
Abstract
The periodontal ligament (PDL) provides support, proprioception, nutrition, and protection within the tooth–PDL–bone complex (TPBC). While understanding the mechanical behavior of the PDL is critical, current research has inferred PDL mechanics from finite element models, from experimental measures on complete TPBCs, or through direct measurement of isolated PDL sections. Here, transducers are used in an attempt to quantify ex vivo PDL strain. In-fiber Bragg grating (FBG) sensors are small flexible sensors that can be placed within an intact TPBC and yield repeatable strain measurements from within the PDL space. The objective of this study was to determine: 1) if the FBG strain measured from the PDL space of intact swine premolars ex vivo was equivalent to physical PDL strains estimated through finite element analysis and 2) if a change in FBG strain could be linearly related to a change in finite element strain under variable tooth displacement, applied to an intact swine TPBC. Experimentally, individual TPBCs were subjected to 2 displacements (n = 14). The location of the FBG was determined from representative micro–computed tomography images. From a linear elastic finite element model of a TPBC, the strain magnitudes at the sensor locations were recorded. An experimental ratio (i.e., FBG strain at the first displacement divided by the FBG strain at the second displacement) and a finite element ratio (i.e., finite element strain at the first displacement divided by the finite element strain at the second displacement) were calculated. A linear regression model indicated a statistically significant relationship between the experimental and finite element ratio (P = 0.017) with a correlation coefficient (R2) of 0.448. It was concluded that the FBG sensor could be used as a measure for a change in strain and thus could be implemented in applications where the mechanical properties of an intact PDL are monitored over time.
Keywords
Introduction
The periodontal ligament (PDL) is a connective tissue that connects the tooth to surrounding alveolar bone and ranges from 0.15 to 0.35 mm along the root in health humans (Beertsen et al. 1997; Nanci and Bosshardt 2006). It provides support, proprioception, nutrition, and protection within the tooth–PDL–bone complex (TPBC) (Beertsen et al. 1997; Newman et al. 2002; Proffit et al. 2013). The fluids within the PDL are incompressible and will resist rapid high-magnitude loads, acting as a shock absorber during mastication (Bien 1966; Beertsen et al. 1997; Newman et al. 2002; Cardaropoli and Gaveglio 2007). Collagen fibers (53% to 74% of the PDL’s volume; Mühlemann 1967; Komatsu 2009) form a support structure around the tooth (Newman et al. 2002). The fibers, resting in a crimped state, will begin to stretch to resist forces as the extracellular fluid seeps out of the PDL when a load is held (Bien 1966; Newman et al. 2002). The PDL can trigger a cellular biological response, leading to permanent tooth movement when a low magnitude load is held, used in orthodontics (Beertsen et al. 1997; Newman et al. 2002; Proffit et al. 2013). The mechanical properties of the PDL are affected by various factors such as external loading (Proffit et al. 2013), disease (periodontitis) (Newman et al. 2002), and injury (Mandel and Viidik 1989). As such, the need to link PDL properties and TPBC response to external loading is essential (Mandel and Viidik 1989; Berkovitz 1990; Yamazaki 1992; Newman et al. 2002; Proffit et al. 2013).
Due to the small and variable geometry, direct mechanical measurements of an intact TPBC are challenging. Generally, physical strains induced within the PDL are estimated through uniaxial testing of isolated PDL sections (Toms, Lemons, et al. 2002; Dorow et al. 2003; Genna et al. 2008), finite element (FE) analysis (Cattaneo et al. 2005; Fill et al. 2011; Ortún-Terrazas et al. 2018), or a combination of experimental and numerical/analytical techniques (Andersen et al. 1991; Toms, Dakin, et al. 2002; Natali et al. 2007; Qian et al. 2009; Fill et al. 2011; Papadopoulou et al. 2011; Nikolaus et al. 2017). Isolating the PDL allows for direct measurement but disrupts the PDL’s 3-dimensional collagen fibers (Dorow et al. 2002; Fill et al. 2011). While FE modeling can be useful in simulating PDL response within a TPBC, the accuracy is reliant on user-defined geometry, material properties, and assumptions (Fill et al. 2012; Nikolaus et al. 2017). Various PDL numerical models with ranging complexity have been implemented (Andersen et al. 1991; Natali et al. 2007; Qian et al. 2009; Nikolaus et al. 2017; Ortún-Terrazas et al. 2018). Direct mechanical measurements from an intact TPBC (e.g., PDL strain) are unavailable, and thus these models cannot be directly validated and are instead implicitly validated based on the structural response (i.e., force/displacement outputs).
A fiber-optic sensing method using an in-fiber Bragg grating (FBG) sensor has been used to obtain strain measurements along the fiber direction from within the PDL space of an intact swine premolar (Zen Karam et al. 2012; Romanyk et al. 2017; Houg et al. 2021). An FBG is small and flexible, permitting insertion into an intact PDL space (Hill and Meltz 1997). Peak FBG strain measurements from within the PDL space have previously been reported on the order of microstrain (µε) (Romanyk et al. 2017; Houg et al. 2021), while predictions from FE models using similar loading conditions were commonly reported on the order of 10,000 µε (Qian et al. 2009; Papadopoulou et al. 2013; Nikolaus et al. 2017; Knaup et al. 2018; Ortún-Terrazas et al. 2018). The apparent discrepancy between FBG strain and reported FE model strain indicates that the output strain measure is only a proxy representing PDL strain (Houg et al. 2021).
Previous investigation into FBG measurements within the PDL have demonstrated repeatability but lacked investigation of FBG location and relation to physical PDL strains (Romanyk et al. 2017; Houg et al. 2021). As FE models have only been validated using indirect measurements and FBG measurements have been reported as proxy strain measures, both methods are considered estimates of physical strains within the PDL and cannot be used to validate one another. Instead, in this study, both measurements were compared through cross-verification. Specifically, the objective of this study was to determine 1) if the FBG strain measured from the PDL space of intact swine premolars ex vivo was equivalent to physical PDL strains estimated though FE analysis and 2) if a change in FBG strain could be linearly related to a change in finite element strain under variable tooth displacement, applied to an intact swine TPBC. Previous studies have shown that FBG measurements are not repeatable between TPBCs but are repeatable within TPBCs (Houg et al. 2021). Therefore, this study measures the change in strain within a TPBC and does not directly compare measurements between TPBCs.
Direct FBG strain measurements from an intact TPBC, if related to physical PDL strains, would allow for stronger, direct verification of FE models. This finding could improve the functionality of FE analysis as a tool to optimize orthodontic treatments. In addition, FBGs could be used to monitor PDL mechanical properties over time without having to sacrifice the specimen for ex vivo mechanical tests, improving research in applications such as the progression of periodontitis (Yamazaki 1992; Newman et al. 2002; Chukkapalli and Lele 2018), repair and regeneration of an injured PDL (Mandel and Viidik 1989; Shinohara et al. 2004), or age (Komatsu et al. 2004).
Materials and Methods
Experimental Procedure
Swine mandibles (n = 14) were retrieved from 12- to 14-wk-old Duroc X pigs (Large White X Landrace) from the Surgical Medical Research Institute at the University of Alberta. The animals were used for purposes outside of this study, and the University of Alberta Animal Care and Use Committee granted an ethical approval exemption, and ARRIVE (Animal Research: Reporting of In Vivo Experiments) best practices have been followed. Each mandible was visually inspected for obvious damage or decay, then stored at −24°C after euthanization and thawed at 0°C over 24 h prior to testing. The posterior portion of the mandible was sectioned into left and right segments to include the second premolars. The base of each segment was cast in dental stone and secured onto a custom-designed testing stage interfacing with a universal testing machine (Instron Electroplus E3000) (Houg et al. 2021). The testing stage allowed for angular alignment of the TPBC relative to the probe, and free translation in the buccal/lingual and distal/mesial directions to ensure a purely compressive load was applied. The second premolars were aligned with approximately 102° between the distal edge of the tooth and probe (Houg et al. 2021) to induce intrusive displacement (Fig. 1A). Each TPBC was submerged in 0.9% NaCl during testing. The gingiva around the tooth crown was removed down to the alveolar bone, and the TPBC was completely unloaded for approximately 5 min between each trial, allowing for fluid recovery. Each TPBC was preloaded to 0.5 N and then subjected to a displacement-controlled test with a loading/unloading rate of 0.05 mm/s. Displacements ranging from 0.08 to 0.3 mm were controlled and held for 10 s prior to unloading (Table 1). Each TPBC underwent 15 trials at 2 different displacements.
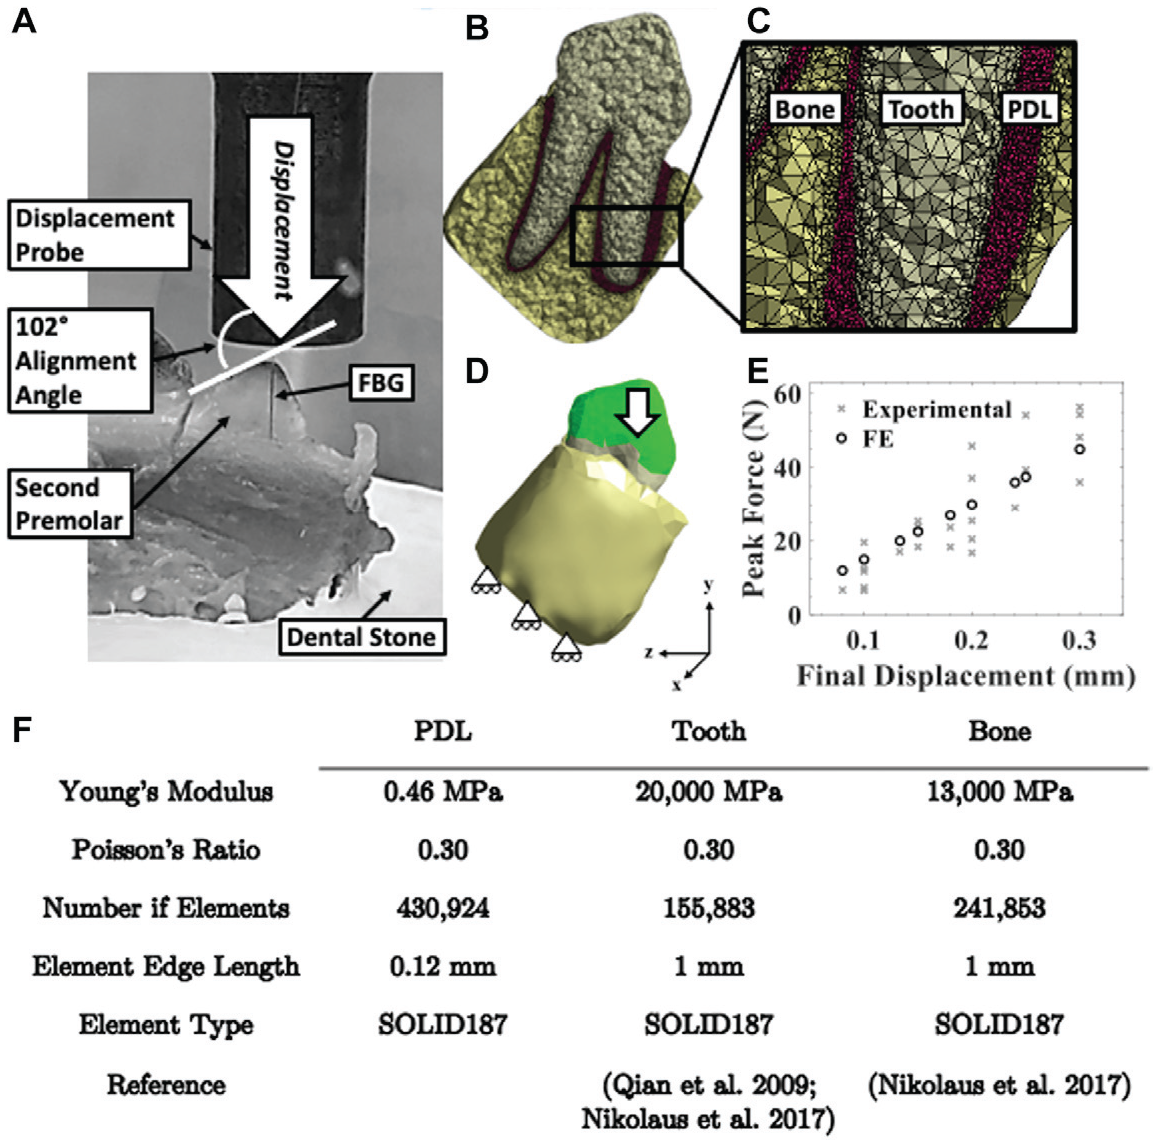
Finite element analysis model setup. (
Summary of the Experimental Protocol Including the Number of Preconditioning Trials and the Displacements for Each Tooth–Periodontal Ligament–Bone Complex.
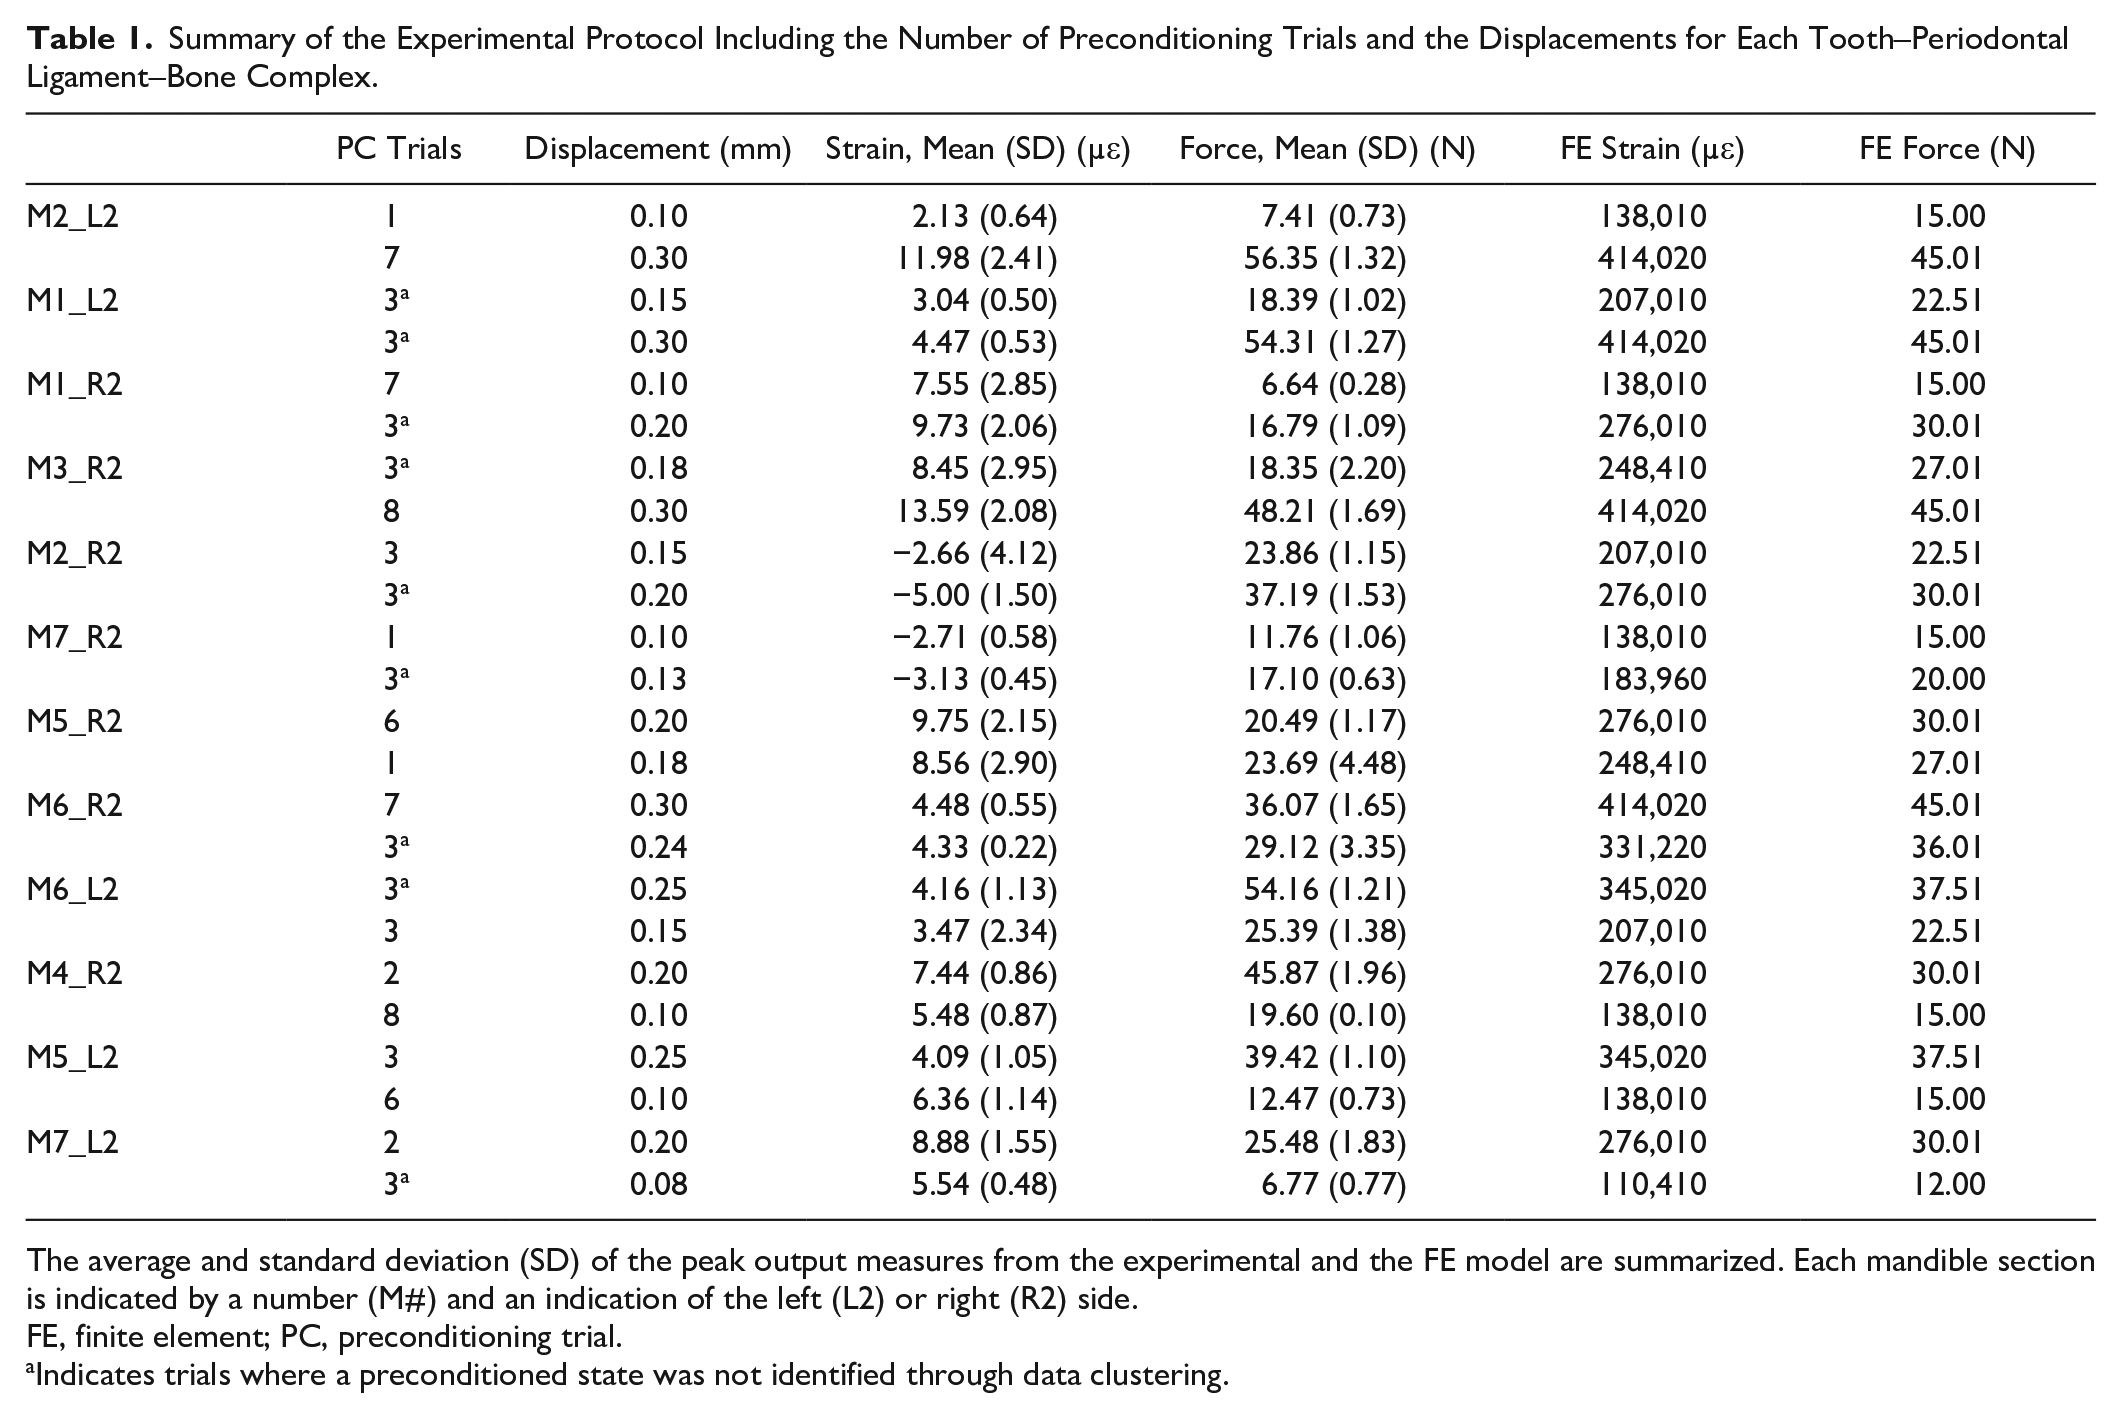
The average and standard deviation (SD) of the peak output measures from the experimental and the FE model are summarized. Each mandible section is indicated by a number (M#) and an indication of the left (L2) or right (R2) side.
FE, finite element; PC, preconditioning trial.
Indicates trials where a preconditioned state was not identified through data clustering.
The number of preconditioning trials for each displacement within a TPBC was determined by exploratory hierarchical data clustering using Ward’s method in MATLAB (MathWorks) (Houg et al. 2021) (Table 1). A preconditioned state is only valid for the loading regime used for preconditioning, and therefore, a preconditioning analysis was completed for both displacements (Viidik 1980).
An FBG (0.125-mm major diameter; Technica SA) with a 1-mm gauge length was inserted using a 27 × 1 ¼ gauge needle into the PDL space on the buccal side of the mesial root. The FBG was inserted to approximately align with the mesial root’s long axis to an approximate depth of 14 mm below the tooth cusp, controlled by markings on the FBG. A MicronOptics Interrogator (SM130 Optical Sensing Interrogator; Micron Optics) collected the peak wavelengths at 200 Hz that were converted to strain using a gauge factor of −1.21 pm/µε (Romanyk et al. 2017). A negative gauge factor converted compressive strains to a positive value for interpretation. The strain data were filtered using a fourth-order Butterworth filter with a cutoff frequency of 100 Hz and 1,000 averages in MATLAB. Peak measurements for each trial were found as the maximum magnitude of strain and force prior to unloading.
Finite Element Analysis
A representative second premolar geometry was created from micro–computed tomography (µCT) scans (SkyScan 1076; Bruker-MicroCT; current 110 µA, voltage 100 kV, voxel size of 17.2 micron) (Fig. 1, Appendix A). The bone and tooth geometries were created using imaging software (Mimics 22.0.0.524; Materialise). The PDL was created in the space between the bone and tooth using additional imaging software (3-matic; Materialise; ANSYS Discovery SpaceClaim 2020 R1) and had a thickness between 0.04 and 1.05 mm, with an average of 0.36 mm. The mesh and FE analysis were completed using ANSYS Workbench (ANSYS Academic Research Mechanical, Release 2020 R1). The tooth, PDL, and bone were assumed homogeneous, linear elastic, isotropic materials (Fig. 1F). A mesh density analysis was completed to ensure the reaction force was independent of mesh density, converging within 0.34% over 7 iterations. To find an appropriate PDL Young’s modulus, the Young’s modulus was varied by increments of 0.01 MPa between 0.40 and 0.50 MPa (Qian et al. 2009) (Appendix B). The best fit was determined by a root mean square comparison between the FE and experimental force/displacement data. The contacts were modeled as a perfectly bonded with an element edge length of 0.12 mm (CONTA174). To reproduce the experimental setup, the TPBC was aligned so the y-axis ran through the long axis of the mesial root and the base of the alveolar bone was constrained to prevent displacement in the y-axis. A compressive displacement was applied to the tooth crown matching the displacements applied experimentally (Fig. 1D).
Sensor location
To determine the location of the FBG, it was left in place for 3 of the final 4 tested TPBCs that were then scanned using µCT (SkyScan 1076; Bruker-MicroCT; current 278 µA, voltage 90 kV, voxel size of 8.9 micron). The tooth crowns were partially removed prior to imaging due to scanner size constraints. The tooth and FBG geometries were reconstructed using Mimics. Each tooth was manually aligned so the y-axis was along the mesial root with the origin at the root’s apex. The FBG tip location relative to the origin was recorded (ANSYS Discovery SpaceClaim 2020 R1) (Fig. 2A). This process was completed 3 times, and the coordinates were averaged. Three regions of interest were defined from the average FBG tip location using the FBG dimensions (0.125 × 1 × 0.125 mm). The average strain in the y-axis, representing the strain along the FBG direction, from each region of interest was recorded. As there were variations in size and shape between the TPBCs used to determine the FBG region of interest and the representative FE model, the 3 regions of interest were translated within the representative geometry to ensure the entire volume of the FBG was included. Specifically, the first region of interest was translated −0.906 mm along the z-axis, the second region of interest was translated 0.614 mm along the y-axis, and the third region of interest was translated 1.329 mm along the y-axis.
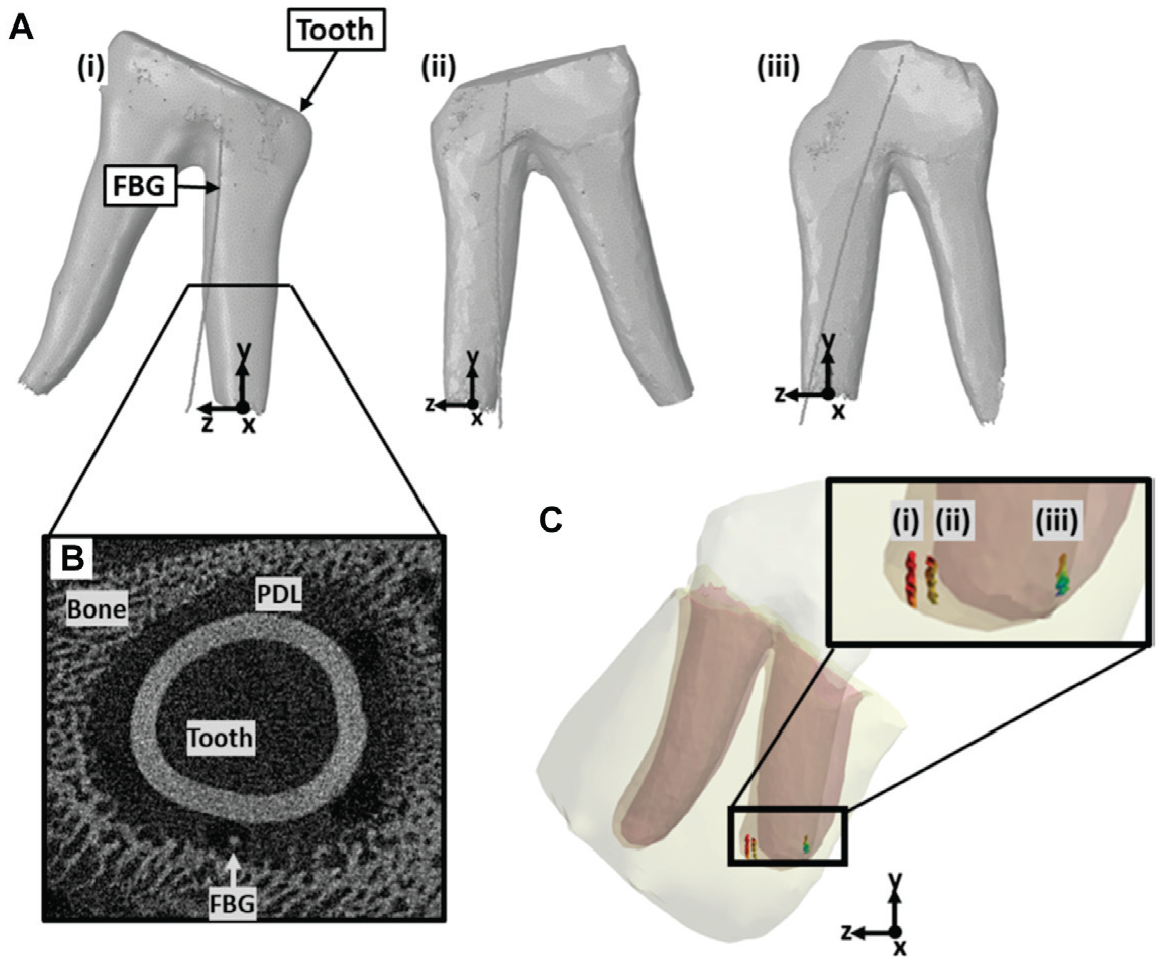
Region of interest identification. (
Linear Regression
An experimental ratio was calculated for each TPBC to quantify the change in output strain and force measurements. The experimental ratio is the average peak measurements from the first displacement divided by the average peak measurements from the second displacement. From the FE model, the reaction force at the base of the TPBC for each displacement was recorded. Using the region of interest from the third sensor as a representative sensor location (Fig. 2A), the average y-axis strain was recorded for each experimental tooth displacement. The FE ratio, for both force and strain, was found by dividing the FE output from each first displacement by the second. To determine if the changes in FBG and FE values were predictive of each other, a linear regression between the experimental and FE ratio was completed for both strain and force outputs. The R2 and P value for each regression were calculated using MATLAB. A sample size estimation was not possible due to the lack of related historical data. Instead, a minimum sample size of 10 for linear regression was fulfilled (Milton 1986).
Results
Force and Strain Output Measures
Average peak experimental strain and force measurements are summarized in Table 1. Of the 14 premolars tested, 2 were not included. The first was not securely cast in dental stone, and the second had an oscillating sensor output indicating the sensor was not placed within the PDL. Exemplar strain and force outputs are shown in Figure 3. The peak strain and force measurements at similar displacements varied. For example, 5 TPBCs were subjected to a displacement of 0.10 mm where peak strain measures ranged from −2.71 to 7.55 µε, and peak force measures ranged from 6.64 to 19.60 N.
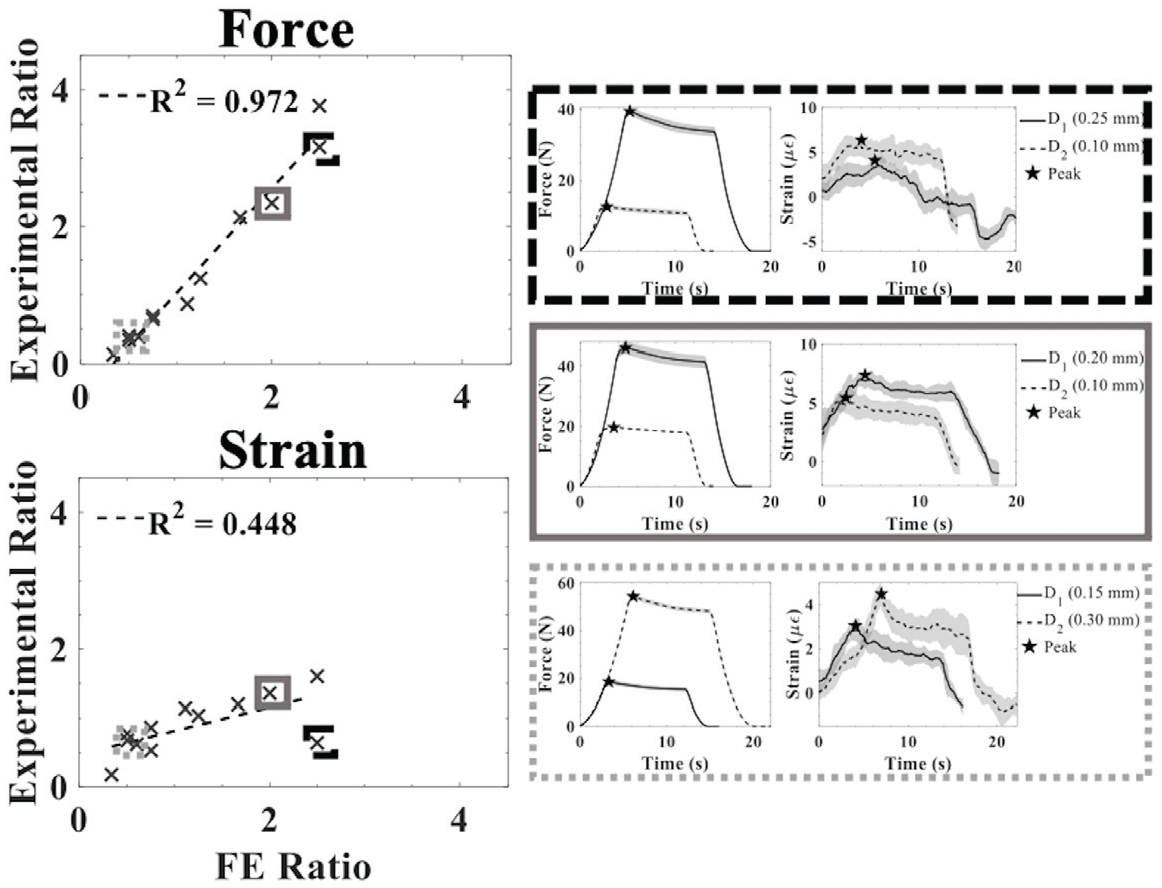
FE and experimental results. Left side: linear regression for the force and strain experimental to finite element (FE) ratios. Right side: 3 representative time-series data for force and strain at the first and second tooth displacements (D1 and D2, respectively). The strain experimental ratio was 0.477 when the FE ratio was 0.00 and increased by 0.339 for every unit increase of the FE ratio. The force experimental ratio was −0.504 when the FE ratio was 0.00 and increased by 1.530 for every unit increase of the FE ratio.
Table 2 summarizes the 3 regions of interest representing FBG locations within the FE model, respective peak experimental force and strain output measures, and corresponding strain and force outputs from the FE model. Corresponding FBG and FE strain magnitudes differed on averageby 200%, suggesting a one-to-one comparison between experimental and numerical models is not appropriate.
Summary of the Peak Strain and Force Outputs from the Experimental Results and FE Model for 3 Representative TPBCs.
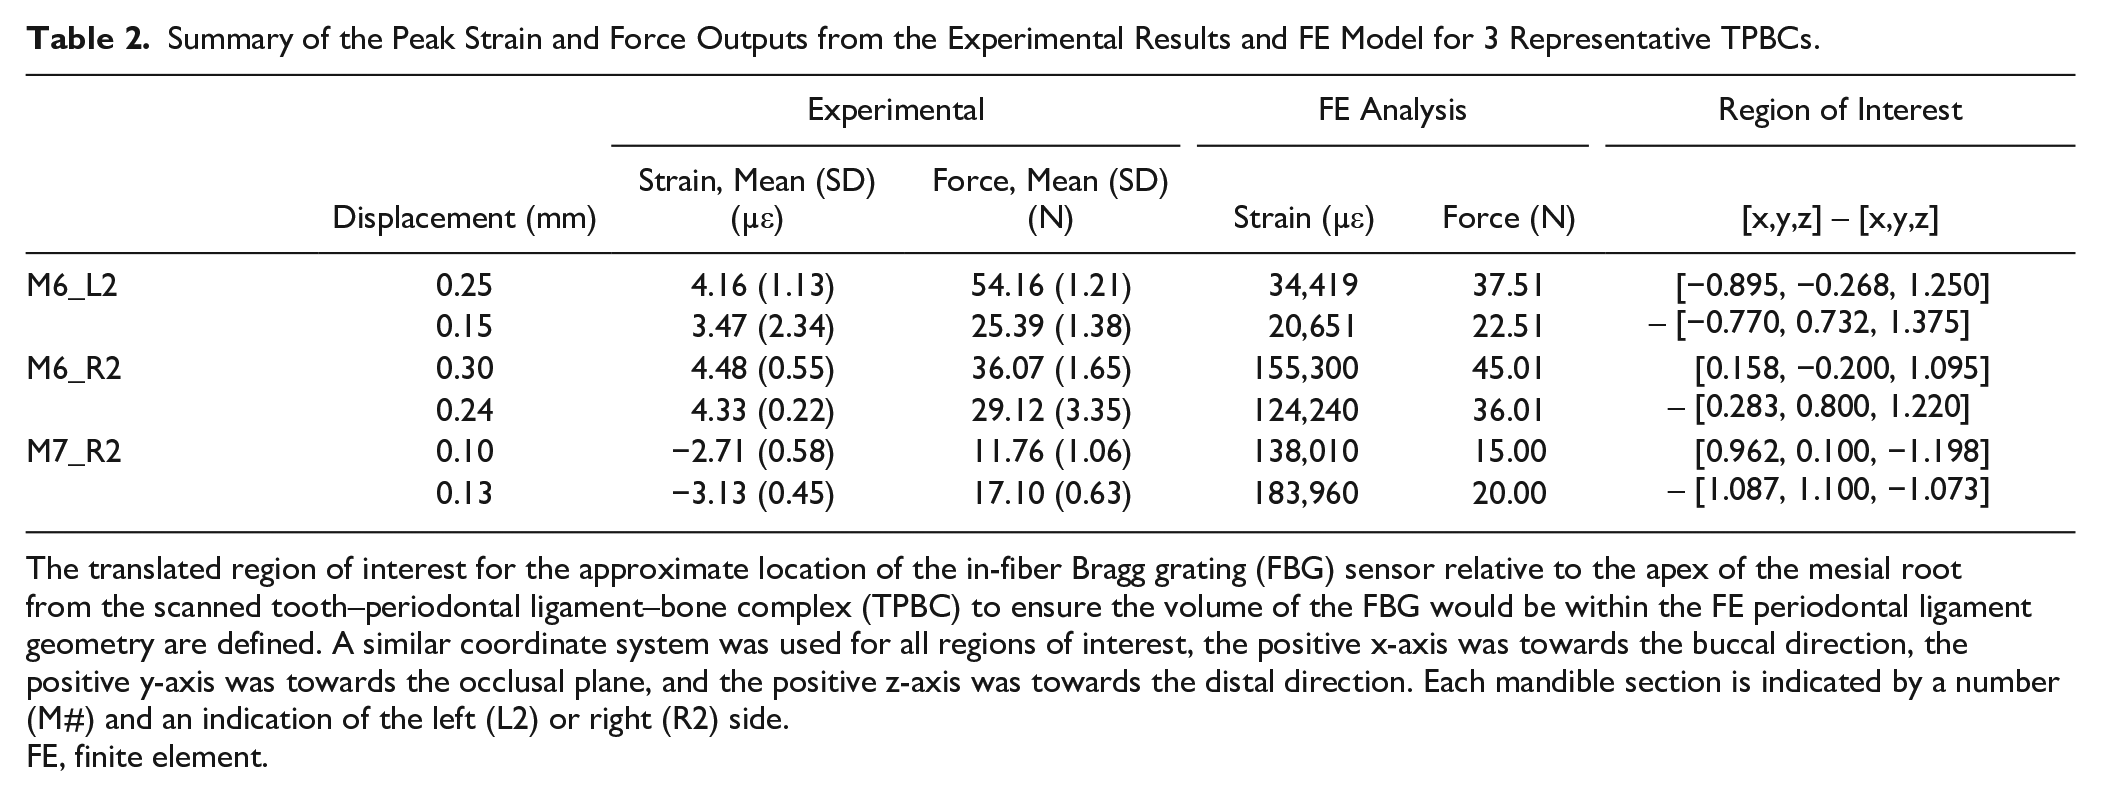
The translated region of interest for the approximate location of the in-fiber Bragg grating (FBG) sensor relative to the apex of the mesial root from the scanned tooth–periodontal ligament–bone complex (TPBC) to ensure the volume of the FBG would be within the FE periodontal ligament geometry are defined. A similar coordinate system was used for all regions of interest, the positive x-axis was towards the buccal direction, the positive y-axis was towards the occlusal plane, and the positive z-axis was towards the distal direction. Each mandible section is indicated by a number (M#) and an indication of the left (L2) or right (R2) side.
FE, finite element.
Linear Regression
A statistically significant linear relationship between the experimental and FE strain ratio had a correlation coefficient (R2) of 0.448 (P = 0.017) (Fig. 3). Similarly, a statistically significant linear relationship between the experimental and FE force ratios had an R2 of 0.972 (P < 0.001) (Fig. 3).
Discussion
The aim of this work was to provide preliminary data to determine if FBG strain measures were related to physical PDL strains estimated through FE simulations through a cross-verification. The FBG and FE strain magnitudes do not match. However, a statistically significant linear relationship between the FE and experimental ratio was observed. This suggests that the FBG can predict the change in strain estimated though an FE model initiated by a change in tooth displacement.
The experimental output strain measures varied between TPBCs, ranging from −5.00 to 13.59 µε with tooth displacements ranging from 0.08 to 0.30 mm. This difference in peak measurements between TPBCs may be partially attributed to sensor placement (Romanyk et al. 2017; Houg et al. 2021). The location of the FBG sensor was identified on µCT scans from 3 TPBCs. From the limited sample size, it was observed that the location of the terminal end of the FBG was not consistent (Fig. 2A). Although the general insertion location and angle correspond, a greater deviation in fiber location occurs further down the root and may be due to the narrow and variable geometry of the PDL. During insertion, the needle, and therefore the FBG, will be partially guided by the unique shape of the PDL space. This could partially explain previous conclusions that FBGs can measure similar strains within but not between TPBCs (Houg et al. 2021). Using the described insertion method, the depth, angle, and location of insertion can be controlled, but the location of the FBG tip is likely to depend on specimen geometry.
The FE output force/displacement values lay within the bounds of the experimental force/displacement outputs, providing confidence that the model is adequate for comparison to the experimental data (Fig. 1E). An apparent discrepancy was observed between the experimental and FE strains. Experimental strains ranged from −3.13 to 4.48 µε, and FE strains ranged from 20,651 to 183,960 µε. Previously reported experimental FBG strain measures, with a similar experimental setup, were comparable to the experimental peak values found in this work, ranging from −5.77 to 11.68 µε with a tooth displacement of 0.20 mm (Houg et al. 2021). Comparing exact strain magnitudes between different FE models is not practical, as a wide range of material properties for the PDL has been reported, and the properties are dependent on species, age, location along the root, displacement rate, and environment (Fill et al. 2011). However, multiple FE studies using a swine model have reported strains with a similar order of magnitude as that of the FE strain output of this study (e.g., 10,000 µε) (Natali et al. 2007; Qian et al. 2009; Nikolaus et al. 2017; Ortún-Terrazas et al. 2018). Due to the apparent discrepancy, it is argued that the FBG strain magnitudes do not represent the magnitudes of physical strains in PDL material, likely attributed to the FBG not being adhered to the PDL. The complex interaction between the sensor and the PDL is likely a function of factors such as friction, the interaction between the bone/tooth/FBG, and fluid movement.
The ability of the FBG to predict a change in FE strain suggests that the FBG strain measures can be used to monitor a change in physical PDL strain over time and has potential applications in in vivo studies. For example, injury or inflammation from periodontitis within the PDL can lead to degradation of collagen fibers and detachment from the cementum, affecting the PDL’s material properties (Mandel and Viidik 1989; Newman et al. 2002; Shinohara et al. 2004; Chukkapalli and Lele 2018). Monitoring the material properties of the PDL over time can be used to track the progression of periodontitis or repair and regeneration (Mandel and Viidik 1989; Shinohara et al. 2004; Chukkapalli and Lele 2018). FBG strain measurements from an intact in vivo TPBC would allow for temporal monitoring of the material properties without having to sacrifice specimens for ex vivo testing. Similarly, strain measurements from an intact TPBC could lead to better validation of PDL FE models. Advancement of PDL FE models could be used for optimization and predictive purposes within orthodontics (Chen et al. 2014).
The presented FE model was validated using force/displacement data (Fig. 1E). Although frequently used to validate PDL FE models (Qian et al. 2009; Papadopoulou et al. 2013; Knaup et al. 2018), this level of validation is not as strong as if strain measurements from within the PDL were available. This work is limited by the linear elastic model assumed for the PDL. Although the PDL is known to be a nonlinear, viscoelastic, anisotropic, heterogeneous material, linear elastic models are frequently implemented and have been reported to sufficiently approximate the PDL’s stress/strain state under appropriate loading conditions (Tanne et al. 1987; Fill et al. 2012; Ortún-Terrazas et al. 2018). In this work, to minimize the viscoelastic effects so the PDL, a constant and quasi-static displacement rate was used. The linear relationship between the FE and experimental force ratios provides confidence the linear elastic assumption was appropriate. The FBG was identified on µCT images (Fig. 2B). However, the density of the FBG fiber was similar to the bone. Therefore, limitations arise as the location of the fiber was identified manually as opposed to using thresholding techniques. This study induced a change in strain within the PDL through tooth displacement. To better characterize the relationship between the PDL and FBG output, future works should focus on defining the FBG strain change in relation to different mechanical parameters (i.e., loading direction and loading rate) or material parameters (i.e., altering fluid content and fiber attachment). This is a vital step toward using the FBG to monitor changes in strain in vivo, as some parameters may have a greater or lesser effect on the FBG measurement and may bias the output.
Author Contributions
K.P. Houg, contributed to conception, design, data acquisition, analysis, and interpretation, drafted and critically revised the manuscript; A.M. Camarillo, contributed to data acquisition, analysis, and interpretation, critically revised the manuscript; M.R. Doschak, contributed to design, data acquisition, analysis, and interpretation, critically revised the manuscript; P.W. Major, contributed to conception, design, and data interpretation, critically revised the manuscript; T. Popowics, contributed to conception, design, data analysis, and interpretation, critically revised the manuscript; C.R. Dennison, D.L. Romanyk, contributed to conception, design, data acquisition, analysis, and interpretation, critically revised the manuscript. All authors gave final approval and agree to be accountable for all aspects of the work.
Supplemental Material
sj-docx-1-jdr-10.1177_00220345221100234 – Supplemental material for Strain Measurement within an Intact Swine Periodontal Ligament
Supplemental material, sj-docx-1-jdr-10.1177_00220345221100234 for Strain Measurement within an Intact Swine Periodontal Ligament by K.P. Houg, A.M. Camarillo, M.R. Doschak, P.W. Major, T. Popowics, C.R. Dennison and D.L. Romanyk in Journal of Dental Research
Footnotes
A supplemental appendix to this article is available online.
Declaration of Conflicting Interests
The authors declared no potential conflicts of interest with respect to the research, authorship, and/or publication of this article.
Funding
The authors disclosed receipt of the following financial support for the research, authorship, and/or publication of this article: This work was supported by the Natural Science and Engineering Research Council of Canada Discovery Grant Program, Natural Sciences and Engineering Research Council–Research Tools and Instruments program, and the American Association of Orthodontists Foundation Center Award.
References
Supplementary Material
Please find the following supplemental material available below.
For Open Access articles published under a Creative Commons License, all supplemental material carries the same license as the article it is associated with.
For non-Open Access articles published, all supplemental material carries a non-exclusive license, and permission requests for re-use of supplemental material or any part of supplemental material shall be sent directly to the copyright owner as specified in the copyright notice associated with the article.