
Abstract
Instrumental motives, such as increasing negative emotions to facilitate performance, are one of the primary motives in regulating one’s own emotions (i.e., intrinsic emotion regulation) and others’ emotions (i.e., extrinsic emotion regulation). However, most instrumental emotion regulation research has been conducted in Western countries, even though desired emotions, such as anger, could vary across Western and Eastern cultures. This research investigates cross-cultural similarities and differences between European Americans and Japanese in instrumental motives for regulating one’s own (Study 1) and others’ anger (Study 2). To this end, the two preregistered studies used the context of playing an aggressive or nonaggressive computer game, a common methodology used in previous research on instrumental anger regulation. The results showed that both European Americans and Japanese significantly preferred angry stimuli for themselves and their partners before playing an aggressive game over a nonaggressive one. We also found that European Americans preferred anger stimuli significantly more than Japanese, although these cultural differences were neither large nor robust. Furthermore, individual differences in the perceived utility of anger were positively associated with a preference for angry stimuli, whereas cultural self-construals were not significantly associated with a preference for angry stimuli among either European Americans or Japanese. This research provides novel evidence for the cross-cultural similarity of instrumental anger regulation in both intrinsic and extrinsic emotion regulation between European Americans and Japanese.
Emotion regulation refers to attempts to influence emotions, including their intensity, duration, and quality, either in oneself or others (Gross, 1998, 2015; McRae & Gross, 2020). Individuals often use emotion regulation to increase positive emotions or decrease negative emotions to seek pleasure and avoid pain, known as hedonic motives (Gross, 2008). However, empirical evidence has shown that individuals can be motivated to decrease positive emotions or increase negative emotions, especially when these emotions help them achieve the desired outcome, known as instrumental motives (Tamir et al., 2008). According to Tamir (2016), the former targets the immediate phenomenology of emotions, whereas the latter targets other potential benefits of emotions, such as facilitating performance. Hedonic and instrumental motives represent the two major categories driving emotion regulation (Tamir, 2016).
Instrumental Motives in Anger Regulation
Individuals can have instrumental motives for regulating their own emotions (intrinsic emotion regulation) and others’ emotions (extrinsic emotion regulation; Nozaki & Mikolajczak, 2020). In a study focusing on instrumental motives, Tamir et al. (2008) found that individuals were likely to prefer angry stimuli that could improve their game performance before playing an aggressive computer game. Moreover, when participants’ partners were expected to play an aggressive computer game, they were also more likely to prefer that angry stimuli be introduced to their partners to facilitate their partners’ performance (Netzer, Van Kleef, et al., 2015; Niven et al., 2019). These findings are consistent with the idea that anger can help in confrontational situations (van Kleef et al., 2004). Furthermore, the extent to which individuals perceive the utility of anger varies and is positively associated with their preference for angry stimuli (Netzer, Van Kleef, et al., 2015; Tamir & Ford, 2012).
Cross-Cultural Similarities and Differences in Instrumental Anger Regulation
One limitation of previous research on instrumental emotion regulation is that most studies have been conducted in Western populations despite that desired emotions 1 and values related to emotions could vary across cultures (Eid & Diener, 2001; Matsumoto & Hwang, 2012; Matsumoto et al., 2008; Tamir et al., 2016). Previous studies have indicated that an individual’s cultural environment has the potential to facilitate feeling of different emotions (Ford & Mauss, 2015; Mesquita et al., 2014). For example, in North America, independence and disengagement of the self are encouraged; consequently, personal goals and agendas are highly salient (Markus & Kitayama, 1991). As a result, American culture motivates individuals to experience socially disengaging emotions such as anger (Kitayama et al., 2006). Conversely, Asian cultures value interdependence and engagement of the self; consequently, social harmony and adjustment are highly salient (Markus & Kitayama, 1991). Thus, Asian culture affords less socially disengaging emotions. In fact, Japanese people reported a lower intensity of experiencing socially disengaging emotions (e.g., anger) in their daily lives than did Americans (Kitayama et al., 2006). Such cultural differences in emotional norms and motivation to feel a specific emotion may influence how individuals engage in instrumental emotion regulation.
As an exception, Ma et al. (2018) investigated cultural differences in the instrumental regulation of positive emotions. They found that European Americans perceived greater utility and less harm in positive emotions than Japanese when engaging in active goal pursuit, such as taking an exam. Moreover, this cultural difference in the perceived utility of positive emotions was reflected in emotion regulation; European Americans reported a stronger relative preference for positive emotions than Asians, especially in a context requiring high cognitive effort.
Although the aforementioned study revealed important cultural differences in instrumental positive emotion regulation, it remains unclear in the case of negative emotion regulation. Given that increasing anger in confrontational contexts is a typical example of counter-hedonic emotion regulation with instrumental motives (Tamir, 2016), it is theoretically important to clarify the extent to which findings on instrumental anger regulation can be generalized across independent and interdependent cultures.
The Current Research
This research investigated cross-cultural similarities and differences in instrumental anger regulation between European Americans and Japanese. Drawing from the principle of instrumental motives (Tamir, 2016), we hypothesized that individuals would be more likely to increase anger in a confrontational context than in a nonconfrontational context (Hypothesis 1). However, given that the American culture is more likely to facilitate individuals being motivated to feel anger than Japanese culture (Kitayama et al., 2006), we predicted that European Americans would be more likely to perceive the utility of anger and prefer it in a confrontational context than Japanese (Hypothesis 2). Furthermore, consistent with previous findings (Tamir & Ford, 2012), we hypothesized that individual differences in the perceived utility of anger would be positively associated with the preference for anger in both cultures (Hypothesis 3). We also assessed cultural self-construals to capture within-cultural individual differences in independence and interdependence (Singelis, 1994). We predicted that independent self-construal would be positively related to anger preference in a confrontational context, whereas interdependent self-construal would be negatively associated with it (Hypothesis 4).
Previous research has found that individuals regulate their own anger (Tamir et al., 2008) as well as that of their partners (Netzer, Van Kleef, et al., 2015) based on instrumental motives. Therefore, we tested the above hypotheses for both intrinsic (Study 1) and extrinsic emotion regulation (Study 2).
Study 1
Study 1 tested the hypotheses in the case of intrinsic anger regulation. To this end, we used the context of playing an aggressive or nonaggressive computer game, a common methodology used in previous research on instrumental anger regulation (e.g., Tamir et al., 2008).
Method
Study design, sample size, inclusion/exclusion criteria, and planned analyses were preregistered (https://osf.io/c5d27). We report all data exclusions, manipulations, and measures. All data, analysis code, and research materials are available (https://osf.io/7nvsb).
Participants
A total of 350 self-identified White/European Americans (hereafter referred to as European Americans; man = 175, woman = 164, transgender man = 1, nonbinary = 8, agender = 1, prefer not to say = 1, Mage = 34.41, SDage = 7.48) and 350 self-identified Japanese (hereafter referred to as Japanese; man = 166, woman = 178, prefer not to say = 6, Mage = 37.46, SDage = 7.15) between the ages of 18 and 49 years participated in the study conducted in October 2022. We focused on this age group because attitudes toward computer games may vary among older adults. Participants had lived in their own country for most of their lives (the mean value of subtracting the length of residence from age was 0.28 years). European American and Japanese participants were recruited via the online crowdsourcing platforms Prolific (https://www.prolific.co) and Crowdworks (https://crowdworks.jp), respectively. Previous studies have shown these platforms to be reliable sources of data for online experiments (e.g., Majima et al., 2017; Peer et al., 2017). Those who completed the experiment were paid £3 (Prolific) or 400 JPY (Crowdworks). Participants were randomly assigned to either aggressive (European Americans = 175, Japanese = 178) or nonaggressive game conditions (European Americans = 175, Japanese = 172).
The sample size was determined by conducting a simulated power analysis using the R package Superpower 0.2.0 (Lakens & Caldwell, 2021). We defined a mixed analysis of variance (ANOVA) with emotion (anger vs. calmness vs. happiness) as a within-participants variable, and game condition (aggressive vs. nonaggressive) and culture (European American vs. Japanese) as between-participants variables. 2 To use Cohen’s d as a standardized effect size, we assumed a standard deviation of 1.0 around the means. In general, previous research on instrumental emotion regulation has revealed large effect sizes. For example, a replication study of Tamir et al. (2008) reported in Open Science Collaboration (2015) revealed a large effect size (d = 1.77) for instrumental anger regulation (Masicampo, 2015). However, as we had predicted a smaller effect size in the Japanese population, we set a more conservative effect size for the power analysis. Moreover, we assumed a medium effect size (d = 0.50) for potential cultural differences in instrumental anger regulation, based on Ma et al. (2018). Therefore, for the aggressive game condition, we specified 1.0, 0.0, and 0.0 for mean anger, happiness, and calmness ratings, respectively, among European American participants and 0.5, 0.0, and 0.0 among Japanese participants. For the nonaggressive game condition, we specified 0.0, 0.0, and 0.8, for both the U.S. and Japanese participants. We also assumed correlations of r = .50 between within-participants conditions and were interested in the Emotion × Game Condition × Culture interaction. Based on 5,000 simulations, we needed 312 European Americans and 312 Japanese each to achieve 90% power for the interaction at the standard .05 alpha error probability. This sample size could detect a medium effect size (r = .30) in the correlation analysis, with over 90% power at a standard .05 alpha error probability. This value was calculated using R package pwr version 1.3.0 (Champely, 2020). Based on these power analyses, we recruited up to 350 European Americans and 350 Japanese individuals, assuming that some participants would be excluded from data analyses.
Procedure
As in previous research on instrumental emotion regulation (e.g., Netzer, Van Kleef, et al., 2015; Tamir et al., 2008), this study was presented as examining performance in computer games. Participants completed an online survey including informed consent on Qualtrics. After rating their current emotional experiences, participants were randomly assigned to a game condition (aggressive shooting or nonaggressive treasure-hunting game). Then, they rated the extent to which they would like to listen to the music clips before playing the game. Afterward, participants also rated the extent to which they would like to remember the emotional events before playing the game. Consistent with previous instrumental emotion regulation research (e.g., Tamir et al., 2008), the order of rating for music and memory was fixed. Next, they rated the perceived utility of emotions in improving the game performance and completed a cultural self-construal scale. Finally, after answering the suspicion probe, the participants were debriefed and thanked. 3 This procedure has been approved by the Ethics Committee of Konan University (22-06).
Materials
All materials, except for the Self-Construal Scale, were translated by the authors and checked for consistency through back-translation by independent bilinguals.
Current Emotional Experiences
Participants rated the extent to which they currently felt angry, irritated, happy, pleasant, calm, and relaxed on a 7-point scale (1 = Not at all, 2 = Just a little, 3 = Somewhat, 4 = Moderately, 5 = Quite a lot, 6 = Very, 7 = Extremely). We used the mean values of the two items for each emotion category (angry and irritated, happy and pleasant, and calm and relaxed, respectively) for analyses (αs > .84). To avoid drawing participants’ attention to the emotions examined in the investigation, these target items were embedded in a list of filler items (confused, surprised, sad, interested, embarrassed, and fearful), following Netzer, Igra, et al. (2015). The order of emotions was randomized.
Game Descriptions
Participants were randomly assigned to game conditions. In the aggressive game condition, the participants were told that they would play the following game: This game is a first-person shooting game. You move through the world and space in the game from the perspective of the character you control and use weapons to fight evil extraterrestrial life forms plotting to enslave the human race. The main character is an active member of a secret organization and has entered the enemy’s hideout to take revenge for losing their friends. The goal of this game is to search for and defeat as many enemies as possible.
In the nonaggressive game condition, the participants were told that they would play the following game: This game is a first-person treasure-hunting adventure game. You move through the world and space in the game from the perspective of the character you control and search for hidden treasures yet to be discovered. The main character is an adventurer with a curious mind and explores inside an old ship that is said to contain a large amount of treasure. The goal of this game is to find and collect as many treasures as possible.
The game descriptions (aggressive shooting vs. nonaggressive treasure-hunting game) were created based on previous research related to instrumental emotion regulation (Netzer, Igra, et al., 2015).
To test the validity of the game description stimuli in both countries, we conducted a pilot study with 20 European Americans and 20 Japanese participants. They read each game description in a randomized order and answered the survey questions on a 7-point scale (1 = Not at all, 2 = Just a little, 3 = Somewhat, 4 = Moderately, 5 = Quite a lot, 6 = Very, 7 = Extremely). The results showed that the aggressive game description was rated as significantly more aggressive than the nonaggressive game description among both European Americans (M = 5.35, SD = 1.53 vs. M = 2.30, SD = 1.53) and Japanese (M = 5.25, SD = 1.21 vs. M = 1.45, SD = 0.60), ts > 7.37, ps < .001, ds > 1.64. Moreover, the interesting ratings of these games were not significantly different among European Americans (M = 4.00, SD = 1.84 vs. M = 4.50, SD = 1.47) and Japanese (M = 4.25, SD = 1.07 vs. M = 4.35, SD = 1.14), ts < 1.32, ps > .204, ds < 0.30. These results indicate the validity of the game descriptions.
Preferences for Emotional Music Clips
Participants listened to two angry, happy, and calm music clips each as shown in Table 1. 4 Although previous research on instrumental emotion regulation used copyrighted music clips (e.g., Tamir et al., 2008), we could not use these clips. This is because the present study used an online survey to ensure a sufficient sample size, and copyrighted music clips could not be used for this kind of survey without permission. It turned out that obtaining these rights was very costly and time-consuming, making it impractical to use them for the current online research. For this reason, and to facilitate later replication research, we used music clips from Premium Beat by Shutterstock (https://www.premiumbeat.com) by purchasing the license required for their use in an online survey.
Music Clips Used in the Experiment.
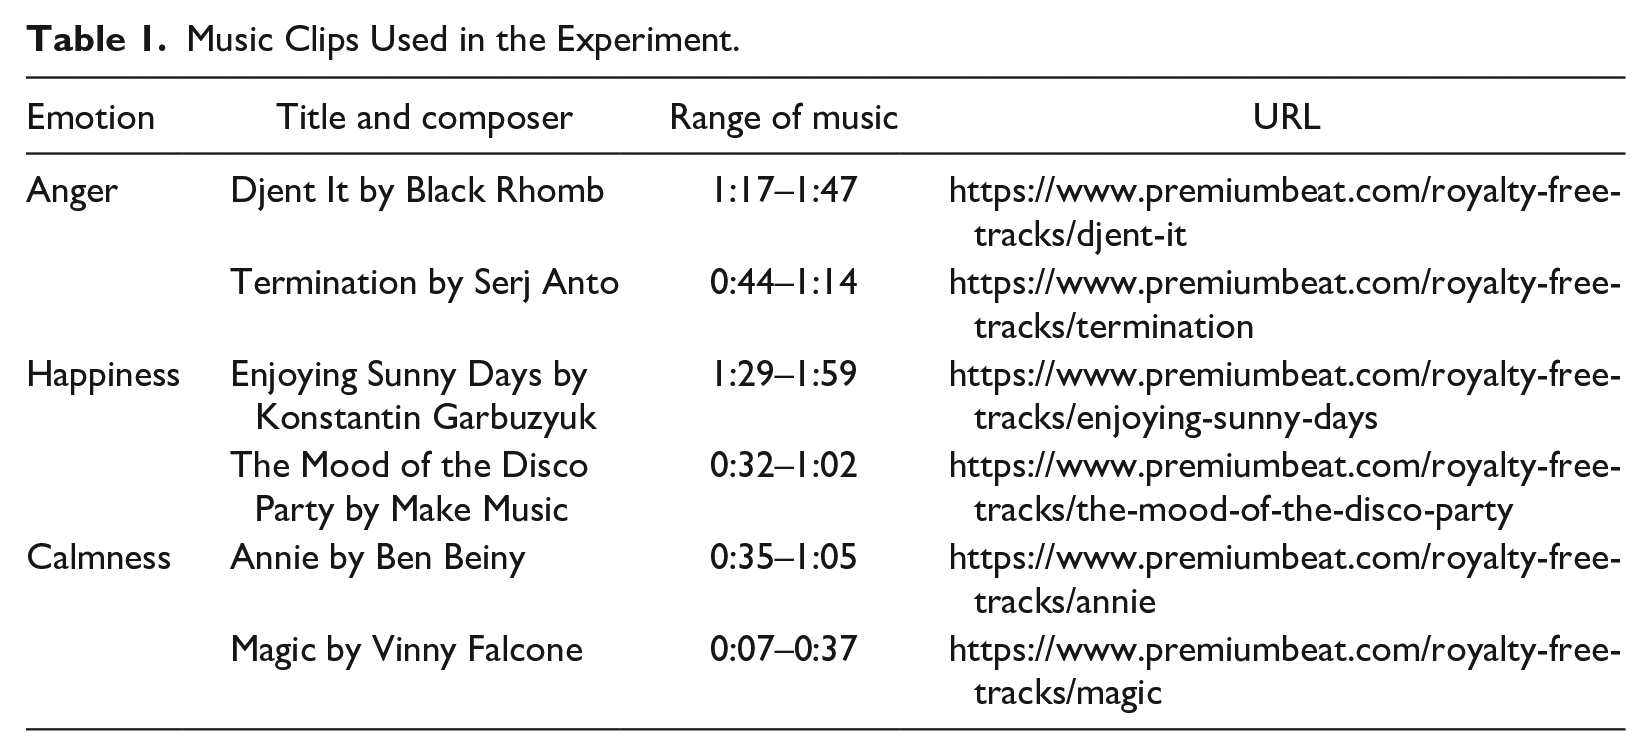
Participants rated the extent to which they would like to listen to each music clip before playing the game to get as good a score as possible in the game on a 7-point scale (1 = Not at all, 2 = Just a little, 3 = Somewhat, 4 = Moderately, 5 = Quite a lot, 6 = Very, 7 = Extremely). We used the mean values of the two items for each emotion category (preference for two angry, happy, and calm music clips each) for analyses (αs > .77). The order of the music clips was randomized. The button to proceed to the next section appeared after the time for the participants to finish listening to all the music (i.e., after 180 s).
As in the game descriptions, we conducted a pilot study with another 20 European American and 20 Japanese participants to test the validity of the music clips in both countries. Participants listened to each music clip in a randomized order and answered the survey questions on a 7-point scale (1 = Not at all, 2 = Just a little, 3 = Somewhat, 4 = Moderately, 5 = Quite a lot, 6 = Very, 7 = Extremely). Moreover, they also answered whether they had heard this music before. The results confirmed that anger ratings were significantly higher for the angry music clips than for the calm or happy music clips among both European Americans (M = 4.10, SD = 1.81 vs. M = 1.10, SD = 0.45 vs. M = 1.02, SD = 0.11) and Japanese (M = 4.18, SD = 1.58 vs. M = 1.20, SD = 0.34 vs. M = 1.10, SD = 0.35), ts > 7.39, adjusted ps < .001, ds > 1.65 (p values were adjusted by the Holm method). Similarly, happiness ratings were significantly higher for the happy music clips than calm or angry music clips among both European Americans (M = 5.22, SD = 1.56 vs. M = 3.48, SD = 1.34 vs. M = 2.05, SD = 0.92) and Japanese (M = 4.80, SD = 1.65 vs. M = 2.30, SD = 1.12 vs. M = 1.62, SD = 1.15), ts > 5.01, adjusted ps < .001, ds > 1.12. Calmness ratings were significantly higher for the calm music clips than the happy or angry music clips among both European Americans (M = 5.88, SD = 1.21 vs. M = 2.92, SD = 1.38 vs. M = 1.23, SD = 0.44) and Japanese (M = 5.30, SD = 0.99 vs. M = 2.35, SD = 1.08 vs. M = 1.20, SD = 0.64), ts > 7.33, adjusted ps < .001, ds > 1.64. Very few participants reported having heard these music clips before (5% or less for each music clip). These results confirm the validity of the music clips.
Preferences for Emotional Memory
Participants read descriptions of a type of event and rated how much they would like to recall each event before playing the game to get as good a score as possible (1 = Not at all, 2 = Just a little, 3 = Somewhat, 4 = Moderately, 5 = Quite a lot, 6 = Very, 7 = Extremely). As in previous research (Tamir et al., 2008), the event types varied in emotional tone (i.e., anger, happiness, calmness) and content (i.e., involving friends vs. strangers). The descriptions were as follows: “An event in which you were angry, involving friends,” “An event in which you were angry, involving strangers,” “An event in which you were happy, involving friends,” “An event in which you were happy, involving strangers,” “An event in which you were calm, involving friends,” and “An event in which you were calm, involving strangers.” We used the mean values of the two items for each emotion category for analyses (αs > .77). The order of the items was randomized.
Perceived Utility of Emotions
Participants rated the extent to which they thought feeling the following emotions would help them get as good a score as possible in the game (1 = Not at all, 2 = Just a little, 3 = Somewhat, 4 = Moderately, 5 = Quite a lot, 6 = Very, 7 = Extremely). As with the ratings of current emotional experiences, emotions included angry and irritated, happy and pleasant, calm and relaxed, and filler items (confused, surprised, sad, interested, embarrassed, and fearful). We used the mean values of the two items for each emotion category for analyses (αs > .81). The order of emotions was randomized.
Cultural Self-Construal
Participants completed a 30-item version of the Self-Construal Scale (Singelis, 1994). This scale was initially developed as a 24-item scale, to which additions were made to improve its internal reliability. This 30-item version has been widely used in previous studies (Cross et al., 2011; Kitayama et al., 2014). Participants indicated the extent to which they agreed with each of the 15 independent and 15 interdependent self-construal items on a 7-point scale (1 = Strongly disagree, 2 = Disagree, 3 = Somewhat disagree, 4 = Don’t agree or disagree, 5 = Agree somewhat, 6 = Agree, 7 = Strongly agree). The mean values of each subscale were used in the analyses.
Suspicion Probe
We used funnel debriefing to probe the participants’ suspicions (Blackhart & Clark, 2019). Participants answered the following questions: (a) Please enter any questions you might have. (b) Please describe what you think our hypotheses are. (c) Did anything odd or strange happen while you were participating in this study? If yes, please explain what happened. (d) Please explain what information, if any, you believe we may have held back from you. (e) If you mentioned anything in response to the previous question, at what point during the study did you begin to think about what you mentioned? Also, how (if at all) do you think those aspects of the study affected your behavior?
Exclusion Criteria
We excluded participants who met any of the following criteria from the primary analysis: (a) answered that they knew the hypotheses during the suspicion probe, (b) failed to answer both instructed response items correctly (e.g., “Please choose strongly disagree for this item” and “Please choose strongly agree for this item”; Kam & Chan, 2018), (c) spent less than 1 second per item on the scale (i.e., self-construal scale) following Wood et al. (2017), (d) chose the same response options within a section (an index of identical consecutive responses; Kam & Meyer, 2015) on the scale (i.e., self-construal scale). As a robustness check, we also investigated whether the inclusion of these participants qualitatively affected the results.
Statistical Analyses
We used R 4.3.0 (R Core Team, 2023) for statistical analyses. Specifically, we used the R packages tidyverse 2.0.0 (Wickham et al., 2019), careless 1.2.1 (Yentes & Wilhelm, 2021), and rstatix 0.7.2 (Kassambara, 2023) for data exploration and descriptive statistics. Moreover, we used the R packages afex 1.3-0 (Singmann et al., 2023), emmeans 1.8.6 (Lenth, 2023), effectsize 0.8.3 (Ben-Shachar et al., 2020), and papaja 0.1.1 (Aust & Barth, 2022) for ANOVA and drawing graphs. We also used the R package ltm 1.2-0 (Rizopoulos, 2006) to compute Cronbach’s alpha coefficients, rstatix 0.7.2 (Kassambara, 2023) and correlation 0.8.4 (Makowski et al., 2020) for correlation analyses, and TOSTER 0.7.1 (Lakens, 2017) for equivalence tests.
To test Hypotheses 1 and 2, we conducted a mixed ANOVA predicting preference ratings with culture (European American vs. Japanese) and game condition (aggressive vs. nonaggressive) as between-participants variables, and emotion (anger vs. happiness vs. calmness) and stimuli type (music vs. memory) as within-participants variables. We also conducted a mixed ANOVA predicting utility ratings with culture (European American vs. Japanese) and game condition (aggressive vs. nonaggressive) as between-participants variables, and emotion (anger vs. happiness vs. calmness) as a within-participants variable.
To test Hypothesis 3, we conducted correlation analyses between the perceived utility of anger and the preference for angry stimuli separately for European Americans and Japanese.
To test Hypothesis 4, we conducted correlation analyses between independent and interdependent self-construals and the preference for angry stimuli as well as the perceived utility of anger separately for European Americans and Japanese and for each of the game conditions. Before conducting analyses, we checked the internal consistency of the subscales of the Self-Construal Scale using Cronbach’s alpha. We also conducted multiple regression analyses with the preference for angry stimuli or perceived utility of anger as dependent variables and independent and interdependent self-construal as predictors separately for European Americans and Japanese and for each of the game conditions.
As a robustness check, we tested whether the main results changed after controlling for demographics (gender and age) and current emotions (anger, calmness, and happiness) at the beginning of the experiment.
Results
Deviations From the Preregistration
There were no deviations in the data collection procedures, sample size, study design, materials, or measured variables from those that were preregistered. We also tested preregistered hypotheses following the preregistered data exclusion and analysis plans. In addition, we conducted non-preregistered analyses to test the robustness of the results. Specifically, we investigated (a) whether the preference and utility ratings differed meaningfully between participants who realized there was no gameplay and those who did not, 5 (b) to what extent the main results changed when a single item was used for utility ratings instead of the mean value of two items, 6 and (c) the correlations between the perceived utility of emotions and the preferences for emotional stimuli separated by the game conditions. 7
Participants Meeting the Exclusion Criteria
In light of the exclusion criteria, 17 participants answered that they knew the hypotheses based on the suspicion probe (see Note 5), three participants failed to answer both instructed response items correctly, five participants spent less than 1 s per item on the self-construal scale, and five participants chose the same response options within a section on the self-construal scale. Among them, one participant met two exclusion criteria (i.e., failed to answer both instructed response items correctly and chose the same response options within a section on the self-construal scale). Therefore, a total of 29 participants were excluded. The remaining 336 European Americans (man = 170, woman = 155, transgender man = 1, nonbinary = 8, agender = 1, prefer not to say = 1, Mage = 34.49, SDage = 7.50) and 335 Japanese (man = 159, woman = 172, prefer not to say = 4, Mage = 37.51, SDage = 7.14) were included in the main analysis. There were 163 European Americans and 170 Japanese in the aggressive game condition and 173 European Americans and 165 Japanese in the nonaggressive game condition.
Preferences for Emotional Stimuli
Based on the principle of instrumental motives, we hypothesized that individuals would be more likely to increase anger in a confrontational context than in a nonconfrontational context (Hypothesis 1). Moreover, we also hypothesized that European Americans would be more likely than Japanese to prefer angry stimuli in a confrontational context (Hypothesis 2). To test these hypotheses, we conducted a mixed ANOVA predicting preference ratings with culture (European American vs. Japanese) and game condition (aggressive vs. non-aggressive) as between-participants variables, and emotion (anger vs. calmness vs. happiness) and stimuli type (music vs. memory) as within-participants variables.
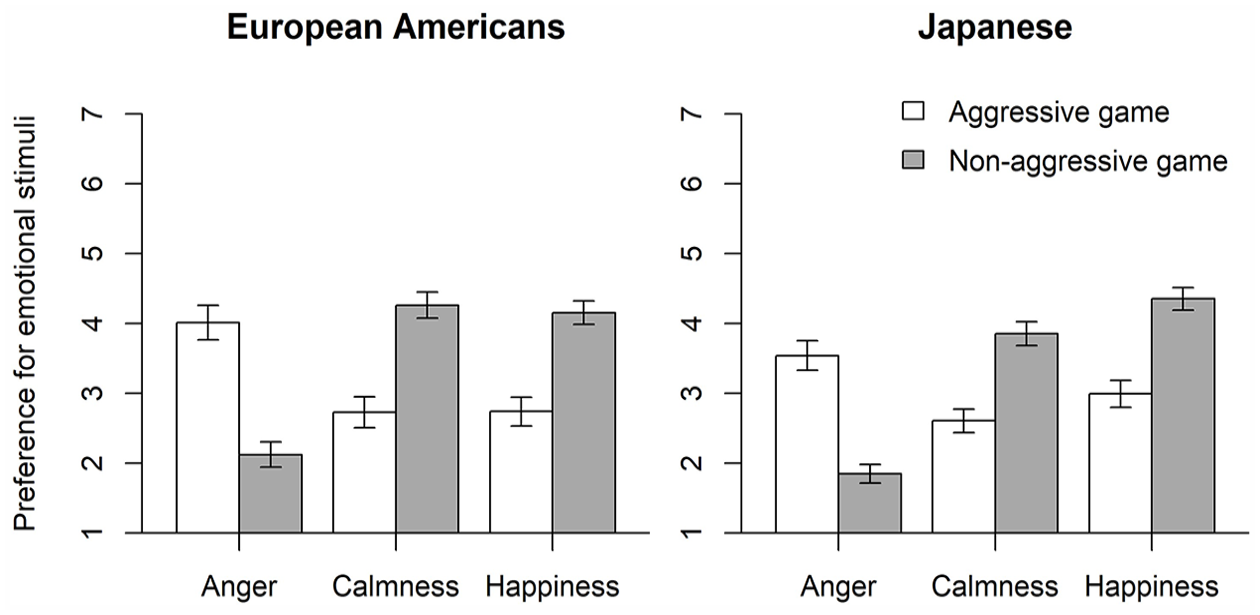
Consistent with Hypothesis 1, we found a significant Game Condition × Emotion interaction, F(2, 1334) = 176.45, p < .001, ηp2 = .21, 95% confidence interval (CI) = [.17, .25]. However, contrary to Hypothesis 2, a Culture × Game Condition × Emotion interaction was not significant, F(2, 1334) = 2.78, p = .063, ηp2 = .00, 95% CI = [.00, .01]. Figure 1 shows the mean values and 95% CIs of the preferences for emotional stimuli according to culture, game condition, and emotion.
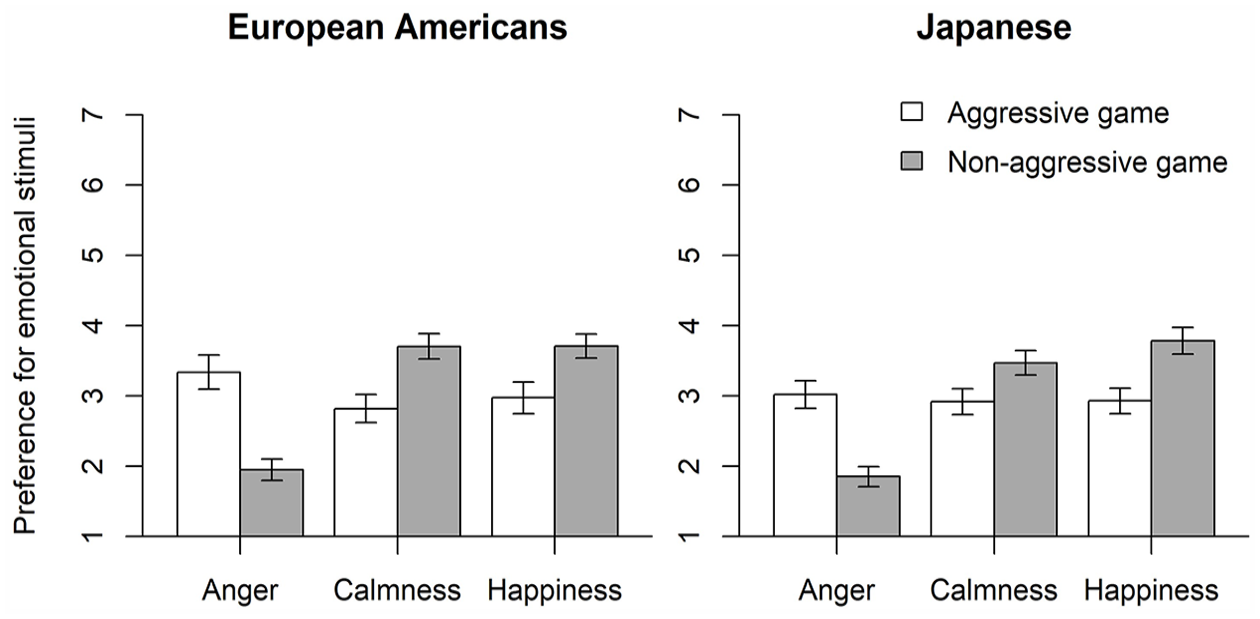
Preferences for Emotional Stimuli Before Playing a Game as a Function of Culture and Game Condition (Study 1).
Post hoc analyses support Hypothesis 1 for both European Americans and Japanese. Specifically, participants in the aggressive game condition significantly preferred angry stimuli more than those in the nonaggressive game condition among both European Americans (M = 3.34, SD = 1.56 vs. M = 1.95, SD = 1.01) and Japanese (M = 3.02, SD = 1.31 vs. M = 1.85, SD = 0.92), ts > 9.40, ps < .001, ds > 1.02. In contrast, those in the nonaggressive game condition significantly preferred happy stimuli more than those in the aggressive game condition among both European Americans (M = 3.71, SD = 1.12 vs. M = 2.97, SD = 1.44) and Japanese (M = 3.78, SD = 1.24 vs. M = 2.93, SD = 1.21), ts > 5.25, ps < .001, ds > 0.57. Participants in the nonaggressive game condition also significantly preferred calm stimuli more than those in the aggressive game condition among both European Americans (M = 3.70, SD = 1.19 vs. M = 2.82, SD = 1.29) and Japanese (M = 3.47, SD = 1.14 vs. M = 2.92, SD = 1.23), ts > 4.27, ps < .001, ds > 0.46. They suggest that both European Americans and Japanese regulated their emotions based on instrumental motives.
Post hoc analyses also revealed that European Americans significantly preferred angry stimuli over Japanese in the aggressive game condition (M = 3.34, SD = 1.56 vs. M = 3.02, SD = 1.31), t(331) = 2.03, p = .043, d = 0.22, 95% CI = [0.01, 0.44]. This result is consistent with Hypothesis 2. However, given that the effect size was small and the Culture × Game Condition × Emotion interaction was not significant, the strength of this result should be interpreted with caution. The remaining cultural differences were not significant, ts < 1.86, ps > .064, ds < 0.21.
Although less relevant to our research hypotheses, we also found a significant Culture × Game Condition × Emotion × Stimuli type interaction, F(2, 1334) = 3.61, p = .027, ηp2 = .01, 95% CI = [.00, .01]. Therefore, we performed analyses separated by stimulus type. These results support Hypothesis 1 for both music and memory stimuli. Specifically, participants in the aggressive game condition significantly preferred both angry music and memory over those in the non-aggressive game condition among both European Americans and Japanese, ts > 6.51, ps < .001, ds > 0.71. In contrast, those in the nonaggressive game condition significantly preferred happy and calm music and memories over those in the aggressive game condition among both European Americans and Japanese, ts > 2.16, ps < .032, ds > 0.23. However, contrary to Hypothesis 2, preferences for angry music and memory were not statistically different between European Americans and Japanese in the aggressive game condition, ts < 1.68, ps > .095, ds < 0.19. Please see Supplemental Material 1 for detailed results.
Perceived Utility of Emotions
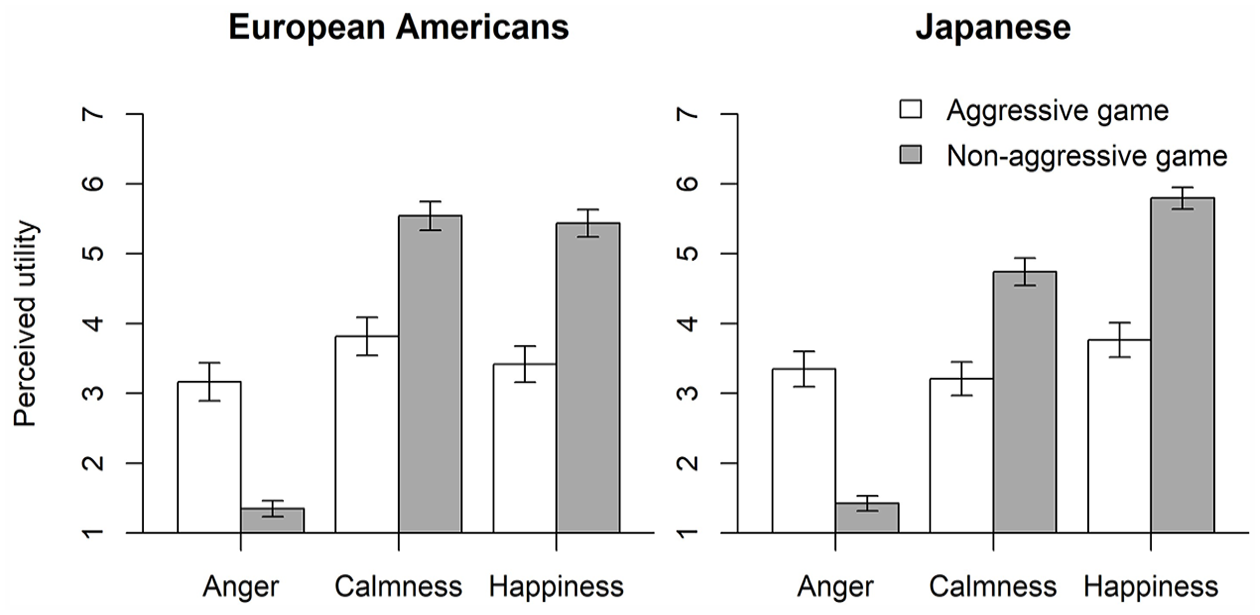
To test whether the perceived utility of emotions differed as a function of culture and game condition, we conducted a mixed ANOVA predicting perceived utility ratings with culture (European American vs. Japanese) and game condition (aggressive vs. nonaggressive) as between-participants variables and emotion (anger vs. calmness vs. happiness) as a within-participants variable. As expected, we found a significant Game Condition × Emotion interaction, F(2, 1334) = 202.05, p < .001, ηp2 = .23, 95% CI = [.19, .27]. However, a Culture × Game Condition × Emotion was not significant, F(2, 1334) = 0.99, p = .371, ηp2 = .00, 95% CI = [.00, .01]. Figure 2 shows the mean values and 95% CIs of the perceived utility of emotions in the game according to culture, game condition, and emotion (see Note 6).
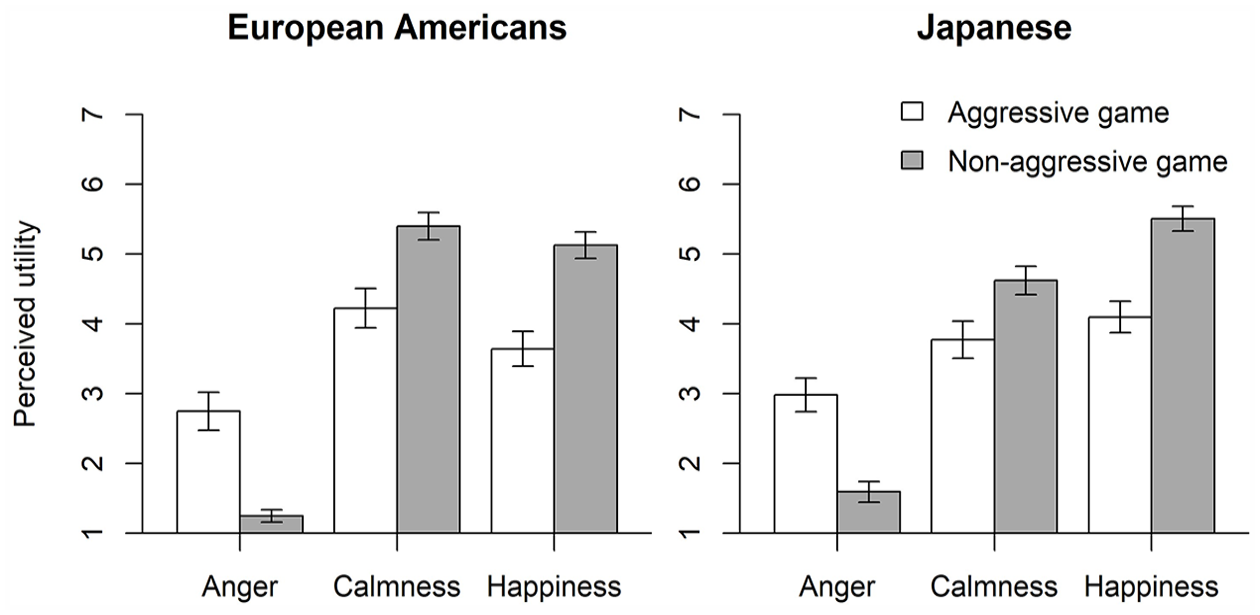
Perceived Utility of Emotions in the Game as a Function of Culture and Game Condition (Study 1).
Post hoc analyses revealed that participants in the aggressive game condition perceived the utility of anger significantly more than those in the nonaggressive game condition among both European Americans (M = 2.74, SD = 1.75 vs. M = 1.25, SD = 0.59) and Japanese (M = 2.98, SD = 1.58 vs. M = 1.59, SD = 0.98), ts > 9.63, ps < .001, ds > 1.05. In contrast, participants in the nonaggressive game condition perceived the utility of happiness significantly more than those in the aggressive game condition among both European Americans (M = 5.13, SD = 1.26 vs. M = 3.64, SD = 1.63) and Japanese (M = 5.51, SD = 1.15 vs. M = 4.10, SD = 1.48), ts > 9.37, ps < .001, ds > 1.02. These participants also perceived the utility of calmness significantly more than those in the aggressive game condition among both European Americans (M = 5.40, SD = 1.29 vs. M = 4.22, SD = 1.81) and Japanese (M = 4.62, SD = 1.32 vs. M = 3.77, SD = 1.75), ts > 5.01, ps < .001, ds > 0.54.
Post hoc analyses also revealed that the perceived utility of anger was not statistically different between European Americans and Japanese in the aggressive game condition (M = 2.74, SD = 1.75 vs. M = 2.98, SD = 1.58), t(331) = 1.28, p = .200, d = 0.14, 95% CI = [−0.07, 0.36]. This result is inconsistent with Hypothesis 2. Regarding the remaining cultural differences, Japanese perceived the utility of anger in the nonaggressive game condition and that of happiness in both game conditions significantly more than European Americans did, ts > 2.67, ps < .008, ds > 0.29. By contrast, European Americans perceived the utility of calmness significantly more than Japanese in both game conditions, ts > 2.32, ps < .021, ds > 0.25.
Relationships Between the Perceived Utility of Emotions and the Preferences for Emotional Stimuli
We hypothesized that individual differences in the perceived utility of anger would be positively associated with anger preference among both European Americans and Japanese (Hypothesis 3). To test this hypothesis, we conducted correlation analyses between the perceived utility of emotions and the preferences for emotional stimuli (see Note 7). The results are summarized in Table 2. As predicted, the perceived utility of anger was significantly and positively associated with the preference for angry stimuli, supporting Hypothesis 3.
Correlations Between Perceived Utility of Emotions and Preferences for Emotional Stimuli (Study 1).
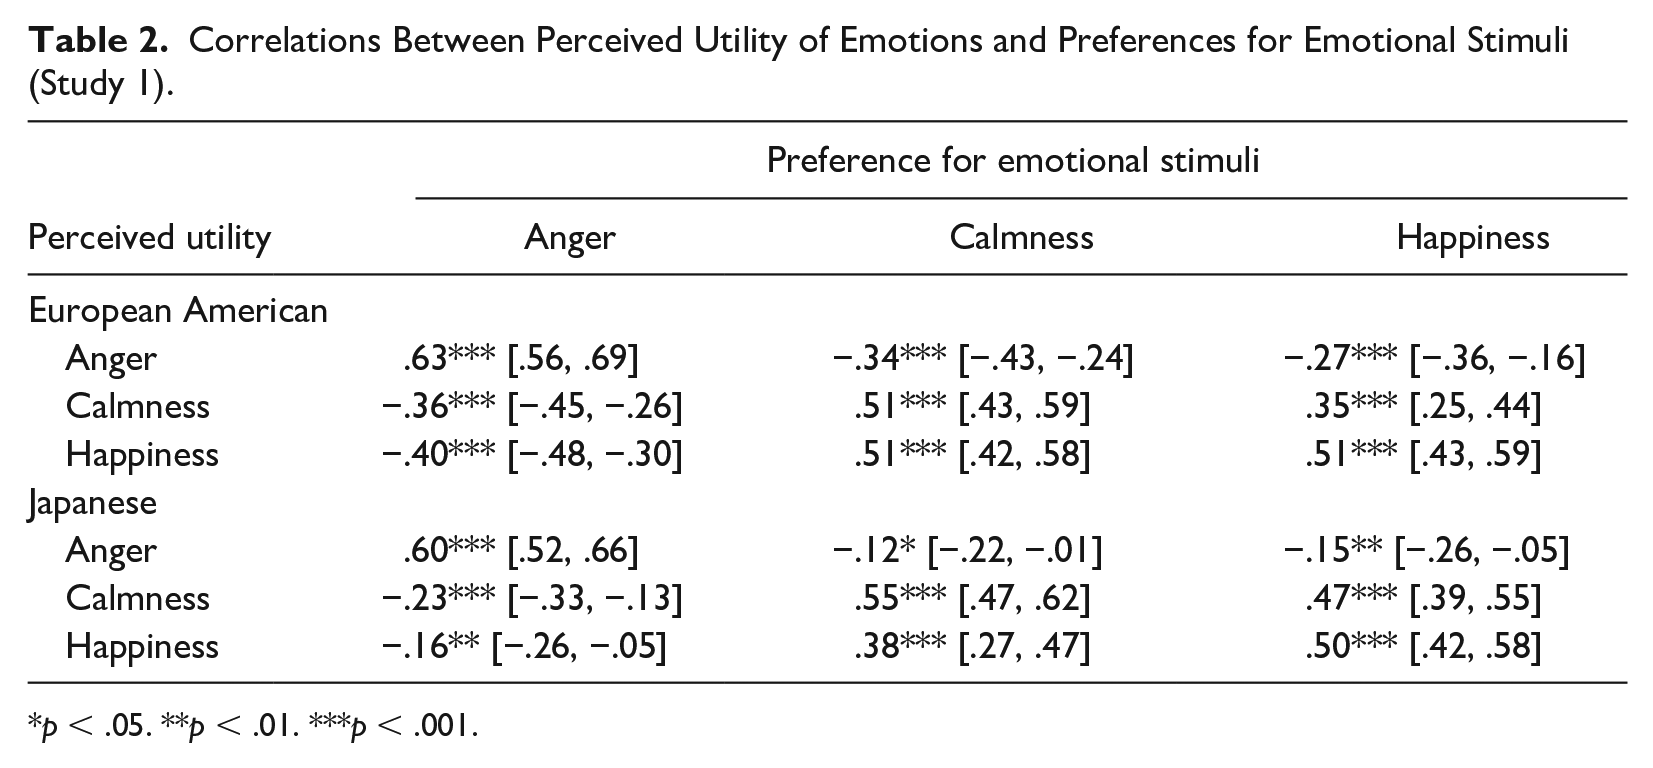
p < .05. **p < .01. ***p < .001.
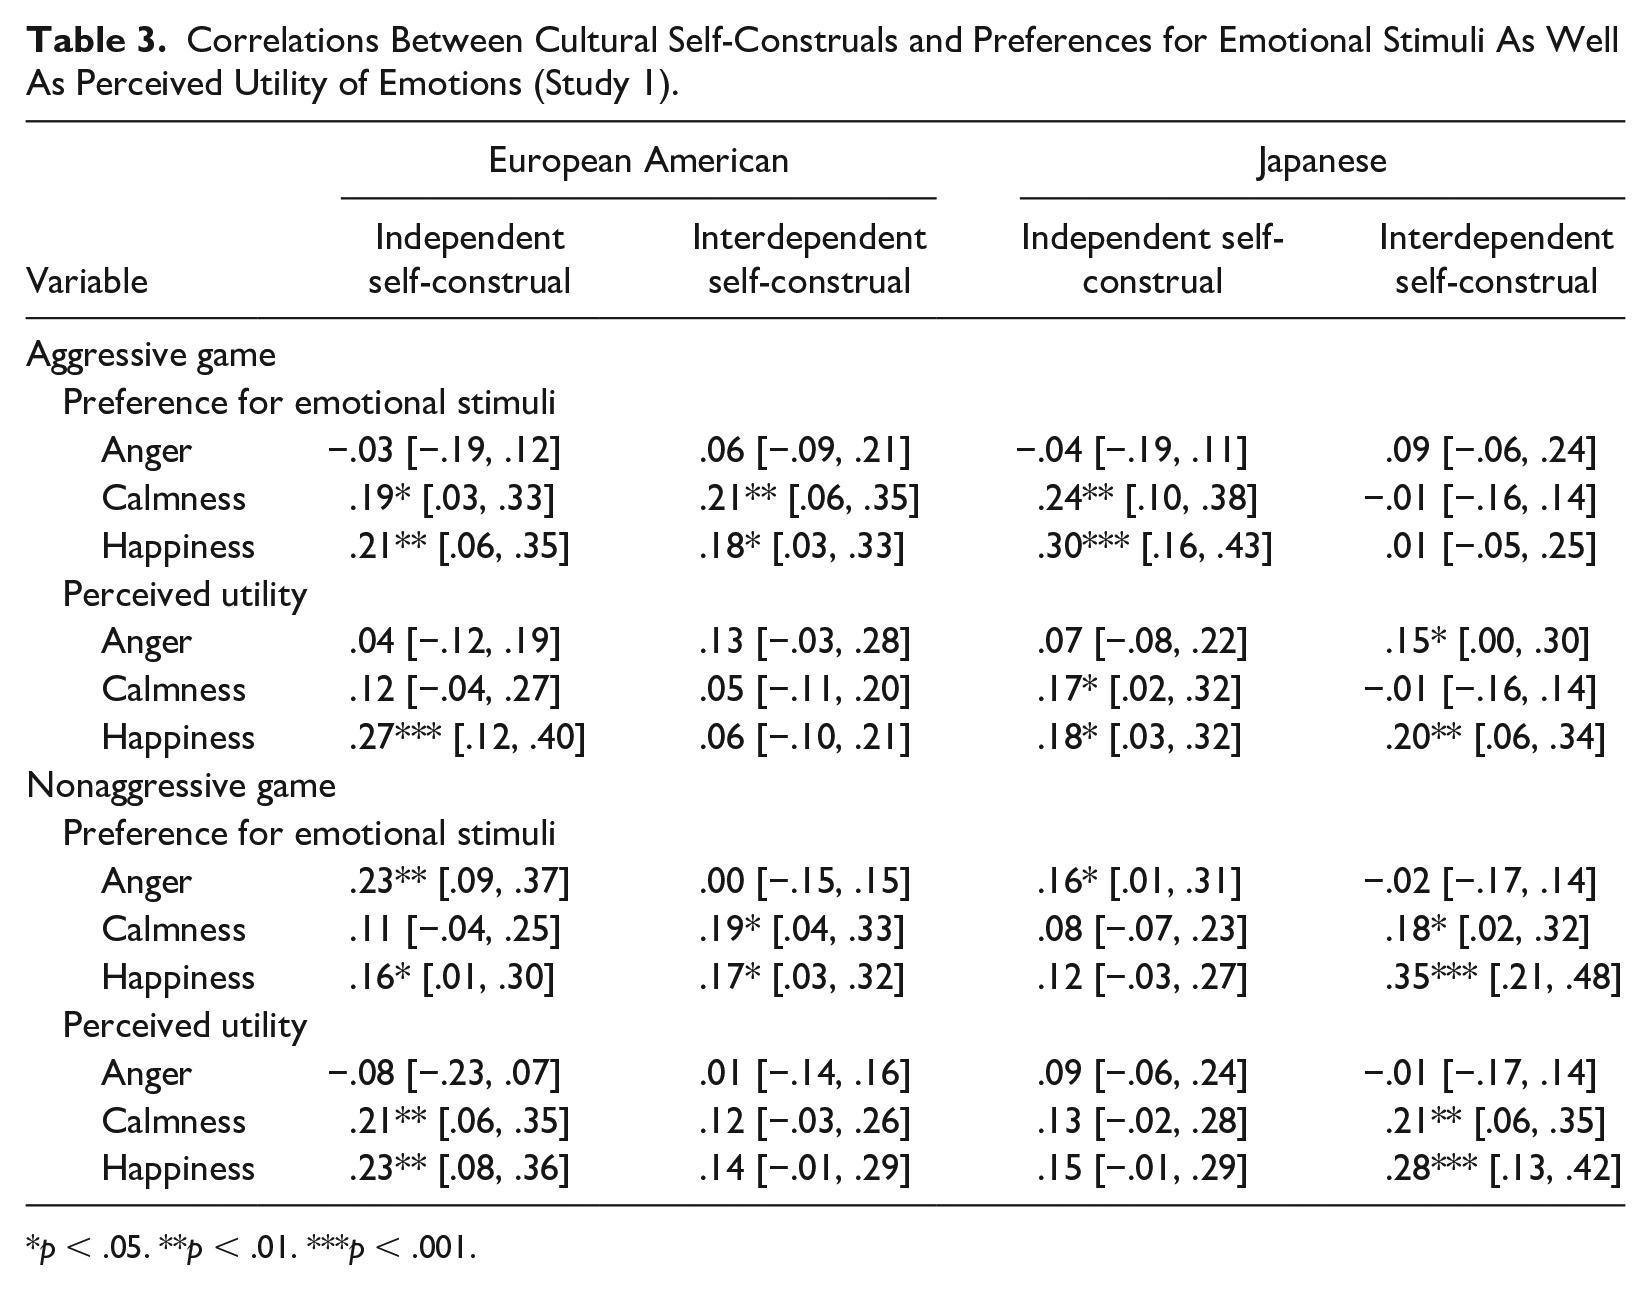
Relationships Between Cultural Self-Construals and the Preferences for Emotional Stimuli As Well As the Perceived Utility of Emotions
We hypothesized that independent self-construal would be positively related to anger preference in a confrontational context, whereas interdependent self-construal would be negatively associated with it (Hypothesis 4). To test this hypothesis, we conducted correlation analyses between independent and interdependent self-construals, and the preference for angry stimuli separately for European Americans and Japanese and for each of the game conditions. Cronbach’s alphas for independent and interdependent self-construals were sufficient for both European Americans and Japanese (αs = .80–.81). Table 3 summarizes the results. Contrary to Hypothesis 4, when focusing on the aggressive game condition, neither independent nor interdependent self-construal was significantly related to the preference for angry stimuli.
Correlations Between Cultural Self-Construals and Preferences for Emotional Stimuli As Well As Perceived Utility of Emotions (Study 1).
p < .05. **p < .01. ***p < .001.
Moreover, we conducted correlation analyses between independent and interdependent self-construals and the perceived utility of anger (Table 3). In the aggressive game condition, interdependent self-construal was significantly and positively related to the perceived utility of anger among Japanese contrary to the prediction, r = .15, 95% CI = [.00, .30], p = .046, whereas the remaining correlations were not statistically significant.
We also conducted multiple regression analyses with the preference for angry stimuli or perceived utility of anger as dependent variables and independent and interdependent self-construals as predictors separately for European Americans and the Japanese and for each of the game conditions. When focusing on the aggressive game condition, interdependent self-construal was significantly and positively associated with the utility rating of anger among Japanese contrary to the prediction, β = .16, 95% CI = [.01, .31], p = .039. In contrast, the remaining predictors were not statistically significant, ps > .101. Therefore, Hypothesis 4 is not supported.
Sensitivity Analyses: Analyses Using All Data
For the sensitivity analyses, we repeated the above analyses using all data without applying the exclusion criteria. The main findings related to the hypotheses remained unchanged except for the following: In the analysis using data in which the exclusion criteria were applied, European Americans preferred angry stimuli significantly more than Japanese in the aggressive game condition. However, in the analysis using all data, this cultural difference was nonsignificant between the two groups of people (M = 3.31, SD = 1.55 vs. M = 3.04, SD = 1.29), t(351) = 1.75, p = .081, d = 0.19, 95% CI = [0.02, 0.40]. Moreover, interdependent self-construal was significantly and positively associated with the perceived utility of anger among Japanese in the correlation and multiple regression analysis using the data in which the exclusion criteria had been applied, whereas this relationship was not significant in the analysis using all data, r = .14, 95% CI = [−.00, .28], p = .058 and β = .14, 95% CI = [−.00, .29], p = .055, respectively.
Sensitivity Analyses: Analyses With Control Variables
We repeated the above analyses while controlling for gender, age, and current emotions (anger, calmness, and happiness) at the beginning of the experiment. Considering the number of participants, only those who identified themselves as man or woman were included. The main findings related to the hypotheses remained unchanged except for the following: In the analysis with control variables, analysis of covariance (ANCOVA) revealed that the preference for angry stimuli was not statistically different between European Americans and Japanese, F(1, 320) = 2.28, p = .132, ηp2 = .01, 95% CI = [.00, .04].
Discussion
Overall, the results of Study 1 reveal similar findings on intrinsic instrumental anger regulation between European Americans and Japanese, with robust results supporting Hypotheses 1 and 3. In contrast, cultural differences in intrinsic instrumental anger regulation are limited, contrary to Hypotheses 2 and 4. Specifically, although European Americans preferred angry stimuli significantly more than Japanese in the aggressive game condition in the main analysis, the effect size was small (d = 0.22, 95% CI = [0.01, 0.44]). Moreover, this cultural difference became nonsignificant in the sensitivity analyses. In addition, cultural self-construals were not significantly related to the preference for anger stimuli in the aggressive game condition.
Study 2
Previous research has highlighted that individuals regulate anger based on instrumental motives, not only in the case of intrinsic emotion regulation but also in the case of extrinsic emotion regulation (Netzer, Van Kleef, et al., 2015). Indeed, Japanese may be more reluctant than European Americans to attempt to increase their partner’s anger, even in a situation where feeling angry would be beneficial. Thus, Study 2 tested the hypotheses in the case of extrinsic emotion regulation.
Method
Study design, sample size, inclusion/exclusion criteria, and planned analyses were preregistered (https://osf.io/rxjgu). We report all data exclusions, manipulations, and measures. All data, analysis code, and research materials are available (https://osf.io/7nvsb).
Participants
A total of 350 European Americans (man = 173, woman = 169, nonbinary = 7, prefer not to say = 1, Mage = 33.85, SDage = 7.85) and 350 Japanese (man = 156, woman = 191, prefer not to say = 3, Mage = 37.69, SDage = 7.06) between the ages of 18 and 49 years participated in the study conducted in January 2023. As in Study 1, we focused on this age range, because attitudes toward computer games may vary among older adults. The criteria for determining the sample size were the same as those used in Study 1. Participants lived in their own country for most of their lives (the mean value of subtracting the length of residence from age was 0.24 years). In Study 2, we also collected data on the participants’ highest level of education that they have completed (if currently enrolled, the highest degree received) and their annual household income for demographic purposes. Please see Supplemental Material 4 for detailed results.
European American and Japanese participants were recruited via the online crowdsourcing platforms Prolific and Crowdworks, respectively. Those who participated in Study 1 did not participate in this study. Participants who completed the experiment were paid £3.75 (Prolific) or 500 JPY (Crowdworks). They were randomly assigned to either aggressive (European Americans = 177, Japanese = 176) or nonaggressive game conditions (European Americans = 173, Japanese = 174).
Procedure
The procedure was the same as that used in Study 1 with the following exceptions: Participants were informed that they would be paired up with another participant taking the survey at the same time. They were paired up with another actual participant by using SMARTRIQS, an open-source add-on to the Qualtrics survey platform (Molnar, 2019). After matching, the participants were told that their paired partners would be playing a computer game (aggressive shooting or nonaggressive treasure-hunting game). Participants then rated the extent to which they would like their paired partners to listen to each piece of music before playing the game to get as good a score as possible. Subsequently, participants rated the extent to which they would like their paired partners to recall each emotional event before playing the game to get as good a score as possible. That is, participants rated the extent to which they would like their paired partners, rather than themselves, to perform each emotional activity before playing the game. 8 Participants reported their educational level and annual household income after completing the cultural self-construal scale. The remaining procedures were the same as those in Study 1. This procedure has been approved by the Ethics Committee of Konan University (22-06).
Exclusion Criteria
As in Study 1, we excluded participants who met any of the following criteria from the primary analysis: (a) answered that they knew the hypotheses during the suspicion probe, (b) failed to answer both instructed response items correctly (e.g., “Please choose strongly disagree for this item” and “Please choose strongly agree for this item”; Kam & Chan, 2018), (c) spent less than 1 s per item on the scale (i.e., self-construal scale) following Wood et al. (2017), (d) chose the same response options within a section (an index of identical consecutive responses; Kam & Meyer, 2015) on the scale (i.e., self-construal scale). As a robustness check, we also investigated whether the inclusion of these participants qualitatively affected the results.
Statistical Analyses
As in Study 1, we used the mean values of the two items for each emotion category regarding the current emotions, preferences for emotional music and memory, and perceived utility of emotions (αs > .74). We conducted the same analyses as in Study 1.
Results
Deviations From the Preregistration
There were no deviations in the data collection procedures, sample size, study design, materials, or measured variables from those that were preregistered. We also tested preregistered hypotheses following the data exclusion and analysis plans. In addition, we conducted non-preregistered analyses to test the robustness of the results, as in Study 1. Specifically, we investigated (a) whether the preference and utility ratings differed meaningfully between participants who believed that there was no partner playing the game and those who did not, 9 (b) to what extent the main results changed when a single item was used for utility ratings instead of the mean value of two items, 10 (c) the correlations between the perceived utility of emotions and the preferences for emotional stimuli separated by the game conditions. 11
Participants Meeting the Exclusion Criteria
In light of the exclusion criteria, 13 participants answered that they knew the hypotheses based on the suspicion probe (see Note 9), four participants failed to answer both instructed response items correctly, two participants spent less than 1 s per item on the self-construal scale, and six participants chose the same response options within a section of the self-construal scale. Among them, two participants met two exclusion criteria (i.e., failed to answer both instructed response items correctly and spent less than 1 s per item on the self-construal scale). Therefore, 23 participants were excluded. The remaining 334 European Americans (man = 164, woman = 162, nonbinary = 7, prefer not to say = 1, Mage = 33.78, SDage = 7.89) and 343 Japanese (man = 152, woman = 188, prefer not to say = 3, Mage = 37.72, SDage = 7.03) were included in the main analysis. There were 165 European Americans and 171 Japanese in the aggressive game condition and 169 European Americans and 172 Japanese in the nonaggressive game condition.
Preferences for Emotional Stimuli for the Partners
Based on the principle of instrumental motives, we hypothesized that individuals would be more likely to increase their partners’ anger in a confrontational context than in a nonconfrontational context (Hypothesis 1). Moreover, we also hypothesized that European Americans would be more likely than Japanese to increase their partners’ anger in a confrontational context (Hypothesis 2). To test these hypotheses, we conducted a mixed ANOVA predicting preference ratings with culture (European American vs. Japanese) and game condition (aggressive vs. nonaggressive) as between-participants variables, and emotion (anger vs. calmness vs. happiness) and stimuli type (music vs. memory) as within-participants variables.
Consistent with Hypothesis 1, we found a significant Game Condition × Emotion interaction, F(2, 1346) = 344.51, p < .001, ηp2 = .34, 95% CI = [.30, .38]. However, contrary to Hypothesis 2, a Culture × Game Condition × Emotion interaction was not significant, F(2, 1346) = 1.50, p = .225, ηp2 = .00, 95% CI = [.00, .01]. Figure 3 shows the mean values and 95% CIs of the preferences for emotional stimuli according to culture, game condition, and emotion.
Preferences for Emotional Stimuli for the Partners Before Playing the Game as a Function of Culture and Game Condition (Study 2).
Post hoc analyses support Hypothesis 1 for both European Americans and Japanese. Specifically, participants in the aggressive game condition preferred angry stimuli for their partners significantly more than those in the nonaggressive game condition among both European Americans (M = 4.01, SD = 1.60 vs. M = 2.12, SD = 1.17) and Japanese (M = 3.54, SD = 1.41 vs. M = 1.85, SD = 0.87), ts > 12.33, ps < .001, ds > 1.34. In contrast, participants in the nonaggressive game condition preferred happy stimuli for their partners significantly more than those in the aggressive game condition among both European Americans (M = 4.15, SD = 1.10 vs. M = 2.74, SD = 1.35) and Japanese (M = 4.35, SD = 1.07 vs. M = 2.99, SD = 1.28), ts > 10.51, ps < .001, ds > 1.15. These participants also preferred calm stimuli for their partners significantly more than those in the aggressive game condition among both European Americans (M = 4.26, SD = 1.23 vs. M = 2.73, SD = 1.43) and Japanese (M = 3.85, SD = 1.12 vs. M = 2.60, SD = 1.12), ts > 10.31, ps < .001, ds > 1.11. They suggest that both European Americans and Japanese tried to regulate their partners’ emotions based on instrumental motives.
Post hoc analyses also revealed that European Americans preferred angry stimuli for their partners significantly more than Japanese in the aggressive game condition (M = 4.01, SD = 1.60 vs. M = 3.54, SD = 1.41), t(334) = 2.89, p = .004, d = 0.32, 95% CI [0.10, 0.53]. This result is consistent with Hypothesis 2. However, given that the Culture × Game Condition × Emotion interaction was not significant, the strength of this result should be interpreted with caution. Moreover, European Americans preferred angry and calm stimuli for their partners significantly more than Japanese in the nonaggressive game condition, ts > 2.46, ps < .015, ds > 0.26. The remaining cultural differences were not significant, ts < 1.78, ps > .076, ds < 0.20.
Contrary to Study 1, a Culture × Game Condition × Emotion × Stimuli type interaction was not significant, F(2, 1346) = 1.96, p = .141, ηp2 = .00, 95% CI = [.00, .01]. To compare the results, we report the results of analyses separated by stimuli type in Supplemental Material 5. In summary, Hypothesis 1 is supported for both music and memory stimuli, while Hypothesis 2 is supported only for music.
Perceived Utility of Emotions
To test whether the perceived utility of emotions differed as a function of culture and game condition, we conducted a mixed ANOVA predicting perceived utility ratings with culture (European American vs. Japanese) and game condition (aggressive vs. nonaggressive) as between-participants variables and emotion (anger vs. calmness vs. happiness) as a within-participants variable. As expected, we found a significant Game Condition × Emotion interaction, F(2, 1346) = 359.43, p < .001, ηp2 = .35, 95% CI = [.31, .38]. However, a Culture × Game Condition × Emotion interaction was not significant, F(2, 1346) = 0.20, p = .821, ηp2 = .00, 95% CI = [.00, .00]. Figure 4 shows the mean values and 95% CIs of perceived utility of emotions according to Culture, Game condition, and Emotion (see Note 10).
Perceived Utility of Emotions in the Game as a Function of Culture and Game Condition (Study 2).
Post hoc analyses revealed that participants in the aggressive game condition perceived the utility of anger significantly more than those in the nonaggressive game condition among both European Americans (M = 3.16, SD = 1.76 vs. M = 1.35, SD = 0.74) and Japanese (M = 3.35, SD = 1.67 vs. M = 1.42, SD = 0.72), ts > 12.32, ps < .001, ds > 1.34. In contrast, participants in the nonaggressive game condition perceived the utility of happiness significantly more than those in the aggressive game condition among both European Americans (M = 5.44, SD = 1.30 vs. M = 3.42, SD = 1.68) and Japanese (M = 5.80, SD = 1.03 vs. M = 3.77, SD = 1.64), ts > 12.31, ps < .001, ds > 1.34. These participants also perceived the utility of calmness significantly more than those in the aggressive game condition among both European Americans (M = 5.54, SD = 1.36 vs. M = 3.82, SD = 1.76) and Japanese (M = 4.74, SD = 1.31 vs. M = 3.21, SD = 1.58), ts > 9.79, ps < .001, ds > 1.05.
Post hoc analyses also revealed that the perceived utility of anger was not statistically different between European Americans and Japanese in the aggressive game condition (M = 3.16, SD = 1.76 vs. M = 3.35, SD = 1.67), t(334) = 0.98, p = .326, d = 0.11, 95% CI = [−0.11, 0.32]. This result is inconsistent with Hypothesis 2. Regarding the remaining cultural differences, the Japanese perceived the utility of happiness significantly more than European Americans did in the nonaggressive game condition, t(339) = 2.83, p = .005, d = 0.31, 95% CI = [0.09, 0.52]. By contrast, European Americans perceived the utility of calmness significantly more than Japanese did in both game conditions, ts > 3.32, ps < .001, ds > 0.36. The remaining cultural differences were not significant, ts < 1.94, ps > .053, ds < 0.22.
Relationships Between the Perceived Utility of Emotions and the Preferences for Emotional Stimuli for the Partners
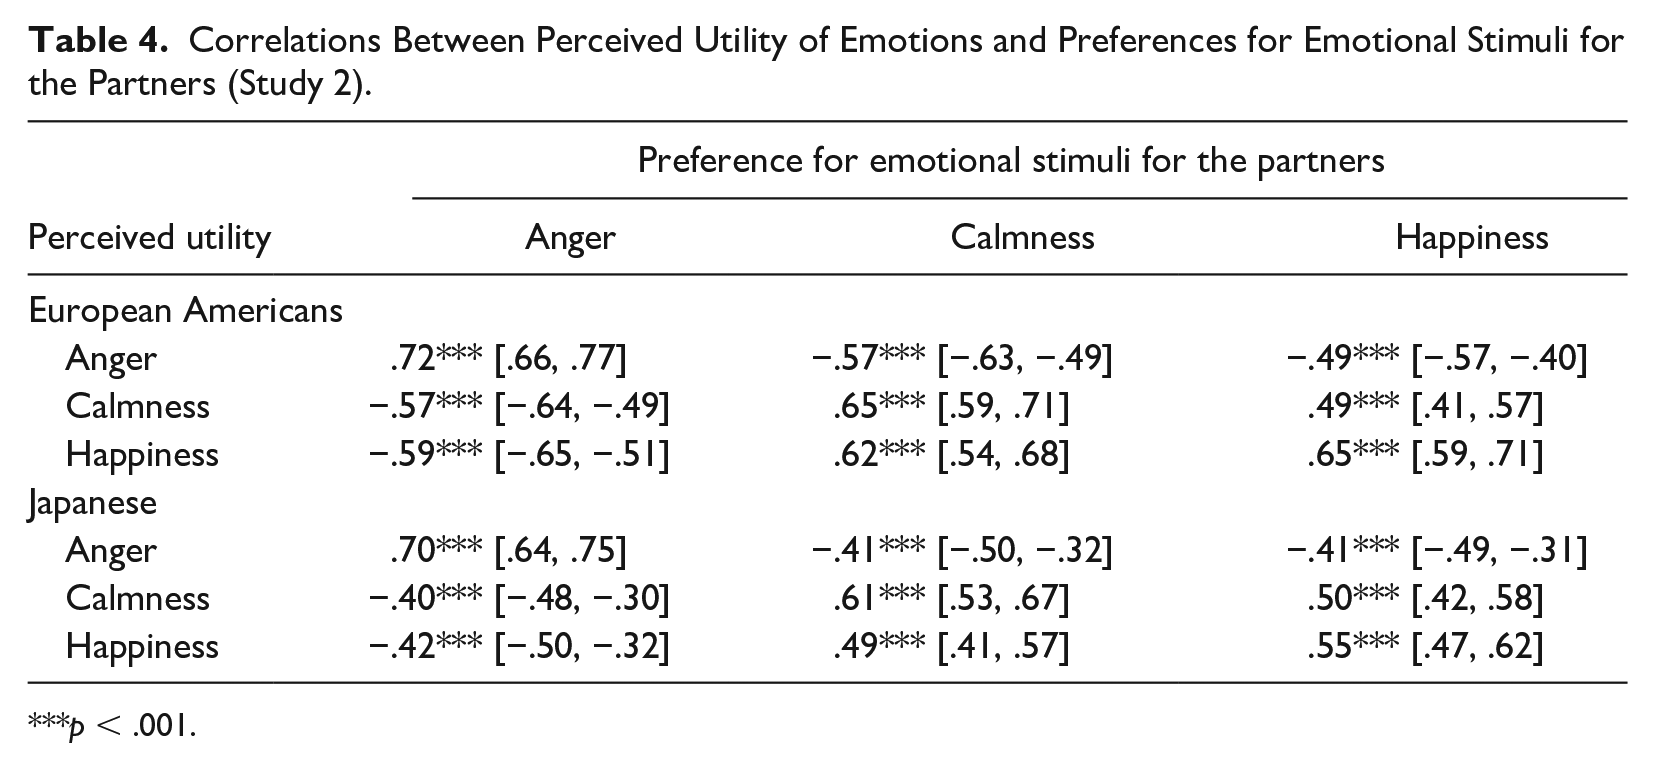
We hypothesized that individual differences in the perceived utility of anger would be positively associated with the preference for angry stimuli for the partners among both European Americans and Japanese (Hypothesis 3). To test this hypothesis, we conducted correlation analyses between the perceived utility of emotions and the preferences for emotional stimuli for the partners (see Note 11). The results are summarized in Table 4. As predicted, the perceived utility of anger was significantly and positively associated with the preference for angry stimuli for the partners, supporting Hypothesis 3.
Correlations Between Perceived Utility of Emotions and Preferences for Emotional Stimuli for the Partners (Study 2).
p < .001.
Relationships Between Cultural Self-Construals and the Preferences for Emotional Stimuli for the Partners As Well As the Perceived Utility of Emotions
We hypothesized that independent self-construal would be positively related to a preference for angry stimuli for the partners in a confrontational context, whereas interdependent self-construal would be negatively associated with it (Hypothesis 4). To test this hypothesis, we conducted correlation analyses between independent and interdependent self-construals, and the preference for angry stimuli as well as the perceived utility of anger separately for European Americans and Japanese and for each of the game conditions. Cronbach alphas of independent and interdependent self-construals were sufficient for both European Americans and Japanese (αs = .80–.84). Table 5 summarizes the results. Contrary to Hypothesis 4, neither independent nor interdependent self-construals were significantly related to the anger preference in the aggressive game condition among both European Americans and Japanese. Moreover, independent and interdependent self-construals were significantly and positively related to the perceived utility of anger in the aggressive game condition only among Japanese participants.
Correlations Between Cultural Self-Construals and Preferences for Emotional Stimuli As Well As Perceived Utility of Emotions (Study 2).
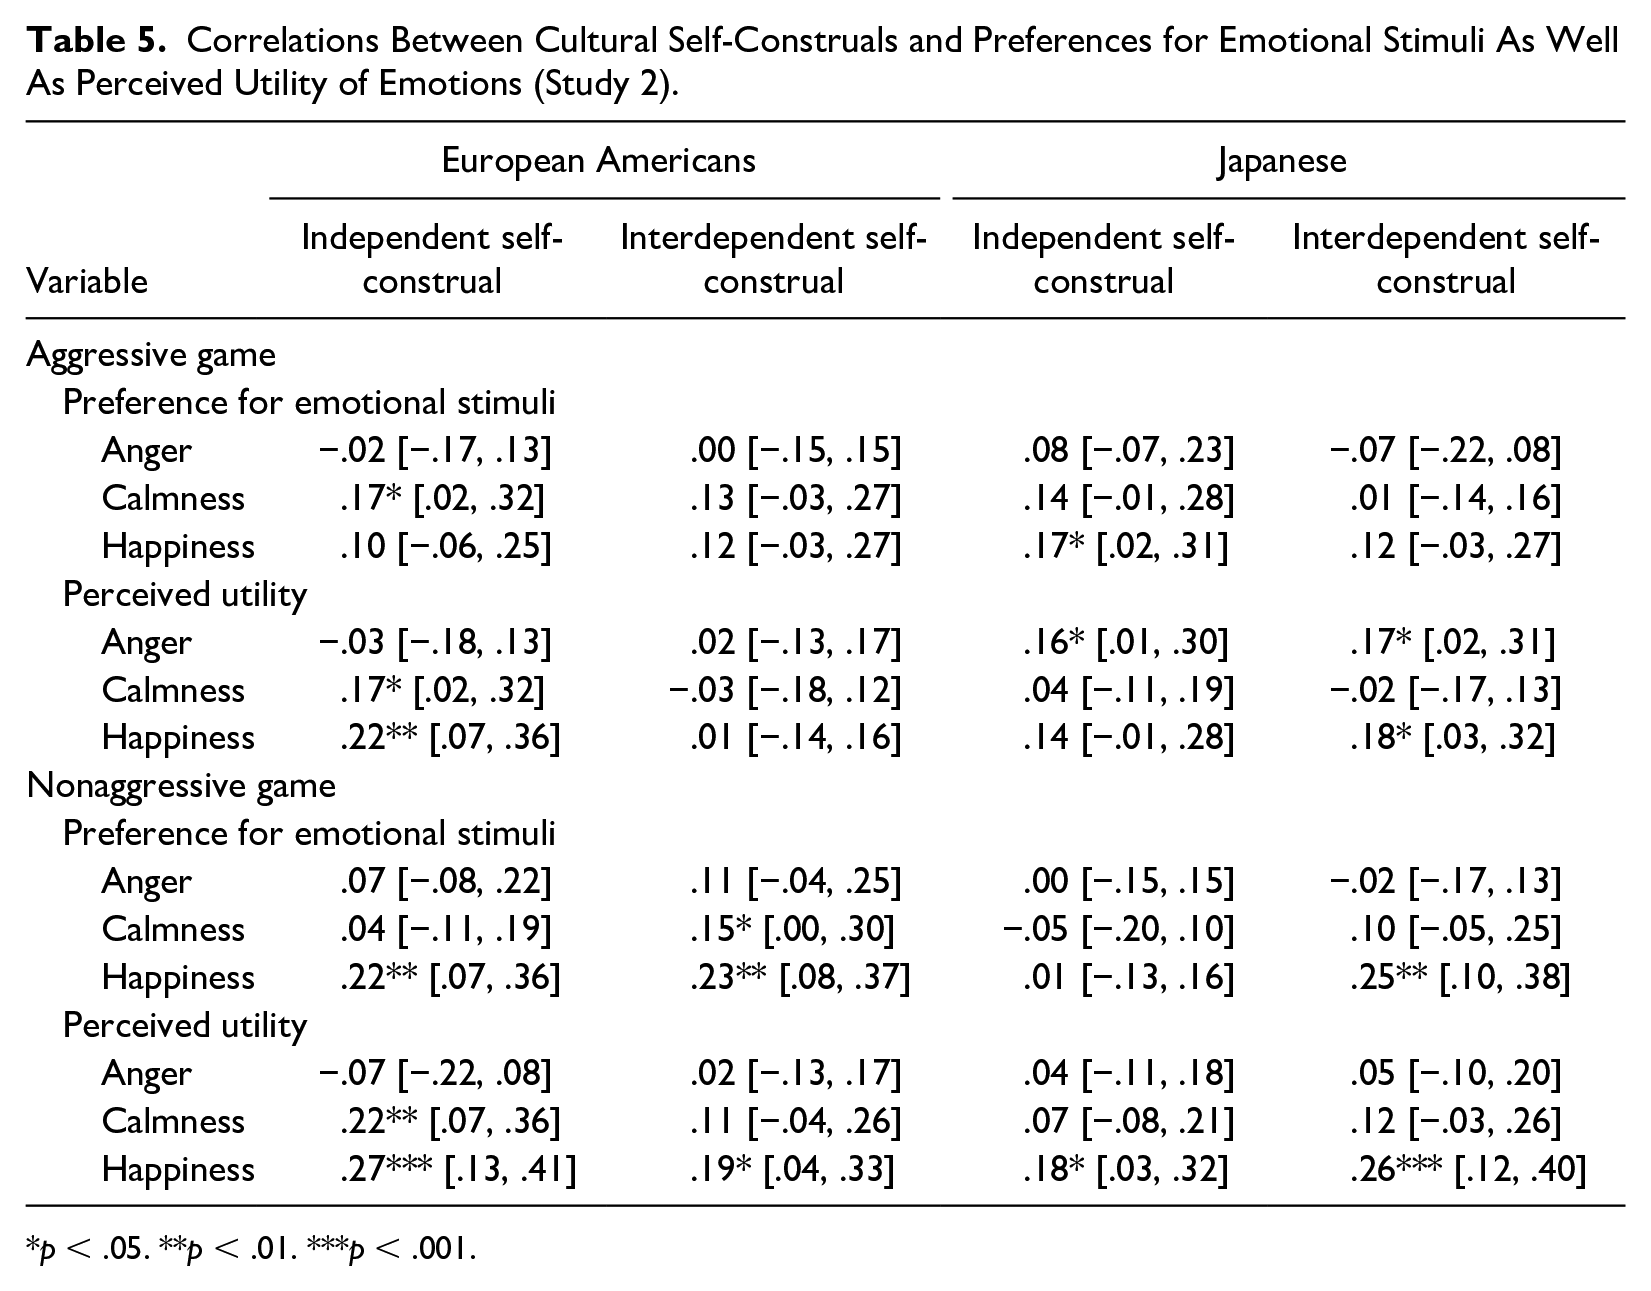
p < .05. **p < .01. ***p < .001.
In addition, we conducted multiple regression analyses with the preference for angry stimuli or the perceived utility of anger as dependent variables and independent and interdependent self-construals as predictors separately for European American and Japanese participants and for each of the game conditions. When focusing on the aggressive game condition, interdependent self-construal was significantly and positively associated with the perceived utility of anger among Japanese, β = .15, 95% CI = [.00, .30], p = .050. In contrast, the remaining predictors were not statistically significant, ps > .065. Therefore, Hypothesis 4 is not supported.
Sensitivity Analyses: Analyses Using All Data
We repeated the above analyses using all the data. The main findings related to the hypotheses remained unchanged except for the following: The correlation between independent self-construal and perceived utility of anger became nonsignificant, r = .14, 95% CI = [−.00, .29], p = .058, whereas the correlation between interdependent self-construal and perceived utility of anger was still significant, r = .17, 95% CI = [.03, .31], p = .022.
Sensitivity Analyses: Analyses With Control Variables
We repeated the above analyses while controlling for gender, age, and current emotions (anger, calmness, and happiness) at the beginning of the experiment. Considering the number of participants, only those who identified themselves as man or woman were included. The main findings related to the hypotheses remained unchanged, except for the following: In the analysis with control variables, ANCOVA revealed that the preference for angry stimuli was not statistically different between European Americans and Japanese, F(1, 325) = 1.37, p = .243, ηp2 = .00, 95% CI = [.00, .03]. Moreover, the correlation between independent self-construal and perceived utility of anger became nonsignificant among Japanese, partial r = .11, 95% CI = [−.04, .26], p = .148, while the correlation between interdependent self-construal and perceived utility of anger was still significant among them, partial r = .17, 95% CI = [.02, .31], p = .027.
Discussion
Overall, the results of Study 2 were similar to those of Study 1. Specifically, they reveal similar findings on extrinsic instrumental anger regulation between European Americans and Japanese, with robust results supporting Hypotheses 1 and 3. In contrast, cultural differences in extrinsic instrumental anger regulation are limited. Consistent with Hypothesis 2, European Americans preferred angry stimuli for their partners significantly more than Japanese in the aggressive game condition in the main analysis. The effect size was slightly larger (d = 0.32, 95% CI = [0.10, 0.53]) than in Study 1 (d = 0.22, 95% CI = [0.01, 0.44]). However, this cultural difference became nonsignificant when control variables were included in the analysis. In addition, contrary to Hypothesis 4, cultural self-construals were not significantly related to the preference for anger stimuli in the aggressive game condition.
General Discussion
This research tested the cross-cultural similarities and differences in instrumental motives for anger regulation between European Americans and Japanese. To this end, the two preregistered studies used the context of playing an aggressive computer game, a common methodology used in previous research on instrumental anger regulation (e.g., Netzer, Van Kleef, et al., 2015; Niven et al., 2019; Tamir et al., 2008). By testing the hypotheses in the case of the regulation of one’s own emotions (intrinsic emotion regulation; Study 1) and that of another person’s emotions (extrinsic emotion regulation; Study 2), the results provide novel insights into the generality of the existing theory of instrumental motives in anger regulation between European Americans and Japanese.
Cross-Cultural Similarities and Differences of Instrumental Anger Regulation
Based on the previous findings on instrumental anger regulation (e.g., Netzer, Van Kleef, et al., 2015; Niven et al., 2019; Tamir et al., 2008), we predicted that individuals would be more likely to prefer angry stimuli for themselves and their partners in a confrontational context than in a nonconfrontational context (Hypothesis 1). The results support this hypothesis for both European Americans and Japanese. Importantly, the effect sizes were large for both intrinsic emotion regulation (ds > 1.02 in Study 1) and extrinsic emotion regulation (ds > 1.34 in Study 2). These effects remained significant in the sensitivity analyses. Combined, these results suggest the robustness of the instrumental anger regulation findings.
We also predicted that European Americans would be more likely to prefer angry stimuli and perceive the utility of anger in a confrontational context than Japanese (Hypothesis 2), given that the American culture is more likely to facilitate individuals being motivated to feel anger than that of the Japanese (Kitayama et al., 2006). However, there is limited evidence to support this hypothesis. Specifically, the results from both Studies 1 and 2 showed that European Americans preferred angry stimuli significantly more than Japanese in the aggressive game condition, which is consistent with Hypothesis 2. Nevertheless, the effect sizes were not large (d = 0.22 in Study 1 and d = 0.32 in Study 2). Notably, as the Culture × Game Condition × Emotion interactions were not significant and these results were not robust in the sensitivity analyses, the strength and robustness of these cultural differences should be interpreted with caution. Moreover, we did not find significant cultural differences in the perceived utility of anger in the confrontational context in either Study 1 or 2. These effect sizes were small (d = 0.14 in Study 1 and d = 0.11 in Study 2).
These smaller-than-expected cultural differences reflect the strength of situational rather than cultural effects. Recent cross-cultural research showed that individuals from dignity (including the United States) and face cultures (including Japan) perceived anger functionality, such as taking resources back, to a similar extent (Maitner et al., 2022). In contrast to the case of instrumental positive emotion regulation (Ma et al., 2018), likely because of the aforementioned cultural similarity in the perception of anger functionality, both European Americans and Japanese perceived the utility of anger similarly in situations where anger was useful. Moreover, individuals from both cultures attempted to increase anger in this situation, albeit with slightly higher means observed in European Americans, which is likely due to the cultural affordance of anger (Kitayama et al., 2006). Overall, these findings provide novel insights into important cultural similarities and differences in instrumental anger regulation.
Individual Differences in Instrumental Anger Regulation: Relationships With Perceived Utility of Anger and Cultural Self-Construals
Based on previous findings on instrumental anger regulation (Netzer, Van Kleef, et al., 2015; Tamir & Ford, 2012), we predicted that individual differences in the perceived utility of anger would be positively associated with anger preference among both European Americans and Japanese (Hypothesis 3). The results support our hypothesis. Again, the effect sizes were large for both intrinsic (rs > .59 in Study 1) and extrinsic emotion regulation (rs > .70 in Study 2). These effects remained significant in the sensitivity analyses. Together with the evidence supporting Hypothesis 1, the results suggest the robustness of the instrumental anger regulation findings.
We also predicted that independent self-construal would be positively related to anger preference in a confrontational context, whereas interdependent self-construal would be negatively associated with it (Hypothesis 4). Contrary to this hypothesis. there were no significant associations between cultural self-construals and the preference for angry stimuli in the aggressive game condition in either Study 1 or 2 (|r| = .03–.09 in Study 1 and |r| = .00–.08 in Study 2). These results suggest that cultural self-construal is not strongly associated with the implementation of instrumental anger regulation. This may reflect the strength of situational rather than cultural effects on instrumental anger regulation, as discussed in the results related to Hypothesis 2.
Apart from the findings mentioned above, although not hypothesized, we found consistent significant positive relationships between interdependent self-construal and the anger utility rating in the aggressive game condition among only Japanese in multiple regression analyses (β = .16 in Study 1 and β = .15 in Study 2). Although difficult to interpret definitively, these results may reflect the high context sensitivity discussed by Cross et al. (2011) as a characteristic of those with high interdependent self-construal. That is, only in Japan, where the cultural affordance of anger is relatively low, individuals with a high interdependent self-construal may be sensitive to the utility of anger in contexts where it is useful. Nevertheless, given that the effect sizes were small and there were no significant relationships between cultural self-construal and preference for anger in the confrontational context, further research is needed to test the robustness of these results.
Theoretical Implications
The existing theory views instrumental motives, which increase negative emotions when they help individuals achieve a desired outcome, as a key class of motives in emotion regulation (Gross, 2015; Tamir, 2016). Nevertheless, most research on the instrumental regulation of negative emotions has been conducted in Western countries. Given that emotional norms and motivations to feel a specific emotion, including anger, can vary across independent and interdependent cultures (Kitayama et al., 2006), it is theoretically important to clarify the extent to which the findings on instrumental anger regulation can be generalized to East Asians, such as Japanese. Our research fills this gap by providing novel findings on the generality of instrumental anger regulation between European Americans and Japanese in the case of both intrinsic and extrinsic emotion regulation.
Our research also contributes to the research field of culture and emotion. Traditionally, this research area has focused on both cultural similarities and differences in various aspects of emotions (Matsumoto & Wilson, 2022). Among them, Matsumoto and Hwang (2012) proposed that domains that were more closely associated with immediate responses that occur in reaction to an event stimulus (e.g., expression, physiology) would be more similar across cultures, whereas domains that were more closely associated with language and higher-order cognition (e.g., self-reports, attitudes, values, beliefs about emotion) would be more culturally variable. Emotion regulation is one of the major topics in the area of culture and emotion (Ford & Mauss, 2015; Matsumoto & Wilson, 2022; Mesquita et al., 2014). Given that this domain would be more culturally variable based on Matsumoto and Hwang (2012), it is important to clarify the boundaries between what is cross-culturally similar and what is different. The current findings contribute to the theoretical advancement of this line of research.
This research also matches a recent trend calling for robust research findings to enhance the credibility of psychological science and contribute to theoretical development (e.g., Milfont & Klein, 2018; Nosek et al., 2022). To evaluate the credibility of research findings, LeBel et al. (2018) proposed the following four dimensions: “(a) transparency of the methods and data, (b) reproducibility of the results when the same data-processing and analytic decisions are reapplied, (c) robustness of the results to different data-processing and analytic decisions, and (d) replicability of the effect” (p. 389). 12 Our research has attempted to satisfy these four elements as much as possible. We believe that the accumulation of such research findings will strengthen the robustness of emotion regulation theory.
Constraints on Generality
We discuss the limitations and future directions of this research here as constraints on generality (Simons et al., 2017). First, it remains unclear whether the current findings on instrumental anger regulation can be generalized to other populations. We focused on European Americans and Japanese because most previous studies on cultural variations in emotion, independence, and interdependence have traditionally compared European Americans and East Asians, such as Japanese (e.g., Akutsu et al., 2016; Kitayama et al., 2006; Ma et al., 2018; Nozaki, 2018). However, given that emerging research in cultural psychology has extended to other cultural zones, such as Arabia, Latin America, and South Asia (see Kitayama et al., 2022 for a review), future research needs to investigate whether the findings of instrumental anger regulation can be generalized to individuals from these zones.
Second, it remains unclear whether the current findings can be generalized to other confrontational contexts. We focused on the context of playing an aggressive computer game because previous research on instrumental anger regulation has frequently used this context (e.g., Netzer, Van Kleef, et al., 2015; Niven et al., 2019; Tamir et al., 2008). However, instrumental anger regulation can also occur in other confrontational contexts, such as negotiations 13 (Tamir & Ford, 2012) or playing competitive sports (Lane et al., 2011). Moreover, instrumental motives in negative emotion regulation can be investigated in the context of daily life rather than in an experimental setup (Kalokerinos et al., 2017). Future research could use these contexts to investigate the generality of instrumental anger regulation.
Third, we did not examine how cultural variables other than cultural self-construals would be related to instrumental anger regulation. We focused on independent and interdependent self-construals because the need for cross-cultural comparisons of instrumental anger regulation was discussed on the basis of these dimensions. However, previous studies on desired emotions and emotion regulation have examined associations with other cultural variables, such as Hofstede’s cultural dimensions (Hofstede, 1980) and Schwartz’s cultural values (Schwartz, 1992) in addition to cultural self-construals (e.g., Matsumoto et al., 2008; Tamir et al., 2016). Future research could use them as correlates of instrumental anger regulation.
Conclusion
The findings presented in this article provide novel evidence for the cross-cultural similarities of instrumental anger regulation in both intrinsic and extrinsic emotion regulation between European Americans and Japanese. Given that existing emotion regulation theory regards instrumental motives, which increase negative emotions when they help individuals achieve a desired outcome, as a key class of motives in emotion regulation, it is important to clarify the robustness of this theory. The current research contributes to strengthening the emotion regulation theory regarding instrumental motives in anger regulation.
Supplemental Material
sj-pdf-1-jcc-10.1177_00220221231212176 – Supplemental material for Instrumental Motives in Emotion Regulation of One’s Own and Others’ Anger: Testing Cross-Cultural Similarities and Differences Between European Americans and Japanese
Supplemental material, sj-pdf-1-jcc-10.1177_00220221231212176 for Instrumental Motives in Emotion Regulation of One’s Own and Others’ Anger: Testing Cross-Cultural Similarities and Differences Between European Americans and Japanese by Yuki Nozaki and Ryota Kobayashi in Journal of Cross-Cultural Psychology
Footnotes
Authors’ Note
A portion of these findings was presented as a poster at the 2023 Society for Affective Science annual conference, Long Beach, CA, United States and an oral presentation at the 31st Japan Society for Research on Emotions annual conference, Ehime, Japan.
Declaration of Conflicting Interests
The authors declared no potential conflicts of interest with respect to the research, authorship, and/or publication of this article.
Funding
The authors disclosed receipt of the following financial support for the research, authorship, and/or publication of this article: This work was supported by JSPS KAKENHI Grant Number JP22K13807 and TATENO JUNZO Grants.
Supplemental Material
Supplemental material for this article is available online.
Notes
References
Supplementary Material
Please find the following supplemental material available below.
For Open Access articles published under a Creative Commons License, all supplemental material carries the same license as the article it is associated with.
For non-Open Access articles published, all supplemental material carries a non-exclusive license, and permission requests for re-use of supplemental material or any part of supplemental material shall be sent directly to the copyright owner as specified in the copyright notice associated with the article.