
Abstract
We examined the global competence of 15-year-old students based on PISA 2018 data (N = 355,579 from 57 countries). Our multilevel latent profile analysis identified two groups at both individual and country levels, resulting in a total of four groups (2 x 2; “competent” and “less competent”). While individual-level differences were pronounced and consistent across all seven global competence indicators, the country-level differences were small overall, with only “attitude towards immigrants” and “respect for people from other cultures” showing somewhat salient group differences. There were more globally “less competent” students in 52 of 57 countries, suggesting the needs to improve students’ global competence in virtually all participating countries. Global competence was related to family socioeconomic status, academic achievement, and countries’ standing on the conservatism/liberalism dimension. We considered different ways to enhance global competence among students and society as a whole.
Globalization has expanded steadily since the end of the Cold War. Although economic collaboration and international trade were the main drivers in the initial stages of globalization, it has also led to a substantial increase in social interactions and communication among people from diverse cultural backgrounds (Hill, 2014). Consequently, there has been a growing recognition of the need to improve understanding of the process, outcomes, and possible forms of globalization (cf. Boix Mansilla & Gardner, 2007; S. X. Chen et al., 2016).
Research on globalization is not new (cf. Albrow & King, 1990). However, conceptual/theoretical work on globalization in relation to student populations is relatively new. In the limited research on student populations, global competence has emerged as an important construct in recent years (Bilgili, 2019; Boix Mansilla, 2016; Reimers, 2009; Sälzer & Roczen, 2018). International organizations such as the United Nations (UN) and the Organization for Economic Co-operation and Development (OECD) have identified the promotion of a global mindset as a matter of urgency to tackle global issues and enhance collective well-being (Jang et al., 2023; OECD, 2018; Reimers, 2009; Sälzer & Roczen, 2018; Tamerat, 2020; UNESCO, 2015). Accordingly, a large-scale international project on global competence was implemented within the OECD’s Programme for International Student Assessment (PISA) in the 2018 cycle. To the best of our knowledge, this is the largest international project on this topic to date. Within its framework, global competence is defined as a multidimensional capacity that encompasses the ability to “examine local, global and intercultural issues, understand and appreciate different perspectives and world views, interact successfully and respectfully with others, and take responsible action toward sustainability and collective well-being” (OECD, 2018, p. 4).
Although PISA’s global competence construct was developed through collaboration among multiple researchers who drew on their previous studies to inform its development (e.g., Bennett, 1993; Boix Mansilla, 2016; Boix Mansilla & Gardner, 2007; Deardorff, 2006; Reimers, 2017; cf. OECD, 2018), a range of different labels has appeared in the cross-cultural research to represent similar and closely related concepts. These include intercultural effectiveness (Hammer et al., 1978), intercultural communication (G.-M. Chen & Starosta, 1996), intercultural sensitivity (Bennett, 1993), intercultural interest (Klinge et al., 2009), intercultural capability (Ang & Inkpen, 2008), global consciousness (Boix Mansilla & Gardner, 2007), global citizenship (Reimers, 2017), intercultural competence (Deardorff, 2006), and cross-cultural competence (Chiu et al., 2013).
Among the constructs listed above, intercultural competence and cross-cultural competence are the closest to the main construct of the present study. Researchers (cf. Chiu & Shi, 2019; Deardorff, 2006), however, noted that while different descriptors for the definitions are available, there seems to be little conceptual difference, at least at the broad definitional level, across these concepts. For example, in Hammer (2013), intercultural competence is defined as “the capability to shift cultural perspective and appropriately adapt behavior to cultural difference and commonalities” (p. 26). In Deardorff (2006), cross-cultural competence is defined as the “ability to communicate effectively and appropriately in intercultural situations based on one’s intercultural knowledge, skills and attitudes” (pp. 247–248). Similarly, after synthesizing various conceptualizations of global competence, Tamerat (2020) offers its definition as “(1) substantive knowledge building around global topics; (2) the cultivation of particular dispositions; (3) skill/proficiency development; and (4) orientation toward individual and collaborative action” (p. 2).
However, there appears to be a couple of unique points in recent conceptualizations of global competence. As aptly noted by Hunter et al. (2006), it entails “the inevitable link between thought and deed and implied that in today’s driven society, learning must result in productivity and capability” (p. 277). The PISA’s concept of global competence also stresses the need for collective action among individuals from various parts of the world to work together to tackle local, global, and intercultural challenges (OECD, 2018). Another distinctive characteristic of PISA’s concept of global competence is the incorporation of values as a fourth broad dimension, in addition to knowledge, attitudes, and skills. Values not only retain individuals’ own cultural identity, but they also influence attitudes toward the cultural values and beliefs of others from diverse cultural backgrounds (OECD, 2018; Stankov & Lee, 2008). Thus, it is believed that globally competent individuals possess “a combination of knowledge, skills, attitudes and values successfully applied to face-to-face, virtual or mediated encounters with people who are perceived to be from a different cultural background” (OECD, 2018, p. 7).
Finally and perhaps most notably, the PISA’s concept of global competence is centered on student populations worldwide, while calling for schools to assume a primary responsibility in fostering a global mindset among young people. There are several assumptions in studies of global competence among the student populations. First, it is assumed that a global mindset should be developed as an essential life skill, like numeracy and literacy (OECD, 2018). Second, it is expected that there will be individual differences in global competence among students, with some students being more proficient than others. Third, it is proposed that individual or group differences in global competence can be reliably measured using appropriate assessment tools (Reimers, 2009), thereby making it possible to identify areas of strength and weakness in each student/group.
There are practical reasons why studying globalization with student populations is important and relevant today. First, young people are more globally connected than ever before due to easier access to goods and services from overseas, the widespread use of social media, and greater opportunities for international education and travel (e.g., Leander & McKim, 2003). Second, it is believed that young people with a global mindset are likely to become adults who endorse global perspectives and take a collective responsibility to improve the conditions of others irrespective of cultural and geographical differences (Boix Mansilla, 2016; OECD, 2018; UNESCO, 2015). Thus, schools are uniquely positioned to nurture young people’s global competence, enabling them to understand their community and the world, and to develop ways to build a cohesive and harmonious society (cf. Barrett, 2018; Bilgili, 2019; Jang et al., 2023; OECD, 2018; UNESCO, 2015).
Global Competence Indicators in PISA 2018
Although there is consensus on the broad definition of cross-cultural or global competence (cf. Chiu & Shi, 2019; Deardorff, 2006), there is limited agreement about which specific constructs are central to the concept. For instance, over 300 personal attributes and more than 30 multifaceted models of cross-cultural competence were noted by Leung et al. (2014). Therefore, it has been proposed that the conceptual approaches of different researchers to global competence are, in fact, distinguished by the selection of specific indicators deemed central and the types of outcomes linked to indicate an individual’s proficiency (cf. Chiu & Shi, 2019).
The present study examines global competence through the conceptual framework of PISA 2018, which assessed it using both a knowledge test and a questionnaire. The focus of the present study is on students’ perceptions, and as such, questionnaire data were utilized rather than the test data. Within the PISA 2018 framework, the following seven indicators were identified as being relevant to global competence of student populations around the world:
Self-efficacy in explaining global issues (hereinafter referred to as “self-efficacy”). Self-efficacy, in general, refers to people’s confidence in their ability to achieve desired results through their actions (Bandura et al., 2001). It is assumed that students who feel confident in explaining global issues are more likely to be globally competent.
Awareness of global issues (hereinafter, “awareness”). Globally competent students are expected to be familiar with current or emerging global issues such as climate change, global health, and international conflicts (Boix Mansilla & Scheicher, 2020).
Attitudes toward immigrants (hereinafter, “immigration”). Many countries have witnessed a sharp rise in the number of immigrants (OECD, 2020). If native populations adopt exclusionary attitudes toward immigrants, the integration of the latter will be severely compromised (Janmaat, 2014).
Interest in other cultures (hereinafter, “interest”). There are individual differences in willingness to engage with cultures, beliefs, and worldviews other than one’s own (Clark & Seider, 2017). These reflect differences in factors such as curiosity, readiness to learn about new cultures, and sensitivity toward people from different backgrounds.
Respect for people from other cultures (hereinafter, “respect”). This refers to a viewpoint in which people with different cultural affiliations are evaluated as worthy of positive regard and esteem (Leask, 2009). In other words, all human beings are seen to possess the same intrinsic dignity even if one does not agree with their beliefs or lifestyle.
Intercultural communication (hereinafter, “communication”). This refers to communication between people from different cultural backgrounds. While multilingualism can enhance effective communication in multicultural contexts, it is also important to understand how cultural differences affect people’s communication in a language that is not their mother tongue (Svalberg, 2012).
Global mindedness (hereinafter, “global mindset”). This is defined as a worldview in which one sees oneself as connected to the global community and feels a sense of responsibility for its members. A person with such an outlook would be concerned for those in other parts of the world and feel a sense of moral responsibility to tackle global challenges (Boix Mansilla, 2016; OECD, 2020).
Testing Hypotheses About Global Competence Based on the Inside-Outside Cascade Model
We utilized the “inside-outside cascade model” proposed by Stankov et al. (2014; Stankov & Lee, 2016b) to formulate hypotheses to explain individual and group differences in the global competence indicators mentioned above. This model was initially developed to theorize why certain (psychological, cognitive, and behavioral) constructs show salient cross-national/cross-cultural differences. The model postulates that people’s dispositions that are genetically influenced (Vukasović & Bratko, 2015) tend to originate mostly from within oneself (“inside”) and can be developed “privately” without significant intervention or influences of external factors. Examples include personality traits and cognitive abilities. These constructs tend to demonstrate relatively small group differences across countries/cultures (Stankov et al., 2014; Stankov & Lee, 2016b). On the other hand, certain human characteristics belong to the “outside” domain. Examples include values, social norms, and social attitudes (Stankov et al., 2014). These dispositions arise through social interactions with others and require subjective assessment of one’s surroundings and social environment, and they tend to exhibit more substantial cross-cultural differences.
In the framework of “the inside-outside cascade model,” global competence variables of the present study can be classified into three groups. The first group includes self-efficacy, awareness, and interest, which belong to the “inside” domain and thus can be expected to show small cross-national differences. The second group consists of communication and global mindset. These dispositions tend to be influenced by both personal characteristics and social experiences and therefore may show a medium-sized effect of cross-cultural differences. The third group comprises immigration and respect. These two constructs are about attitudes toward “others” and thus, belong to the “outside” domain. People’s perceptions of “others” tend to be influenced by country-specific characteristics such as social norms (i.e., how members of “outgroup” populations are treated within the society), social attitudes (i.e., what type of behavior is acceptable or promoted), and societal stereotypes (i.e., how “outgroup” members are perceived to behave). Society’s geographical, historical, and demographic features, as well as its social and political orientations, also tend to shape people’s attitudes toward “others” with different cultural backgrounds (e.g., Bennett, 1993; OECD, 2020; Stankov et al., 2014; UNESCO, 2015). Therefore, these two “outside” constructs—attitudes toward immigrants and respect for people from other culture—are likely to show profound cross-national/cross-cultural differences.
Students’ Global Competence and Country-Level Conservatism/Liberalism
The present study also explores the link between global competence of the student population and the country’s overall conservatism/liberalism scores. The importance of this link lies in the premise that globally competent young people may become adults who take personal responsibilities to take actions toward the improvement of intercultural and global issues (Boix Mansilla & Gardner, 2007; OECD, 2018; Reimers, 2009; UNESCO, 2015). If a sufficiently high correlation is found—that is, if it turns out that countries identified as having a higher number of teenagers with globally competent outlooks are likely to have adult populations with more liberal social outlooks—it could provide initial evidence in support of the claim that globally competent teenagers may grow up to have liberal outlooks. Furthermore, establishing this link might lead to the inclusion of global competence within the broader theoretical framework of conservatism/liberalism.
Following Hofstede (2001) and others (e.g., House et al., 2004; Saucier & Goldberg, 2002; Schwartz, 2012), cross-cultural psychologists have used large-scale surveys to identify the main dimensions of cross-cultural/cross-national differences. For instance, in Stankov et al. (2014), 43 scales with a total of 316 items (which was reduced to 22 scales) across the broad domains of personality traits (e.g., extraversion, cf. Saucier & Goldberg, 2002), social attitudes (e.g., toughness, cf. Stankov & Knezevic, 2005), values (e.g., self-indulgence, cf. Schwartz, 2012), social axioms (e.g., neoliberalism, cf. Bou Malham & Saucier, 2014), and social norms (e.g., power distance, cf. House et al., 2004) were put together to arrive at the main dimensions of cross-cultural differences. A single factor was defined at the country-level across 17 variables, which was interpreted as the conservatism-liberalism dimension (Stankov & Lee, 2016a). Stankov and Lee (2016b) employed the country-level factor scores from the Stankov and Lee (2016a) to conduct the latent profile analysis (LPA) and concluded that the countries could be effectively classified into three distinct groups: conservative, in-between, and liberal.
Empirical studies (e.g., Stankov, 2017; Stankov & Lee, 2016b; Stankov et al., 2014) suggest a close conceptual similarity between the constructs of global competence and conservatism/liberalism. Individuals with developed global competence are more likely to be open-minded toward others from different cultural backgrounds, which is also considered to be a critical aspect of liberalism (Taylor, 2017). Both open-mindedness and liberal attitudes have been reported to lead to a greater level of respect for other cultures and better awareness of global social and environmental issues—attributes that are also embedded in the concept of global competence (e.g., S. X. Chen et al., 2016). Thus, our expectation was that a country with a higher average global competence score will also have a higher liberalism score.
Family Socioeconomic Status and Academic Achievement as Covariates of Global Competence
The present study included two additional variables—family socioeconomic status (SES) and academic achievement—as potential covariates of students’ global competence. These two variables are, arguably, the most extensively employed background variables in studies involving student populations (Lee et al., 2019). Moreover, Lee and Borgonovi (2022) found that the influence of family socioeconomic status on students’ academic achievement vary depending on the economic development status of the country, suggesting the importance of considering the country-specific context in studies of student outcomes.
There is some empirical evidence that suggests potential positive associations between students’ achievement and their global competence. For example, the OECD (2020) report indicates that students who exhibit higher global competence also tend to have higher academic achievement in the PISA 2018. Specifically, the correlations between reading, mathematics, and science among 15-year-old students ranged from r = .78 to r = .85. The correlations were similar, ranging from r = .73 to r = .84, between each of these three achievement domains and the global competency cognitive test (not the questionnaire-based data). These high correlations suggest that students’ academic achievement could have played a role in their acquisition of knowledge and possibly, their attitudes toward learning about global issues. Students’ reading achievement, in particular, was positively related to their global and intercultural attitudes (OECD, 2020) and their out-group attitudes such as tolerance, perspective taking, and empathy toward immigrants and refugees (Vezzali et al., 2015).
It is also possible to find a link between family SES and at least some elements of the global competence indicators of this study. For example, students in the top quarter of the PISA index of family SES showed greater self-efficacy regarding global issues than students within the bottom quarter of that index (OECD, 2020). There is also theoretical work highlighting the importance of family backgrounds in student development of global competence (cf. Tamerat, 2020). It is believed that students’ body of knowledge is influenced by the family’s labor history, social networks, and knowledge and skills collectively accumulated for survival (Moll et al., 1992). Consequently, students’ global competence is likely to be developed within varied family histories and circumstances, including international travel experience, exposure to varied cultural practices, and knowledge of intercultural events. This clearly indicates the potential influence of family backgrounds on student development of global competence. Given the suggestions from both theoretical and empirical studies, we expected positive correlations between the measures of students’ global competence and their family SES.
The Present Study
The present study has three aims:
To identify a typological representation that depicts individual- and country-level differences in global competence among 15-year-old students from around the world. Furthermore, we sought to examine which global competence indicators show noteworthy individual- and country-level differences.
To examine the extent to which two covariates (students’ family SES and academic achievement) are associated with global competence.
To explore the relationship between a country’s standing on conservatism/liberalism based on the adult population, and global competence measured within the student population in PISA 2018.
Methods
Participants
The data for students’ global competence, family SES, and academic achievement were extracted from the international database collected via the PISA 2018 student questionnaire. In PISA 2018, there were N = 612,004 participants representing about 32 million 15-year-old students from 79 countries. The participating students had about 2 hours to complete academic assessment tests of reading, mathematics, and science. They had an additional 30 minutes to complete a questionnaire on their attitudes, dispositions, school experiences, and beliefs. Global competence was a special theme in the 2018 cycle. After excluding countries which did not participate in the global competence module and individuals who had missing data, the final sample size for the present study was N = 355,579 students (50.9% females) from 57 countries. The classification of these countries into conservative, in-between, and liberal was based on the information presented in Table 1 in Stankov and Lee (2016b).
Scale Scores Means and Standard Deviations (Student Weight Applied), Correlations Between the Measures at Individual (Lower Triangle; N = 355,579) and Country (Upper Triangle; N = 57) Levels, and Standardized Factor Loadings at Individual- and Country-Level Multilevel Exploratory Factor Analysis.
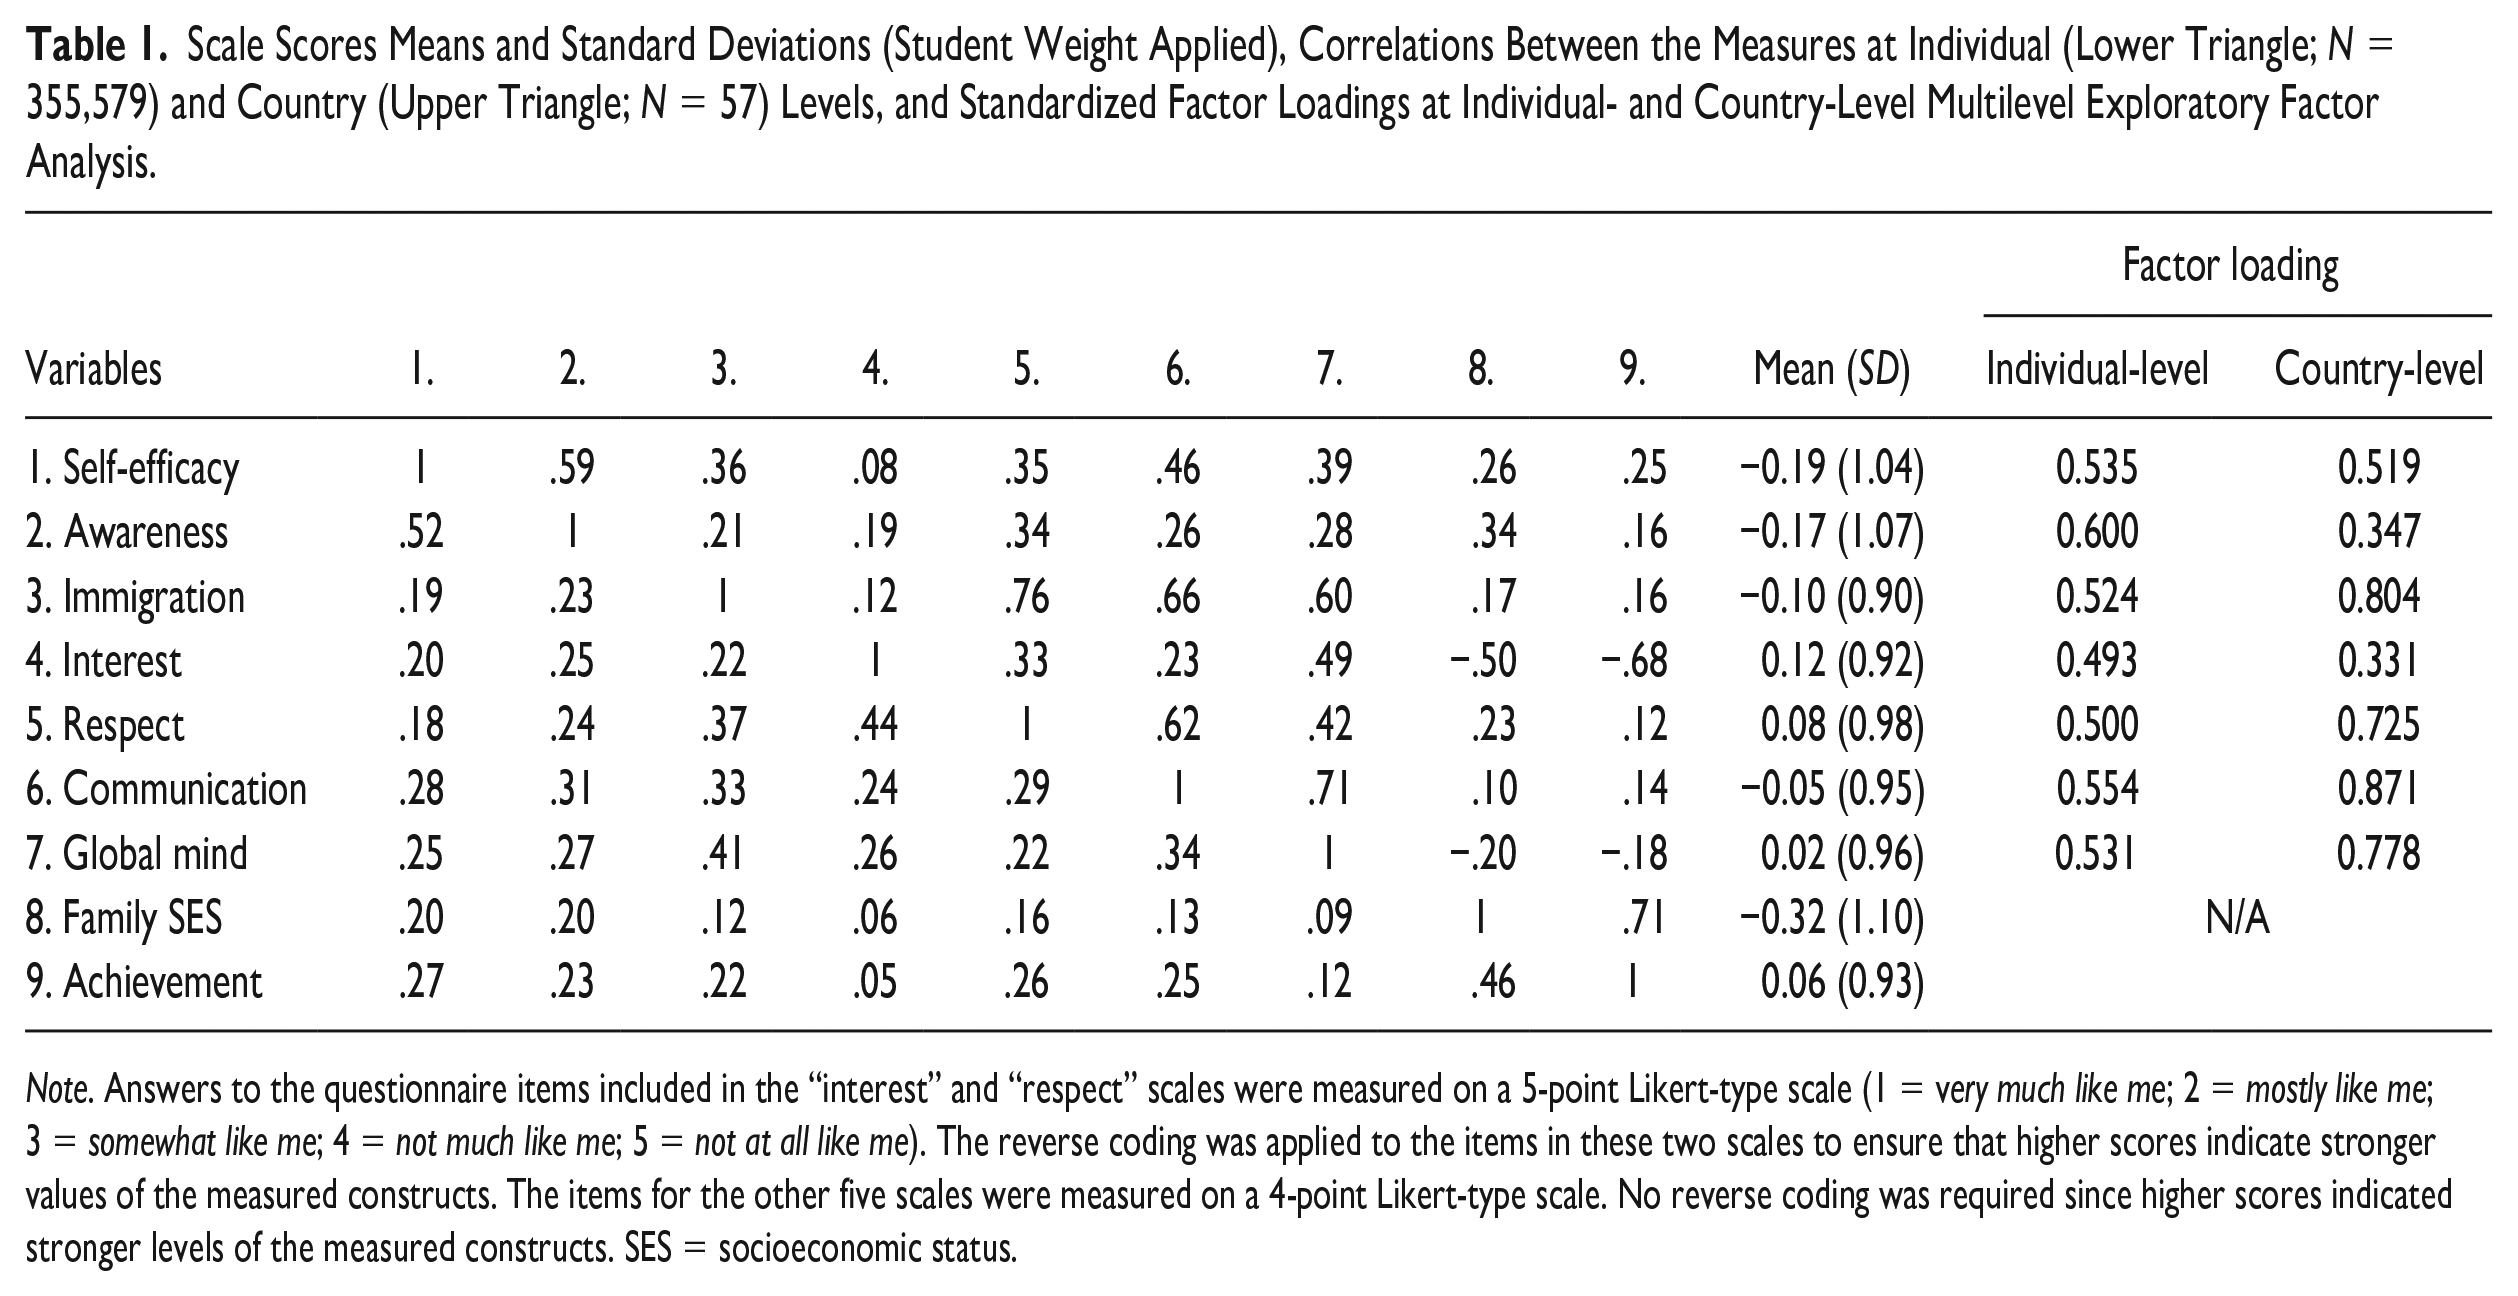
Note. Answers to the questionnaire items included in the “interest” and “respect” scales were measured on a 5-point Likert-type scale (1 = very much like me; 2 = mostly like me; 3 = somewhat like me; 4 = not much like me; 5 = not at all like me). The reverse coding was applied to the items in these two scales to ensure that higher scores indicate stronger values of the measured constructs. The items for the other five scales were measured on a 4-point Likert-type scale. No reverse coding was required since higher scores indicated stronger levels of the measured constructs. SES = socioeconomic status.
Measures
Global Competence Scales
Students’ global competence was measured with seven scales corresponding to the global competence indicators described in the introduction. The scales were developed during the field trial and their psychometric properties including structural invariance and scale reliability were judged to be satisfactory for use in cross-national comparisons (see OECD, 2019, for detailed results of the field trial’s item and scale analyses). Specifically, international item and person parameters were obtained from the generalized partial credit model (GPCM; Muraki, 1992) in a single analysis based on data from the participant countries. This was followed by the invariance tests of item parameters across the countries. Weighted likelihood estimates (WLE; Warm, 1989) were used as individual student scores on the given scale, which were then transformed to have a mean of 0 and a standard deviation of 1 across the weighted OECD countries (see Chapter 16 in OECD, 2019, for a detailed description of the scale construction). We used students’ scale scores from the publicly available PISA 2018 data sets. The scale items and reliability indices are presented in Appendix.
Economic, Social, and Cultural Status
Students’ family socioeconomic status (SES) was measured by the PISA index referred to as Economic, Social, and Cultural Status (ESCS). This is a composite scale consisting of the three major components of family SES, namely, highest parental occupation, parental education (in years), and household possessions, including books. The ESCS scale was transformed to have a mean of 0 and a standard deviation of 1 across the weighted OECD countries (see Chapter 16 in OECD, 2019, for a detailed description of the ESCS scale construction).
Academic Achievement
Students’ academic achievement scores in PISA were generated using the plausible value methodology. This is based on the item response theory (IRT) scaling from multiple domains followed by latent regression and multiple imputations. In PISA 2018, students were given 10 plausible values for each of the reading, mathematics, and science domains. Then, the scores were converted into a scale with a weighted mean of 500 and a weighted standard deviation of 100 across the OECD countries (see Chapter 9 in OECD, 2019, for a detailed description). For the present study, we created individuals’ overall academic achievement scores by averaging all 30 plausible values from reading, mathematics, and science. These were then standardized to have a mean of 0 and a standard deviation of 1.
Conservatism/Liberalism Dimension
The country-level information about the conservatism-liberalism dimension was drawn from Stankov and Lee’s (2016b) LPA results, which suggest three groups of countries—conservative, in-between, and liberal. This country-level grouping information (i.e., three categories) is used in the present study. The conceptual foundation of this work was established in a series of studies (e.g., Stankov et al., 2014; Stankov & Lee, 2016a, 2016b), as presented in the previous section. In summary, Stankov and Lee (2016a) employed 20 measures of personality, social attitudes, values, social axioms, and social norms to arrive at the main dimensions of cross-cultural differences. At the country level of analysis, a single factor was derived and interpreted as the conservatism-liberalism dimension.
Detailed descriptions of each of the scales that defined the conservatism-liberalism dimension can be found in Stankov et al. (2014).
Statistical Analyses
In preliminary analyses, descriptive statistics and correlations among the study variables were calculated. We also ran a multilevel exploratory factor analysis (MEFA) that accounts for variances and covariances at both individual and country levels to examine whether each of the seven global competence scales can be considered an indicator of one general factor of global competence (general-global; “g-g”). The maximum likelihood estimation with robust standard errors (MLR) was employed.
Latent profile analysis was the main statistical analytic technique used in this study. In general, LPA seeks to identify homogeneous groups under the assumption that the overall multivariate normal distribution is composed of a given number of the underlying distributions. It is a person-centered typological approach rather than the more commonly employed variable-centered structural (e.g., factor analytic) approach. LPA modeling produces a set of profile patterns for each group, which consists of the estimated mean values on the variables included in the model. In all LPA modeling, the maximum likelihood estimation with robust standard errors (MLR) was used, with individuals as the Level 1 cluster variable and the country as the Level 2 cluster variable. The proper sampling weights (i.e., “student weights” that are available in the public data files) were used in all LPA analyses (see Chapter 9 in OECD, 2019, for the weight calculation).
We performed LPA in three ways: single-level LPA (SLPA) separately at the individual level and the country level, and multilevel latent profile analysis (MLPA). The focus of MLPA is to identify the number of groups/classes at the individual and country levels simultaneously. MLPA involves creating group profiles based on individual-level data, initially without considering the individual’s country of origin. In this first step, the means of each profile group are calculated at the individual level, which are then used to create country-level profiles that vary across countries while maintaining the country as the unit of analysis. Thus, MLPA integrates information from both individual and country levels by using the individual-level profile outcomes to generate country-level profiles. In MLPA, individuals are assigned to both an individual-level profile group and a country-level profile group. This enables inferences to be made about individuals’ global competence (Level 1) within the context of the country’s profile patterns (Level 2). Please note that there are multiple ways in which solutions at the individual and country levels may differ—for example, in terms of the number of groups or with respect to the levels and shapes of their mean profiles. Analyzing individual- and country-level information simultaneously within the multilevel structure is an important means of guarding against ecological fallacy (Durkheim, 1951; also see Loney & Nagelkerke, 2014), whereby inferences about individuals can be (potentially wrongly) deduced from inferences about the country to which those individuals belong.
Both SLPA and MLPA procedures are exploratory rather than confirmatory, and various issues need to be taken into account in choosing the optimal model. Statistical information (goodness-of-fit indices) is typically employed (see Muthen & Muthen, 2015). These include Akaike information criterion (AIC), Bayesian information criterion (BIC), and sample-size adjusted BIC (A_BIC), along with a statistical model improvement test such as Lo-Mendell-Rubin Likelihood ratio test. A smaller value of AIC, BIC, and A_BIC suggests that the model shows a better fit. The likelihood ratio test is conducted in pairs between two nested models of k-class and (k-1) class solutions. A significant p value suggests that the k-class model is a significant improvement compared with the (k-1)-class model, and, thus, the k-1 profile model should be rejected in favor of the k-profile model (cf. Wang & Wang, 2020). Entropy (Celeux & Soromenho, 1996) is also employed as the summary index of the accuracy of the class membership prediction. With a range from 0 to 1, an entropy value greater than 0.80 is considered good while a value less than 0.60 is viewed as a poor classification result (Asparouhov & Muthén, 2014). The size of the groups/classes must also be considered. A latent profile group with a small number of individuals (typically, less than 10%) is hard to justify as a useful/meaningful group. Finally, substantive interpretation of the results is critical when deciding on a final LPA model, since model fit tends to improve with a greater number of free parameters (i.e., classes/groups) in the model (cf. Wang & Wang, 2020).
For comparisons between the group means, we report the effect size of “practical” significance (Kline, 2004), in preference over a conventional p < .05 statistical significance level, to indicate substantively noteworthy group differences. This is because even a small and negligible mean difference is likely to show statistical significance at the p < .05 level in large-scale data sets like PISA. According to Cohen’s (1977) guidelines, an effect size smaller than .20 is considered not to be noteworthy. This translates to a .20 size of group difference in this study since the scale standard deviation is 1. Therefore, we use .20 as a minimum cutoff point for the effect size of group difference that is practically noteworthy. Following this logic and Cohen’s guidelines, a mean difference of about .50 is considered a medium effect size, and about or greater than .80 is a large effect size. Previous studies of cross-cultural differences (e.g., Stankov & Lee, 2016b) have also used an effect size of .20 as a cutoff point to indicate substantively meaningful cross-cultural differences (see Sun et al., 2010, for a comprehensive review of effect sizes).
To examine the role of covariates, the latent profile group membership (as the unordered categorical dependent variable) was regressed on family SES and academic achievement performance (both continuous variables) via multinomial logistic regression. We used Spearman’s rho (a non-parametric, rank-order correlation coefficient) to link the country-level LPA membership on global competence to the country-grouping information based on the conservatism/liberalism dimension.
Results
Preliminary Analyses: Descriptive Statistics and Multilevel Exploratory Factor Analysis
Table 1 presents descriptive statistics (means and standard deviations) and Pearson bivariate correlations for the study variables at both individual level (lower triangle; N = 355,579) and country level (upper triangle; N = 57). Correlations between self-efficacy and awareness are moderately high at both individual (r = .52) and country (r = .59) levels. However, immigration correlates with respect (r = .76), communication (r = .66), and global mind (r = .60) only at the country level.
Results of multilevel exploratory factor analyses (see the right-hand side of Table 1) show a general factor of global competence (“g-g”) at both individual and country levels. The standardized factor loadings are all greater than .30 at both levels. The first eigenvalue at the individual level was 2.685 and the corresponding value at the country level was 3.544. As expected from the correlation results at the country level, immigration (.804), respect (.725), communication (.871), and global mind (.778) show sizable factor loadings, whereas the other three variables contributed less to the “g-g.” Overall, these preliminary analyses demonstrated that each of the global competence variables employed in this study are indeed indicators of the broad concept of global competence at both individual and country levels.
Latent Profile Analyses: Selecting the Optimal Latent Profile Solution Based on Multilevel Analysis
Table 2 presents goodness-of-fit indices for eight MLPA models we have fitted. The #CB (“Class Between”) refers to the number of groups at the between (country) level whereas the #CW (“Class Within”) refers to the number of groups at the within (individual) level in the multilevel latent profile structure. The fit indices presented in Table 2 are comparable only between the nested models (i.e., between Models 1 and 2, Models 3 to 5, and Models 6 to 8). These comparisons examine the model fits when the number of CW changes while the number of CB is fixed. Similarly, the model fit indices can be examined for comparisons between Models 1, 4, and 7, between Models 2, 5, and 8, and between Models 3 and 6. These comparisons are for cases where the number of CB changes while the number of CW is fixed.
Multilevel Latent Profile Analysis: Model Fit Statistics (N = 355,579).
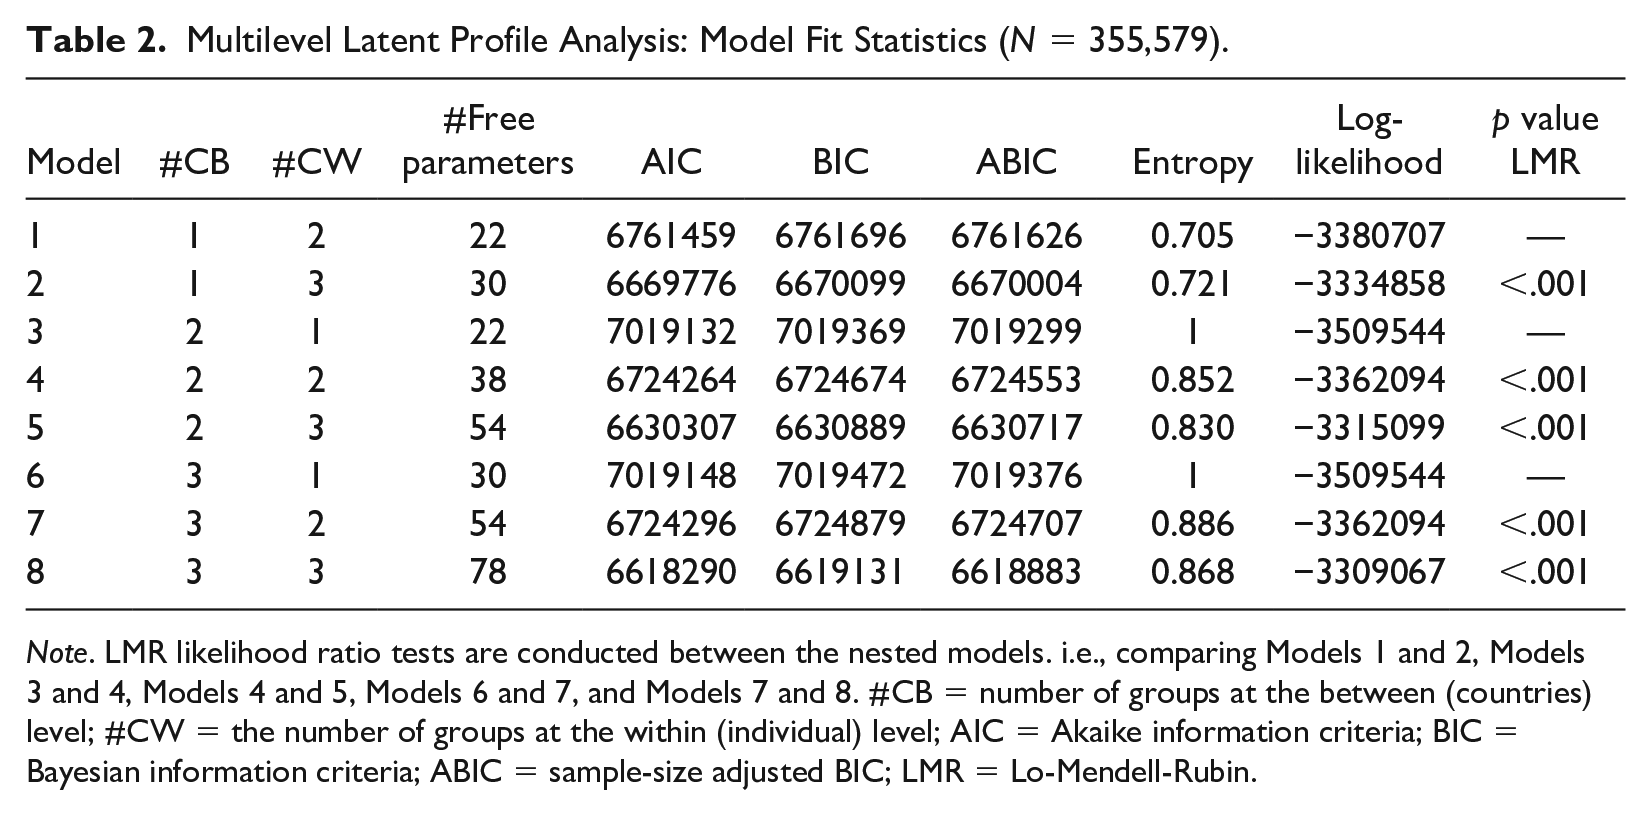
Note. LMR likelihood ratio tests are conducted between the nested models. i.e., comparing Models 1 and 2, Models 3 and 4, Models 4 and 5, Models 6 and 7, and Models 7 and 8. #CB = number of groups at the between (countries) level; #CW = the number of groups at the within (individual) level; AIC = Akaike information criteria; BIC = Bayesian information criteria; ABIC = sample-size adjusted BIC; LMR = Lo-Mendell-Rubin.
As expected, the model fit indices of AIC, BIC, and ABIC were generally better (i.e., lower) when more groups were fitted to the data either at the individual or country level. Models 1 and 2 with the number of CB groupings fixed at 1 are, in fact, technically not multilevel models because the country-level group is fixed at 1 and, thus, they do not utilize the multilevel structure of the data. Models 3, 4, and 5 all have two groups at the country level (CB2), but CW at the individual level varies from one (CW1) to three groups (CW3). Among these three models, model indices are the best for Model 5 (CB2_CW3). However, the size of one of the three groups in Model 5 was small, consisting of less than 8% of the total number of participants. As can be seen in Table 2, we also ran models with CB3 (i.e., three groups at the country-level) in Models 6, 7, and 8. However, the third group at the country-level had zero members and, thus, every model with three groups at the country-level was deemed not to be appropriate. For these reasons, Model 4, with two groups at both CB and CW was selected as the optimal solution. The entropy of Model 4 (.852) was also slightly better than the entropy of Model 5 (.830).
Results Based on the Single-Level Latent Profile Analyses (SLPA)
Understanding the multilevel findings is facilitated by first having a closer look at the single-level results, carried out separately at the individual and country levels. Since we have settled on the two-group solutions at both levels in the multilevel analyses, we report only the two-group solutions in this section. Figure 1 presents the mean profile patterns for the two-group solution at the individual level (Figure 1A) and the country level (Figure 1B). The most notable features of Figure 1A are that (a) the two groups show a pronounced difference, and (b) group differences are fairly consistent across all seven variables of global competence. Thus, since the individual-level groups can be characterized by “higher” (positive) and “lower” (negative) mean scores across the seven global competence variables, we labeled these “competent” and “less competent” groups, respectively. The average global competence scores across all seven variables are 0.57 for the “competent” group and −0.38 for the “less competent” group (see the encircled numbers on the right-hand side of Figure 1A). Thus, the group average difference is 0.95 at the individual level. This size of the difference is considered “large,” according to Cohen’s effect size guidelines.
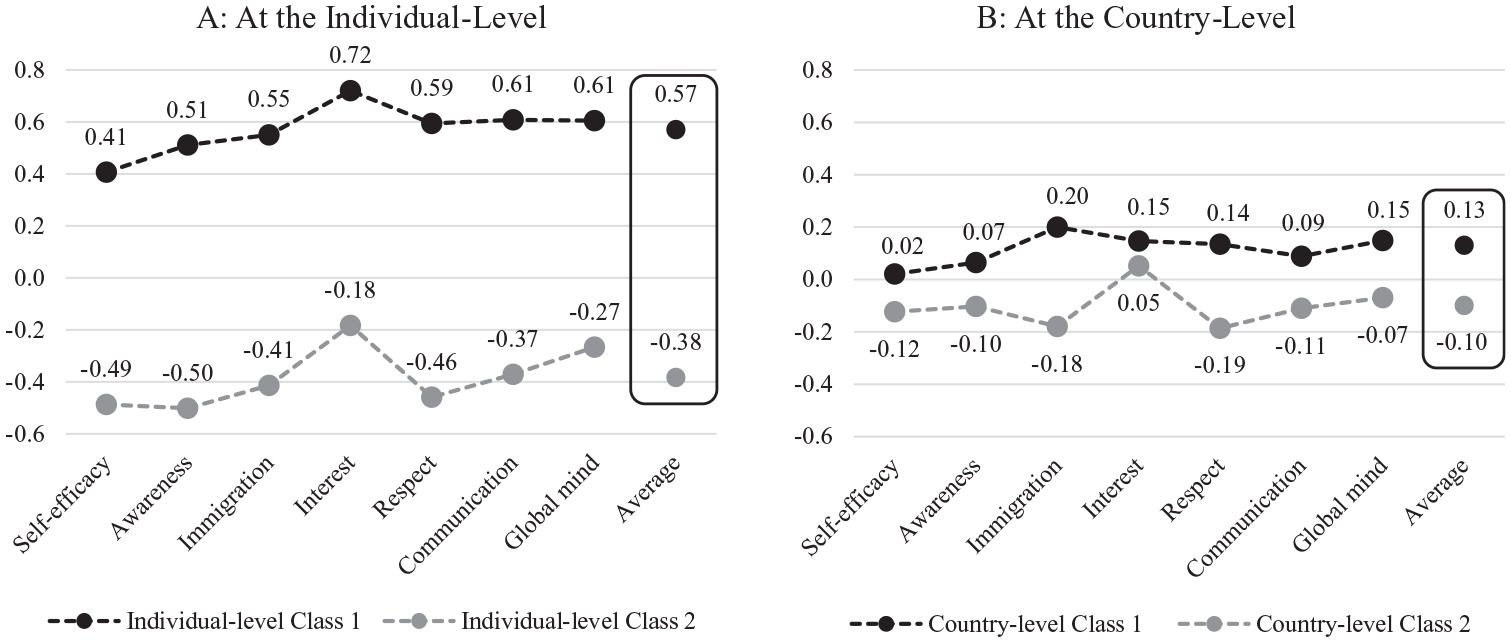
Latent Profile Analysis at the Individual Level (N = 355,579) and the Country Level (N = 57)
In the country-level LPA solution (Figure 1B), the top group is higher than the lower group on all seven global competence variables. Therefore, we also labeled them as “competent” and “less competent” countries. However, compared with the individual-level profile, the group differences at the country level are much smaller across the seven variables. The average score for the “competent” group across all seven variables is 0.13, which can be compared with −0.10 for the “less competent” group, showing an average difference of 0.23. While the size of this difference surpasses our criterion cutoff value of an effect size of 0.20, it is on the borderline of being noteworthy and certainly much smaller than the individual-level two-group difference. Furthermore, the country-level differences are more pronounced on “immigration” and “respect,” compared with all other variables. For these two variables, the differences between the two groups are larger (i.e., .38 and .33, respectively) than the average difference of 0.23. This point is further elaborated in the context of multilevel results (presented in the next sections).
Latent Profile Group Identification From the Multilevel Analysis
The multilevel model assumes that within every country there is a range of individual differences in global competence. Thus, the country-level latent profiles need to take into account the individual-level information because individuals are nested within the country. Figure 2 presents the pattern of the mean profiles of the four multilevel latent groups (i.e., 2 x 2; “competent” and “less competent” groups at both individual and country levels) generated by the MLPA for the chosen Model 4. We have assigned number 1 to the “competent” group and 2 to the “less competent” group, at both individual and country levels. Thus, the group labeled CB1_CW1 (black solid line) in Figure 2 represents globally competent individuals residing in a globally competent country. The group labeled CB2_CW1 (black dotted line) represents globally competent individuals living in a less globally competent country. Similarly, the group labeled CB1_CW2 (gray solid line) represents less globally competent individuals living in a globally competent country, while the group labeled CB2_CW2 (gray dotted line) represents individuals who are classified as less competent and living in a less competent country.
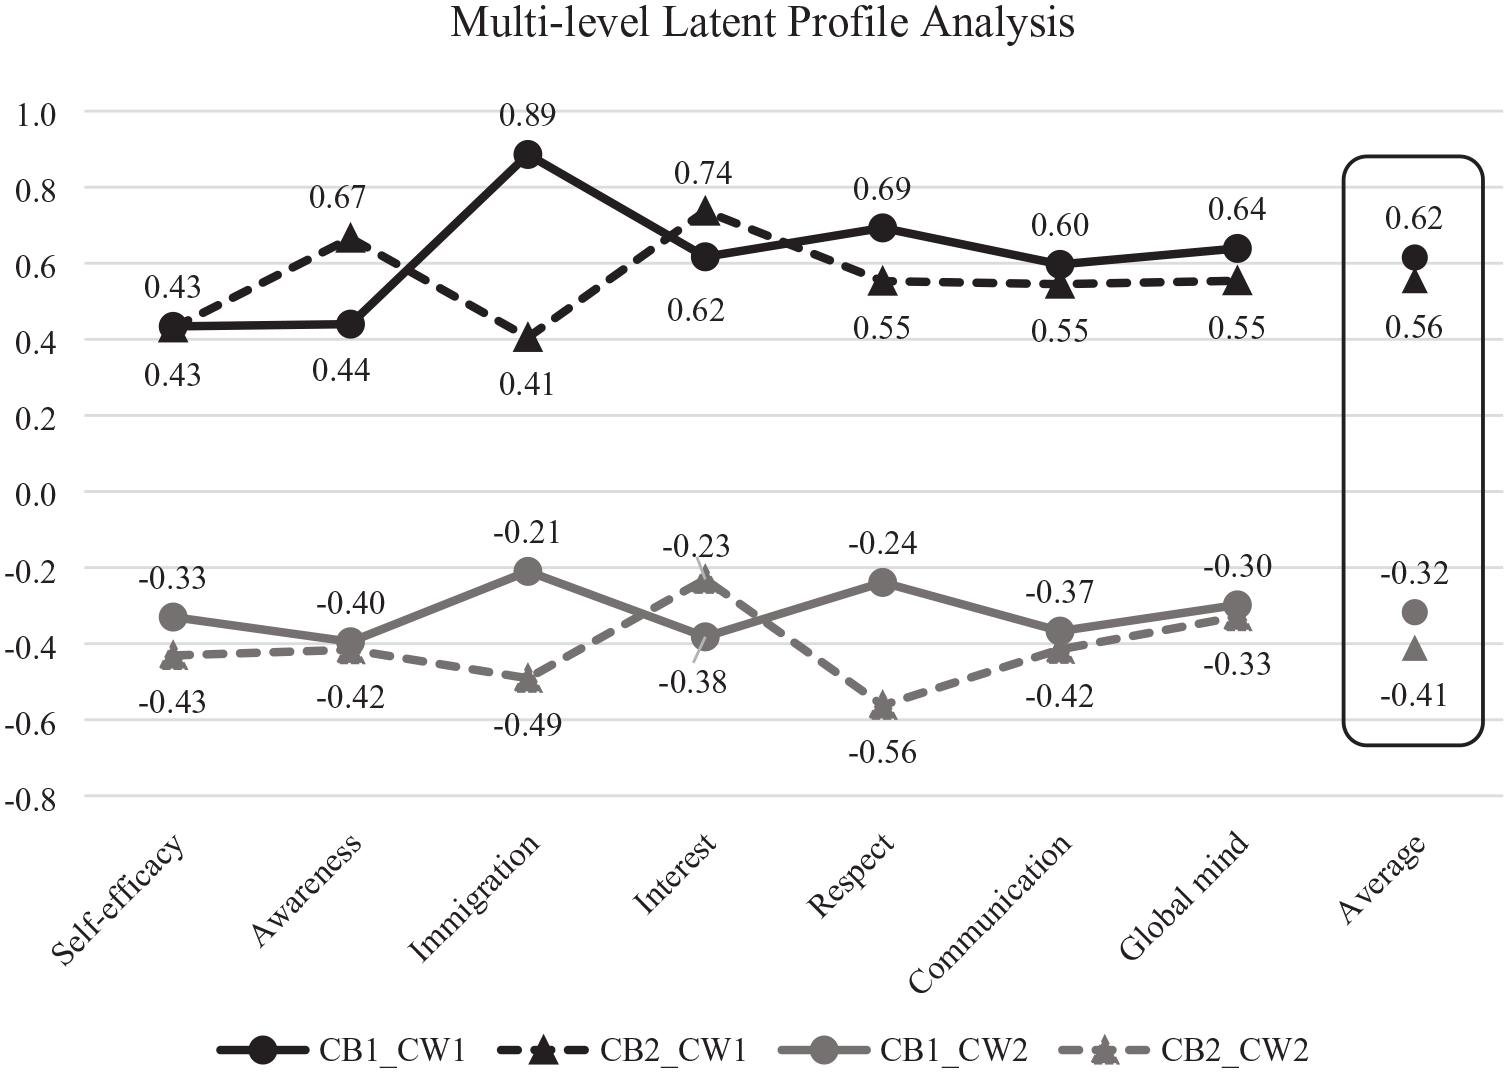
Profiles From the Multilevel Latent Profile Analysis: 2 Groups at the Between-Level and 2 Groups at the Within-Level (N = 355,579)
A couple of findings are noteworthy. First, the overall country-level differences in global competence are small when comparing the two groups of globally “competent” individuals only (i.e., between CB1_CW1 and CB2_CW1) and when comparing the two groups of “less competent” individuals only (i.e., between CB1_CW2 and CB2_CW2). That is, the difference between CB1_CW1 and CB2_CW1 in the average global competence scores over all seven scales was only .06 (.62–.56). Similarly, the average group difference between CB1_CW2 and CB2_CW2 was .09 (−.32–[−.41]). Therefore, it can be said that the country difference on global competence barely exists, especially among the individuals who share similar outlooks related to global competence.
Second, the multilevel LPA results allow the comparison between the individuals belonging to the same grouping at the country level. The two individual groups belonging to CB1 (i.e., between CB1_CW1 and CB1_CW2) show an average difference of 0.94 (.62–[−.32]). Similarly, the two individual groups belonging to CB2 (i.e., between CB2_CW1 and CB2_CW2) show an average difference of 0.97 (.56–[−.41]). This means that there is a sizable range of individual-level differences in global competence even though they belong to the same, either “competent” (CB1) or “less competent” (CB2), groups of countries.
Subgroup Membership Size at the Individual and Country Levels
Table 3 shows the membership sizes for each profile group. Overall, among the four latent profile groups, CB2_CW2 was the largest, containing 40% of all participants. Each of the other three groups comprises about 20% of participants from the total sample (see the left-hand side of Table 3). In addition, CB1 (global competent countries) and CW1 (global competent individuals) account for 40%, while their corresponding “less competent” groups, CB2 and CW2, comprise the remaining 60% (see the middle column of Table 3).
Sizes of the Profile Memberships Based on Multilevel Latent Profile Analysis With 2 Groups at the Between-Level (CB) and 2 Groups at the Within-Level (CW) (N = 355,579).
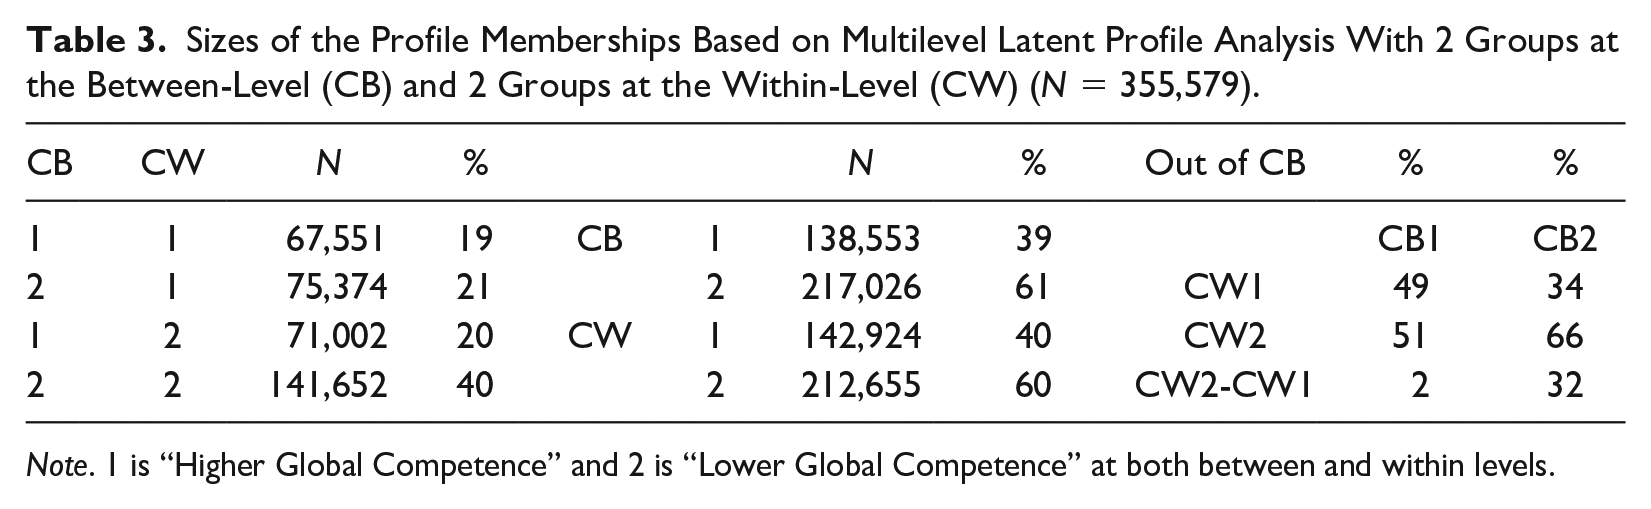
Note. 1 is “Higher Global Competence” and 2 is “Lower Global Competence” at both between and within levels.
The right-hand section of Table 3 shows that there are as many as 51% of globally “less competent” individuals (CW2) in the “competent” countries (CB1). Thus, the percentage difference between “competent” individuals (49% of CW1) and “less competent” individuals living in the CB1 countries (51% of CW2) is only 2%. This means that although individuals may belong to a country that is generally considered “globally competent” (CB1), inferences cannot be made about all individuals from the CB1 countries, since about half of them are in fact globally “less competent” individuals. Among the “less competent” countries (CB2), 34% of individuals are classified as “competent” (CW1), with the remaining 66% classified as “less competent” (CW2). While a much larger proportion of the “less competent” individuals is found in the “less competent” countries (CB2), there are still 34% of individuals who are classified as globally “competent” within the CB2 group. Overall, the presence of 51% of CW2 within CB1 and 34% of CW1 within CB2 indicates the extent to which global competence designations are not aligned between the individual and country levels.
Immigration and Respect Show Noteworthy Country-Level Group Differences
The profile plots at the individual-level LPA (Figure 1A) show similar sizes of group differences across all seven variables. On the other hand, two variables, “immigration” and “respect,” showed more substantial group differences in the country-level profiles compared with the other five variables in the model (see Figure 1B). These single-level profile patterns are also reflected in the multilevel LPA outcomes. Thus, it appears that only two components of global competence, “immigration” and “respect,” are important markers that differentiate the two groups of countries (see Figure 2). Specifically, individuals in the “less competent” countries (CB2)—whether they are globally competent (CW1) or not (CW2)—express a less positive attitude toward immigrants than those from the “competent” countries (CB1). Interestingly, the country-level group difference was larger between the two “competent” groups of CW1 (top two plots indicating a mean difference .89–.41 = .48) than between the two “less competent” groups of CW2 (bottom two plots indicating a mean difference = [−.21]–[−.49] = .28). This means that among the globally “competent” individuals (CW1), their attitude toward “immigration” was the indicator that was central to the country-level classification (CB1 vs. CB2).
The other variable that showed noteworthy country-level difference was “respect.” However, the difference was of noteworthy size only under the CW2 condition (mean difference = [−.24]–[−.56] = .32). Among the “less competent” individuals (CW2), those from the “less competent” countries (CB2_CW2) expressed less respect for people from other cultures, than those from the “competent” countries (CB1_CW2).
Academic Achievement, Family SES, and Global Competence
Figure 3 presents the means of family SES and academic achievement for the four latent profile groups. As can be seen, both family SES and academic achievement decrease as we move successively from the CB1_CW1 group to the CB2_CW2 group. Thus, there appears to be a systematic relationship between the groups’ global competence membership designation and these two variables. Statistical tests using one-way analysis of variance and post hoc comparisons that were adjusted using the Bonferroni method showed that the group differences in both family SES and academic achievement are highly significant (p < .001) across all six pairs of group comparisons.
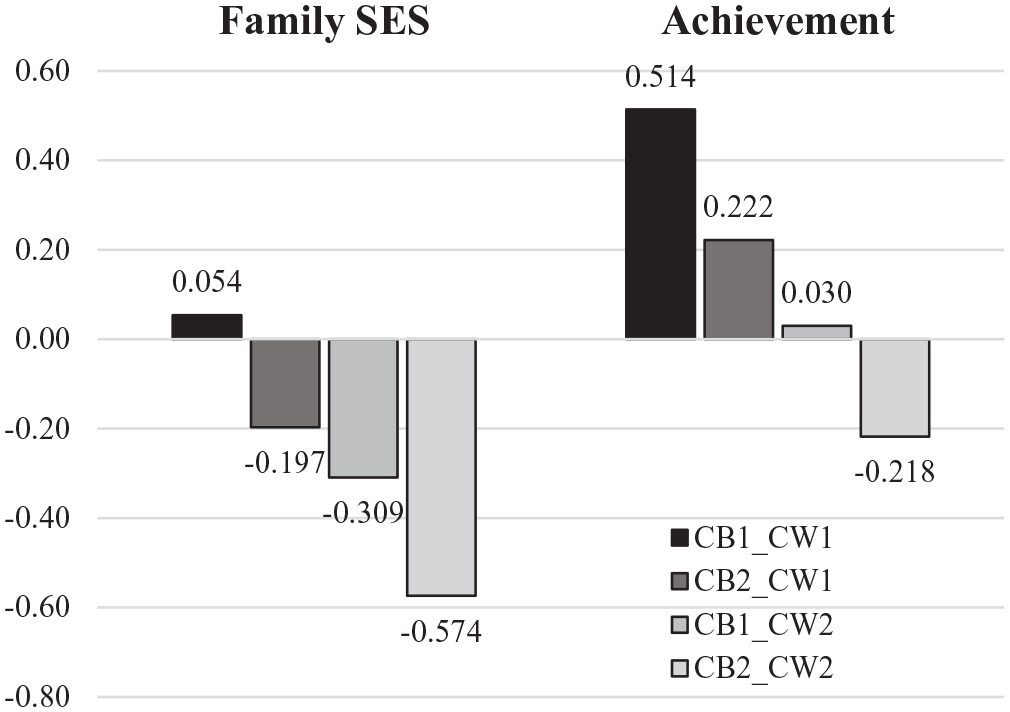
Mean Scores on Family SES and Academic Achievement of Four Latent Profile Groups of Global Competence
We also carried out multinomial logistic regression to examine the relative predictive power of family SES and academic achievement for the group membership. The results shown in Table 4 are based on CB2_CW2 as the criterion group, and the regression coefficients represent the predictors’ effects on the likelihood of belonging to each of the other three groups relative to the criterion group. As can be seen, both family SES and achievement are statistically significant in all three pairs of group comparisons. As expected, the coefficients for both family SES and achievement are the largest when comparing CB1_CW1 with CB2_CW2, that is, the two groups that are the highest and lowest on global competence. The model predicted that the odds ratio of belonging to CB1_CW1, relative to CB2_CW2, would be 2.17 for a one-unit change in academic achievement. The corresponding odds ratios for the prediction of belonging to CB2_CW1 and CB1_CW2 were 1.59 and 1.28, respectively. We can also compare the odds ratios of 2.17 for academic achievement and 1.28 for family SES, in predicting the individuals belonging to CB1_CW1 relative to CB2_CW2. Overall, both family SES and academic achievement are predictors of group membership on global competence, but the effect of academic achievement is stronger than the effect of SES.
Multinominal Logistic Regression Based on Multilevel Latent Profile Analysis.
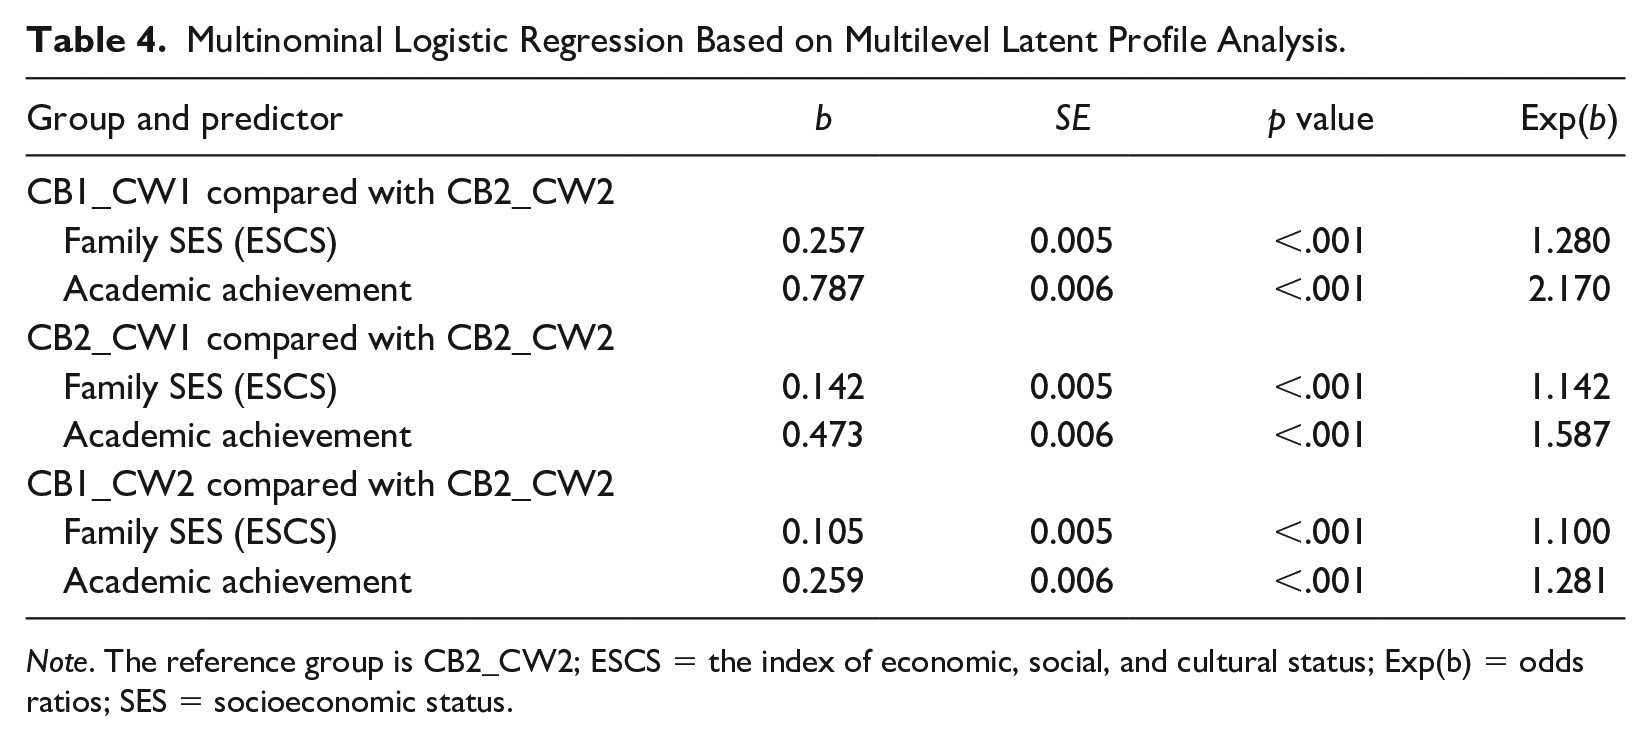
Note. The reference group is CB2_CW2; ESCS = the index of economic, social, and cultural status; Exp(b) = odds ratios; SES = socioeconomic status.
Country-Level Differences in Latent Profiles: Global Competence in Each Participating Country
Table 5 presents the country’s CB designation (in the first column) and the proportion of individual students belonging to the “competent” (CW1) or “less competent” (CW2) group within the country (in the second and third columns), along with each country’s overall score on global competence, averaged over all seven variables. Out of a total of 57 countries, 19 are classified as “competent” countries (CB1) and the remaining 38 as “less competent” countries (CB2). The mean average global competence score across the 19 CB1 countries is .14, compared with −.07 for the 38 CB2 countries. Thus, the overall country-level difference between CB1 and CB2 is .21, suggesting again, that the size of difference is on the borderline of being noteworthy.
Country Classification Based on Multilevel Latent Profile Analysis With 2 Groups at the Between-Level and 2 Groups at the Within-Level.
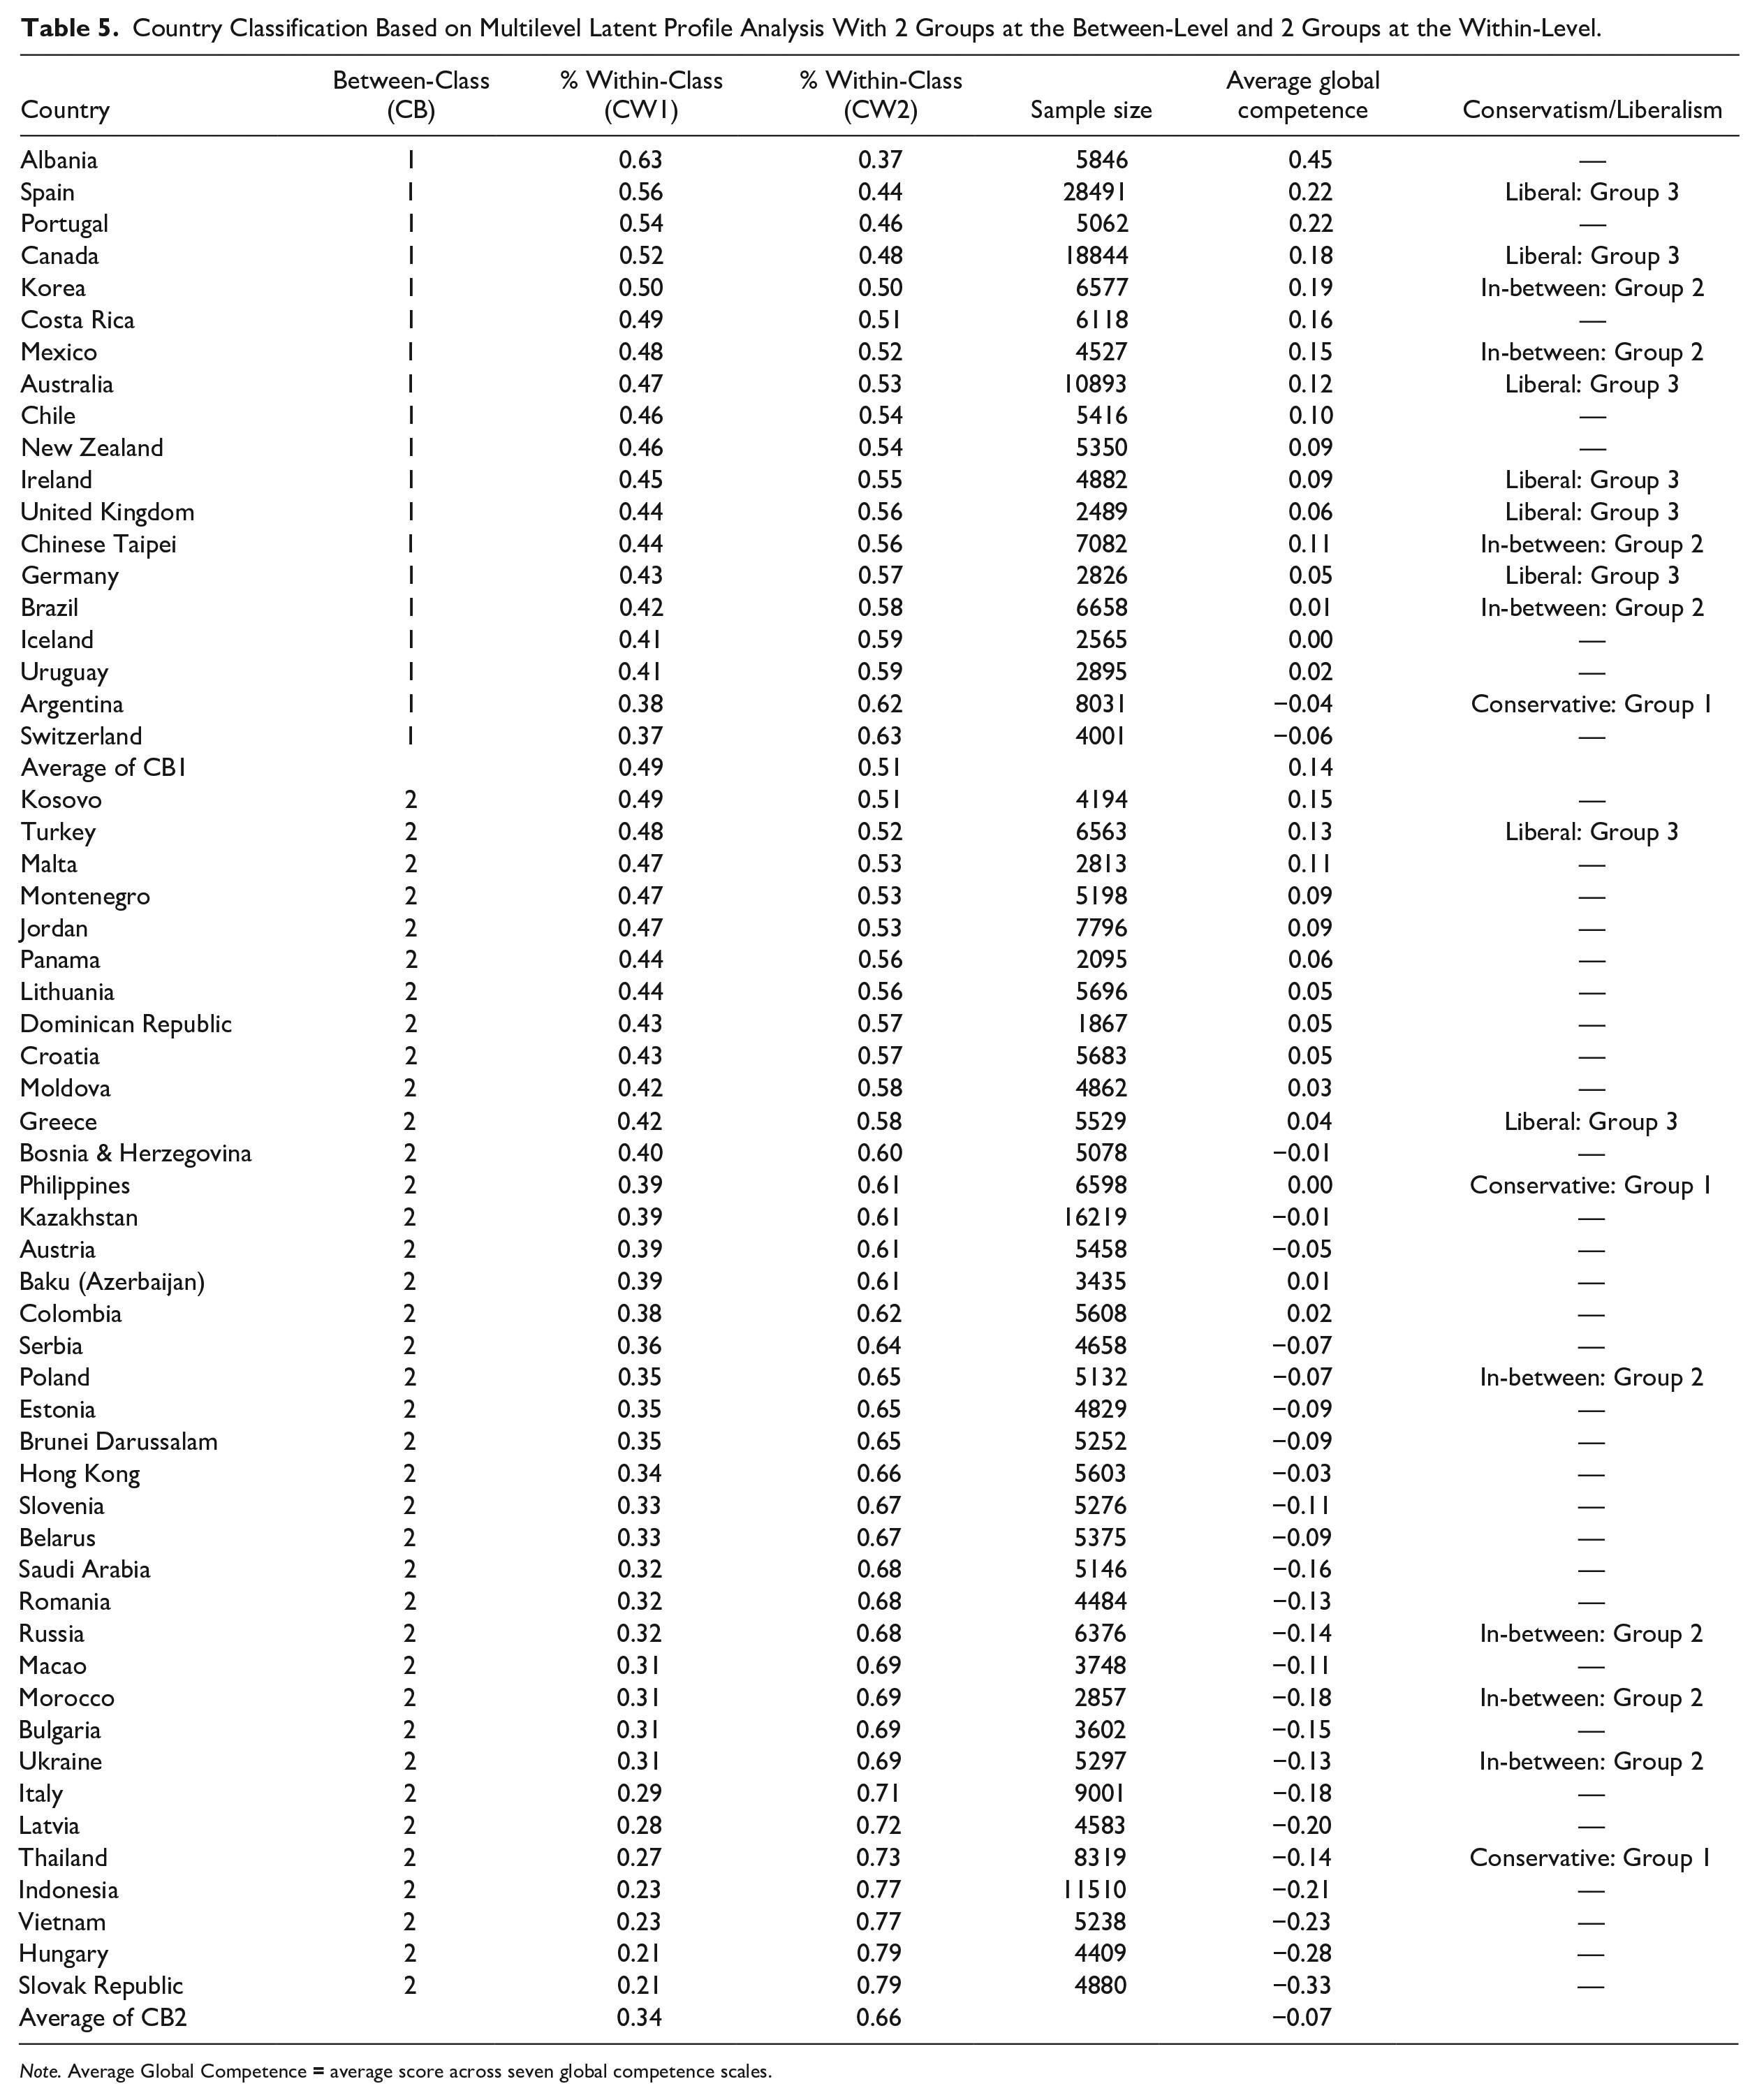
Note. Average Global Competence
As can be seen in Table 5, there were both “competent” (CW1) and “less competent” (CW2) individuals in each country regardless of its CB designation. Specifically, there was about a 50-50 division of CW1 and CW2 individuals in the majority of the CB1 countries. Surprisingly, only five countries (Albania, Spain, Portugal, Canada, and Korea) within the CB1 countries showed larger proportions of “competent” (CW1) than “less competent” (CW2) individuals. Among the CB2 group, no country had a larger proportion of CW1 than CW2 individuals. More than 75% of individual students are classified as “less competent” (CW2) in the CB2 countries listed at the bottom of Table 5 (Slovak Republic, Hungary, Vietnam, and Indonesia).
Global Competence and Conservatism/Liberalism
In the final set of analyses, we explored the link between global competence scores from the PISA student population and countries’ conservatism/liberalism designation from the studies based on the adult population. Of the 33 countries for which country-level data on conservatism/liberalism were available (see Stankov et al., 2014; Stankov & Lee, 2016a, 2016b), 19 also participated in the PISA 2018 survey. Among these, eight countries, including Spain, Canada, and Australia, belong to the “Liberal” group (labeled Group 1 in Table 5). Another eight belong to the “In-between” group, including Korea, Mexico, and Chinese Taipei (labeled Group 2). The other three countries, Argentina, the Philippines, and Thailand, are classified “Conservative” (labeled Group 3). Given the relatively small sample of countries (N = 19), we chose to calculate Spearman’s correlation rho (ρ) to rank countries based on their average global competence scores and their rank order in relation to conservatism/liberalism. The result showed rho (ρ) = .565 (p = .012 and significant at the .05 level), suggesting a moderate strength of association at the country level—i.e., students from more liberal countries tended to score higher on global competence, compared with students from conservative countries.
Figure 4 is a plot showing the countries’ average global competence scores (on the y-axis) and their designation into one of the three categories on the conservatism/liberalism dimension (on the x-axis). As expected from the less-than-perfect correlation, there was a range of global competence scores within each of the three groups of conservative/liberal countries. In particular, a wide range of global competence scores were noted in the “in-between” group of countries. Among them, the global competence scores of Korea, Taipei-China, and Mexico are on a par with those in the liberal countries. This implies that students in these “in-between” groups of countries are more globally oriented and more liberal than their current adult populations. On the other hand, Brazil, Poland, Ukraine, Russia, and Morocco in the “in-between” group showed similar levels of global competence scores to those of the conservative group. This implies, arguably, that younger generations within these “in-between” countries are less globally competent and more conservative than their adult populations.
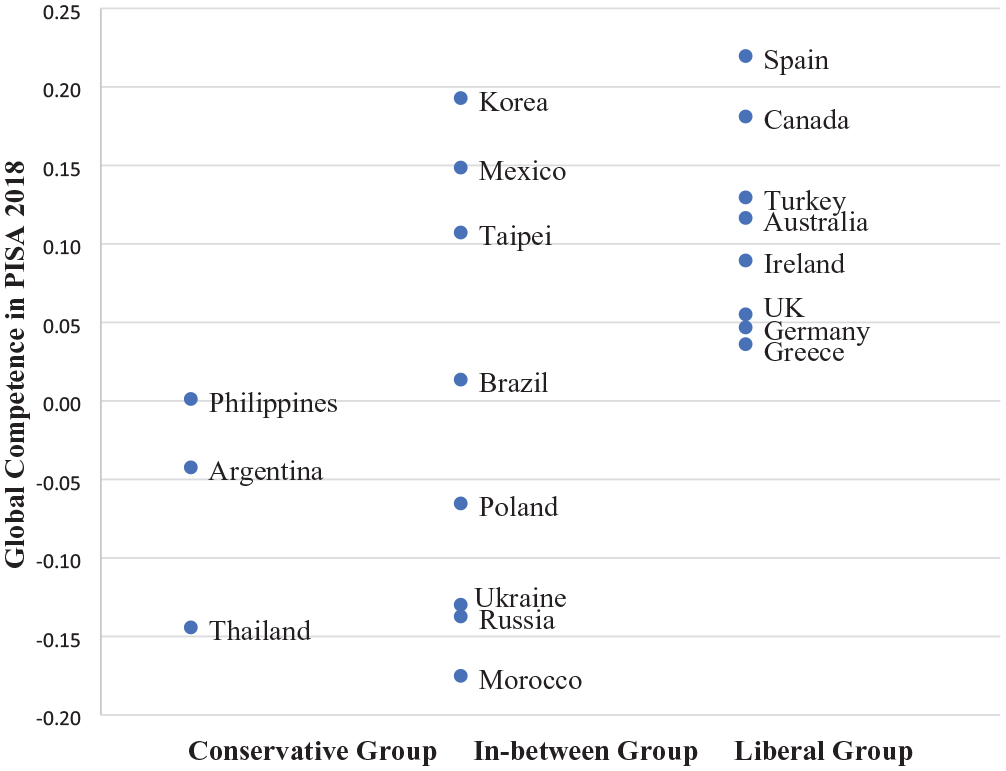
Scatterplot of Global Competence at the Country Level and Liberal, In-Between and Conservative Groups of Countries (Stankov & Lee, 2016b)
Discussion
Multilevel LPA Outcomes: Individual- and Country-Level Differences
The present study identified two groups of global competence, “competent” and “less competent,” at both individual and country levels. There was no a priori reason to expect the same number of latent profile groups to emerge at both levels. Cross-cultural research tends to show that the number of groups differs at the individual and country levels (Na et al., 2010). However, similar typological outcomes were also reported, for example, with measures of religiosity, nastiness, and social awareness/morality at both levels (e.g., Stankov & Lee, 2016a, 2016b).
Beyond the number of groups, individual- and county-level LPA outcomes may differ with respect to the overall levels and shapes of the subgroup profiles. Indeed, we found the overall group differences to be pronounced at the individual level (i.e., close to 1.00 standard deviation) while the country-level group differences were small (.23 of the standard deviation in the single LPA) or negligible (an average of .075 of the standard deviation in the multilevel LPA).
Small/Negligible Country-Level Differences
The small/negligible country difference in global competence found in this study was unexpected. According to the central limit theorem, that is, the distribution of group means tends to be normal (Gaussian) with its dispersion being smaller than that of individual units, we may expect smaller but not necessarily negligible differences at the group level. Previous research on cross-cultural differences in psychological variables often reported larger country-level differences than what we found in this study. For example, Inglehart and Welzel (2005) reported a group difference of more than 3 standard deviations between top and bottom countries on measures of values. In PISA studies, a typical range of country differences in cognitive assessment is at least 2 standard deviations or higher. In contrast, the range of the global competence score between the top (.45 in Albania) and bottom (−.33 Slovak Republic) countries is only .78 of the standard deviation in this study. Given that both self-efficacy and awareness measures have some cognitive element (i.e., confidence in knowledge and asking about specific global issues), our initial expectation was larger country-level difference than what we found.
We may conjecture a few potential explanations for the small country-level group differences found in this study. First, it may be that contemporary teenagers around the world are exposed to “shared” information through a wide range of online sources and social media (cf. Leander & McKim, 2003), leading to a “leveled” globalization. Second, it is possible that global competence may be a “mature” disposition as it requires critical thinking, emotional maturity, and life experiences to reflect on and care about global issues. As such, most teenagers may not have had a chance to develop a strong global outlook and thinking about the “world.” Indeed, only 5 out of 57 countries had a greater number of students classified as globally “competent” compared with globally “less competent.”
Third, our finding may suggest that global competence may be a disposition that needs to be learned through education. Without adequate learning opportunities for specific knowledge, skills, and attitudes designed to improve global competence, most students may not develop this disposition. Our finding of small country-level difference suggests that there has been limited success in education around the world that aimed to promote global competence among young people.
Group Differences in Global Competence and the Inside-Outside Cascade Model
As mentioned in the introduction, we adopted the “inside-outside cascade model” (Stankov et al., 2014) to guide our expectations about which variables may show noteworthy cross-cultural differences. It was assumed that people’s attitudes toward immigration and respect for other cultures reflect social norms and values, and thus, may exhibit substantial cross-cultural differences. Then, a moderate level of cross-cultural differences was expected for communication (i.e., knowing how to communicate with others from different cultures) and global mind (i.e., desire to do something about global issues), because these constructs reflect not only self-ability and self-perception but also include values and social attitudes. Self-efficacy, interest, and awareness were projected to exhibit small or negligible cross-cultural differences because they are largely considered as “inside” personal traits/dispositions.
Our findings are largely in agreement with this “cascade” pattern of the “inside-outside model.” As predicted, “attitudes towards immigrants” and “respect for other cultures” showed the largest country-level differences (i.e., subgroup differences of .33 to .38). “Communication” and “global mind” showed “in-between” sizes of the country-level differences (i.e., subgroup differences of .20 to .22). Finally, “self-efficacy,” “interest,” and “awareness” showed the smallest country-level differences (i.e., subgroup differences of .10 to .17). As it is the first study to examine the conceptual correspondence between a range of global competence indicators and the “inside-outside cascade model,” more empirical data will be needed to confirm this classification.
Global Competence, Social Conservatism, and Cognitive Ability
The present study also found a moderate correlation between global competence and conservatism/liberalism dimension, suggesting that the countries whose teenagers scored highly on the PISA measures of global competence are also more socially liberal countries. Previous cross-cultural studies (e.g., Stankov, 2009) showed a link between cognitive ability and social liberalism at the country level, and this study also found a link between academic achievement and global competence. Thus, it is possible that cognitive ability may be a potential underlying common factor for both global competence and social liberalism.
We should also note that the obtained correlation was not close to 1, which suggests either a conceptual gap between these two constructs, or possible generational trends in different countries, especially those previously labeled as the “in-between” group. According to our findings, contemporary students in Korea, Taipei-China, and Mexico may be more globally oriented and more liberal than their adult populations. This may suggest a strong intergenerational trend toward social liberalism in these countries. On the other hand, students in Morocco, Russia, Ukraine, and Poland may be less globally oriented and more conservative than their adult populations. This may suggest the intergenerational trend toward stronger conservative worldviews among the younger generations in these countries and their willingness to take conservative positions. However, the implication of intergenerational trend can only be verified with the collection of new data.
Policy Implications
The present study contains several policy implications. First, assuming global competence is an important disposition for young generations, it may be beneficial to incorporate education about it in formal schooling. Global competence can be taught to students in traditional subjects, such as by incorporating reading materials about diverse cultures or using examples from different cultures in mathematical problem-solving. In addition, it can be taught as a standalone subject, where students study global issues and work on projects proposing solutions to these.
Second, our finding of consistent individual-level group differences across the seven indicators, along with our finding of “g-g” (general factor of global competence), suggests that improvement in students’ global competence will probably need to occur across all domains, that is, knowledge (e.g., “awareness of global issues”), skills (“intercultural communication”), values (“respect for other cultures”), and attitudes (“attitudes toward immigrants”). Proper development of global competence would require not only knowledge and skills, but also the ability to apply it, hold relevant values, and have desire to act. As mentioned in the introduction, the global competence concept in PISA has a strong emphasis on “action.” Thus, concepts known as “knowledgeable action” (i.e., promotion of action based on knowledge, cf. Markauskaite et al., 2021) and “actionable knowledge” (i.e., acquiring knowledge that can lead to addressing societal challenges, cf. Mach et al., 2020) may be relevant for schools and teachers to consider for student development of global competence.
Third, we found that two specific constructs, “attitudes toward immigrants” and “respect for other cultures,” are important at the country level. This implies that national and international policies aimed at fostering global competence should focus on these key elements. Previous research has highlighted the negative effects of exclusionary attitudes toward immigrants on social integration (e.g., Janmaat, 2014) and the importance of education in addressing this issue (e.g., Bilgili, 2019). Schools can play a role by fostering a global perspective and incorporating explicit teaching on global issues. However, addressing the specific challenges faced by marginalized groups such as refugees and immigrants also requires proactive policies at the national and international level. Cross-cultural psychologists have identified various strategies to enhance attitudes toward immigrants. Yagmur and Van de Vijver (2022) pointed out that some countries, such as Australia and Netherlands, have had more success in terms of immigrants’ well-being and acculturation as compared with others like France and Germany. They argued that policies that allow immigrants to maintain their own language and culture, instead of imposing pressure to adopt host nation’s lifestyle, play a critical role in fostering positive attitudes towards immigration among both immigrants and citizens.
Finally, our multilevel results revealed that there is plenty of room to improve global competence in virtually all countries. Among the four latent profile groups, CB2_CW2 was the largest group (40% of all participants), and in 52 out of 57 countries there was a greater number of “less globally competent” students compared with the number of “globally competent” students. The country-level information presented in Table 5 may further provide specific directions to policymakers in each country. For instance, countries like Argentina and Switzerland that belong to the “competent” group (CB1) but have a large percentage of “less competent” individuals (CW2) may consider implementing actions to enhance “attitudes towards immigrants.” Meanwhile, countries such as Indonesia, Vietnam, Hungary, and the Slovak Republic that belong to the “less competent” (CB2) group with most students classified into the “less competent” (CW2) group may take steps to improve both “attitudes towards immigrants” and “respect for other cultures.”
Limitations of the Present Study and Future Research Directions
We wish to acknowledge the limitations of the present study that may be addressed in future. First, the indicators and measures of global competence used in our study were drawn from the PISA 2018 project. While it is the most comprehensive international project of this kind, its indicators have been criticized for, among other things, having a neo-liberal Western bias, encouraging socially desirable responses, and producing stereotypical views of nations (e.g., Bailey et al., 2023; Sälzer & Roczen, 2018). It may be worthwhile to explore new items/scales of global competence, keeping these concerns in mind. Alternative forms of assessing global competence may also include behavioral observation. A benefit of this approach is to encourage schools to educate their students about appropriate conduct and effective communication with people from diverse cultures.
Second, scholars have called for further research to bolster construct validity of global competence (e.g., Barrett, 2018). Research efforts to examine discriminant validity with measures of similar constructs noted in the introduction (e.g., cross-cultural competence, intercultural sensitivity, intercultural effectiveness, and global citizenship) should be considered.
Third, as the present study found that attitudes toward immigration are an important marker for students’ global competence, it may be a useful direction to explore how the student attitudes toward immigrants are formed, including potential influences of in-person experiences with immigrant groups, recent social events and policy announcements involving immigrants, and perceptions about the extent of the immigration flow to the country.
Finally, future studies can broaden the nomological network by including a wider range of cross-cultural variables derived from the dimensions identified in traditional cross-cultural studies such as individualism and uncertainty avoidance (e.g., Hofstede, 2001; House et al., 2004; Schwartz, 2012), and other factors such as education and social policies that shape values and social norms toward diverse cultural backgrounds and marginalized groups.
Footnotes
Appendix
Descriptions of the Scales: Scale Labels in PISA, Items, Response Points, and Cronbach’s Reliability (α).
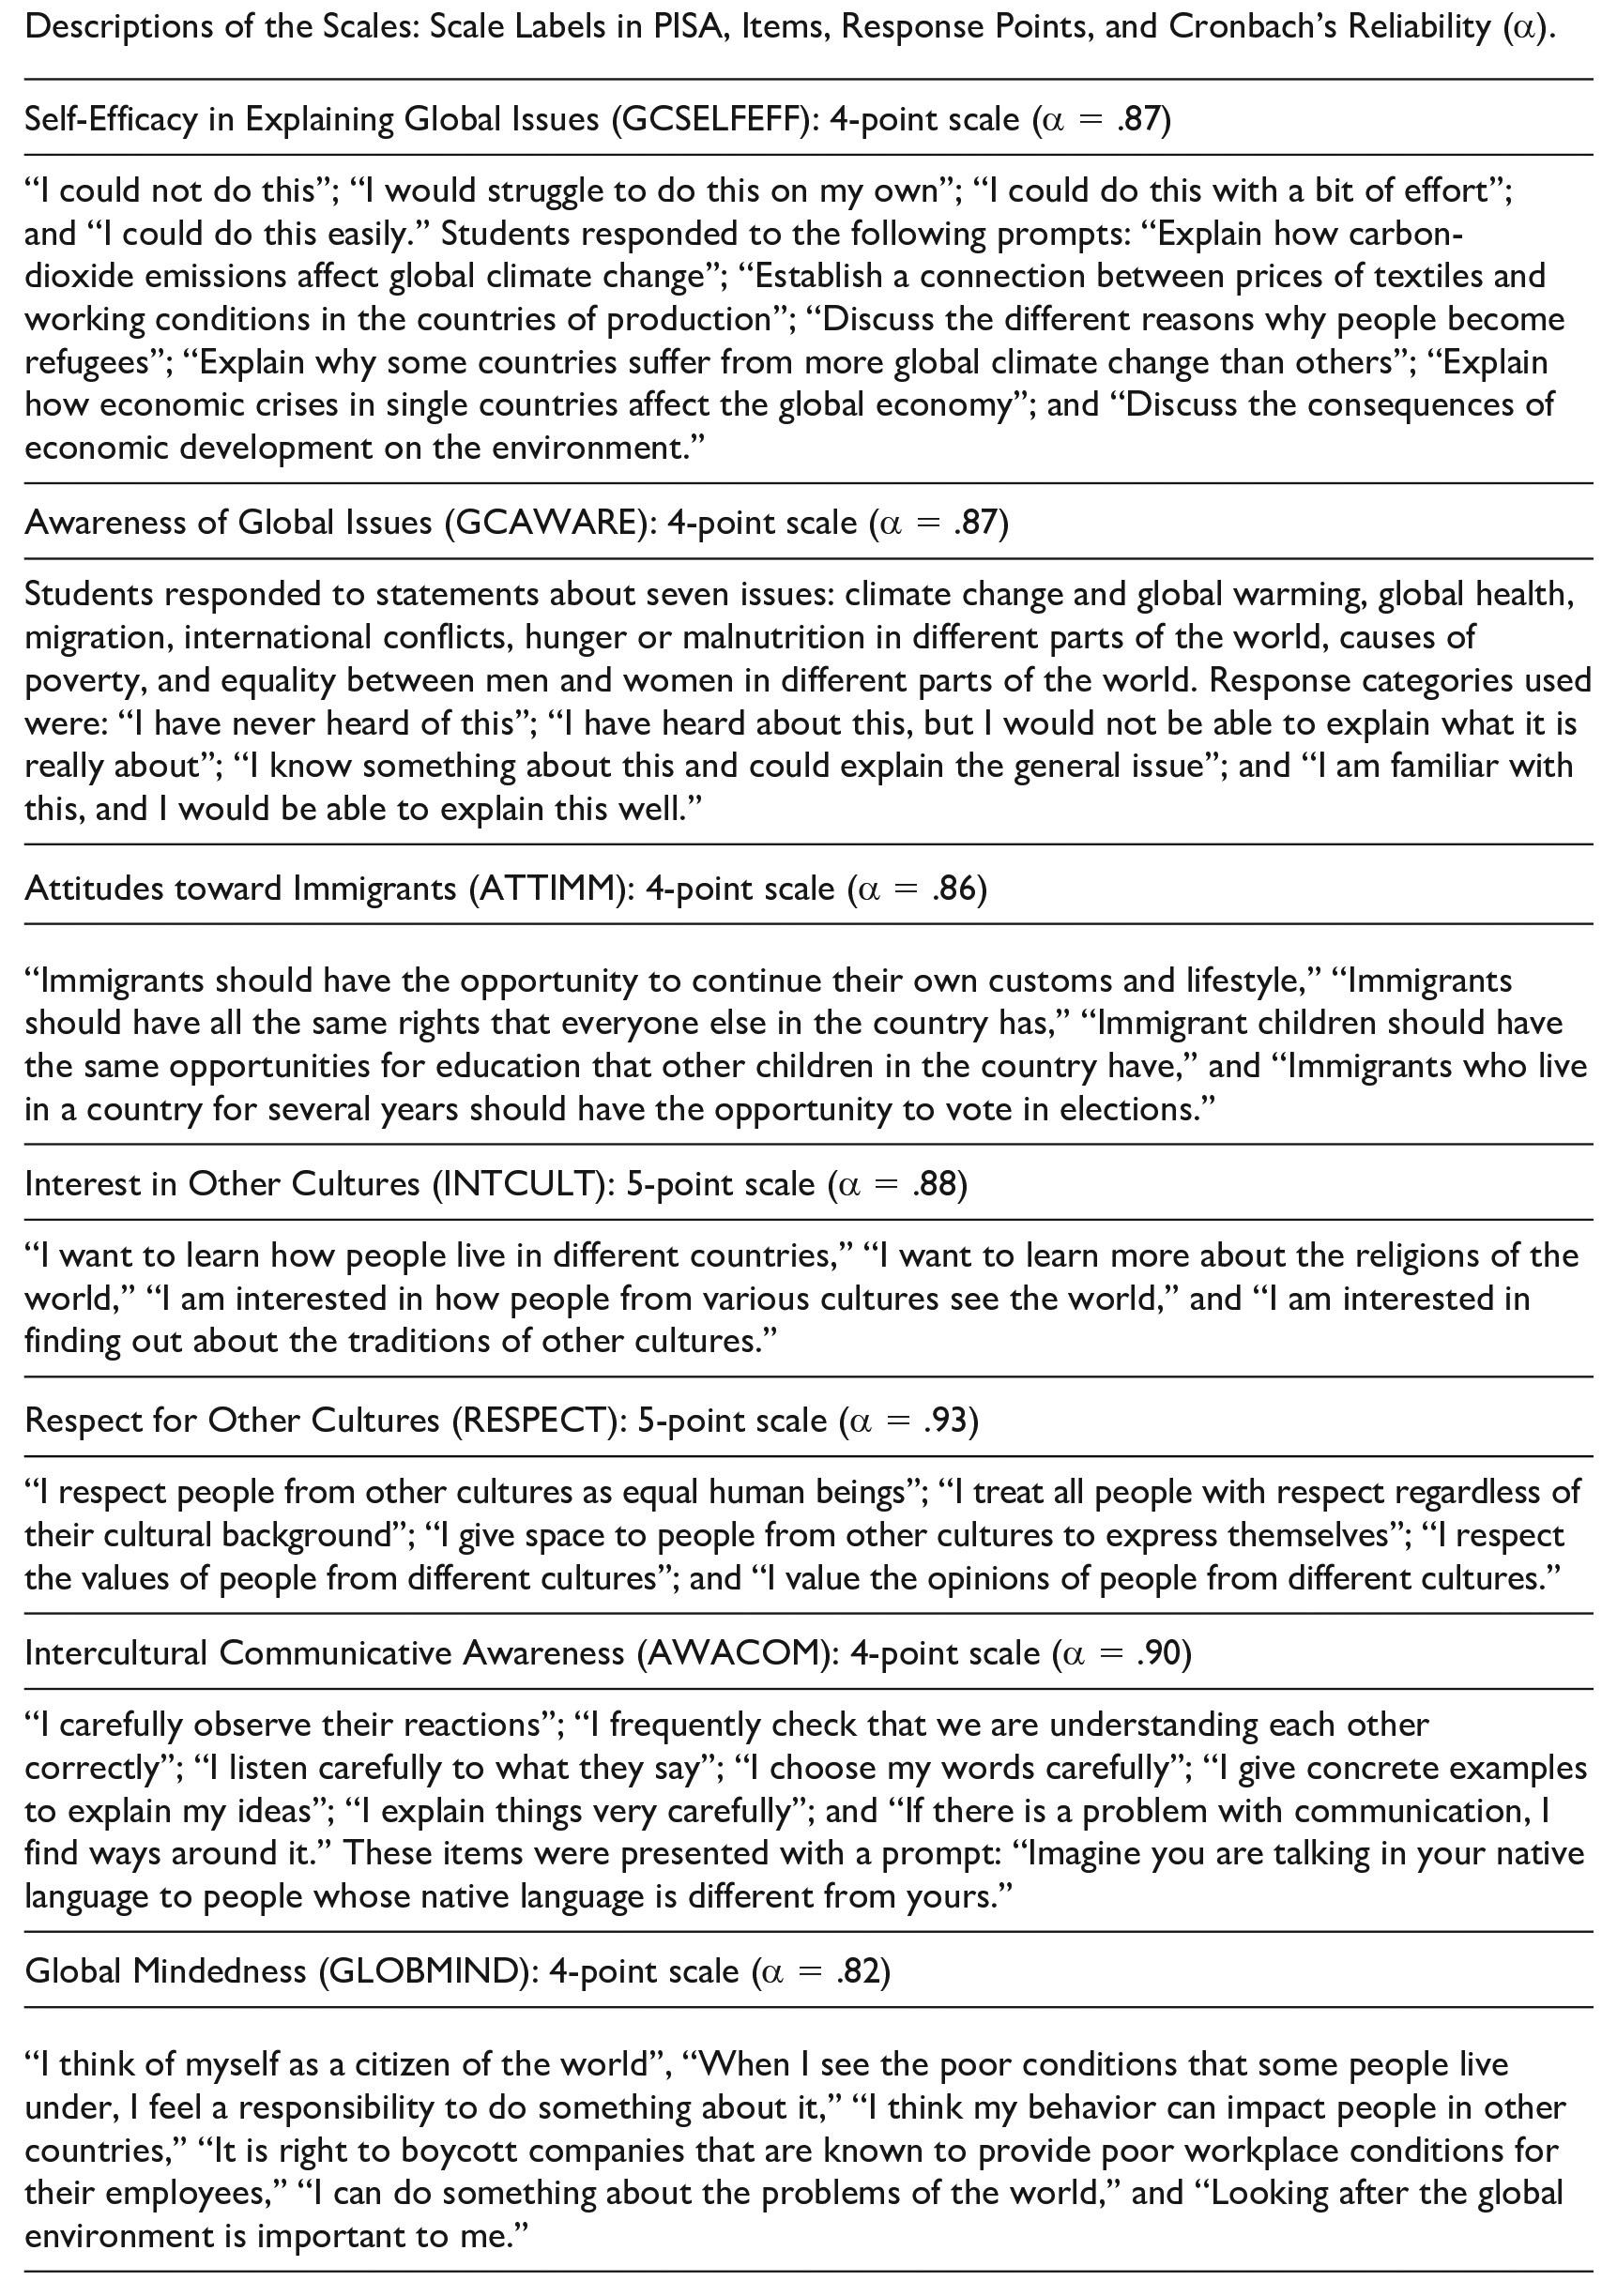
| Self-Efficacy in Explaining Global Issues (GCSELFEFF): 4-point scale (α = .87) |
|---|
| “I could not do this”; “I would struggle to do this on my own”; “I could do this with a bit of effort”; and “I could do this easily.” Students responded to the following prompts: “Explain how carbon-dioxide emissions affect global climate change”; “Establish a connection between prices of textiles and working conditions in the countries of production”; “Discuss the different reasons why people become refugees”; “Explain why some countries suffer from more global climate change than others”; “Explain how economic crises in single countries affect the global economy”; and “Discuss the consequences of economic development on the environment.” |
| Awareness of Global Issues (GCAWARE): 4-point scale (α = .87) |
| Students responded to statements about seven issues: climate change and global warming, global health, migration, international conflicts, hunger or malnutrition in different parts of the world, causes of poverty, and equality between men and women in different parts of the world. Response categories used were: “I have never heard of this”; “I have heard about this, but I would not be able to explain what it is really about”; “I know something about this and could explain the general issue”; and “I am familiar with this, and I would be able to explain this well.” |
| Attitudes toward Immigrants (ATTIMM): 4-point scale (α = .86) |
| “Immigrants should have the opportunity to continue their own customs and lifestyle,” “Immigrants should have all the same rights that everyone else in the country has,” “Immigrant children should have the same opportunities for education that other children in the country have,” and “Immigrants who live in a country for several years should have the opportunity to vote in elections.” |
| Interest in Other Cultures (INTCULT): 5-point scale (α = .88) |
| “I want to learn how people live in different countries,” “I want to learn more about the religions of the world,” “I am interested in how people from various cultures see the world,” and “I am interested in finding out about the traditions of other cultures.” |
| Respect for Other Cultures (RESPECT): 5-point scale (α = .93) |
| “I respect people from other cultures as equal human beings”; “I treat all people with respect regardless of their cultural background”; “I give space to people from other cultures to express themselves”; “I respect the values of people from different cultures”; and “I value the opinions of people from different cultures.” |
| Intercultural Communicative Awareness (AWACOM): 4-point scale (α = .90) |
| “I carefully observe their reactions”; “I frequently check that we are understanding each other correctly”; “I listen carefully to what they say”; “I choose my words carefully”; “I give concrete examples to explain my ideas”; “I explain things very carefully”; and “If there is a problem with communication, I find ways around it.” These items were presented with a prompt: “Imagine you are talking in your native language to people whose native language is different from yours.” |
| Global Mindedness (GLOBMIND): 4-point scale (α = .82) |
| “I think of myself as a citizen of the world”, “When I see the poor conditions that some people live under, I feel a responsibility to do something about it,” “I think my behavior can impact people in other countries,” “It is right to boycott companies that are known to provide poor workplace conditions for their employees,” “I can do something about the problems of the world,” and “Looking after the global environment is important to me.” |
Declaration of Conflicting Interests
The author(s) declared no potential conflicts of interest with respect to the research, authorship, and/or publication of this article.
Funding
The author(s) received no financial support for the research, authorship, and/or publication of this article.