
Abstract
Some metropolitan areas (e.g., Berlin, New York) have a cosmopolitan culture. That is, they serve as centers of economic development and value diversity, creativity, and equality. These areas offer economic and creative opportunities that are open to anyone willing to take a risk. Therefore, such cities may attract people who are high in risk-taking. We first showed that real-world risk-taking is more common in cities with a more cosmopolitan culture (Study 1). Second, we found that people who are more prone to risk-taking as measured by self-report (Studies 2a and 2b) and observed behavior (Study 3, preregistered) have greater preferences for cosmopolitan cities as residential destinations. Third, we tested a causal link between risk-taking and preference for cosmopolitan cities. Inducing a prevention focus (known to inhibit risk-taking) reduced people’s desire to settle in cosmopolitan cities (Study 4). We discuss implications for economic growth and migration to cosmopolitan cities.
Keywords
People frequently change their place of residence to seek better economic and social opportunities. Pursuing new opportunities, however, almost always involves some risk. A business idea may fail, or a new job may be a disappointment, yet the reward of success can also be huge. Some people are more likely than others to take risks and may feel attracted to places that offer more frequent and potentially more lucrative opportunities.
What are the places that offer such opportunities? We propose that these places are cities with a cosmopolitan culture. Cosmopolitan cities harbor global enterprises and endorse diversity, creativity, and equality (Sevincer et al., 2017). Cosmopolitan cities not only offer more opportunities, but these opportunities are also more open to anyone willing to take the risk. Here, we asked whether people who take more risks (whose actions involve the possibilities of harm but also of reward; Leigh, 1999) prefer cosmopolitan cities as their potential residential destinations.
Cosmopolitan Culture
Drawing on interdisciplinary conceptualizations of cosmopolitanism, Sevincer et al. (2017) identified four defining features of places with a cosmopolitan culture. First, cosmopolitan cities provide abundant economic opportunities. They host financial and entrepreneurial networks (Sassen, 2001), and are hubs of economic development (Florida, 2002). Second, cosmopolitan cities are ethnically and socially diverse. Their residents are a mixture of people with different ethnic and social backgrounds, lifestyles, values, and sexual orientations (Short, 2004), who tend to embrace tolerance toward each other (Leung & Koh, 2019; Leung et al., 2015). Third, cosmopolitan cities foster creativity. New trends (fashion, arts) often originate in cosmopolitan cities and these cities typically host creative professions and industries (Florida, 2002). Fourth, cosmopolitan cities endorse equality. Such cities tend to have policies and norms intended to promote equality and reduce discrimination (Appiah, 2006; Sevincer et al., 2017).
Cosmopolitan culture can be measured by a scale, the Cosmopolitan City Scale (CCS; Sevincer et al., 2017) that assesses the degree to which people perceive certain places to be cosmopolitan. The scale consists of nine items that tap into the four features of cosmopolitanism, economic opportunities, diversity, creativity, and equality (e.g., “provides equal opportunities to succeed”). Using factor-analysis, Sevincer et al. (2017) found that the scale is unidimensional. The researchers also found that the four aspects are correlated across many different cities and that they correlated with numerous objective indicators of cosmopolitanism (e.g., proportion of ethnic minorities) independent of the cities’ population size. These findings suggest that cosmopolitanism is a coherent construct.
Examples of cosmopolitan cities include Chicago and Boston in the U.S., Berlin and London in Europe, and cities in other parts of the world such as Singapore and Buenos Aires. Although cosmopolitan cities most often are large metropolitan areas, examples of cosmopolitan places also include smaller cities such as Edinburgh in the UK, or Asheville, North Carolina. In recent decades, many cosmopolitan cities received an influx of migrants from other regions (Ihrke et al., 2011).
Migration to Cosmopolitan Cities
Cities in general, and cosmopolitan cities in particular, symbolize opportunities for individual success, freedom, and self-realization (Yamagishi et al., 2012). As a result, they tend to attract people with certain personal attributes. First, cosmopolitan cities attract people with an independent (vs. interdependent) social orientation (Sevincer et al., 2015, 2019). People with an independent orientation prefer personal (vs. relational and collective) goals, uniqueness (vs. conformity), and weak (vs. strong) subjective connectedness to others (Markus & Kitayama, 1991; Oettingen et al., 2008; Varnum et al., 2010). Second, cosmopolitan cities also attract people who are high on the personality trait openness to experience (Allik et al., 2009; Jokela et al., 2015; Rentfrow et al., 2008; Sevincer et al., 2017). People who are open to experience prefer novelty (vs. familiarity), variety (vs. uniformity), and change (vs. stability). Cosmopolitan cities afford more opportunities to express and fulfill these goals and preferences.
The findings that people high in independence and openness to experience feel inclined to settle in cosmopolitan cities are broadly in line with research on frontier settlement. This research suggests that people oriented toward independence settle in places that symbolize economic opportunities, self-realization, and freedom (Feng et al., 2017; Ishii, 2014; Kitayama et al., 2009, 2010; Varnum & Kitayama, 2011). Indeed, some have argued that in fact cosmopolitan cities can be thought of as a modern day frontier in which boundaries are defined not by geography, but by economical, technological, and societal advancements (Kitayama et al., 2014).
The Present Research: Cosmopolitan Cities and Risk-Taking
We go beyond previous research by exploring whether cosmopolitan cities not only attract people high in independence and people high in openness to experience but also those high in risk-taking. Specifically, we propose that the combination of economic and creative opportunities with diversity and equality in cosmopolitan cities attract people who are more (vs. less) willing to take risks.
Cosmopolitan cities provide economic opportunities, in particular on the cutting-edge of the finance, technology, fashion, and media businesses (Glaeser, 2011). These industries offer the potential for high returns but are also associated with a high risk of failure. Indeed, endeavoring in new business opportunities requires the readiness to accept risks (Slovic, 2000) and people who intend to launch their careers in such businesses are generally high in risk-taking (Rauch & Frese, 2000; Simon et al., 2000). Therefore, the economic opportunities in cosmopolitan cities should attract people willing to take risks.
Cosmopolitan cities are also hubs for creativity such as innovations and the art scene. This emphasis of innovations, in turn, may diminish parochial norms regarding ethnic or national traditions and traditional gender roles, which would further attract those who seek to go beyond such norms (Aldrich, 2004). However, innovations may not catch on and new trends in the arts may fade quickly. Indeed, being creative involves some risk-taking (Feist, 1989; Sternberg, 2006) and people who work in creative domains tend to be high in risk-taking (Dewett, 2006, El-Murad & West, 2003). Therefore, the opportunities for creativity in cosmopolitan cities should attract people willing to take risks.
Overview of Studies
First, to establish whether risk-taking is indeed more common in more (vs. less) cosmopolitan cities, we correlated population-level indicators of risk-taking behaviors (e.g., number of car accidents) with the degree of cosmopolitanism of the biggest U.S. cities (Study 1). Then, to test our main hypothesis that people high in risk-taking prefer settling in more rather than less cosmopolitan cities, we examined whether higher risk-taking measured by self-report (Study 2a) is related to a greater preference to move to more (vs. less) cosmopolitan cities and whether the hypothesized relationship holds true when controlling for independence and openness to experience (Study 2b). We also examined whether the hypothesized relationship emerges when measuring risk-taking by observed behavior rather than self-report (Study 3). Finally, we investigated whether manipulating focus toward risk-taking causally leads people to prefer cosmopolitan cities (Study 4).
Study 1: Real World Risk-Taking in Cosmopolitan Cities
As a first step, we examined whether real-world risk-taking behaviors are more prevalent in more cosmopolitan cities by comparing city-level indicators of risk-taking in the domains of career/finance and safety/health to the cities’ cosmopolitanism. We used an index of perceived cosmopolitanism as rated by U.S. participants (Sevincer et al., 2015) and an aggregated index of objective cosmopolitanism (Sevincer et al., 2017). We predicted that risky behaviors would be more prevalent in more cosmopolitan cities, particularly in career/finance. 1
Method
We used data on the 30 largest U.S. cities (see the Supplemental Material).
Risk-taking
All indicators were obtained as a proportion of inhabitants in each city to control for population size. For each indicator we used data from the most recent year for which data was available. The data was from the years between 2010 and 2018.
Risk-taking in career/finance
Start-ups
Because launching a new business entails considerable risks, for example in the U.S., 25% of businesses failed after the first year (Statistic Brain, 2012), we took the number of start-ups per 1000 firms in each city (Kauffman, 2018).
Entrepreneurs
Because entrepreneurs tend to be more risk-taking than the general population (Rauch & Frese, 2000), we used the percentage of inhabitants who became entrepreneurs per month (Fairlie et al., 2015).
Credit-card debts
Because accumulating debts is related to risk-taking, sensation seeking, and impulsiveness (Wang et al., 2011), we used the average credit-card debt per inhabitant (Brown, 2017).
Risk-taking in safety/health
Car accidents
Because the strongest determinant of accident likelihood is risky driving behavior (Jonah, 1986), we used the relative car-accident likelihood compared to the national average (Allstate, 2016).
Insurance claims
Because the number of claims is related to people’s risk-taking propensity (Machin & Sankey, 2008), we used the likelihood of insurance claims, indexed by the average number of years between claims (reverse coded; Allstate, 2016).
Drug use
Because illicit drug use is associated with greater risk-taking (Adlaf & Smart, 1983), we took the percentage of inhabitants age 12 or older who reported using drugs in a given year (U.S. Department of Health and Human Services, 2012).
HIV rate
Because most HIV infections are due to risky practices such as unsafe sex, we used the HIV rate per 1,00,000 inhabitants (Big Cities Health Coalition, n.d.).
Teen births
Because most teenage pregnancies are unwanted (Finer, 2010), suggesting risky sexual behavior, we used the rate of teen births per 100.000 inhabitants (calculated from the absolute number of teen births; Kids Count Data Center, 2018).
Cosmopolitanism
Perceived cosmopolitanism
We used data from Sevincer et al. (2017) on the rated cosmopolitanism of the various cities. Sevincer et al. (2017) presented participants from the U.S. with the biggest U.S. cities and asked them rate the perceived cosmopolitanism of each city using the Cosmopolitan City Scale (CCS). The scale consists of nine statements (e.g., “is a multicultural city”), and participants indicated how much each statement applies to each city (7-point scale; 1 = does not apply at all; 7 = applies very much). For each city, the ratings for the nine items were then aggreated into an index of perceived cosmopolitanism of that city. The ratings of perceived cosmopolitanism for each city used here is presented in the Supplemental Material.
Objective cosmopolitanism
We created an aggregated index of objective cosmopolitanism using the city-level indicators from Sevincer et al. (2017). Sevincer et al. (2017) correlated 22 objective indicators of cosmopolitanism with participants’ perceived cosmopolitanism of the 30 largest U.S. cities. Of these 22 indicators, we used all indicators that correlated significantly positively with perceived cosmopolitanism and that were not rank-order data (two were available as rank-order data only). Specifically, we used the following 16 indicators: proportion of self-employed workers, number of companies, per capita income, median household income, median family income, proportion of inhabitants from minority ethnic groups, proportion of foreign-born inhabitants, proportion of gay and lesbian people, number of international immigrants, number of patents generated, proportion of members of the supercreative class, proportion of people with a university degree, number of universities/colleges, intergenerational mobility, proportion of people with a bohemian lifestyle, number of museums. Of the 16 indicators five were available in absolute numbers only (firms, international migrants, patents, universities/colleges, museums). To take the population size of the cities into account, all indicators were obtained as the proportion relative to the population size. We z-transformed and combined the indicators into one overall index (α = .87).
Results
Risk-taking in career/finance
As can be seen in Table 1, all three indicators correlated positively with perceived cosmopolitanism (start-ups, entrepreneurs, and debts marginally) and two of the three indicators correlated positively with objective cosmopolitanism (entrepreneurs and debts). Scatterplots depicting the correlation between the three risk-taking indicators in career/finance and cosmopolitanism can be found in the Supplemental Material.
Study 1: Means, Standard Deviations, and Correlations among the Measures.
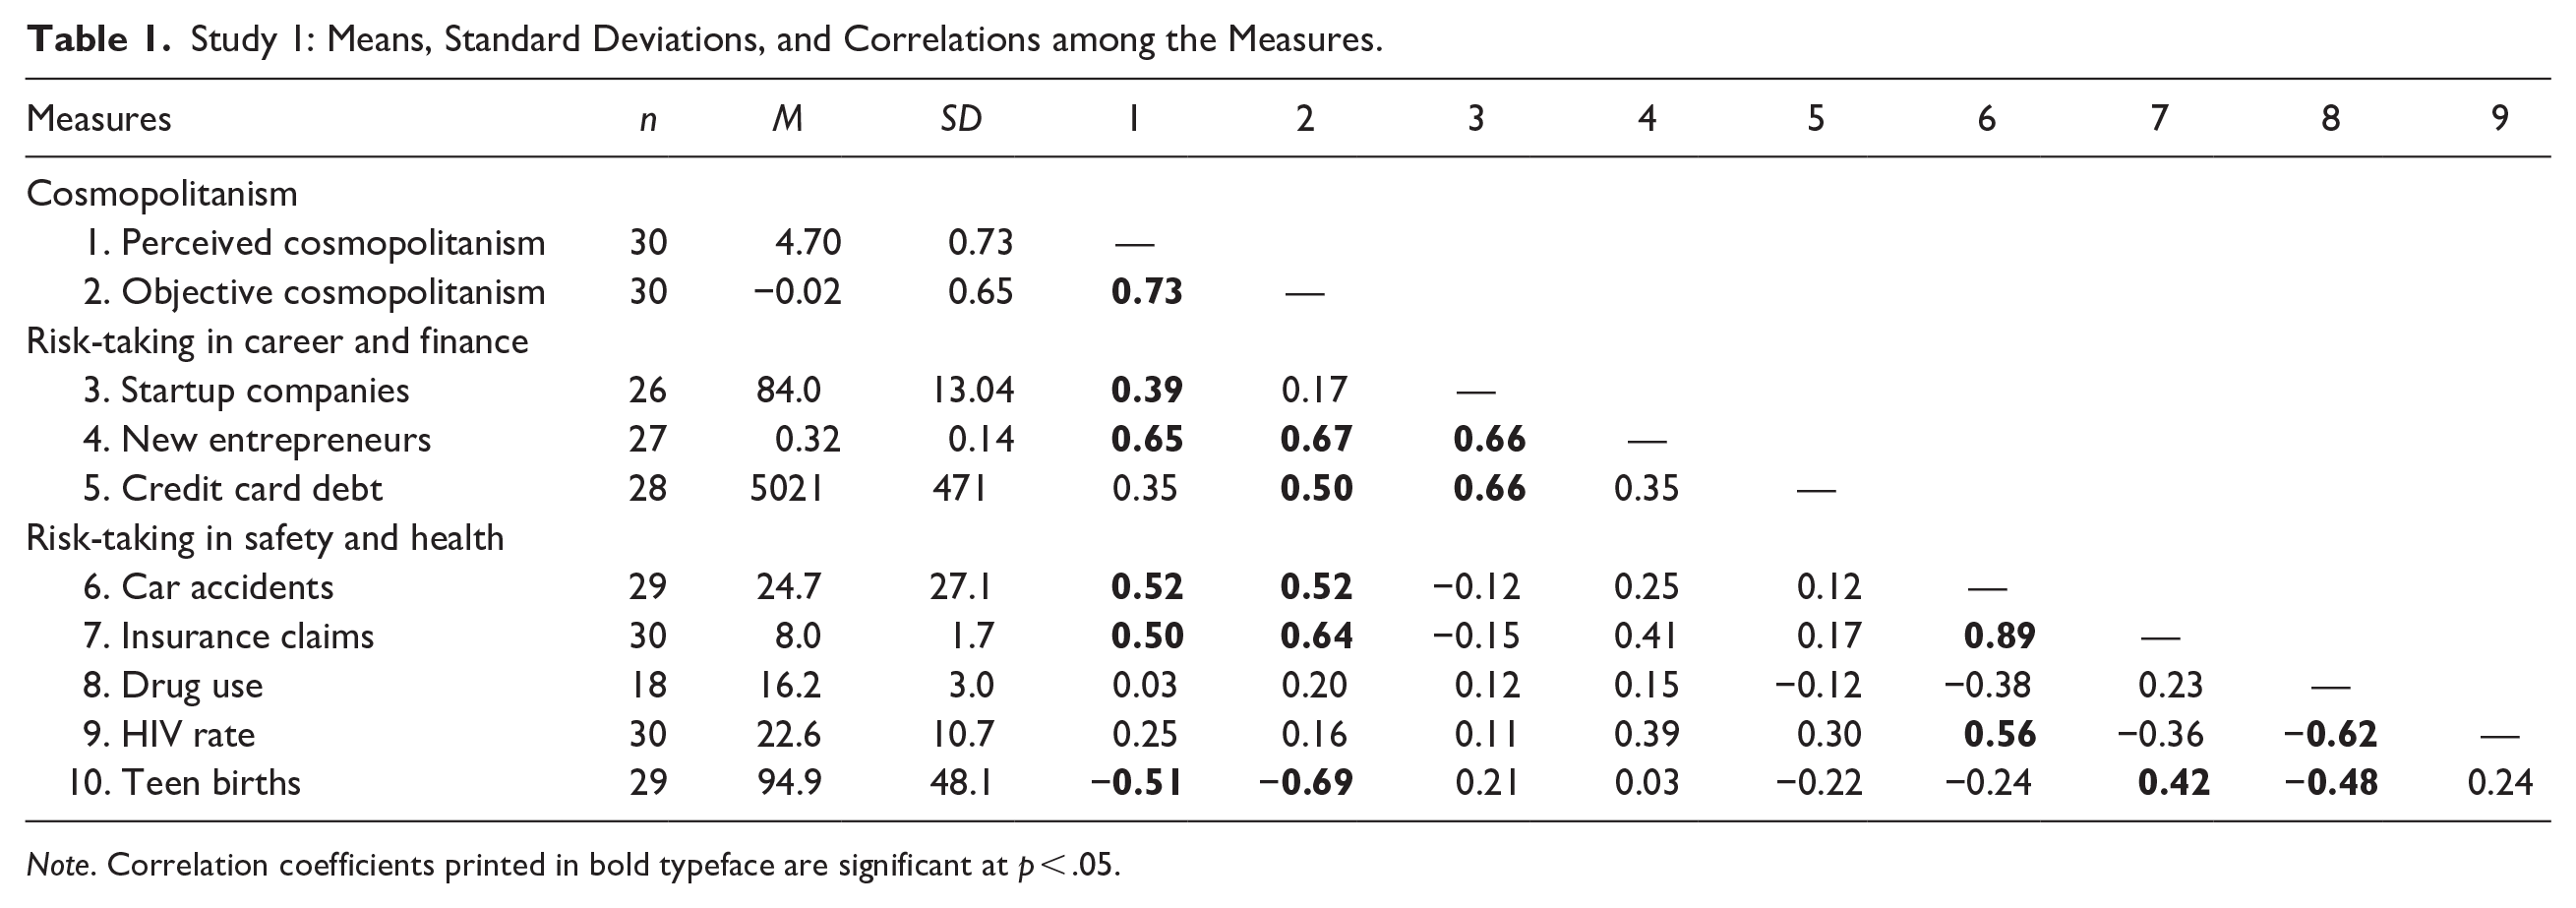
Note. Correlation coefficients printed in bold typeface are significant at p < .05.
Risk-taking in safety/health
As can also be seen in Table 1, two of the five indicators correlated positively with perceived cosmopolitanism (car accidents, insurance claims), two (drug use, HIV rate) were not correlated with perceived cosmopolitanism, and one (teenage births) was negatively correlated with perceived cosmopolitanism. The pattern was the same for objective cosmopolitanism.
Discussion
Risk-taking in career/finance correlated positively with the cosmopolitanism of the 30 largest U.S. cities (start-ups correlated only with perceived but not objective cosmopolitanism). Apparently, risk-taking in this domain is more prevalent in more cosmopolitan cities. A mixed pattern emerged for risk-taking in the safety/health domain. Two of the five indicators (car accidents and insurance claims) correlated positively with cosmopolitanism, two (drug use and HIV rate) were not correlated with cosmopolitanism, and one (teenage births) was negatively correlated with cosmopolitanism. We speculate that because cosmopolitan cities (e.g., Boston) tend to be more wealthy than less cosmopolitan ones (e.g., Detroit; Sevincer et al., 2017), and some forms of risk-taking are less prevalent in higher than in lower socioeconomic classes (e.g., HIV rates, Pellowski et al., 2013), these forms do not correlate positively with cosmopolitanism but may even correlate negatively (teenage births). Having established that certain types of risk-taking behaviors are more common in more (vs. less) cosmopolitan cities, we then explored whether high risk-takers prefer cosmopolitan cities as the destination of a potential residential move.
Study 2a: Trait Risk-Taking and Preference for Self-Perceived Cosmopolitan Cities
Study 2a investigated whether people high in trait risk-taking as measured by the General Risk Aversion Scale (GRA; Mandrik & Bao, 2005) prefer moving to cities that are more cosmopolitan. To measure preference for cosmopolitan cities, we used a scenario method by Sevincer et al. (2017). Because greater preference for cosmopolitan cities is related to higher socioeconomic status (SES; Sevincer et al., 2017) and because people may prefer moving to cities that are similar to the city where they currently live, following Sevincer et al. (2015), we controlled for participants’ SES 2 and the cosmopolitanism of their current city. Moreover, because men tend to take more risks than women and risk-taking declines with older age, in this and all following studies, we controlled for gender and age (see Supplemental Material). Further, to explore whether high risk-takers feel attracted to the cosmopolitan culture of the cities rather than their size, we also controlled for the population size of participants’ preferred cities (see also the Supplemental Material).
Method
Participants and design
We recruited 605 participants from across the U.S. (299 male, 304 female, two unidentified, Mage = 38.58, SD = 12.59) for an online study on residential preferences via MTurk. Power calculations yielded that we attained 96% power to detect a small effect (r = .15; Faul et al., 2007). We report demographic information for this and all following studies in the Supplemental Material. Participation was voluntary and participants indicated their consent by clicking a button. They received $0.50. We used a cross-sectional, correlational design.
Procedure
Trait risk-taking
We used the GRA (Mandrik & Bao, 2005). We combined the six items (e.g., “I do not feel comfortable about taking chances”) into an overall index (α = .82; reverse-coded, higher numbers indicate greater risk-taking). 3
Attention check
Within the GRA, we included an attention-check question (“When you read this, please choose 2”).
Preference for cosmopolitan cities
Following Sevincer et al. (2017), we asked participants to list the three cities in the U.S. they would move to if they had to leave their current city. Because whether people feel attracted to a certain city may depend on what this city idiosyncratically symbolizes to them rather than what it symbolizes to others (Phillips & Brunn, 1978), following Sevincer et al. (2017) we asked participants to self-rate the cosmopolitanism of their preferred cities on a continuous scale. Specifically, participants rated the perceived cosmopolitanism of each city using the CCS described above. For each of participants’ three preferred cities, we averaged the nine items (αs = .94, .94, .93). Because the three averaged scores correlated positively (rs = .71, .59, .58), we combined them into one indicator of cosmopolitan preference (α = .84). Finally, participants completed a demographic questionnaire.
Cosmopolitanism of participants’ current city
To control for the cosmopolitanism of participants’ current city we asked participants to complete the CCS (Sevincer et al., 2017) for their current place of residence. Finally, participants completed a demographic questionnaire.
Results
Descriptives
See Table 2. Fourteen participants who did not list a city and nine who failed the attention check were excluded.
Studies 2a, 2b, 3, and 4: Means, Standard Deviations, and Correlations Among the Measures.
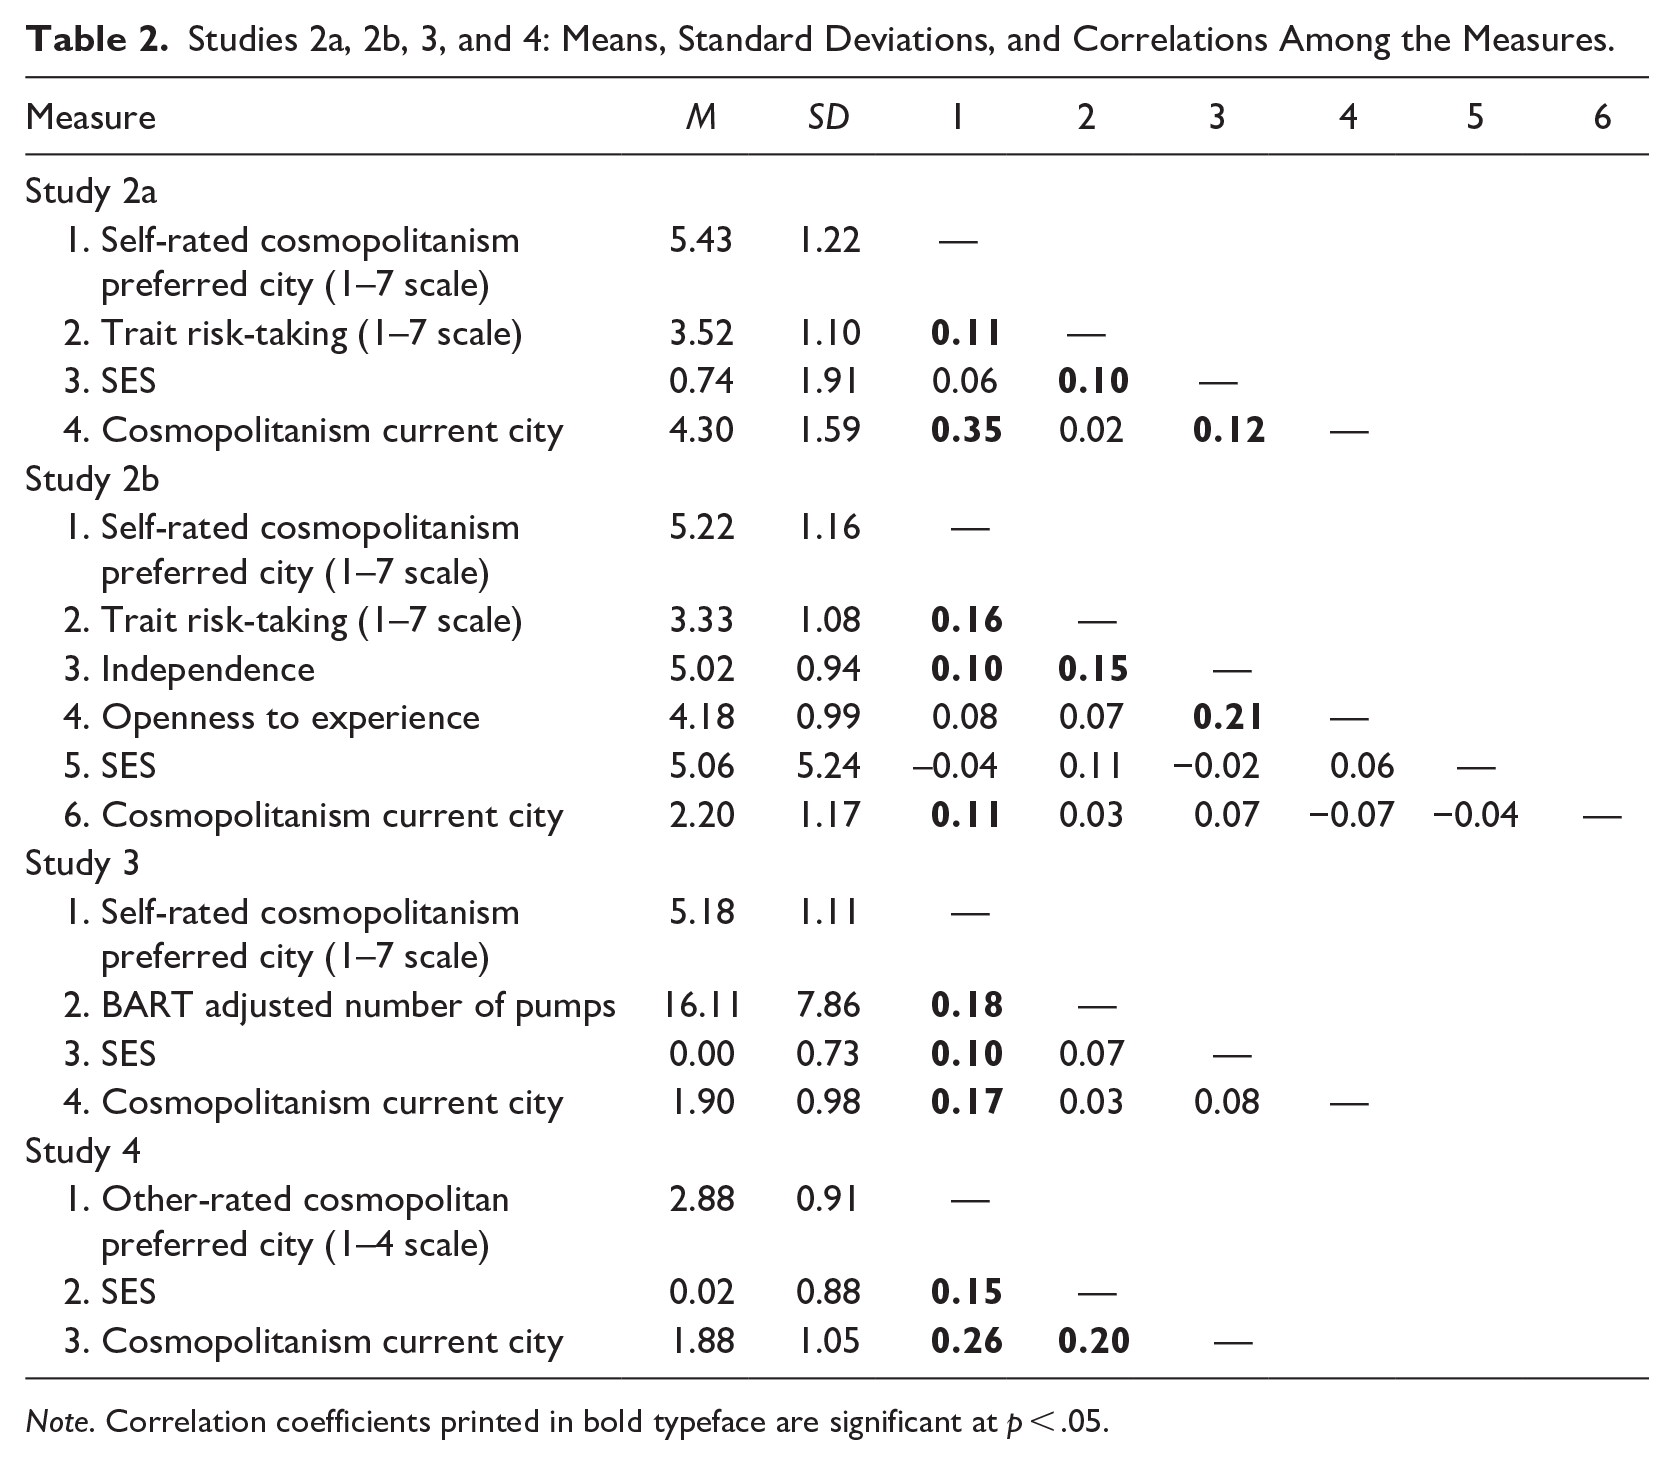
Note. Correlation coefficients printed in bold typeface are significant at p < .05.
Trait risk-taking and preference for cosmopolitan cities
As hypothesized, higher risk-taking predicted participants’ CCS score, β = .11, p = .008, 95% CI [.03, .21], r = .110. The higher participants’ trait risk-taking, the more cosmopolitan were their preferred cities. When we added SES and the self-rated cosmopolitanism of participants’ current city as predictors (Table 3), greater cosmopolitanism of participants’ current city predicted greater cosmopolitan preference. Risk-taking continued to predict cosmopolitan preference.
Study 2a: Summary of Hierarchical Regression Analyzes for Trait Risk-Taking and the Control Variables (SES and Cosmopolitanism of Participants’ Current City) Predicting Preference for Cosmopolitan Cities (Measured by the CSS).
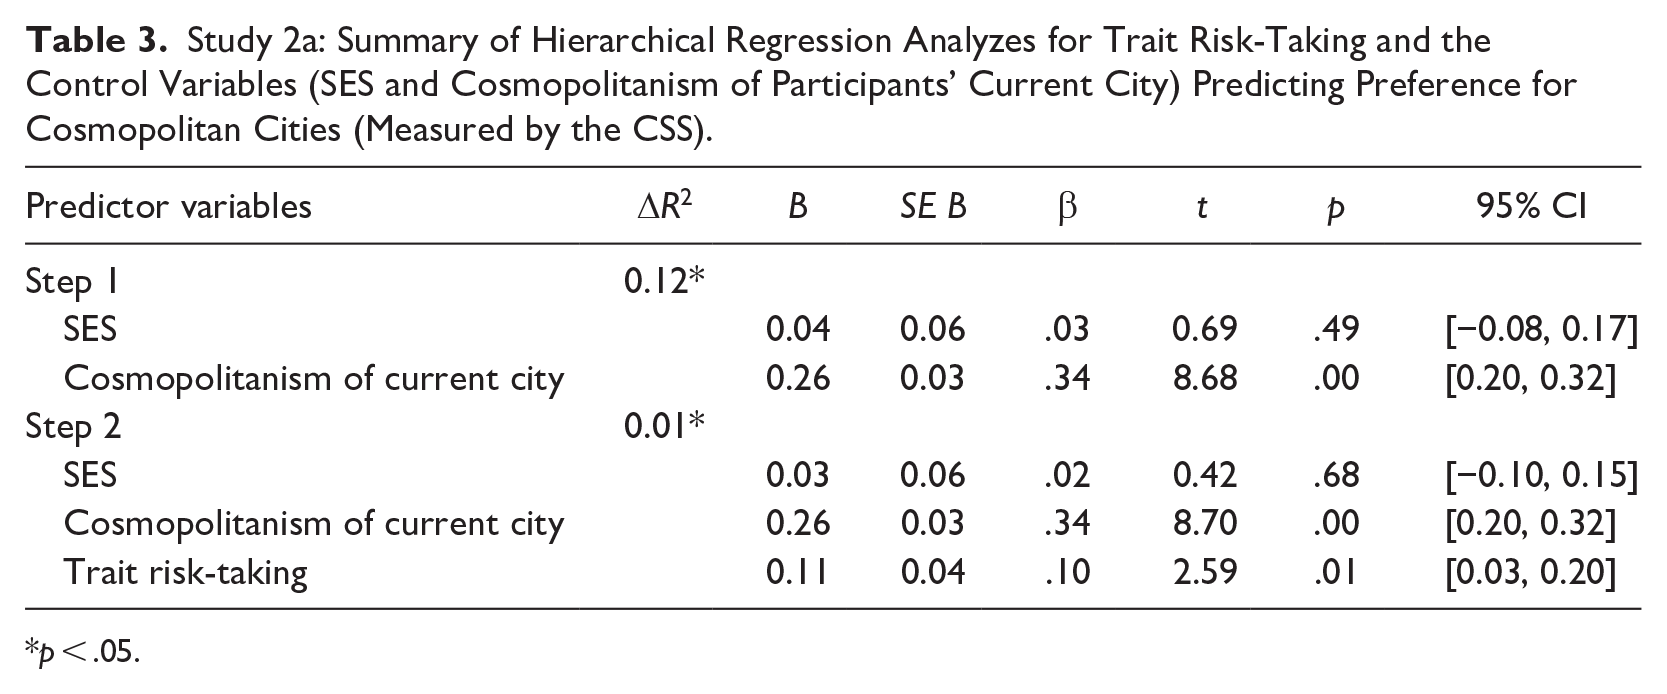
p < .05.
Discussion
The higher participants’ trait risk-taking, the more cosmopolitan were the cities they named as the preferred destinations of a potential residential move. This relationship remained robust over and above participants’ SES and the self-rated cosmopolitanism of their current city. Because in previous research people high in independence and those high in openness to experience preferred more (vs. less) cosmopolitan cities as their residential destinations (Sevincer et al., 2017), we conducted Study 2b to examine whether the relationship between trait risk-taking and preference for cosmopolitan cities remains robust over and above independence and openness to experience.
Study 2b: Trait Risk-Taking, Independence, Openness to Experience and Preference for Self-Perceived Cosmopolitan Cities
Method
Participants and design
We recruited 504 participants from across the U.S. (229 female, 271 male, four unidentified, Mage = 34.6, SD = 20.4) via MTurk for a study on residential preferences. Power calculations yielded that we attained 93% power to detect a small effect (r = .15). We preregistered the study on www.aspredicted.org (#51381). Participation was voluntary and participants indicated their consent to participate by clicking a button. They received $1.00 for their participation. The study used a cross-sectional correlational design.
Procedure
Trait risk-taking
As in Study 2a, we used the GRA (Mandrik & Bao, 2005). We combined the six items into an overall index (α = .79; reverse-coded).
Independence
We used the independence subscale of the Self-Construal Scale (SCS; Singelis, 1994). The subscale consists of 12 items (e.g., “I am comfortable with being singled out for praise or rewards”). Internal consistency was α = .83.
Openness to experience
We used the openness to experience subscale of the Big Five Inventory 10 (BFI-10; John & Srivastava, 1999). The scale consists of two items (e.g., “I see myself as someone who has an active imagination”). Following John and Srivastava, we averaged the two items (r = .35, p < .0001) into one indicator of openness to experience.
Preference for cosmopolitan cities
We used the same measure as in Study 2a. Reliabilities (αs) for averaging the nine CCS items for each of the three preferred cities were .93, .92, and .92. The three scores correlated positively (rs = .54, .58, and .59). Thus, we averaged them into one indicator of cosmopolitan preference (α = .80).
Results
Descriptives
See Table 2. Twenty-two participants who did not list a city and twenty-four who failed the attention check were excluded.
Trait risk-taking and preference for cosmopolitan cities
We performed analogous analyzes as in Study 2a. Higher risk-taking predicted participants’ CCS score, β = .17, p < .0005, 95% CI [.08, .27]. When we added SES, the self-rated cosmopolitanism of participants’ current city, independence, and openness to experience as predictors (Table 4), greater cosmopolitanism of participants’ current city predicted, and greater independence tended to predict greater cosmopolitan preference. Risk-taking continued to predict cosmopolitan preference.
Study 2b: Summary of Hierarchical Regression Analyzes for Trait Risk-Taking, Independence, Openness to Experience as well as SES and Cosmopolitanism of Participants’ Current City) Predicting Preference for Cosmopolitan Cities (Measured by the CSS).
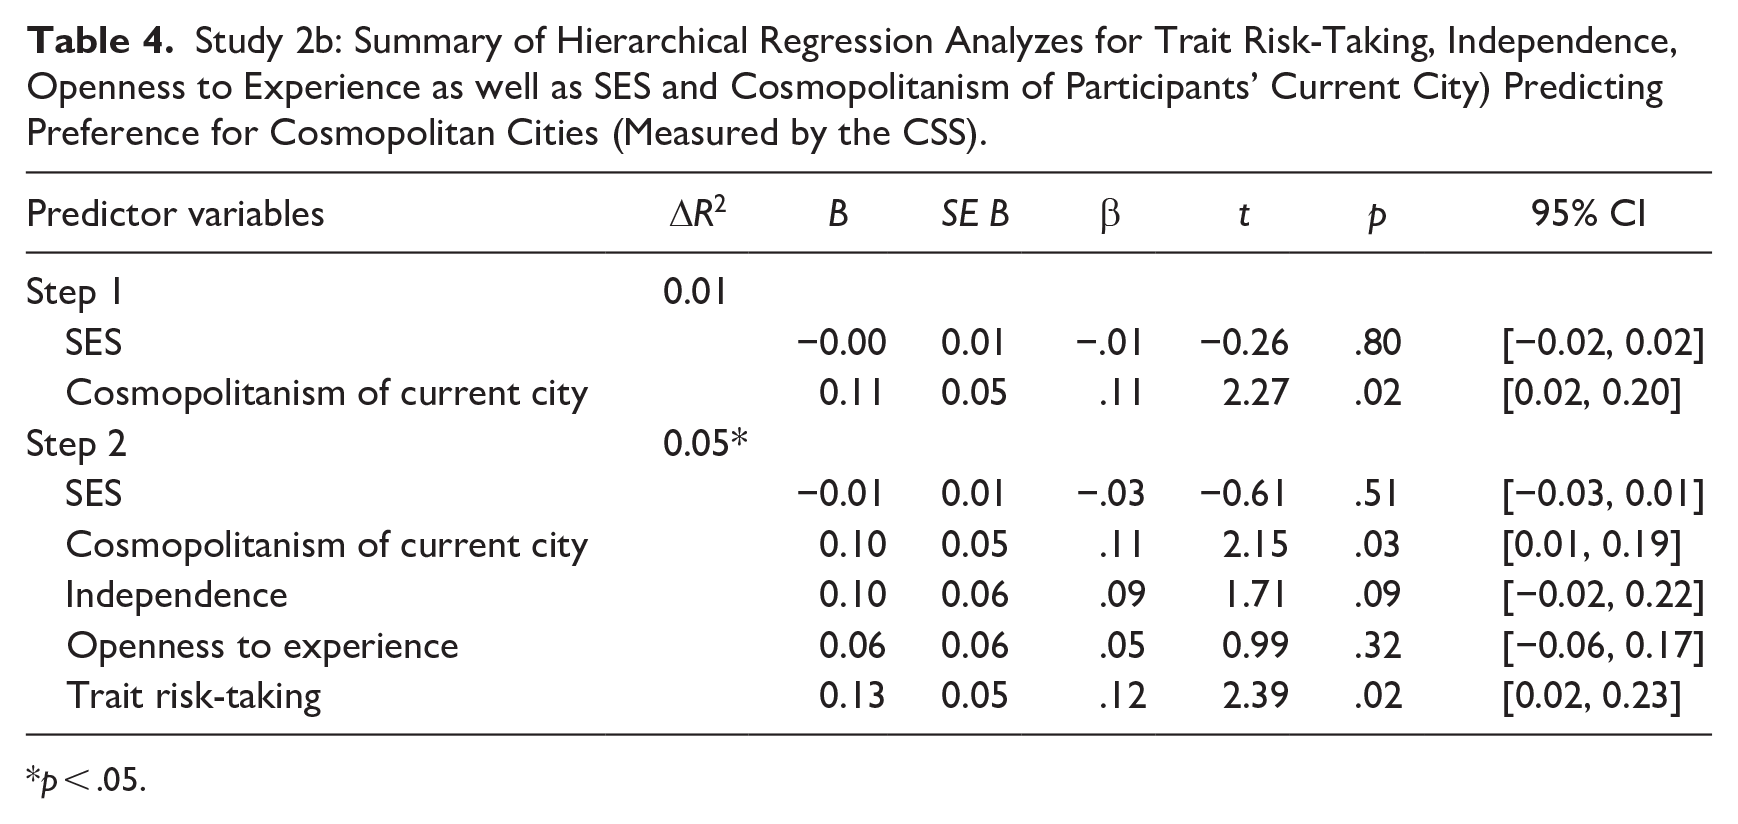
p < .05.
Discussion
As in Study 2a, higher trait risk-taking predicted a greater preference for cosmopolitan cities. Of importance, this relationship remained robust over and above participants’ independence and their openness to experience (and SES and the self-rated cosmopolitanism of their current city). Study 2b thus extends the findings of Study 2a by showing that risk-taking has unique predictive power over and above independence and openness to experience.
In Studies 2a and 2b, we measured trait risk-taking by self-report. To investigate whether the pattern also emerges when we observe participants’ risk-taking behavior, in Study 3, we assessed risk-taking behavior using a behavioral measure, the computerized Balloon Analogue Risk Task (BART; Lejuez et al., 2002).
Study 3: Risk-Taking Behavior and Preference for Cosmopolitan Cities
Method
Participants and design
We recruited 400 participants from across the U.S. (201 female, 197 male, two unidentified, Mage = 41.18, SD = 10.79) via MTurk for a study on gambling and residential preferences. We estimated sample size on the basis of a predecessor study (Pilot Study to Study 3, reported on https://osf.io/r4qtg/) which yielded an effect size of r = .16 for the relationship between risk-taking behavior, measured by the BART, and preference for cosmopolitan cities. Using this effect size as the benchmark, Study 3 achieved a power of 90%. We preregistered Study 3 on www.aspredicted.org (#28374). Participation was voluntary and participants indicated their consent by clicking a button. They received $1.00. The study used a cross-sectional correlational design.
Procedure
Observed risk-taking behavior
We used an online version of the BART (Gnambs et al., 2015). Risk-taking as measured by the BART correlates with self-reported risk-taking behaviors in real life (Fernie et al., 2010; Lejuez et al., 2003), and with risk-taking as assessed by other behavioral and self-report measures of risk-taking (e.g., impulsivity; Lejuez et al., 2002; Xu et al., 2013). On the first page, participants learned they will be successively presented with 20 balloons on the screen. We chose 20 trials because the task’s reliability does not increase with more trials (Wallsten et al., 2005). Participants also learned that by clicking the mouse, they could inflate the balloon. Each pump would inflate the balloon a little more and with each pump participants earn one point. The balloon would explode when it reached a certain size. Participants did not know when the balloon would explode. If the balloon exploded, participants would lose their points from that trial. Participants were instructed to earn as many points as they can and they were also informed that the participant who earned the most points wins $30. Previous studies used similar reward schemes as we did (Fernie et al., 2010; Lejuez et al., 2003). Following Lejuez et al. (2002), we took the adjusted number of pumps (the total number of pumps from trials in which the balloon did not explode) as an indicator for risk-taking behavior.
Preference for cosmopolitan cities
We used the same measure as in Studies 2a and 2b. Reliabilities (αs) for averaging the nine CCS items for each of participants’ three preferred cities were .94, .93, and .93. The three scores correlated positively (rs = .54, .53, and .52). Thus, we averaged them into one index (α = .77).
Cosmopolitanism of participants’ current city
We asked participants to name their current city. Two independent raters coded the named cities for their overall cosmopolitanism. To code the cities, they were provided with our definition of cosmopolitan cities as cities that offer economic opportunities, are ethnically and socially diverse, and embrace creativity and equality. The raters used a 4-point scale (1 = not at all cosmopolitan, e.g., Burlington; 4 = very cosmopolitan, e.g., Chicago). Agreement was α = .94. If the raters disagreed, we averaged the two ratings.
Results
Descriptives
See Table 2. Two participants who did not list any cities were excluded.
Observed risk-taking and preference for cosmopolitan cities
As hypothesized, the number of adjusted pumps in the BART predicted participants’ CSS score, β = .18, p = .0003, 95% CI [.01, .04]. As in Studies 2a and 2b, we added SES and the cosmopolitanism of participants’ current city as predictors. Greater cosmopolitanism of participants’ current city predicted greater preference to move to cosmopolitan cities and the adjusted BART score continued to predict a greater preference to move to cosmopolitan cities (Table 5).
Study 3: Summary of Hierarchical Regression Analyzes for Observed Risk-Taking and the Control Variables (SES and Cosmopolitanism of Participants’ Current City) Predicting Preference for Cosmopolitan Cities.
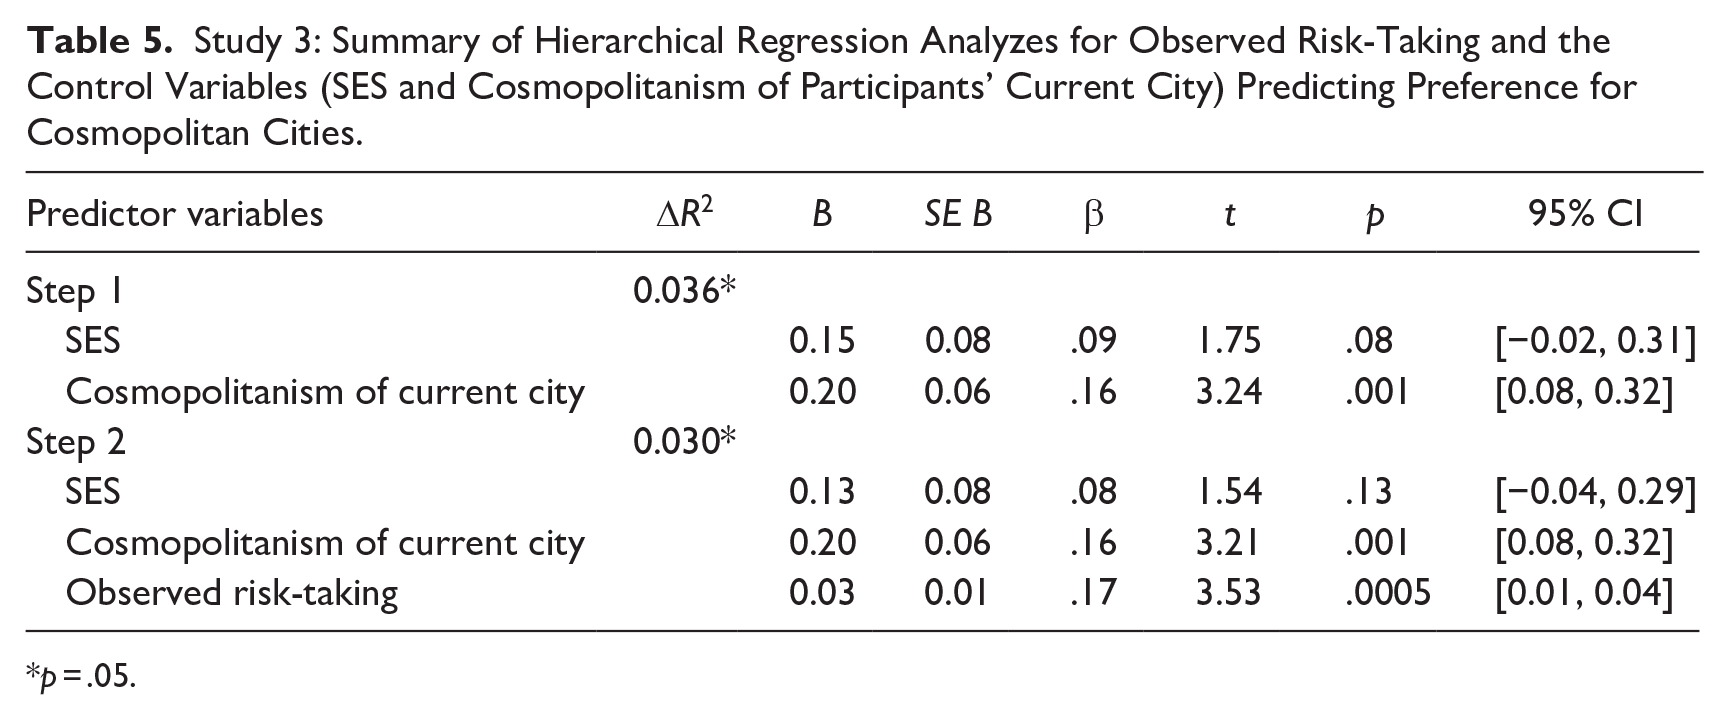
p = .05.
Discussion
Participants who demonstrated greater risk-taking, as measured by their observed risk-taking in the BART, preferred cities they perceived as more cosmopolitan as the destination of a possible residential move. As in Studies 2a and 2b, the relationship remained robust when controlling for SES and the cosmopolitanism of participants’ current city. All evidence presented thus far is correlational. Therefore, in Study 4, we examined whether manipulating participants’ focus toward seeking versus avoiding risk causes a greater preference for cosmopolitan cities.
Study 4: Manipulating Risk-Taking
To manipulate emphasis on risk-taking, we used a promotion/prevention-orientation manipulation (Freitas & Higgins, 2002). People with a promotion focus are concerned with improvement; they focus on aspirations, mastery, and growth. Those with a prevention focus, by contrast, are concerned with maintenance; they focus on responsibilities, safety, and security (Higgins, 1998). A chronic promotion focus is associated with higher risk-taking and a prevention focus with lower risk-taking (e.g., reckless vs. careful driving; Crowe & Higgins, 1997; Hamstra et al., 2011). Moreover, temporarily inducing a promotion (vs. prevention focus) led to more favorable attitudes toward risk-taking (e.g., cheating on an exam; Gino & Margolis, 2011; summary by Cornwell & Higgins, 2018). We hypothesized that participants induced with a promotion focus should show a stronger preference for cosmopolitan cities, those induced with a prevention focus should show a weaker preference.
Method
Participants and design
We recruited 510 participants from across the U.S. (232 female, 269 male, nine unidentified, Mage = 35.28, SD = 14.53) via MTurk for a study on personal aspirations or obligations and residential preferences. Power calculations yielded that Study 4 obtained 93% power to detect a small effect (r = .15). Participation was voluntary and participants indicated their consent by clicking a button. Participants received $0.50. They were randomly assigned to one of three conditions (promotion, prevention, and control).
Procedure
Promotion/prevention-focus manipulation
Participants in the promotion condition were asked to list three hopes or aspirations (“own a business”), those in the prevention condition listed three duties or obligations (“pay bills”), and those in the control condition were not asked to list any terms (Freitas & Higgins, 2002).
Preference for cosmopolitan cities
As in Studies 2a, 2b, and 3, participants listed their three preferred destination cities if they had to move from their current city. This time however, rather than asking participants to self-rate the cosmopolitanism of their preferred cities, to examine whether the hypothesized results would also emerge when we measured the cosmopolitanism of participants’ preferred cities as perceived by independent observers, two independent raters coded the listed cities for cosmopolitanism. The raters were provided with our definition of cosmopolitan cities and used the same 4-point scale (1 = not at all cosmopolitan, 4 = very cosmopolitan) that we also used to measure the cosmopolitanism of participants current cities in Studies 2a, 2b, and 3. Agreement was α = .96. If the raters disagreed, we averaged the two ratings. The cosmopolitanism ratings of the three cities were averaged into one cosmopolitan preference index.
Cosmopolitanism of Participants’ Current City
As in Studies 2a, 2b, and 3, we also measured the cosmopolitanism of participants’ current city by asking two independent raters code the named cities for cosmopolitanism using a 4-point scale (1 = not at all cosmopolitan; 4 = very cosmopolitan). Agreement was α = .94. If the raters disagreed, we averaged the two ratings. Finally, participants completed a demographic questionnaire.
Results
Descriptives
See Table 2. Neither SES nor the cosmopolitanism of participants’ current city differed between conditions, Fs < 1.63, ps > .198. Six participants who did not list any cities were excluded.
Effect of promotion/prevention-focus on preference for cosmopolitan cities
A one-way ANOVA yielded that participants’ cosmopolitan preference index differed between the three conditions (promotion, prevention, and control), F(2, 495) = 4.26, p = .015. Planned contrasts revealed that participants in the prevention condition listed cities that were less cosmopolitan (M = 2.71, SD = .93) than those in the promotion condition (M = 2.97, SD = .88), t(325) = 2.57, p = .011, 95% CI [0.06, 0.46], d = .28 and the control condition (M = 2.96, SD = .89), t(328) = 2.47, p = .014, 95% CI [0.05, 0.45], d = .27. The promotion condition and the control condition did not differ, t(337) = 0.11, p = .92.
As in Studies 2a, 2b, and 3, we examined whether the observed results remained robust when controlling for participants’ SES and the cosmopolitanism of their current city. We estimated a GLM with the coded cosmopolitanism of participants’ preferred cities as the dependent variable. We entered the dummy-coded condition variable (prevention vs. promotion) as random factor, and SES and the cosmopolitanism of participants’ current city as covariates. SES did not predict cosmopolitan preference, F(1, 305) = 1.00, p = .318. Greater cosmopolitanism of participants’ current city predicted a greater cosmopolitan preference, F(1, 305) = 18.78, p < .0001. Prevention (vs. promotion) focus predicted lower cosmopolitan preference, F(1, 305) = 4.38, p = .037, 95% CI [0.01, 0.41], d = .24.
We conducted analogous analyzes for the observed difference in preference for cosmopolitan cities between the prevention and the control condition. Higher SES and greater cosmopolitanism of participants’ current city predicted a greater cosmopolitan preference, Fs > 4.96, p = .027, and p = .0002, respectively. Prevention (vs. control) did not predict cosmopolitan preference, F(1, 300) = 1.62, p = .204.
Discussion
When asked to list three cities they would prefer to move to, participants induced with a prevention focus listed cities that were less cosmopolitan than those induced with a promotion focus and those in the control condition. The latter difference became nonsignificant when controlling for SES and the cosmopolitanism of participants’ current city, however. Thus, this study provides some evidence that inducing a prevention focus reduced the attractiveness of cosmopolitan cities as places to live. It did not provide evidence however that inducing a promotion focus increased the attractiveness of such cities.
As for why the observed effect was driven by the prevention rather than promotion focus manipulation, we speculate that because people’s chronic focus tends to be promotion rather than prevention (Lockwood et al., 2002), the promotion focus manipulation was more in line with participants’ chronic focus than the prevention focus manipulation. Therefore, the prevention condition may have lowered participants’ preference for cosmopolitan cities whereas the promotion condition had no effect.
Meta-Analysis
To estimate the average effect size for the relationship between risk-taking and preference for cosmopolitan cities, we conducted a meta-analysis. The meta-analysis also included four pilot studies, reported in an online repository (available at: https://osf.io/r4qtg/). We used the correlation coefficients between the indicators of risk-taking and the measures of preference for cosmopolitan cities. We converted each coefficient to Fisher’s Z and calculated the variance for each Fisher’s Z, following Borenstein et al. (2009).
For Studies 2a and 2b, we used the correlation between trait risk-taking and the cosmopolitanism of the chosen cities, r(603) = .11, and r(458) = .16, respectively. For Study 3, we used the correlation between observed risk-taking behavior and the cosmopolitanism score, r(396) = .18. And for Study 4, we used the point-biserial correlation between the prevention focus condition (vs. the control condition) and the cosmopolitanism score, r(328) = .14. The average effect size weighted for sample size across studies was r = .14, 95% CI [.10, .18] (Figure 1), which is a small effect (Cohen, 1988).
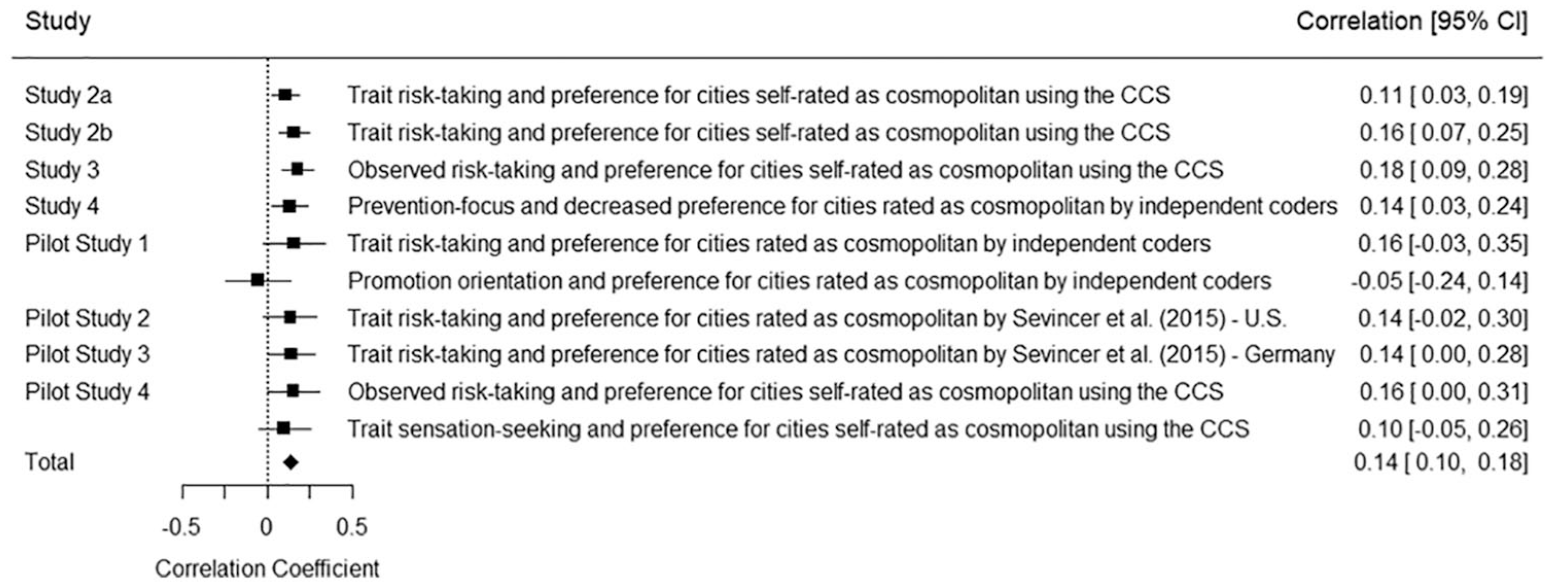
Meta-analysis for the four individual-level studies (Studies 2a, 2b, 3, and 4) reported in the main text and the four pilot studies. Error bars in the forest plot indicate 95% confidence intervals (CIs) around the effect sizes.
General Discussion
After providing evidence that real-world risk-taking behaviors, particularly in the domain of career/finance, are more common in more cosmopolitan cities (Study 1), we showed that people who are inclined to take risks feel attracted to cosmopolitan cities (Studies 2a, 2b, 3, and 4). Importantly, the relationship between risk taking and preference for cosmopolitan cities was observed even when risk-taking was assessed with a standard behavioral measure. In summary, we tested the relationship between risk-taking and cosmopolitan cities using different designs (correlational and experimental), different indicators of risk-taking (self-reported, observed behavior, and population-level), and different indicators of cosmopolitanism (self-perceived, other-rated, and population-level). A meta-analysis of all studies (including pilot studies details of which are available at https://osf.io/r4qtg/) containing individual-level data yielded an average weighted effect size of r = 0.14, 95% CI [.10, .18].
Moreover, across studies when controlling for participants’ SES, gender, age, the cosmopolitanism of the city they are currently living in, and the size of their preferred destination cities, the key effects generally held. In Study 4, when controlling for the cosmopolitanism of participants’ current city and the size of their preferred cities the difference between the prevention condition and the control condition ceased to be significant, however; see Supplemental Material). The effects also remained robust when we controlled for participants’ independence and their openness to experience (Study 2b), suggesting that risk taking is linked to attraction to such cities above and beyond related constructs.
Implications for Economic Development
Our finding that high risk-takers prefer cosmopolitan cities may hint at one reason why many cosmopolitan cities are more economically successful than less cosmopolitan areas (Carr & Kefalas, 2009). Sustained economic success relies on new ideas and innovations—companies that fail to catch up with new technological advancements (e.g., Kodak, SONY) often experience severe setbacks and even bankruptcy. Nonetheless, developing new ideas and innovations always entails risks and may depend on there being people who are willing to take these risks (Kitayama et al., 2014). We speculate that the influx of such people to cosmopolitan cities may be one mechanism that fuels these cities continuing economic development.
We should note, however, that to seek to succeed in a cosmopolitan city is one thing, to actually succeed is something else. Hence, while some risk-taking is essential for economic growth, overconfident risk-taking may be detrimental (Duca et al., 2010; Ebert et al., 2019; Sevincer et al., 2014). For example, people with high rather than low risk-taking were more likely to become self-employed, but those with extreme risk-taking tendencies were less likely to remain self-employed (Nieß & Biemann, 2014). The risk-taking propensity in cosmopolitan cities demonstrated here may have to be combined with the ability to accurately assess the likelihood of success to lead to positive economic outcomes.
There may be an additional downside to the risk-taking tendency among those who prefer moving to cosmopolitan cities for success. Risk-taking can entail negative consequences, particularly in the domain of safety/health. Study 1, however, suggests that, with the exceptions of reckless driving and accidents, these behaviors are no more frequent in more than in less cosmopolitan cities. Rather, risk-taking in the domain of career/finance is prevalent in cosmopolitan cities. Thus, another avenue for future research may be to test whether more nuanced measures of risk-taking tendencies in these domains (e.g., Nicholson et al., 2005) are even stronger predictors of residential preferences.
Entrepreneurial Culture
In addition to risk-taking, another psychological dimension that contributes to the economic power of cities is entrepreneurial personality (high extraversion, conscientiousness, and openness to experience, low agreeableness and neuroticism; Obschonka et al., 2013). Cities in which an entrepreneurial personality is more prevalent (e.g., London) have more entrepreneurial activity (Obschonka et al., 2016). Thus future work might explore the extent to which risk-taking relates to the entrepreneurial personality profile and the extent to which it may mediate links between this profile and entrepreneurial behavior.
Risk-Taking in Cosmopolitan Cities
In the three correlational studies using individual-level data (Studies 2a, 2b, and 3), the higher participants’ risk-taking, the more cosmopolitan were their preferred cities. In these studies, participants’ risk-taking tendency did not correlate with the cosmopolitanism of their current city, however. This finding suggests that while high risk-takers prefer moving to cosmopolitan cities, the inhabitants in cosmopolitan cities are not more risk-taking than those in less cosmopolitan cities. In explaining this pattern, we speculate that because we assessed moving preferences rather than actual movements, some of the high risk-takers in less cosmopolitan cities who would like to move to cosmopolitan cities may not be able to do so because of their external circumstances (family ties, financial constraints).
The finding in Studies 2a, 2b, and 3, that the inhabitants in cosmopolitan cities are not more risk-taking than those in less cosmopolitan cities seems to stand in contrast to the finding in Study 1 that the assessed risk-taking behaviors in the domain of career/finance (start-up firms, new entrepreneurs, and credit card debts) were more common in more rather than less cosmopolitan cities. As for two of the assessed three indicators—the number of start-up firms and the number of new entrepreneurs—these instances may be more common in cosmopolitan cities, but they apply to a relatively small proportion of the inhabitants. Therefore, they may not substantially impact the average risk-taking tendency on the individual level. Also, it may be disproportionally the highrisking immigrants who found start-up businesses and become entrepreneurs. As for credit card debts, when people self-report their risk-taking behavior, they may not see their credit debts as a typical indicator of their risk-taking. Thus, even though credit cards may be higher in more cosmopolitan cities, this fact may not inform the inhabitants’ self-reported risk-taking.
Perceptions of Cosmopolitan Cities: Accuracy and Origins
In Studies 2a, 2b, and 3, we measured participants’ subjective perceptions of how cosmopolitan their preferred cities are by asking them to complete the CSS for their preferred cities. In previous research, participants’ subjective perceptions, measured by the CSS, correlated with objective indicators of cosmopolitanism (e.g., proportion of ethnic minorities, number of companies, Sevincer et al., 2017). This finding suggests that, on average, people’s perceptions of cosmopolitanism are quite accurate. Nevertheless, people’s images of their preferred destinations may in principle diverge from reality. For example, throughout history, New York symbolized the American Dream perhaps more than any other city, yet the actual living conditions there likely were far less rosy than in the minds of the prospective migrants.
Regardless of whether people’s perceptions are accurate or inaccurate however, they often influence whether people decide to move to a particular place (Phillips & Brunn, 1978). Future research may examine whether risk-taking correlates more with cosmopolitanism as subjectively perceived by participants or with cosmopolitanism as measured by objective indicators. Future research may also investigate the degree to which subjective perceptions guide moving decisions depending on from where the perceptions originate. For example, people may have visited their preferred places, lived there, seen them in the media, or heard about them from vicarious travel experiences.
Limitations and Future Directions
There are several limitations of the present work. First, the relationship between risk-taking and cosmopolitan preference was weak across studies, suggesting that other factors contribute to people’s residential preferences, such as independent (vs. interdependent) social orientation (Sevincer et al., 2015), the personality traits openness to experience and extraversion (Oishi et al., 2015), liberal (vs. conservative) political attitude (Motyl et al., 2014), and the dark triad traits (narcissism, psychopathy, machiavellianism; Jonason, 2018). Second, we measured residential preferences rather than migration behavior. Although preferences predict actual migration (Fuguitt & Brown, 1990), future work should explore whether those high in risk-taking are more likely to actually move to cosmopolitan cities. Third, we measured cosmopolitan preferences using close-ended response formats (e.g., by asking participants to complete the CCS for their preferred cities). Future research may investigate whether the observed results also emerge when cosmopolitan preference is measured using open-ended response formats, for example by asking participants to name the most desirable features of their destination cities and code these features for cosmopolitanism. Fourth, in Study 4, we did not employ a manipulation check to test whether the promotion (vs. prevention) focus manipulation altered participants’ risk-taking propensity. Future research should test whether the effect of promotion (vs. prevention) focus on stronger cosmopolitan preference is mediated by a greater risk-taking propensity. Finally, our investigation focused on participants (and cities) in Western societies. Future studies should examine non-western samples and cities as well.
Conclusion
To conclude, our work provides some evidence that risk-taking in the domains of career and finance is more common in cities with a more cosmopolitan culture and that such cities tend to attract people who are inclined to take risks. We speculate that the tendency of those high in risk-taking to feel attracted to cosmopolitan cities might contribute to these cities economic flourishing.
Supplemental Material
sj-doc-1-jcc-10.1177_00220221211003207 – Supplemental material for Risky Business: Cosmopolitan Culture and Risk-Taking
Supplemental material, sj-doc-1-jcc-10.1177_00220221211003207 for Risky Business: Cosmopolitan Culture and Risk-Taking by A. Timur Sevincer, Jung Yul Kwon, Michael E. W. Varnum and Shinobu Kitayama in Journal of Cross-Cultural Psychology
Footnotes
Acknowledgements
We thank Vanessa Begemann, Laura Clausen, Vivian Dell, Johanna Dreyer, and Tina Pudack for their help with collecting and coding the data. We also thank Peter J. Rentfrow and Joanna Schug for their helpful comments on an earlier version of this manuscript.
Declaration of Conflicting Interests
The author(s) declared no potential conflicts of interest with respect to the research, authorship, and/or publication of this article.
Funding
The author(s) received no financial support for the research, authorship, and/or publication of this article.
Supplemental Material
Supplemental material for this article is available online.
Notes
References
Supplementary Material
Please find the following supplemental material available below.
For Open Access articles published under a Creative Commons License, all supplemental material carries the same license as the article it is associated with.
For non-Open Access articles published, all supplemental material carries a non-exclusive license, and permission requests for re-use of supplemental material or any part of supplemental material shall be sent directly to the copyright owner as specified in the copyright notice associated with the article.