
Abstract
Building upon existing measures, four new brief acculturation scales are presented, measuring sociocultural adaptation, psychological adaptation, perceived cultural distance, and acculturation orientation. Following good scale reliability in initial samples, the English scales were translated into nine different languages (Chinese, French, German, Italian, Japanese, Portuguese, Spanish, Thai, and Turkish). The translated scales were administered to a large sample of sojourners (N = 1,929), demonstrating good reliability and adequate structural equivalence across languages. In line with existing theory, sociocultural adaptation and psychological adaptation were positively correlated, and showed a negative association with perceived cultural distance. General measures of well-being were correlated with adaptation and distance, with better adaptation relating to higher well-being, and more distance relating to lower well-being. Acculturation orientation toward the home and host culture were measured separately and a weak negative correlation was found between the two, supporting their independence. Arguing against dichotomization, these subscales were analyzed as continuous variables. Regression analysis showed sojourners to be better adapted, if they were oriented more toward the host culture and less toward the home culture. These new scales are proposed as alternatives to existing measures.
In today’s global society, research on intercultural mobility may be more pertinent than ever. Although acculturation may seem to be a contemporary topic, it has actually engaged the attention of researchers for over a century (Adler, 1975; Redfield, Linton, & Herskovits, 1936; Richardson, 1957; Thomas & Znaniecki, 1918; van Osch & Breugelmans, 2012; Ward & Kennedy, 1994). Naturally, this vast body of research has generated several seminal theories and associated concepts. The present article will focus on three important concepts and the challenges in their operationalization. These three concepts are cultural adaptation (Cemalcilar & Falbo, 2008; Church, 1982; Ward, Okura, Kennedy, & Kojima, 1998), acculturation orientation (Arends-Tóth & van de Vijver, 2007; Berry, Phinney, Sam & Vedder, 2006; Bourhis, Barrette, El-Geledi, & Schmidt, 2009), and cultural distance (Babiker, Cox, & Miller, 1980; Mumford & Babiker, 1998; Suanet & van de Vijver, 2009).
It may be hard to overestimate the impact that these theoretical concepts have had on the acculturation domain. However, the operationalization of these key constructs still poses challenges for researchers. For example, the particular acculturation measures used often vary across different groups of researchers (Jansinskaja-Lahti, 2008; Motti-Stefanidi, Pablopoulos, Obradovic, & Masten, 2008; Ward & Kennedy, 1994), which makes it difficult to confidently compare findings between studies. In addition, boundaries between different concepts are sometimes unclear. Identification scales have been used as measures of acculturation attitudes (Ward & Rana-Deuba, 1999), in place of construct-specific measures. Although related, identity and acculturation orientation are distinct concepts (see also Playford & Safdar, 2007).
Existing acculturation measures have already been critically analyzed in a number of extensive review articles and attempts to improve these measures have been made (Arends-Tóth & van de Vijver, 2007; Boski, 2008; Celenk & van de Vijver, 2011; Rudmin, 2009). It is our aim to build on these efforts, by developing a number of measures that address limitations of current acculturation tools. In this article, measurement issues related to conceptual clarity, specificity, applicability across contexts and target groups, language, and scale length are addressed. Four new scales are constructed, designed to measure sociocultural adaptation, psychological adaptation, perceived cultural distance, and acculturation orientation.
Adaptation
Although adaptation can be conceptualized in different ways, in this article the model of Searle and Ward (1990) is adopted. This model distinguishes between two distinct aspects of cultural adaptation–sociocultural and psychological. Sociocultural adaptation refers to the more practical and behavioral aspects of adapting to a new culture; those aspects that allow a person to navigate the culture effectively on a day-to-day basis. Psychological adaptation however, refers to how comfortable and happy a person feels with respect to being in the new culture, or anxious and out of place. Although related, these two types of adaptation are clearly different and are not necessarily always correlated (Ward et al., 1998). Sociocultural and psychological adaptation should therefore be measured independently (Motti-Stefanidi et al., 2008; Ward & Kennedy, 1996).
An issue with the measurement of sociocultural and psychological adaptation is the mismatch between their operationalizations in terms of context specificity. Measures of sociocultural adaptation, like the Sociocultural Adaptation Scale (Ward & Kennedy, 1999), or Cultural Readjustment Rating Scale (Furnham & Bochner, 1982), refer specifically to the challenges of the relocation experience. In contrast, the measurement of psychological adaptation has typically used general measures of well-being and ill-being, such as the Zung Self-Rating Depression Scale (Zung, 1965) or Profile of Mood States measure (McNair, Lorr, & Droppleman, 1971), which are relocation independent (Cemalcilar & Falbo, 2008; Rogers & Ward, 1993; Safdar & Lay, 2003; Ward et al., 1998; Ward & Kennedy, 1996). General well-being will be influenced by psychological adaptation, but will undoubtedly vary as a function of other factors as well. This confound can be removed by measuring psychological adaptation in the context of the cultural relocation, such that psychological and sociocultural scales use the same level of context specificity. To our knowledge no such psychological adaptation scale exists, although a number of culture shock or acculturative stress measures may provide the next best solution (e.g., Benet-Martinez, 2003; Mumford, 1998).
A further consideration for measures of sociocultural adaptation and psychological adaptation is scale length. For example, existing measures of sociocultural adaptation, like the Cultural Readjustment Rating Scale (Furnham & Bochner, 1982), Social Situations Questionnaire (Spradley & Phillips, 1972) and the Sociocultural Adaptation Scale (Cemalcilar & Falbo, 2008; Ward & Kennedy, 1999) are between 30 and 40 items in length. Measures that have been used as indicators of psychological adaptation like the Profile of Mood States (McNair et al., 1971) are up to 65 items long. If recorded in isolation these scales are of manageable length. However, with the drive toward more longitudinal research including multiple measures, participant fatigue is a serious concern (Galesic & Bosnjak, 2009). Hence, there is a need for more short and concise scales of adaptation that do not risk tiring participants from whom a high level of commitment and time investment is asked.
The applicability or generalizability of adaptation scales across different populations (sojourners vs. migrants), or across different cultural contexts is also an important consideration. This is not to argue that all acculturating individuals go through exactly the same processes. Rather, we argue that to look at the differences between relocating groups, we need measures that are comparable and applicable across different contexts. For instance, the Abbreviated Multidimensional Acculturation Scale focuses heavily on language (Zea, Asner-Self, Birman, & Buki, 2003). For a Briton relocating to another English-speaking country, these questions would be mostly irrelevant.
In sum, existing measures of sociocultural adaptation and psychological adaptation vary in levels of context specificity, tend to contain many items, and can be difficult to generalize to different populations.
Cultural Distance
Cultural distance, the difference between two cultures, has proved itself to be an important predictor of adaptation and ill-being in intercultural travelers, with greater difference predicting more difficulties (Dunbar, 1994; Furnham & Bochner, 1982; Geeraert & Demoulin, 2013; Searle & Ward, 1990; Ward, Bochner, & Furnham, 2001; Ward & Kennedy, 1999). A number of different measures or conceptualizations of cultural distance exist, ranging from the economic (e.g., gross domestic product) to the psychological (e.g., Hofstede, 1980; House, Hanges, Javidan, Dorfman, & Gupta, 2004; Schwartz, 1992). These measures of distance are highly relevant. However, equally important may be the relationship between adaptation and cultural distance as perceived by the intercultural traveler, with respect to the differences experienced on a day-to-day basis in the new culture (Galchenko & van de Vijver, 2007; Suanet & van de Vijver, 2009).
Sociocultural adaptation and perceived cultural distance are interrelated. Only those elements of the host culture that are different from the home culture will require adaptation. 1 The larger the difference between two cultures, the greater the challenge to adapt. Thus, there is a clear connection or overlap between these two concepts. Researchers studying attitudes have long argued that related measures should specify the same target and context. We argue that this principle of compatibility (Ajzen, 1988) should also be applied to the measurement of perceived cultural distance and sociocultural adaptation. That is, to best understand the relation between these interrelated constructs, the scales of perceived cultural distance and sociocultural adaptation should include matching dimensions and items.
Acculturation Orientation
Acculturation orientations or strategies are most well known in the framework of Berry (1997, 2005). This framework presents two main issues facing acculturating individuals. The first of these is how important or valuable it is for the individual to maintain their own cultural heritage while in the host society. The second issue relates to the importance or value of participating in the larger society’s culture. From these two concerns, four acculturation orientations can be derived. Those with a high orientation toward the host culture and the home culture are integrated. A high orientation toward the host culture but not to the home culture suggests assimilation, whereas the reverse (low host, high home) indicates separation. Those rejecting both cultures are marginalized.
In the literature, the measurement of acculturation orientations has been approached in one of three ways. In the bipolar method, participants typically indicate their preference for either the home or host culture across a number of areas, such as friendship or traditions (e.g., Celano & Tyler, 1991). The bidimensional approach establishes preference for home and host culture independently; each aspect is assessed separately for both cultures (e.g., Donà & Berry, 1994). Finally, in the four-scale method, different items represent each of the four orientations. Thus, preference for each of the four acculturation orientations is assessed independently (e.g., Berry et al., 2006). Recent reviews assessing these different methods recommend the bidimensional approach (Arends-Tóth & van de Vijver, 2007; Rudmin, 2009; Ryder, Alden, & Paulhus, 2000).
Regardless of approach, the assessment of acculturation orientations is not without its limitations. First, many scales have been designed for a specific immigrant population and/or context, making it difficult to generalize their use to different contexts or populations. For example, the Immigrant Acculturation Scale (Bourhis & Barrette, 2006) does not easily adapt to nonimmigrant populations, such as temporary relocations. Some items in this scale refer to employment, housing, and marriage, which may not be relevant for all populations (i.e., short-term expatriates or international students).
Second, the conceptual clarity of acculturation orientation measures is also an issue. The theoretical overlap between acculturation orientation and identification for example is part of this problem. For instance, the Acculturation Index (Ward & Rana-Deuba, 1999) is described as a measure of identity, yet it is used to derive respondents’ acculturation orientation. Furthermore, on face value this particular measure could also be construed as a measure of cultural distance as the instructions ask participants to assess similarity between themselves and people from the home and host culture.
Finally, a methodological issue is how measures of acculturation orientations are used to classify individuals into one of the four acculturation strategies (Berry et al., 2006; Bourhis et al., 2009). For example, measures such as Berry and colleagues’ (2006) Acculturation Attitudes Scale use the four-scale method, presenting participants with a number of statements associated with individual acculturation attitude. The attitude that receives the most endorsement is then posited to be that persons preferred orientation. In the case of the Acculturation Index (Ward & Rana-Deuba, 1999), participants are split into four groups based on how they respond to the home and host dimension of the scale relative to a median or scalar split (e.g., high similarity to both = integration). We argue, as others have before (Arends-Tóth & van de Vijver, 2007; Ryder et al., 2000) that a more appropriate approach to measuring acculturation orientations is to assess home and host orientation independently, yielding two continuous variables.
In summary, of the different approaches to the measurement of acculturation orientations, the bidimensional method is preferred. Limitations of existing measures are population specificity, lack of conceptual clarity, and methodological shortcomings.
Current Research
In this article, the development of four Likert-type scales is described. These new scales will be referred to as the Brief Sociocultural Adaptation Scale (BSAS), the Brief Psychological Adaptation Scale (BPAS), the Brief Perceived Cultural Distance Scale (BPCDS) and the Brief Acculturation Orientation Scale (BAOS). To generate items for these scales, two main approaches were used. First, a number of existing scales measuring similar constructs were identified. Items or concepts appearing in multiple scales were taken to be core elements of that construct. Second, items were generated through a pilot study of people who were currently or had previously relocated abroad. Reliability of the scales was tested across different samples, students, and migrants, and in 10 different languages. The structural equivalence of the scales was established across languages by means of a Procrustean rotation procedure (for scales with multiple factors) and by correlating factor loadings (for single-factor scales).
Validity was assessed by examining the relationships between the new scales and theoretically related measures. Sociocultural and psychological adaptation are related yet distinct constructs (Searle & Ward, 1990). We therefore expected responses to the BSAS and BPAS to be related but only moderately. Previous research has shown that individuals better adapted to their host country have lower ill-being (Berry et al., 2006; Klineberg & Hull, 1979). Others have also demonstrated a positive relationship between cultural distance and psychological distress (Babiker et al., 1980; Furnham & Bochner, 1982; Mumford & Babiker, 1998; Suanet & van de Vijver, 2009). Thus, we expect to find the same pattern of relationships between our new measures and general measures of well-being.
According to previous work on acculturation orientations, the degree of orientation to the home and host country are independent from one another and should therefore be measured independently (Arends-Tóth & van de Vijver, 2007; Rudmin, 2009; Ryder et al., 2000). Consequently, we do not expect to find a strong relationship between the home and host factors of the BAOS.Furthermore, we hypothesize that individuals’ independent identities with respect to their home and host culture (Phinney, 1990) will be positively associated with acculturation orientation to the home or host country, respectively.
Scale Construction
Sociocultural Adaptation and Perceived Cultural Distance
The Brief Sociocultural Adaptation Scale and Brief Perceived Cultural Distance Scale were constructed with the same items to allow, when relevant, for direct comparisons in research practice to be made between these two constructs. 2 To develop these items, a number of existing scales were examined. These scales, designed to measure various aspects of sociocultural adaptation and cultural distance, were the Social Situations Questionnaire (Furnham & Bochner, 1982), the Sociocultural Adaptation Scale (Ward & Kennedy, 1999), the Cultural Readjustment Rating Scale (Spradley & Phillips, 1972), the Acculturation Index (Ward & Kennedy, 1994; Ward & Rana-Deuba, 1999), and the Cultural Distance Index (Mumford & Babiker, 1998). Thirty distinct concepts appeared across two or more of the scales (e.g., making friends, pace of life, values). This list was reduced by half when selecting only those items that were present in both the sociocultural adaptation and cultural distance measures.
Second, a number of people (N = 23, Mage = 23.6 years) who had either relocated abroad in the past or who were currently living abroad were interviewed. These participants represented 13 different nationalities from Africa, Asia, Europe, and North America. For sociocultural adaptation, participants are asked, “For you, what have you found to be the main things that you have to adjust/adapt to when staying in a new country?” For perceived cultural distance, participants were asked, “What are the main things that you notice to be different in other countries in comparison to your own?” In this pilot study, the total number of items listed across all participants was 84 for the sociocultural adaptation question and 80 for the cultural distance question, a total of 164. Duplicate items (e.g., 19 responses of “food” and 15 of “language”) and conceptually similar items (e.g., “climate” and “weather”) were grouped together, resulting in a shorter list of responses and their frequencies.
The list of responses from the pilot study was compared with the short list of items extracted from existing scales. Reassuringly, there was much overlap between these two sources. Conceptually similar responses and items across these two sources were then grouped together, resulting in a combined list of concepts and their frequencies. Twelve categories emerged from this list representing key issues in cultural distance and sociocultural adaptation concerning the host language, making friends, peoples’ social attitudes, values, social norms, family life, food and eating, day-to-day practicalities, standard of living, social environment, natural environment, and climate. 3 Each item constructed displayed a category name, followed by some clarifying examples (see Appendix).
Although the BSAS and BPCDS use the same items, different question stems were designed to distinguish them. For BSAS, participants were asked to “Think about living in [host country]. How easy or difficult is it for you to adapt to . . . ” and then rate the following 12 items on a 7-point Likert-type scale from 1 = very difficult to 7 = very easy. For the BPCDS, participants are asked to “Think about [home country] and [host country]. In your opinion, how different or similar are these two countries in terms of . . . ” and then rate the items on a scale from 1 = very similar to 7 = very different.
Psychological Adaptation
The items for the Brief Psychological Adaptation Scale were designed to be nongeneral, that is, specific to cultural relocation. To develop these items, a similar strategy was adopted as for the BSAS and BPCDS. First, an existing two-factor measure of ill-being with regard to relocating abroad was assessed; the Culture Shock Questionnaire by Mumford (1998). Items in this scale included concerns with regard to feeling strain from the effort to adapt, missing friends and family back home, and feeling anxious meeting local people. Next, the 10th revision of the International Statistical Classification of Diseases and Related Health Problems (ICD-10) classification of mental and behavioral disorders was reviewed for “stress and adjustment difficulties.” Thirteen symptoms were extracted as descriptors of this situation, including anxiety, worry, and withdrawal (World Health Organization, 1992).
Finally, in the pilot study described above (N = 23) participants were asked “During the time you have spent in another country, what emotions/feelings and thoughts do you often experience?” A total of 97 responses were given across participants. Interestingly, these responses could be distinguished in terms of reference to the home country (e.g., homesickness) and to the host country (e.g., not knowing how to act). Also, participants reported positive as well as negative responses. This contrasts with the usually negative stance that researchers take on psychological adjustment (i.e., culture shock). A number of reoccurring concepts among these responses were identified (i.e., excitement, homesickness, insecurity), resulting in a list of items and their frequencies.
Concepts identified from the existing Culture Shock Questionnaire, the ICD-10, and the pilot study were compared. Ten salient and frequently appearing concepts formed the basis for the items of the BPAS. These items included positive and negative feelings, and feelings related to the home and host country. Specifically, participants are asked to “Think about living in [host country]. In the last 2 weeks, how often have you felt . . . ”. Participants respond on a scale from 1 = never to 7 = always, to such items as “out of place, like you don’t fit into [host country] culture” (see Appendix for the full scale).
Acculturation Orientation
The Brief Acculturation Orientation Scale was constructed to be bi-dimensional. Specifically, acculturation orientation toward the home country and the host country were designed to be measured independently. Using existing scales as a basis (e.g., Berry et al., 2006; Ryder et al., 2000), four central indicators of acculturation orientation were identified: the value of cultural friendships, traditions, characteristics, and actions. Participants were asked to rate their agreement with four statements such as “It is important for me to have [home country] friends”, on a 7-point Likert-type scale, from 1 = strongly disagree to 7 = strongly agree. These four items are presented twice, once for the home country and again for the hosting country (see Appendix for the full scale).
Scale Reliability
Student Samples
The reliability of the new scales was assessed across two independent opportunity samples. Both samples consisted of international students studying at the University of Essex (United Kingdom), coming from a wide range of different countries (including countries in Europe, Asia, and Africa). The first sample consisting of 76 sojourners (Mage = 22.21, 69% male), completed the BPCDS and BAOS. The second sample, comprising 53 students (Mage = 23.17, 54% male), completed the BSAS and BPAS. Cronbach’s alpha was computed to assess scale reliability. Both of the adaptation scales and the perceived distance scale had good reliability (αBPCDS = .79, αBSAS = .85, αBPAS = .72), as did the home and host country factors of the BAOS (αBAOS-Home = .79, αBAOS-Host = .80).
Corrected item-total correlations were analyzed for each scale. These were at acceptable levels (r′s > .3), for all but the BPAS. For the BPAS, item 3 (a sense of freedom being away from [home country]) and item 7 (curious about things that are different in [host country]) had low item-total correlations of .02 and .01, respectively. Removing items 3 and 7 did not significantly change the item-total correlations of remaining items and improved scale reliability (αBPAS = .79).
Migrant Sample
Scale reliability was also assessed in a migrant sample, consisting of 53 international staff members at the University of Essex (Mage = 34.64, 34% male), originating from 28 different countries. These participants had lived in their birth country for an average of 26.4 years (SD = 7.4) before moving abroad. On average, participants had been living in the United Kingdom for 6.4 years (SD = 6.0, min = 2 months, max = 27 years). All scales showed good reliability (αBPCDS = .94, αBSAS = .84, αBPAS = .73, αBAOS-Home = .81, αBAOS-Host = .83). As before, corrected item-total correlations were acceptable for all scales (r′s > .3), except for the BPAS. This scale had low scores for item 3 (r = .18), item 7 (r = .10), and also for item 5 (r = .18). In parallel with the student sample, items 3 and 7 were removed from the BPAS. This intervention improved the scale’s reliability (αBPAS = .78) and the item-total correlation of item 5 (r = .34).
Based on the reliability analysis from student and migrant samples, all items were retained for the BPCDS, BSAS, and BAOS. For the BPAS, items 3 and 7 were permanently removed.
Scale Translation
The nature of these new measures is such that they will often be completed by non-native speakers of English. Therefore, it is important that these scales use language that is simple and easy to understand. However, sometimes it may be preferable for participants to complete measures in their native tongue. To assess whether the present scales meet these criteria, they were administered to a final sample of 1,929 sojourners, traveling from 46 home countries to 1 of 51 different host countries (Mage = 16.80, SD = 1.47, 72.81% female). These participants were recruited via AFS Intercultural Programs, which is a non-profit, volunteer-based organization that offers international exchange programs in more than 50 countries. Typically, AFS participants are placed with a host family for the duration of their stay abroad (8-10 months) and during this time they enroll at a local high school. These participants were monitored via online surveys on nine occasions over an 18-month period before, during, and after their sojourn.
The scales were translated into nine different languages, with the aim to cover the most commonly spoken languages within the AFS Network. Specifically, using the standard forward–backward translation procedure (Brislin, 1980), the scales were translated into Chinese, French, German, Italian, Japanese, Portuguese, Spanish, Thai, and Turkish. Those participants whose primary language was not included completed the scales in English. These participants were mostly from the Nordic countries (i.e., Norway, Denmark), where it is typical for the younger generation to speak English as a second language.
Reliability
Cronbach’s alpha was computed for all languages (see Table 1). Reliability was good for the BPCDS, BSAS, and BPAS in all languages (α′s > .70). Reliability for the BAOS was generally good (α′s > .70), except for the English, French, German, Portuguese, and Chinese versions of the BAOS-Host subscale, which was somewhat weaker but still acceptable (.70 > α′s > .60).
Cronbach’s Alphas and Sample Sizes for Each Translated Scale; the BSAS, BPAS, and BPCDS (Top Panel) and the Home and Host Subscales of the BAOS (Bottom Panel).
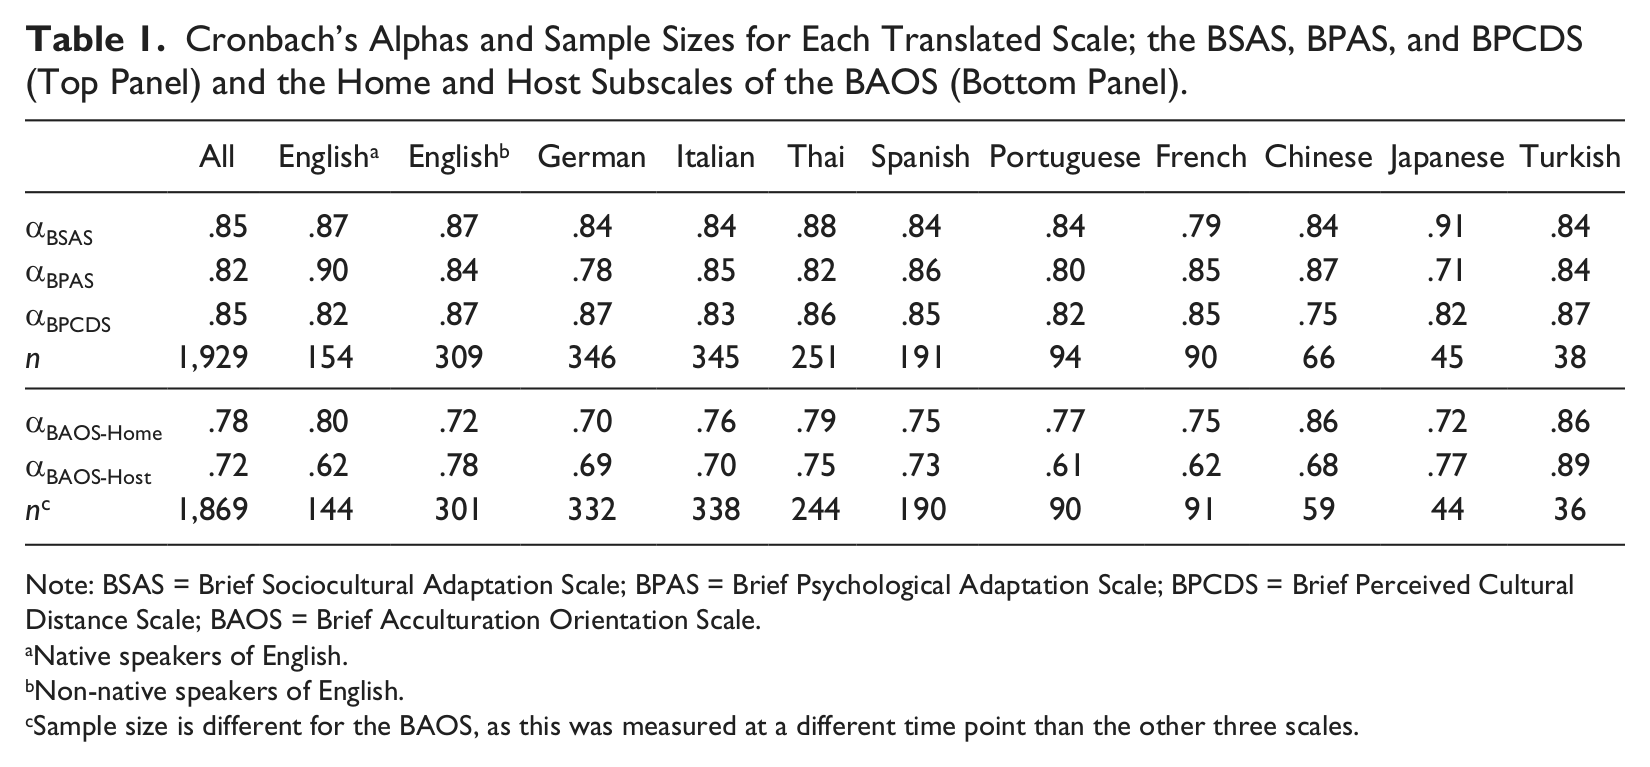
Note: BSAS = Brief Sociocultural Adaptation Scale; BPAS = Brief Psychological Adaptation Scale; BPCDS = Brief Perceived Cultural Distance Scale; BAOS = Brief Acculturation Orientation Scale.
Native speakers of English.
Non-native speakers of English.
Sample size is different for the BAOS, as this was measured at a different time point than the other three scales.
Scale Structure
The structural validity of the scales across different languages was assessed next. Due to insufficient sample size (see Table 1), some languages could not be included in these analyses (Chinese, Japanese, and Turkish). For the bi-dimensional BAOS, structural validity was assessed through a Procrustean factor rotation (Fischer & Fontaine, 2011). Specifically, for each language, scale fit was compared with the scale fit in the remaining sample (excluding the target language). Inspection of the agreement coefficients—Tucker’s Phi (see Table 2), showed a good fit for all languages (φ′s > .90). This suggests that the BAOS had a comparable factor structure across translations.
Factor Loading Correlations (Top Panel) for the BSAS, BPAS, and BPCDS and Tuckers Phi (Bottom Panel) for the BAOS Subscales for Seven Different Language Versions, Comparing Target Language Sample With Whole Sample (Minus Target Language).
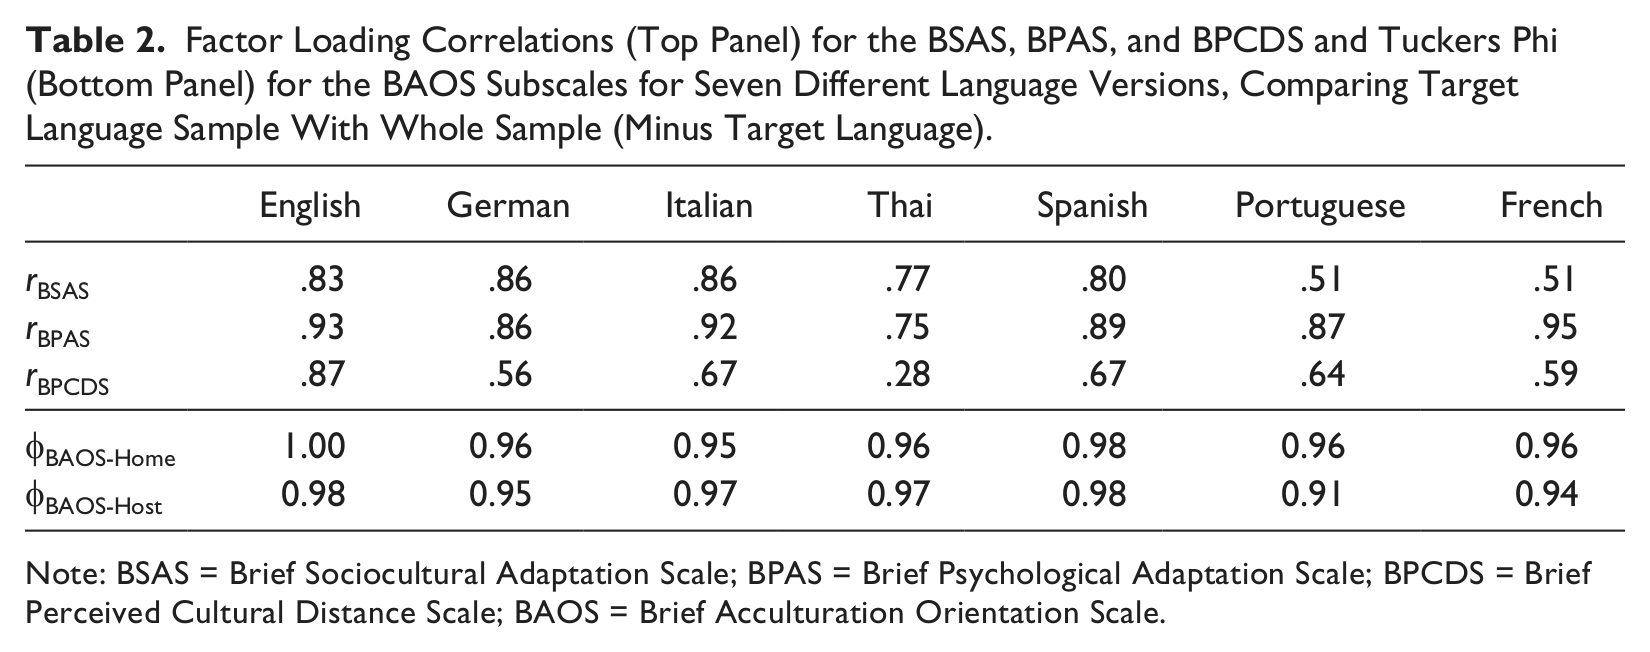
Note: BSAS = Brief Sociocultural Adaptation Scale; BPAS = Brief Psychological Adaptation Scale; BPCDS = Brief Perceived Cultural Distance Scale; BAOS = Brief Acculturation Orientation Scale.
The three remaining scales, the BPCDS, BSAS, and BPAS, were each designed to represent a single factor. As the Procrustean rotation procedure requires a minimum of two factors, a different procedure had to be used to establish the structural equivalence of the single factor scales. For each scale and language a factor analysis was conducted, restricting extraction to one single factor. The resulting item loadings were then compared with the item loadings from the remaining sample (excluding the target language) by means of a bivariate correlation. This resulted in a correlation for each scale in each language (see Table 2). Overall, the structure of each translated scale was strongly and positively correlated with the structure of the remaining sample (r′s > .50), suggesting that the structure of these scales was largely comparable across languages. There was one exception to this pattern of results, the Thai version of the BPCDS had a more moderate correlation (r = .28). Although not as strong as the other languages, the loadings for the Thai version of the BPCDS were still positively correlated, suggesting that the interpretation of the scale items in Thai may differ somewhat from that of other languages. Nonetheless, the Thai version proved to be highly reliable according to the criteria of Cronbach’s alpha.
Scale Validity
The concurrent validity of the new measures was assessed by examining correlations between the new scales and other theoretically related constructs. In the large sojourner sample, a number of other variables in addition to the new scales were recorded.
Adaptation
The correlation between the BSAS and BPAS was first computed. As expected, these two measures were correlated, r = .55, p < .001. Alongside the adaptation scales, participants’ levels of perceived stress (Cohen, Karmarck, & Mermelstein, 1983), state anxiety (Marteau & Bekker, 1992), self-esteem (Rosenberg, 1965), and satisfaction with life (Diener, Emmons, Larsen, & Griffin, 1985) were recorded. Correlations between the BSAS, BPAS, and the four well-being measures are presented in Table 3. These correlations show that the BSAS and BPAS are moderately related to all four measures, with correlations ranging in magnitude from r = .40 to r = .70. Greater adaptation, whether sociocultural or psychological, is related to less stress and anxiety and more self-esteem and satisfaction with life. Notably, the BPAS shows a stronger link with well-being than does the BSAS.
Correlations Between the New Measures, BSAS, BPAS, BPCDS, and Related, Established Well-Being Scales.
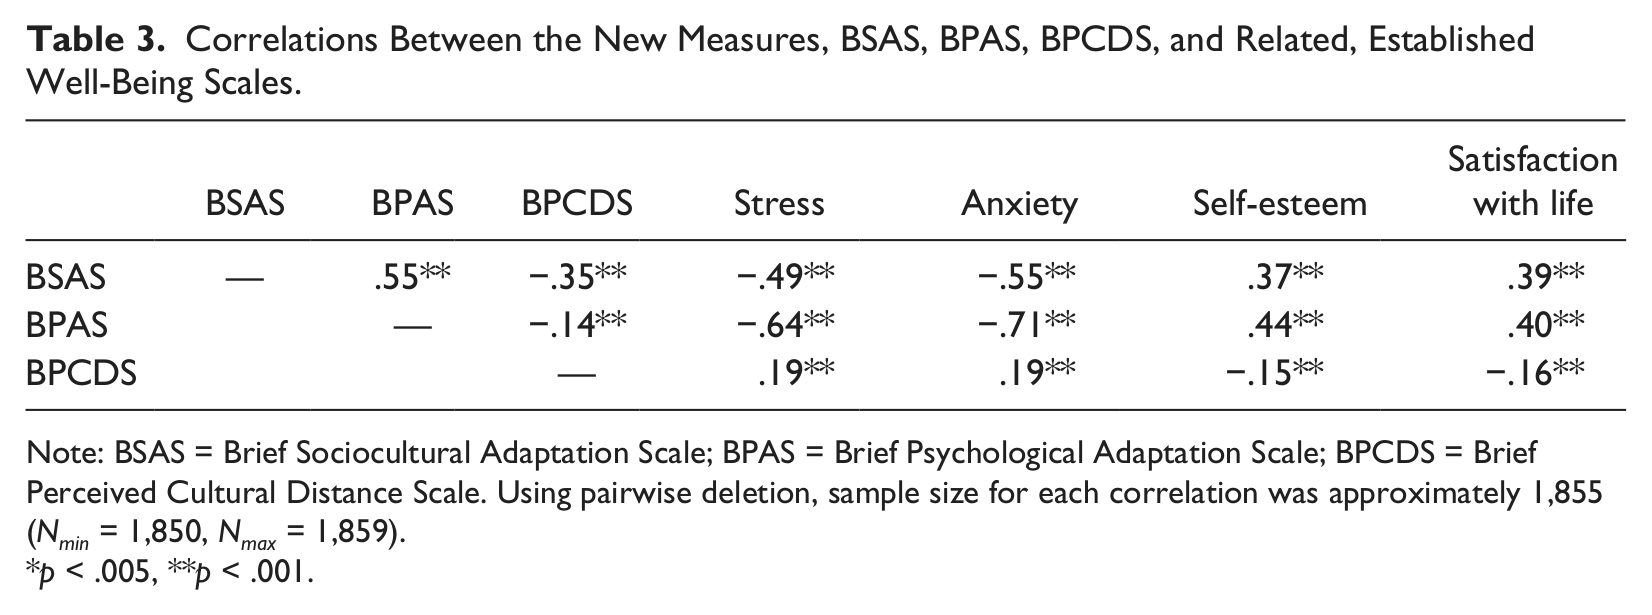
Note: BSAS = Brief Sociocultural Adaptation Scale; BPAS = Brief Psychological Adaptation Scale; BPCDS = Brief Perceived Cultural Distance Scale. Using pairwise deletion, sample size for each correlation was approximately 1,855 (Nmin = 1,850, Nmax = 1,859).
p < .005, **p < .001.
Perceived Cultural Distance
The relationship between the BPCDS and the adaptation and well-being measures was assessed (see Table 3). In support of our prediction, the BPCDS was negatively related to the BSAS and BPAS; that is, greater perceived cultural distance was associated with lower levels of adaptation. In terms of the relationship between the BPCDS and well-being, a modest correlation between these measures emerged. Specifically, the greater the perceived cultural distance, the more sojourners reported feeling stressed and anxious and as having lower self-esteem and satisfaction with life.
Acculturation Orientation
With regards to acculturation orientation (see Table 4), a low correlation between the home and host factor of the BAOS was hypothesized. The correlation was indeed low, at r = −.11, p < .001, suggesting that participants had a weak tendency to orient themselves less toward one culture if they were more oriented to the other. Next, we expected to find a moderate relationship between the two orientation factors and the equivalent two factors on an identification scale (based on Doosje, Ellemers, & Spears, 1995; Karasawa, 1995; Spears, Doosje, & Ellemers, 1997). The two BAOS dimensions did indeed correlate with the equivalent identification dimensions, for the home country, r = .46, p < .001, and for the host country, r = .41, p < .001. The more participants were orientated toward a particular culture, the more they identified with that same culture.
Correlations Between the BAOS (BAOS-Home, BAOS-Host) and Identification (Home, Host).
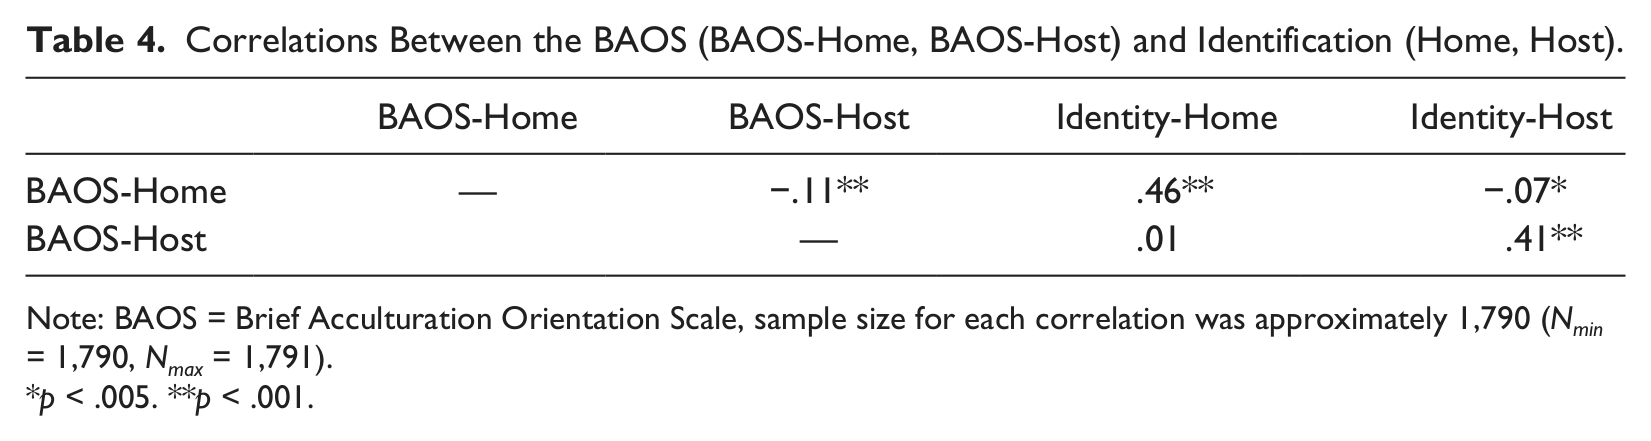
Note: BAOS = Brief Acculturation Orientation Scale, sample size for each correlation was approximately 1,790 (Nmin = 1,790, Nmax = 1,791).
p < .005. **p < .001.
Analysis Strategy for Acculturation Orientation
Berry’s (1997, 2005) acculturation strategies are typically conceptualized as four discrete categories. That is, an individual migrant or sojourner is believed to use one of four approaches. Participants’ acculturation orientation toward the home and host culture has often been measured on two independent scales (Donà & Berry, 1994; Ryder et al., 2000; Ward & Rana-Deuba, 1999) and then based on their individual scores, participants are allocated to one of the four acculturation strategies. Allocation is typically by means of a median, mean, or midpoint split. This dichotomization places people into two separate groups (high or low) for the home and host dimensions. The combination of grouping across both dimensions results in being placed in one of four quadrants overall (the four acculturation strategies). Although this categorization may make sense on a theoretical level, there are some statistical and conceptual problems with this approach.
First of all, to split a continuous scale into two separate categories, the scores ought to be bimodally distributed. To test whether this is the case, the distribution of scores in the exchange student sample was plotted. Orientation toward the home culture (Figure 1—top left panel) was normally distributed, with the mean around the midpoint of the scale. Orientation toward the host culture (Figure 1—top right panel) was negatively skewed, but nevertheless unimodal. Thus, the distribution of responses across these two dimensions cannot justify dichotomization.
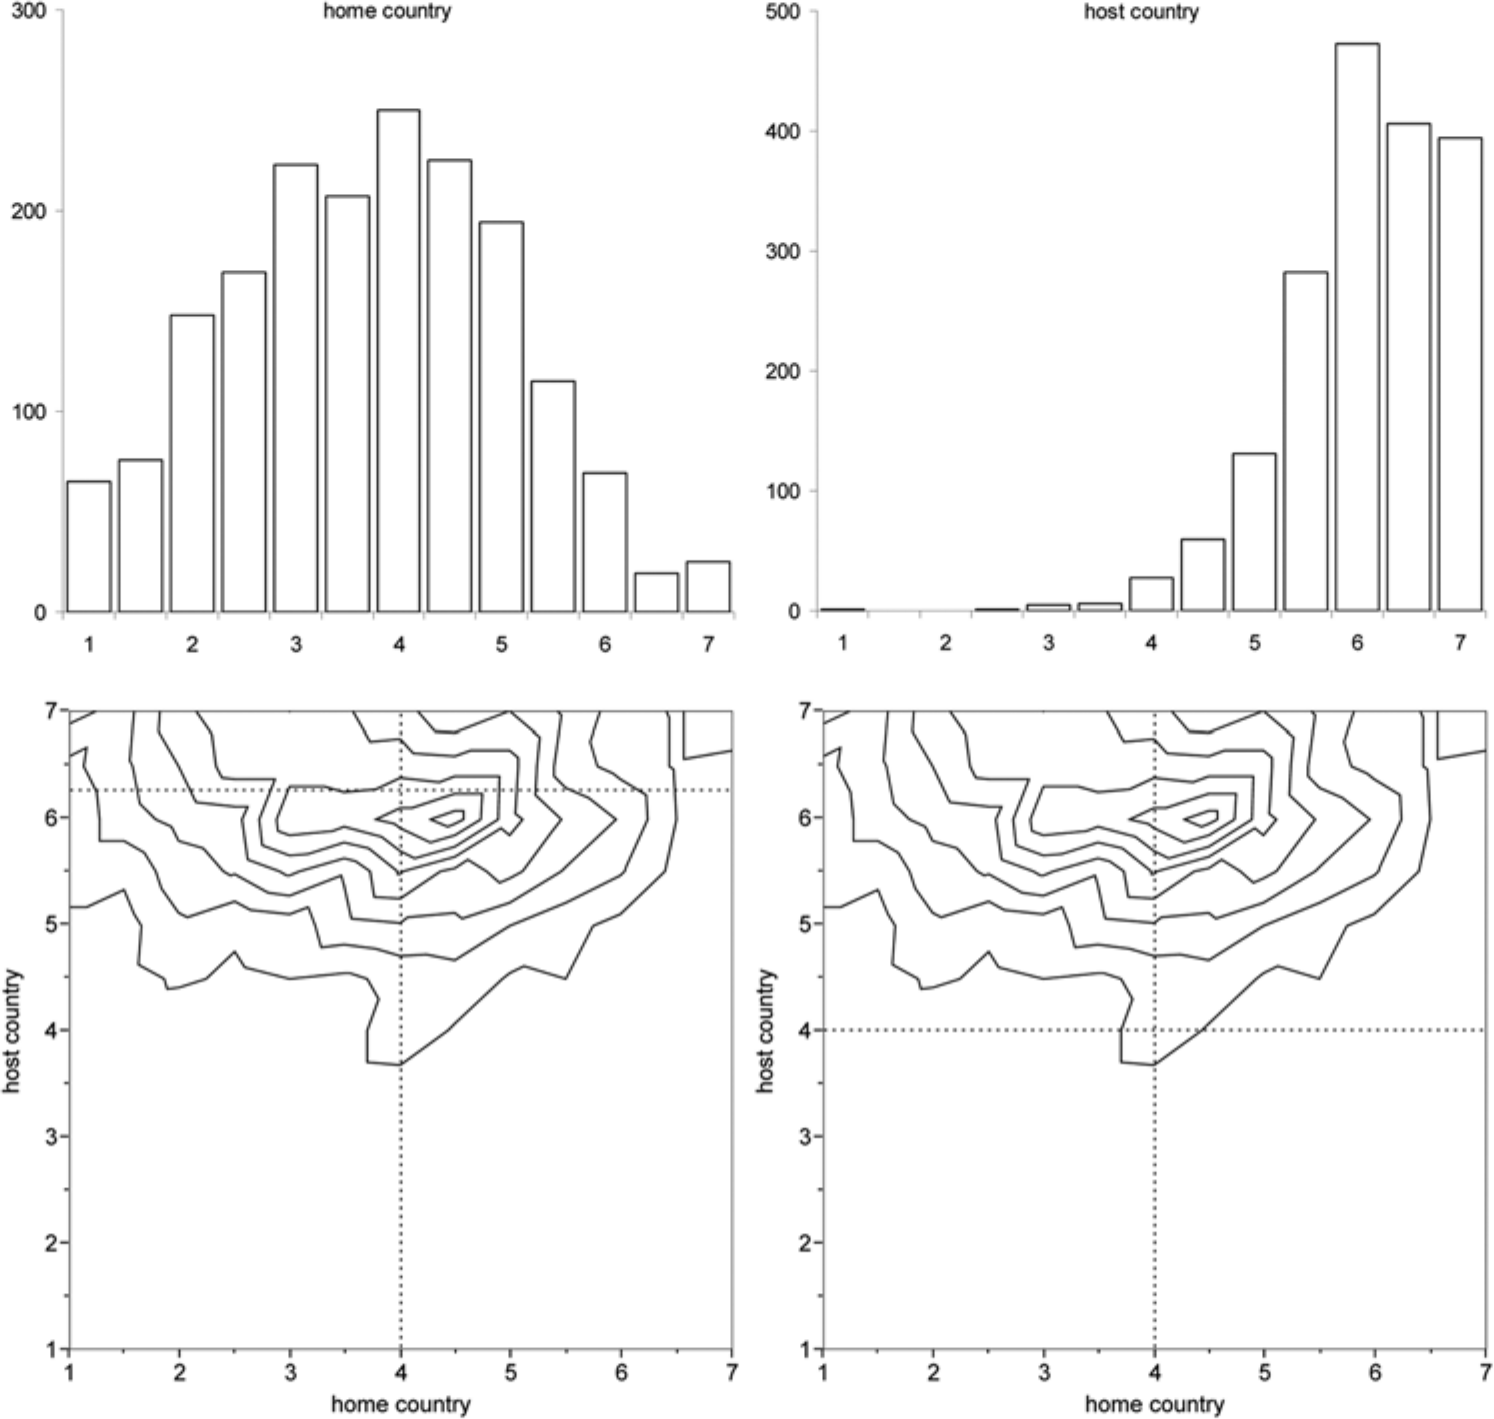
Distribution of Scores on the BAOS for the Home and Host Country Factors.
A second but related issue is the loss of variability and statistical power that results from this method. Dichotomization may alter relationships between variables (i.e., change correlation coefficients, effect sizes) or lead to spurious effects. As a consequence of the dichotomization, the scores of some individuals’ may differ more within a quadrant, than scores nominally belonging to different quadrants (MacCallum, Zhang, Preacher, & Rucker, 2002). To illustrate these issues, a bivariate distribution of scores (orientation toward home and host cultures) was plotted in a contour graph (see Figure 1—bottom panels). When dichotomization is based on the median (bottom left panel), then naturally all four groups emerged. However, the peak of the distribution lies at the intersection of the quadrants, which means that a relatively small change in score may cause an individual to change category. This means that participants close to the median, similar in profile, may nevertheless end up in different quadrants. Also, the bottom quadrants (i.e., separation, marginalization) contain individuals with high scores on orientation toward the host culture, which is conceptually problematic. When the data are split according to the scales’ midpoints (bottom right panel), other problems emerge. The midpoint split generates only two groups—integration and assimilation. The bottom two categories (separation, marginalization) are virtually unpopulated, completely eradicating the variability of orientation scores toward the host culture.
To summarize, acculturation strategies are often operationalized by splitting scores of orientation toward home and host cultures into four quadrants. However, this approach seems to be flawed conceptually (Boski, 2008; Playford & Safdar, 2007; Rudmin, 2009) and statistically (DeCoster, Iselin, & Gallucci, 2009; Fitzsimons, 2008; MacCallum et al., 2002). The theory of acculturation strategies (Berry, 1997, 2005) is a meaningful framework and is supported by a large body of research. However, the categorical operationalization of this theory may be overly simplified and a continuous approach would be more justified. This could be easily established by measuring home and host orientation independently on continuous scales and then analyzing them using hierarchical multiple regression. Independent influences of each orientation could then be established, as well as the combination of the two via the interaction term (see also Ryder et al., 2000; Ward & Rana-Deuba, 1999). Such a continuous approach may further enrich the theory, as it would better allow individuals to have intermediate scores and/or be in transition from one category to another.
To demonstrate this, a regression approach was used with our large sojourner sample (see Table 5). In the first step, adaptation at midstay was regressed on the home and host factors of the BAOS, which was measured a couple of months earlier. In the second step, the home x host interaction term was added. The independent home and host orientation scores accounted for 4% of the variance in the BSAS, F(2, 1543) = 33.76, p < .001. The BAOS-Home scores were negatively related to the BSAS, β = −.07, p < .005, and the BAOS-Host scores were positively related to the BSAS, β = .18, p < .001. The interaction term did not explain any additional variance over and above the BAOS-Home and BAOS-Host, ΔR2 < .001, β = .004, p = .86. A similar pattern of results emerged for the BPAS. In the first step, the BAOS-Home and BAOS-Host factors accounted for 8% of the variance in the BPAS, F(2, 1541) = 70.56, p < .001. Again, the BAOS-Home was negatively related to the BPAS, β = −.21, p < .001, and the BAOS-Host positively so, β = .18, p < .001. The interaction term did not account for any further variance in the BPAS, ΔR2 < .001, β = .02, p = .35.
Two-Step Regression Analyses of the Home and Host Factor of the BAOS (Step 1) and Their Interaction Term (Step 2) on the BSAS and BPAS.
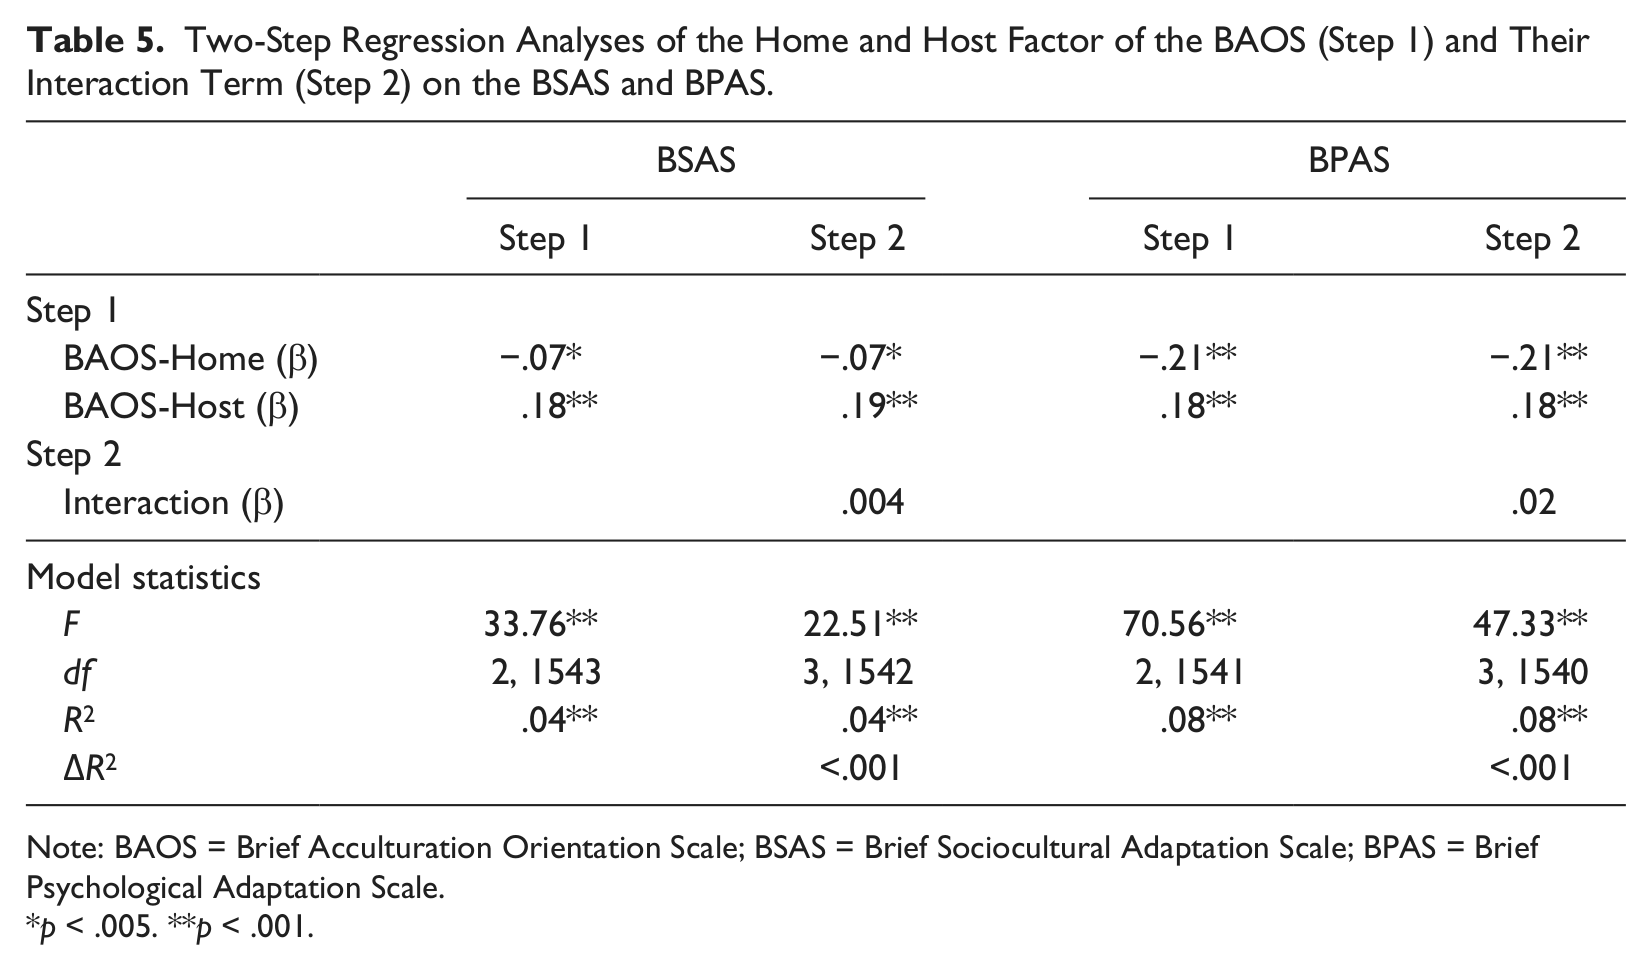
Note: BAOS = Brief Acculturation Orientation Scale; BSAS = Brief Sociocultural Adaptation Scale; BPAS = Brief Psychological Adaptation Scale.
p < .005. **p < .001.
In this particular sample, a negative relationship between home orientation and adaptation was found, such that the greater the importance placed on maintaining the home culture, the poorer the sociocultural and psychological adaptation. Conversely, the more importance placed on embracing the host culture, the better the adaptation.
Discussion
The aim of the present research was to develop new scales measuring a series of key acculturation concepts. The development of these scales builds upon previous efforts to tackle limitations in the measurement of acculturation (Arends-Tóth & van de Vijver, 2007; Celenk & van de Vijver, 2011; Rudmin, 2009). This article addresses issues related to conceptual clarity, context specificity, language, scale length, and generalizability of measures.
To generate the items for these new scales, items from existing measures were compared with pilot data from individuals who were currently or had previously relocated abroad. This enabled the identification of the most salient aspects of each construct and formed the basis for the scale items. Reliability of these measures was tested initially in two student samples and a migrant sample. All scales showed good internal consistency. Each scale was translated into nine different languages from English and tested on a sample of exchange students. All translated scales demonstrated good reliability and structural equivalence.
The Brief Sociocultural Adaptation Scale (BSAS) and Brief Psychological Adaptation Scale (BPAS) were shown to measure related yet distinct constructs, supporting previous research and theoretical assumptions surrounding these two forms of adaptation (Searle & Ward, 1990). Both types of adaptation were also related to general measures of well-being. Interestingly, the relationship between well-being and the BPAS could indicate that general well-being measures are not a bad proxy for psychological adaptation (Cemalcilar & Falbo, 2008; Jansinskaja-Lahti, 2008; Rogers & Ward, 1993; Ward et al., 1998). Nonetheless, a context-specific measure of psychological adaptation is no doubt preferred.
Higher scores on the Brief Perceived Cultural Distance Scale (BPCDS) were related to poorer adaptation and well-being, supporting previous findings (Babiker et al., 1980; Furnham & Bochner, 1982; Mumford & Babiker, 1998; Suanet & van de Vijver, 2009). The relationship between perceived distance and adaptation was strongest for the BSAS, which is encouraging given that these two scales were constructed with the same items. This demonstrates that greater perceived difference between the home and host culture with regard to salient social and cultural elements does indeed translate to greater difficulty adjusting to those same elements. The fact that these two scales use the same items makes the interpretation of this relationship much more transparent and provides a good estimation of what may be the true relationship between perceived distance and sociocultural adaptation.
The home and host factors of the Brief Acculturation Orientation Scale (BAOS) were found to be positively associated with identification with the home and host culture, respectively (Phinney, 1990). Importantly, the home and host subscales were found to be only weakly related, providing further support that these two dimensions are independent (Berry, 1997; Ryder et al., 2000). In line with this, we argued that the BAOS subscales should be analyzed as independent and continuous variables (see also Arends-Tóth & van de Vijver, 2007; Rudmin, 2009). As the unimodality of the subscales in the sojourner sample presents a problem for dichotomization, an alternative analysis was conducted. Adaptation was regressed on the BAOS subscales, showing home orientation to be negatively related to adaptation and host orientation to be positively related.
Although previous research has repeatedly shown the benefits of maintaining the home culture (Berry et al., 2006; Brisset, Safdar, Lewis, & Sabatier, 2010; Ward & Kennedy, 1994), our results suggest that sojourners, who downplayed the importance of the home culture while strongly endorsing the host culture, reported higher levels of adaptation. This effect may be due to the particular characteristics of the sojourn and its participants. First, the sojourn was of a limited duration; sojourners return to their home country after a year. Therefore, the discounting of the home culture may only be temporary, as sojourners are likely to restore the orientation toward the home culture when they return home. Second, this group of sojourners is particularly motivated to engage with their host culture, almost to the point of assimilation. Placed in host families and participating in local education, these sojourners have extensive contact with host nationals (Geeraert, Demoulin, & Demes, 2013). This is contrary to international students in higher education, who are known to have little contact with the local population (Bochner, Hutnik, & Furnham, 1985; Boski & Biłas-Henne, 2008).
This finding reinforces the notion that a single acculturation model does not suit all acculturating groups (Geeraert & Demoulin, 2013) but that to further understand how groups differ, we need measures that are transferable across different contexts. Future research should therefore compare different acculturating populations using transferable measures such as the ones presented in this article. When assessing acculturation orientation, a regression approach should be used, allowing for the relative importance of home and host orientation in different acculturation settings to be examined.
Strengths and Limitations
Many existing acculturation scales have been developed for a particular study or are tailored for a specific population (e.g., Bourhis & Barrette, 2006). Applying these scales to other contexts is not always appropriate. The present scales were constructed with the aim to be generalizable across different relocating populations. These scales are conceptually clear and use simple items that should be meaningful to most relocating groups. To maximize the accessibility of these scales across different research contexts and populations, these scales were translated into a number of different languages. Across translations, the four scales showed acceptable levels of reliability and structural equivalence. The availability of scales in different languages is especially important in cross-cultural research.
Although the present scales are intended to be generalizable across different contexts and populations, we also acknowledge their limitations. The majority of our participants in the migrant and sojourner samples came from well-educated backgrounds. While on face value there is no reason to believe that these scales would not be suitable for samples with a different socioeconomic make-up, this is yet to be determined and should be investigated in future. Similarly, future research should test these scales on more diverse samples of temporary or permanent acculturation populations, such as immigrants and expatriate workers. While the newly developed scales should be applicable to sojourner and immigrant samples alike, we would not expect them to generalize to non-immigrant acculturation populations, such as indigenous people or national minorities.
Having been developed together, the BPAS, BSAS, and BPCDS are at the same level of specificity. In the past, psychological adaptation has been operationalized through general well or ill-being measures, such as depression or mood instruments (Cemalcilar & Falbo, 2008; Ward & Kennedy, 1996). In this article, we argue that there is a need for a context-specific measure, that is, psychological adaptation should be assessed in relation to the relocation. In parallel, measures of BSAS and BPCDS are thought to be inversely related, such that greater distance should be associated with more difficulty in adapting (Babiker et al., 1980; Searle & Ward, 1990; Ward & Kennedy, 1999). With the principle of compatibility in mind (Ajzen, 1988), the same items were developed for the BSAS and BPCDS.
A final guiding principle in the development of the present scales was scale length. Some existing scales consist of many items, making it quite lengthy. The current scales in contrast are brief and concise. Undoubtedly, long and brief scales have their advantages, and the approach chosen should depend on the research context. Longer scales are typically associated with good scale reliability and can provide greater depth in measurement. However, for complex designs with multiple instruments and/or repeated measures, shorter scales are more desirable (Galesic & Bosnjak, 2009). Hence, with a drive toward more longitudinal research, these new scales complement existing measures.
To summarize, a set of new scales were developed to measure psychological and sociocultural adaptation, perceived cultural distance and acculturation orientation. Designed to be context-specific, generalizable, and concise, these scales have a number of key strengths making them a worthy addition to the acculturation researcher’s toolbox.
Footnotes
Appendix
| Items for acculturation orientation |
| Have [home country] friends |
| Take part in [home country] traditions |
| Hold on to my [home country] characteristics |
| Do things the way [home country] people do |
| Have [host country] friends |
| Take part in [host country] traditions |
| Develop my [host country] characteristics |
| Do things the way [host country] people do |
| Items for psychological adaptation |
| Excited about being in [host country] |
| Out of place, like you don’t fit into [host country] culture (R) |
| A sense of freedom being away from [home country] a |
| Sad to be away from [home country] (R) |
| Nervous about how to behave in certain situations (R) |
| Lonely without your [home country] family and friends around you (R) |
| Curious about things that are different in [host country] a |
| Homesick when you think of [home country] (R) |
| Frustrated by difficulties adapting to [host country] (R) |
| Happy with your day-to-day life in [host country] |
| Items for sociocultural adaptation/perceived cultural distance |
| Climate (temperature, rainfall, humidity) |
| Natural environment (plants and animals, pollution, scenery) |
| Social environment (size of the community, pace of life, noise) |
| Living (hygiene, sleeping practices, how safe you feel) |
| Practicalities (getting around, using public transport, shopping) |
| Food and eating (what food is eaten, how food is eaten, time of meals) |
| Family life (how close family members are, how much time family spend together) |
| Social norms (how to behave in public, style of clothes, what people think is funny) |
| Values and beliefs (what people think about religion and politics, what people think is right or wrong) |
| People (how friendly people are, how stressed or relaxed people are, attitudes toward foreigners) |
| Friends (making friends, amount of social interaction, what people do to have fun and relax) |
| Language (learning the language, understanding people, making yourself understood) |
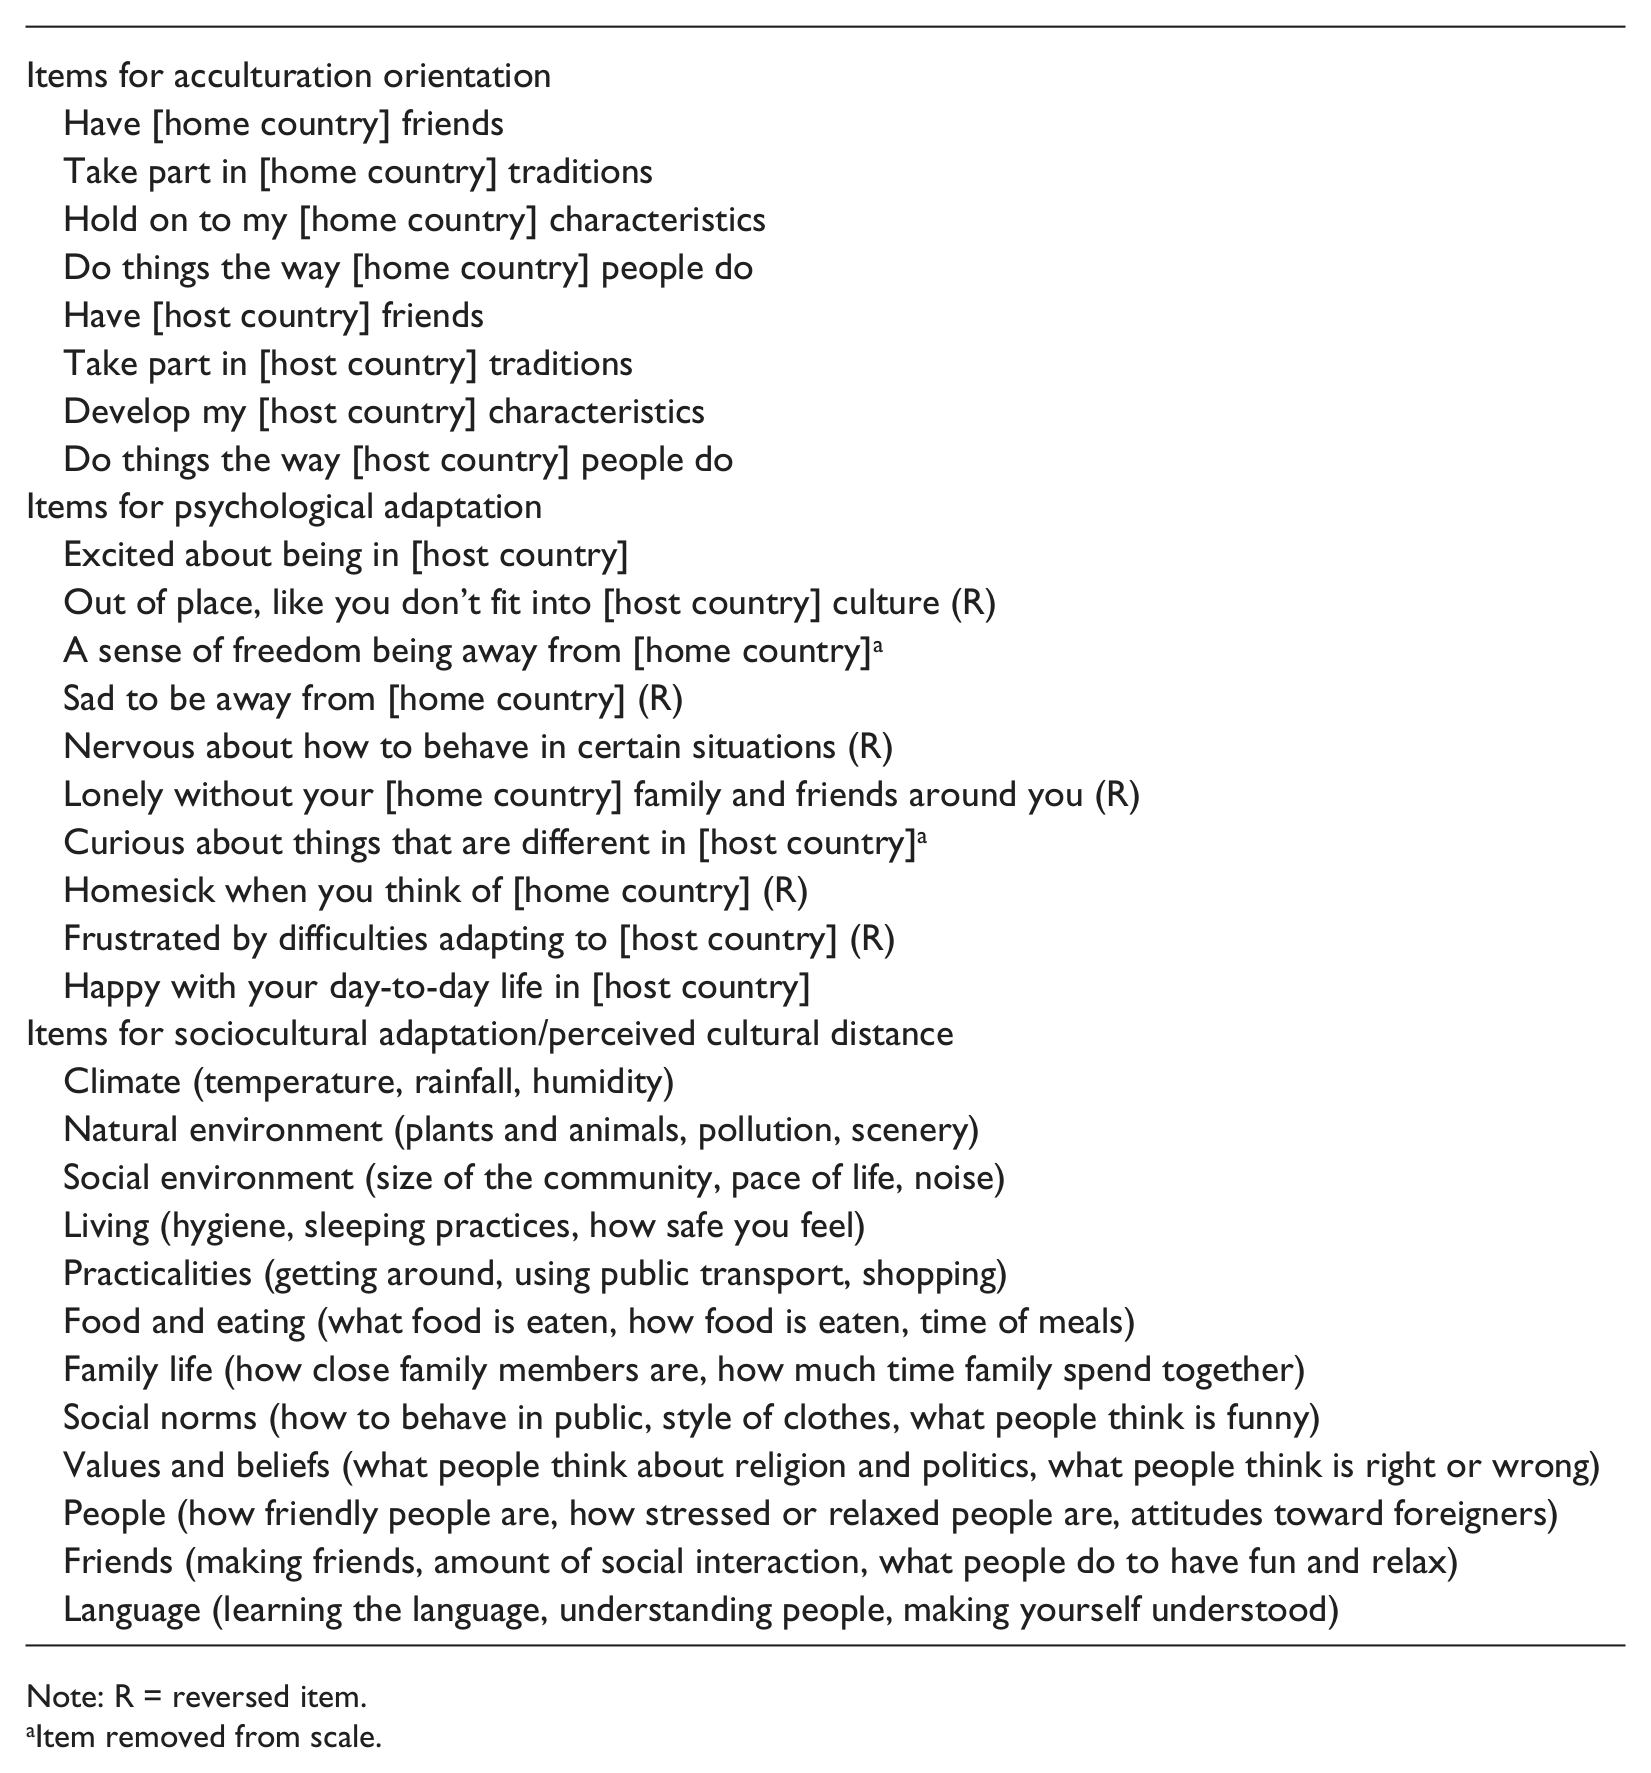
Note: R = reversed item.
Item removed from scale.
Acknowledgements
The authors wish to thank AFS Intercultural Programs for their contributions to this project.
Authors’ Note
Both authors contributed equally to this article.
Declaration of Conflicting Interests
The author(s) declared no potential conflicts of interest with respect to the research, authorship, and/or publication of this article.
Funding
The author(s) disclosed receipt of the following financial support for the research, authorship, and/or publication of this article: This research was supported by a research grant of the Economic and Social Research Council to the second author (ESRC RES-062-23-1211).