
Abstract
Event datasets, such as those provided by the Uppsala Conflict Data Program (UCDP), provide high-quality data on conflict fatalities. However, such data are likely to suffer from an unknown extent of bias and uncertainties in the reports they are based on. Although a substantial literature documents reporting bias in conflict research, analyses that quantify this bias are mostly limited to single countries. Here, we combine a survey with UCDP coders and statistical modeling to derive a distribution of plausible number of fatalities given the number of battle-related deaths and the type of violence documented by the UCDP. We provide a generalizable, cross-national measure of uncertainty around UCDP reported fatalities that is more robust and realistic than UCDP’s documented low and high estimates, countering UCDP’s intrinsic tendency to under-estimate fatalities, and we make available a dataset and R package that can be applied to future releases of the UCDP data.
Introduction
Empirical research on peace and conflict has increasingly relied on event datasets that provide information on armed conflict events and related deaths for multiple countries and over time. The majority of these datasets are based on automatic or manual coding of events from news and media sources, thus giving rise to potential reporting bias. Although this bias and its implications for conflict research are largely acknowledged, there is currently no systematic approach to quantify uncertainty about reported conflict fatalities, nor solutions to handle measurement error.
There are two types of uncertainty and bias in conflict event datasets. One relates to the unknown and uncertain events that fail to be reported at all in the available sources; the other, to bias and uncertainty in the events that are actually reported by credible news sources, government and NGO reports, etc. Most of existing research has focused on the former. In this article, we focus on the latter, and provide the first systematic modeling of uncertainty in armed conflict fatalities reported by the Uppsala Conflict Data Program (UCDP).
UCDP is one of the most acknowledged and widely used among conflict event datasets, reporting organized violence globally since 1989. The UCDP data are hand-collected based on a rigorous and immutable definition of armed conflict, and systematic and transparent coding rules, which make them comparable across cases and countries, and over time (Davies et al. 2025; Sundberg and Melander 2013). UCDP relies on local, national, and international news sources, as well as IGO, NGO and research centers’ monitoring efforts. The UCDP has unrivaled experience and allocates considerable resources to assess reporting bias, using multiple sources for each event wherever feasible. Still, some bias is unavoidable. UCDP has a known tendency to be conservative when uncertain, but little is known about the amount of this bias, as the UCDP does not provide a simple, consistent estimate of their own uncertainty about the number of deaths in the events they report.
Here, we propose a simple modelling framework that translates UCDP's expert knowledge into usable uncertainty measures for conflict fatalities. We leverage UCDP’s knowledge through a survey with their coders to construct a model that can generate probability distributions of plausible fatality levels for all possible events and related fatalities coded in the UCDP dataset. We use this model to estimate the probability distribution of the most plausible number of fatalities for any conflict event reported by UCDP. As the survey with UCDP coders gives us expert estimates of uncertainty around reported fatalities by violence type and for varying contexts, the resulting estimates of uncertainty can be generalized across countries and settings.
Our analysis suggests that the coders believe that fatalities in UCDP data are generally under-reported. Further, we find that the relative estimated rate of under-reporting decrease non-linearly with the number of fatalities. For low-fatality events, with a reported best estimate of 100 fatalities or less, the estimated rate of under-reporting is around 100 percent for events with one fatality, decreasing to around 30 percent for events with at least 100 fatalities and approaching zero for very high-fatality events, in excess of 23,000 fatalities. At the same time, the associated uncertainty, that is the width of the estimated fatality distribution, increases considerably with the size of the conflict event.
The results contribute to existing research on measurement uncertainty and media bias in conflict events by augmenting the UCDP ‘best’ death estimates with distributions of plausible values of fatalities, as assessed by the UCDP coders themselves, based on their knowledge of the coding procedures and information sources. Our approach yields two useful additions to the UCDP data: a more general and useful estimate of uncertainty than the current ‘low’ and ‘high’ estimates they provide; and a remedy to UCDP’s tendency to publish conservative estimates of fatalities. As UCDP is one of the most widely used conflict event datasets globally, these additions are particularly relevant to conflict scholars.
Our simulation approach is parsimonious, simple, fast to replicate, can be applied to future releases of UCDP data, and offers a practical tool to address measurement bias in conflict research. To facilitate the uptake of our model, we released the R package
In our replication analysis, we show how to account for uncertainty in fatalities in empirical studies of conflict, as a simple solution to increase transparency and strengthen the robustness of regression models using UCDP data.
By improving our understanding of uncertainty around conflict deaths in UCDP data, this approach can open new research avenues on the implications of measurement error for the statistical analysis of conflict data. Our practical solution to account for measurement uncertainty can easily be applied in other domains, and thus contribute to the ongoing debate on measurement error in data derived from expert judgments.
Uncertainty in Conflict Data
We can distinguish two main types of uncertainty in conflict fatalities: first, uncertainty around conflict events that are completely unreported in any source of information. This is the so-called ‘fog of war’, or the inherent uncertainty in conflict fatalities related to missing people that are not recorded as dead, or conflict events that are completely undocumented – what we here refer to as ‘unknown and uncertain’ events.
A second type of uncertainty, also referred to as measurement uncertainty or error, concerns conflict events that are in fact documented, but for which the number of related fatalities is not completely certain. This latter type of uncertainty can arise from how coders apply different definitional aspects (see e.g., Otto 2013; Restrepo et al. 2006; Tabeau and Zwierzchowski 2013), for example concerning the count of fatalities, the actors involved in the conflict, the type of violence (one-sided, state-based, or non-state), and the geographic and temporal precision of the event. Uncertainty around the number of fatalities in documented conflicts can also stem from biases inherent in the underlying information sources.
The problem of measurement error is well-known in social science survey research, which has exposed the challenges in dealing with latent variables from expert judgments (Blackwell et al. 2017; Knutsen et al. 2024; Little and Meng 2024; Marquardt 2020). Although these studies have improved the measurements of concepts like democracy, human rights, or public opinion, the issue of how to account for measurement error into empirical analyses remains unresolved. Standard approaches to handle measurement error are not robust to violations of the assumption of independence (Blackwell et al. 2017): If measurement error is correlated with other variables, the most common approach is to ignore it, but this is equivalent to assume that the data are measured perfectly (Blackwell et al. 2017) and thus distorts inference (e.g., Crabtree and Fariss 2015).
In the peace and conflict domain, studies have mostly focused on the first type of uncertainty referred to above. These studies aim at uncovering the magnitude of completely unreported conflict episodes, which remain undocumented in event datasets coded from the media. This research largely relies on comparisons between media-based event datasets and ‘ground truth’ data collected from non-media sources (Ball and Price 2018; Guzmán et al. 2012; Hoover Green and Ball 2019; Krüger and Ball 2014; Price et al. 2015; Sloboda et al. 2013; Tabeau and Zwierzchowski 2013).
A second strand of literature focuses on detecting contextual factors that shape uncertainties in conflict fatalities, for example by relating media coverage to country or local attributes to uncover parallel trends, or by exploiting information available from the coding process of the event datasets to draw inference about events precision and uncertainty.
These studies find that the precision of conflict reporting varies by country and year in which the event takes place (Davenport and Ball 2002; Herkenrath and Knoll 2011), and is influenced by socio-economic and political conditions including international trade (Dietrich and Eck 2020), freedom of the press, political regime, and presence of human right organizations (Baum and Zhukov 2015; Dietrich and Eck 2020; Drakos and Gofas 2006). Studies also show that different types of violence tend to be reported differently across information sources (Davenport and Ball 2002), depending on their proximity to the event (Gritten et al. 2012), idiosyncratic biases towards violent perpetrators (Ariyanto et al. 2008; Radford et al. 2023) and victims (Otto 2013), as well as political regime type. While media in democracies tend to over-report terrorist episodes as well as non-violent collective actions especially by regime opponents, media outlets in autocracies under-report these events but inflate violent acts by rebel groups (Baum and Zhukov 2015; Drakos and Gofas 2006). Geographic factors such as distance to internet access, information and communication technology, or major settlements also help predict the precision of conflict event reports (Croicu and Kreutz 2017; Dietrich and Eck 2020; Weidmann 2015).
These studies have greatly advanced our knowledge of reporting bias and measurement uncertainty in conflict event datasets. However, they are either concerned with estimating the true, undocumented number of fatalities related to the ‘unknown and uncertain’ events for specific case studies, or they focus on contextual drivers of uncertainty in fatalities related to documented events. A systematic effort to provide a measure of uncertainty in fatalities for events that are documented, and which can be generalized across different contexts, has yet to be undertaken.
Here, we fill this gap by augmenting UCDP estimates of deaths with a probability distribution of plausible values of fatalities, for any fatality level recorded in the UCDP dataset. The resulting distributions provide a more realistic and robust confidence interval around UCDP best estimates than their documented high and low estimates. We leverage the expert knowledge of the UCDP team coupled with statistical simulations to obtain an estimate of uncertainty that is generalizable across information contexts, settings, and violence types.
Methods
UCDP Coding of Fatalities
UCDP defines armed conflict as a violent event where the use of armed force leads to at least 25 battle-related deaths at the country level in one calendar year (Davies et al. 2025; Gleditsch et al. 2002). UCDP consistently reports on three types of organized violence: state-based conflict, where the use of armed force involves at least one governmental actor; non-state conflict between two organized groups, none of which is the government of a state, and one-sided violence, where an organized actor deliberately targets civilians.
For each event and each type of violence, UCDP reports a ‘best estimate’ of the number of people killed, which represents the most reliable count of deaths associated to that event (Högbladh 2025; Sundberg and Melander 2013). We will refer to this as the ‘reported value’ for the event, denoted as
Importantly, UCDP low and high estimates do not represent a confidence interval around the best estimate: they are the result of a systematic coding process, and reflect the uncertainty and reliability of available sources, but they are not an estimate of measurement error. 1
UCDP distinguishes two types of conflict events by ‘clarity’ (Högbladh, 2025): ‘ordinary’ single events with high clarity (1), and ‘summary’ events with lower clarity (2). Events coded with clarity 1 are those for which the source is sufficiently detailed to identify individual incidents in a single location and date. ‘Summary’ events describe cases when one or multiple sources aggregate violent incidents for a given location over a longer period (e.g., a month), such that individual events cannot be disentangled (Croicu and Sundberg 2013). To avoid double-counting, fatalities from individual events are subtracted from fatalities reported in summary events in the same location and time span. Additional coding rules adopted by UCDP specify how to attribute fatality numbers to ‘high’, ‘low’, and ‘best’ to reflect the uncertainty about conflict contexts and the reliability of sources. For example, when the coding of an event is drawn from a single biased source, UCDP only codes fatalities related to that event as high. In these cases, the high estimate may be lower than the best estimate if later summary events are coded from non-biased sources, as UCDP reports fatalities from such non-biased sources in the best and low category, but subtracts them from the high category to avoid duplication. 2
These protocols are fundamental in ensuring consistency in the definition of political violence and comparability across contexts, but they also contribute to explain the variation in reported fatality figures across different conflict event datasets (Öberg and Yilmaz 2025). To increase transparency, UCDP documents these coding rules internally, as well as externally through publicly available codebooks (see Högbladh 2025, https://ucdp.uu.se/downloads/ged/ged251.pdf). However, this information is conveyed in a form that is specific to distinct sub-cases, and is not a practically useful or accessible representation of uncertainty. The UCDP coding protocol also contains a number of other practices based on an understanding of uncertainty which is documented, yet not easily accessible by users. For instance, a news report stipulating ‘many fatalities’ will be coded as 3 fatalities by the UCDP according to their practice. All UCDP coders know in this case that a coding of ‘3 fatalities’ in many cases means ‘3 or more’ rather than ‘3’. A coding of ‘4 fatalities’, on the other hand, is more precise according to this coding convention. These rules are encompassed in the so-called ‘vague number translator’ reported in the online appendix (section A1).
The approach we describe below taps into the UCDP knowledge about all of these documented but internal coding practices, in addition to their accumulated experience and understanding about uncertainty in conflict reporting. We seek to present the UCDP coders’ uncertainty in the form of probability distributions over all possible fatality counts, given the published report. This format has the advantage of being uniform across all cases, but ignores the detailed information about the sources of the uncertainty in the original UCDP coding.
Survey With UCDP Coders
We rely on a survey with UCDP to extract coders’ probabilistic assessments of plausible fatalities – the ‘coder distributions’ – given the reported value and the type of violence recorded in the UCDP dataset.
To this end, we first conducted a workshop with 15 UCDP coders (almost the entire team) to discuss the main concepts, delimit the scope and ambition of the survey, and pilot it. The UCDP coders undergo extensive training on the coding rules and attend weekly consultations on difficult cases, which increases inter-coder reliability. In our sample, coders have 2–5 years of experience, although considerable variations exist, with 3 coders having more than 10 years of experience, and 2 coders having less than 1 year of experience. Variations across coders’ backgrounds, behaviors, and systematic biases in their perception can play a role in our analysis (Marquardt 2020); While we leave it to future research to measure how inter-coder reliability affect uncertainty in conflict data, the approach illustrated here at least partially reflects inter-coder variations in the estimate of uncertainty (see appendix Figures A6–A7).
The workshop focused on UCDP’s coding procedures to understand how uncertainty around the most plausible number of deaths varies depending on the information context, the type of violence, and other characteristics of the country in which the event takes place. The discussion provided us with a broad understanding of how uncertainty is assessed by coders and reflected in their coding rules.
Next, we administered a questionnaire through Qualtrics to elicit probability intervals of ‘actual’ conflict fatalities given the reported ones, and to cover all types of conflict events coded by UCDP. The first part included country-level questions. We first asked respondents to indicate which of the countries they have ever coded for has the ‘best’ information coverage and reliability, and which country has the ‘worst’. The best country represents a context where information sources on the conflict event are relatively accessible, abundant and reliable; the worst, one where information is scarce, incomplete, or unreliable.
We also asked some calibration questions to understand which factors, for example type of violence, information provider, or political regime, shape the availability and reliability of information. As explicitly modeling how each factor shapes uncertainty in fatalities is beyond the scope of this study, these questions are descriptive in nature, and do not link each factor to different levels of fatalities (which would be required for inclusion in the statistical modelling described below). Yet, responses show that coders are highly aware of drivers of uncertainty, in line with the existing literature (see section A1.2 in the appendix for a discussion). This awareness is implicitly accounted for in the coders’ responses, as event-level questions are iterated across information contexts of different quality, letting coders free to adjust their responses based on differences in the information environment.
The main part of the questionnaire included event-level questions, where we retrieved the ‘coder distributions’ – a representation of each coder’s subjective probability density function (PDF) – over the ‘true’ number of fatalities for an event, given how UCDP coded it. We iterated these questions over best and worst information contexts, and the three types of violence coded by UCDP. For a selected number of fatalities reported in the UCDP dataset, which spanned the major contexts identified in preliminary discussions with UCDP (equal to 0, 1, 2, 3, 13, 20, 24, 40, 47, 100, 101, 200, 201, 1,000, 1,001, 2,000, 2,001, 10,000, 100,000) we asked coders how likely it is that the ‘true’ number of fatalities related to the event lies in a specified interval. The response intervals in the survey varied according to the level of reported fatalities for which we asked questions. The response options were: Extremely likely (90–100 percent), Somewhat likely (60–90 percent), Neither likely nor unlikely (40–60 percent), Somewhat unlikely (10–40 percent), Extremely unlikely (0–10 percent). An example survey question and resulting coder distribution is presented in Figure 1, for an event recorded by the UCDP to involve Example question, response options and resulting responses in the survey administered to the UCDP team, for 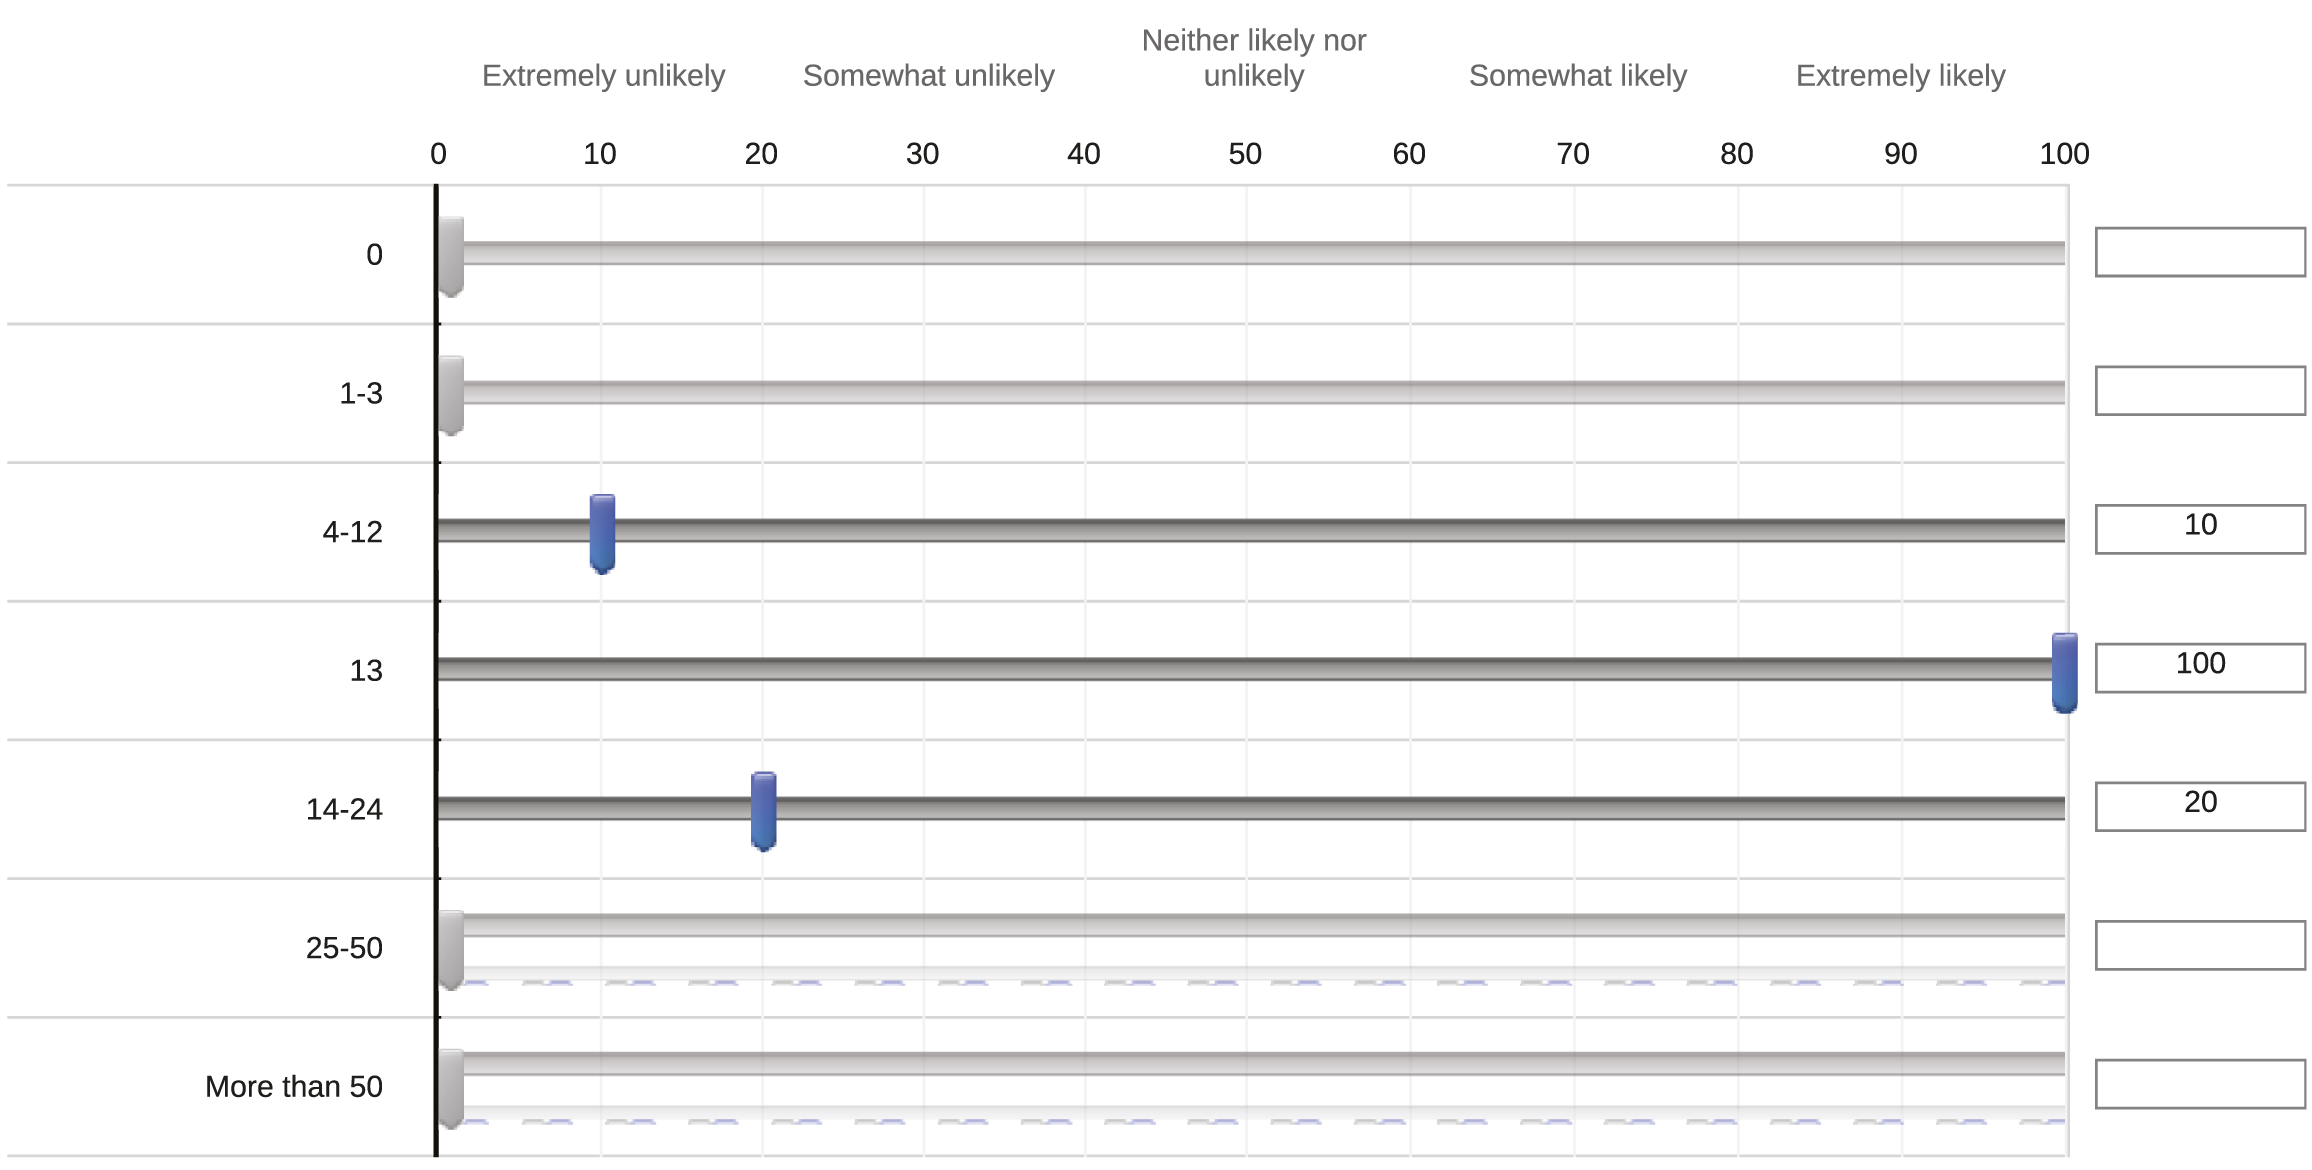
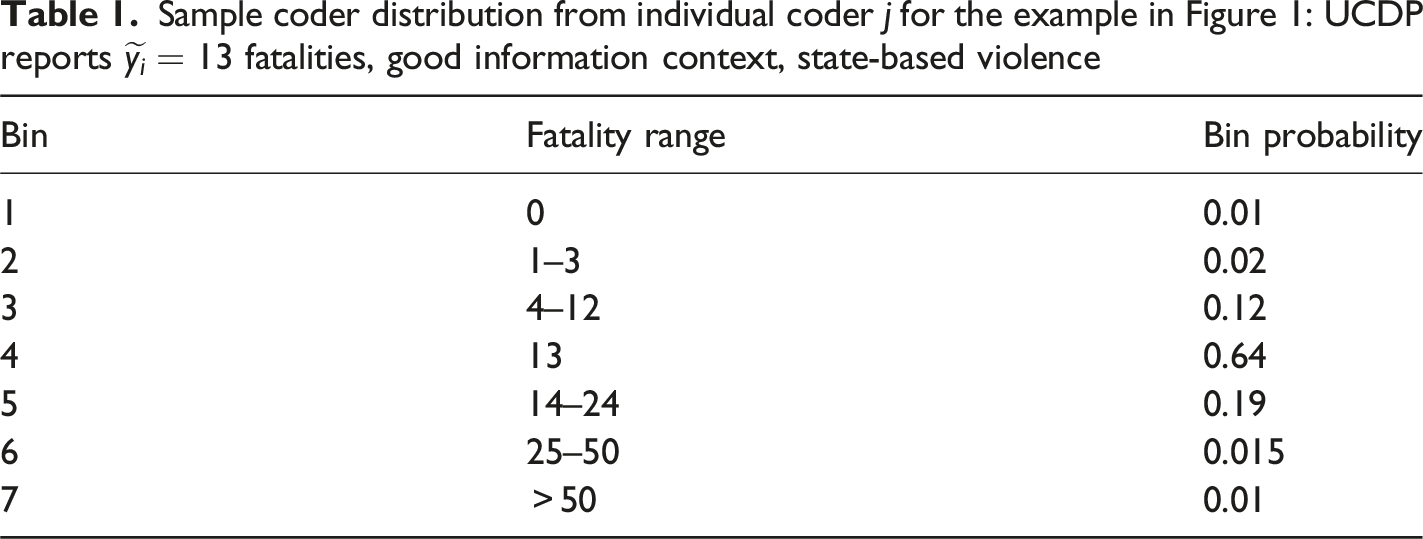
Sample coder distribution from individual coder j for the example in Figure 1: UCDP reports
The statistical analysis of the survey results is described in the next section.
Statistical Modelling
Our estimation strategy aims to build a simple and generalizable model of uncertainty in UCDP fatalities which can be applied to new releases of UCDP data, while accounting for how uncertainty varies with UCDP coding rules, violence types, and information contexts. As the survey asked a finite number of questions, however, we could collect the coders’ probabilistic assessments only for a limited number of reported values. The task is therefore to construct a model that generalizes these responses beyond the surveyed values. For example, if UCDP codes
Estimation Strategy: A Model of y i
We can think of the distribution of plausible values for the true number of fatalities of an event i as a PDF with parameters 

The c i variable was aggregated directly from coders’ ranking of best and worst information contexts out of all countries they had documented. Coders are aware of how the information quality and quantity vary, and what shapes these variations (see section A1.2), and they incorporate this awareness in their survey responses, as event-level questions are iterated for different information contexts. Therefore, the model implicitly accounts for UCDP’s expert opinion of how uncertainty in conflict reporting varies depending on the coverage and quality of information sources.
Our objective is to identify a parametric distribution with parameters
To achieve this, we implement a two-stage procedure. In the first stage, we consider a range of candidate distributions and, for each distribution, coder j, and event i, estimate the parameter vector
As plausible distributions for fatalities in the first stage, we evaluate the normal, lognormal, Gumbel, negative binomial, and Poisson distributions, as well as reported-value inflated (RVI) mixture variants of each. The RVI mixture distributions combine a standard parametric distribution with a point distribution at the reported UCDP value, governed by an additional parameter, the mixture weight w. The RVI mixture distributions are designed to capture coders’ tendency to place disproportionate probability on the recorded estimate relative to what the standard distribution would imply.
In the first stage of the procedure, we obtain optimal parameters
In the second stage, we estimate regression models to predict the The two-step procedure for evaluating any given distribution, presented for two example coders and two fatality levels and for the point-value inflated lognormal distribution.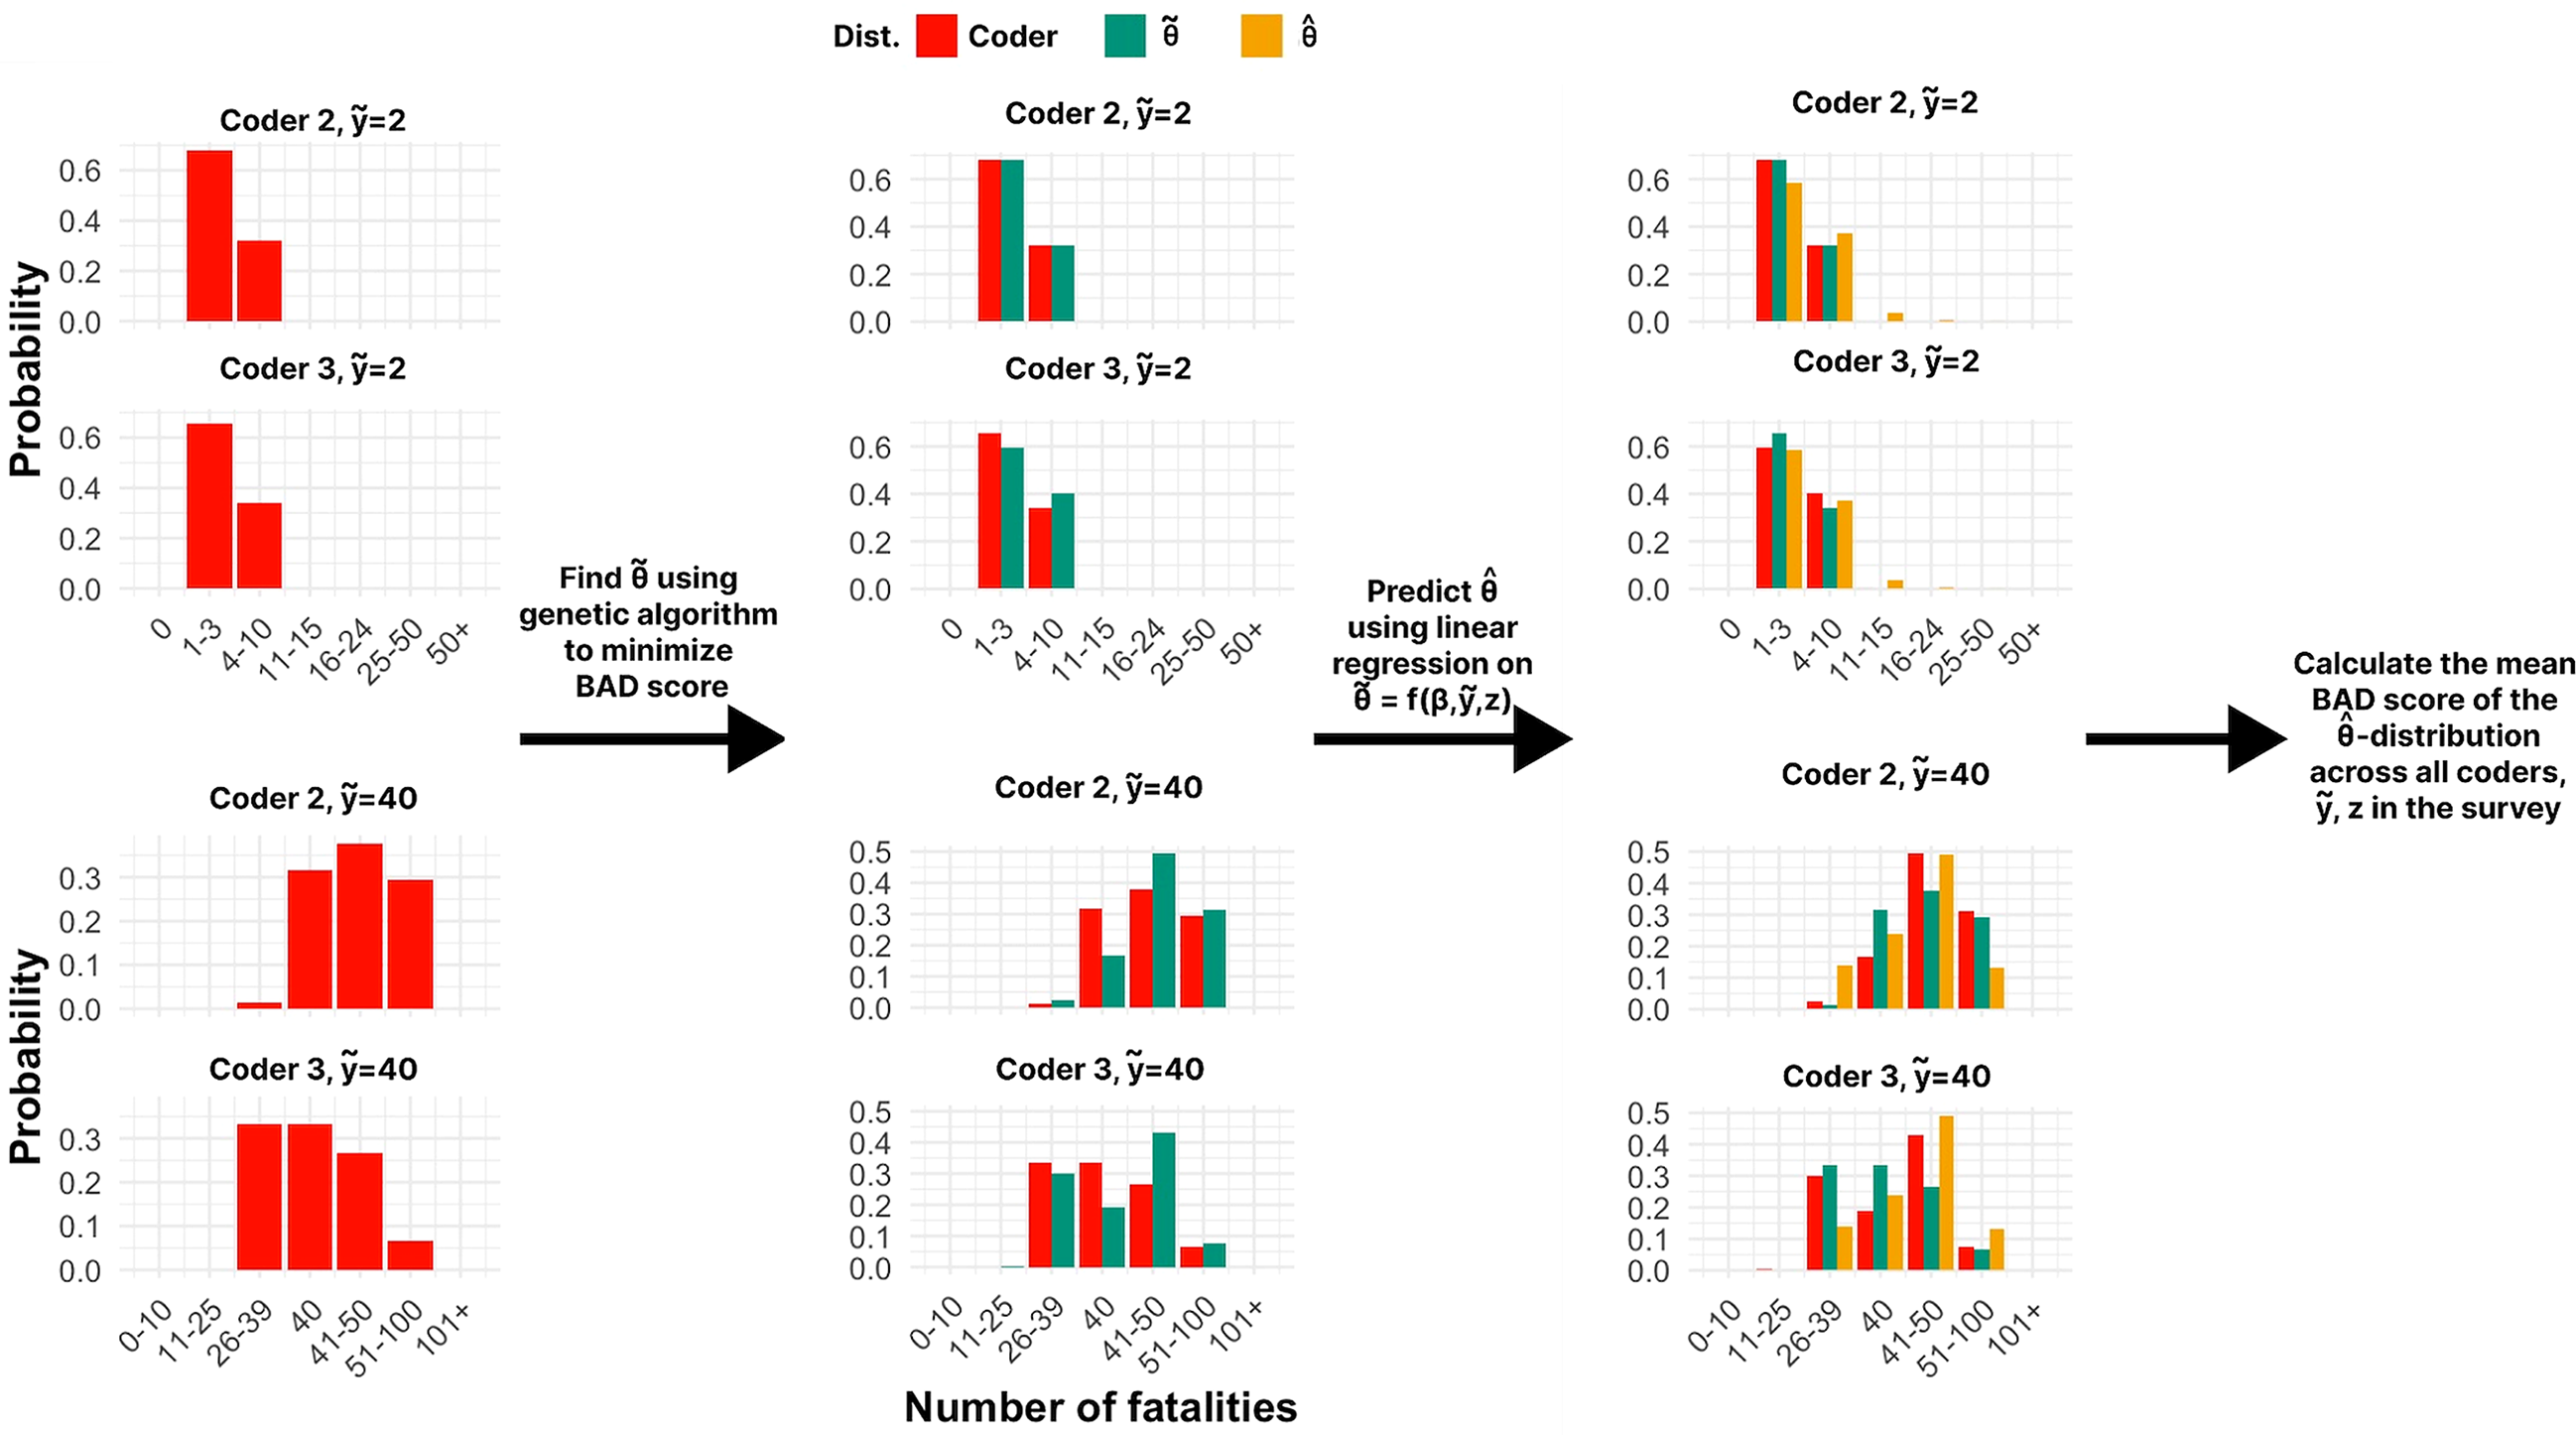
Our preferred model, presented in the next section, includes the combination of covariates that best approximates the coders’ distribution, while also retaining parsimoniousness and generalizability.
Results
Model Specifications That Best Approximate Coders’ Distribution of Uncertainty
The mean and median BAD scores for the best performing specification per distribution and type of violence are shown in Tables A2–A5 in the Online Appendix. As all types of violence show similar aggregate coders’ distributions (Figures A1–A4), we focus on state-based violence in the remainder of the paper. While differences across distributions are modest, the results consistently indicate that the RVI Gumbel mixture yields the lowest aggregate median BAD scores across violence types. 6
The RVI Gumbel mixture distribution is characterized by three parameters: a location parameter θ1 = μ g , which determines the center of the continuous component; a scale parameter θ2 = β g , which governs the dispersion of plausible fatality counts; and a mixture weight θ3 = w, which represents the excess probability mass placed on the reported UCDP fatality count (i.e., inflation at the reported value). The strong performance of the RVI Gumbel mixture distribution is in line with expectations about uncertainty in fatalities: its right-skewed shape accommodates the asymmetric nature of reporting uncertainty; its lighter upper tail relative to the log-normal distribution avoids assigning undue weight to extreme values that coders view as unlikely, while the RVI – which concentrates probability at the best estimate – captures the coders’ belief that the UCDP reported value of fatalities is the single most likely value, even when acknowledging substantial uncertainty. 7 This explains why mixture distributions consistently outperform their non-mixture counterparts.
In the second stage, where we predict
The results of our tests are shown in Tables A6–A9 in the Online Appendix, which report the mean and median BAD scores for the different types of violence and for different sets of covariates. Contrary to our expectations, including c i does not substantially improve accuracy: For both the coders’ distributions (Figures A1–A3) and the modelled distribution of fatalities (Figure A4) 8 differences in predictive performance when including or omitting the information context c i are marginal. Uncertainty is predominantly explained by the intensity of violence reported in the UCDP dataset, as well as internal coding rules defining how textual information is translated into numbers (proxied by D i ).
This is an important insight: Internal coding rules have largely been neglected by research on measurement error in conflict data, which has mostly focused on the role of external factors in driving reporting accuracy. This omission is striking given the substantial variation in coding rules across event datasets. Understanding how internal coding processes shape uncertainty is particularly urgent given the rapid adoption of Large Language Models for automated conflict event data coding (Brandt and Sianan 2025; Skorupa Parolin et al. 2022; Steinert and Kazenwadel 2025), as algorithms trained on human-coded data may reproduce and amplify dataset-specific biases into systematic, large-scale distortions.
Given the minor contribution of the c
i
term to predictive performance, and since omitting it from the model saves us from estimating the quality of information context for any individual event, we opt for a parsimonious specification that includes
These covariates explicitly capture the uncertainty around UCDP coders’ application of the violence definition, their rules on how to translate textual sources into fatality counts, and their beliefs about how uncertainty varies with reported fatality levels. Moreover, the model implicitly reflects coders’ beliefs about how reporting uncertainty varies across contexts, as their survey responses were elicited across diverse countries and information environments. The resulting aggregate distribution, which the model generalizes, incorporates the full range of coders’ assessments, informed by their extensive experience on how contextual factors shape information availability, quality, and potential systematic under- or overreporting across conflicts. A broad set of context- and conflict-specific considerations, extending beyond the vague number translator, are implicitly encompassed in the model. This might explain why adding the binary variable c i does not improve the model’s performance. Overall, our simple approach can provide a measure of uncertainty in UCDP’s best estimates that generalizes across countries and settings – which is important to ensure consistency with the cross-national and time-varying UCDP data.
The results from the regression analysis (Table A10), show that there is a strong linear relationship between the logarithm of the number of reported fatalities and the location parameter of the gumbel distribution, indicating that higher reported mean values are associated with higher values in the plausible fatality distribution.
Using the predicted parameters, we compute the mean of the RVI gumbel mixture distribution and compare it against the reported value. The results, visualized in Figure 3, suggest that UCDP fatality counts tend to be under-reported on average, with the estimated under-reporting – defined as the ratio between the predicted mean and the reported count – decreasing non-linearly with the number of reported fatalities. For reported fatality levels under 100, the estimated rate of under-reporting ranges from over 100 percent – for events with 1 fatality – to around 30 percent – for events with 100 fatalities. For medium levels of conflict intensity (e.g., 100–500), the ratio of under-reporting continues to decrease, reaching approximately 25 percent for 250 fatalities and 20 percent for 500 fatalilties. At very high levels of violence (e.g., The line shows the predicted μ, denoting the overall mean of the plausible fatality level (y axis) for any given level of fatality reported by UCDP (x axis), according to our preferred model specification. The dots represent the predicted means for each sample of 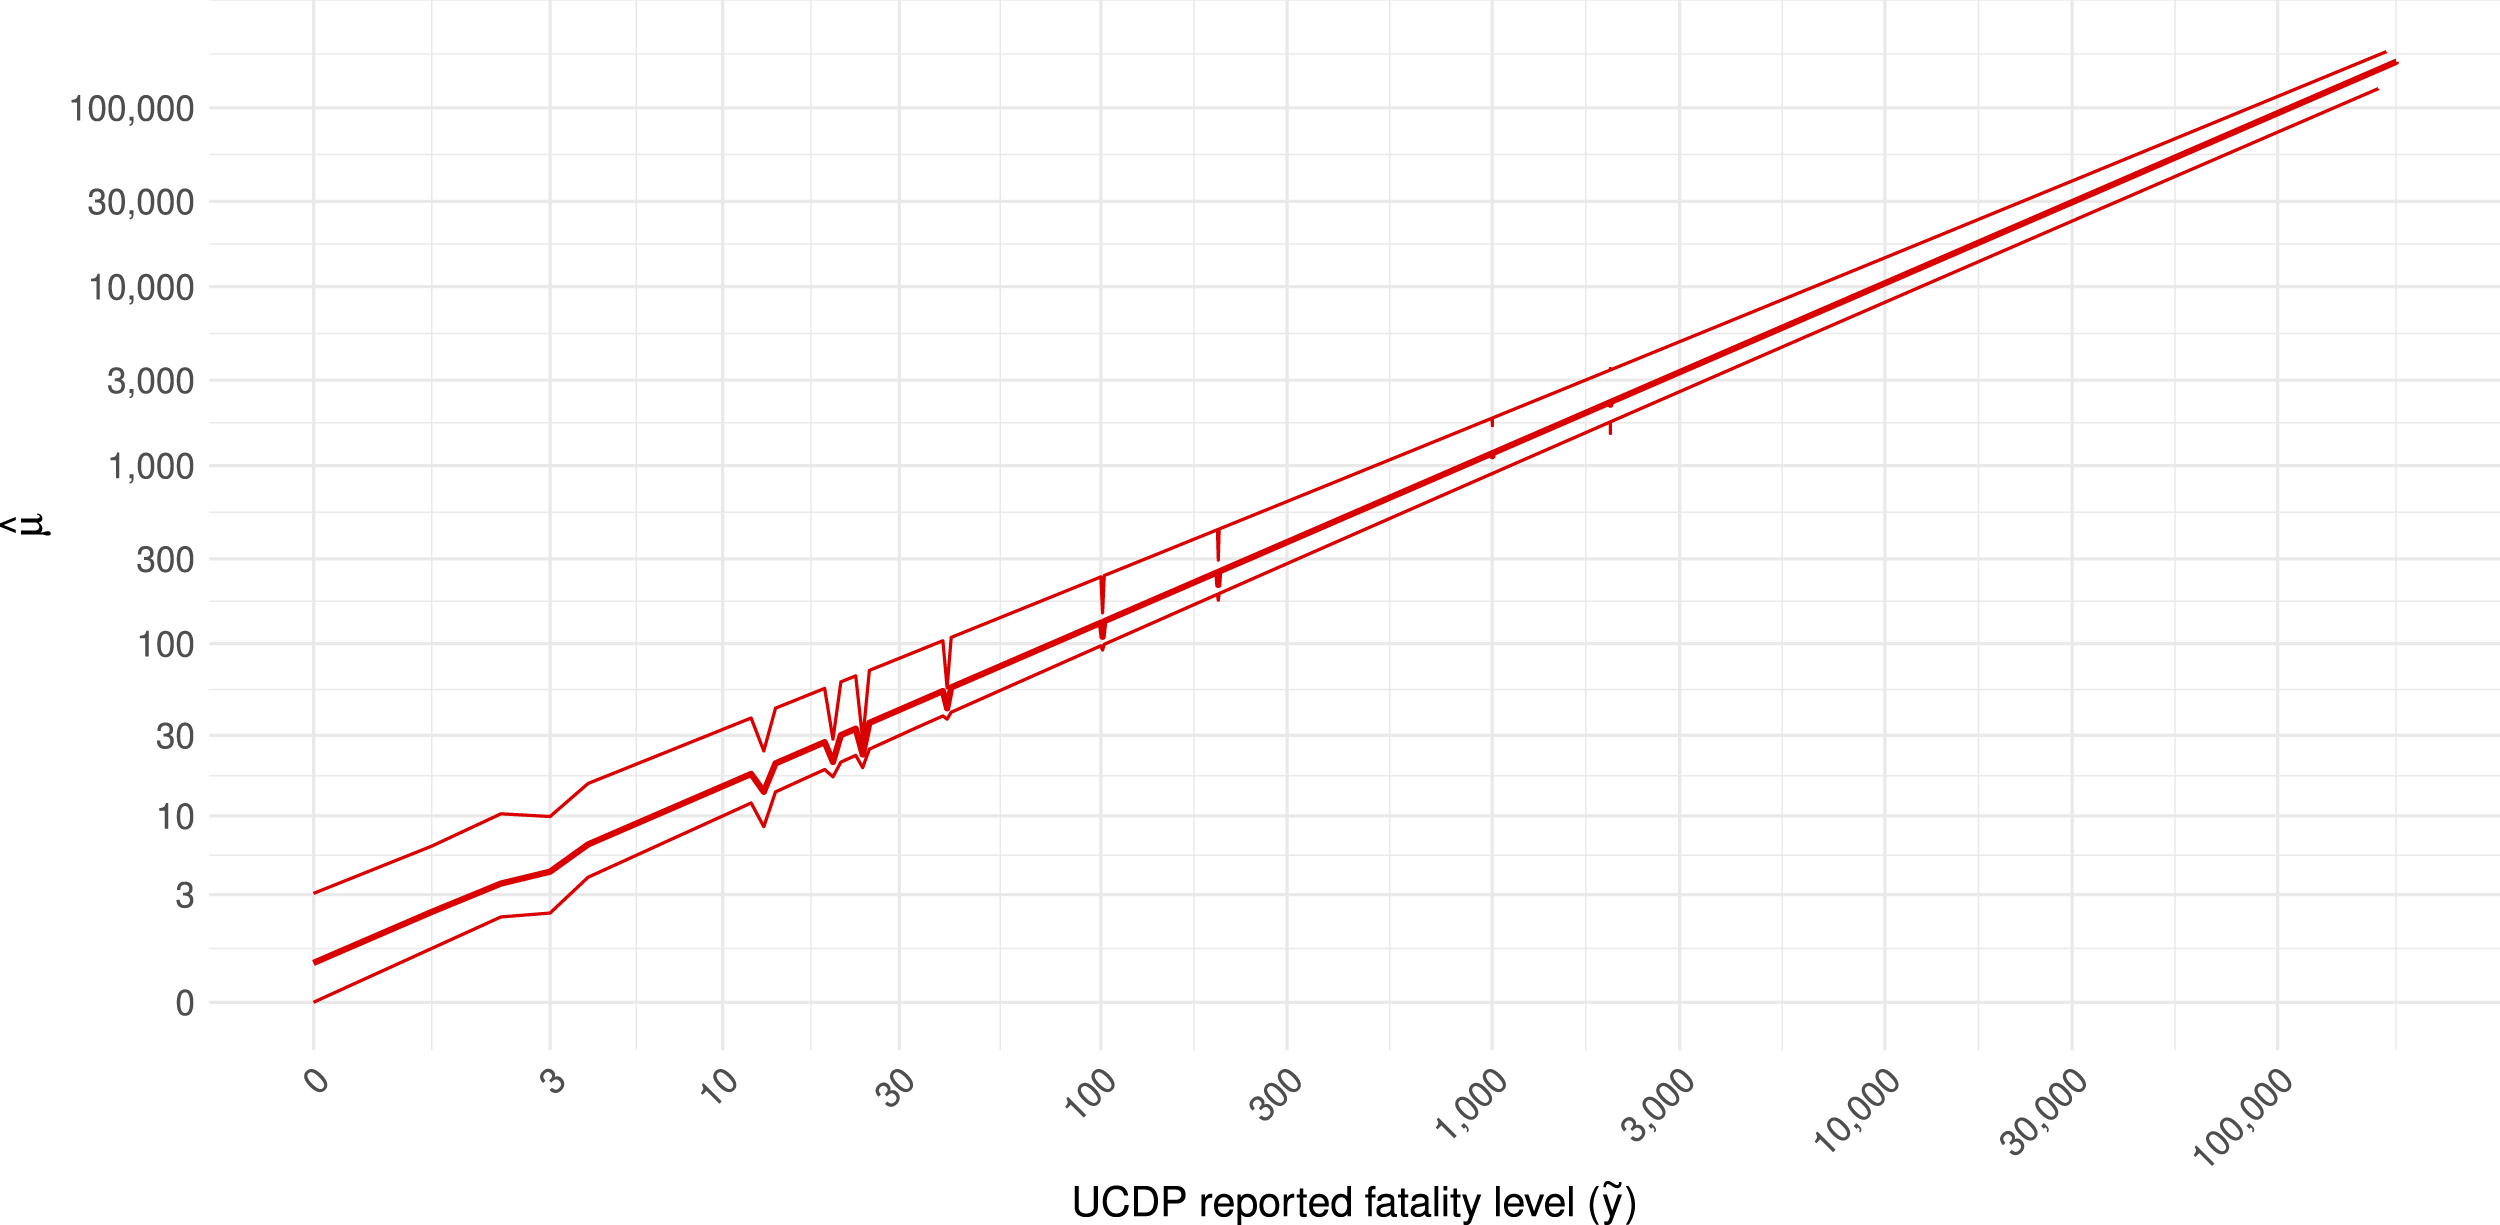
Moreover, the results show that the dummies for the vague numbers in the UCDP generally have negative effects on the first two parameters of the distribution, indicating that, according to the coders, these vague numbers (except for
We can also use the fitted regression models to produce densities of plausible actual values of fatalities given a specific reported value and type of violence, and for any given event in the UCDP dataset. Figure 4 shows the densities of the plausible number of fatalities for eight different The facets each show a density for a specific 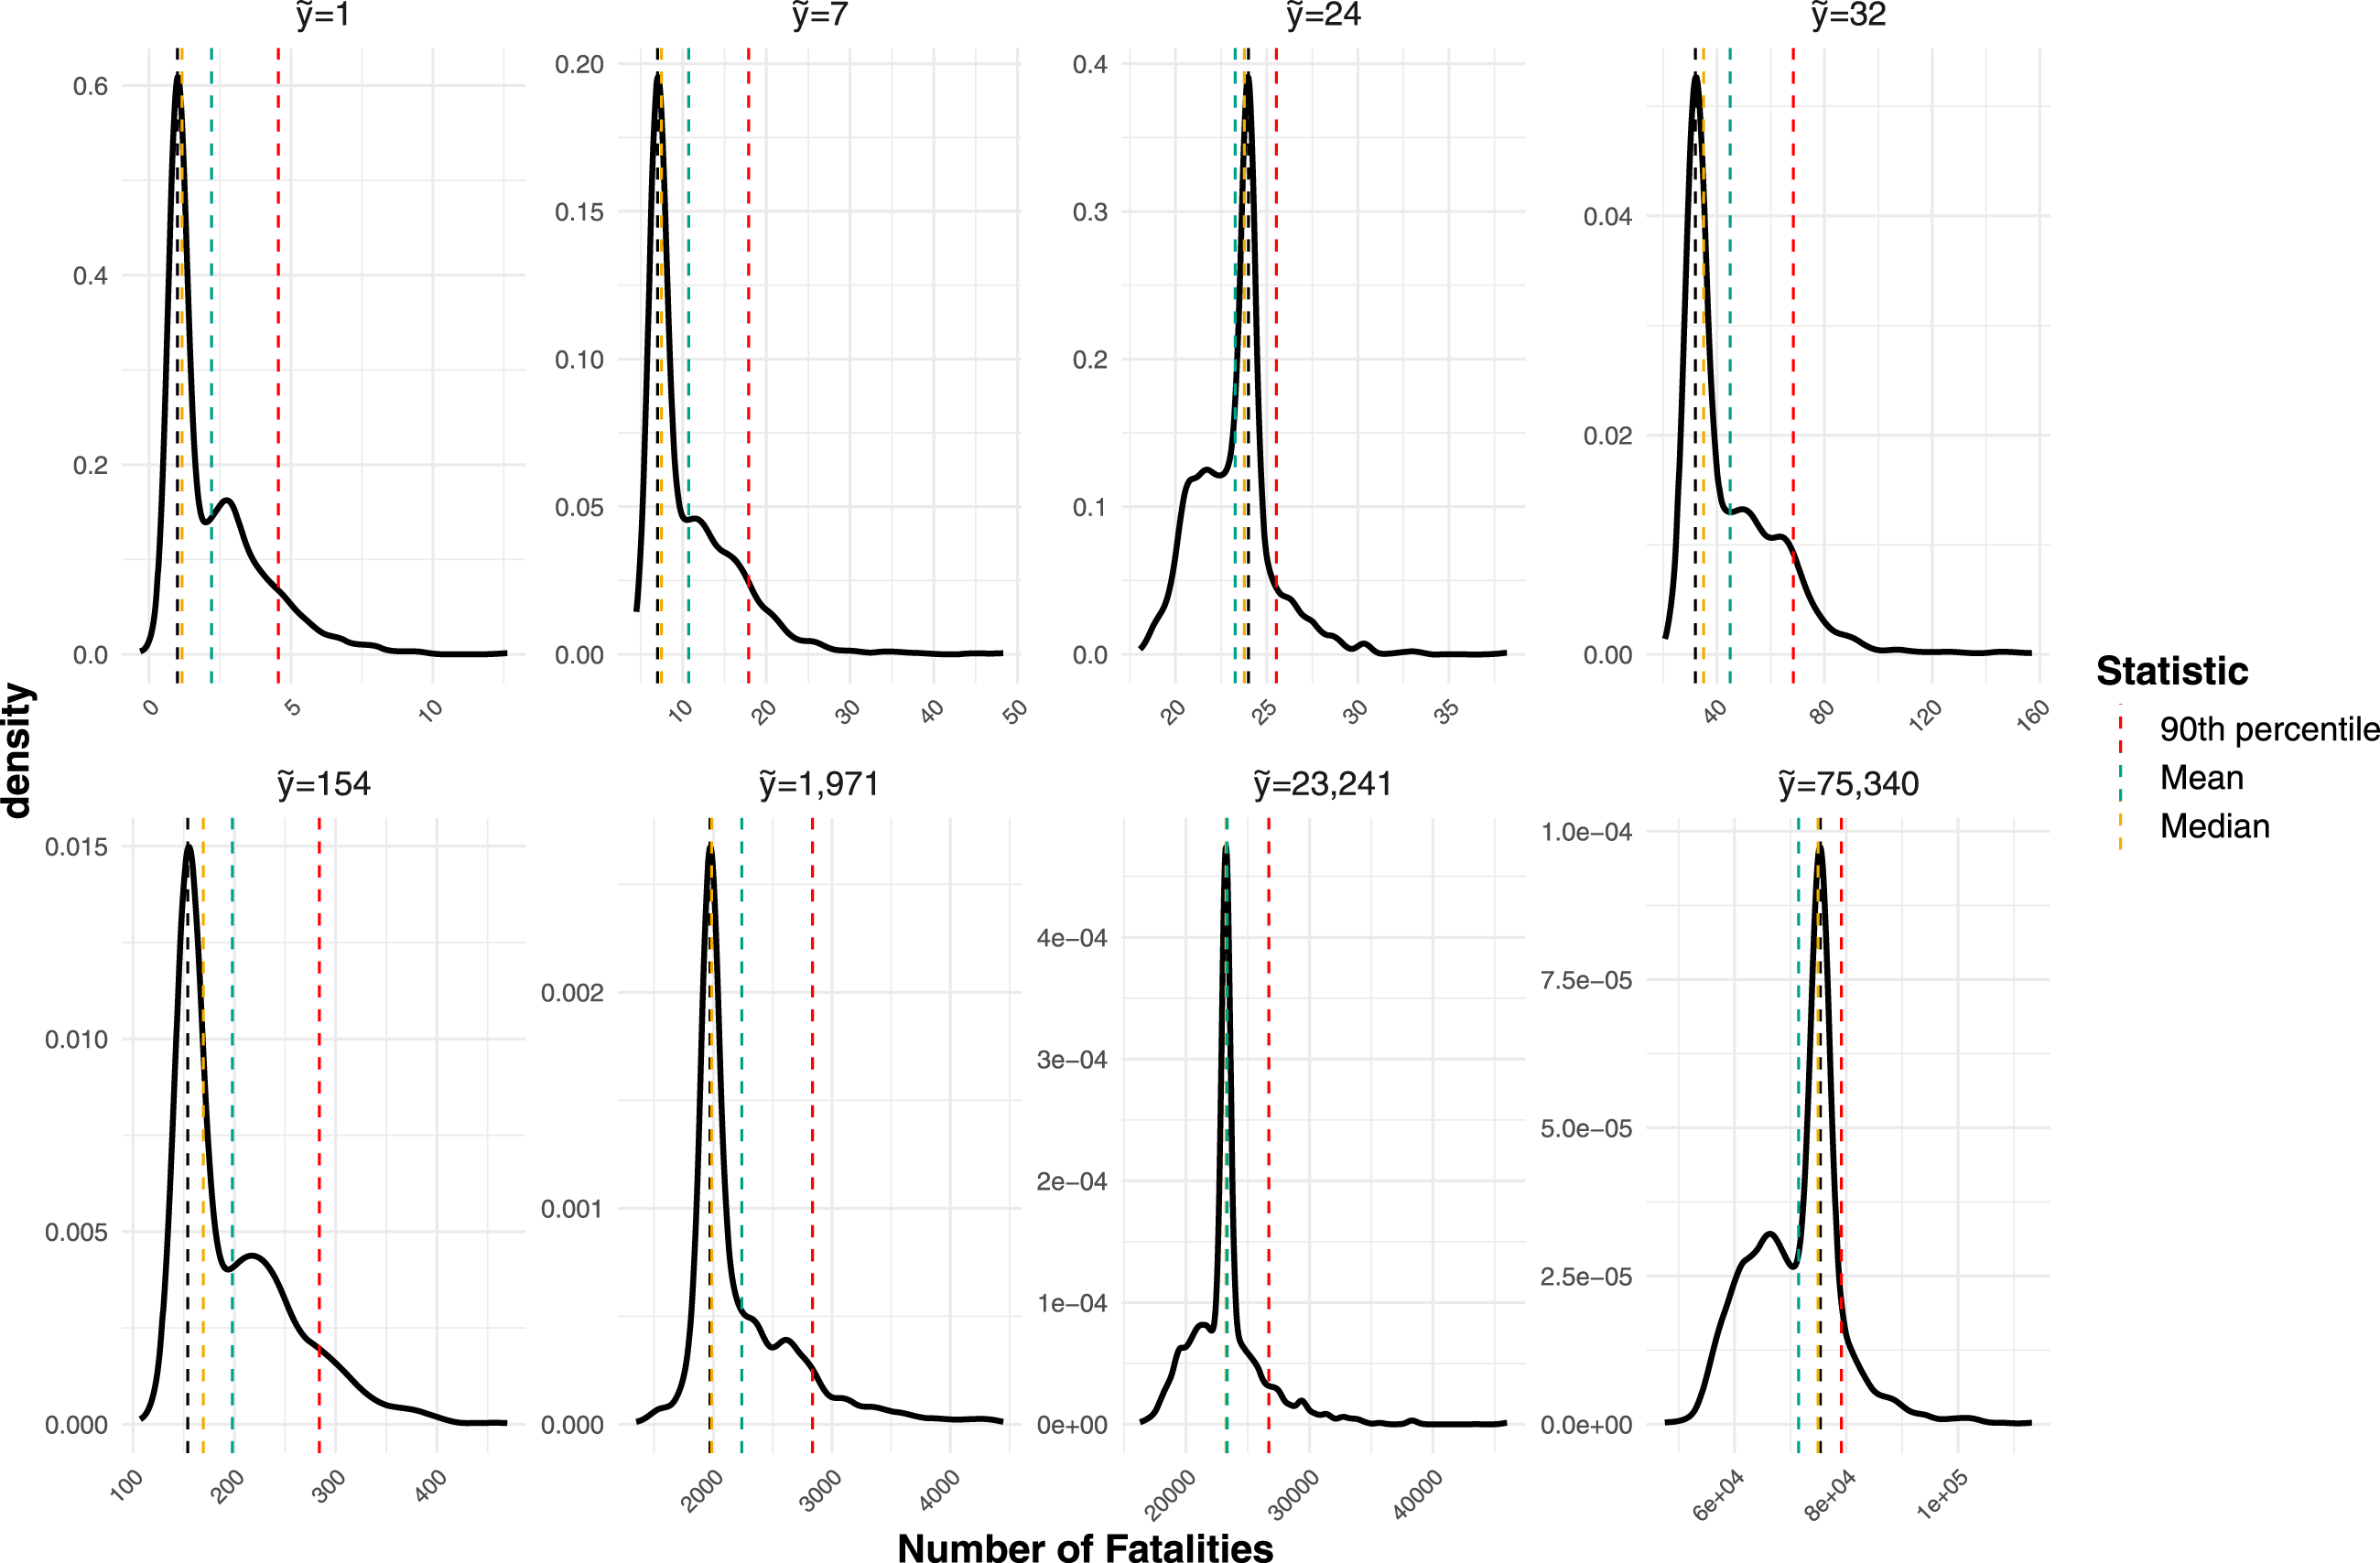
To facilitate the uptake of this model, we released the R package
Distributions of Fatalities Across Aggregated Events
The framework outlined above allows us to move from point estimates of reported fatalities to full predictive distributions for individual UCDP events, conditional on the reported count
Specifically, we predict the distribution of plausible fatality level for all state-base conflict events reported by UCDP in each country in 2020–2022. Next, we make a random draw from the predicted distribution for each event and sum the total number of fatalities across all events. We repeat the procedure 1,000 times to obtain a distribution of the total plausible number of fatalities for each case.
Figure 5 shows the predicted distribution of the total number of fatalities in 2020–2022 for the two cases. The figure shows that for Syria (2020–2022), the mean of the plausible distribution of the actual fatalities is almost 60 percent higher than the actual number reported in the UCDP dataset. In a good-information case like this, our procedure effectively counters the conservative bias, while showing that the uncertainty with respect to total number of fatalities is relatively small – in 90 percent of simulations the total fatalities are between 11,193 and 11,950. Even if the UCDP coders think that there is considerable uncertainty within each report (see Figure 4), pooling the large number of independent reports present in a good-information context like Syria yields a moderate overall estimate of uncertainty. Distribution of plausible fatalities values for Syria (left) and Ethiopia (right) in 2020–2022, aggregated across all violent events. Black dashed line shows sum of the UCDP’s ‘best’ estimates, colored dashed lines the median and mean, as well as the 5th and 95th percentile of the estimated distribution.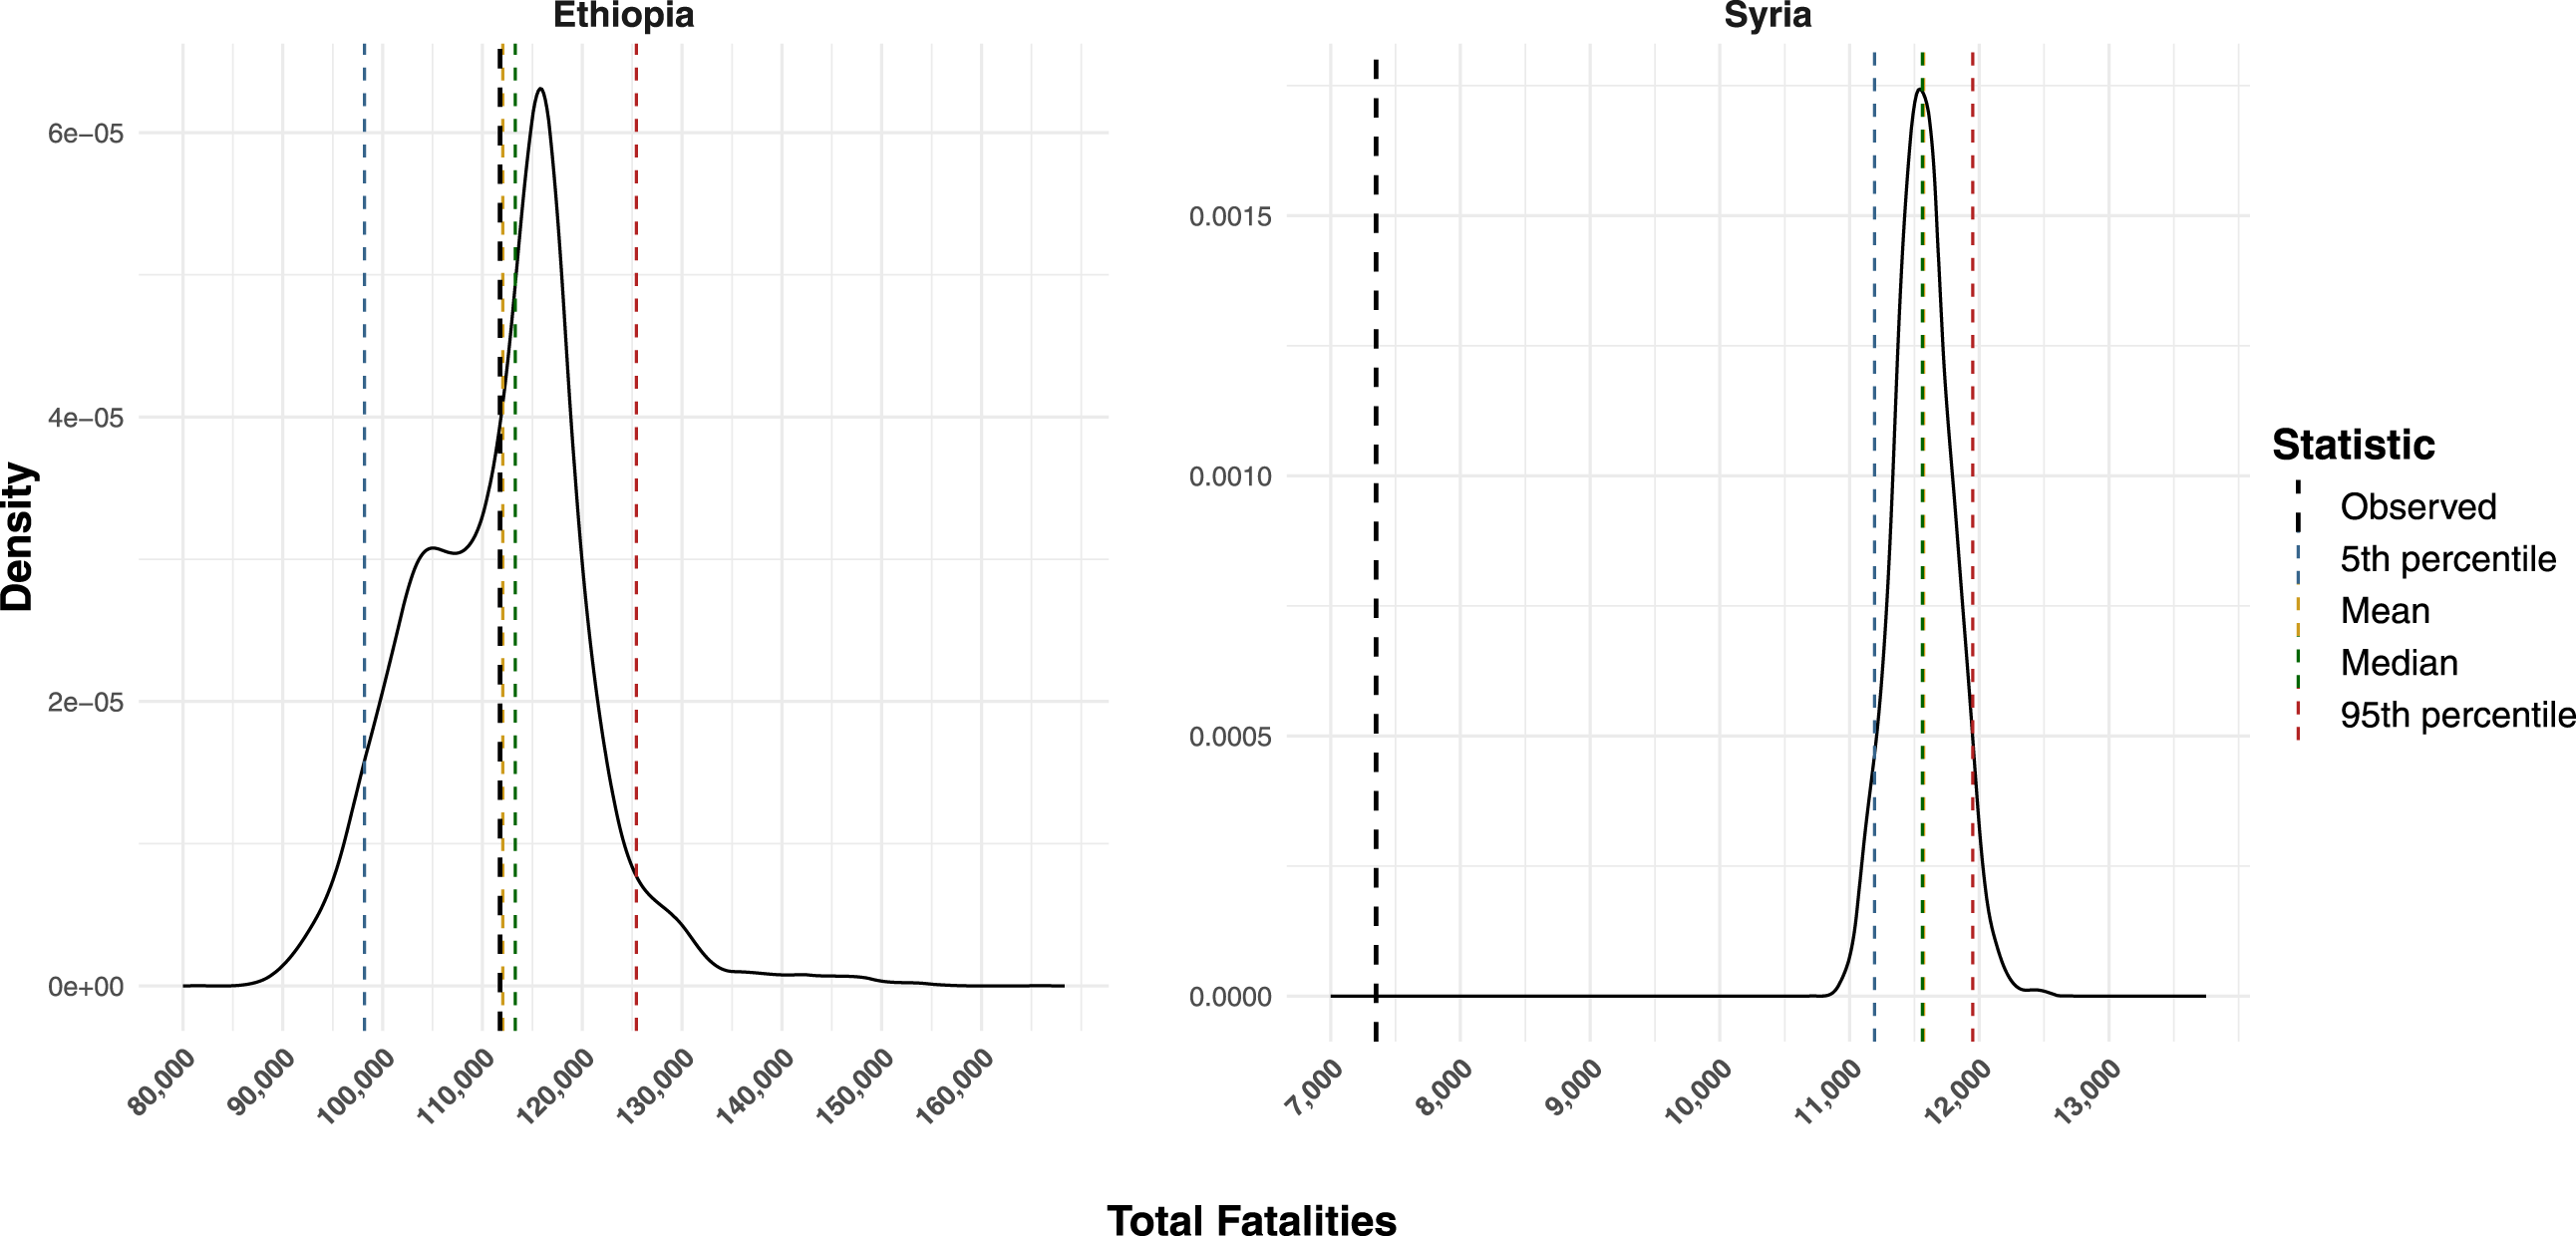
For a poor-information context like Ethiopia, our results are quite different. First, the resulting uncertainty estimate for fatalities in reported events is much wider relative to the central value – 90 percent of the simulations fall in an interval ranging from 98,187 to 125,417. The central tendency of this distribution, however, is much closer to what the UCDP has reported as the best estimates. A primary reason for this is that UCDP coders generally regard fatality estimates in large events as less likely to be under-reported than for small events. 10 Such high-fatality events are typically reported as aggregated “summary” events by reputable sources. In line with our previous results, such events are characterized by a higher degree of uncertainty (i.e., wider distribution) but a lower rate of under-reporting. This means that pooling a larger number of small events tend to yield less uncertain fatality distributions, but with a higher rate of estimated under-reporting. Conversely, pooling a smaller number of large events tend to yield more uncertain fatality distribution but a lower rate of under-reporting. This is in line with the coders’ intuition that high-fatality summary events are more uncertain, but less likely to be under-reported.
These results highlight that our estimate of uncertainty varies non-linearly with the number of reported fatalities, confirming that the model represents uncertainty well beyond the vague numbers in UCDP coding rules. These non-linear variations have important implications for measurement bias in conflict research, as they add nuance to the standard assumption that larger conflict events are automatically more likely to be reported, and may thus complement recommended empirical tests for detecting measurement bias which lie on this assumption (e.g., Weidmann 2016).
Replication Study
Our study provides a practical tool to address measurement uncertainty and biases in conflict event data and to test its potential implications in empirical analyses of conflict. We illustrate how integrating uncertainty around UCDP fatalities data can affect empirical findings by replicating the analysis of Brosché and Sundberg (2024). Our illustrative replication exercise exemplifies how to incorporate uncertainty estimates around conflict fatalities by replacing the best estimates reported by UCDP with random draws from our modelled distribution of plausible fatalities.
As our uncertainty model is calibrated to fatalities related to UCDP-GED events, we limit the replication dataset to dyad-years which are available in the UCDP-GED dataset, and replace the number of fatalities in the original dataset with dyad-year aggregates drawn from UCDP-GED version 23.1 (Davies et al. 2023). We integrate our uncertainty estimates as follows: in each simulation, we replace the fatalities in the replication dataset with a random draw of fatalities for each related UCDP event from our model. We then aggregate the simulated fatalities to the dyad-year level, update and lag the dependent variable, and run the same models as Brosché and Sundberg (2024) – a model with country-level fixed effects and a pooled model with standard errors clustered at the country level. We repeat this process 100 times and calculate the coefficients and standard errors using the Rubin rules. The Rubin rules were originally developed for combining multiple imputation datasets (Rubin 1987); the same logic can, however, be used to combine the results from multiple simulations (Croicu 2024).
This approach is quite simple, and aims to showcase how uncertainty estimates can be integrated in empirical research. However, relying on two-stages method of composition approaches, as the one used here, can perform poorly in settings with strong endogeneity between measurement and outcome processes, where unified Bayesian approaches estimating these processes jointly are preferable (Marquardt 2020).
Replication study of Brosché and Sundberg (2024) using simulated fatalities (columns 2, 4) in place of the original best estimates (columns 1, 3). Standard errors are in parentheses.
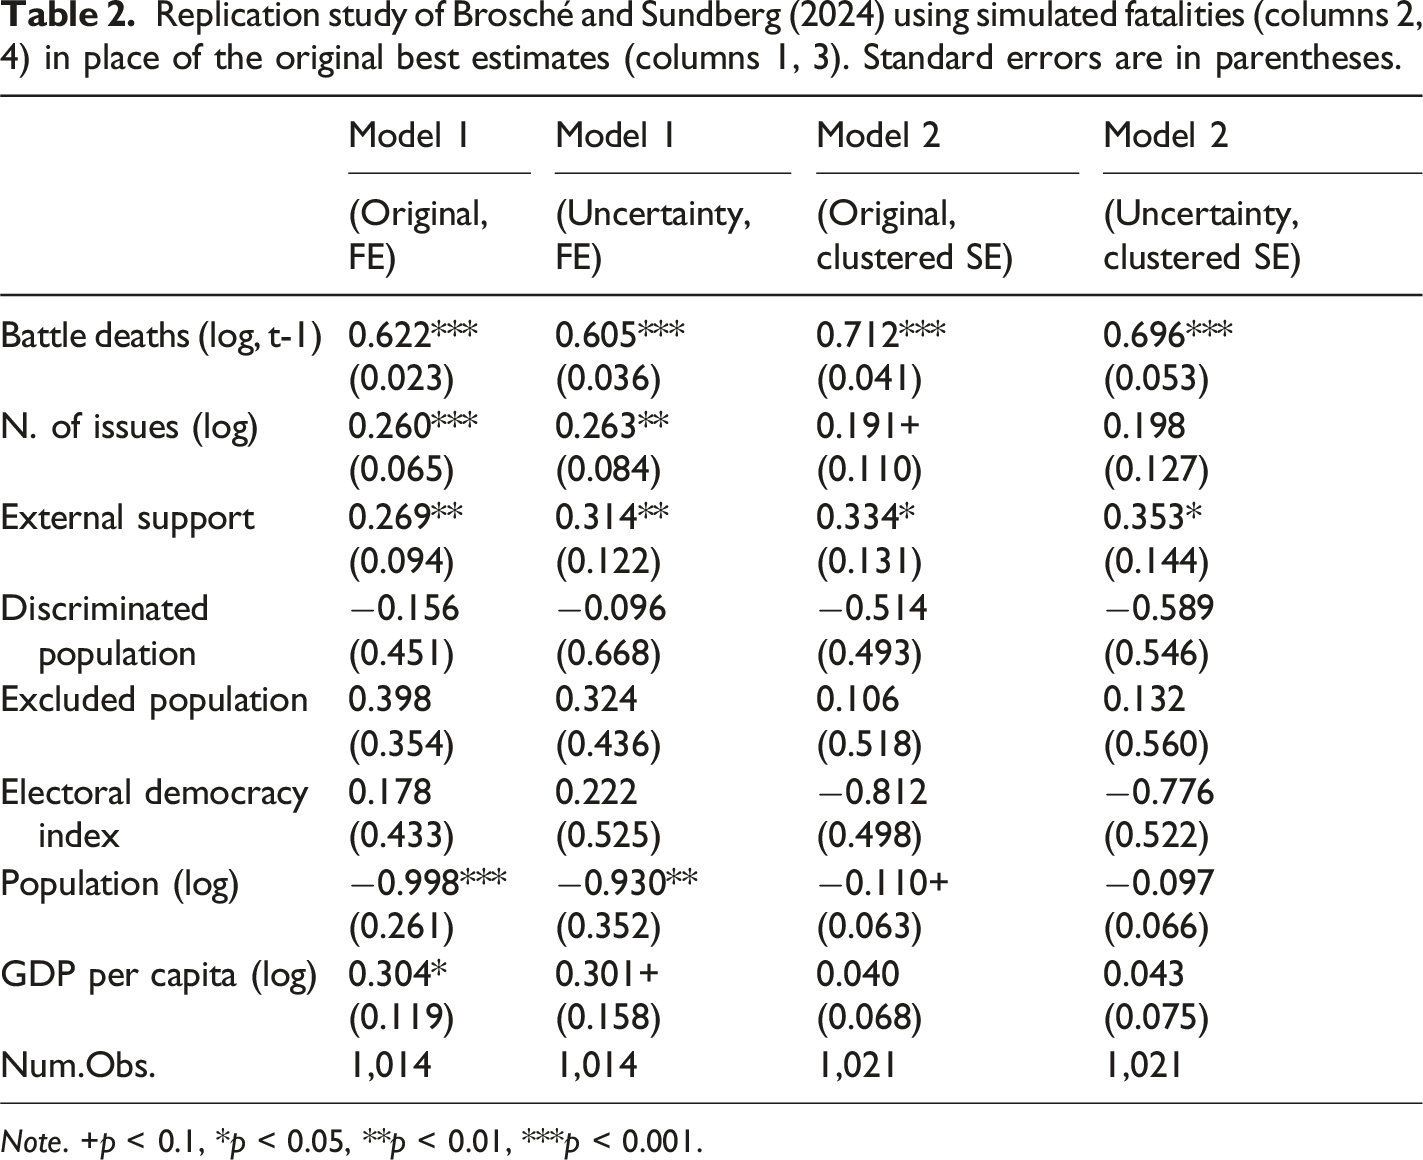
Note. +p < 0.1, *p < 0.05, **p < 0.01, ***p < 0.001.
We also compare the predicted values of the models using the original replication dataset versus the simulated fatalities. The predicted values for different number of conflict issues (on a log scale) are presented in Figure 6. Notably, the predicted values are substantially higher for the models using simulated fatalities, reflecting the general trend towards under-reporting fatalities we observed in our analysis. Battle related deaths (log) predicted by our uncertainty model (green, orange), versus the original estimates from Brosché and Sundberg (2024) (red, blue).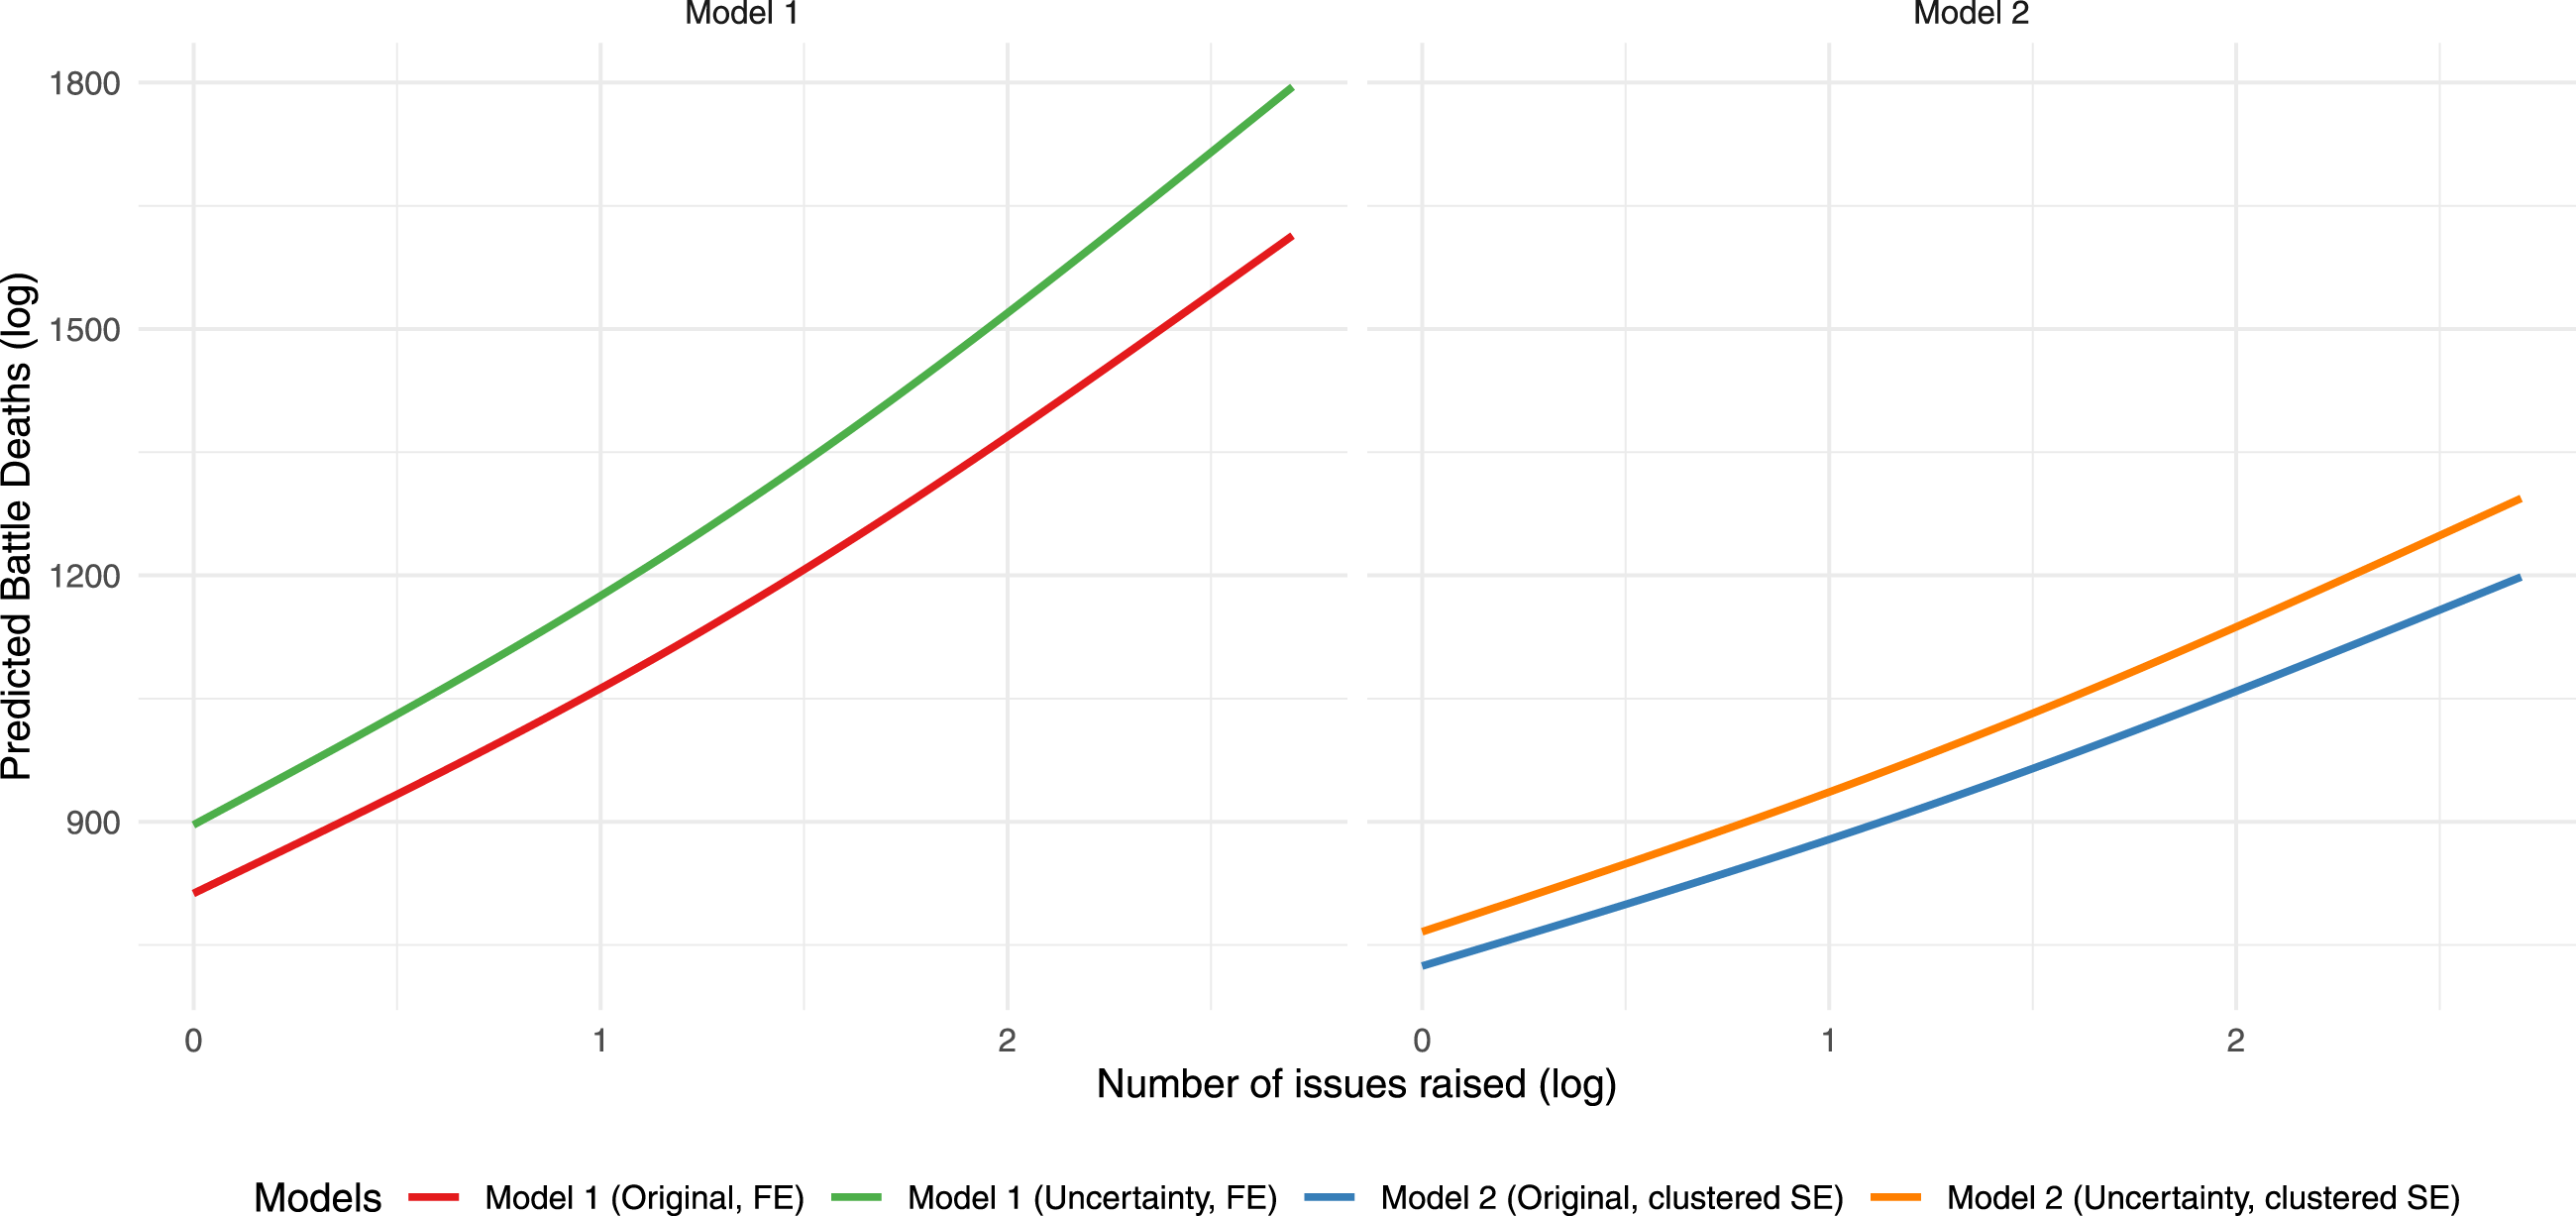
The process illustrated here can be applied and refined by future studies of conflict to test the sensitivity of their findings to measurement error. Explicitly accounting for and reporting uncertainty in empirical results can increase transparency and robustness, and thus contribute to tackle the reproducibility crisis in social sciences (see Simkus et al. 2025, for a review).
Conclusions
In this paper, we have estimated uncertainty around the number of fatalities reported in the UCDP dataset for different types of violence and information contexts, combining a survey with UCDP coders with a simulation approach. We find that reported fatalities in the UCDP dataset generally suffer from under-reporting, especially at very low levels of fatalities, for which there tends to be a relatively higher conservativity bias than for events with higher levels of fatalities. However, uncertainty (the width of the plausible fatalities distribution) is higher for high-intensity conflict events.
The estimated probability distributions can be used as confidence intervals around the best estimate provided by UCDP, avoiding the misuse of low and high estimates as uncertainty boundaries. Our approach to model uncertainty in conflict data, easily implemented through our
This analysis has important limitations. First, our uncertainty estimates cannot capture fatalities from events that are entirely unreported, since UCDP experts cannot observe events that never reach any source. Our estimates concern only the distribution of documented deaths, which cannot be validated against a ‘ground truth’ – as this truth is not available across countries and contexts. Another limitation of this study is inherent in its reliance on UCDP coders: Although our approach to some extent reflects variations across coders, we do not measure how and to what extent our estimates are driven by coders’ individual characteristics. In line with the literature on expert reliability in surveys (Bakker et al. 2014; Lindstädt et al. 2020; Marquardt et al. 2019), an avenue for future research is to assess how coding of conflict events vary as a function of these individual characteristics. Further, our approach reflects UCDP coders’ expert knowledge of variations in information contexts, but does not systematically explore how different factors shape the quality and quantity of available information, and how this affects reporting uncertainty. Future research can refine the model presented here to explicitly incorporate these contextual factors. Lastly, these results cannot be directly generalized to other conflict event datasets, as our approach was specifically designed for UCDP data and coders. However, our modelling framework could easily be replicated in other domains, facilitating cross-datasets validation practices, and shedding new light on the broader debate around measurement error in expert-derived estimates.
Supplemental Material
Supplemental Material - The Underreported Death Toll of Wars: A Probabilistic Reassessment From a Survey with UCDP Coders
Supplemental Material for The Underreported Death Toll of Wars: A Probabilistic Reassessment From a Survey with UCDP Coders by Paola Vesco, David Randahl, Håvard Hegre, Stina Högbladh, and Mert Can Yilmaz in Journal of Conflict Resolution
Supplemental Material
Supplemental Material - The Underreported Death Toll of Wars: A Probabilistic Reassessment From a Survey with UCDP Coders
Supplemental Material for The Underreported Death Toll of Wars: A Probabilistic Reassessment From a Survey with UCDP Coders by Paola Vesco, David Randahl, Håvard Hegre, Stina Högbladh, and Mert Can Yilmaz in Journal of Conflict Resolution.
Footnotes
Acknowledgements
We thank the UCDP team for contributing their vast experience through their workshop participation and questionnaire responses. We are grateful to two anonymous reviewers for their constructive feedback that greatly improved the manuscript, and to participants of the American Political Science Association Annual Convention in 2023, the workshop at the Center for Advanced Studies held in Oslo in March 2023, the 22nd Jan Tinbergen Conference, the PaCE team workshop in Dublin in 2024, and the 2024 DEMSCORE conference in Gothenburg for their useful comments. For more information on the UCDP and VIEWS and UCDP projects see https://ucdp.uu.se and ![]() .
.
Author Contributions
Supplemental Material
Supplemental material for this article is available online.
Funding
The authors disclosed receipt of the following financial support for the research, authorship, and/or publication of this article: The research was funded by Riksbankens Jubileumsfond through the programme Societies at Risk, Uppsala University, the European Research Council under Horizon Europe (Grant agreement No. 101055176, ANTICIPATE), the Research Council of Norway (Grant agreement n. 334977, UFFAC), and the Center for Advanced Study (CAS) at The Norwegian Academy of Science and Letters.
Declaration of Conflicting Interests
The authors declared no potential conflicts of interest with respect to the research, authorship, and/or publication of this article.
Data Availability Statement
Data have been made available in the form of an R package ![]() ).
).