
Abstract
We reconsider the relationship between oil and conflict, focusing on the location of oil resources. In a panel of 132 countries over the period 1962-2009, we show that oil windfalls escalate conflict in onshore-rich countries, while they de-escalate conflict in offshore-rich countries. We use a model to illustrate how these opposite effects can be explained by a fighting capacity mechanism, whereby the government can use offshore oil income to increase its fighting capacity, while onshore oil may be looted by oppositional groups to finance a rebellion. We provide empirical evidence supporting this interpretation: we find that oil price windfalls increase both the number and strength of active rebel groups in onshore-rich countries, while they strengthen the government in offshore-rich ones.
Keywords
Oil is often considered responsible for fueling civil conflicts and wars - both as a source of funding for the contenders and as a prize for the fighting. Anecdotal evidence consistent with this argument abounds: examples of recent oil-related episodes of conflict include ISIL’s strategic control of resources in Syria and Iraq, oil theft by MEND rebels in Nigeria, and attacks to extraction facilities by Darfur insurgents in South Sudan. 1
Despite the popularity of the argument, establishing a systematic nexus between oil wealth and conflict has proved complex, since oil-rich countries display large variations in measures of internal stability. While countries like Iraq and Nigeria are often cited as examples of the nefarious consequences of oil abundance on conflict, other countries, as diverse as Qatar, Norway and Gabon, have never experienced a civil conflict over the past 40 years in spite of their vast oil wealth. Yet other countries, like Angola and Azerbaijan, have even put an end to their conflicts in correspondence to large increases in oil wealth. Indeed, while early cross-sectional studies generally found a positive association between oil wealth and the onset and duration of conflicts and wars (Collier and Hoeffler 2004; Fearon and Laitin 2003; Le Billon 2003), more recent studies focusing on within-country variation find mixed evidence on the relationship (e.g. Bazzi and Blattman 2014; Lei and Michaels 2014).
In this paper, we take a fresh look at the oil-conflict nexus by analyzing how conflict and war escalations depend on the location of oil, using new industry-licensed data allowing us to distinguish between onshore and offshore production. In a large panel of countries, we first confirm the insignificant average effect of oil wealth on the probability of conflict, consistent with the existing inconclusive evidence (Brückner and Ciccone 2010; Cotet and Tsui 2013; Bazzi and Blattman 2014; Ciccone 2018). We then show how this zero-result may be attributed to opposite-sign effects of onshore and offshore oil. While greater onshore oil wealth makes conflict and civil war outbreaks and escalations more likely, greater offshore oil wealth tends to de-escalate conflicts.
To reach these conclusions we use exogenous fluctuations in international oil prices, weighted by each country’s average shares of onshore and offshore production in GDP. The effects we document are both statistically and economically significant. For a large onshore producer like Iraq, our estimates suggest that a one standard deviation increase in the price of oil raises the probability of conflict escalation by 3 percentage points, or 28% compared to its average probability. For a large offshore producer like Azerbaijan, instead, a similar oil price windfall reduces the probability of conflict escalation by 1.6 percentage points, or 39% of its mean. In general, we show that the overall impact of oil price windfalls shifts from reducing to increasing the probability of conflict escalation when the share of onshore oil exceeds about 38% of total production.
We attribute the opposite effect of oil price windfalls in onshore- and offshore-rich countries to their differential impact on the fighting capacities of the contenders. We argue that a crucial difference between offshore and onshore facilities is that the latter can more easily be attacked, looted, and even seized by rebel groups, which in turn can use the proceeds from the looting to maintain and equip their troops. Thus, oil price windfalls increase relatively more the fighting capacity of rebels compared to the government, the larger is the share of onshore oil production for any given share of offshore (or total) oil production in GDP. Conversely, oil price windfalls tilt the balance of power in favor of the government more, the larger is the share of production obtained from offshore facilities, which are easier to defend and whose proceeds almost exclusively accrue to the central government.
We document the empirical relevance of the fighting capacity mechanism using a rebel strength indicator that measures the ability of active rebel groups to maintain and equip troops, relative to the government (Cunningham, Gleditsch, and Salehyan 2013). Consistent with our interpretation, an increase in the price of oil raises the indicator of rebels’ strength in onshore-rich countries, while it decreases it in offshore-rich countries.
To get a better sense of the sort of episodes driving our empirical analysis, consider the case of Indonesia. During the early 1970s, the discovery of vast oil and gas fields in the northern region of Aceh almost doubled the country’s oil production, 80% of which proceeded from onshore sources. The spike in production, coupled with the fourfold increase in the price of oil during the 1973 crisis, were instrumental to the consolidation of the Free Aceh Movement (GAM), an insurgency movement that aimed at securing larger shares of the oil rents to the local population (Schulze 2006). In 1976 the group launched an offensive against the central government. 2 During the following three years, characterized by soaring oil prices, the number of GAM rebels and their strength relative to the government increased, resulting in a large scale civil conflict. Only around 1980, with oil prices starting to decline sharply, did the central government manage to defeat the insurgency, and the group’s leader fled the country.
Now consider instead the case of Angola, where, at the end of the 1990s, new deep-water exploration technologies made it possible to double offshore oil production, which came to represent 80% of the country’s GDP. The increased offshore production, together with the sustained increase in oil prices (an average annual growth rate of 60% between 1998 and 2000) enabled the government to mortgage future oil revenues, purchase weapons on the international arms market and, in 1999, launch an offensive against the rebels of the National Union for the Total Independence of Angola (UNITA) (Le Billon 2007). The offensive led to the destruction of UNITA as a conventional military force, paving the way for the end of a civil war that had been going on since the country’s independence in 1975. 3
To guide our empirical analysis, we open the paper with a model a la Tullock (1980) in which the government and a rebel group fight over power and, thereby, the control of oil resources. In the baseline version of the model, the probability of winning the conflict depends on the relative fighting capacity of the contenders (e.g., their relative abilities to maintain and equip troops). Our simple theoretical innovation is to let the fighting capacities be functions of oil and its geographical location. Crucially, we assume that both onshore and offshore oil income contribute to the fighting capacity of the central government, but only onshore oil contributes to the fighting capacity of the rebels. A straightforward implication of this assumption is that an oil windfall raises the fighting capacity of the rebels relative to the government when the share of onshore production is sufficiently large – that is, above what we call the fighting capacity threshold.
Incorporating the fighting capacity mechanism into the baseline model also allows us to identify an equilibrium conflict threshold. This represents the share of onshore production above which an oil windfall raises the probability of conflict escalation. The equilibrium conflict threshold lies below the fighting capacity threshold, because it also accounts for the value of holding power (a state prize effect). Hence, the two thresholds effectively identify three ranges for the share of onshore oil production. If the share is low (i.e. below the equilibrium conflict threshold), an oil price shock mostly benefits the government, weakening the rebels and increasing the probability of a conflict de-escalation. If, on the contrary, the share of onshore production is high (i.e. above the fighting capacity threshold), the shock benefits mostly the rebels, raising their fighting capacity and increasing the probability of conflict. Finally, if the share of onshore production lies between the two thresholds, an oil price shock increases the probability of conflict escalation in spite of making the government relatively stronger. Intuitively, this is because – at intermediate values of onshore production – the increased value of holding power (the state prize effect) more than compensate the rebels for the reduced probability of winning the conflict (the fighting capacity effect), motivating them to intensify their conflict activities despite having become relatively weaker compared to the government.
Both the fighting capacity and the equilibrium conflict thresholds depend on parameters that may vary across countries. In particular, when onshore facilities are easily lootable or when rebels are more effective than the government in transforming resources into fighting capacity, the share of onshore wealth at which oil windfalls tilt the fighting capacity in favour of the rebels is (potentially much) lower. In this way, the model can also account for cases like Nigeria and Democratic Republic of Congo, where the limited state apparatus hampers the ability to secure onshore facilities and transform oil revenues into military power, making them subject to frequent spikes in rebel activity and conflict in spite of the limited share of onshore oil production.
The paper continues as follows. Section 2 places our contribution in the related literature. Section 3 formulates a \simple model and derives the main hypotheses. Section 4 establishes the empirical model derived from the theory. Section 5 introduces the data. Section 6 provides the results from the empirical analysis, while Section 7 concludes.
Related Literature
An early and influential literature in political science and economics investigates the relationship between resource abundance – oil in particular – and civil conflict and war, using predominantly cross-country variation (Le Billon 2003; Fearon and Laitin 2003; Collier and Hoeffler 2004). These studies generally point to a positive relationship between resource abundance and incidence of conflict and war. More recent studies, however, argue that identification of causal effects can be achieved with greater confidence using within-country variation. When focusing on within-country variation and using exogenous price shocks or resource discoveries for empirical identification, the results are largely inconclusive. Lei and Michaels (2014) find that giant oil discoveries increase the incidence of internal armed conflicts within 4-8 years of discovery. However, Cotet and Tsui (2013) and Bazzi and Blattman (2014) do not find a significant association between changes in oil wealth and the probability of civil war onset, while Brückner and Ciccone (2010) and Ciccone (2018) find that commodity price downturns provoke civil war onset in Sub-Saharan Africa and beyond. We add on this literature by, first, making a clear distinction between the conflict effects of onshore and offshore oil extraction. Second, rather than focusing exclusively on either conflict or war onsets or incidence, we propose a more unified framework, where events may escalate from peace to conflict, from conflict to war or directly from peace to war
The only studies we are aware of that explicitly focus on the location of oil to investigate civil conflict in a cross-country setting are Ross (2006) and Lujala (2010). Both studies hypothesize that only oil located onshore should be expected to ignite or increase conflict, due to conflict financing mechanisms or secessionist motives. Consistent with this hypothesis, they find that only onshore oil is associated with the onset of conflict, not oil that is extracted offshore (see also Ross 2012). One important difference with these studies is that we break down the country’s production by location, rather than relying on dummy variables to indicate offshore and onshore production, which allows us to account for the intensive margin of oil production. More broadly, we improve upon this earlier research by demonstrating empirically that oil lootability helps explain the location-specific effects, by considering a wider range of conflict escalation and de-escalation outcomes, and by showing that offshore oil is indeed associated with conflict de-escalation. A further concern with the existing studies is that they do not account for time-invariant country characteristics and global trends, potentially related to oil production and conflict. We overcome these shortcomings by focusing on within-country changes in oil wealth over time, weighting exogenous changes in international oil prices by the average share of onshore and offshore oil production in GDP. Finally, we contribute by developing a more complete and explicit theory to rationalize our hypotheses and findings.
Our identification strategy is similar to that used in the literature investigating the effects of income shocks induced by commodity price changes (Brückner and Ciccone 2010; Berman and Couttenier 2015; Caselli and Tesei 2016; Dube and Vargas 2013). An important distinction in these studies has to do with the extent of capital and labor intensity of different commodities. Dube and Vargas (2013), for example, show that price shocks to the capital-intensive oil sector in Colombia are positively related to violent conflict, while the relationship is negative for the labor-intensive coffee sector. This lends support to the hypothesis that oil income fosters rent-seeking behavior by increasing the state prize, while income from coffee triggers an opportunity cost effect by increasing worker wages. Our results show that other characteristics of natural resources contribute to explain their tendency to fuel conflict. We argue in particular that, while onshore and offshore oil are similar in terms of capital intensity, they are asymmetrically appropriable by the two sides in conflict, thus affecting the relative fighting capacities of government and rebels and the ensuing probability of conflict escalation. 4 This interpretation, based on the different ability of government and rebels to access onshore and offshore oil facilities, echoes similar arguments on the importance of conflict financing (e.g. Fearon 2004; Collier, Hoeffler, and Rohner 2009). This is also in line with recent empirical evidence by Berman et al. (2017), who show that the appropriation of mining revenues by rebel groups contributes to the spreading of conflict to other parts of the country, something the authors attribute to the increased financial ability to sustain larger-scale insurgency.
Our focus on the fighting capacity of the contenders is complementary to other explanations of the impact of oil abundance on conflict. The already mentioned state prize hypothesis suggests that oil abundance increases the probability of conflict escalation by raising the prize that can be seized through the capture of the state (Bates, Greif, and Singh 2002; Fearon and Laitin 2003). Alternative explanations focus on the lack of incentives for rentier states to develop a strong state capacity, which eventually makes them less able to prevent rebellions (Dunning 2008; Ross 2012); and on the inability of incumbent governments to credibly commit to oil rents redistribution, which exacerbate grievances of the excluded groups (Fearon 2004; Besley and Persson 2011). 5 While these theories aim to explain the incidence of conflict in oil-rich countries, they cannot account for the opposite effect of onshore and offshore oil windfalls on the probability of conflict escalations observed in our data.
Our results are also broadly related to the class of contributions that have investigated the effects of oil price windfalls on political-economy outcomes other than civil conflict. For example, Haber and Menaldo (2011) and Brückner, Ciccone, and Tesei (2012) present empirical evidence on oil abundance and democratization. Andersen et al. (2017), Caselli and Michaels (2013) and Dalgaard and Olsson (2008) look at oil windfalls and hidden wealth and corruption; Andersen and Aslaksen (2013) and Deaton and Miller (1996) at incumbents’ survival; and Caselli, Morelli, and Rohner (2014) at international war.
Finally, our paper relates to Nordvik (2018), who studies the prevalence of coups d’etat in oil rich countries and documents strong asymmetries in the onshore-offshore dimension. While coups and civil conflict are different processes, our findings confirm that the location of oil may affect the political incentives of both incumbent governments and oppositions.
A Model of Oil Location and Conflict
Preliminaries
We consider an economy with both onshore and offshore oil production, occupied by two equally sized groups, the government (G) and the opposition (O). The groups engage in a violent conflict over the oil resources Q with value P, both exogenously given.
A minor share
We model the fight over the government oil revenues using a Tullock-type conflict framework (Hirshleifer 1991; Skaperdas 1996).
8
The win probability of group i (
The Fighting Capacity Mechanism
Crucially, we assume that oil revenues do not only constitute a motive for the conflict, but they also provide the means for fighting. An increase in the value of the resources looted by the rebels increases their fighting capacity relative to the government, while the opposite happens when the value of the offshore resources in the hands of the government increases. 9
More technically, we assume that group i‘s fighting capacity
We first derive the effect of an oil price shock on the relative fighting capacity of the government,
where:
We summarize this result in the following proposition:
11
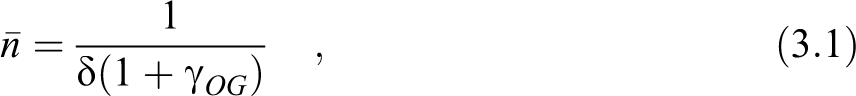
The fighting capacity threshold in equation (3.1) is a function of the share of onshore oil looted,
Conflict Equilibrium
We assume that each group is summarized by a representative agent with risk neutral preferences. Group i‘s expected payoff from mobilizing troops and fighting can thus be expressed as:
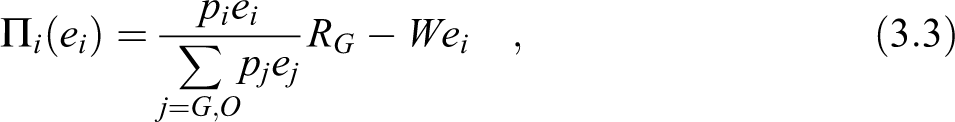
where
The following timing of events describes the game between the government and the opposition:
Nature determines the state of the world, given by the shape of
Each group i simultaneously determines its level of troop mobilization, ei, taking its own and the other group’s expected payoff functions in equation (3.3) as given.
Payoffs are distributed across the government and the opposition according to the contest success function.
In the resulting game, all the strategic action takes place at Stage 2, where each group i maximizes equation
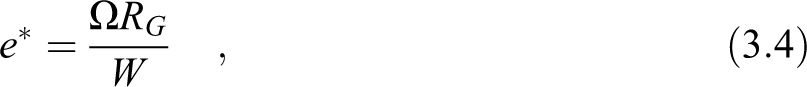
and where
Oil price shocks influence the conflict intensity
where the first term (
Importantly, the overall effect of an oil price windfall on the equilibrium level of conflict is ambiguous, depending on its effect on the relative fighting capacity of the government and the opposition (i.e., on the sign of
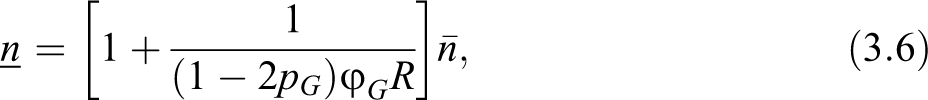
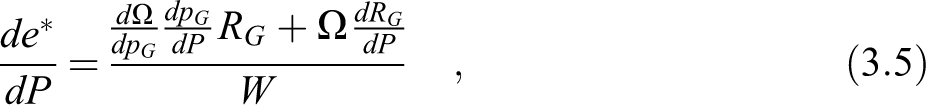
such that:
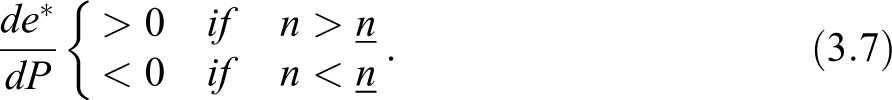
In equation 3.6,
We summarize the results on the conflict effect of an oil price shock in the following proposition:
15
The results in Proposition 2 are graphically illustrated in Figure 1, which presents a schematic representation of the marginal effects of oil price windfalls on the equilibrium level of conflict (equation 3.7) and on the relative fighting capacity of the government (equation 3.2), both calculated as a function of the share of onshore oil production.
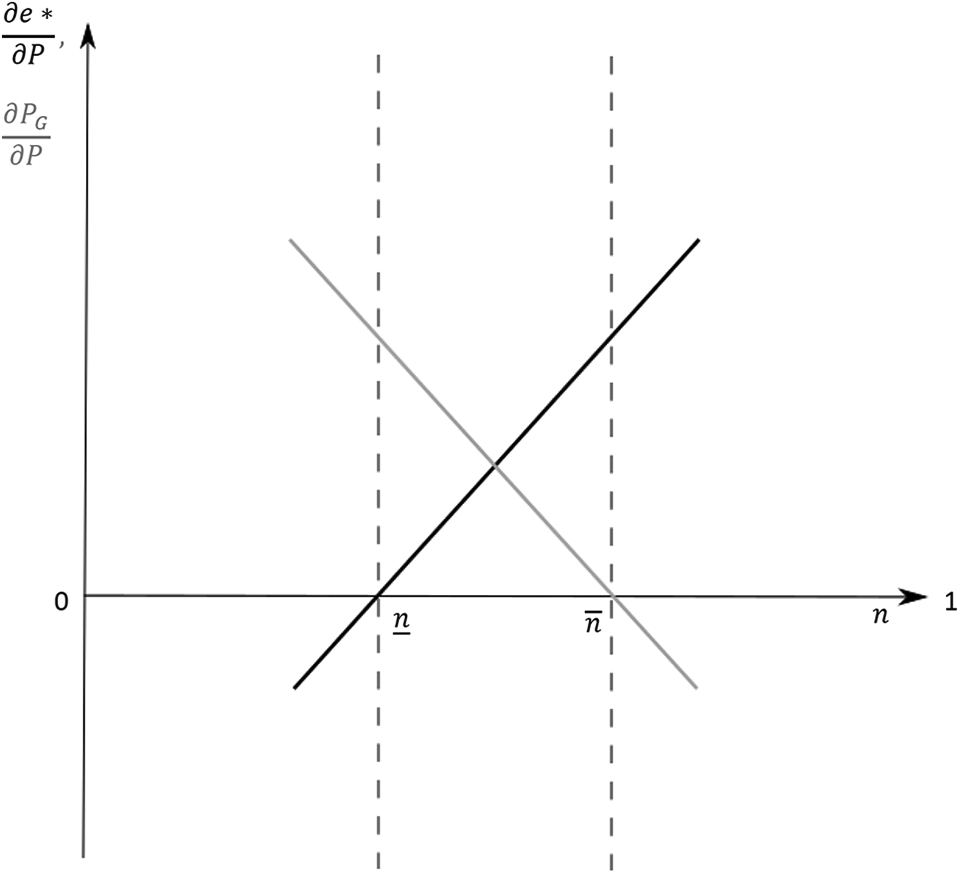
Marginal effects of oil price windfalls as a function of the share of onshore oil. Note: The Figure shows the marginal effects of oil price windfalls on the equilibrium level of conflict (equation 3.7) and on the relative fighting capacity of the government (equation 3.2), both calculated as a function of the share of onshore oil produced.
Starting with the marginal effect on the relative fighting capacity of the government, this is represented by the downward-sloping line in the figure. The effect turns from positive to negative when the share of onshore oil
The intersection of the two lines with the x-axis identifies three areas for the relationship between oil price shocks and conflict escalation. At high shares of onshore oil production (
From the Model to the Empirics
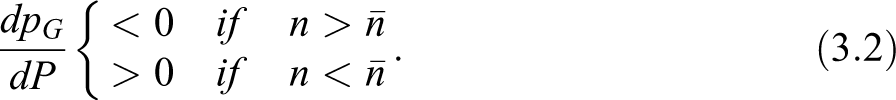
The simple model presented in Section 3 delivers a number of testable implications that we bring to the data. First, the model predicts that a positive oil price shock is expected to escalate the conflict intensity if the share of onshore oil is above a certain level (“the equilibrium conflict threshold”,
We test these predictions in the following empirical model, which maps directly from the theory: 17

where
The coefficient estimates of
Data and Summary Statistics
In order to recover the parameters of equation (4.1), we first construct measures of onshore and offshore petroleum intensity using data from Rystad Energy’s UCube database (2013). Rystad is an independent oil and gas consulting services company headquartered in Oslo, Norway, which collects production data from oil and gas companies’ annual reports as well as authorities’ historical production accounts. Based on their data, we calculate for each country the average share of onshore and offshore oil production in GDP over the sample period 1962-2009. We check the quality of the Rystad Energy data against the total share of oil production in GDP from the World Development Indicators and find a correlation of 0.99 between the two measures.
Online Appendix Table A.1 reports the averages of total, onshore and offshore oil production as share of GDP for all countries in our sample. A large number of countries produce significant amounts of oil: on average, oil accounts for more than 1% of GDP in 51 countries and more than 5% in 33. There is also significant variation in the onshore/offshore composition of total production. Among countries with at least an average 5% share of total oil production in GDP, 19 produce more onshore than offshore (10 onshore only), while 14 produce more offshore than onshore (4 offshore only).
We interact our country-specific weights of onshore and offshore production with oil price data from the BP Statistical Review of World Energy. 19 We assume that annual changes in the oil price are stationary and can be interpreted as oil price shocks, while the price level follows a random walk. This is in line with previous studies (Liang and McDermott 1999; Brückner, Ciccone, and Tesei 2012) and is confirmed by a variety of tests of stationarity on our oil price series. 20
The conflict data come from the UCDP/PRIO Armed Conflict Dataset (Gleditsch et al. 2002; Themnér and Wallensteen 2012). Civil conflict is defined for armed confrontations resulting in at least 25 battle-related deaths in a year, while the threshold for civil war is set at 1,000 battle-related deaths. We use these data to construct our main dependent variables. First, a conflict escalation dummy, equal to one when a country’s conflict status changes from peace to conflict (or directly to war), or from conflict to war, and zero otherwise. Second, a conflict de-escalation dummy, defined analogously for reductions in conflict intensity. 21
We measure the relative strength of rebel groups using data from the Non-State Actor (NSA) database (Cunningham, Gleditsch, and Salehyan 2013). The dataset provides an indicator on the military capabilities of non-state actors relative to the government in ongoing civil conflicts in the UCDP/PRIO dataset. The rebel strength indicator ranges from 1 to 5 (from “much weaker” to “much stronger than the government”), and is based on observations of the number of troops possessed by the rebel group(s) relative to the government. 22 Governments may be facing contemporaneous conflict dyads with different rebel groups. For each conflict-year we calculate the average and maximum strength of rebel groups, as well as their number. 23
Key summary statistics for the full sample of countries are reported in Table 1. The average share of total oil in GDP is 6.4%, roughly two thirds of which come from onshore production (4.0%) and the remainder from offshore production (2.4%). The total number of oil producing countries is 87, two thirds of which (59 countries) produce mainly or only from onshore sources, with the remaining 28 countries producing mainly or only from offshore sources. The geographic distribution of onshore and offshore producers in the sample is illustrated by a world map in Figure 2. Turning to the measures of conflict intensity, both escalations and de-escalations are relatively infrequent events, which jointly account for about 6% of total observations in the sample, compared to an overall conflict incidence of 14%. Table 1 also details the average number of rebel groups faced by the government (0.31, ranging from 0 to 11) and their average strength according to the relative strength indicator (0.31, ranging from 0 to 5).
Summary Statistics.
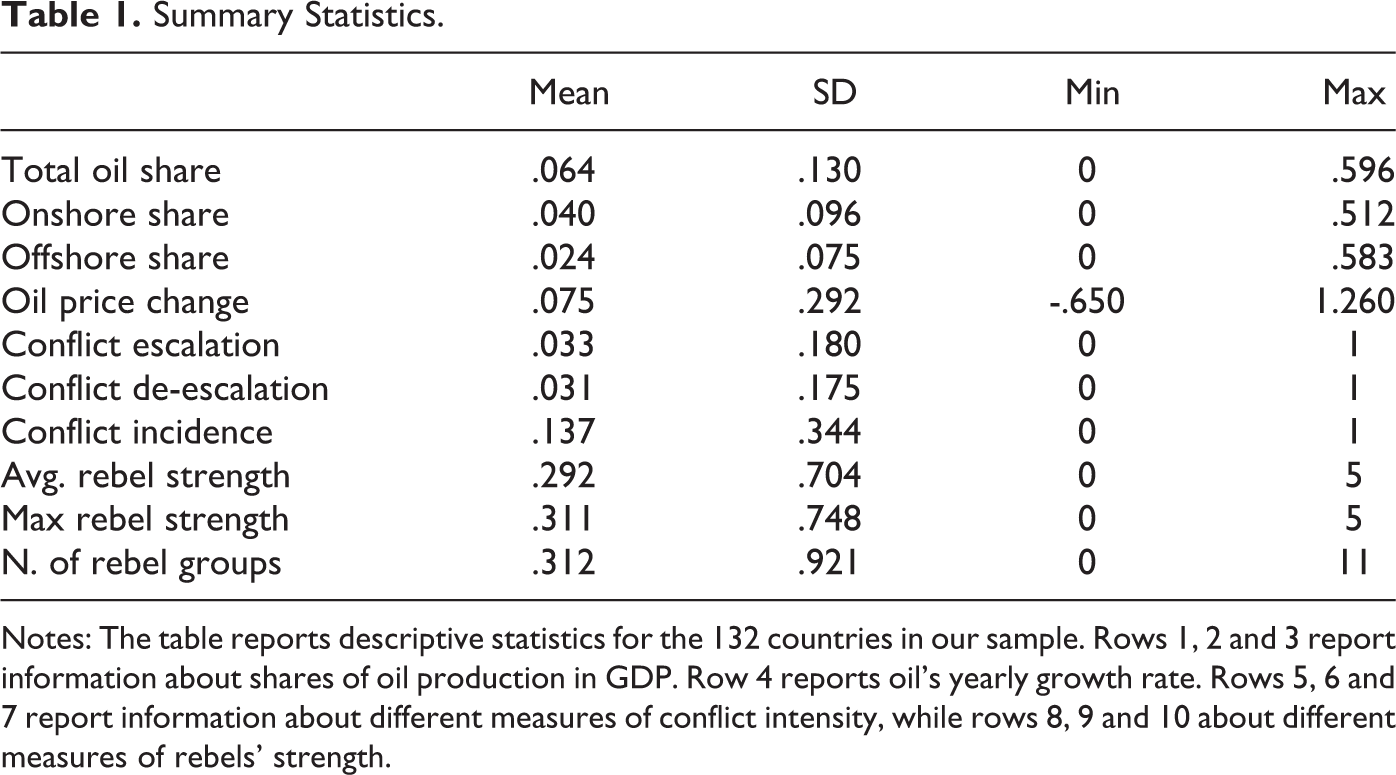
Notes: The table reports descriptive statistics for the 132 countries in our sample. Rows 1, 2 and 3 report information about shares of oil production in GDP. Row 4 reports oil’s yearly growth rate. Rows 5, 6 and 7 report information about different measures of conflict intensity, while rows 8, 9 and 10 about different measures of rebels’ strength.
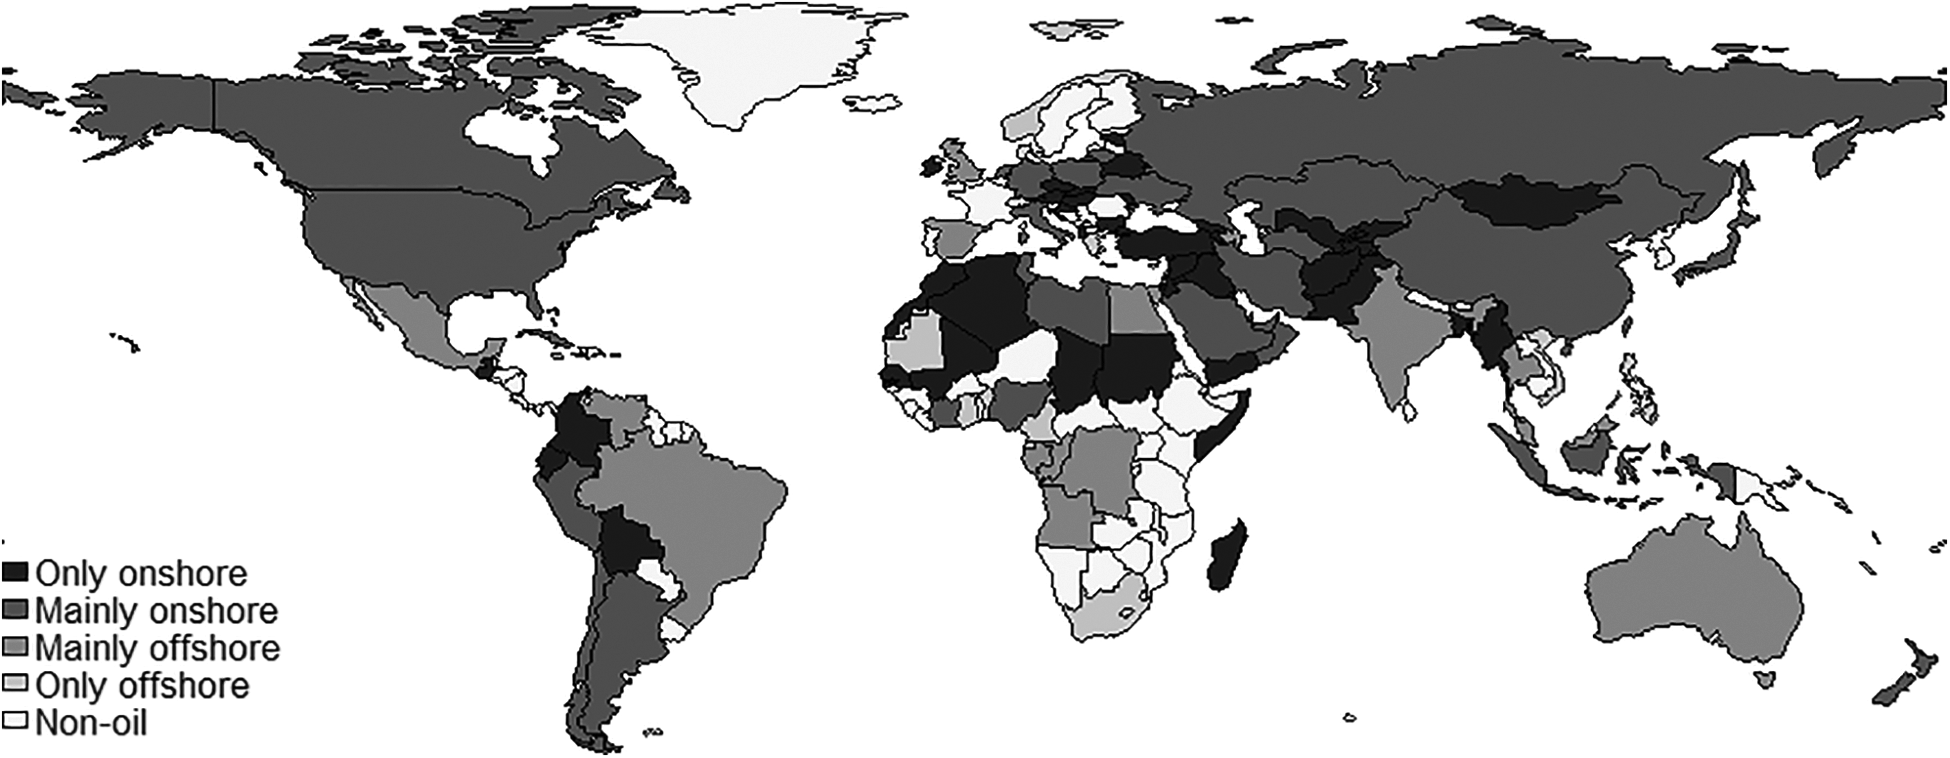
Onshore and offshore oil countries. Note: The Figure shows the geographical distribution of onshore and offshore producers. The data come from Rystad Energy (2014). Mainly onshore (offshore) refers to countries with more than 50% of oil production coming from onshore (offshore) sources.
The simple cross-country association between the location of oil and the extent of conflict can be appreciated in Figure 3. The left panel ranks the 15 oil producers (at least 1% of GDP) with the highest incidence of civil conflict between 1962 and 2009, distinguishing them by the location of their main oil facilities. The right panel performs a similar exercise, but focusing on conflict escalation. In both panels, onshore producers represent the clear majority of conflict countries, consistent with the hypothesis that onshore facilities are more easily looted by rebels, providing the means to fight and increasing the probability of conflict. In the following, we move beyond cross-country correlations and turn to a formal quantitative analysis of the relationship between oil location and conflict to substantiate this interpretation.
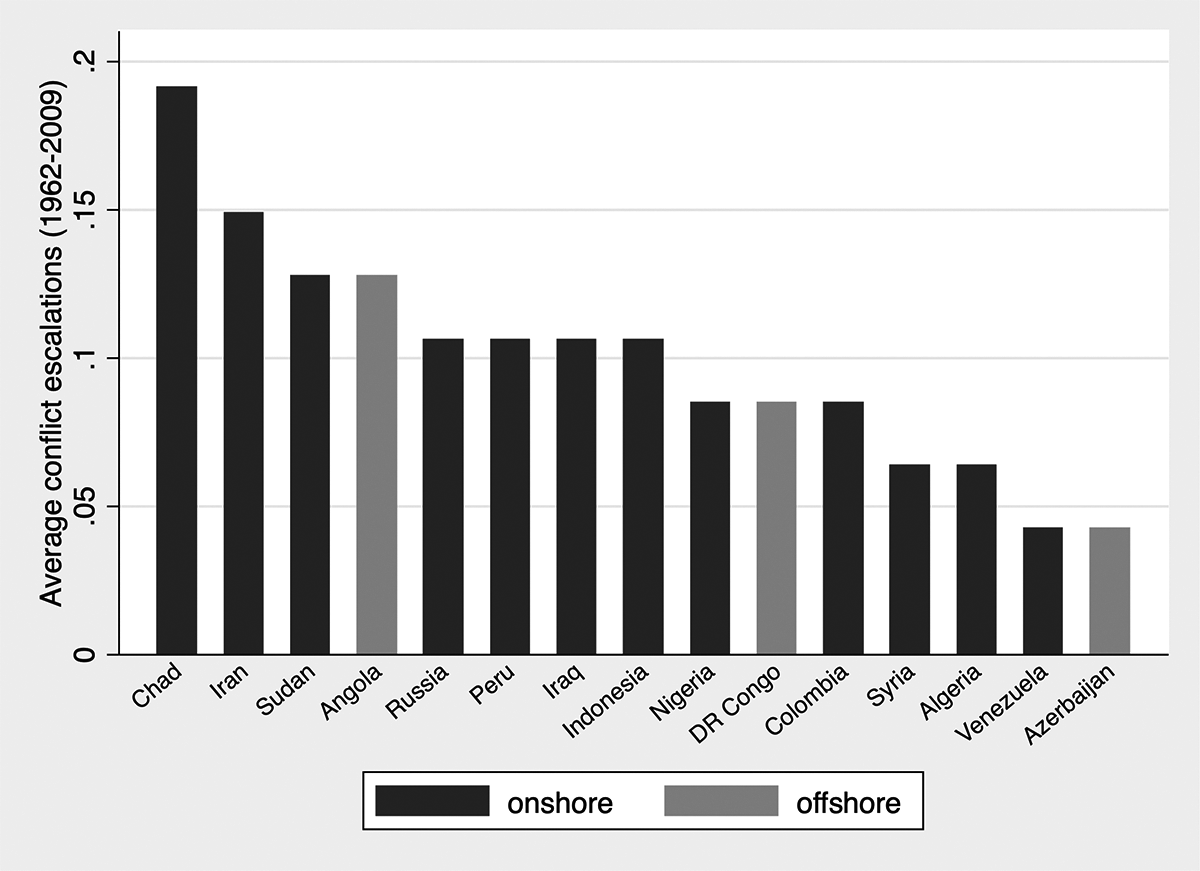
Civil conflict and the location of oil. Note: The Figure ranks the 15 oil producers with the most conflict escalations over the period 1962-2009, separated into onshore and offshore producers.
Results
Main Results
Table 2 investigates the impact of oil price windfalls on conflict escalation (columns 1 and 2) and de-escalation (columns 3 and 4). In column (1), we start by estimating a constrained version of model (4.1), where the location of oil plays no role (i.e., where
Conflict and the Location of Oil Production.
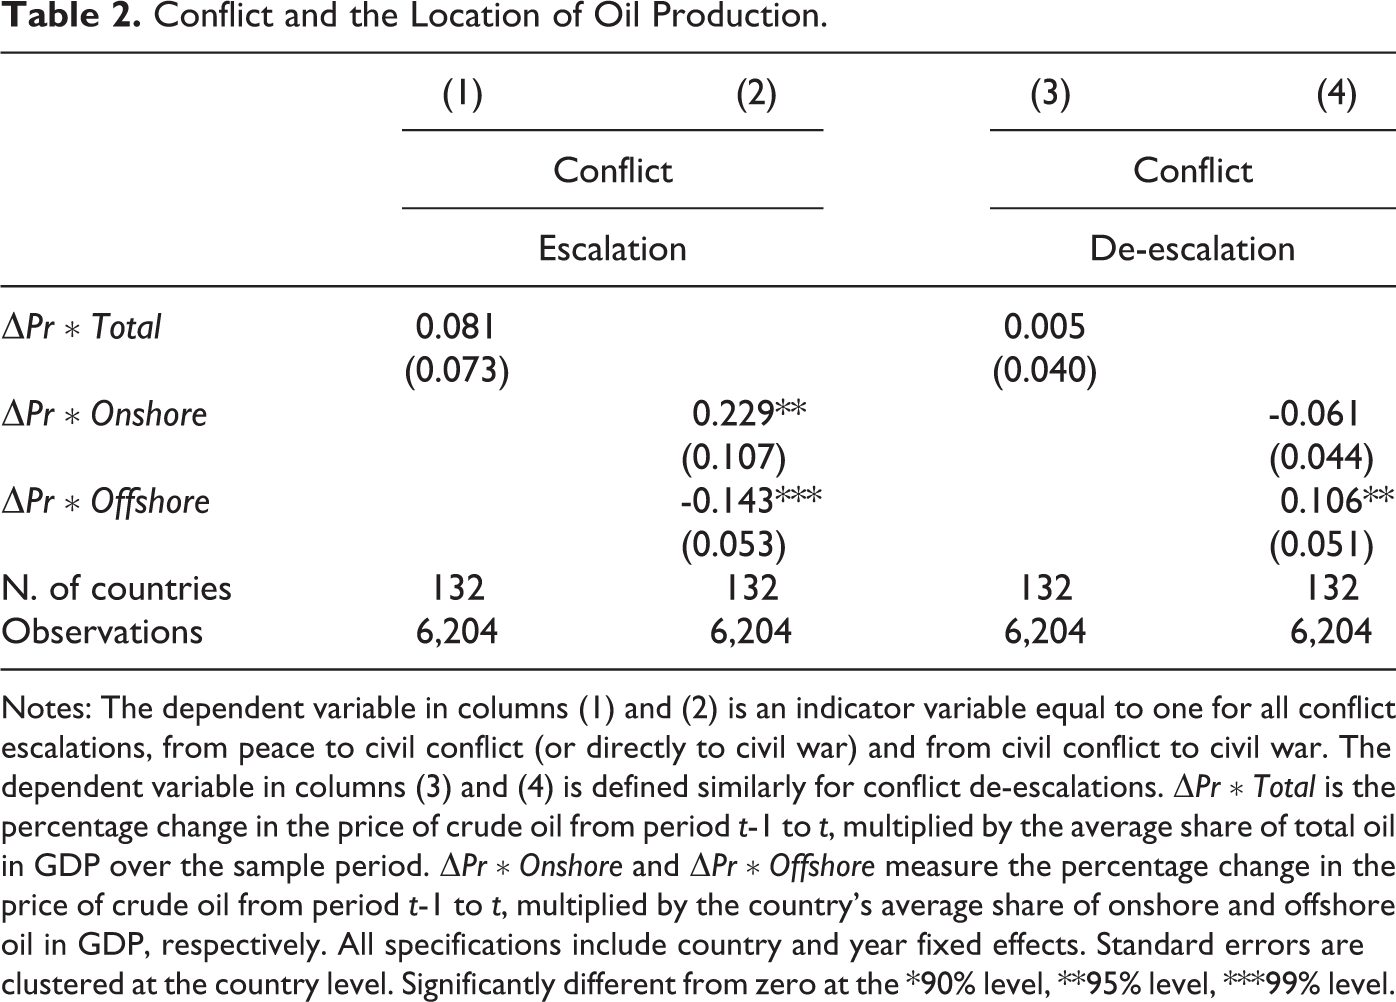
Notes: The dependent variable in columns (1) and (2) is an indicator variable equal to one for all conflict escalations, from peace to civil conflict (or directly to civil war) and from civil conflict to civil war. The dependent variable in columns (3) and (4) is defined similarly for conflict de-escalations.
Clearly, many countries produce a combination of both onshore and offshore oil. It is therefore interesting to calculate the share of onshore oil at which the effect of oil windfalls turns from having a negative to a positive impact on conflict escalation. This corresponds to the equilibrium conflict threshold
Turning to the estimates of the probability of conflict de-escalation, the results in column (3) confirm the small and statistically insignificant average effect of oil price shocks. As in the case of escalation, however, this masks considerable heterogeneity in the response to oil windfalls by onshore and offshore producers. Estimates in column (4) indicate that oil windfalls reduce the probability of conflict de-escalation for onshore countries, while they raise it for offshore countries, with an effect that is statistically significant at the 5% level.
We find a similar pattern of results in Table 3, where we restrict to the subset of events of conflict onset and termination, as well as to the overall incidence of conflict. 26 Oil price windfalls appear to raise the probability of conflict onset and incidence among onshore oil producers, as well as to reduce the probability of terminating an existing conflict in these countries. The opposite happens in offshore-producing countries. The estimates are statistically and economically meaningful. For example, according to the estimates in column (1) of Table 3, a 30% increase in the price of oil - similar to what observed at the beginning of the first Gulf war or in the aftermath of the 2011 financial crisis - triples the probability of starting a conflict in large onshore producers like Iraq. For large offshore producers like Azerbaijan, on the contrary, a similar oil price shock reduces the probability of initiating a conflict by 25%, while it increases the probability of ending an existing conflict by more than 50%. 27
Conflict Onset, Incidence, and Termination.
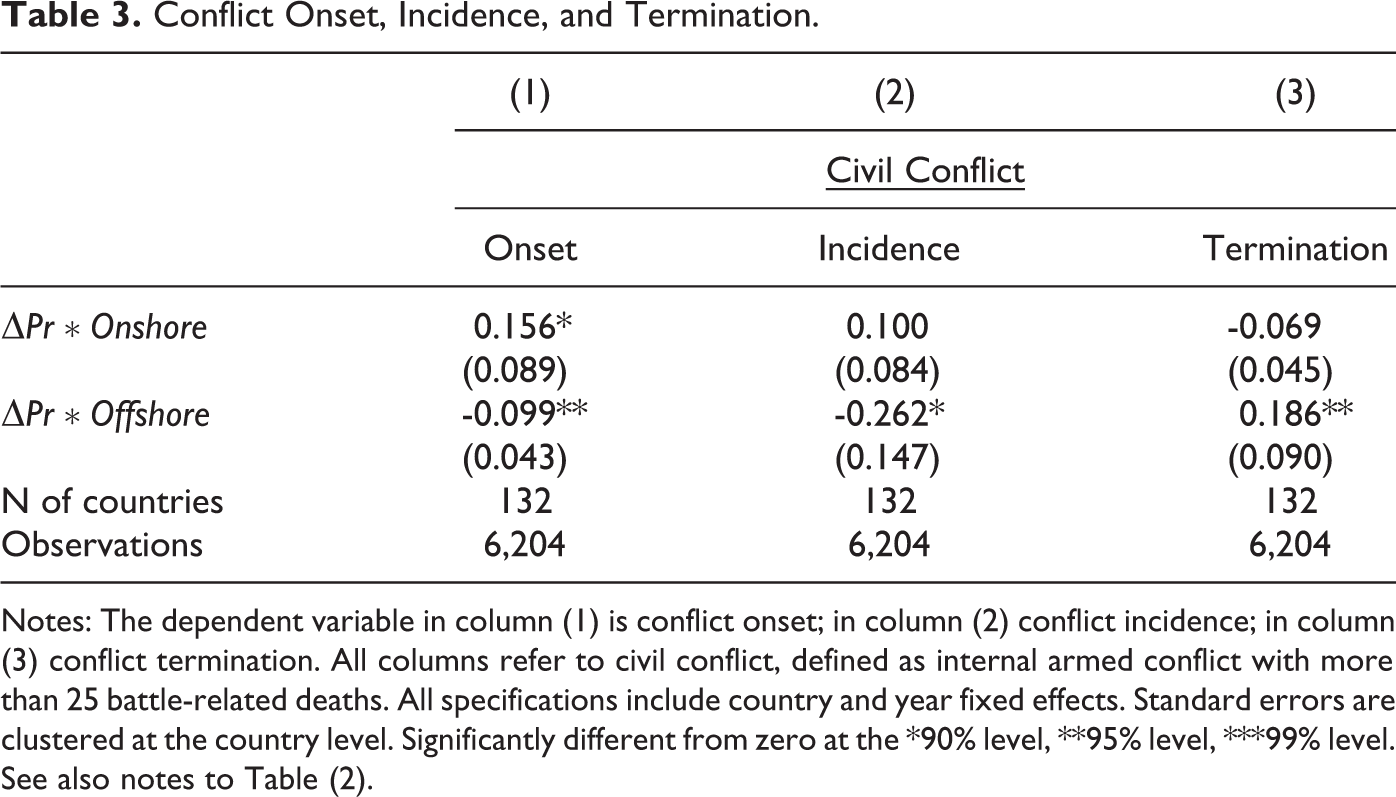
Notes: The dependent variable in column (1) is conflict onset; in column (2) conflict incidence; in column (3) conflict termination. All columns refer to civil conflict, defined as internal armed conflict with more than 25 battle-related deaths. All specifications include country and year fixed effects. Standard errors are clustered at the country level. Significantly different from zero at the *90% level, **95% level, ***99% level. See also notes to Table (2).
Overall, the empirical estimates in Table 2 and Table 3 provide support for the main theoretical prediction in Proposition 2, namely that oil price windfalls have opposite effects on the escalation and intensity of conflict depending on whether oil is produced onshore or offshore. We now move to test the second prediction of our model, that these heterogeneous effects are due to the different impact that windfalls have on the balance of power between contenders in onshore and offshore producing countries.
To test the fighting capacity mechanism, in Table 4 we estimate model (4.1) where the dependent variable is now the change between
Changes in Rebels’ Strength.
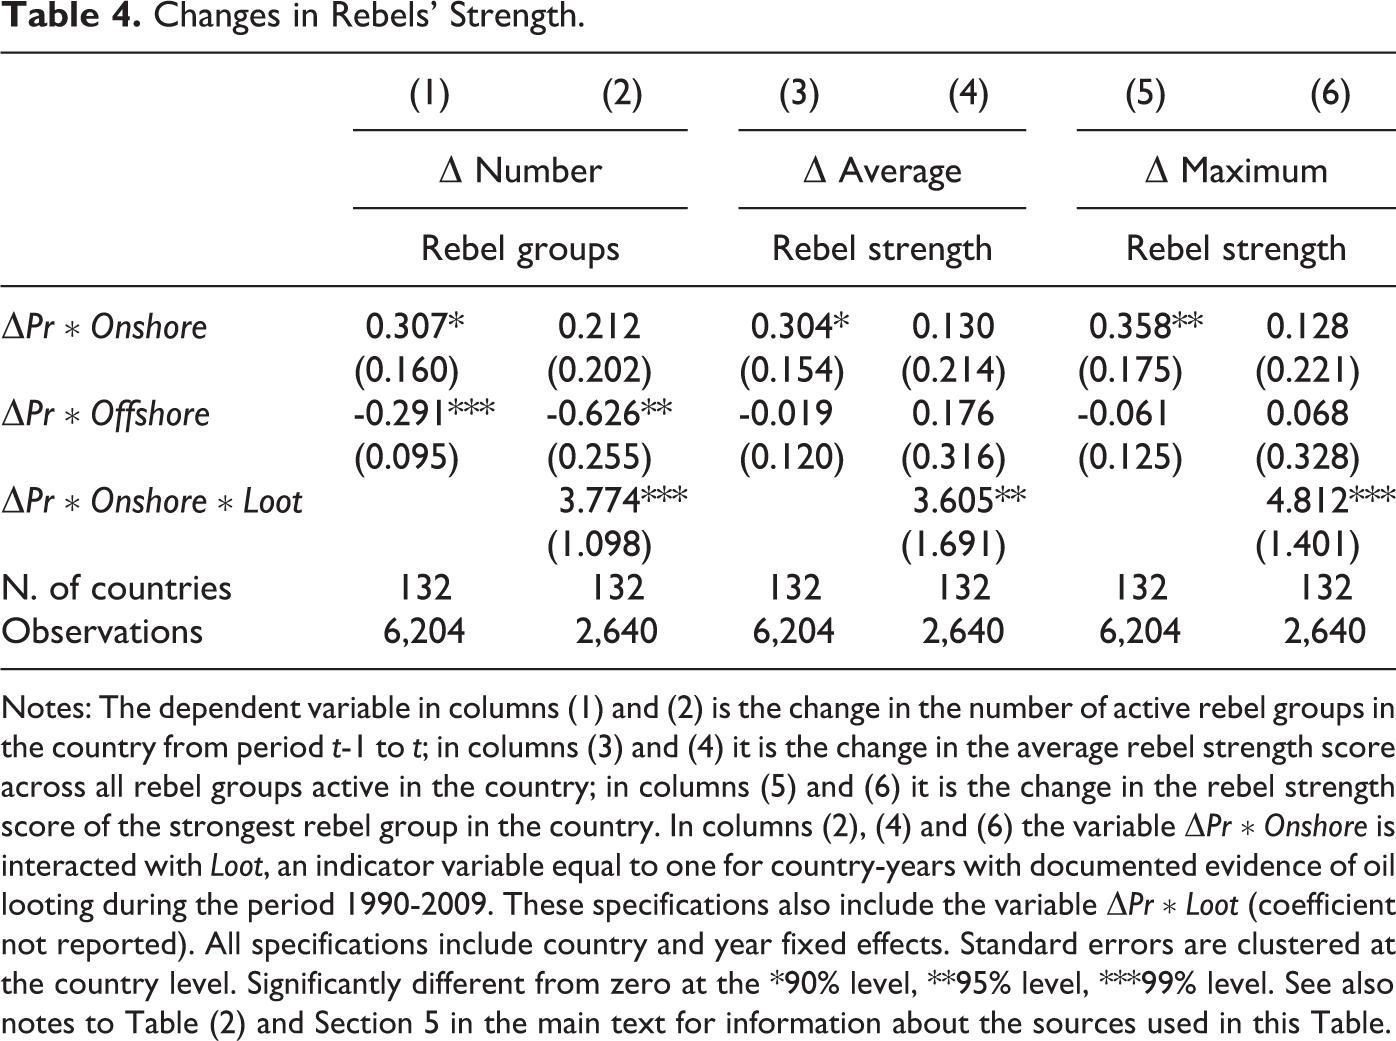
Notes: The dependent variable in columns (1) and (2) is the change in the number of active rebel groups in the country from period t-1 to t; in columns (3) and (4) it is the change in the average rebel strength score across all rebel groups active in the country; in columns (5) and (6) it is the change in the rebel strength score of the strongest rebel group in the country. In columns (2), (4) and (6) the variable
The even columns of Table 4 additionally include the interaction between the onshore-weighted price shock and an indicator variable equal to one for countries subject to documented cases of oil looting, from the Rebel Contraband data set (Walsh et al. 2018). 28 Irrespective of the measure of strength considered, the estimates indicate that oil lootability plays a crucial role in tipping the balance of power in favour of the rebels during oil windfalls.
As in the previous case of conflict escalation, we can calculate the share of onshore production above which oil windfalls raise the relative strength of the rebels against the government (i.e., the fighting capacity threshold
Robustness Checks
In this section we present a number of checks meant to probe the robustness of our findings, focusing in particular on the effect of oil windfalls on conflict escalation and de-escalation. We discuss robustness to: (i) an alternative weighting scheme; (ii) inclusion of country-specific linear trends; (iii) accounting for the potentially endogenous location of oil production; (iv) dropping countries where oil shares are identified with relatively low accuracy; (v) dropping non-oil producers; (vi) dropping large oil producers with the potential of influencing the world price. The results are reported in Table 5, where the upper panel refers to conflict escalation and the lower panel to de-escalation.
Robustness Checks: Alternative Specifications.
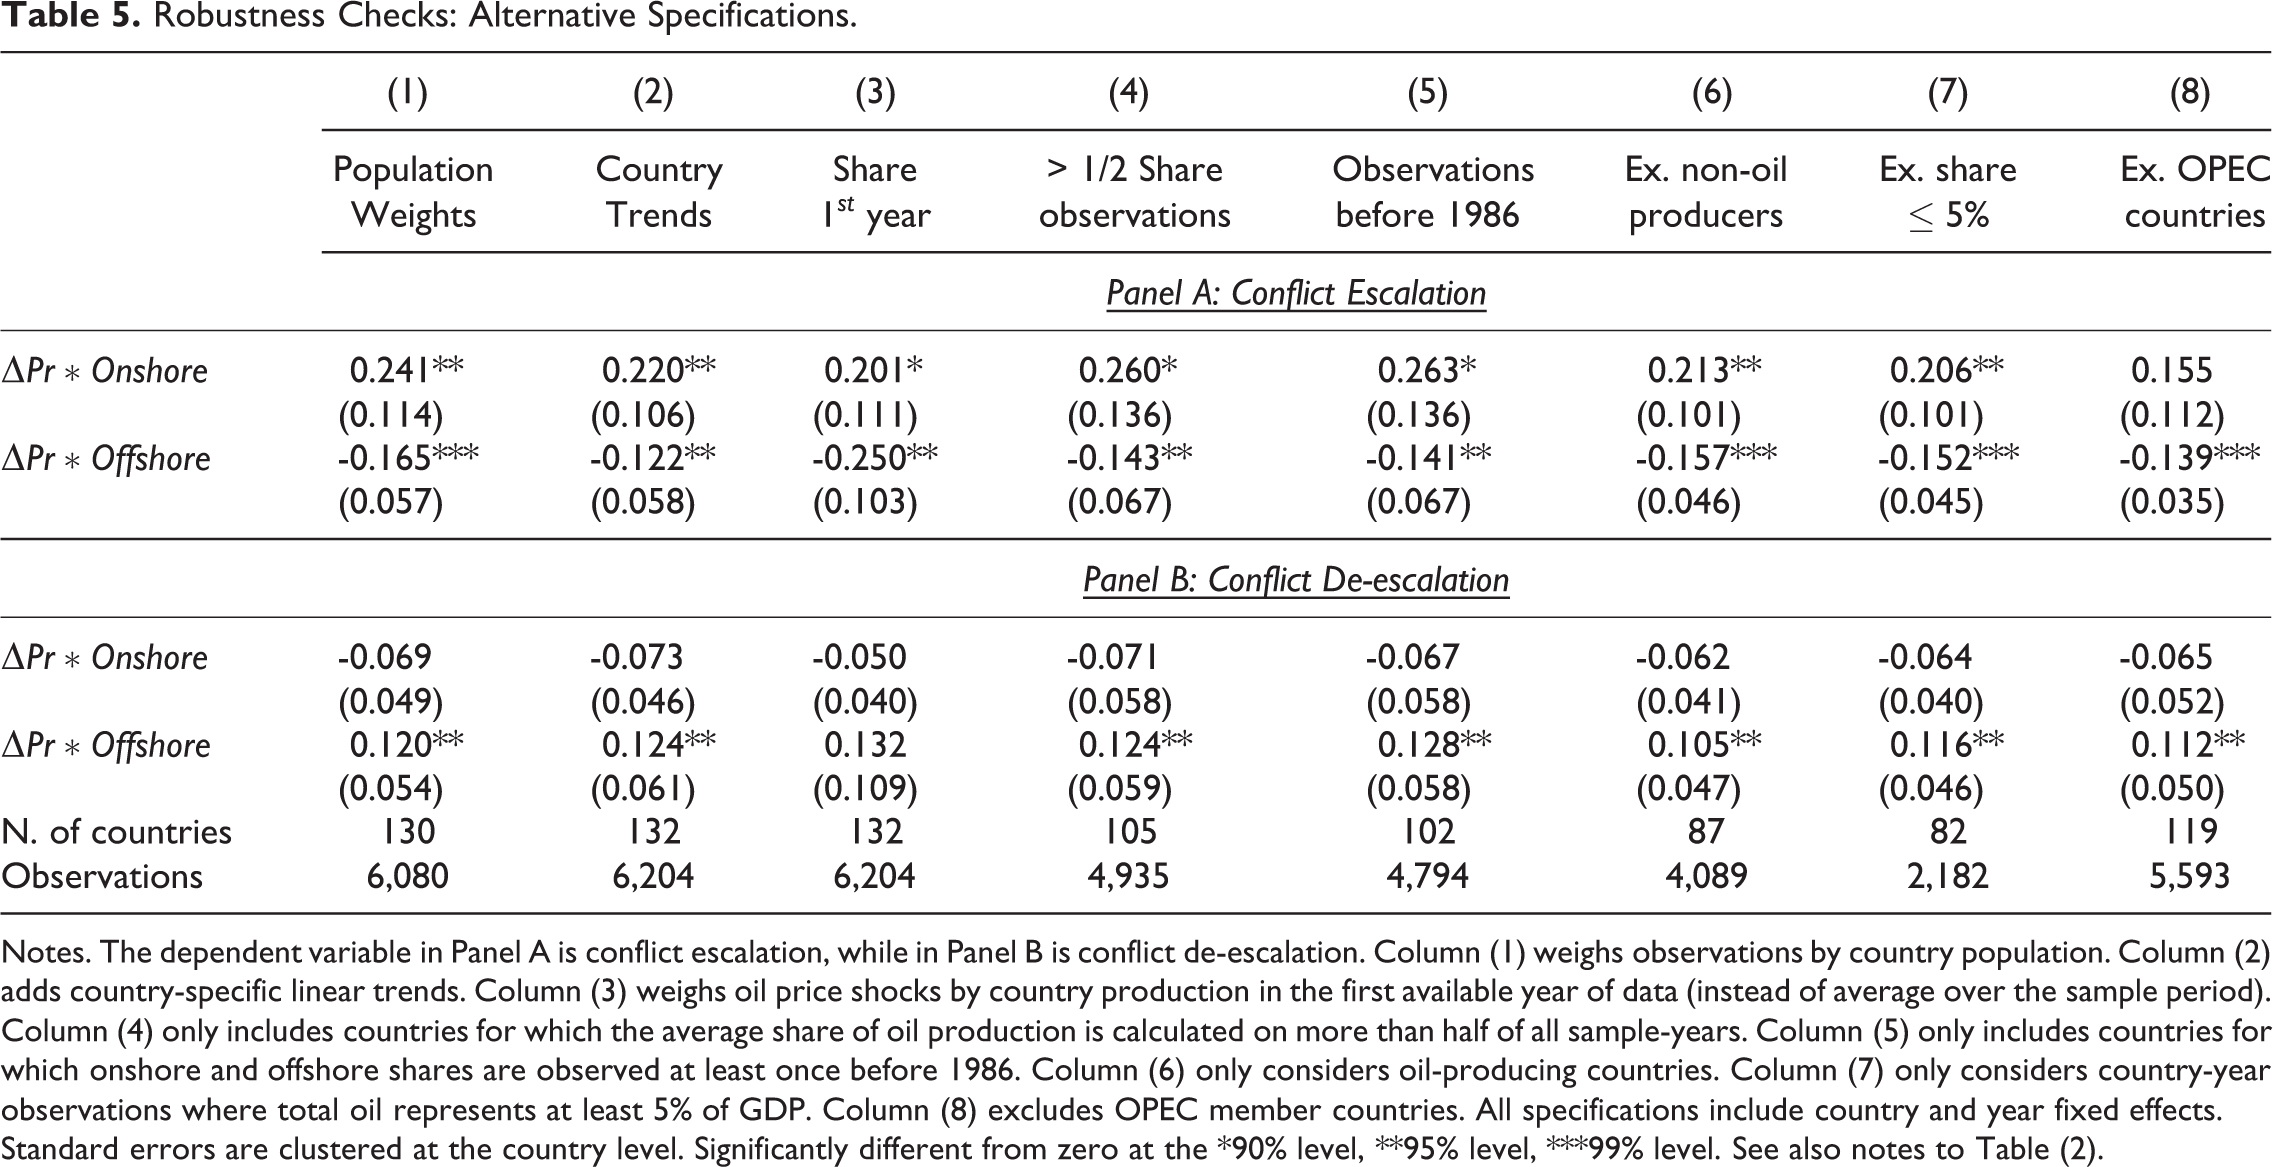
Notes. The dependent variable in Panel A is conflict escalation, while in Panel B is conflict de-escalation. Column (1) weighs observations by country population. Column (2) adds country-specific linear trends. Column (3) weighs oil price shocks by country production in the first available year of data (instead of average over the sample period). Column (4) only includes countries for which the average share of oil production is calculated on more than half of all sample-years. Column (5) only includes countries for which onshore and offshore shares are observed at least once before 1986. Column (6) only considers oil-producing countries. Column (7) only considers country-year observations where total oil represents at least 5% of GDP. Column (8) excludes OPEC member countries. All specifications include country and year fixed effects. Standard errors are clustered at the country level. Significantly different from zero at the *90% level, **95% level, ***99% level. See also notes to Table (2).
In column (1), we start by running our baseline specification with population weights to recover effects for an average person in the population rather than for an average country. Point estimates are effectively insensitive to the use of this alternative weighting scheme, and are largely in line with our baseline results.
In column (2), we include country-specific linear trends. This accounts for the possibility that countries may have embarked on different conflict paths due to trends in variables that may correlate with oil production (e.g., institutional or economic development). The inclusion of country-specific trends does not affect the baseline results, which continue to show an opposite and statistically significant effect of oil wealth on the probability of conflict in onshore and offshore countries.
In column (3), we address the potential endogeneity of oil production to conflict. One may worry, for example, that in periods of conflict a government may strategically decide to move from onshore to offshore oil production, which is at lower risk of being seized by the rebels. Or that a deterioration in the international economic outlook may increase the probability of conflict in a country, while also inducing the government to downsize the expensive offshore oil industry. We try to assuage these concerns by replacing the average production weights (i.e., the
Columns (4) and (5) show the robustness of our results to only including countries with high-quality information on the quantity of oil produced onshore and offshore. Column (4) includes countries for which the average share of oil production is calculated over more than half of the sample-years, while column (5) restricts the sample to countries for which we observe onshore and offshore shares at least once before 1986, which is the mid-point of the sample period. Both exercises lead to a drop of about 20% of the sample observations. In spite of the reduction in the sample size, the estimated effects remain precisely identified and in line with our baseline results.
Columns (6) to (8) check the robustness of our results to the exclusion of very small and very big producers. Since non-oil producing countries and countries with very low shares of oil production in GDP are unlikely to be affected by oil price changes, focusing on a smaller sample of countries with significant oil shares is arguably a better test for our model. At the other end of the spectrum, however, one might fear that our results are driven by a limited number of major oil producers, whose expected future political developments have the potential to affect the international oil prices. Column (6) excludes non-oil producers, which represent one third of countries in our sample. The point estimates remain very similar to the baseline specification, confirming that our main results are not spuriously driven by non-oil producing countries. In column (7) we perform a more stringent test, excluding any country-year observation in which total production accounts for less than 5% of GDP. This amounts to including all observations for large producers, plus medium-size producers in years of significant oil production or periods when the oil price level is relatively high. Despite the considerable sample reduction, which only includes about one third of all observations, the results remain similar to the baseline specification. Finally, in column (8) we exclude from the sample all countries belonging to the OPEC. The estimates remain qualitatively similar, although in this case the effect on onshore oil becomes marginally insignificant. 29
Despite our results appear robust to sample selection and potential endogeneity in oil’s location, one might still worry that onshore and offshore producers also differ in other - political, socio-economic or institutional - dimensions that influence their response to oil windfalls. If that is the case, the estimates of our key interaction terms will be biased. To test for this possibility, in Table 6 we present estimates of the parameters of the model where we interact oil price shocks not only with onshore and offshore production shares, but also with a large array of observable cross-country characteristics. We focus in particular on well-known correlates of conflict - such as, for example, polarization (Montalvo and Reynal-Querol 2005), colonial history (Acemoglu, Johnson, and Robinson 2001; Dell 2010), population, or socioeconomic and geographical features (Fearon and Laitin 2003). As shown, only about 10 percent of the coefficients on the additional interaction terms are significant at the 10 percent level, which is no more than what can be expected if the patterns are generated by chance. More importantly, our main coefficients of interest remain largely in line with our baseline specifications - that is, the signs of the estimates are consistent with our theoretical predictions across specifications - and the estimates are also largely statistically significant. We conclude that our main results are not likely generated by other country characteristics that happen to correlate with oil’s location.
Robustness Checks: Interactions with Country Characteristics.
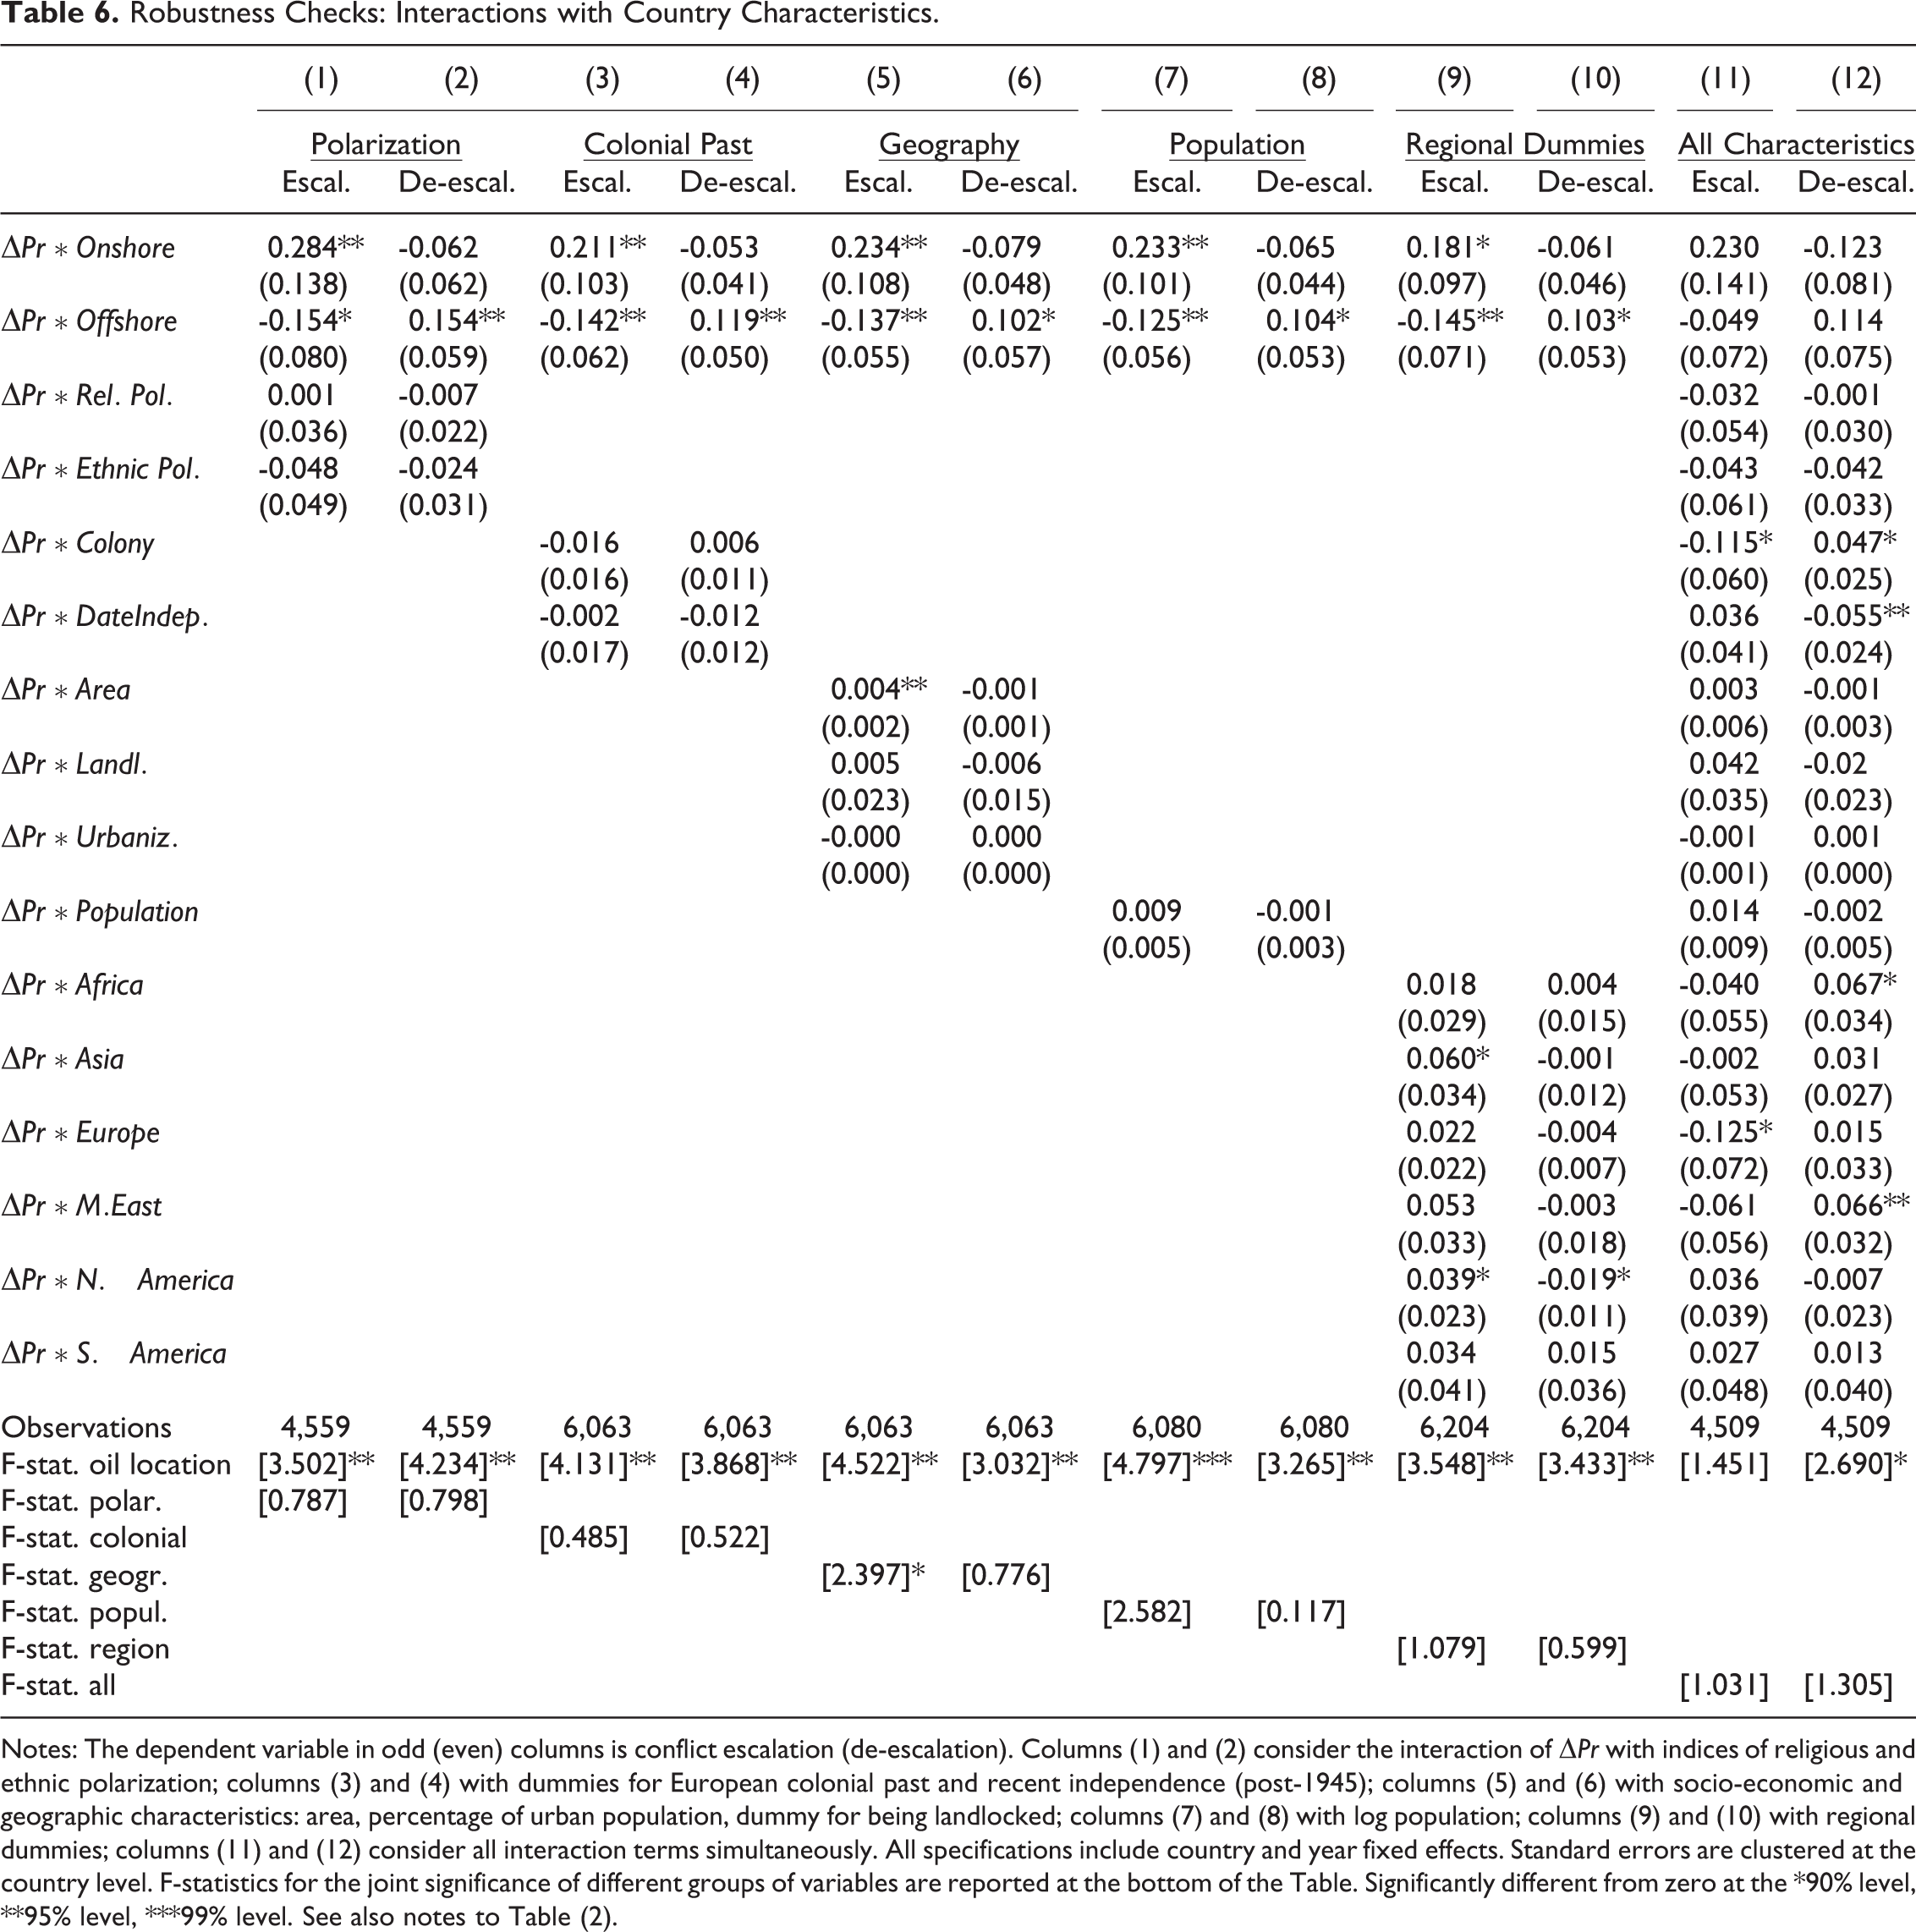
Notes: The dependent variable in odd (even) columns is conflict escalation (de-escalation). Columns (1) and (2) consider the interaction of
Conclusion
In this paper, we re-examine the relationship between oil wealth and conflict, focusing on the location of oil production and on the short-run effects of oil price changes. We start from the observation that offshore and onshore oil facilities may be asymmetrically appropriated by the parts in conflict, with the latter more likely to be attacked, looted, and even seized by rebel groups, which can use the proceeds from the looting to increase their fighting capacity. We formalize this insight in a standard conflict model a la Tullock (1980), modified to account for the endogenous fighting capacity of the opponents. The model predicts that an exogenous increase in oil wealth tilts the balance of power in favour of the rebels when the share of onshore oil production in a country exceeds a certain threshold. When onshore production is below this threshold, instead, an increase in oil wealth raises relatively more the fighting capacity of the government compared to the rebels. These heterogeneous effects on the relative balance of power of the contenders in onshore and offshore producing countries, in turn, have consequences for their level of conflict. Our model predicts that, following an oil price windfall, conflict should escalate in onshore producing countries, while the opposite should happen in offshore producing countries, where most of the profits associated to oil windfalls accrue to the government.
Our empirical results from a large panel of countries support these predictions: exogenous spikes in the price of oil on international markets appear to escalate conflict in onshore-rich countries and to de-escalate it in offshore-rich ones. We also provide evidence consistent with our interpretation of the results, by showing that changes in the relative fighting capacity of rebels and governments – measured by their observed abilities to maintain and equip troops – depend on the location of oil. Finally, by aggregating over the onshore and offshore effects of oil price windfalls, we show that the two almost exactly offset each other, plausibly explaining the zero average effect of oil wealth on conflict found in recent studies.
While our results indicate that onshore-rich countries are more prone to civil conflict, this is not to say that offshore-oil abundance necessarily represents a blessing for the citizens of a country. Indeed, offshore oil revenues have often guaranteed steady resources and increased stability to oppressive governments, like in Congo, Angola and Equatorial Guinea. An overall welfare assessment of the consequences of oil abundance and its location remains a first order question for future research.
Supplemental Material
Supplemental Material, sj-pdf-1-jcr-10.1177_00220027211042664 - Oil Price Shocks and Conflict Escalation: Onshore versus Offshore
Supplemental Material, sj-pdf-1-jcr-10.1177_00220027211042664 for Oil Price Shocks and Conflict Escalation: Onshore versus Offshore by Jørgen Juel Andersen, Frode Martin Nordvik and Andrea Tesei in Journal of Conflict Resolution
Supplemental Material
Supplemental Material, sj-zip-1-jcr-10.1177_00220027211042664 - Oil Price Shocks and Conflict Escalation: Onshore versus Offshore
Supplemental Material, sj-zip-1-jcr-10.1177_00220027211042664 for Oil Price Shocks and Conflict Escalation: Onshore versus Offshore by Jørgen Juel Andersen, Frode Martin Nordvik and Andrea Tesei in Journal of Conflict Resolution
Footnotes
Declaration of Conflicting Interests
The author(s) declared no potential conflicts of interest with respect to the research, authorship, and/or publication of this article.
Funding
The author(s) disclosed receipt of the following financial support for the research and/or authorship of this article: This study received funding from Norges Forskningsråd.
Supplemental Material
The supplemental material for this article is available online.
Notes
References
Supplementary Material
Please find the following supplemental material available below.
For Open Access articles published under a Creative Commons License, all supplemental material carries the same license as the article it is associated with.
For non-Open Access articles published, all supplemental material carries a non-exclusive license, and permission requests for re-use of supplemental material or any part of supplemental material shall be sent directly to the copyright owner as specified in the copyright notice associated with the article.