
Abstract
This article introduces an extended data set of 760 terrorist groups that engaged in attacks during 1970 to 2016. Unlike most extant group data sets, the extended data on terrorist groups (EDTG) is not tied to terrorist groups and attacks listed in the RAND terrorism data; rather, EDTG is linked to terrorist groups and attacks given in the Global Terrorism Database. Terrorist groups’ variables in EDTG include ideology, main goals, start date, duration, base country, attack diversity, peak size, alternative endings (if relevant), and others. We display interesting features of EDTG through a series of tables and figures. Our EDTG-based survival analysis is at odds with some of the literature: for example, the demise of a leader and a larger share of transnational terrorist attacks increase the group’s odds of failure. After 2001, religious terrorist groups are more resilient than those with other ideologies. We also analyze terrorist group lethality and productivity.
Keywords
Why is extended data on terrorist groups (EDTG) so essential? To understand terrorism and its drivers, researchers must investigate terrorist groups’ characteristics and actions that create casualties, achieve demands, determine base location, and affect their longevity. Knowledge of those things can foster more effective counterterrorism measures to limit terrorist groups’ carnage, political consequences, and economic ramifications. If measures can be devised to disrupt sufficiently the operation of terrorist groups, then those countermeasures can limit the associated terrorist campaigns. Terrorist groups solicit support from the base country population, other terrorist groups, and state sponsors so that the impact of such support on groups’ viability must be ascertained. To assess properly terrorist groups’ actions and prowess, research must have an up-to-date data set on terrorist groups which contains their start date, duration, goals, ideology, location, size, lethality, strategic decisions, leadership structure, and other characteristics. That data set must be bolstered by observations from other data sources, such as the World Bank’s (2018) World Development Indicators (WDI), to include economic and demographic variables from the terrorist groups’ base countries.
Terrorist groups may last for one or a few attacks, or they may exist for over fifty years (Blomberg, Engel, and Sawyer 2010; Phillips 2017). What affects terrorist groups’ survival? That survival may hinge on strategic considerations of the terrorist groups, countermeasures of governments, sponsorship from a government, or support from allied terrorist groups. The pioneering article on the determinants of terrorist group longevity is by Blomberg, Engel, and Sawyer (2010) who apply a survival or time-to-failure model. Subsequent studies on terrorist groups’ survival include Blomberg, Gaibulloev, and Sandler (2011), Carter (2012), Gaibulloev and Sandler (2013, 2014), Phillips (2014, 2017), and others. In three earlier landmark contributions, Cronin (2006, 2009) and Jones and Libicki (2008) discuss factors behind terrorist group demise but do not employ survival models. Those three studies emphasize the importance of groups’ size, their ideology, and alternative endings (e.g., having demands met, being annihilated, joining the political system, or splintering). Cronin (2006, 2009) makes clear that the death or capture of a terrorist group’s leader, even a charismatic one, need not end the group, as the assassination of Osama bin Laden in May 2011 later demonstrated (also see Jordan 2009). Other studies on terrorist groups investigate the determinants of their lethality (Asal and Rethemeyer 2008; Horowitz and Potter 2014), the diffusion of innovations (Horowitz 2010), the factors behind location decisions (Gaibulloev 2015), or the impact of state sponsorship (Carter 2012).
With the collection of terrorist event data sets, information was accumulated on terrorist groups that were thought responsible for terrorist attacks after 1967. The three most important event data sets—International Terrorism: Attributes of Terrorist Events (ITERATE; Mickolus et al. 2018), Global Terrorism Database (GTD; National Consortium for the Study of Terrorism and Response to Terrorism [START] 2018), and RAND Database of Worldwide Terrorism Incidents (RAND 2012)—provide key variables that can be linked to terrorist groups over time. Those variables include the number of attacks, the diversity of attacks, the number of casualties, the country of attack, the use of hostage taking, the success or failure of attacks, and many others. As discussed later, each of the three event data sets has its pros and cons when used in conjunction with terrorist groups’ characteristics. Because groups’ names vary among terrorist event data sets, researchers must exercise care to link terrorist group data to a given event set.
The purposes of this article are as follows: first, and foremost, we introduce the EDTG that extends the GTD-based data of Blomberg, Gaibulloev, and Sandler (2011) from 367 to 760 terrorist groups that operated during 1970 to 2016. In so doing, we explain our collection procedures and indicate data sources. EDTG is tied to GTD, thus allowing for coverage of domestic and transnational terrorist incidents throughout the period. Unlike RAND (2012) event data, GTD is updated yearly so that EDTG can be subsequently updated. Second, we illustrate myriad ways that EDTG can be employed advantageously. For example, EDTG can also be used to display the relative distributions of terrorist groups’ ideologies during the so-called third and fourth waves of terrorism, known as the leftist and religious fundamentalist waves, respectively (Rapoport 2004). Third, we exploit EDTG to show interesting patterns for the distribution of terrorist groups during various time intervals. We are interested particularly in how the four basic ideologies (i.e., leftist, nationalist/separatist, religious fundamentalist, and right wing) of terrorist groups influence their births, regional location, attack characteristics, lethality, and other aspects. Fourth, we employ EDTG to take a fresh look at group longevity using survival methods for various time intervals. The new survival analysis offers some novel findings. For example, the death or arrest of its leader increases the terrorist group’s odds of failure, contrary to the literature. Unlike Gaibulloev and Sandler (2013), casualties per attack and the number of home bases do not affect the terrorist groups’ longevity. After 2001, religious terrorist groups fare better than other ideologies in terms of survival. Our empirics also show that a larger portion of transnational terrorist attacks shortens the group’s life span. Finally, we use EDTG in a second empirical application of the determinants of groups’ lethality and attack counts.
Background
A terrorist group is a subnational collective whose members try to obtain a political goal by intimidating an audience (or constituency) through violence or its threat (Gaibulloev and Sandler 2019; Phillips 2015). Group size may vary from a mere handful of members (e.g., Animal Liberation Front) to many thousands (e.g., Aum Shinrikyo). Terrorist groups employ a variety of modes of attack that include kidnappings, skyjackings, bombings, assassinations, and armed attacks. Not only can terrorist groups’ ideologies differ but also their primary goals can vary. Key goals include policy change, territorial change, status quo (i.e., maintaining an existing political state), empire, regime change, or social revolution. The last three goals require a major upheaval of the existing political situation and are difficult to achieve.
The distinction between domestic and transnational terrorism figures prominently in the construction of EDTG. Domestic terrorism involves perpetrators and victims who are nationals from the venue country, where the attack takes place. In contrast, transnational terrorism concerns two or more nations through the perpetrators, the victims, or the host country of the attack. If, say, an Italian terrorist assassinates a French citizen in Lyon for a political purpose, then the incident is a transnational terrorist attack (Enders, Sandler, and Gaibulloev 2011). If an international border is crossed before or after an attack, then the incident is a transnational terrorist attack. Our distinction abides by that used by GTD. Most terrorist groups engage in both domestic and transnational terrorist events (Gaibulloev and Sandler 2013, 2014). In fact, domestic terrorist attacks far outnumber transnational terrorist attacks (Gaibulloev and Sandler 2019).
Previous Data Sets of Terrorist Groups
To be useful, a terrorist group data set must be tied to terrorism event data. Most terrorist group data sets and previous terrorist organization analyses are linked to RAND (2012) event data so that terrorist groups’ names and attack data are those given in RAND. Such RAND-based group data and studies include, among others, Asal and Rethemeyer (2008), Carter (2012), Cronin (2006, 2009), Gaibulloev and Sandler (2013, 2014), Horowitz (2010), Horowitz and Potter (2014), Jones and Libicki (2008), Phillips (2014, 2017), and Vittori (2009). Some of those articles’ group data sets record groups’ peak size, groups’ ideology, base location, groups’ start date, groups’ duration, allied groups, organizational structure, and competitive groups. RAND-based terrorist group data have a number of drawbacks. First, RAND data are no longer updated; the last year of coverage was 2007. The lack of recent coverage represents a significant concern if researchers are to learn about current terrorist groups and how they behave differently than past groups. Second, domestic terrorist attacks are recorded in RAND only for 1998 to 2007, which is a fairly short time period. For 1968 to 1997, RAND data track only transnational terrorist incidents. Because terrorist groups engage in both domestic and transnational terrorist attacks, coverage of both kinds of incidents is essential for understanding groups’ strategic choices, which may influence their survival. Third, RAND lacks the same coverage as ITERATE and GTD because RAND focuses on significant terrorist events (Enders 2007).
ITERATE is the basis for the study of terrorist group survival by Blomberg, Engel, and Sawyer (2010), whose data identify 1,414 terrorist groups for 1968 to 2007. Given the nature of ITERATE, all of the terrorist attacks are transnational so that the mix between domestic and transnational terrorist attacks cannot be addressed or analyzed for the sample terrorist groups. The authors use all terrorist groups associated with ITERATE-listed incidents. There is no action by the authors to clean the data and remove double counting of groups. Not surprising, Blomberg, Engel, and Sawyer (2010) uncover a large number of “one-hit wonders” that conducted a single terrorist attack. About two-thirds of their sample terrorist groups survived a year or less. By ignoring domestic terrorist events, ITERATE-based terrorist group data do not provide a full picture of terrorist groups’ campaigns because most of the groups’ attacks are not recorded.
To date, there are at least four GTD-based terrorist group studies: Blomberg, Gaibulloev, and Sandler (2011) for 1970 to 2007, Dugan (2012) for 1970 to 2010, Miller (2016) for 1970 to 2013, and Young and Dugan (2014) for 1970 to 2010. The last three studies investigate 2,103, 2,437, and 2,223 groups, respectively. For those three studies, there are few details given about cleaning the incident data of drug trafficking, insurgent activities, other nonterrorist actions. Nothing is said about removing redundant group names, typos, criminal groups, or political parties. By contrast, Blomberg, Gaibulloev, and Sandler (2011) apply inclusion criteria to limit GTD incidents to terrorist attacks before identifying GTD-identified responsible perpetrating groups. The three criteria employed are as follows: (1) the attack is perpetrated for political, socioeconomic, or religious motives; (2) the attack is intended to coerce, intimidate, or send a message to a wider audience than the immediate victim(s); and (3) the attack is beyond the boundaries set by international humanitarian law (Enders, Sandler, and Gaibulloev 2011; START 2018). Blomberg, Gaibulloev, and Sandler (2011) also purge all GTD incidents that are defined by the “Doubt Terrorism Proper” determination in GTD. Once GTD incidents are culled of nonterrorist attacks, groups claiming responsibility for the remaining attacks are identified to come up with a list of terrorist groups. GTD—as well as ITERATE and RAND—does not provide information about group characteristics such as ideology, goal, base country, and size. Therefore, Blomberg, Gaibulloev, and Sandler (2011) obtained Jones and Libicki’s (2008) terrorist group data, which has rich group-level information, and linked it to GTD. Blomberg, Gaibulloev, and Sandler (2011) were able to match 367 terrorist groups for which information on both data sets are available. These authors attributed a single name to groups with multiple names, removed criminal and other nonterrorist groups, and fixed other problems, see EDTG description below.
Why Is a New Data Set Needed for Terrorist Groups?
An extended terrorist group data set is needed that can be updated periodically as new terrorist groups emerge and existing ones end. The mix of terrorist groups’ ideologies and goals are constantly changing, as are terrorist groups’ geographical distribution. Changes in terrorist groups’ base countries can also alter these groups’ regional locations. Most researchers still rely on Jones and Libicki’s (2008) characterization of groups’ ideologies and goals, which are now ten years old and dependent on RAND event data. In past studies, those groups’ characteristics (e.g., peak size and group rivalry) and other considerations (e.g., base country economic variables and regional location) are crucial determinants for understanding group longevity, lethality, influence, and innovation. An updated data set with panel observations of key and novel variables of terrorist groups can permit past studies to be revisited and improved.
Description of EDTG
We start with the terrorist groups given in Blomberg, Gaibulloev, and Sandler (2011) for 1970 to 2007. Those 367 groups are cleaned further and updated until 2016. Then, using various additional sources, the data are extended to 760 terrorist groups that operated at times during 1970 to 2016, based on terrorist incidents listed in GTD (START 2018). Numerous new groups began terrorist operations during 2008 to 2016 and are included in EDTG. Part of the cleaning process requires merging multiple names for a group into a single entity. For example, Hezbollah, Hizballah, and Islamic Jihad are alternative names for the same group that is listed as Hezbollah in EDTG. Variants of groups’ names may stem from translation issues, other language-based names, or abbreviations. Those merging efforts greatly reduce the number of terrorist groups. Cleaning group names also requires removing typos, eliminating aliases, and assigning cells to the parent group. Finally, cleaning involves eliminating nonterrorist organizations, such as criminal organizations (e.g., Los Rastrojos), drug trafficking groups (e.g., Juarez Cartel), and political parties (e.g., Bharatiya Janata Party and All India Anna Dravida Munnetra Kazhagam Party).
Where possible, each terrorist group in EDTG is assigned a primary ideology—leftist, nationalist/separatist, religious fundamentalist, and right wing—following the convention of Jones and Libicki (2008). This assignment relies on a number of sources (Asal and Rethemeyer 2015; Crenshaw 2018; Jones and Libicki 2008; South Asia Terrorism Portal [SATP] 2018; Terrorism Research and Analysis Consortium [TRAC] 2018, and other news and Internet pages). Using those same sources, we match each sample terrorist group with a primary goal—policy change, status quo, territorial change, and empire, regime change, or social revolution—as had been done in Jones and Libicki (2008). Based on Crenshaw (2018), Jones and Libicki (2008), and other sources (see codebook), each terrorist group’s base country is identified. If a terrorist group possesses more than one base country, then each base country is noted. Using World Bank’s (2018) regional classifications, we then match each terrorist group’s base country with a region. When a group’s base countries are in more than one region, each region is recorded in EDTG.
When there is firm evidence that a group began in a certain year, that year is recorded by EDTG as the group’s start date. If no such evidence exists, EDTG uses the year of the group’s first attack in GTD as its start date. When evidence indicates that a terrorist group ended, that year is recorded as the group’s end point. Without such evidence, we record the group as ending if it was inactive for five years. That is, a terrorist group that does not claim responsibility for any attack from, say, 2012 to 2016 is deemed by EDTG to have concluded operations. The group’s duration is the number of years since its founding if it is still active. Otherwise, duration refers to the time span between its founding and ending. EDTG indicates the following alternative endings for terrorist groups: defeated by military force or police, splintered from within, joined the political process or achieved its goals, merged with other groups, or concluded operations since 2012. Data sources for alternative endings include Asal and Rethemeyer (2015), Crenshaw (2018), Jones and Libicki (2008), SATP (2018), and TRAC (2018).
A handful of terrorist groups, listed in Jones and Libicki (2008) or Blomberg, Gaibulloev, and Sandler (2011) as having ended, are resurrected in EDTG if the terrorist group resurfaces with newly claimed attacks during 2008 to 2016 in GTD (2018). We are cautious about resurrecting groups unless there is convincing evidence about the group resuming and claiming attacks. Moreover, we set a threshold of at least two attacks if the group is resurrected. For example, after a hiatus of over a decade, Jammu and Kashmir Islamic Front took credit for terrorist attacks after 2013. Another resurrected group is the Kosovo Liberation Army (KLA), which is listed as ending in 1999 in Jones and Libicki (2008) but KLA claimed attacks in 2014. If over five years have passed since a group’s resurrection, then the group is treated as a different group with a birth at the time of the first new attack. Our data then distinguish between the original and the resurrected group—see the codebook.
Another important group variable is group size because larger terrorist groups are thought to possess better survival prospects and to engage in more lethal attacks. Like Jones and Libicki (2008), we are particularly interested in the largest or peak size achieved by the group over its duration. For a subsample of groups, Asal and Rethemeyer (2015), Crenshaw (2018), and SATP (2018) list varying group size for selected years. EDTG uses these yearly group size observations to alter the peak size variable, n, if relevant. The peak size variable is in discrete units: 1 for 0 < n ≤ 9, 10 for 10 ≤ n ≤ 99, 100 for 100 ≤ n ≤ 999, 1000 for 1000 ≤ n ≤ 9999, and blank if n is unknown.
EDTG relates terrorist groups to attack and strategic variables, derived from GTD (2018) and Enders, Sandler, and Gaibulloev (2011). The latter provides a decomposition of terrorist incidents into domestic, transnational, and ambiguous (uncertain) attacks. With the help of GTD (2018), EDTG records various injuries, deaths, and casualties (i.e., deaths plus injuries) figures associated with the sample terrorist groups during each of their active years. As an important source of funding, kidnappings are indicated for sample groups during each year of operation.
EDTG includes some variables missing from most other group data sets, such as attack diversity (i.e., one minus the Hirschman–Herfindahl index), share of transnational terrorist attacks, reliance on kidnappings, and fate of leader. From other data sets, EDTG incorporates important variables on state sponsorship of groups, interface with other terrorist groups (allied or competitive), supply of social services, and the holding of territory (Asal and Rethemeyer 2008; Heger and Jung 2017; San-Akca 2009, 2015, 2016; Wilkenfeld, Asal, and Pate 2011). In so doing, we make sure that the groups’ names agree between EDTG and those other data sets.
Other characteristics of groups are indicated in the codebook, along with their data sources. In the Online Appendix, Table A1 indicates summary statistics for EDTG-based variables. In the ensuing text, we display figures and tables that parse out EDTG group variables in informative ways.
How Can EDTG Be Used?
EDTG can enrich survival analyses of terrorist groups through the inclusion of many new variables. In addition, the added nine years of coverage permits the inclusion of many new terrorist groups (e.g., Baloch Liberation Tigers and Mukhtar Army) and the demise of other groups (e.g., Tamil Tigers). The expanded range of data also allows for more interesting subperiods such as post-9/11 or post-2006.
The data are sufficiently rich to investigate the changing geographical distribution of terrorist groups over time. In so doing, the influence of those altering distributions on group survival rates can be ascertained. Not only has the mix of ideologies of terrorist groups changed over time but also has the driving goals of terrorist groups. Both of those changes can influence the prognosis for terrorist group survival. With the expanded data, researchers possess more panel data observations to apply competing risks models to ascertain the determinants of alternative ways that terrorist groups end. Nine more years of data, coupled with the origin of many new terrorist groups, bolster the precision of competing risks models. The new observations allow for more controls, which are recorded in EDTG. Thus, the importance of group leadership, intergroup linkages, group rivalry, and group financial strategy on group survival can be investigated. For example, after 9/11, terrorist groups have relied increasingly on kidnapping ransoms as a financing tool (Brandt, George, and Sandler 2016). However, the downside of the reliance on kidnappings is that it may expose terrorist groups to heightened risks as they must maintain hideouts for hostages. EDTG also permits further analysis of the determinants of the lethality of terrorist groups based on a longer time series, more controls, and additional terrorist groups. As shown below, more religious fundamentalist groups, especially Islamic ones, have emerged than the other three ideologies over the last decade. Moreover, these religious groups are shown later to engage in more incidents with carnage.
Some Trends and Patterns Based on EDTG
We employ EDTG to indicate some insights that this group data can provide for researchers and policy makers. Figure 1 depicts the annual number of newly formed terrorist groups for 1970 to 2016, given in EDTG. There appears to be an increased variability in their formation during the last decade with two prominent peaks. The inclusion of the last nine years and the ability to expand terrorist group data into the future are essential to understand a fluid set of terrorist groups, whose ideological composition and other characteristics are changing.
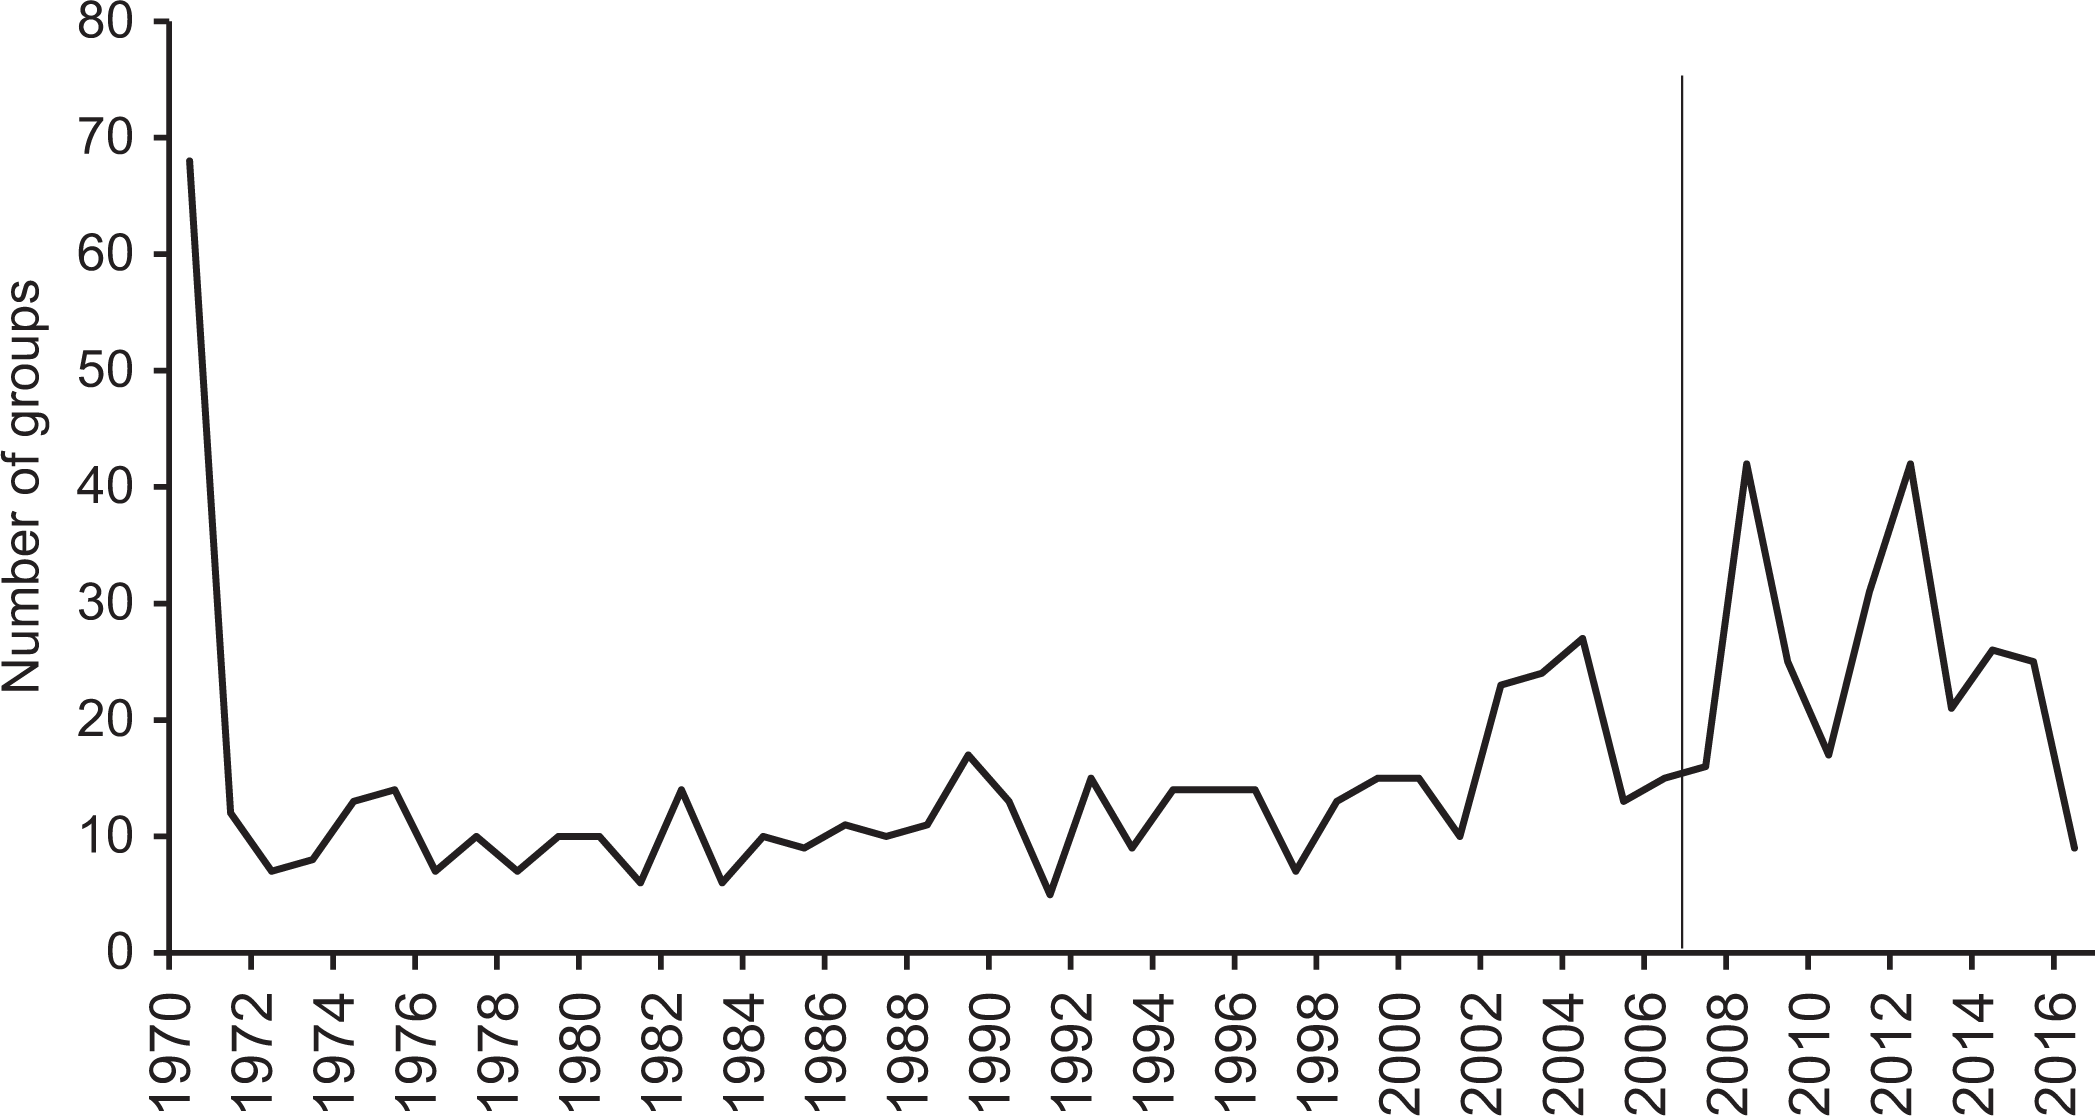
The annual number of newly formed groups during 1970 to 2016.
Figures 2 and 3 depict terrorist groups’ composition based on their four ideologies and the seven regional classifications, respectively, for the entire period (1970–2016) and two subperiods (1970–2006 and 2007–2016). Comparing those subperiods, we see the marked rise of religious fundamentalist terrorist groups and the clear decline of left-wing terrorist groups during the latest subperiod. Those compositional changes agree with the notion of the third and fourth waves of terrorism (Rapoport 2004). An often overlooked feature is that nationalist/separatist (henceforth, nationalist) terrorist groups continued to rival religious fundamentalist terrorist groups in percentage terms or “market share” during the so-called fourth wave. That rivalry is displayed for the last ten sample years in Figure 2. As those two ideologies compete for dominance, a subsequent table shows that religious groups conducted more lethal attacks. Although left-wing terrorist groups’ market share declined greatly during the recent decade, these groups still had a presence.
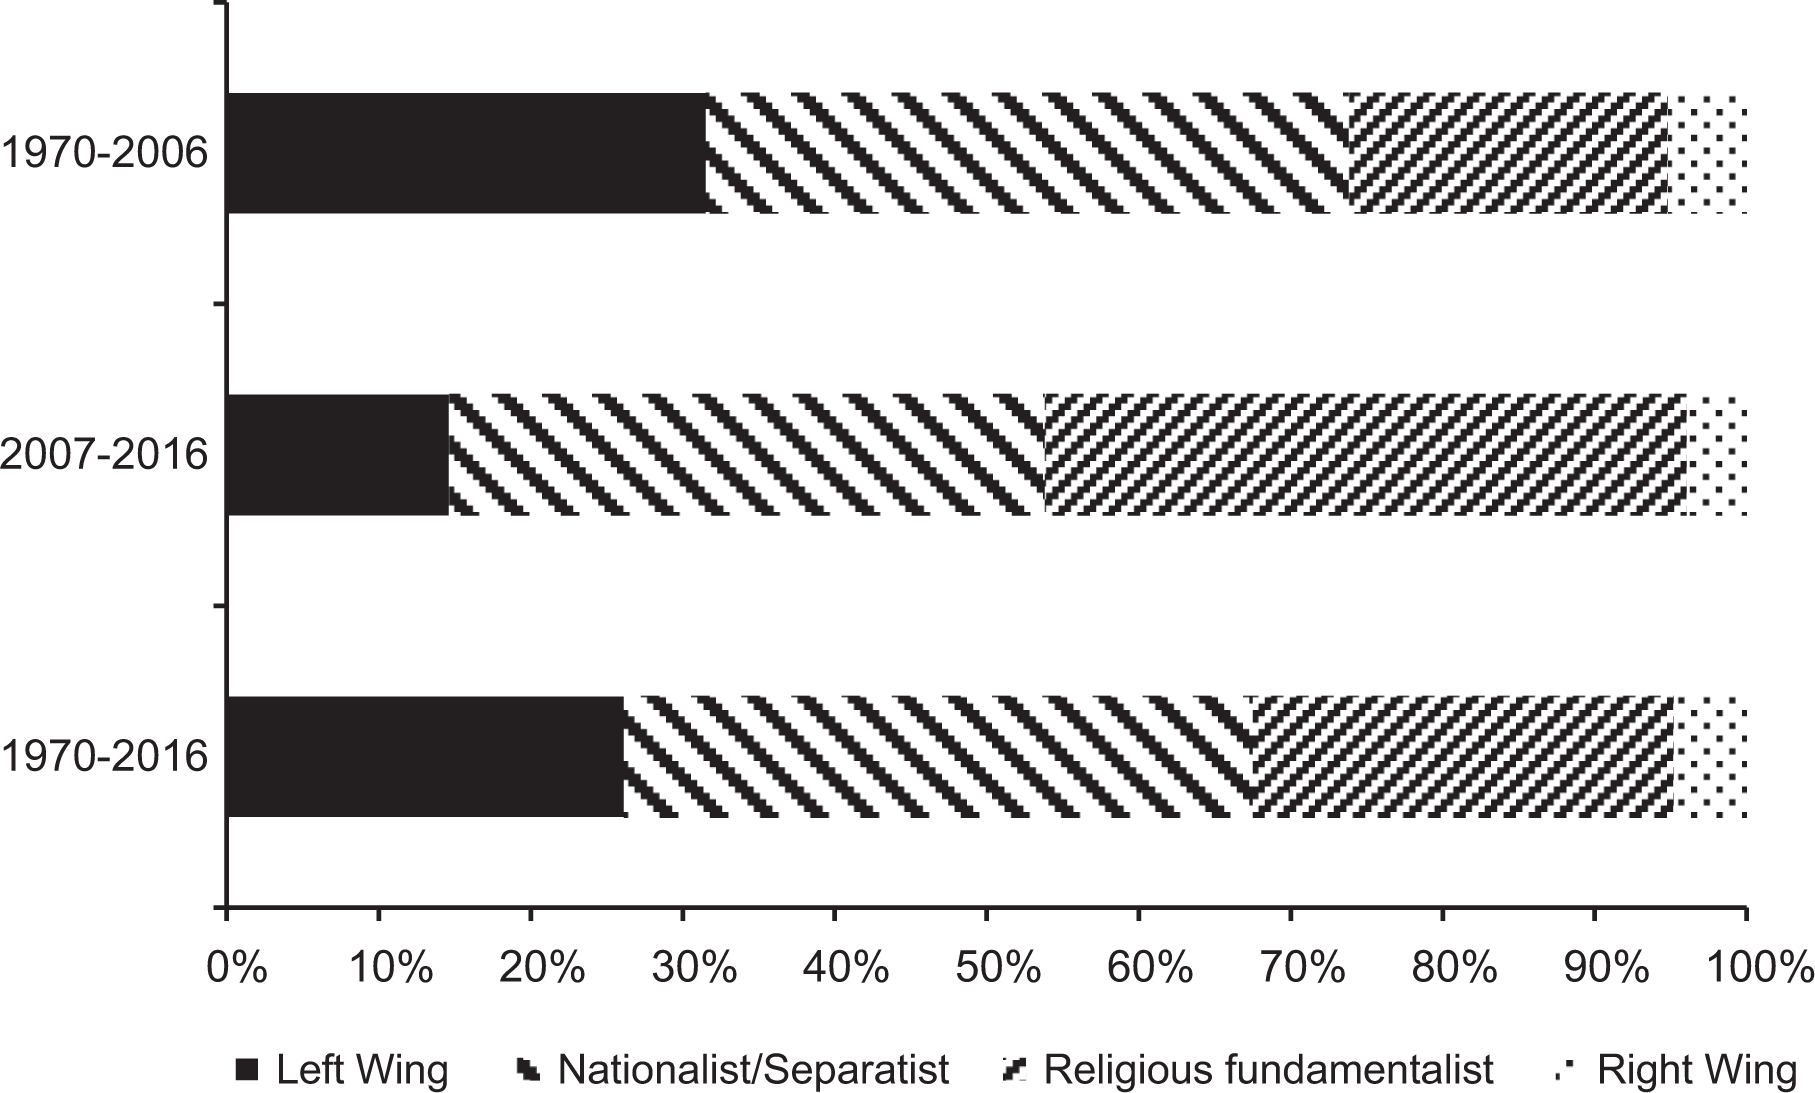
Group composition based on ideology.
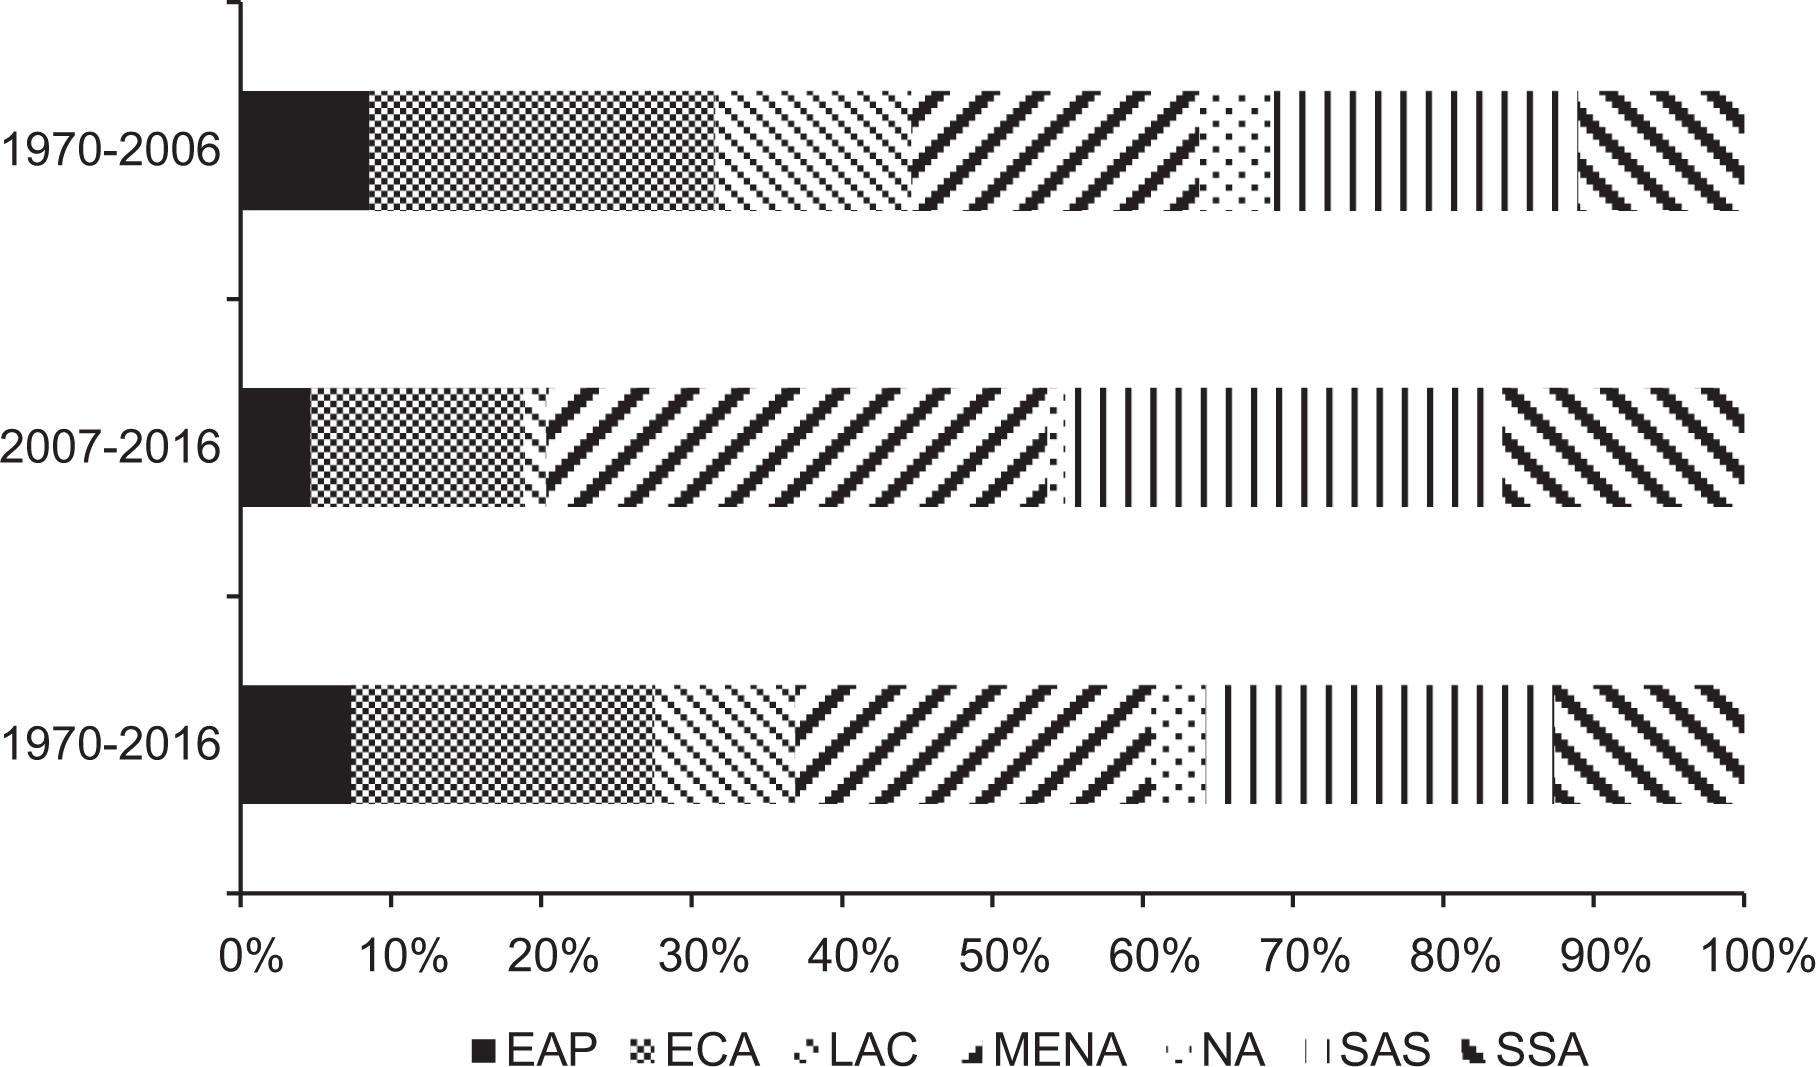
Group composition based on location.
Figure 3 presents three alternative time interval observations of terrorist groups, based on seven regional locations: Eastern Asia and Pacific (EAP), Europe and Central Asia (ECA), Latin America and Caribbean (LAC), Middle East and North Africa (MENA), North America (NA), South Asia (SAS), and sub-Saharan Africa (SSA). When the 1970 to 2006 regional locations are compared to those of 2007 to 2016, there are noticeable declines for terrorist groups located in EAP, ECA, LAC, and NA, coupled with noteworthy increases for terrorist groups located in MENA, SAS, and SSA. Since the start of 2007, the greatest percentage increase in terrorist groups occurs for MENA. Thus, there is a regional relocation of terrorist groups during the last decade that would be missed by RAND-based group data sets. This relocation is likely driven by post–9/11 increases in security in ECA and NA and by political instabilities and resulting rise in Islamic religious fundamentalist terrorism in MENA, SAS, and SSA (Gaibulloev and Sandler 2019). Additionally, leftist terrorist groups in LAC are in great decline.
Three tables allow us to characterize various aspects of terrorist groups with the help of EDTG. Table 1 indicates the ideological distribution of terrorist groups in terms of their base country’s (countries’) income levels and regime type before and after 2002. Groups’ ideologies are listed in the left-most column, immediately followed on the right by the average annual number of terrorist groups. In the third column, the number of groups is given with their percentages in parentheses. The average number of a particular type of group is computed by dividing thirty-two into the number of that type of group that started during 1970 to 2001. A similar computation is made for the annual average number of new terrorist groups of a given ideology that began during 2002 to 2016. Nationalist groups had the most starts in both periods, but they narrowly edged out the births of religious groups during 2002 to 2016. In percentage terms, the births of nationalist and religious groups are near one another in the post-2001 period. Next, we use the World Bank (2018) income classes for terrorist groups’ base countries. For terrorist groups that started before 2002, left-wing groups were mainly located in middle- and high-income countries; nationalist and religious groups were primarily located in low- and middle-income countries; and right-wing groups were mostly located in middle- and high-income countries. In terms of base country income level, nationalist groups were the most widely distributed. Some noteworthy changes occurred in the post-2001 period. New left-wing terrorist groups were more evenly split between middle- and high-income countries, while emerging nationalist terrorist groups were more concentrated in low- and middle-income countries. Religious groups remained concentrated in low- and middle-income countries with their presence in middle-income countries increasing noticeably after 2001.
Distribution of Terrorist Groups by Ideology and Base Country of Operation’s Characteristics: Before and After 2002.
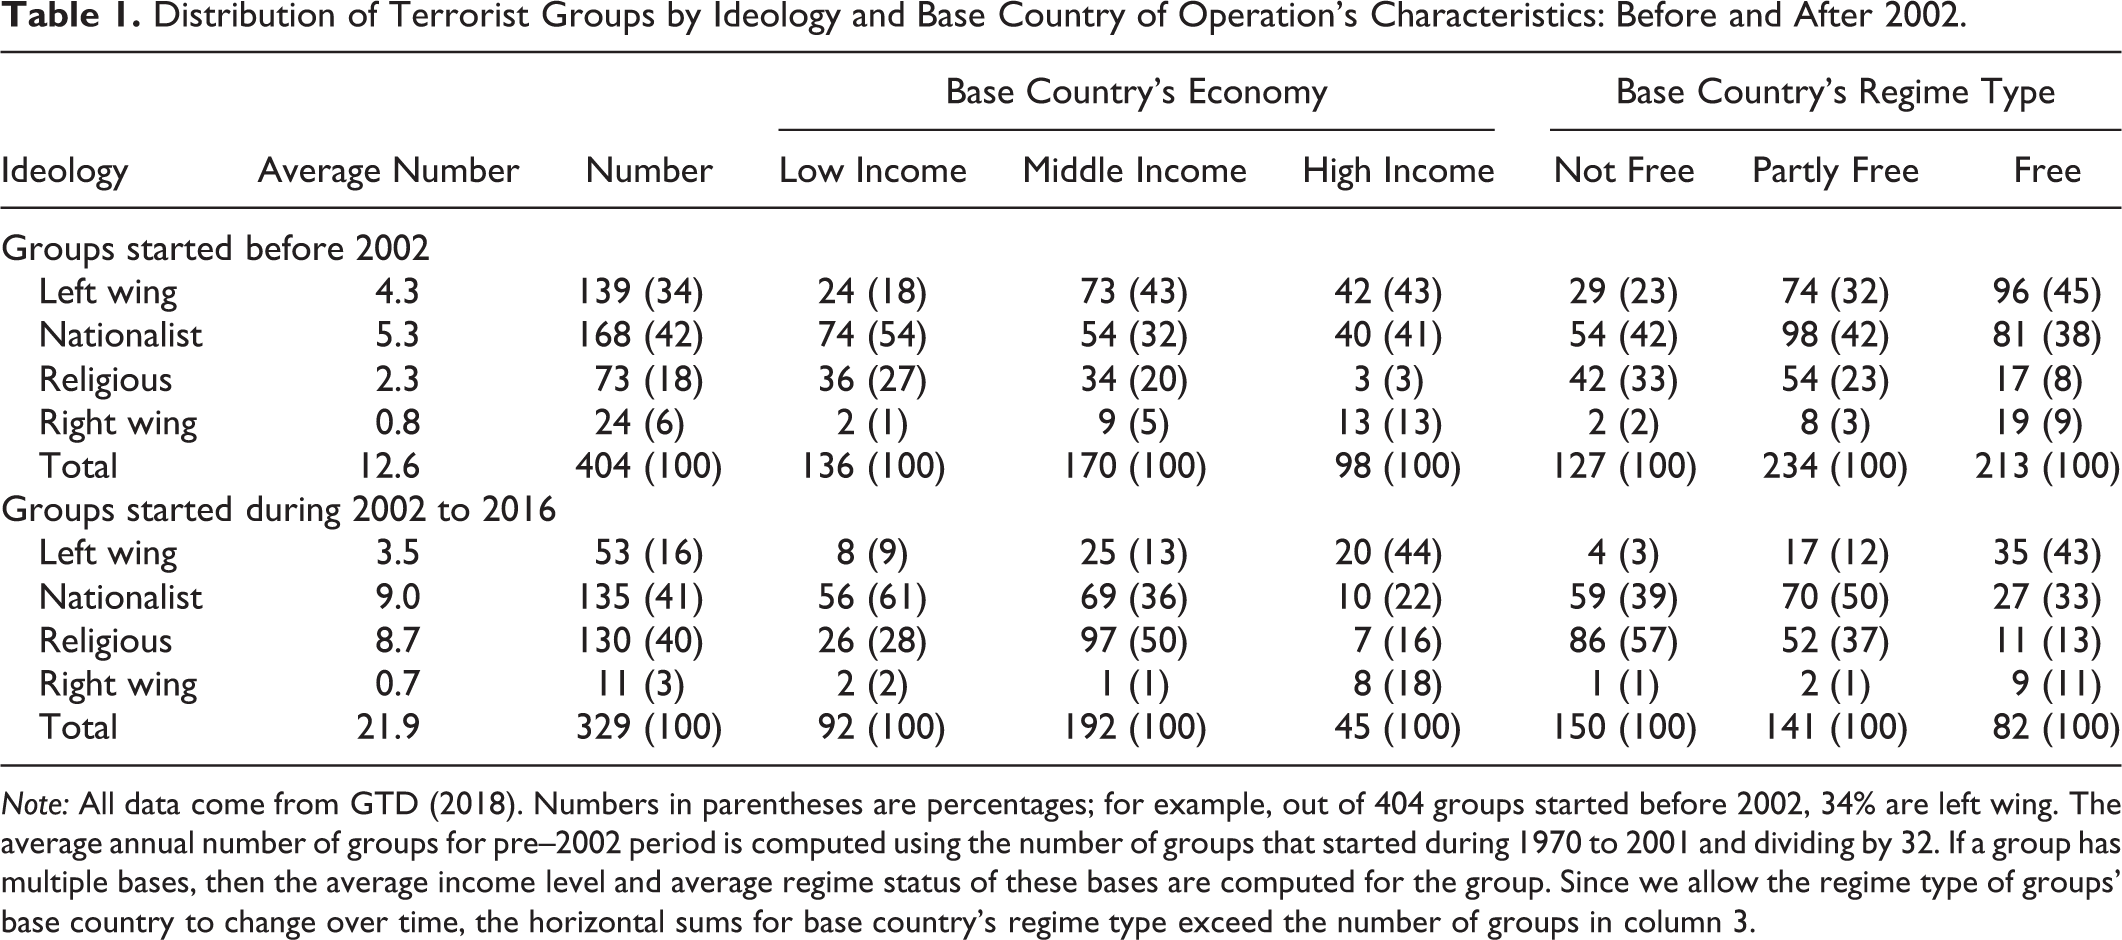
Note: All data come from GTD (2018). Numbers in parentheses are percentages; for example, out of 404 groups started before 2002, 34% are left wing. The average annual number of groups for pre–2002 period is computed using the number of groups that started during 1970 to 2001 and dividing by 32. If a group has multiple bases, then the average income level and average regime status of these bases are computed for the group. Since we allow the regime type of groups’ base country to change over time, the horizontal sums for base country’s regime type exceed the number of groups in column 3.
In Table 1, we also parse out the ideological distribution of terrorist groups in terms of base country’s regime type. For this exercise, we combine Freedom House (2018) measures of civil liberties and political freedoms, each of which varies from 1 to 7, where smaller scores indicate greater liberties or freedom. As is standard, we add these two indices together and have the following three classifications: free (2–5), partly free (6–10), and not free (11–14). For terrorist groups started before 2002, left-wing, nationalist, and right-wing groups were more concentrated in Partly Free and Free countries, whereas religious groups were more centered in not free and partly free countries. There are two noteworthy changes in those distributions after 2001. First, emerging nationalist terrorist groups became more concentrated in not free and partly free countries relative to the earlier period. Second, emerging religious groups became more concentrated in not free countries compared to the earlier period. This shift to more autocratic regimes by nationalist and religious terrorist organizations is likely due to security and geopolitical considerations in the post–9/11 era.
Table 2 indicates additional details of terrorist groups by listing for the two periods the following: the number of groups that ended by 2016, the number of incidents, the number of casualties, the number of incidents per group, and the number of casualties per group. The four right-hand columns give a picture of the terrorism campaigns waged by each ideology. For the groups that started before 2002, leftist, followed by nationalist, groups had the largest number of endings. Right-wing and then left-wing groups displayed the greatest demise percentages. During 2002 to 2016, all ideologies showed an enhanced resilience for newly formed terrorist groups, which was particularly true for religious and nationalist organizations. At the terrorist campaign level, emerging leftist groups had the greatest influence on the number of incidents during 1970 to 2001. However, religious and nationalist groups caused more casualties than leftists. This concurs with leftist intent not to have large casualty tolls (Enders and Sandler 2012). Despite the relatively small number of pre-2002 religious groups, they caused the largest number of casualties, as reflected in their casualties per group. For groups starting during 2002 to 2016, religious groups not only engaged in well over five times as many attacks, but these attacks resulted in far more casualties when compared to each of the other three ideologies. Those terrorist campaign characteristics justify the perceived dominance of religious terrorists since 9/11. In EDTG, religious terrorist attacks resulted in 14.3 and 56.5 times as many casualties as attacks by nationalist and left-wing groups, respectively. Moreover, the casualties per religious group were 14.8 times as great as those of nationalist groups.
Distribution of Terrorist Incidents by Group Ideology: Before and After 2002.
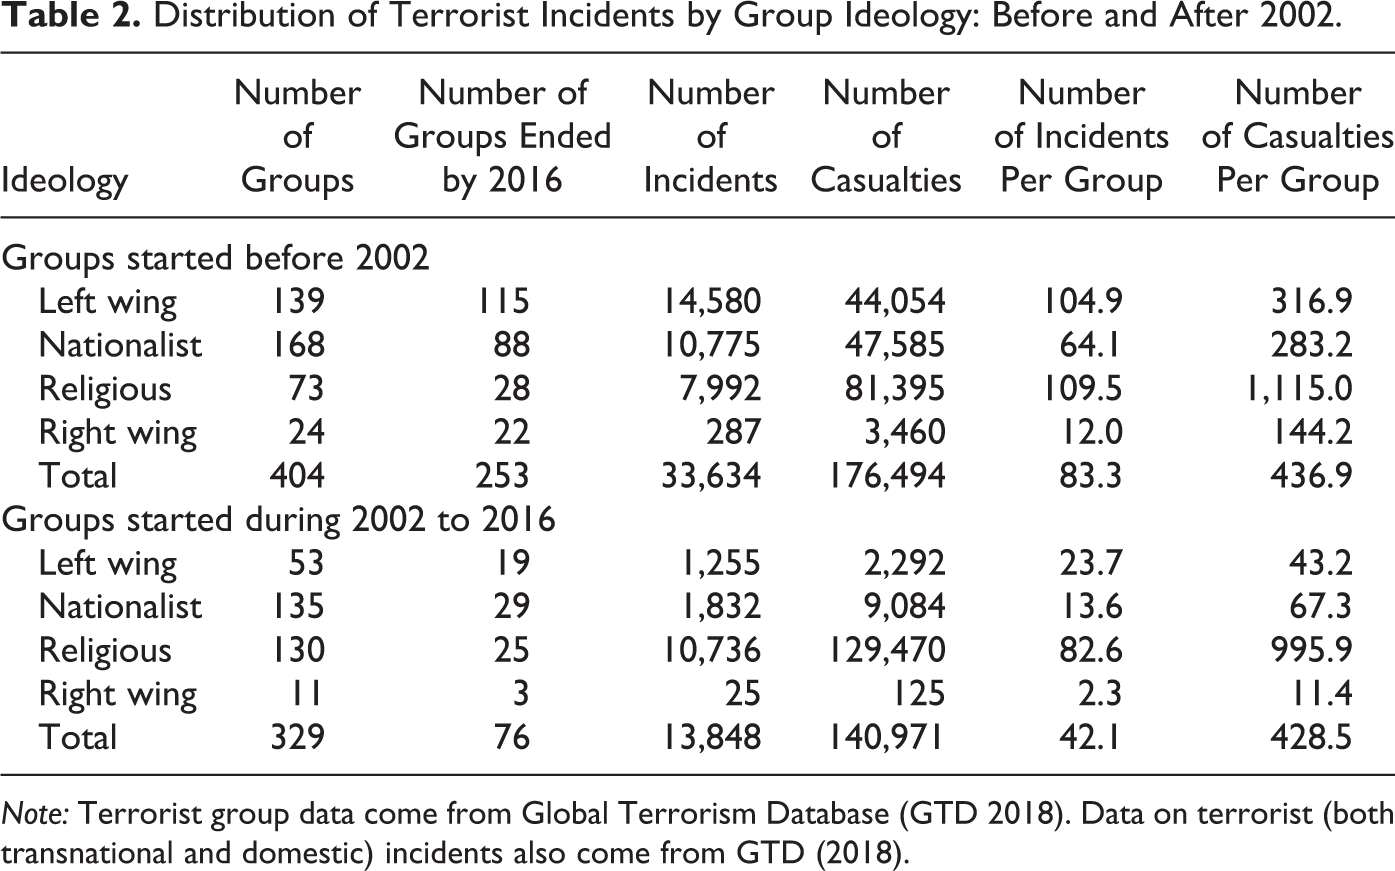
Note: Terrorist group data come from Global Terrorism Database (GTD 2018). Data on terrorist (both transnational and domestic) incidents also come from GTD (2018).
Finally, Table 3 depicts further aspects of the terrorist campaigns of the four ideologies during four time intervals. The 2002 to 2006 and 2007 to 2016 periods are intended to capture the emergence of terrorist groups toward the end of the RAND data period and thereafter. The last period’s observations are best characterized by EDTG. During 2007 to 2016, religious groups were most prevalent of the four ideologies in terms of emerging group numbers and attacks. The right-most column of Table 3 indicates that religious groups relied much more on kidnappings than other ideological-based groups in the three post-2001 periods. As such, kidnapping ransoms financed a share of religious groups’ operations (Brandt, George, and Sandler 2016). Table 3 displays the breakdown of attacks into domestic and transnational incidents. For any ideology or period, the share of transnational attacks was a rather small percentage that fell after 2001. This highlights why terrorist group data sets must include domestic terrorist attacks. Surprisingly, nationalist and left-wing groups provided the most social services before 2002, but religious groups had the highest percentage of social service–providing groups. Even though emerging religious groups gave the most social services during 2002 to 2016, most terrorist groups did not provide such services, which was especially true during 2007 to 2016 for new groups. Table 3 also highlights that a very small percentage of terrorist groups held territory during any of the displayed periods.
Further Characteristic of Terrorists Incidents by Group Ideology: Alternative Time Periods.
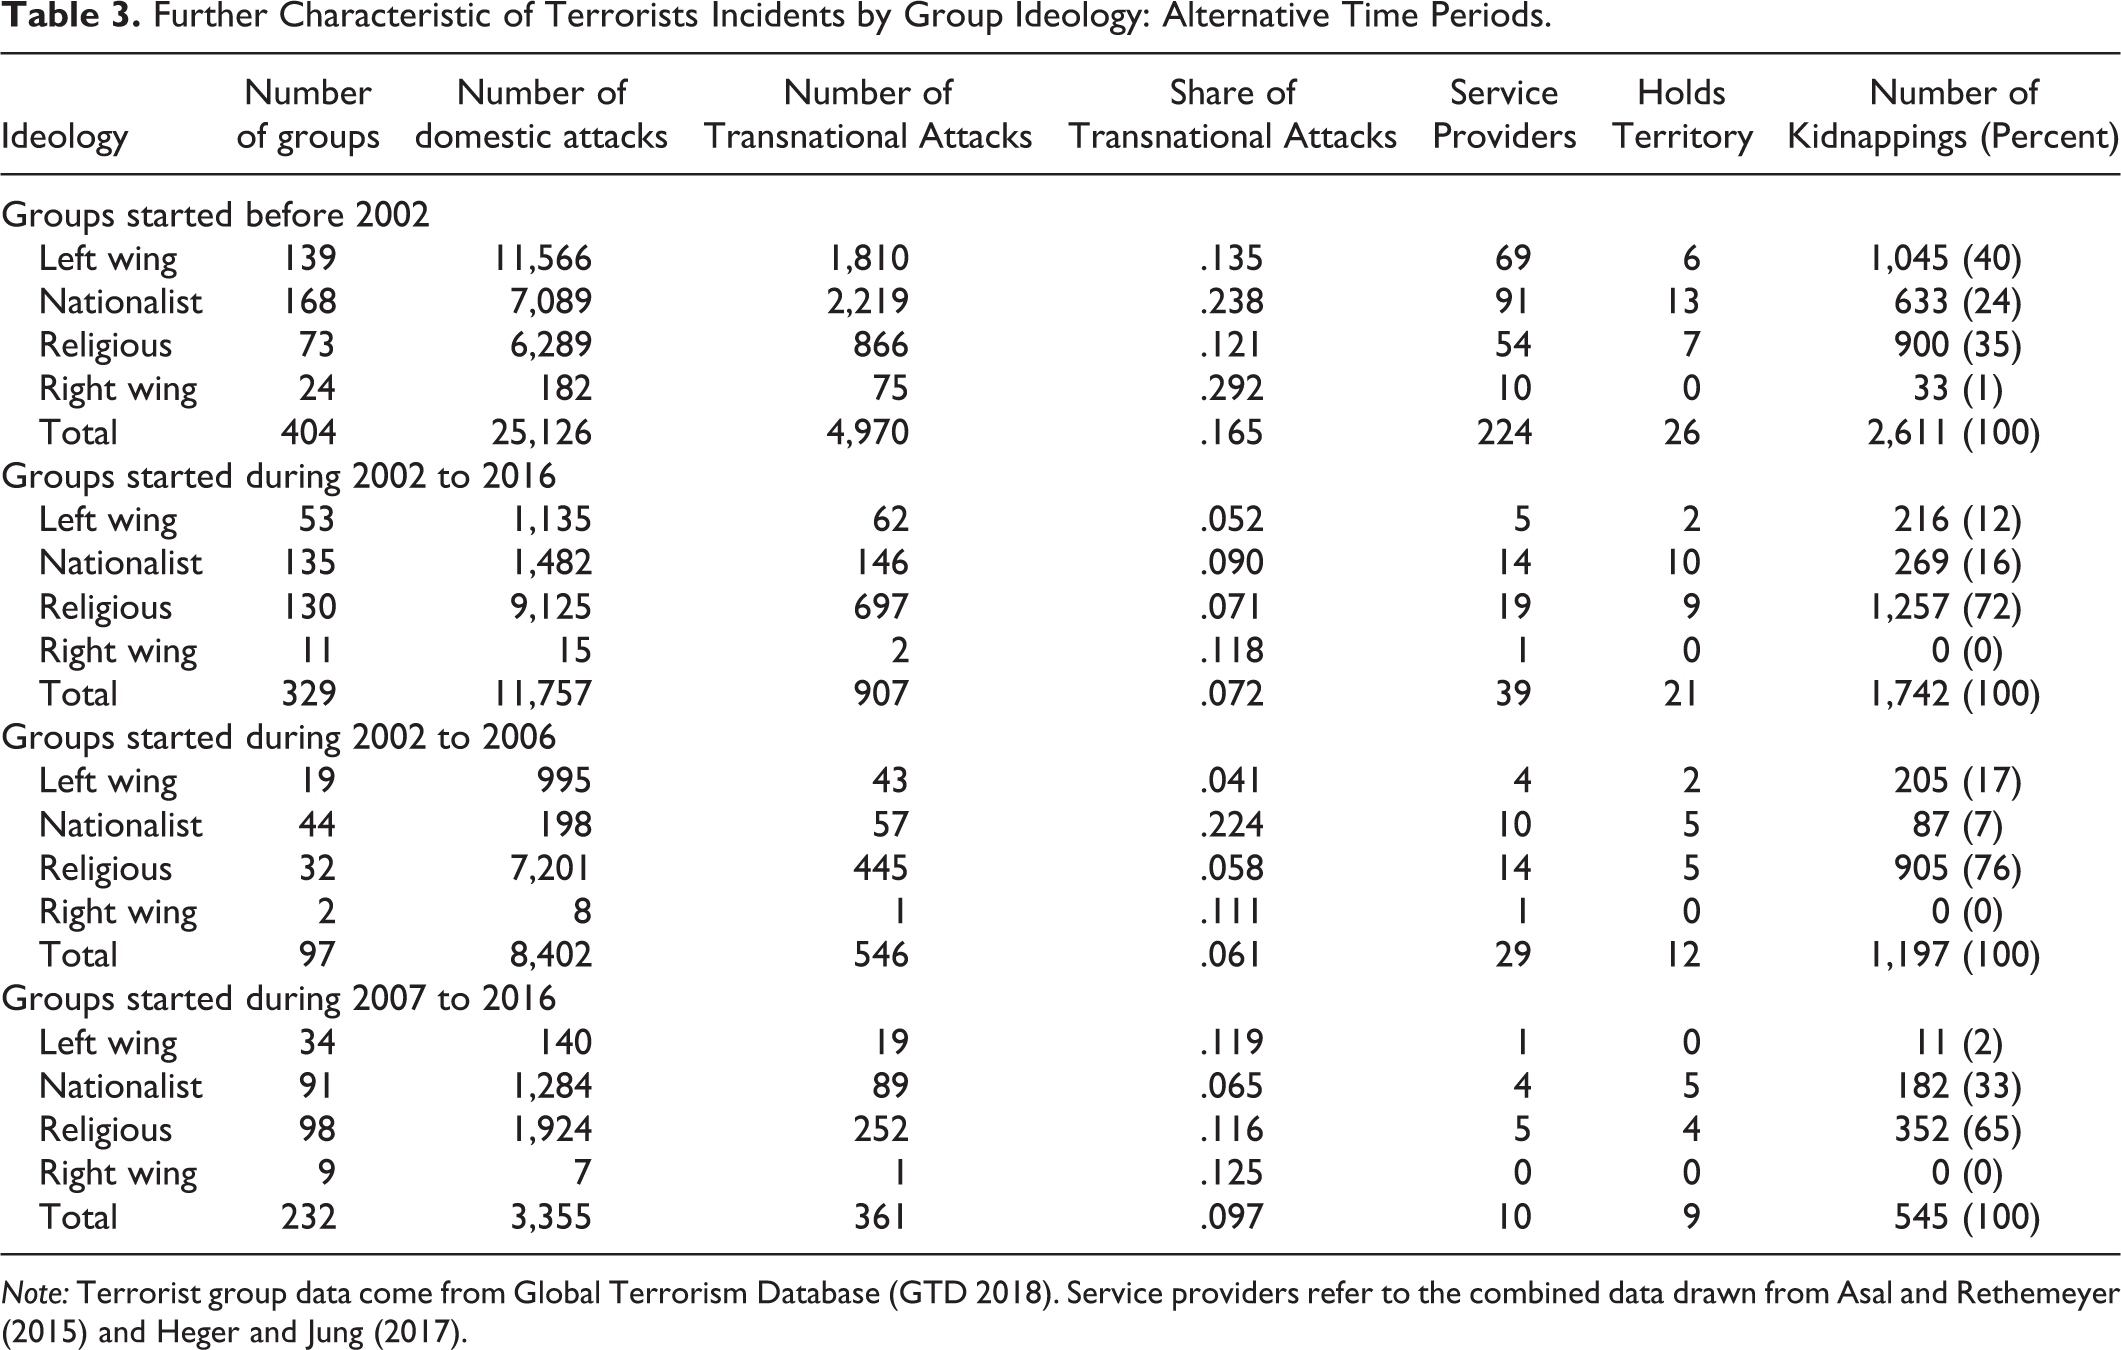
Note: Terrorist group data come from Global Terrorism Database (GTD 2018). Service providers refer to the combined data drawn from Asal and Rethemeyer (2015) and Heger and Jung (2017).
Survival Analysis Based on EDTG
Methodology and Data
We follow Gaibulloev and Sandler (2013) and apply the discrete-time hazard approach, where the probability,

In equation (1),
Our dependent variable equals one if a group ends in a given year and equals zero otherwise. Group-specific explanatory variables are the logarithm of a group size at its peak, four dummy variables—left wing, nationalist, right wing, and religious fundamentalist (base category)—for group ideology, the share of transnational terrorist attacks (trans. terr. share) in total attacks in a given year, and the number of casualties (deaths and injuries) per attack (casual. per attack) in a given year. Other group-specific controls include attack diversity in a given year, the number of bases (i.e., base countries) of operation, a dummy variable that equals one if the group’s leader is arrested or dies in a given year (leader’s fate), a dummy variable that equals one if a terrorist group engages in kidnappings in a given year, the number of states sponsoring (num. sponsors) a particular terrorist group in a given year, the number of a terrorist group’s allies (num. allies) in a given year, and the number of terrorist group’s enemies (num. enemies) in a given year.
Group peak size and the number of base countries are proxies for the group’s capabilities and resources, which are anticipated to increase the group’s longevity. Furthermore, leader’s fate, the number of state sponsors, the number of allies, and the number of enemies also affect the group’s strength and resources. For example, allies may cooperate on planning and staging attacks, benefit from knowledge spillover, and share resources and training facilities (e.g., Gaibulloev, Sandler, and Sul 2013; Horowitz 2010) to enhance productivity and to take advantage of economies of scale and economies of scope. Survival prospect is found to vary across groups with different ideologies (e.g., Blomberg, Gaibulloev, and Sandler 2011). A greater share of transnational attacks may limit the group’s likelihood of survival because transnational attacks provoke retaliation by targeted countries. Moreover, traveling to and operating on a foreign soil are riskier with large costs tied to cross-border movement of terrorist resources. The impact of the number of casualties is uncertain. Larger casualties may generate a more aggressive government response, which weakens the likelihood of survival. In contrast, more casualties may attract more followers, which enhance the probability of survival. Attack diversification may bolster survival prospects by reducing the dependence on a specific type of attack, making a group less predictable and complicating a government’s counterterrorism efforts (Gaibulloev and Sandler 2013). The articles cited in this paragraph provide a further theoretical justification that space does not permit us to elaborate in this data set article.
The main data sources for base countries, leader’s fate, kidnappings, state sponsorship, and groups’ allies and enemies are Asal and Rethemeyer (2015), Crenshaw (2018) and Jones and Libicki (2008), San-Akca (2009, 2015, 2016), SATP (2018), and START (2018). The other group-specific variables are explained earlier in this article. See the codebook for more details.
Following the literature, we include a number of variables to control for characteristics of a terrorist group’s base country of operation. If a terrorist group has more than one base country, then we average the variables across these base countries. Using WDI data set (World Bank 2018), we construct the logarithm of real per capita gross domestic product (GDP) (GDP/POP) in constant 2010 US dollars, the logarithm of population (POP), the share of international trade in GDP (Openness), and the share of government spending in GDP (gov. spending). Larger population augments terrorists’ chances of locating new recruits, finding protection, and hiding in densely populated areas. High-income base countries may offer skilled recruits for terrorists, but the opportunity costs of engaging in terrorism increases with income. Moreover, higher per capita income allows the government to placate material discontent—for example, through welfare spending—and spend more on counterterrorism. Trade openness can strengthen terrorist groups’ survival prospects by easing the movement of terrorists and assets across borders. However, trade openness may also diminish groups’ survival by promoting development. Government spending is used as a proxy for counterterrorism, which is difficult to measure owing to a lack of data.
The studies on terrorist groups’ failure identify a base country’s regime type, its ethnic fractionalization, and its geographical features and location as potential determinants of groups’ longevity (see, e.g., Blomberg, Gaibulloev, and Sandler 2011; Gaibulloev and Sandler 2013 for details). The Polity index ranges between −10 (strongly autocratic) and +10 (strongly democratic) and is obtained from the Polity IV data set (Marshall, Jaggers, and Gurr 2017). We enter the quadratic term of the polity variable (Polity squared) to test for a possible nonlinear relationship. An index of ethnic fractionalization (ethnic frac.) and its squared value (ethnic frac. sqrd.) are constructed using data from Alesina et al. (2003). Seven regional dummy variables are included to control for geographic location of base countries. To account for base countries’ geographical features, we enter the logarithm of a country’s average elevation (elevation), the percentage share of land territory in the tropics (Tropics), and a dummy variable equal to one if a base country is landlocked (Landlocked) (Central Intelligence Agency 2018; Gallup, Mellinger, and Sachs 1999; Gallup, Sachs, and Mellinger 1999). Higher elevation and tropics may bolster terrorist groups’ survival by giving them more hiding places.
Results
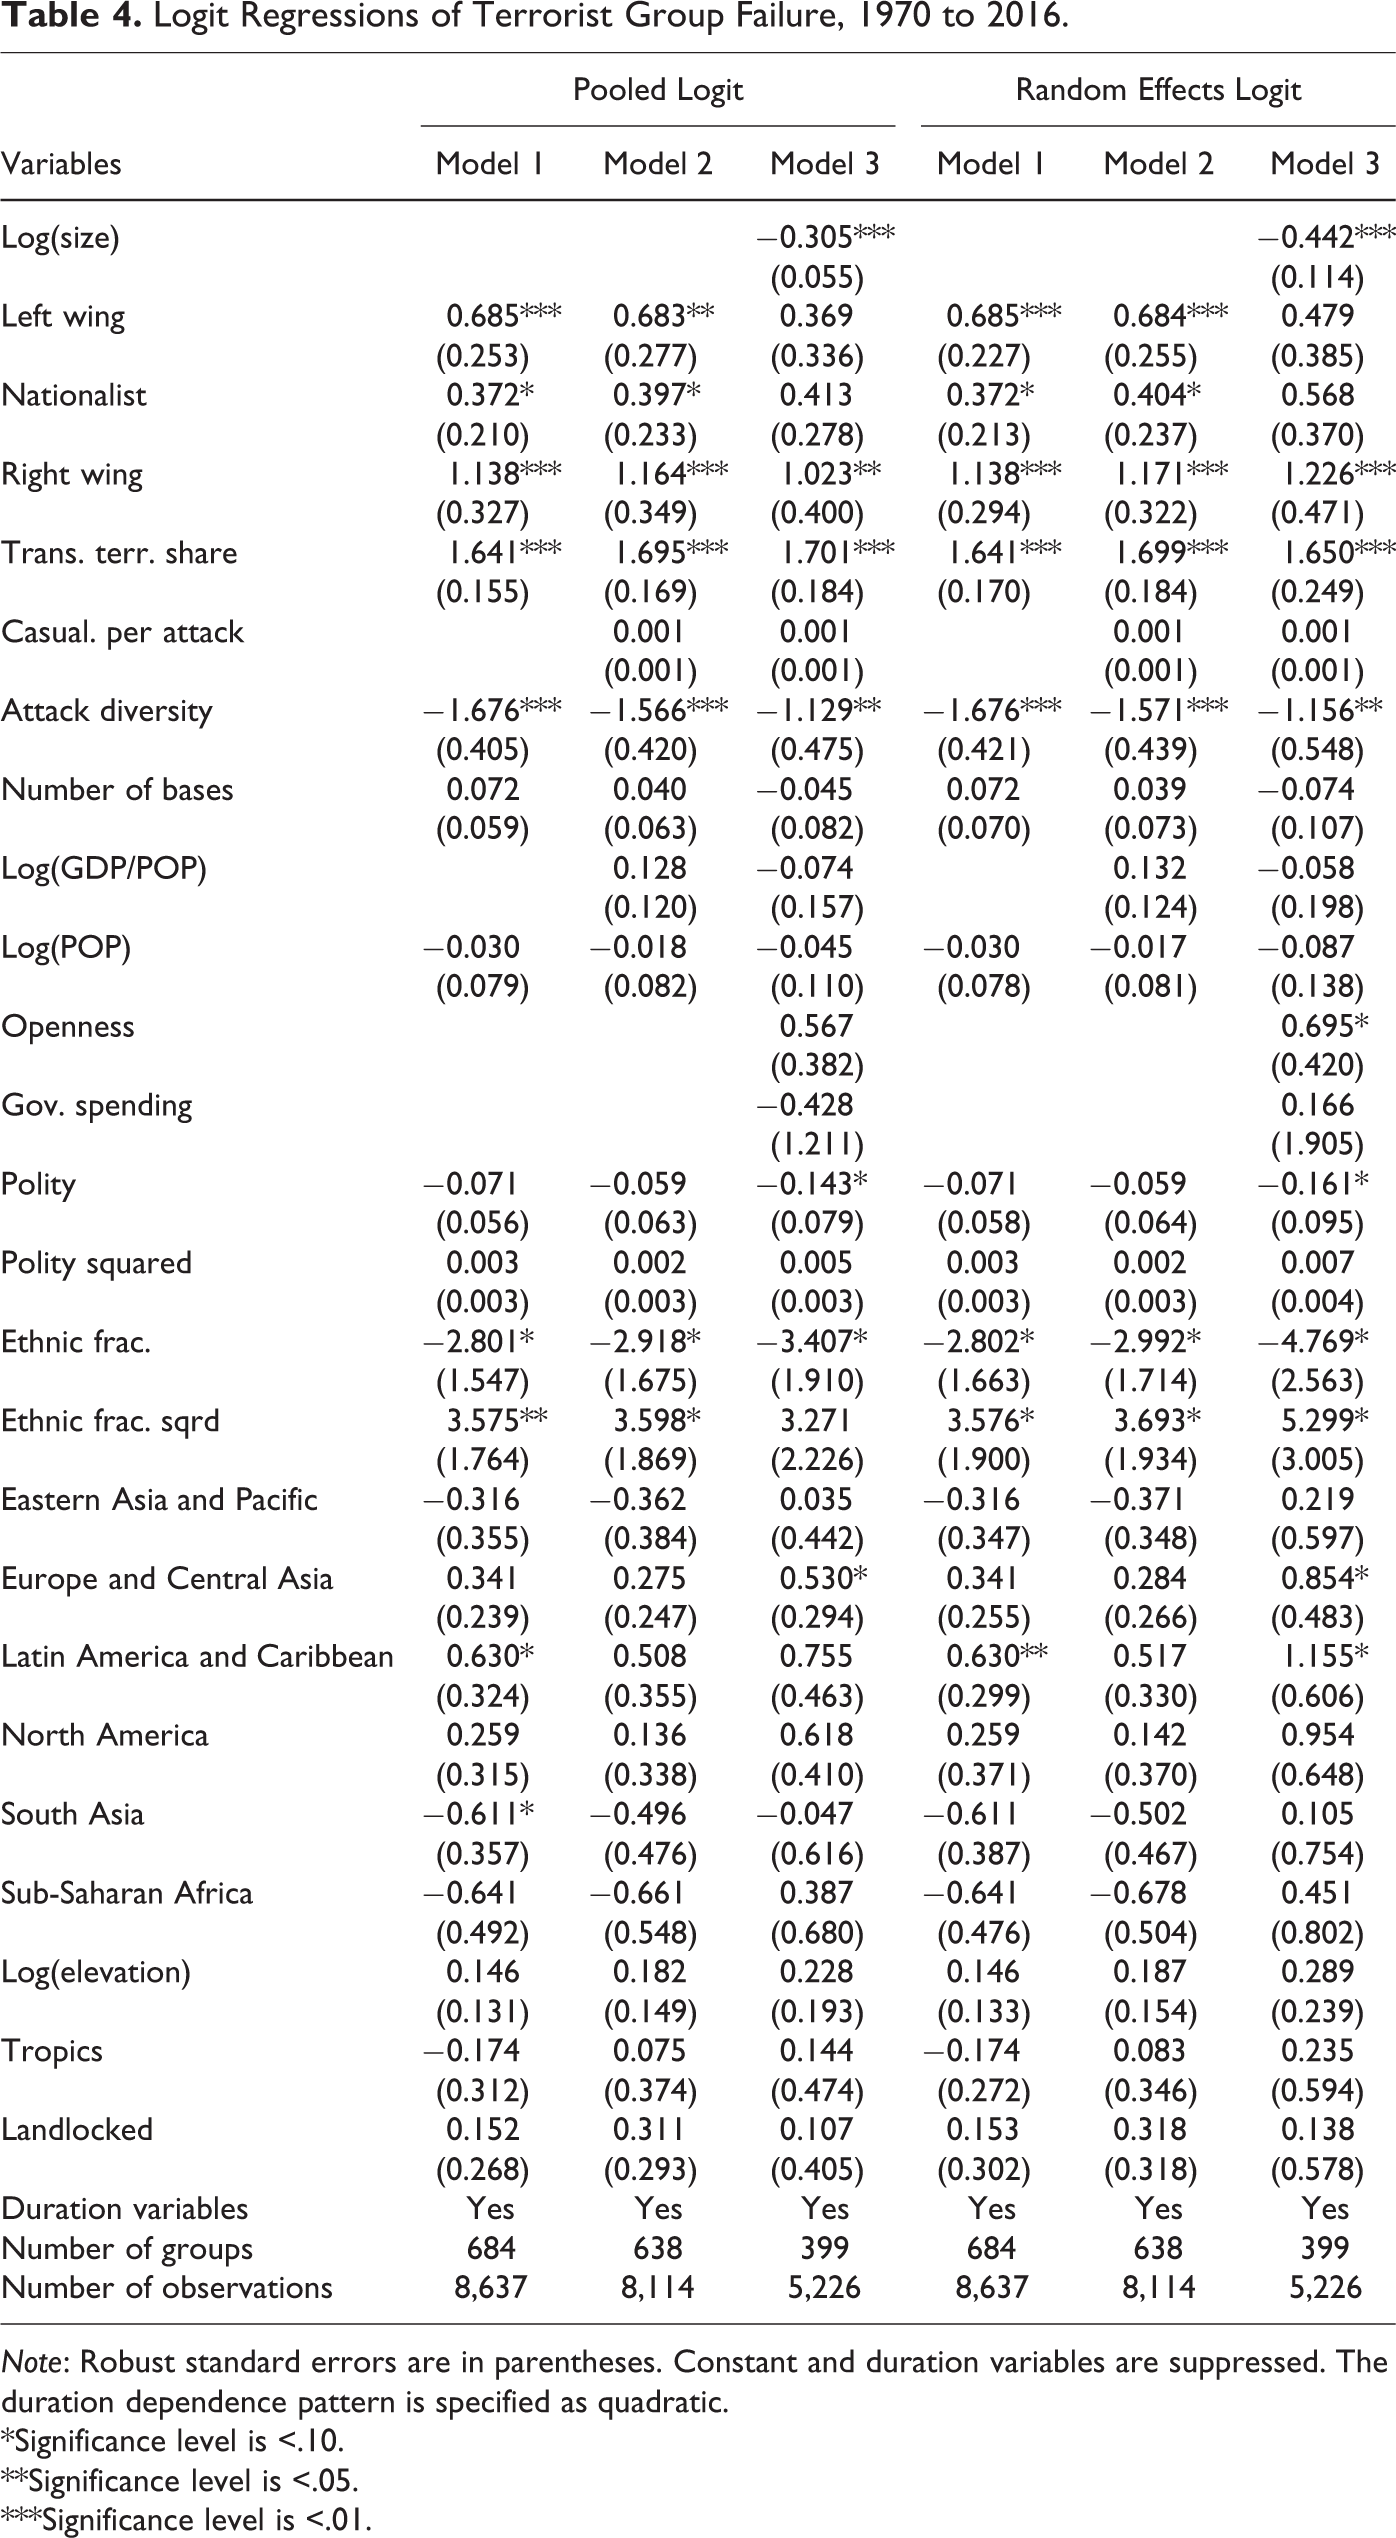
Table 4 presents the main results for 1970 to 2016. Models 1 to 3 are estimated using the (pooled) logit estimator. Model 1 includes 684 groups. As we enter more variables, the number of groups drops to 399 as displayed because of missing observations in the fully specified model 3. Consistent with Gaibulloev and Sandler (2013), larger peak membership size and attack diversification reduce a terrorist group’s probability of failing. An increase in the share of transnational attacks enhances the group’s chances of demise. This variable did not exist for the full sample period in the earlier studies because RAND data did not distinguish between domestic and transnational incidents until after 1997. Religious fundamentalist terrorist groups have better survival prospects than left-wing, nationalist, or right-wing organizations. However, contrary to Gaibulloev and Sandler (2013), casualties per attack and the number of bases are not statistically significant. These results are robust across models. The only exceptions are the left-wing and nationalist ideology variables, which are not statistically significant in the full specification.
Logit Regressions of Terrorist Group Failure, 1970 to 2016.
Note: Robust standard errors are in parentheses. Constant and duration variables are suppressed. The duration dependence pattern is specified as quadratic.
*Significance level is <.10.
**Significance level is <.05.
***Significance level is <.01.
Overall, base country factors do not display a statistically robust association to groups’ survival. Ethnic diversity is an exception, which has a negative impact on terrorist groups’ likelihood of failing, while the diversity squared term has a positive effect. This suggests an inverted U-shaped relationship for which a moderate diversity is more conducive to group failure. We also implement the random-effects logit regression to account for unobserved heterogeneity (models 4–6) and obtain qualitatively similar results. Trade openness, which is positive, now becomes marginally significant.
We perform several robustness checks, which are reported in Tables A2 and A3 of the Online Appendix. We reestimate Table 4 with a piecewise constant time specification by entering time interval dummies for the 1970s, 1980s, 1990s, 2000s, and 2010 to 2016. In so doing, the previous results hold. We also estimate models 1 to 3 by holding sample size constant. The left-wing and nationalist ideology variables are never statistically significant indicating that these variables lose statistical significance in Table 4 because of sample size (groups) reduction rather than inclusion of additional regressors. The other results are not sensitive to different model specifications with constant sample size. Finally, we examine a subsample of demised groups by excluding groups that remain active at the end of the sample period. That exercise gives three findings that differ from Table 4. First, nationalist and right-wing ideology variables have negative signs and are generally not significant. Left-wing ideology variable, however, is negative and statistically significant, which indicates that left-wing organizations were more resilient among demised groups. This might be because our sample of demised groups is dominated by major leftist groups that lasted relatively long; most religious fundamentalist groups started relatively recently and are still active. Second, consistent with Gaibulloev and Sandler (2013), casualties per attack and the number of bases are statistically significant with anticipated positive and negative signs, respectively. Third, trade openness is statistically significant and positive; an increase in a base country’s trade openness augments the resident group’s probability of ending after controlling for per capita GDP, population, and other factors. The remaining results are consistent with Table 4.
Next, we divide our sample between terrorist groups that have been operating during 1970 to 2001 and those that have been active during 2002 to 2016. The latter period’s analysis is made possible by EDTG-extended temporal coverage. Table A4 in the Online Appendix reports several interesting insights. The effects of group size and base country’s trade openness are negative and positive, respectively, before 2001, but they are not statistically significant after 2001. Ethnic fractionalization is also significant before, but not after, 2001. Additionally, ideology variables are generally not statistically significant before 2001. This suggests that religious fundamentalists do not differ from leftists, nationalists, or right-wing groups in terms of survival prospects before 2001. However, religious fundamentalist groups are more resilient than groups with other ideologies in the later subperiod. The other results largely do not differ across subperiods.
Finally, we examine the impact of terrorist group’s leader’s death or capture, engagement in kidnappings, state sponsorship, and allies and enemies, see Table 5. The number of observations and the number of terrorist groups drop significantly for models 3 to 6 due to missing observations. Therefore, we choose a parsimonious specification by removing some variables that were not statistically significant. Overall, the findings in Table 4 hold, although the estimates are sometimes not robust due to a smaller sample size. With regard to new variables, a group’s odds of failure rise with the death or arrest of its top leader. This is in contrast with Cronin (2006, 2009) and Jordan (2009) who indicate that a leader’s fate was not so important for the group’s survival. A terrorist group’s likelihood of ending also increases with the greater number of sponsoring states but decreases with the larger number of the group’s allies. The impact of kidnappings is negative as anticipated in model 2 but not robust. The effect of state sponsorship is somewhat consistent with Carter (2012), who shows that, despite a boost in resources, a group that is provided safe haven may be in greater peril of being forcefully eliminated. Our state sponsorship variable is not conditioned on safe haven. In Carter (2012), the host country may choose to avoid military confrontation by providing information to a state that is a target of the terrorist group.
Logit Regressions of Terrorist Group Failure, 1970 to 2016.
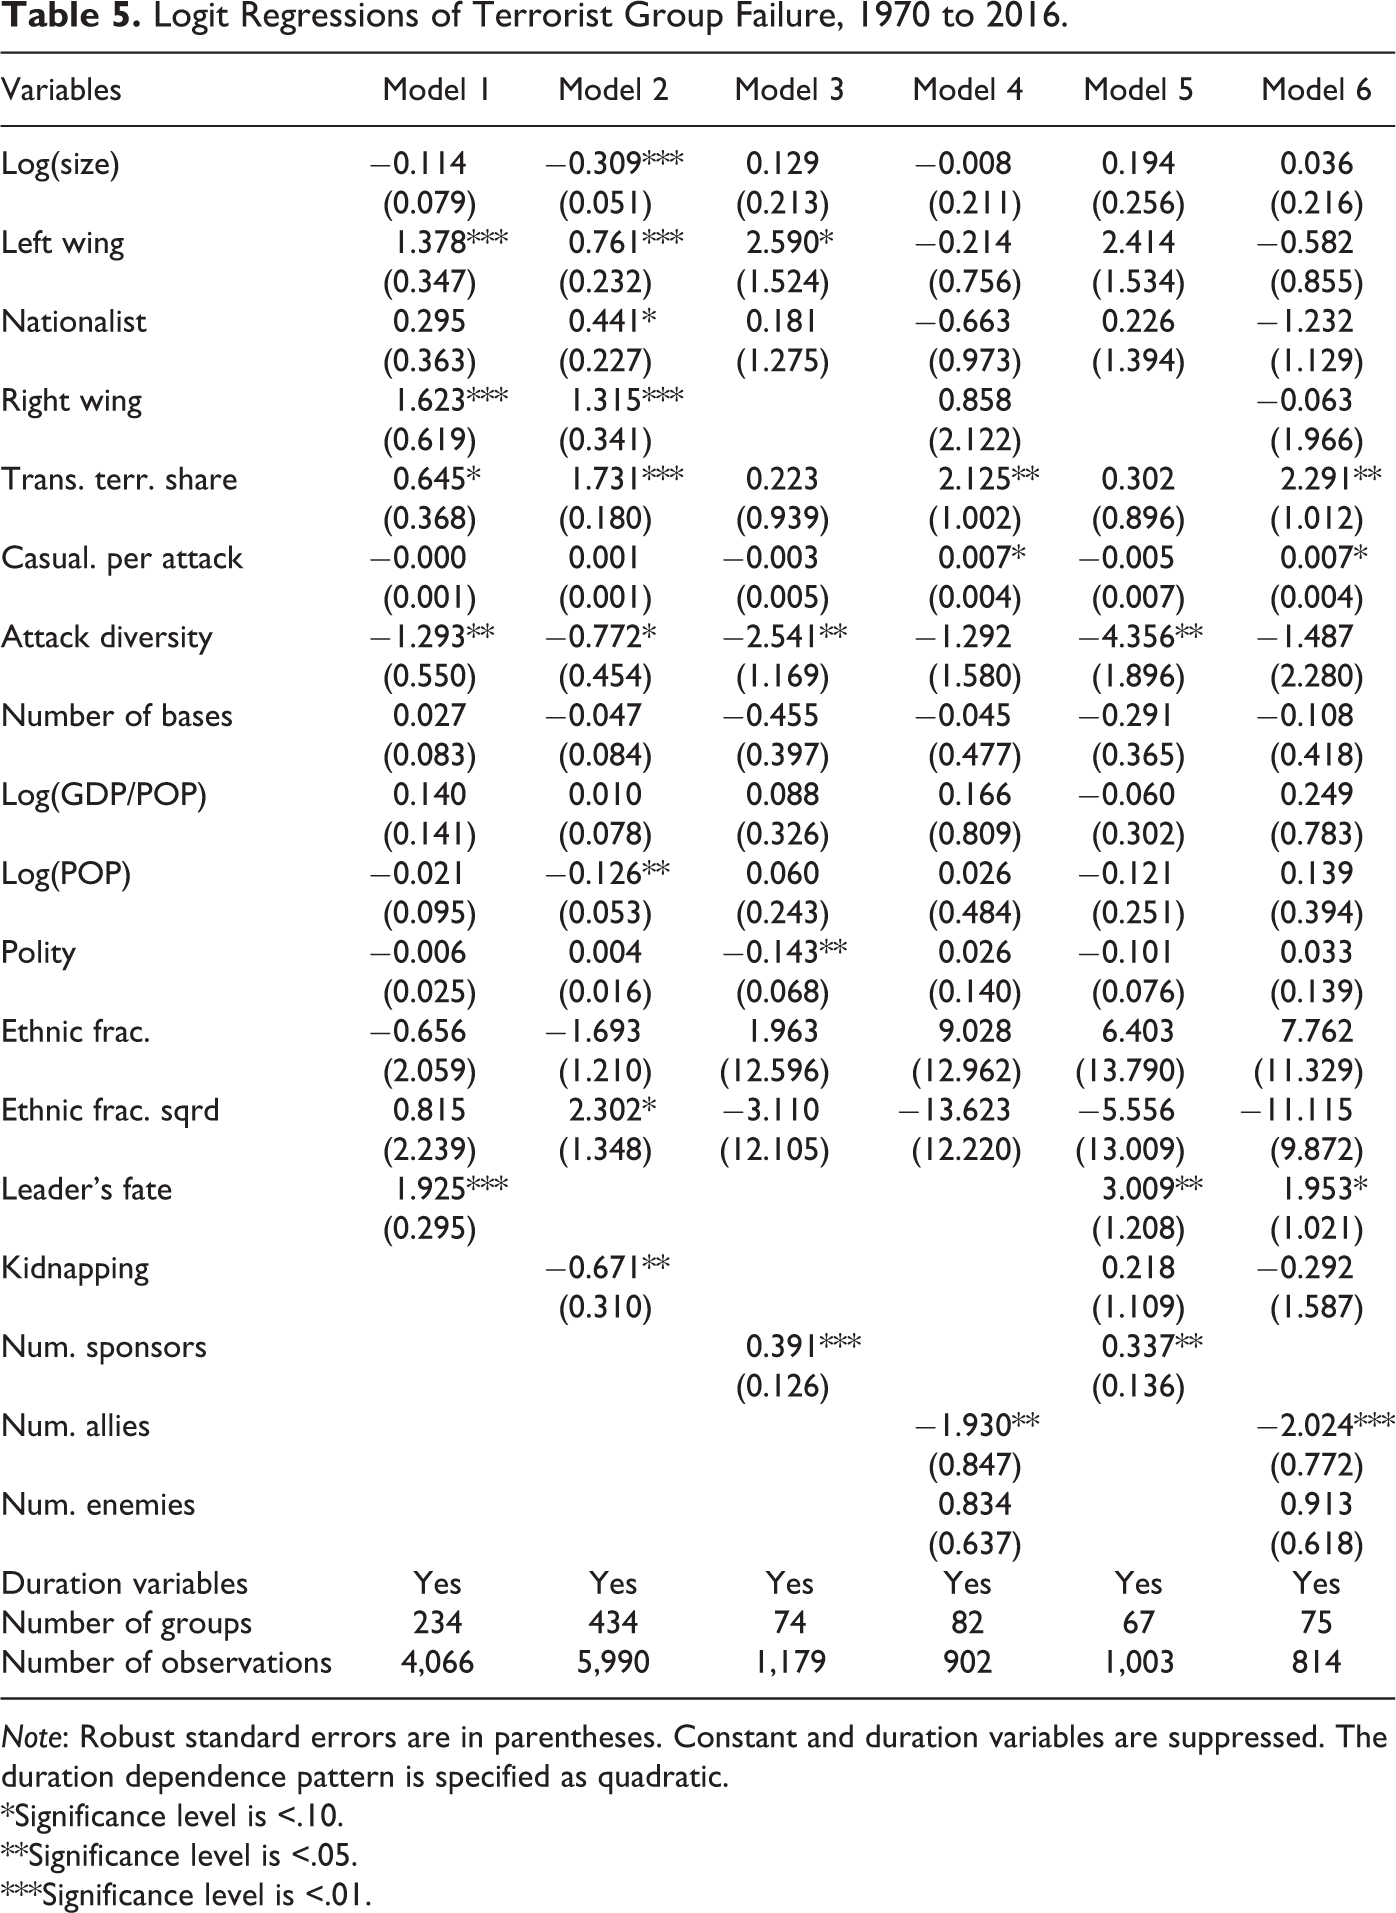
Note: Robust standard errors are in parentheses. Constant and duration variables are suppressed. The duration dependence pattern is specified as quadratic.
*Significance level is <.10.
**Significance level is <.05.
***Significance level is <.01.
Terrorist Group Productivity and Lethality
Methodology and Data
We implement the negative binomial regression on cross-sectional data of terrorist groups using two alternative dependent variables—group lethality and group productivity. Similar to Asal and Rethemeyer (2008), our measure of group lethality is a count of total (nonterrorist) deaths from attacks by a terrorist group during our sample period (1970–2016). Following Asal and Rethemeyer (2008), we include group size, ideology, age, and base country characteristics. We designate right wing as a base ideological category by leaving it out. For organizational age, we use the number of years that the group was active during our sample period (Duration) and its squared term. We do not include group’s alliance, state sponsorship, and territorial control because our cross-sectional sample size reduces dramatically owing to missing observations. However, we control for the logarithm of the (average) number of other groups operating in the same base country (other groups). We also enter the logarithm of the number of terrorist attacks (attacks), which is not in Asal and Rethemeyer’s (2008) regression because the risk of fatalities is expected to increase with the frequency of attacks. The base country’s characteristics include the logarithm of real per capita GDP (GDP/POP) in constant 2010 US dollars, the logarithm of population (POP), the Polity index, and regional dummy variables, using their initial values. For example, if a group becomes active in 1980, the values of base country variables for 1980 are used. In the case of missing observations, the earliest available information is employed.
Our measure of group productivity is a count of total attacks by a terrorist group during the sample period. Asal and Rethemeyer (2008) did not examine the productivity of terrorist organizations. Most of the variables from group lethality regressions are included in the productivity runs, except for the terrorist attacks variable, which is now the regressor. Group characteristics—size, ideology, and duration—and base country’s political system, population size, and relative wealth are important for a group’s ability to stage terrorist attacks. The number of competing terrorist groups in a base country affects a government’s counterterrorism efforts and a group’s success, depending on the extent of cooperation and rivalry among groups. The sign of the coefficients may differ between the lethality and productivity regressions.
Results
Table 6 presents the results. Consistent with Asal and Rethemeyer (2008), larger groups are deadlier. Further, religious terrorist groups are more lethal, whereas left-wing groups are less fatal than right-wing organizations. The negative effect of left-wing group is not statistically significant in Asal and Rethemeyer (2008). As expected, the average impact of the frequency of terrorist attacks on fatality is positive. The effect of population is positive, while the impact of democracy appears to be nonlinear.
Negative Binomial Regressions of Terrorist Group Productivity and Lethality, 1970 to 2016.
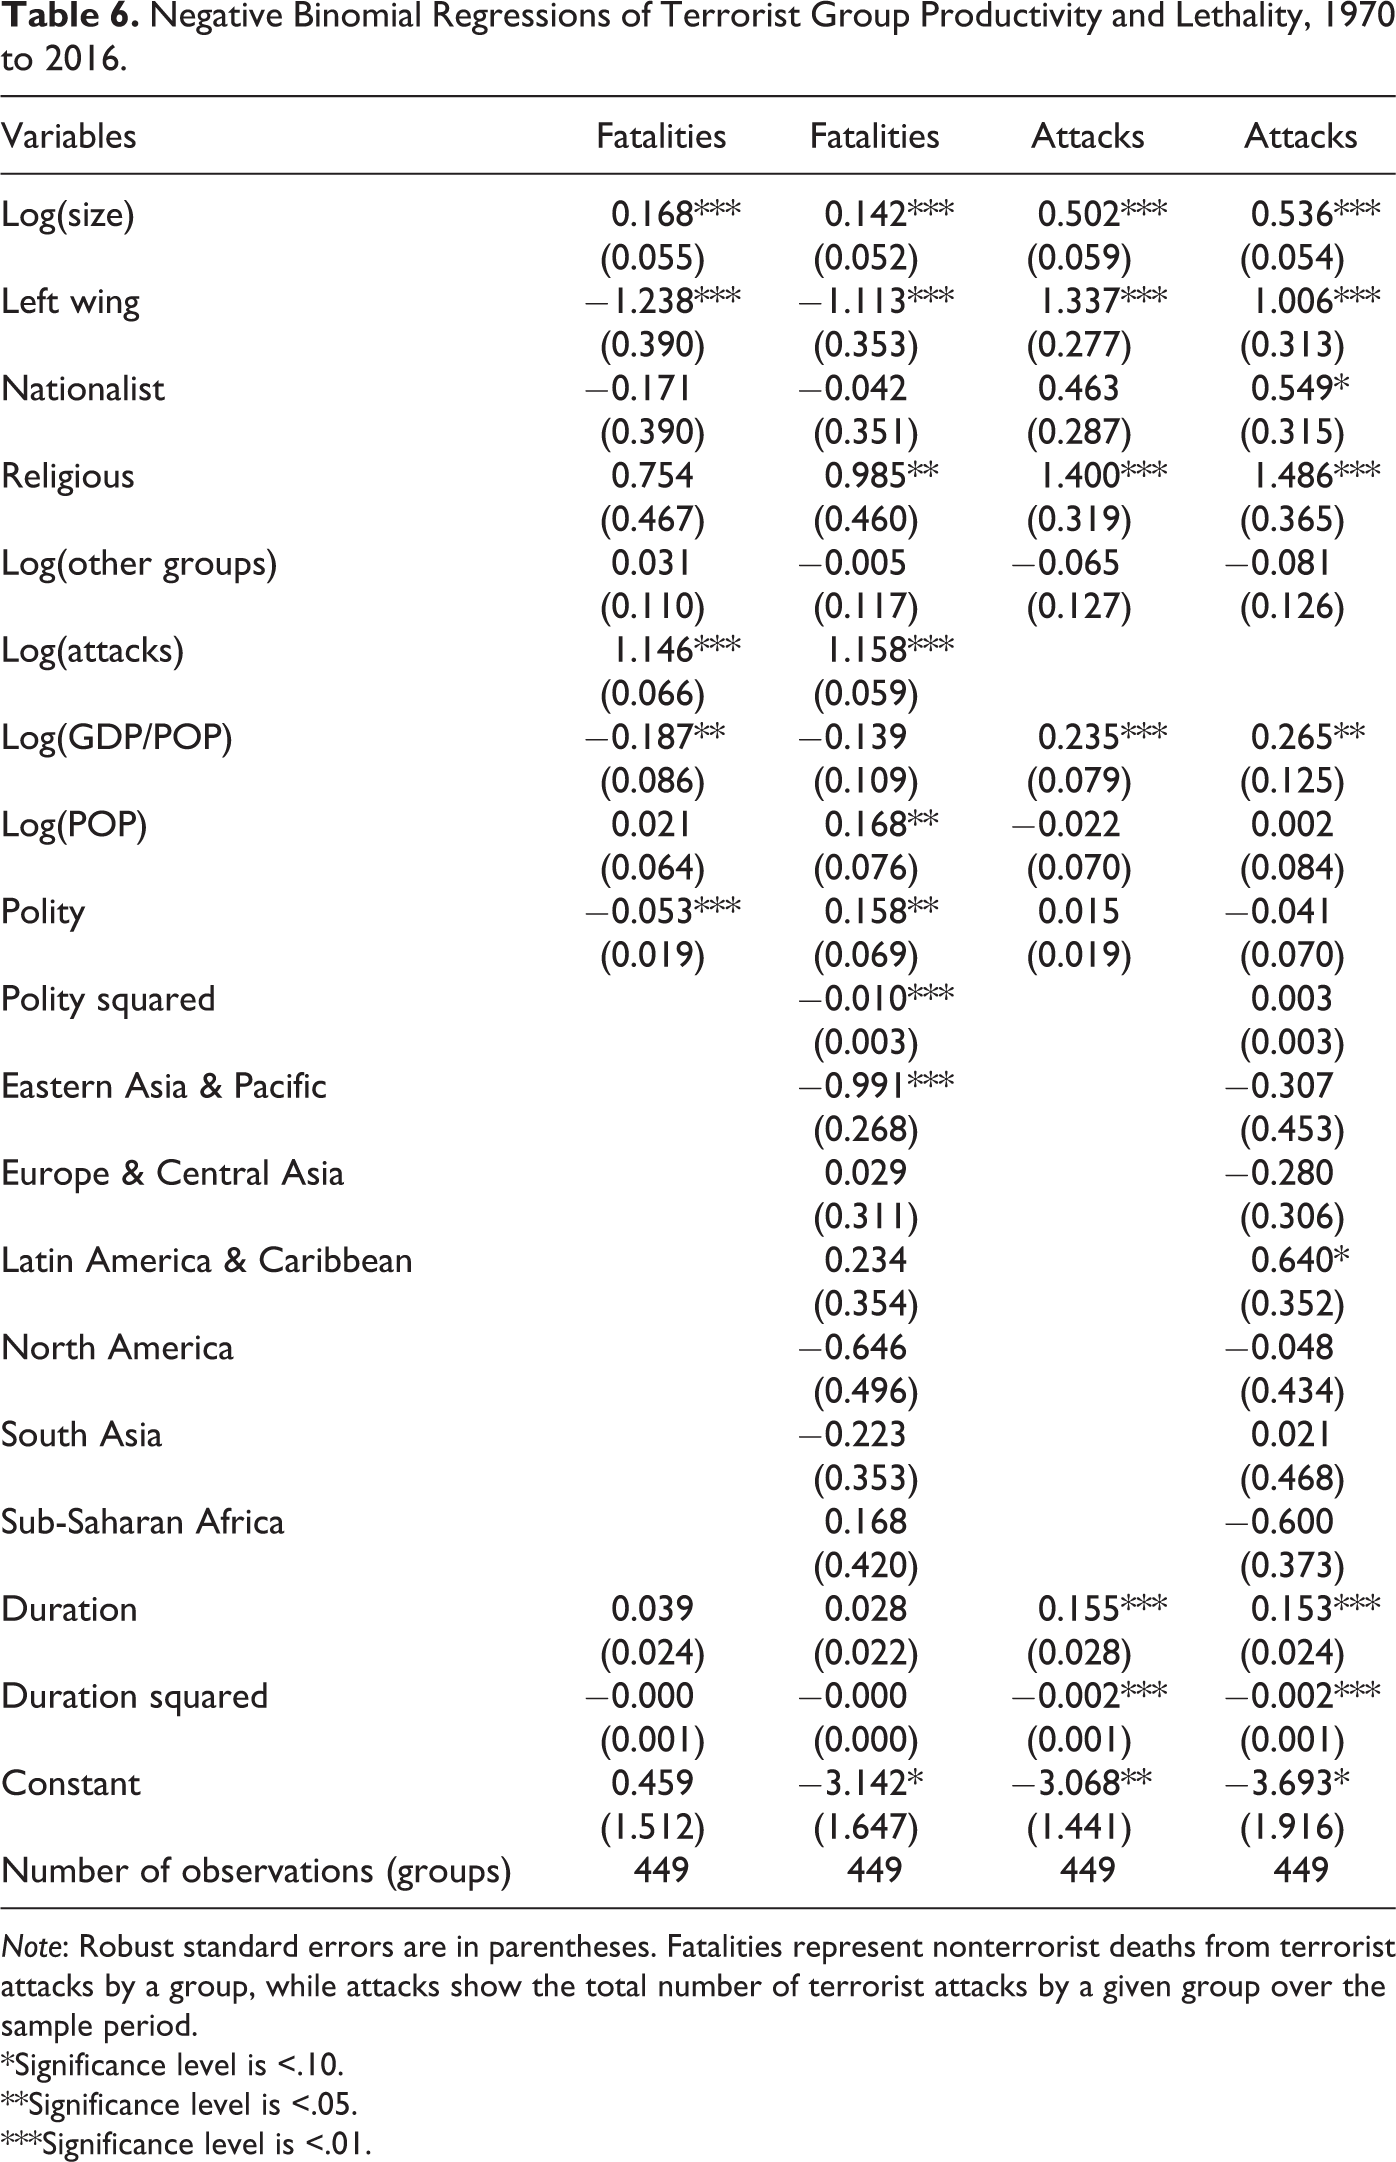
Note: Robust standard errors are in parentheses. Fatalities represent nonterrorist deaths from terrorist attacks by a group, while attacks show the total number of terrorist attacks by a given group over the sample period.
*Significance level is <.10.
**Significance level is <.05.
***Significance level is <.01.
Comparison of group productivity and fatality regressions reveal several interesting findings. Larger groups and religious terrorist organizations conduct more attacks and are correspondingly more lethal. Left-wing groups also produce more attacks but are less deadly than right-wing organizations. Similarly, groups based in countries with higher per capita income produce more attacks; however, these groups are less lethal. Duration is not a statistically significant determinant of lethality, consistent with Asal and Rethemeyer (2008), but it is a statistically significant determinant of the number of attacks—duration is positive and its squared term is negative.
Concluding Remarks
The figures and tables in this article offer a small glimpse of how EDTG and its further extension over time can enlighten us about terrorist groups and their characteristics, distribution, strengths, and vulnerabilities. As an important stakeholder in terrorism, terrorist groups must be understood in terms of their operations, orientation, and survival prospects. Effective counterterrorism hinges on governments’ ability either to defeat terrorist groups or to induce them to adopt legitimate nonviolent actions (e.g., joining the political process or ending attacks). To understand the fate of past terrorist groups under a variety of circumstances, we need richer and more up-to-date data on terrorist groups as provided by EDTG.
Terrorist groups are in a constant state of flux in terms of their geographical distribution, predominant ideologies, driving goals, organizational structure, intergroup ties, and strategic tactics. Often policy makers and commentators observe the recent actions of a few terrorist groups and generalize from such actions to all terrorist groups. For instance, the observation that some prominent terrorist groups supply social services or hold territory may make people think that those actions are commonplace for terrorist groups, but Table 3 shows that a relatively small percentage of groups do either. Panel data on terrorist groups in terms of those two actions permit researchers to ascertain the survival implication of such tactics in future analyses. If they are deemed to be efficacious for terrorist groups’ longevity and effectiveness, then countermeasures to offset the supplying of social services or the holding of territory must be devised. Such reality checks are required for other characteristics or innovations of terrorist groups. Terrorist groups’ innovations are of a particular concern and can only be studied with a group data set that captures recent developments. As terrorist groups evolve their tactics and locations, different factors are anticipated to affect groups’ survival prospects. Thus, updated survival analyses must investigate changing cohorts of terrorist groups, alternative sets of variables, and a varying set of time intervals.
Our second application shows that the effects of the determinants for terrorist group’s lethality and productivity differ. The EDTG data allow more precise future analyses of lethality and productivity with a panel approach and additional controls. EDTG can also be used to reexamine Bapat’s (2011) analysis of moral hazard associated with military aid given to countries hosting terrorist groups. Bapat shows that the longevity of terrorist groups in recipient countries actually increases because to annihilate the group would mean the loss of the aid. EDTG when combined with more military aid data from additional countries would allow one to see whether aid still poses a moral hazard problem and whether this problem characterizes countries other than the United States.
Supplemental Material
Supplemental Material, EDTG_Data_and_Replication - Introducing Extended Data on Terrorist Groups (EDTG), 1970 to 2016
Supplemental Material, EDTG_Data_and_Replication for Introducing Extended Data on Terrorist Groups (EDTG), 1970 to 2016 by Dongfang Hou, Khusrav Gaibulloev and Todd Sandler in Journal of Conflict Resolution
Supplemental Material
Supplemental Material, EDTG_MS_Final_Appendix_Tables_Codebook - Introducing Extended Data on Terrorist Groups (EDTG), 1970 to 2016
Supplemental Material, EDTG_MS_Final_Appendix_Tables_Codebook for Introducing Extended Data on Terrorist Groups (EDTG), 1970 to 2016 by Dongfang Hou, Khusrav Gaibulloev and Todd Sandler in Journal of Conflict Resolution
Footnotes
Authors’ Note
Acknowledgment
The authors thank Paul Huth and two anonymous referees for helpful comments on an earlier draft.
Declaration of Conflicting Interests
The author(s) declared no potential conflicts of interest with respect to the research, authorship, and/or publication of this article.
Funding
The author(s) disclosed receipt of the following financial support for the research, authorship, and/or publication of this article: Sandler acknowledges funding from the Vibhooti Shukla Endowment at the University of Texas at Dallas.
Supplemental Material
Supplemental material for this article is available online.
References
Supplementary Material
Please find the following supplemental material available below.
For Open Access articles published under a Creative Commons License, all supplemental material carries the same license as the article it is associated with.
For non-Open Access articles published, all supplemental material carries a non-exclusive license, and permission requests for re-use of supplemental material or any part of supplemental material shall be sent directly to the copyright owner as specified in the copyright notice associated with the article.