
Abstract
This study investigated in-plane permeability of a biaxial stitched E-glass fabric preform using 2D (radial) flow experiments under constant-injection pressure at fiber volume fractions of
Introduction
Resin Transfer Molding (RTM) process is traditionally utilized for producing thermoset matrix composites. Recently, a newer generation process, thermoplastic resin transfer molding (TP-RTM) has been employed in the manufacturing of thermoplastic matrix (e.g., Elium®, anionically polymerised Polyamide 6) composites due to their distinct properties such as superior toughness and weldability, making them suitable for applications where thermoset matrix may not meet the expectations of impact resistance and part assembly.1–3 Regardless of whether the matrix is thermoset or thermoplastic, successful RTM processing relies on a thorough understanding of resin flow through a porous fiber reinforcement. Consequently, characterizing the permeability of porous fiber reinforcements is essential for accurately modeling mold filling in Liquid Composite Molding (LCM) processes. In these processes, a liquid polymer (resin) impregnates a dry fiber reinforcement (typically made of stacked fabric layers) placed in a mold cavity prior to resin injection (as in Resin Transfer Molding, RTM) or resin infusion (as in Vacuum-Assisted RTM, VARTM, also known as Resin Infusion, RI). Simulation of mold filling is done through mathematical modeling of porous media flow based on Darcy’s Law and its numerical solution. This is highly beneficial, as it helps predict resin flow and optimize key manufacturing parameters. These include the placement of gates (resin inlets and outlets), boundary conditions (such as pressure levels or flow rates), and the timing for opening or closing valves. Simulation is especially useful when: (1) the composite part has a large or complex geometry, or (2) there are significant variations in the fiber volume fraction and permeability of the fabric preform. 4 The reliability of simulation results strongly depends on the accuracy of the permeability data. Regional variations (such as much higher permeability of mold cavity along edge race-tracking channels than inner regions) may drastically affect resin flow pattern. Random and minor variations (such as a few missing yarns or unintended shearing during fabric placement) can locally affect permeability due to changes in dual-scale porosity, but they typically do not have a significant impact on the overall mold filling pattern.5,6 Mold filling simulations are primarily used to ensure complete mold filling (by minimizing air entrapment and thus no significant void remains in the preform) and shorten manufacturing cycle time by designing fast mold filling and resin cure. Simulations replace time-consuming and costly experimental trial-and-error approaches during designing mold and process parameters. 7 To model mold filling of thick composite parts, through-thickness permeability (besides in-plane permeability components) must also be characterized for 3D flow simulations.8,9 However, as the thickness of the mold cavity is usually much smaller than the in-plane dimensions, 2D mold filling models for resin injection or infusion processes are commonly preferred over 3D models due to their simplicity. Accurate permeability measurement is essential for reliable flow simulations, and therefore plays a critical role in mold design (e.g., gate and vent placement) as well as in setting the processing window (boundary conditions such as injection and venting pressures) 4 and advancing composite material manufacturing applications such as wind turbine blades, 10 tidal turbine blades11–13 and aircraft wings and wingbox. 14 All of these factors make accurate permeability measurement a subject of significant importance and ongoing research in composite manufacturing.
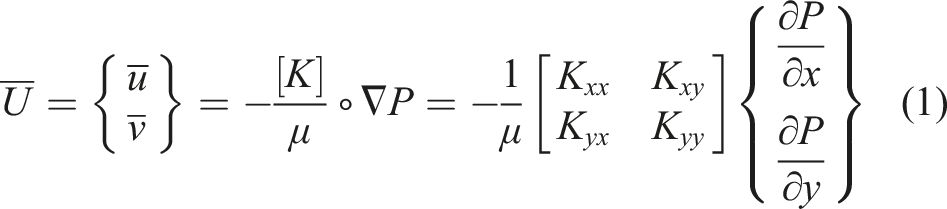
For porous-media flows, conservation of momentum equation of fluid mechanics is replaced with the following empirical Darcy’s Law in 2D modeling:
Swery et al. 16 measured both 2D unsteady and steady permeabilities for plain woven E-glass fabric by assuming that the fabric is isotropic during steady flow regime. Buntain et al. 17 measured the steady permeability of an isotropic fabric preform at various fiber volume fractions (V f ) using radial flow experiments. For each experiment of this continuous process, they fixed V f , measured the permeability, then adjusted V f to a new value and repeated the process. Similarly, Comas-Cardona et al. 18 measured continuous permeability of an E-glass twill-weave and carbon non-crimp fabrics by using the anisotropy ratio obtained from a prior measurement. Many studies on 2D permeability predominantly focus on unsteady permeabilities, omitting the measurement of steady permeability in the same experimental context.
Using unsteady permeability may seem to be more appropriate than steady permeability, especially while simulating flow front propagation in LCM (which is an unsteady process itself). Different than steady (and thus saturated) flow regime, many experimental unsteady studies revealed that full saturation behind flow front takes extra time due to delayed saturation of microvoids especially in intra tow spaces which are typically less porous and permeable than inter tow spaces. However, Darcy’s Law assumes full saturation of the preform behind the resin flow front. Steady permeability measurements should be preferred while simulating the resin pressure and velocity distributions during post-filling stages such as resin bleeding. 17 As demonstrated in a radial permeability benchmark study, 19 the variations between repeated experiments—whether conducted by the same experimenter or different participants—can be substantial, often reaching ±20% and sometimes differing by an order of magnitude. The common reasons for these variations are fiber tow nesting and shearing, tool deflection, preforming defects and inherent textile defects. 6 Therefore, mold filling simulations are essential for understanding the injection and infusion processes; however, their accuracy is highly sensitive to uncertainties in the permeability of the reinforcements.
In this study, both 2D unsteady and steady permeabilities of a biaxial fabric were characterized and compared at three different fiber volume fractions (
Recall that 2D (radial) unsteady permeability characterization is preferred over 1D alternative because 1D characterization is more time-consuming (a pair of experiments is needed instead of a single one). In other words, 2D characterization is quicker as it allows measuring
The proposed approach in this study (a combination of experimental data (flow rate) and an iterative numerical analysis) overcomes the abovementioned issue by computing the exit velocity components along all edges and flow rate for fabric specimens in non-elliptical molds.
In this study, unsteady (also referred to as transient or unsaturated) permeability was measured experimentally, while steady (also referred to as saturated) permeability was predicted through simulation. The former was determined by curve fitting the experimental data of the radial flow front position, r(t), versus time along three directions (x, y, and θ = 45°), using the closed-form relationship between the permeability components and the evolution of the flow front position.19,21 By using Finite Difference Method (FDM), the latter was determined under steady-state conditions by iteratively solving the pressure distribution in the fully filled mold cavity and matching the numerical flow rate with the experimental one.
The present study will be helpful to measure 2D steady permeability components with the following steps: (1) it is assumed that the anisotropy ratio of unsteady permeability components and the rotation angle between x-y and principal 1–2 axes remains unchanged at steady state, and (2) permeability values are numerically iterated by calculating exit velocity components along all edges and matching the corresponding flow rate (Qnumerical) to the experimentally measured flow rate in the characterization experiment (Qexperiment).
Subsequent sections provide comprehensive information on the materials, the 2D permeability measurement setup, and present both experimental and numerical results, discussion and conclusions.
Materials and procedure of permeability characterization experiments
Materials
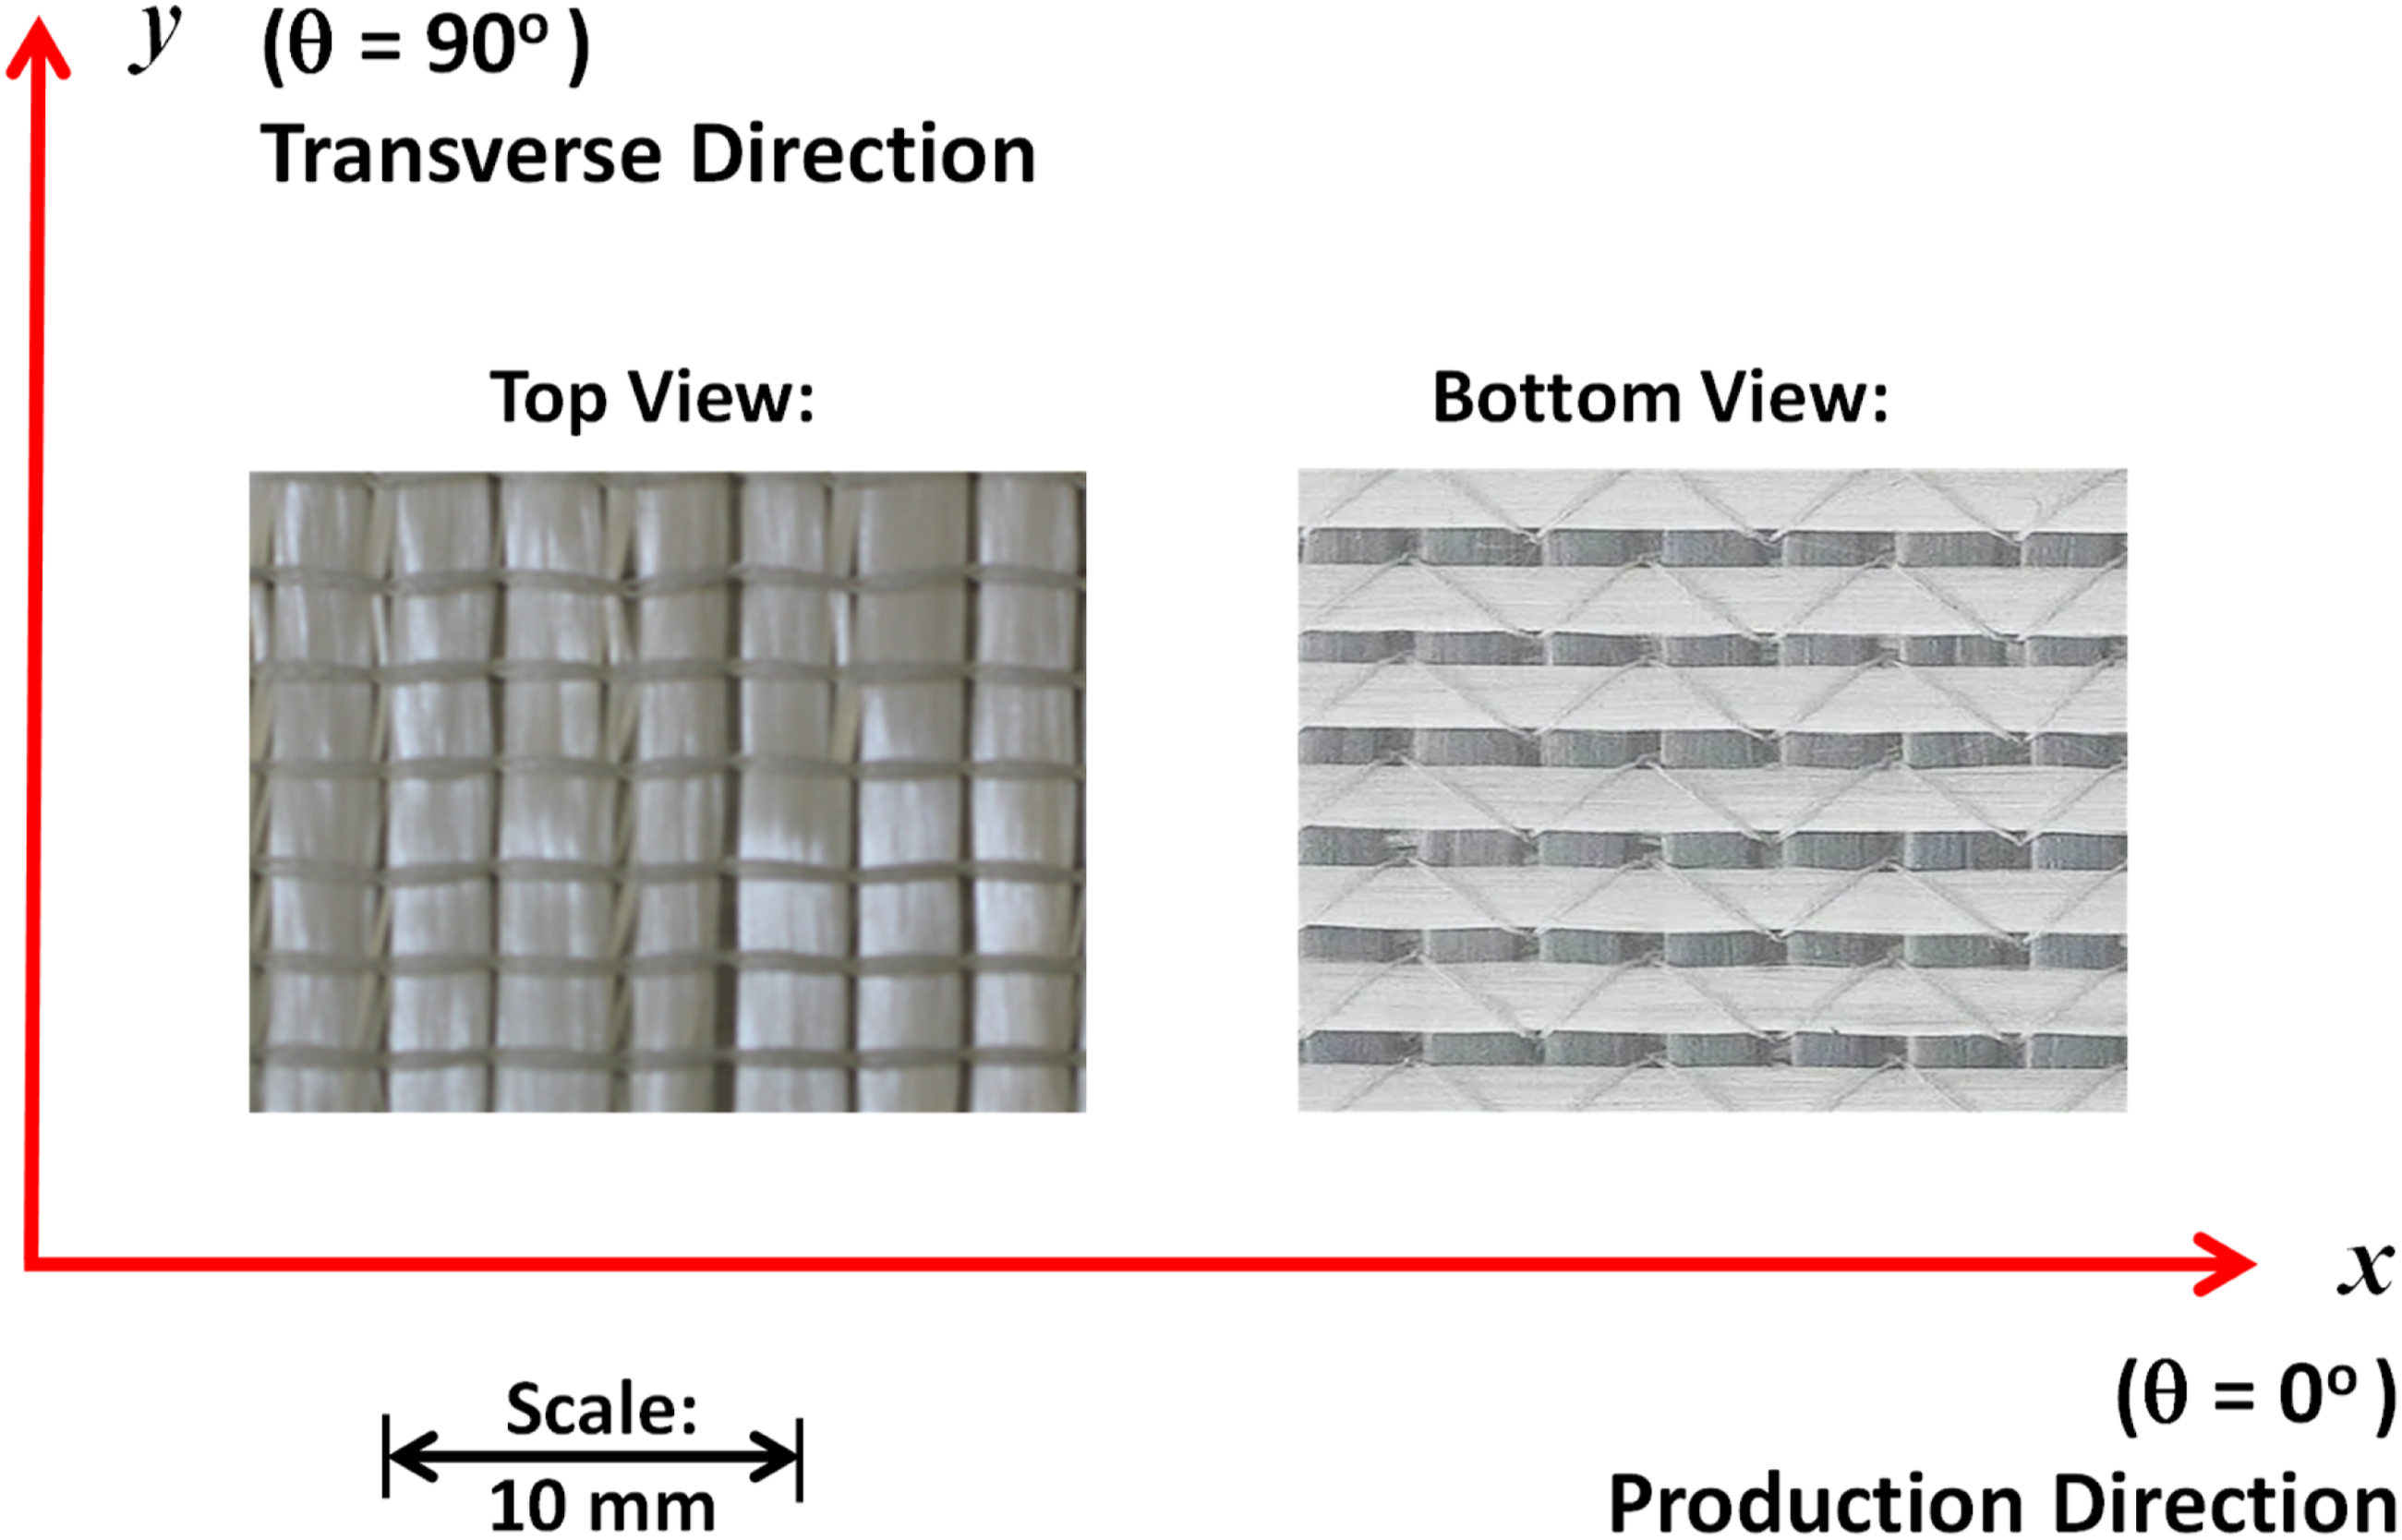
Permeability characterization of a biaxial stitched E-glass fabric (Metyx LT850 0/90, see Figure 1) was conducted at different fiber volume fractions by stacking five layers in a varying mold thickness, h. A new fabric specimen was used in each experiment. Silicone oil (Xiameter PMX 200) was used as test fluid. Material properties (oil viscosity and fabric superficial density per layer) are given in Table 1. During each experiment, the temperature of the silicone oil was recorded by using a thermocouple sensor. Temperature-dependent viscosity characterization for the oil was previously conducted by Technical University of Munich as a part of a benchmark study.
19
The Arrhenius equation, Top and bottom views of Metyx LT850 0/90 E-glass biaxial stitched fabric. Material properties of the resin and fabric
19
.
Experimental procedure
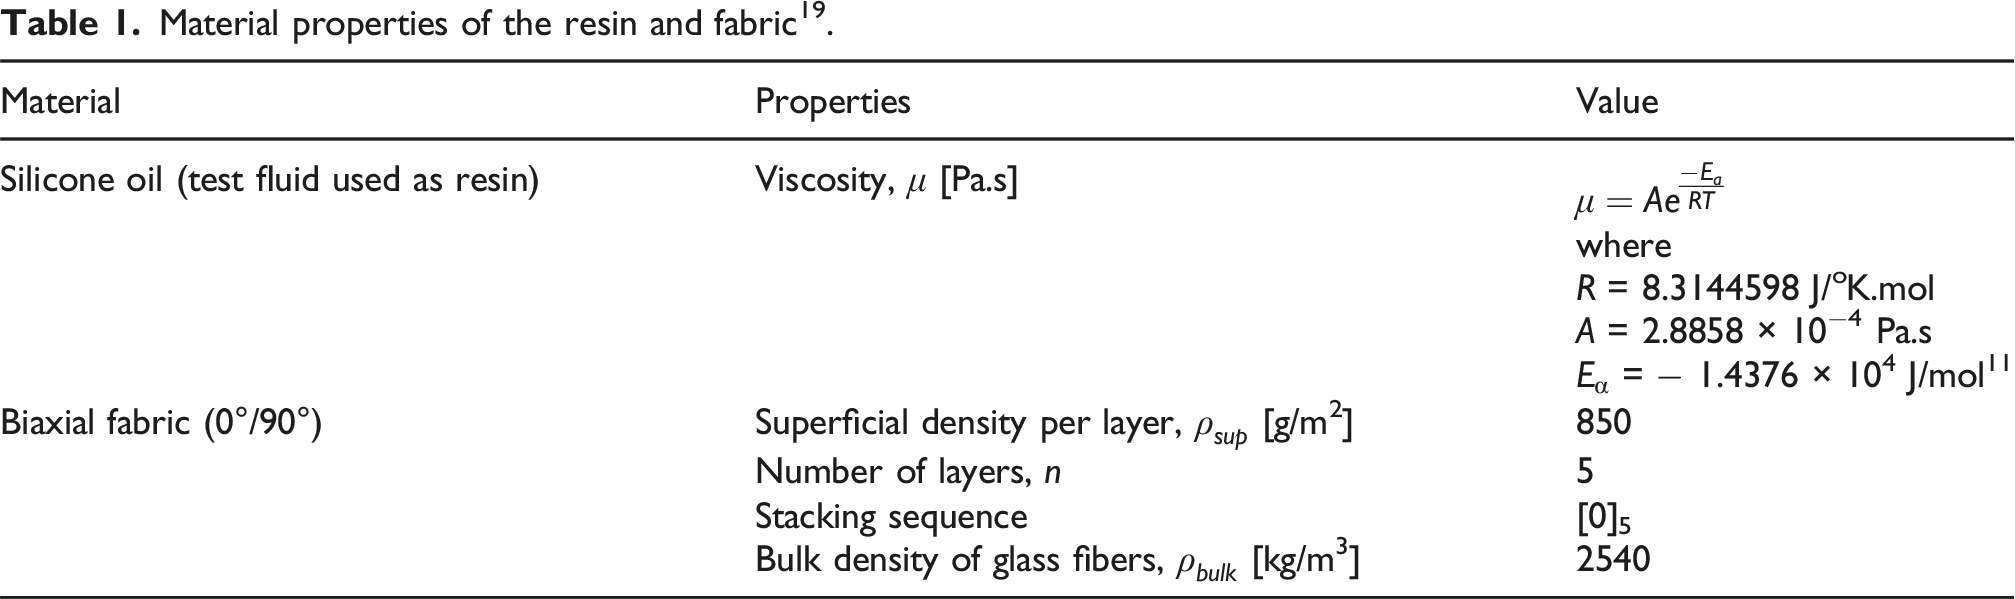
Five layers of the fabric with in-plane dimensions of 0.21 m × 0.21 m were cut and stacked with a sequence of [0]5. To create an inlet for the resin injection, the center of the fabric preform was punched with a hole diameter of 12 mm. Sharp hole edge was assumed to allow major flow in in-plane directions, and prevent significant resin flow through the thickness direction of the fabric during its initial entry into the mold cavity and throughout the impregnation of a specimen. A preformed specimen was placed on a lower metallic mold half (see Figure 2(b)). Eight steel spacers were placed between the lower and upper mold halves to adjust the cavity thickness. Three cavity thicknesses were studied: h = 3.0, 3.5, and 4.0 mm. An upper mold half made of perforated aluminum plate with glass monitoring windows was compressed onto the preform using 16 latches and 8 clamps (see Figures 2 and 3). 2D (radial) permeability measurement setup: (a) top view and (b) side view. Transient (unsteady) flow regime is illustrated here where the elliptical flow front has not reached the exit pool along the mold edges yet. 2D (radial) permeability measurement setup: (a) top view and (b) side view.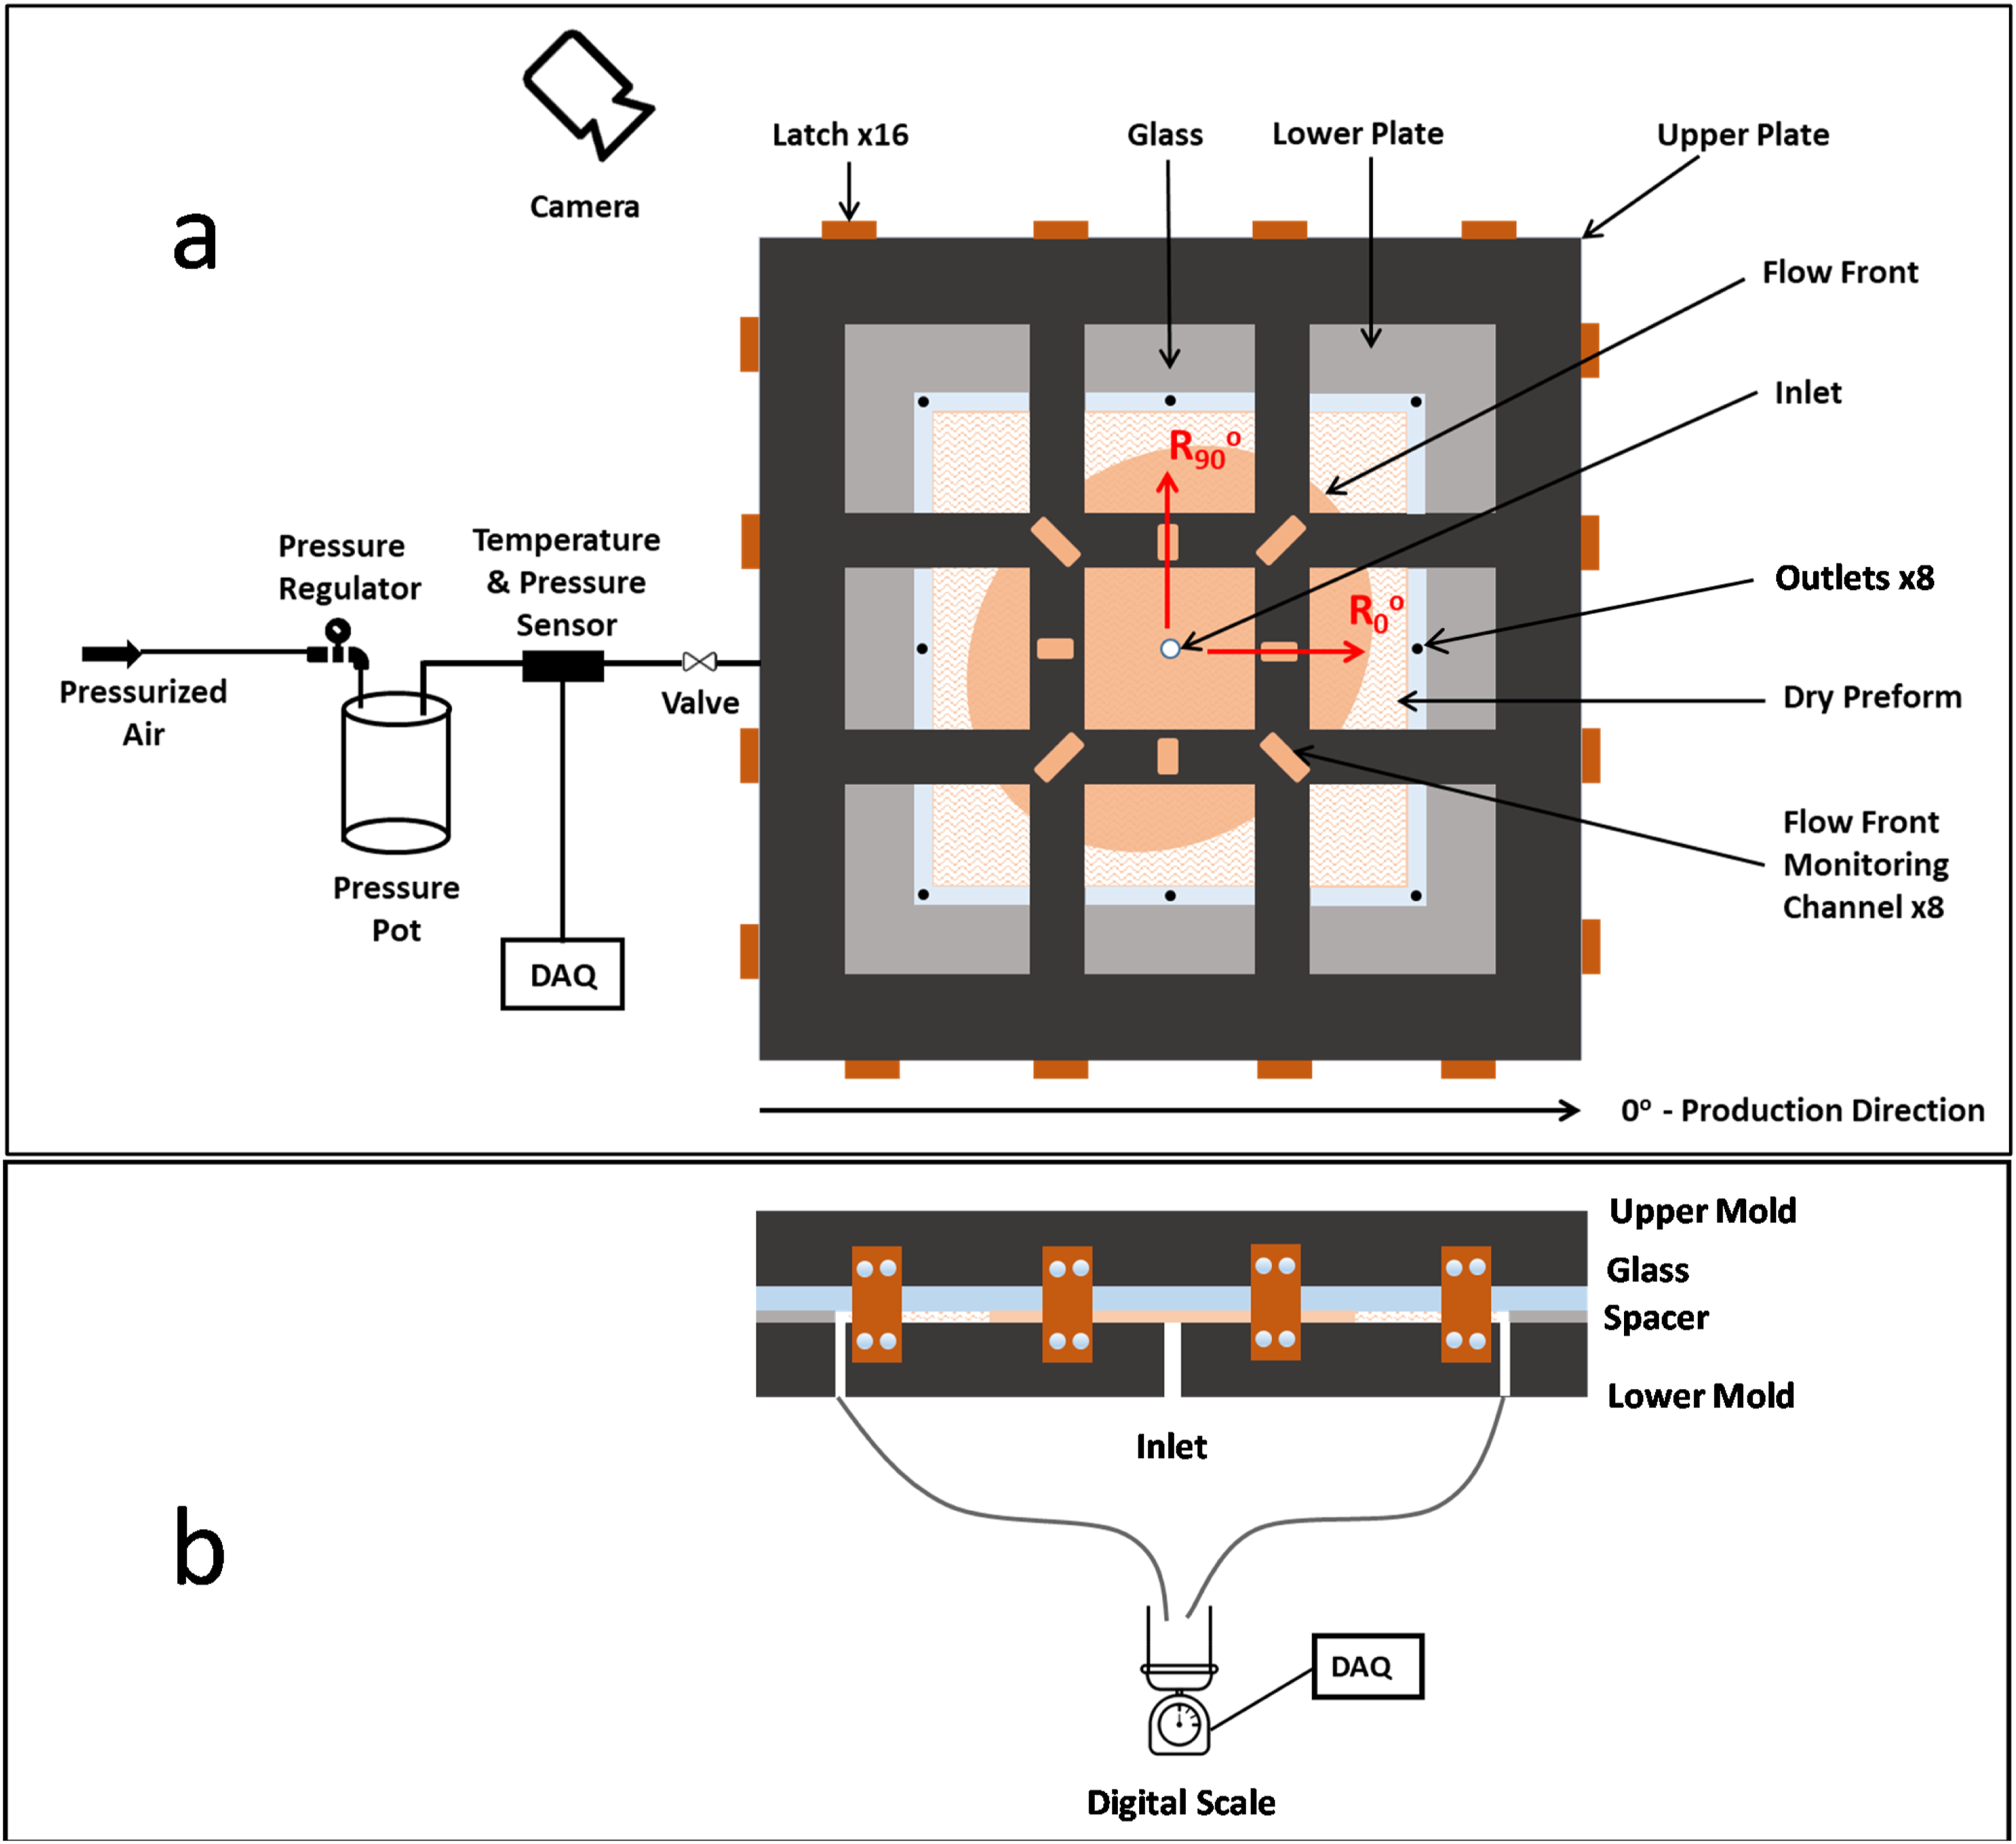
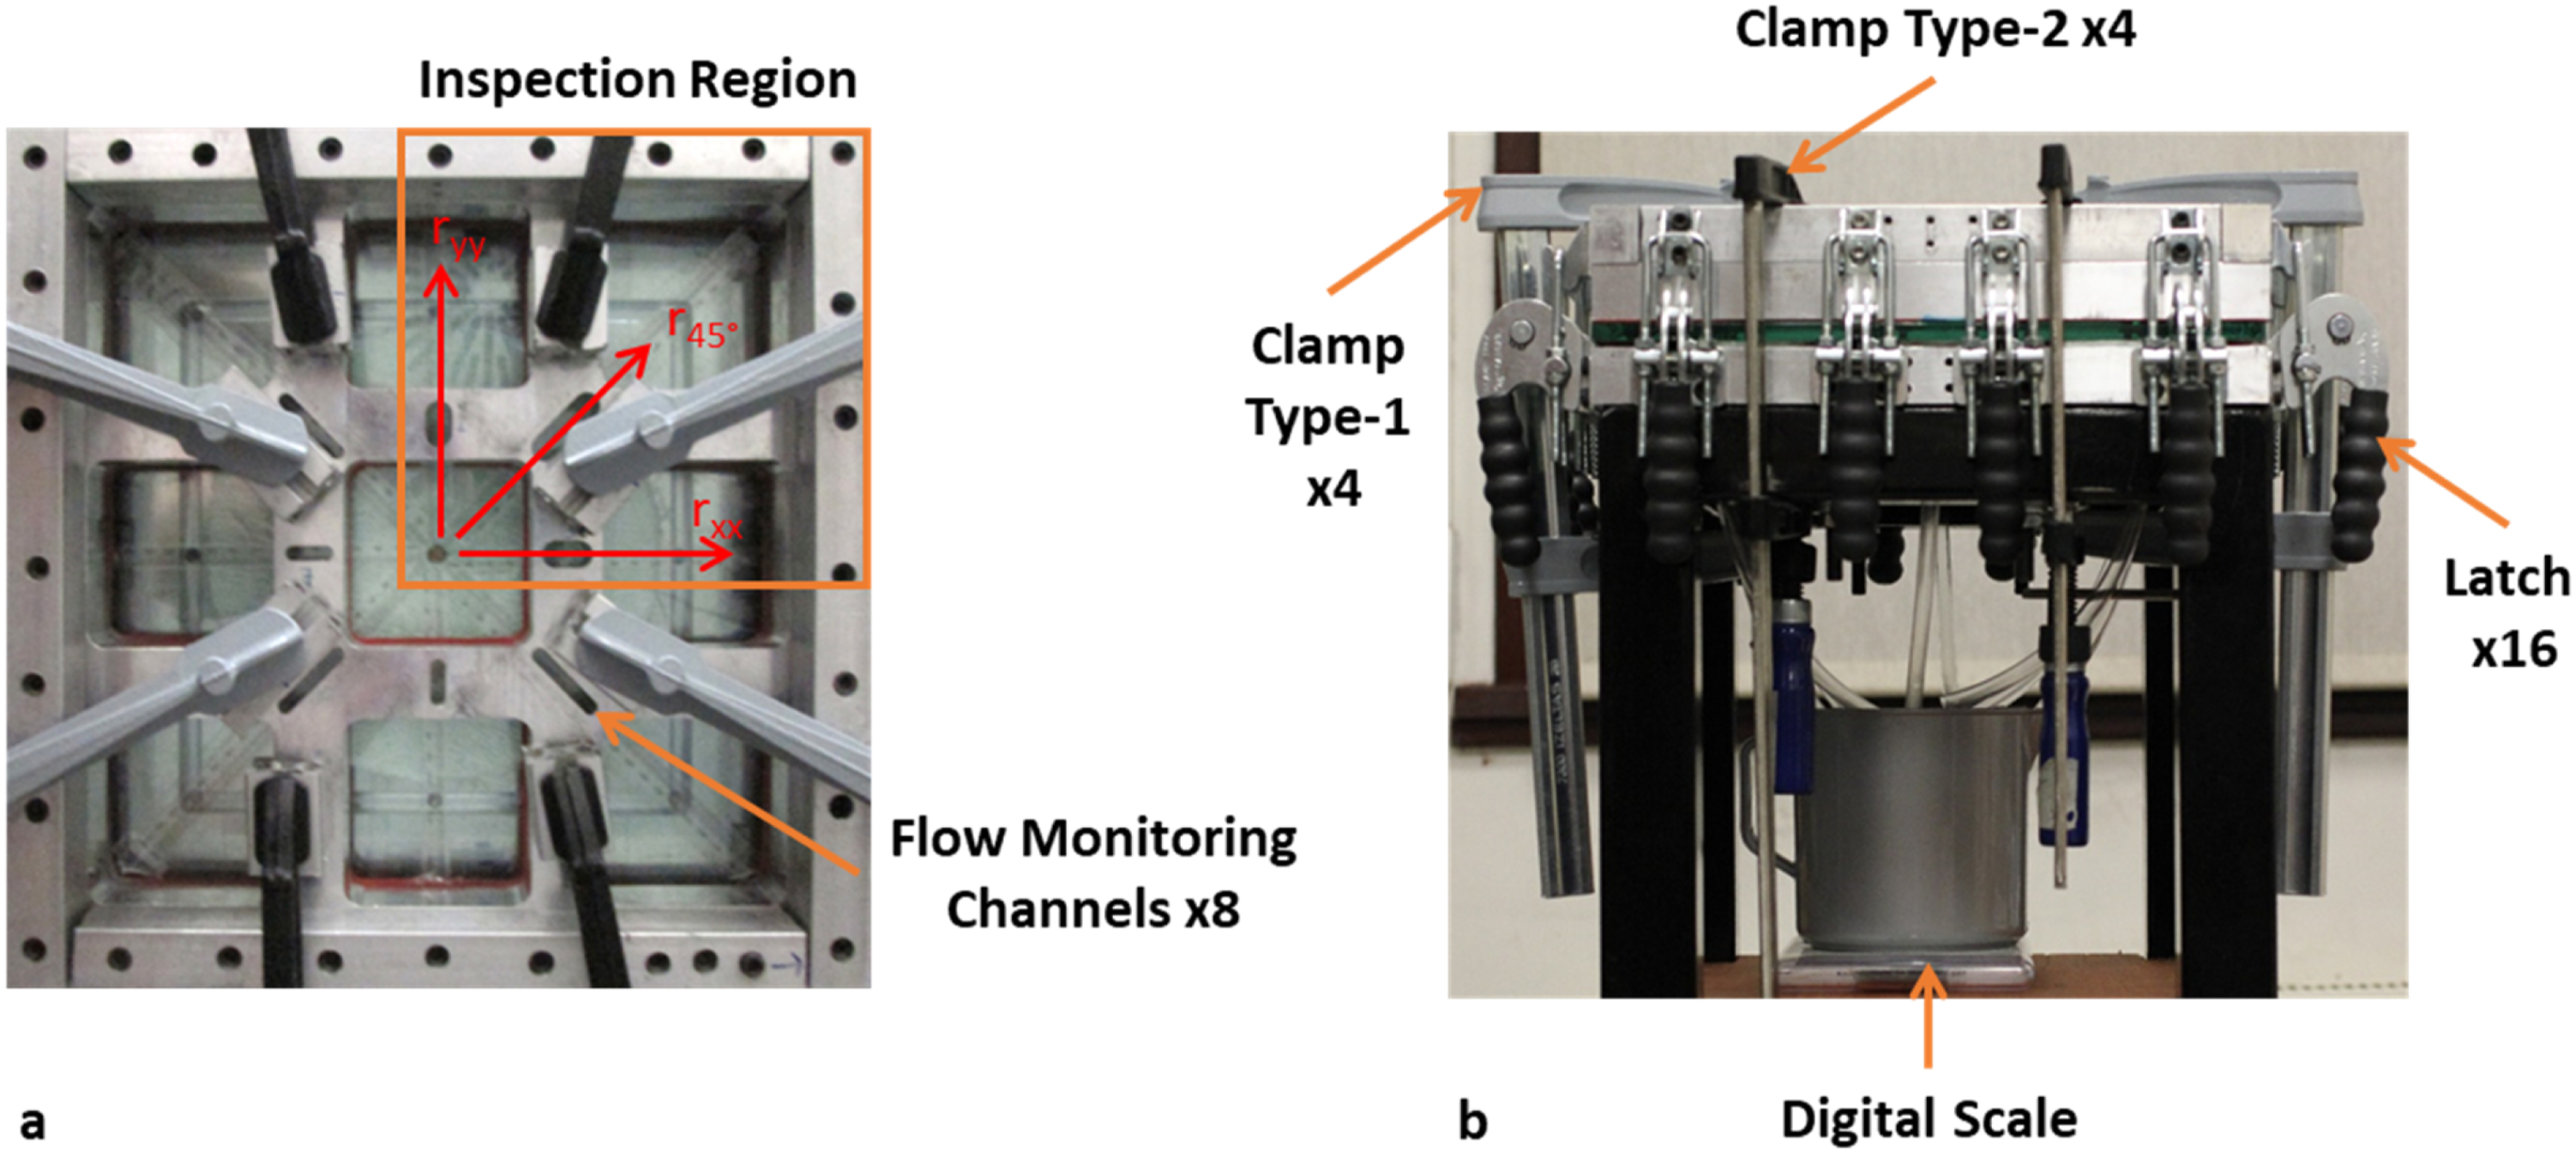
Compressed air pressurized the resin in a pressure pot to the targeted injection value of 80 kPa. An analog pressure regulator (CKD RP1000) was used to set this value. The resin pressure and temperature were recorded using a pressure sensor (Keller PAA 35X, 0 to 10 bar abs, 0.002 full scale resolution) and a thermocouple, respectively. Although the experiments were conducted under isothermal room temperature condition, the viscosity of the resin was calculated by averaging the temperature of the resin (T) recorded during each experiment (not a significant temperature variation was observed during any experiment) and substituting it in the Arrhenius equation,
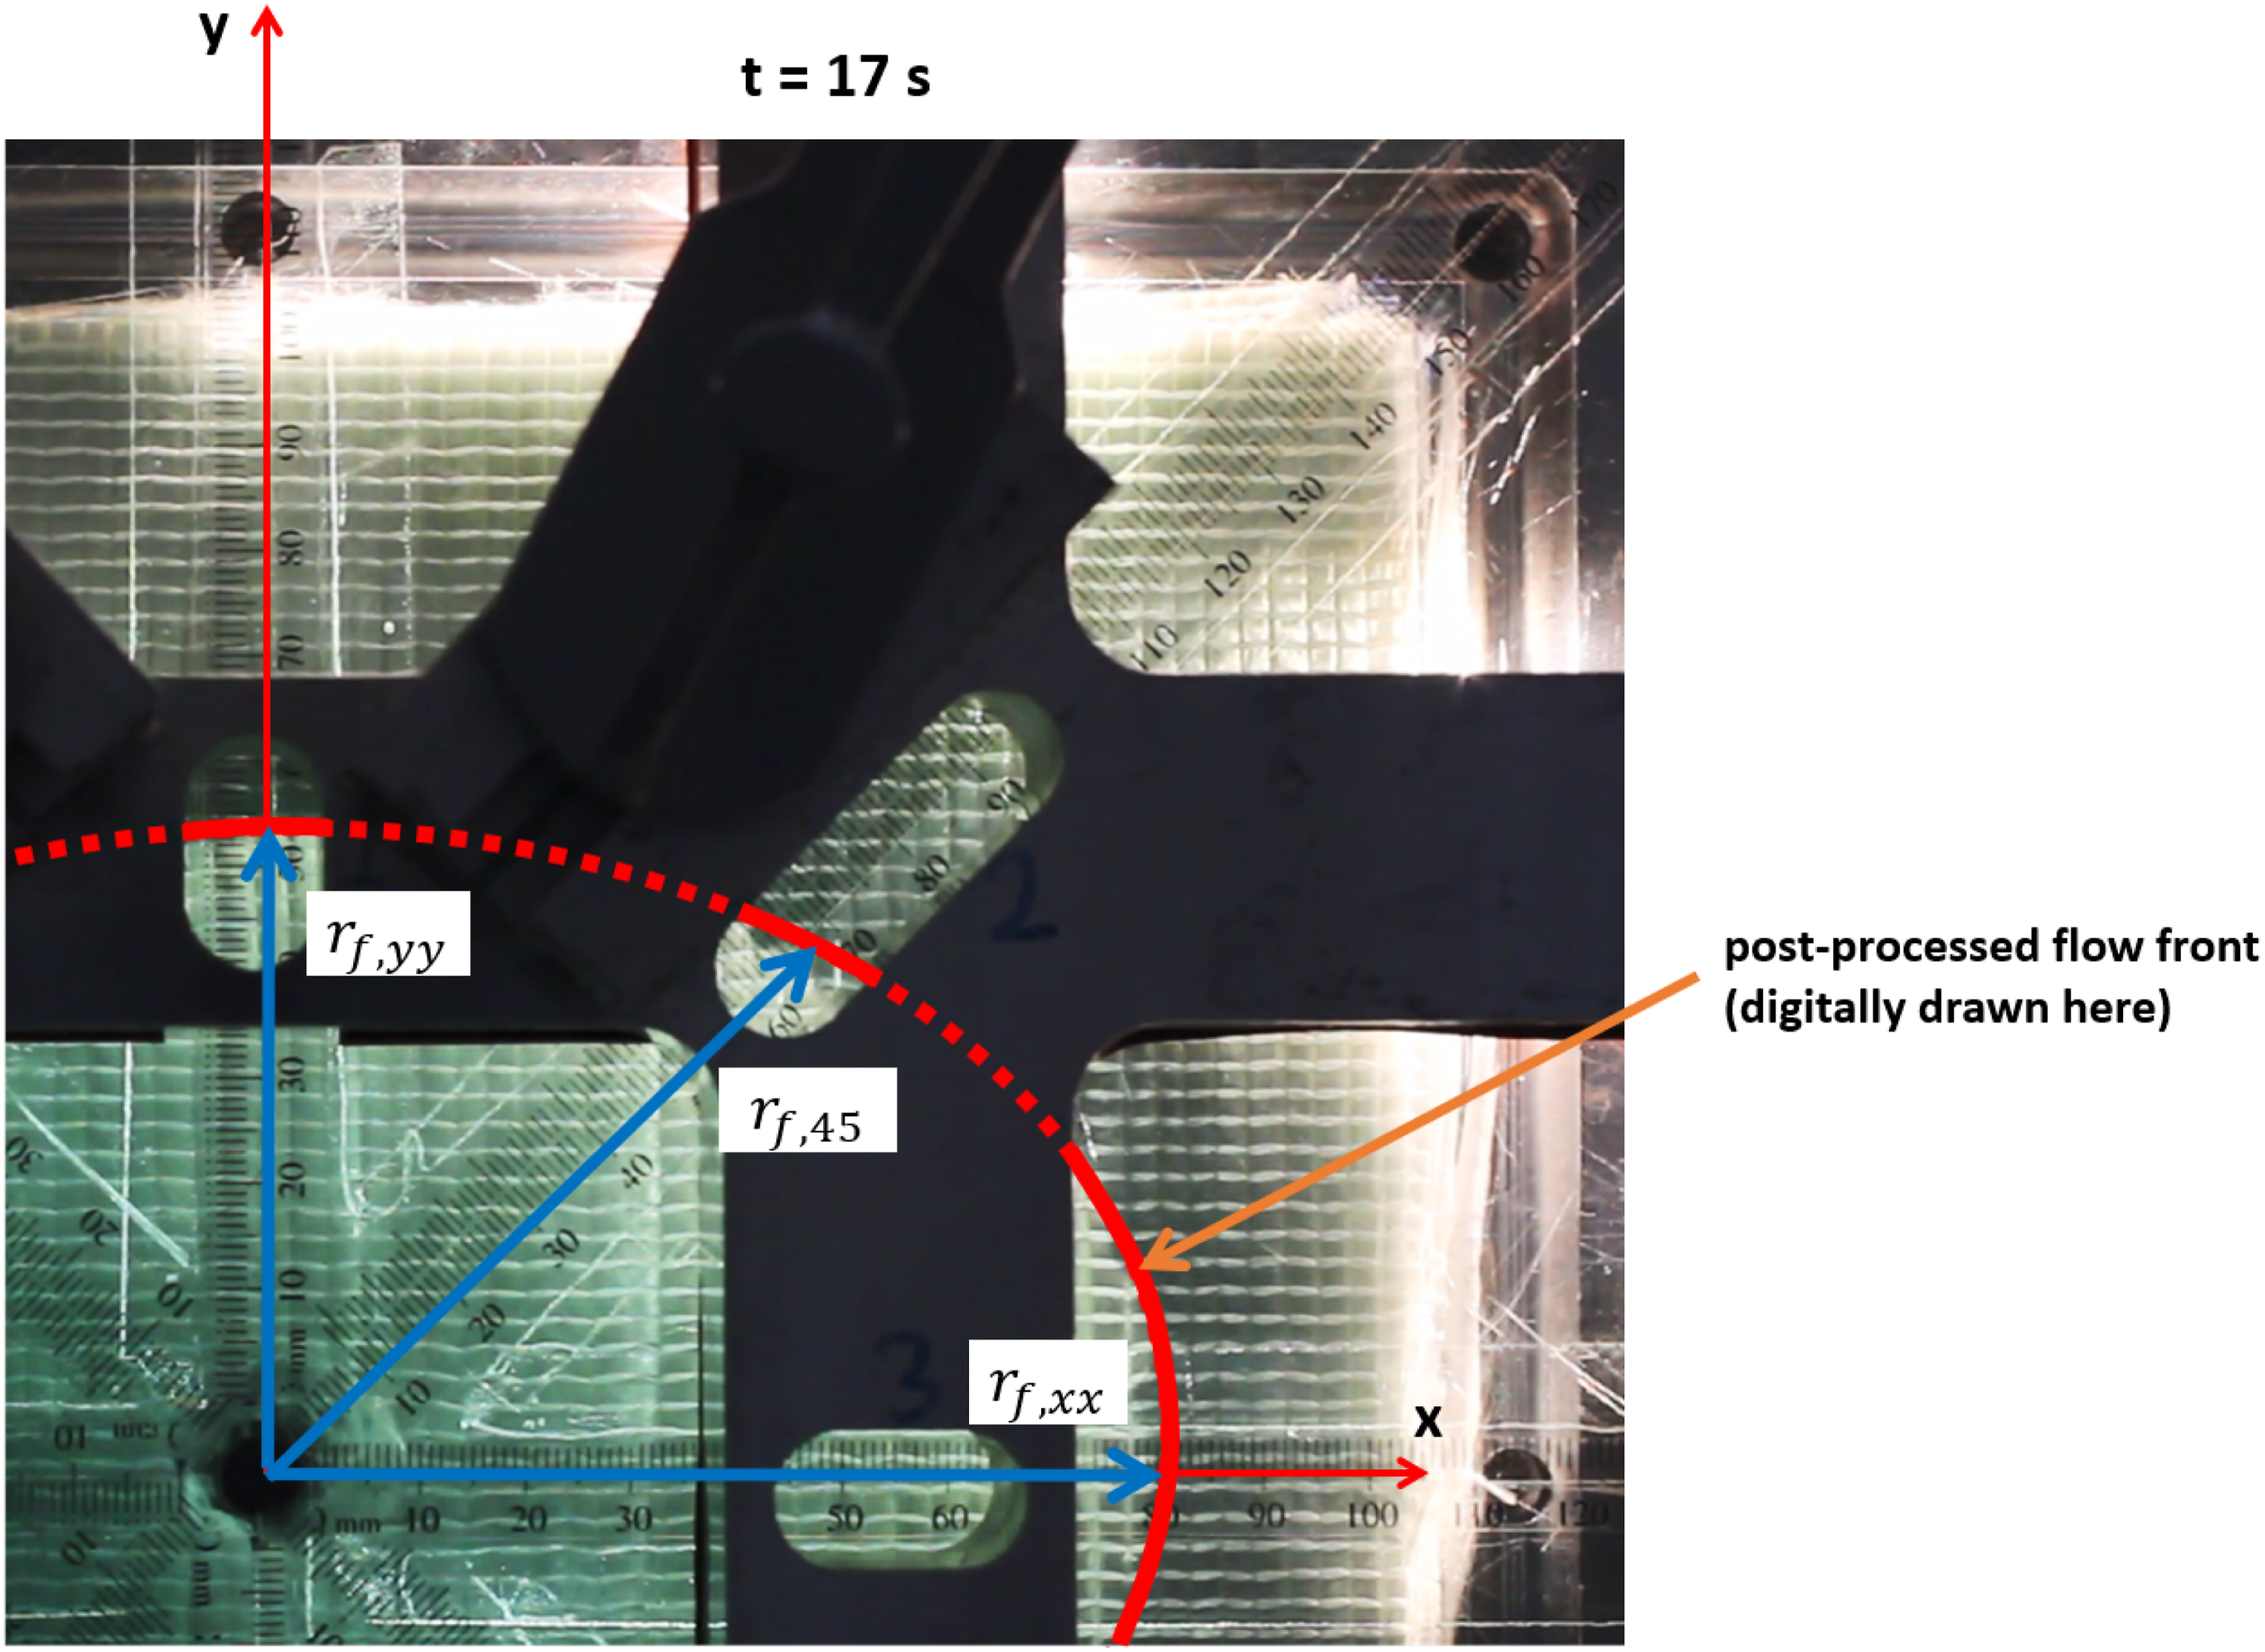
Resin injection was facilitated from the center of the lower mold half, and the outlet vent was open to the atmosphere (see Figure 2). In this study, an anisotropic biaxial fabric preform was used, consequently an elliptical flow front was observed (Figure 4). The flow front radii in three directions ( Coordinate systems x–y and 1–2. The three radii 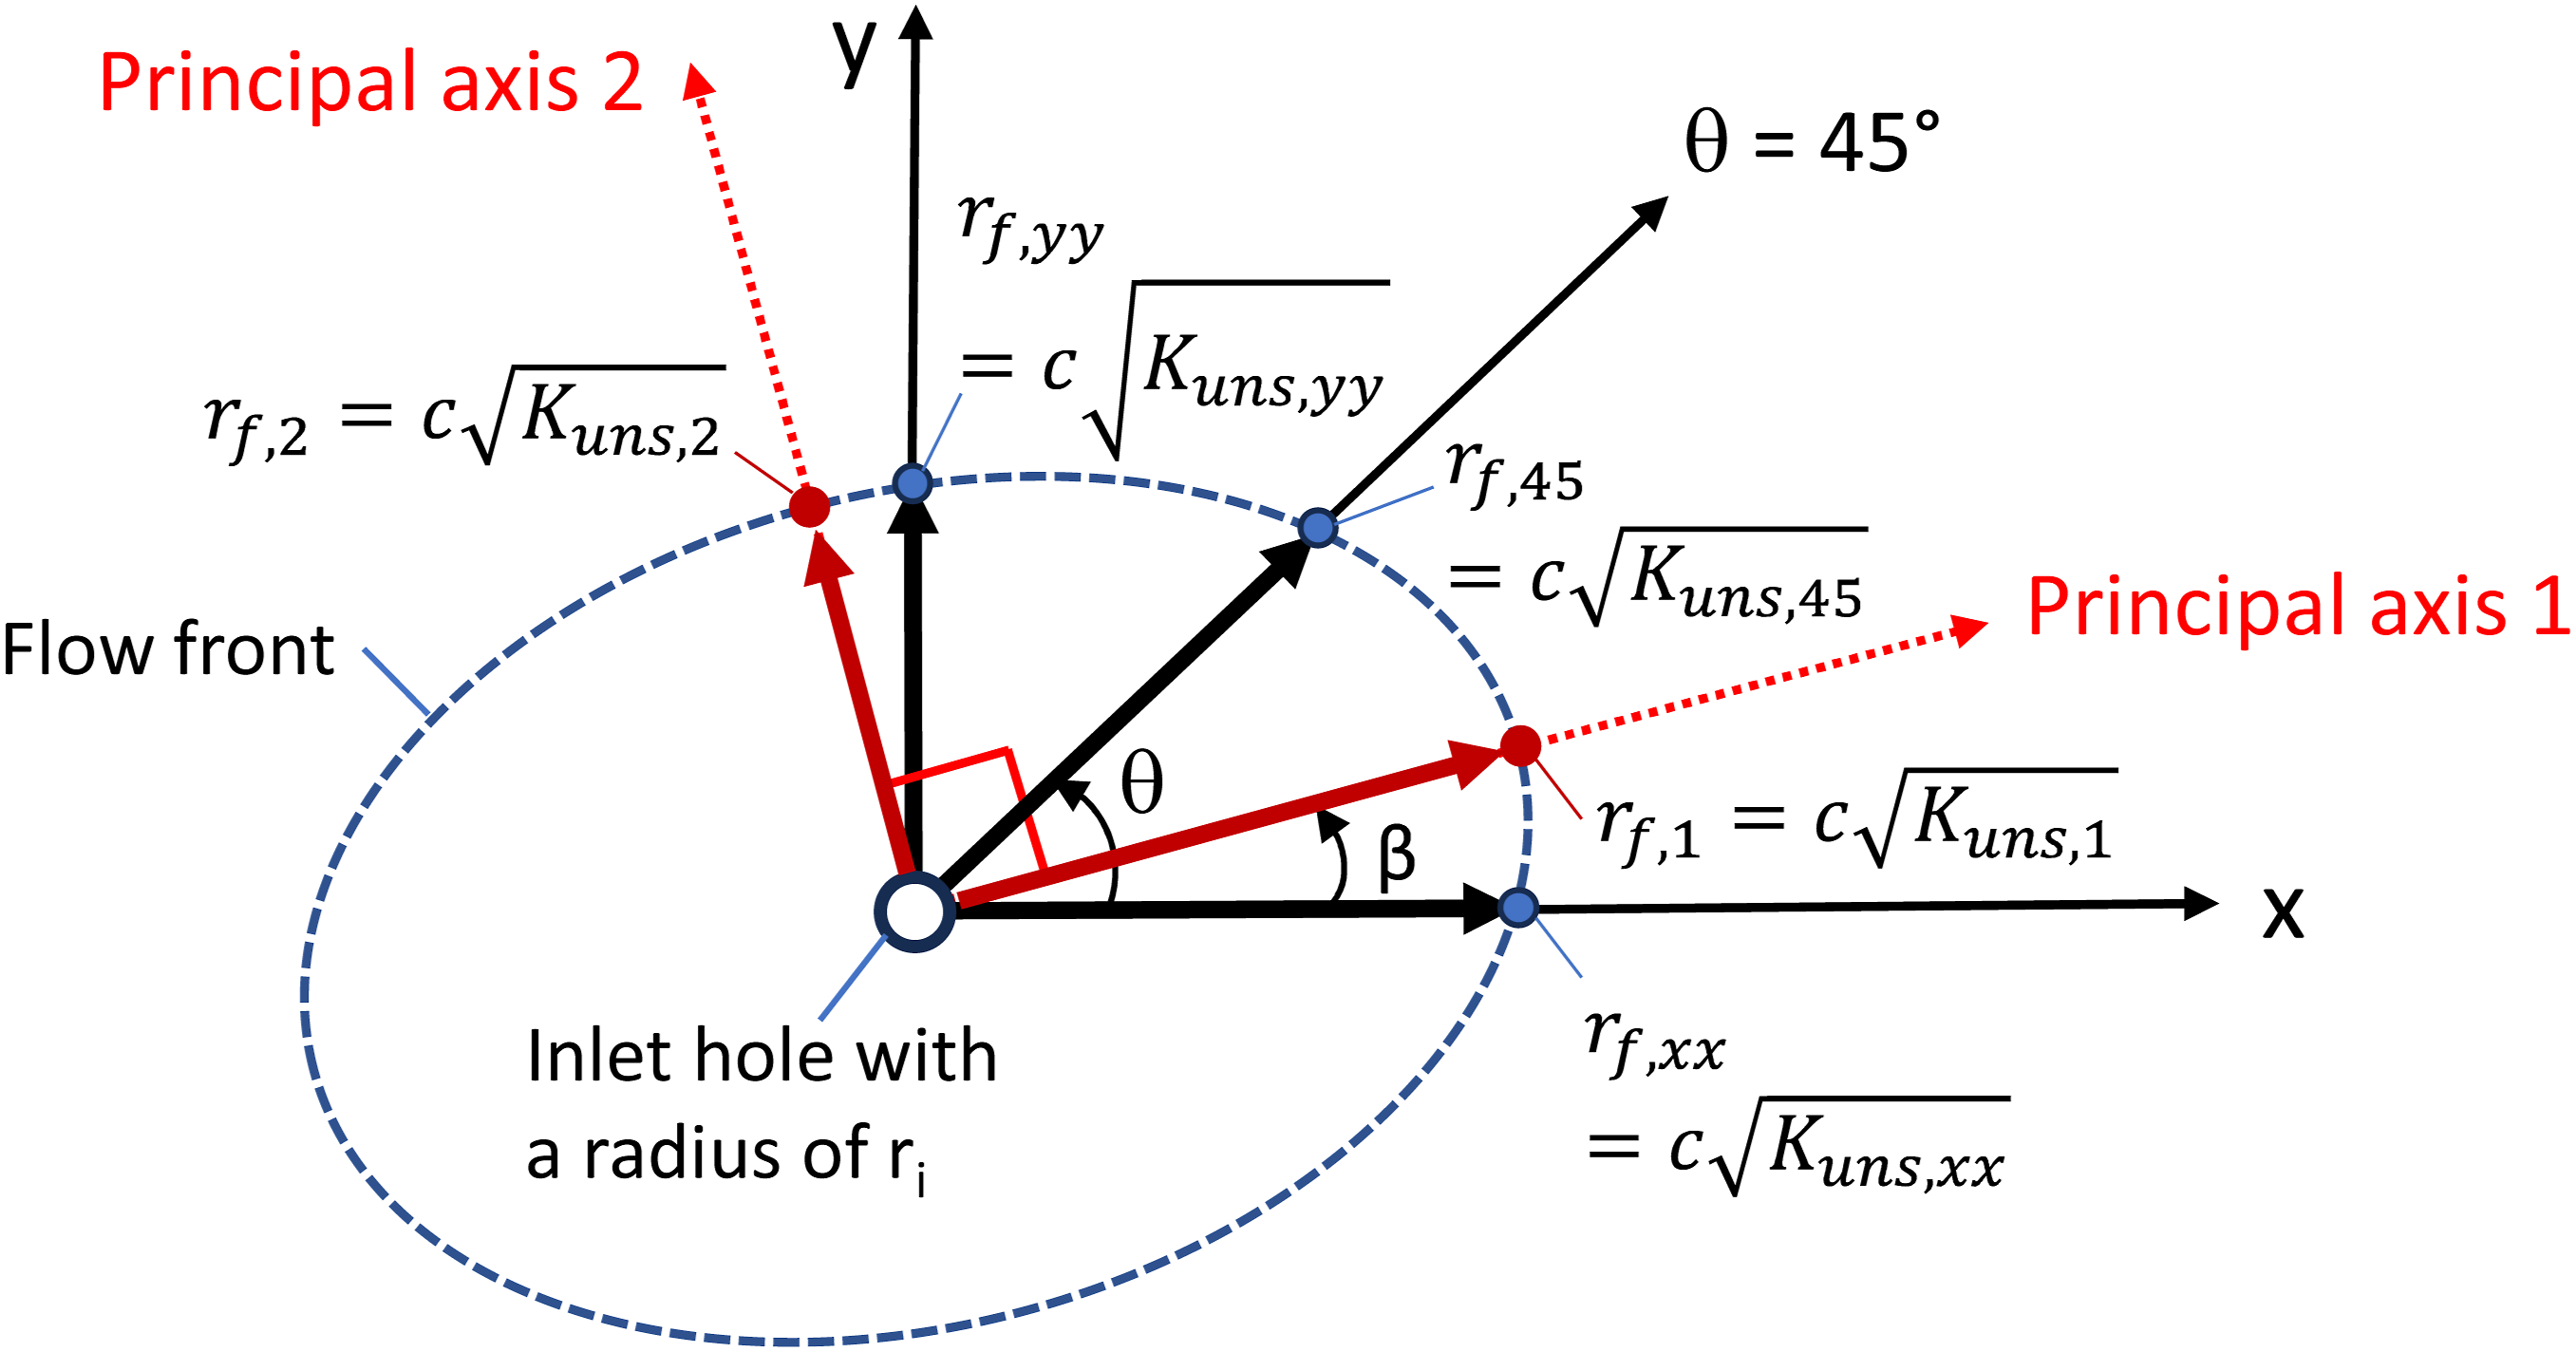
The components of 2D unsteady permeability 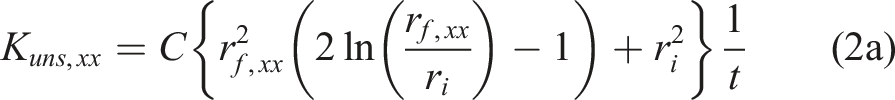
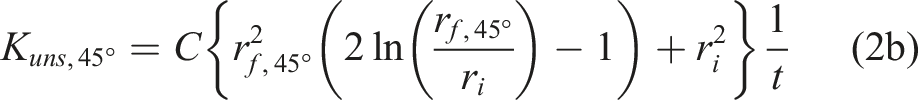
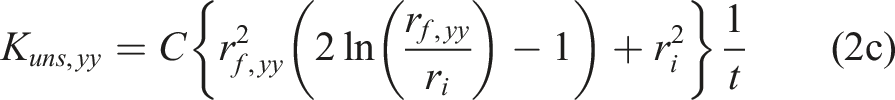
The first data point for unsaturated permeability measurement was recorded approximately 2 s after resin first became visible at the inlet hole. During this period, the resin flow front advanced rapidly (on the order of several centimeters), and this short delay in data collection was assumed to ensure that entry effects associated with the punched hole had diminished. The experimental data was obtained by post-processing of the video recordings manually. While curve-fitting, equations ((2a)–(2c)) were expressed as
As previously done in a benchmarking study,
21
axes transformation is done to determine the principal permeabilities (denoted as 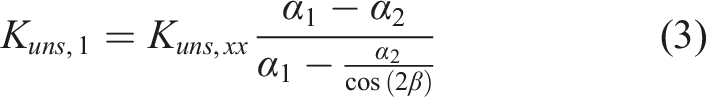
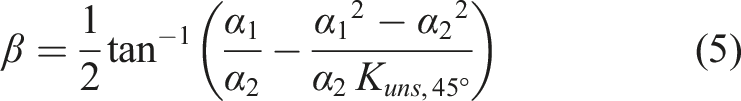
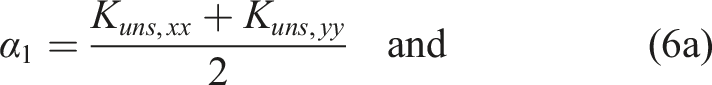
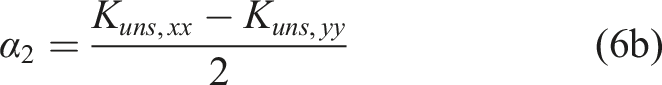
As in this study, if one uses x–y coordinate system (instead of 1–2 coordinate system) in the numerical solutions, 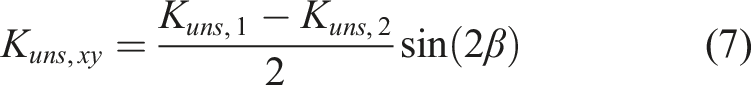
The anisotropy ratio, 
Although the analysis was based only on data from the inspection region (0° ≤ θ ≤ 90°), as is commonly done in the literature, the flow front in the other regions was also observed to follow a similar qualitative pattern, with its elliptical shape matching that of the analyzed quarter. The experimental setup included a peripheral groove surrounding the specimen, with eight outlets located within it on the lower mold plate (see Figure 5). The bled resin was collected in a container on a digital scale (see Figure 2 and 3), and the mass versus time data of the resin was recorded using a DAQ system on MATLAB®. After the resin bleeding was observed, the resin flow continued for at least 300 s to ensure complete impregnation of the fabric and thus to reach an almost steady flow. The data for the last 120 s were used in the calculation of the experimental volumetric flow rate, Top view of the 2D (radial) permeability measurement setup schematically showcasing a steady flow regime, i.e., when the fabric preform was fully wetted.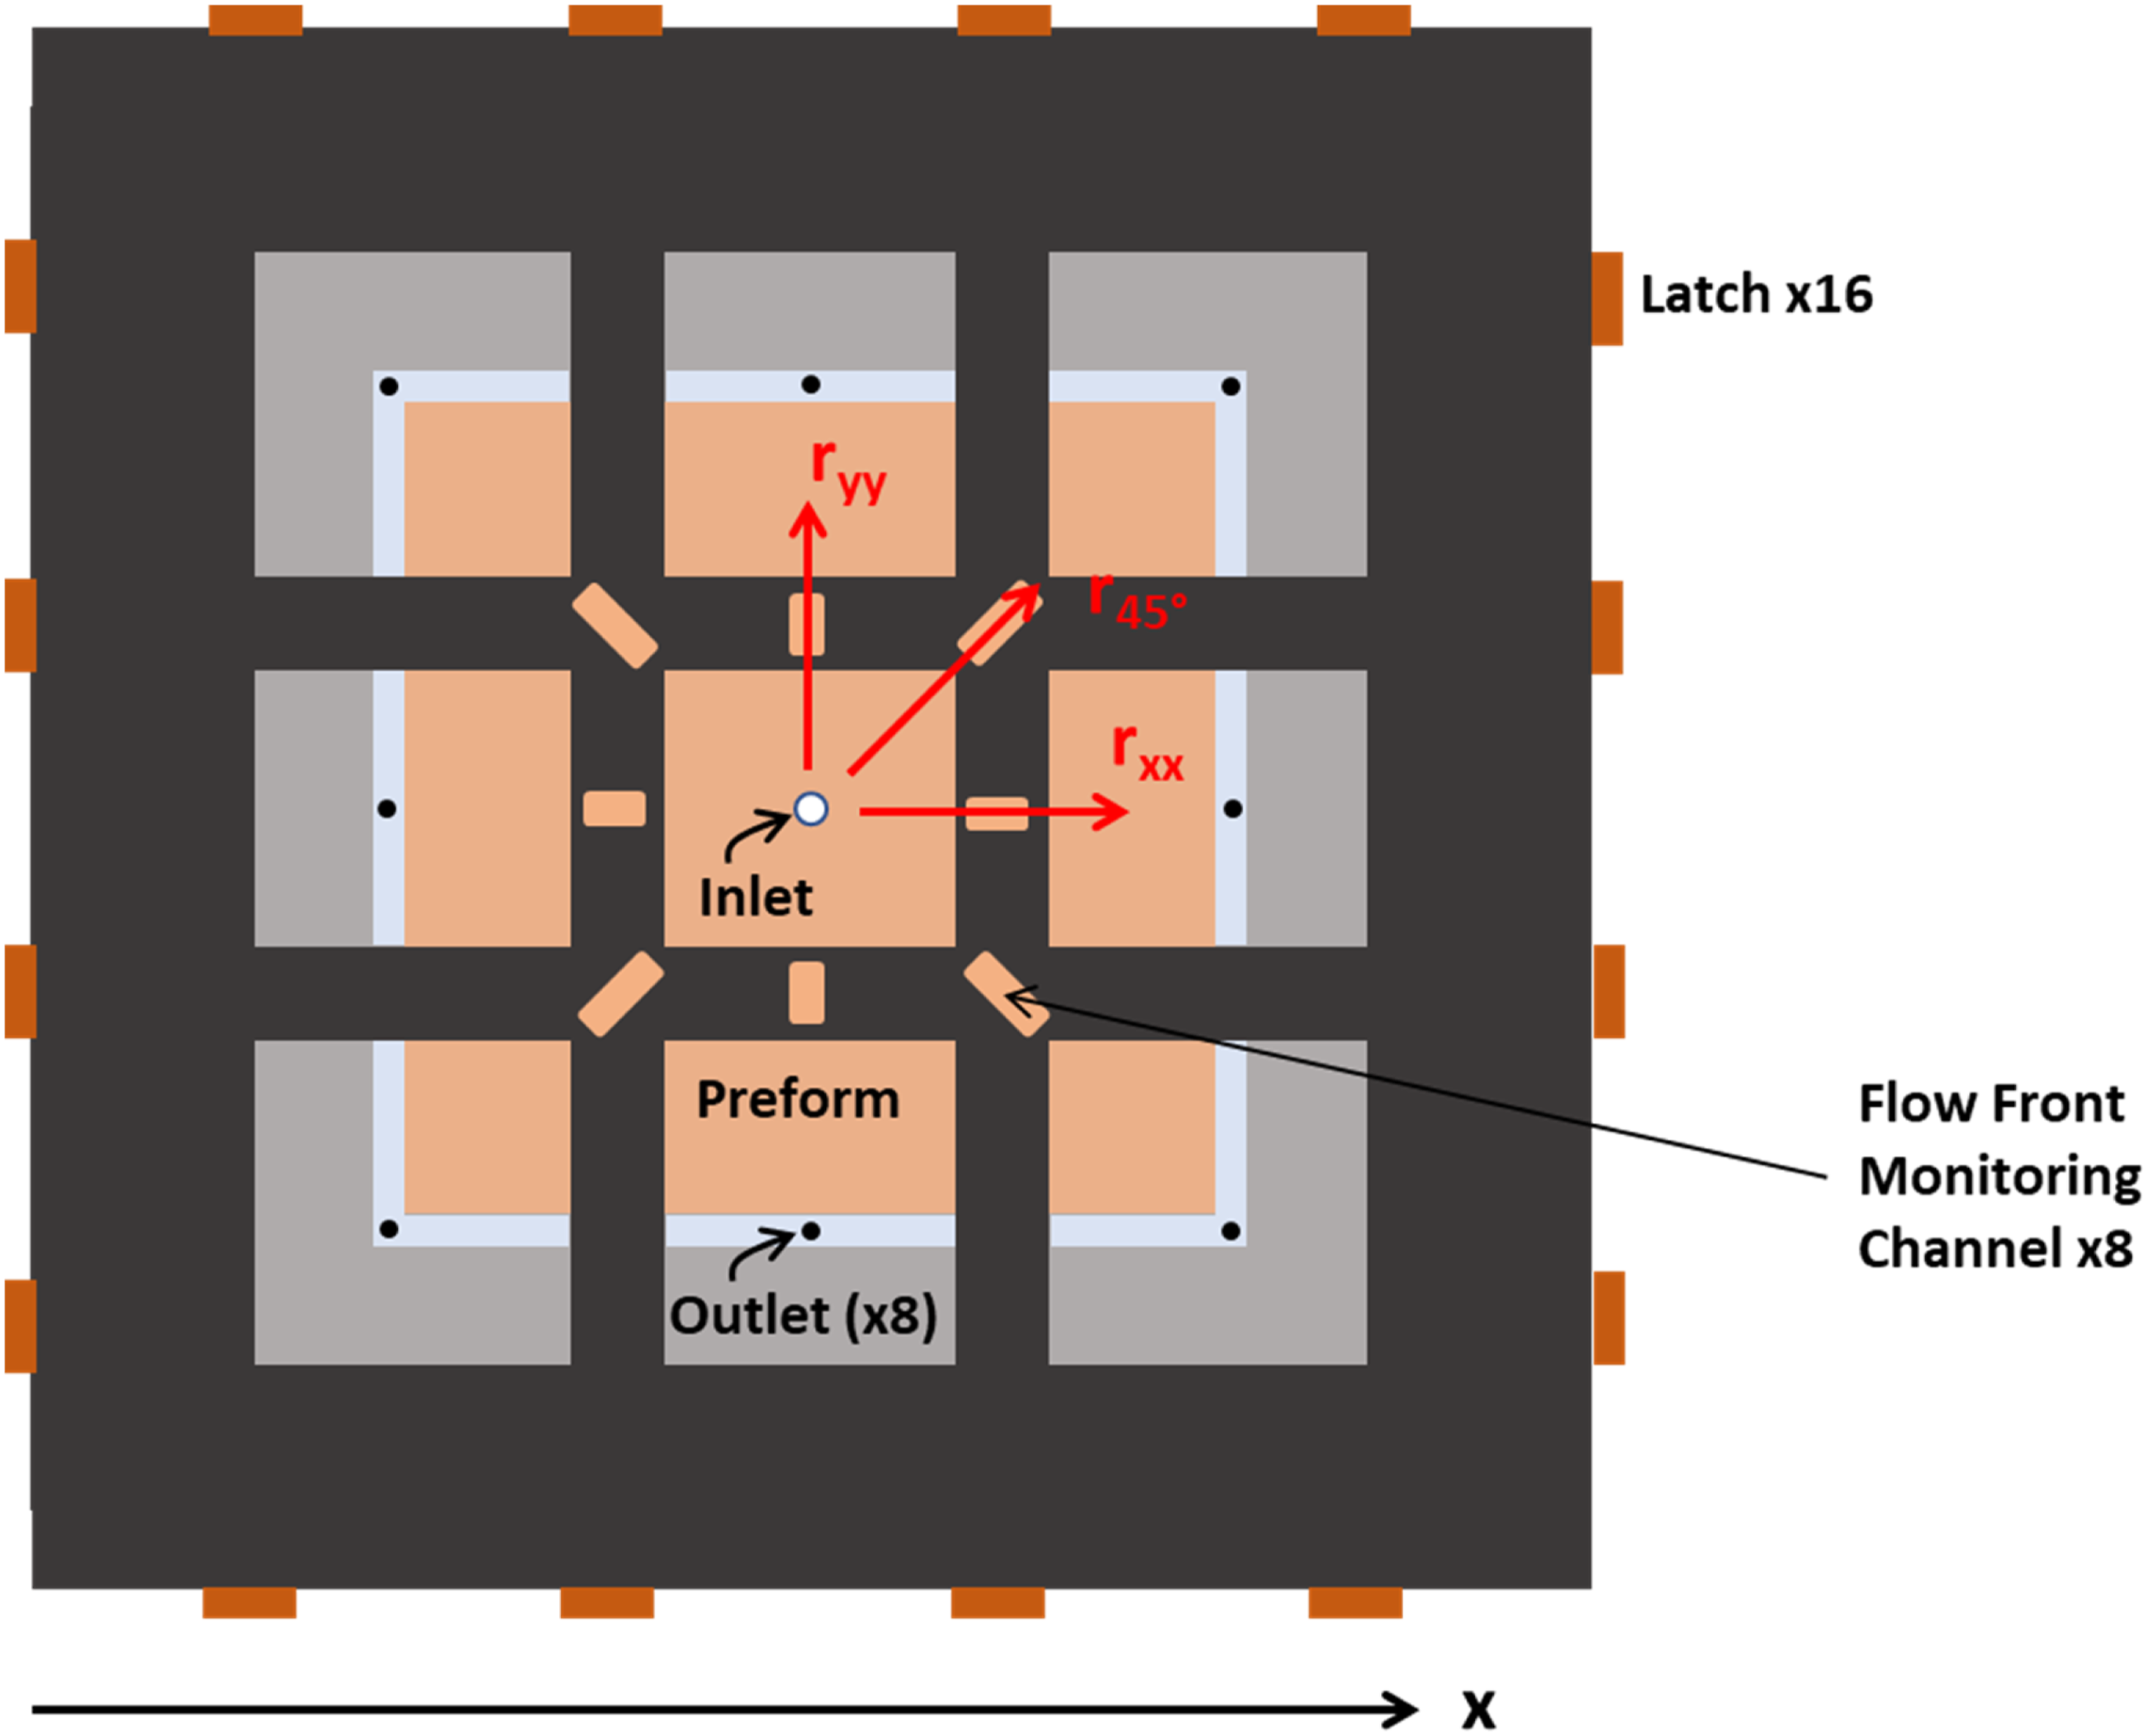
Numerical modelling of 2D steady permeability
Following the numerical model and solution approach described in this section, the steady permeability components were determined in MATLAB® using a custom-written code, such that the simulated outflow volumetric flow rate matched the experimental measurements. The initial step in the analysis was the calculation of the pressure distribution. For 2D incompressible flow through a porous medium, the following continuity equation represents conservation of mass, assuming that both local inter- and intra-tow regions within a representative domain are filled simultaneously: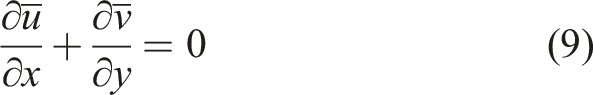
By assuming that the permeability tensor and viscosity are spatially uniform and 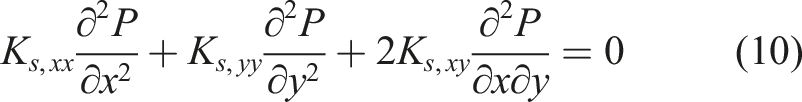
Steady state pressure distribution, P(x,y) was numerically calculated by discretizing the resin-filled domain (the entire mold; see Figure 7) and using finite-difference method (FDM). Pressure at any inner point was related to its neighbors’ pressures when FDM was applied. By using 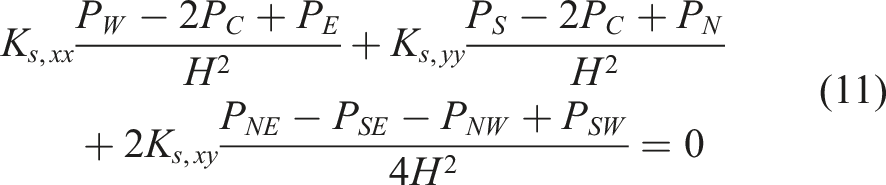
Here an inner central C node has indexes i and j for x and y axes, respectively such that 
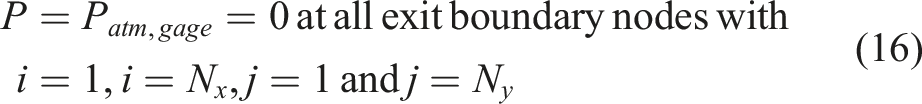
The pressure at the inlet hole was assigned as the injection pressure, and the pressure at the exit edges were assigned as atmospheric pressure (see Figure 6): The domain of the fabric specimen wetted with resin at steady state 2D flow. Pressure boundary conditions were defined at the inlet hole and the outer periphery. Normal exit velocity components were specifically shown here and used to compute outflow rate at steady state.

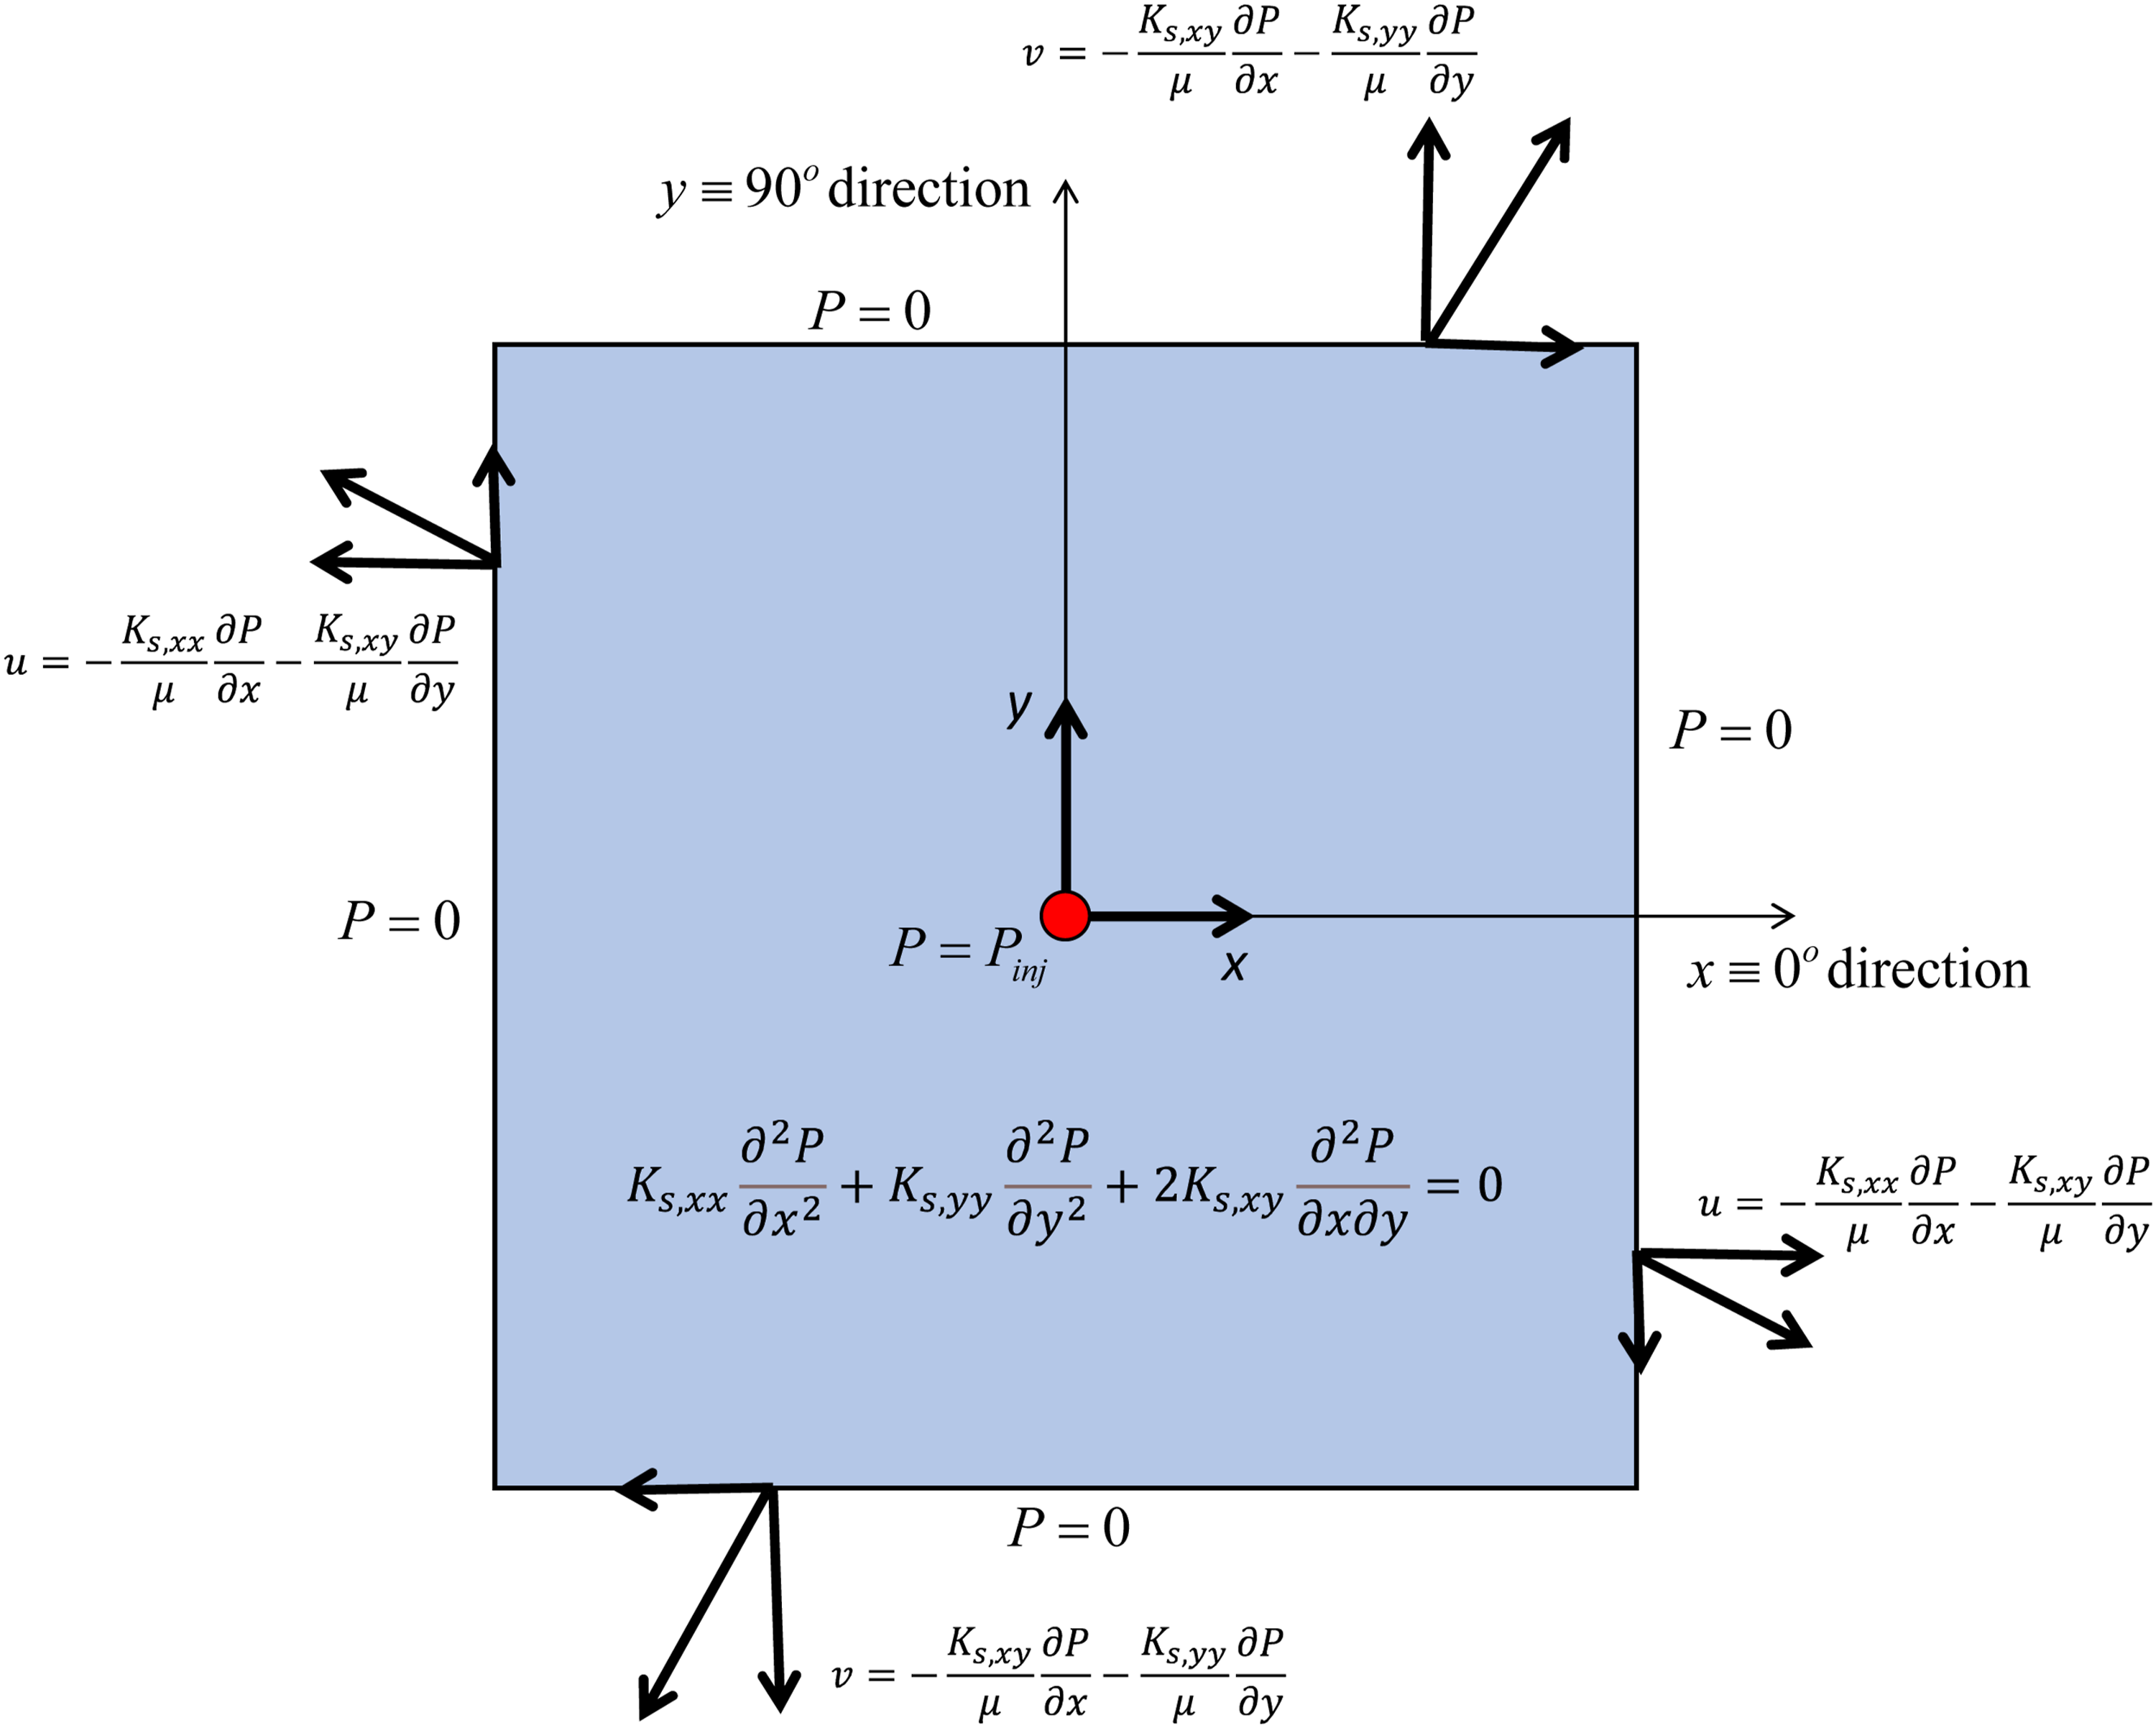
These boundary conditions were numerically implemented as follows in the discrete form:
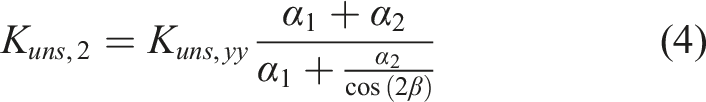
The anisotropy ratio of the steady-state permeability tensor was assumed to remain unchanged from that of the unsteady-state permeability tensor: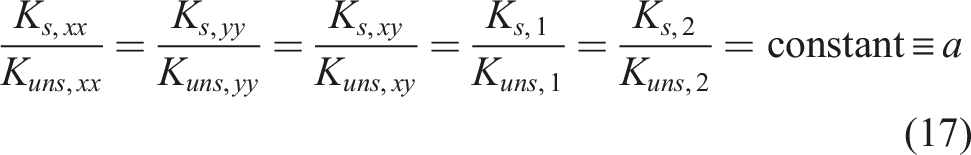

During the initial unsteady stage of the characterization, the unsteady permeability was already experimentally measured. In the subsequent steady-stage analysis, the goal was to estimate the steady-state permeability components by iteratively determining the parameter a in equation (17). This iteration was based on matching the outflow rate computed numerically with that experimentally measured. The numerical volumetric outflow rate was calculated as follows: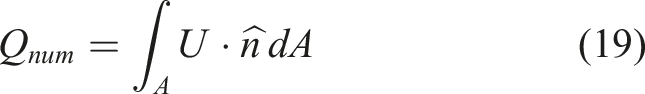
Iterative algorithm to estimate the steady permeability components
The algorithm used in the numerical procedure for estimating the steady permeability components was as follows: (1) Initialization: Begin by predicting the steady permeability components (2) Pressure Field Solution: Solve the pressure distribution, (3) Velocity Field Computation: Calculate the velocity components, (4) Outflow Rate Computation: Calculate the numerical outflow rate, (5) Correction: Fix (6) Permeability Update: Repeat the steps 1–3 by using the corrected
Although this procedure was referred to as an iterative solution method, it effectively involved only two steps (initial estimation and one correction) and can therefore be regarded as a quasi-direct approach.
Specifically, because both the velocity field (U) and the outflow rate (Q) are linearly proportional to the parameter a in equation (17), scaling the initially estimated permeability components by the ratio of
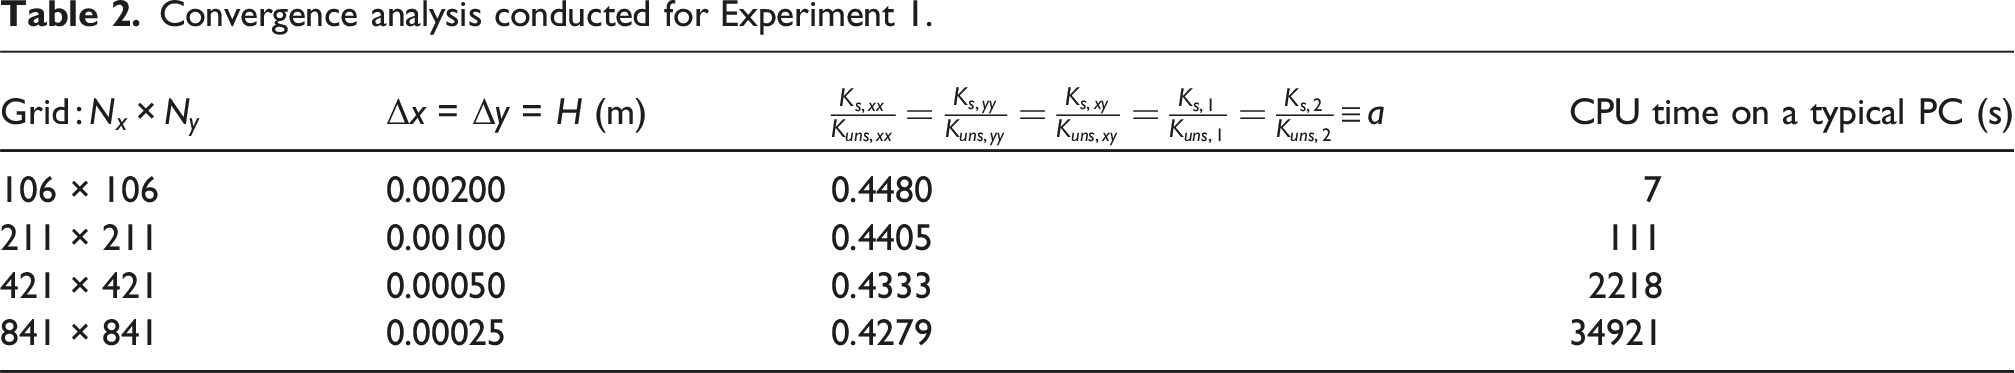
Convergence analysis
A common finite difference method (FDM) grid was used across all 15 simulation experiments, based on a convergence study conducted for a representative case (Experiment 1). As the grid spacing H (see Figure 7) decreased, the ratio a appeared to converge (see Table 2). To balance accuracy with computational efficiency and thus avoid excessively long CPU times (e.g., 34,921/3600 = 9.7 h for an 841 × 841 grid in Experiment 1), a more practical grid size of 421 × 421 was chosen. This resolution was considered sufficient for achieving convergence to two significant figures in a (0.43 Grid and representative nodes used in finite difference method. Here a coarse mesh was illustrated, however, a finer grid with Convergence analysis conducted for Experiment 1.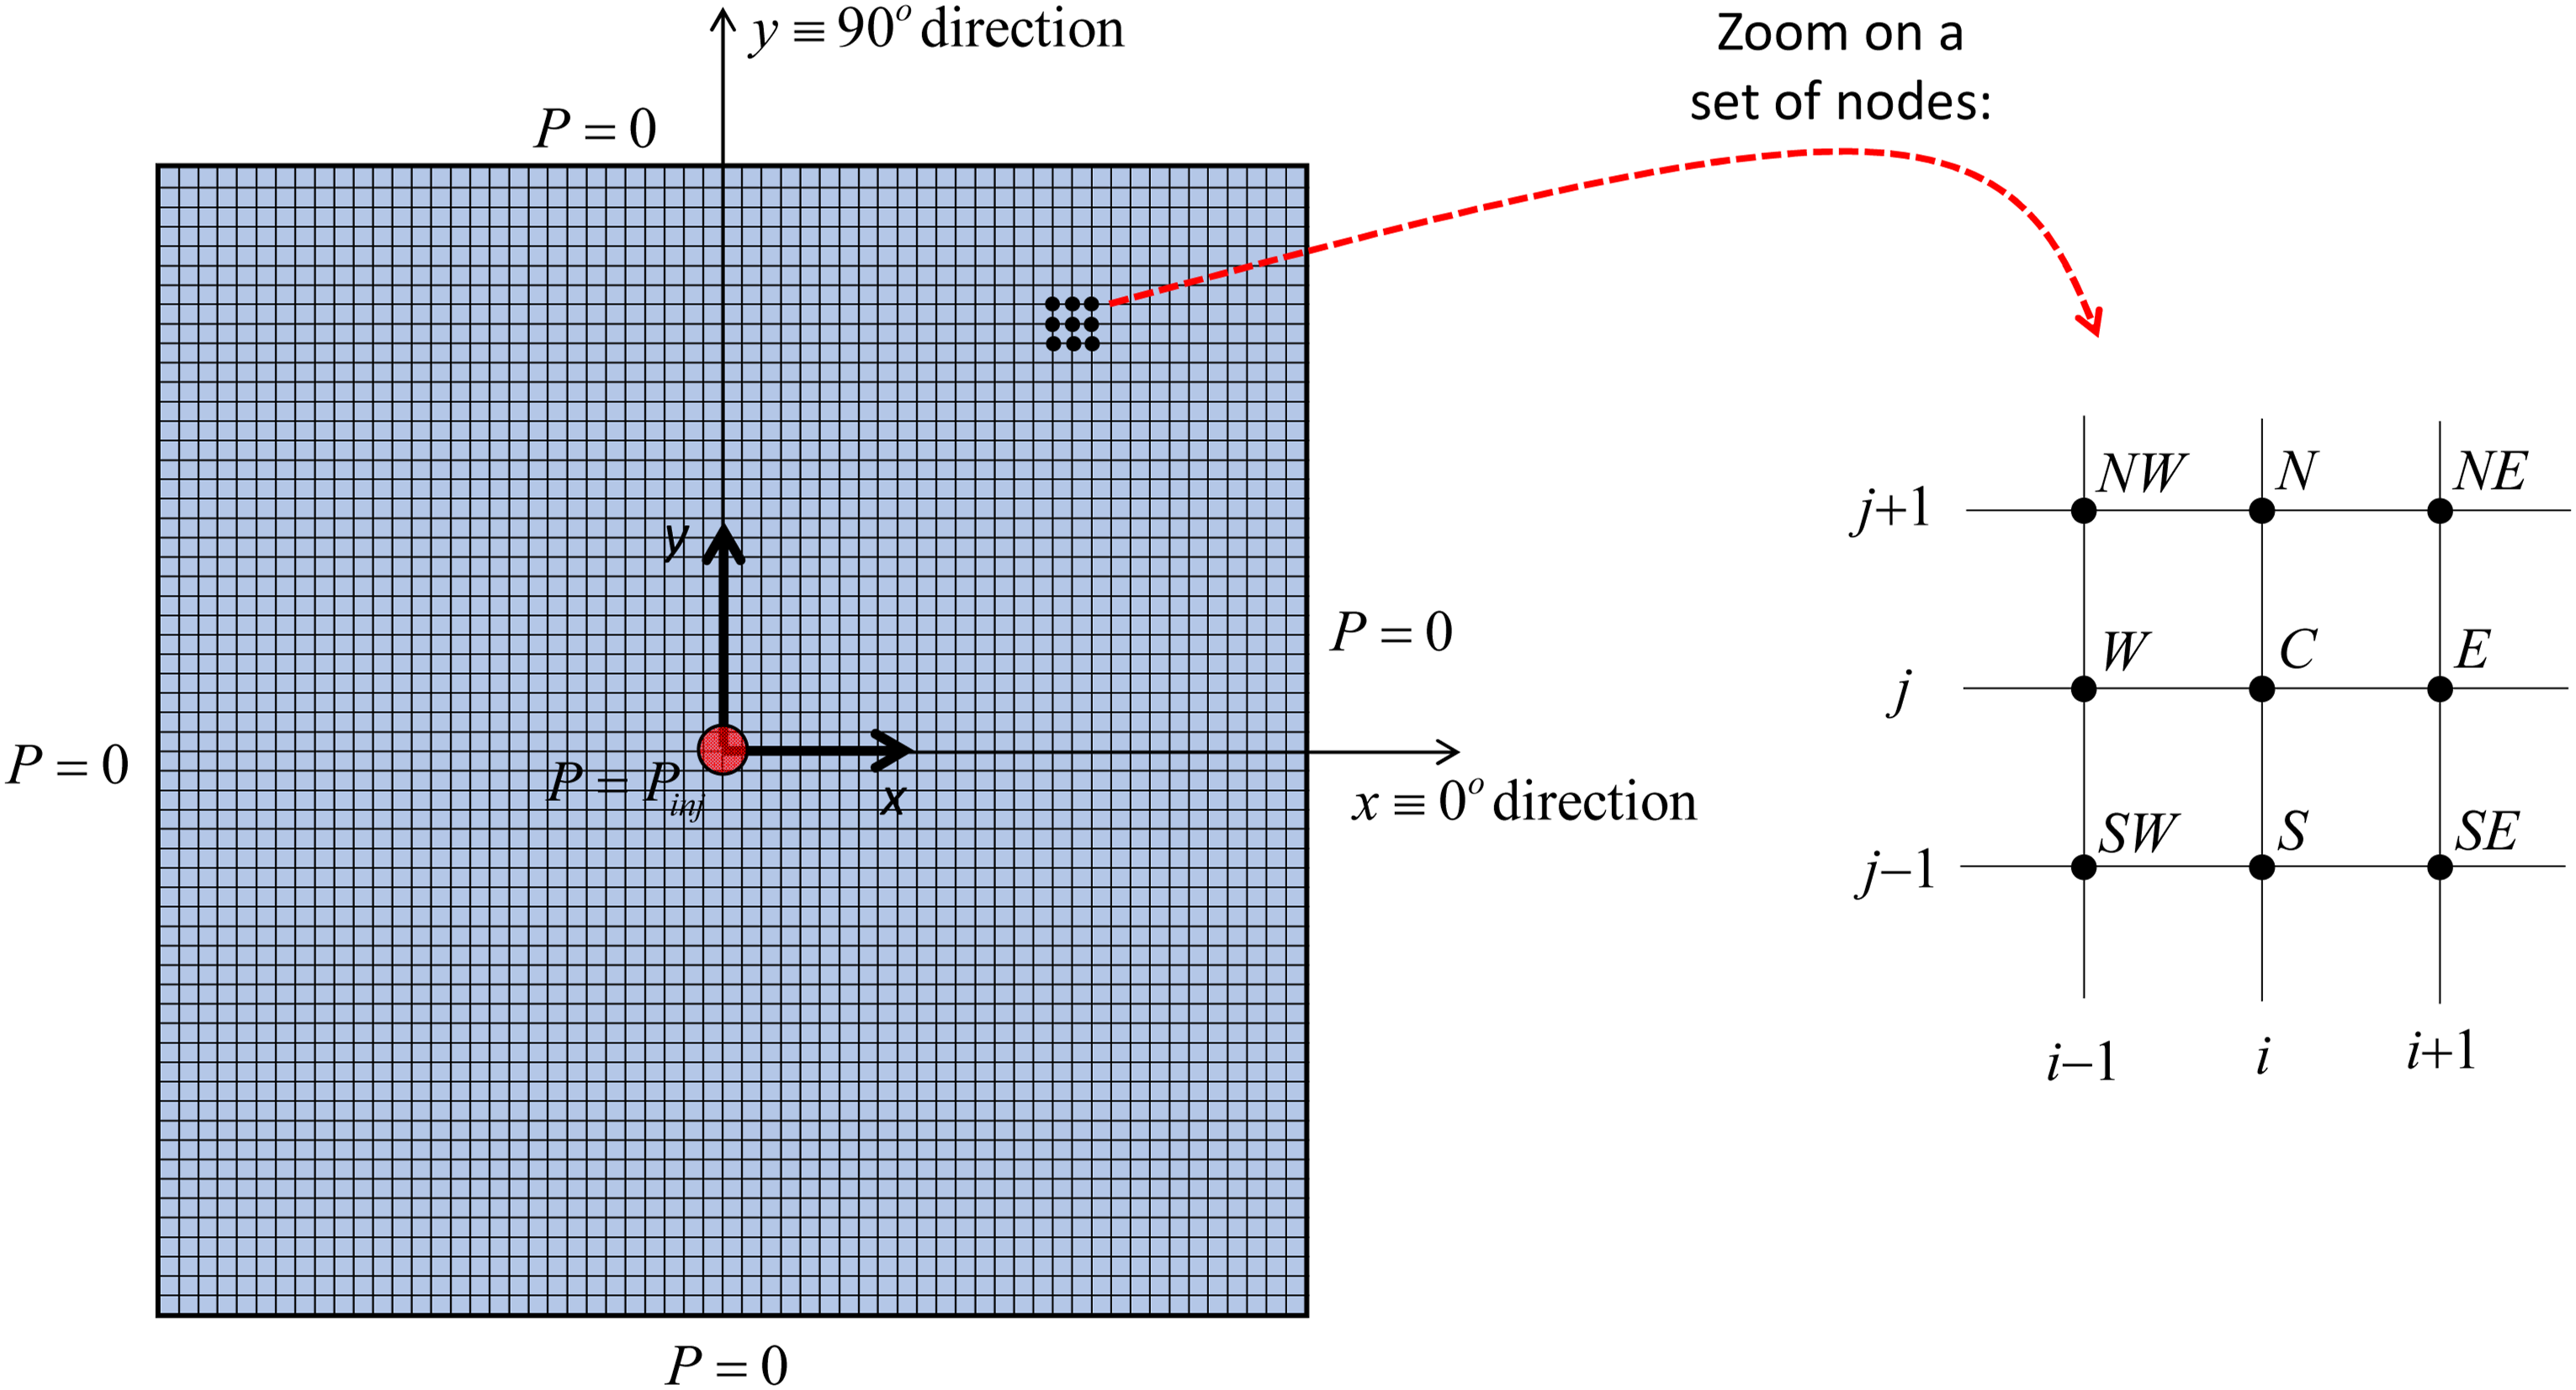
Results and discussion
Unsteady-state characterization
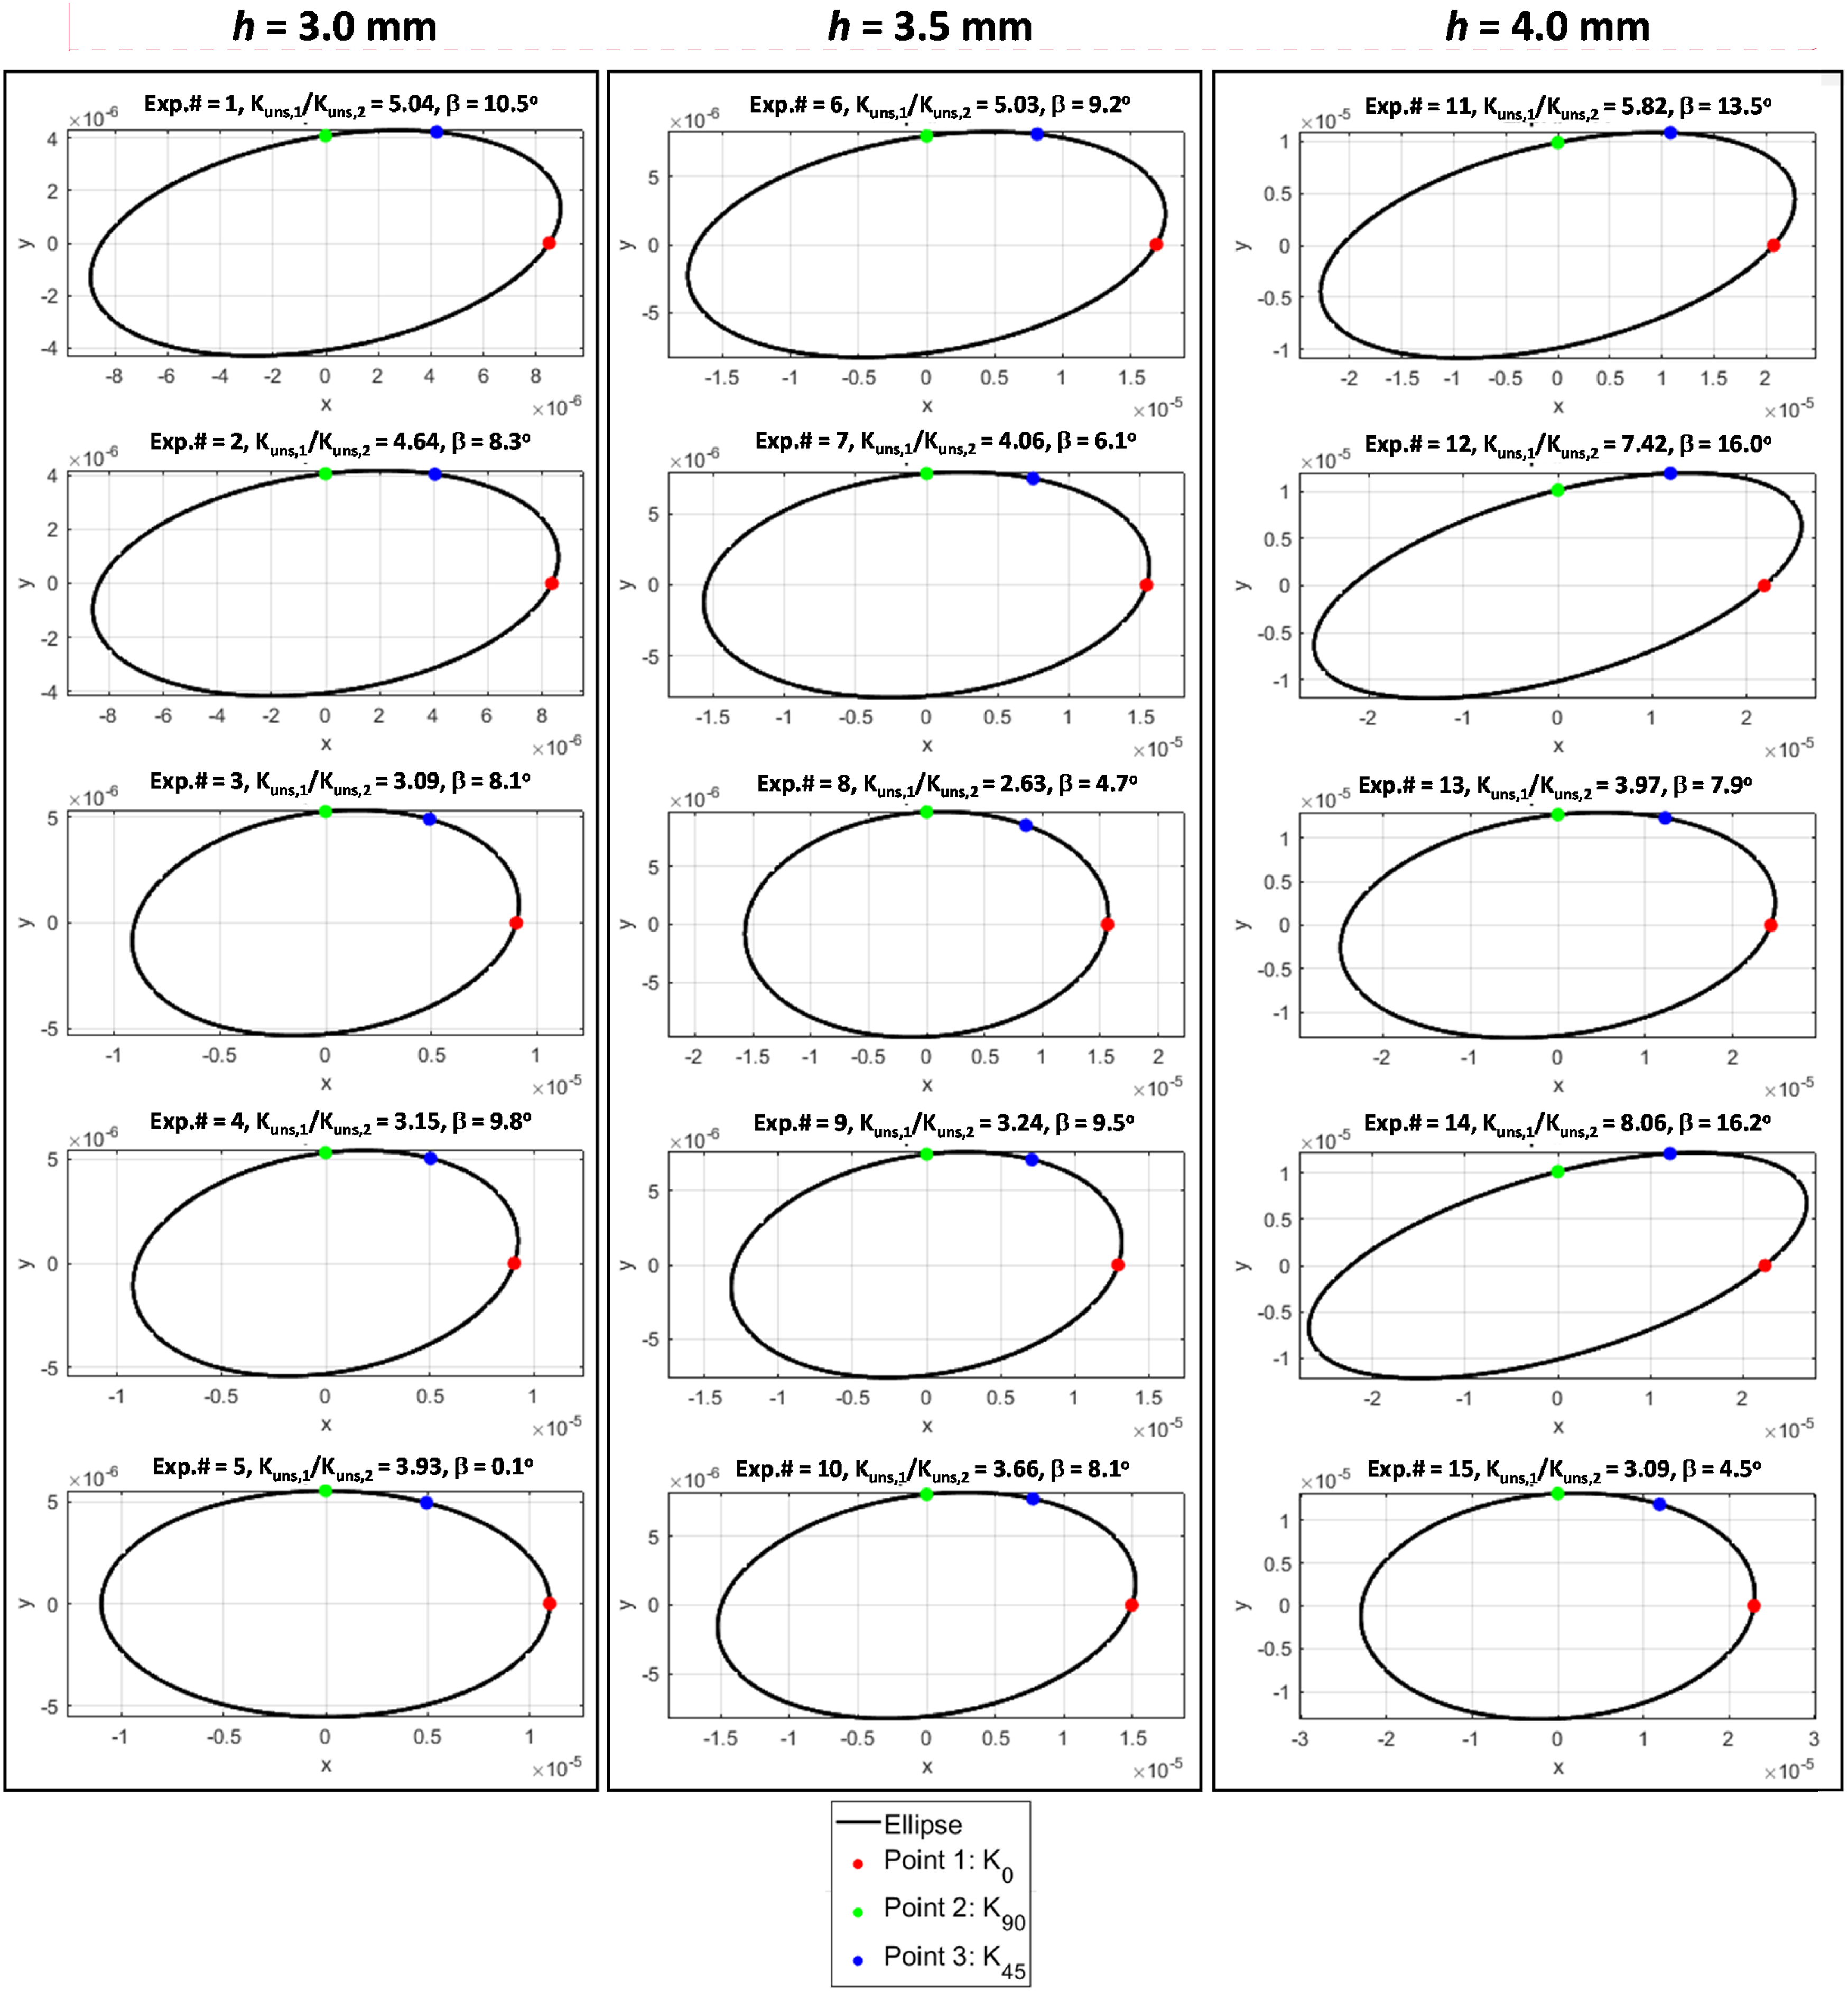
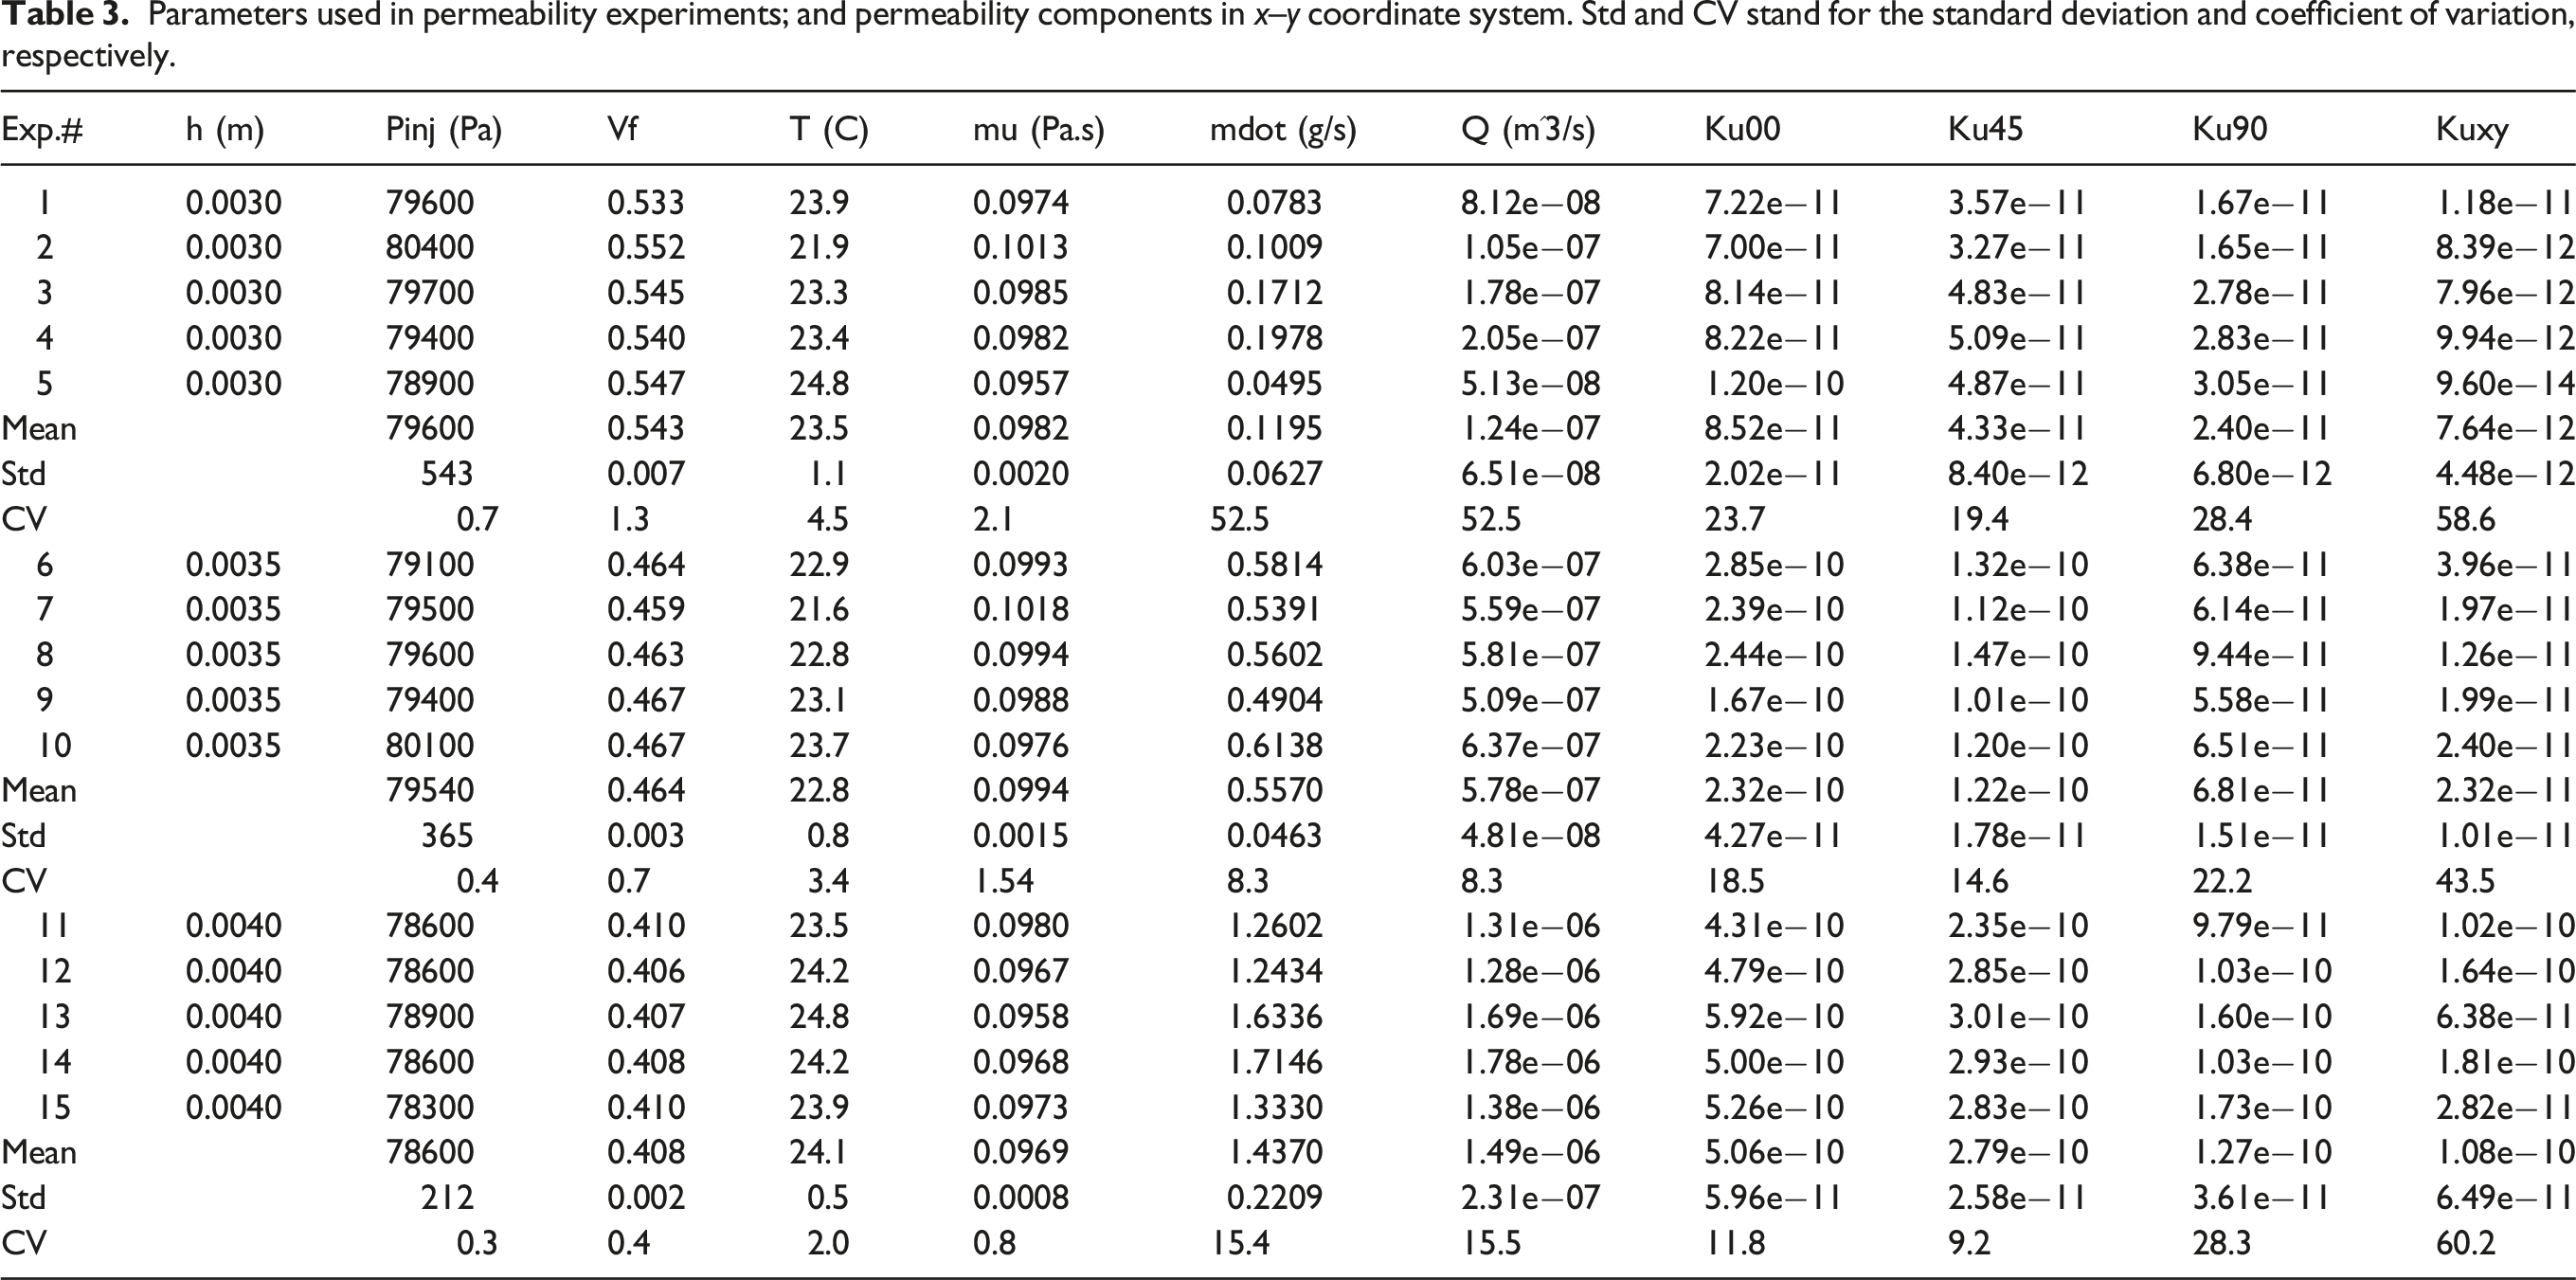
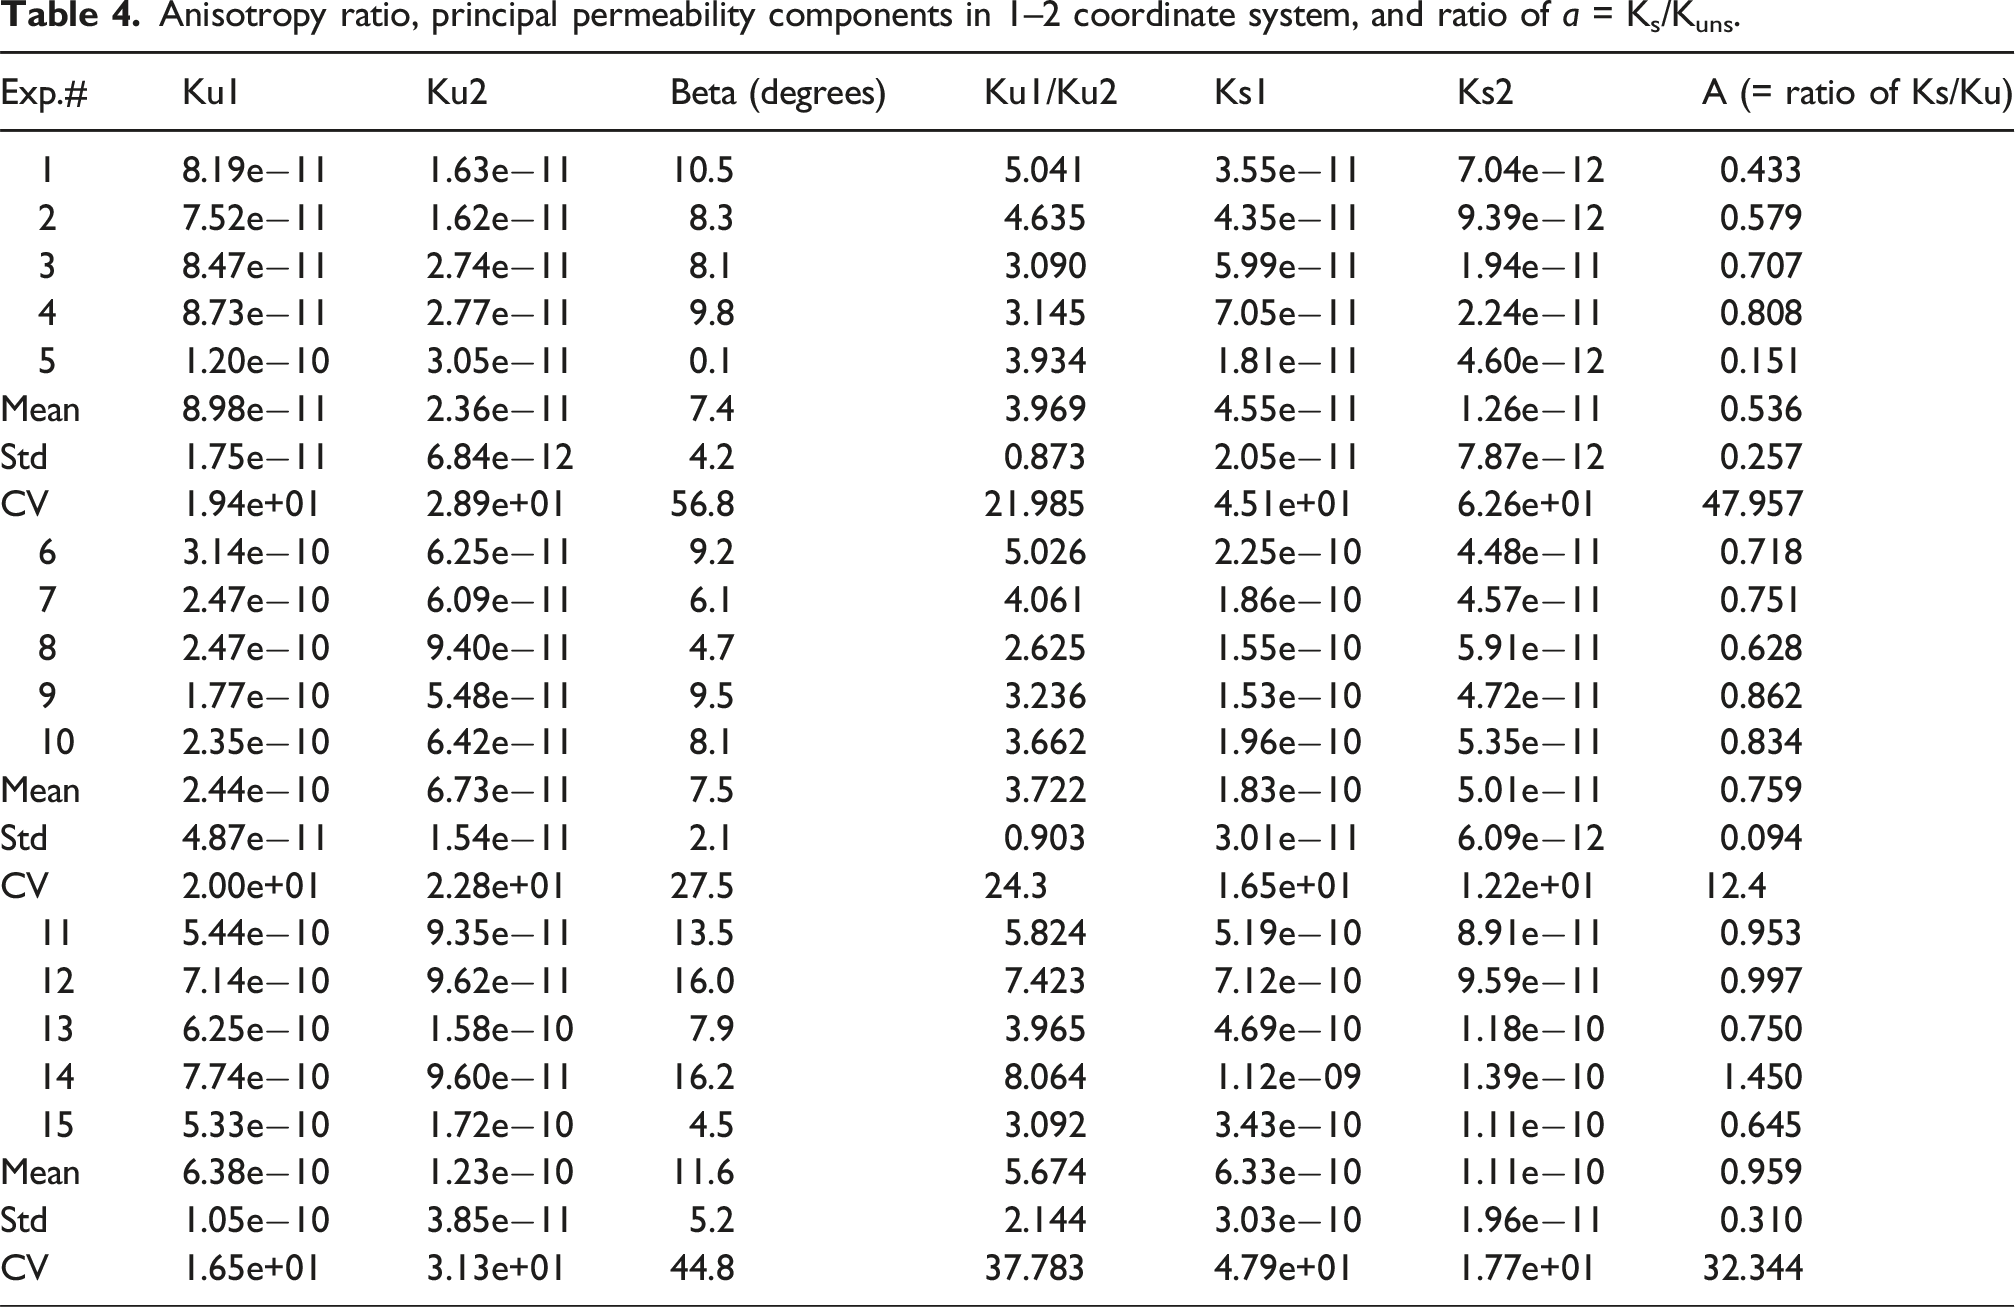
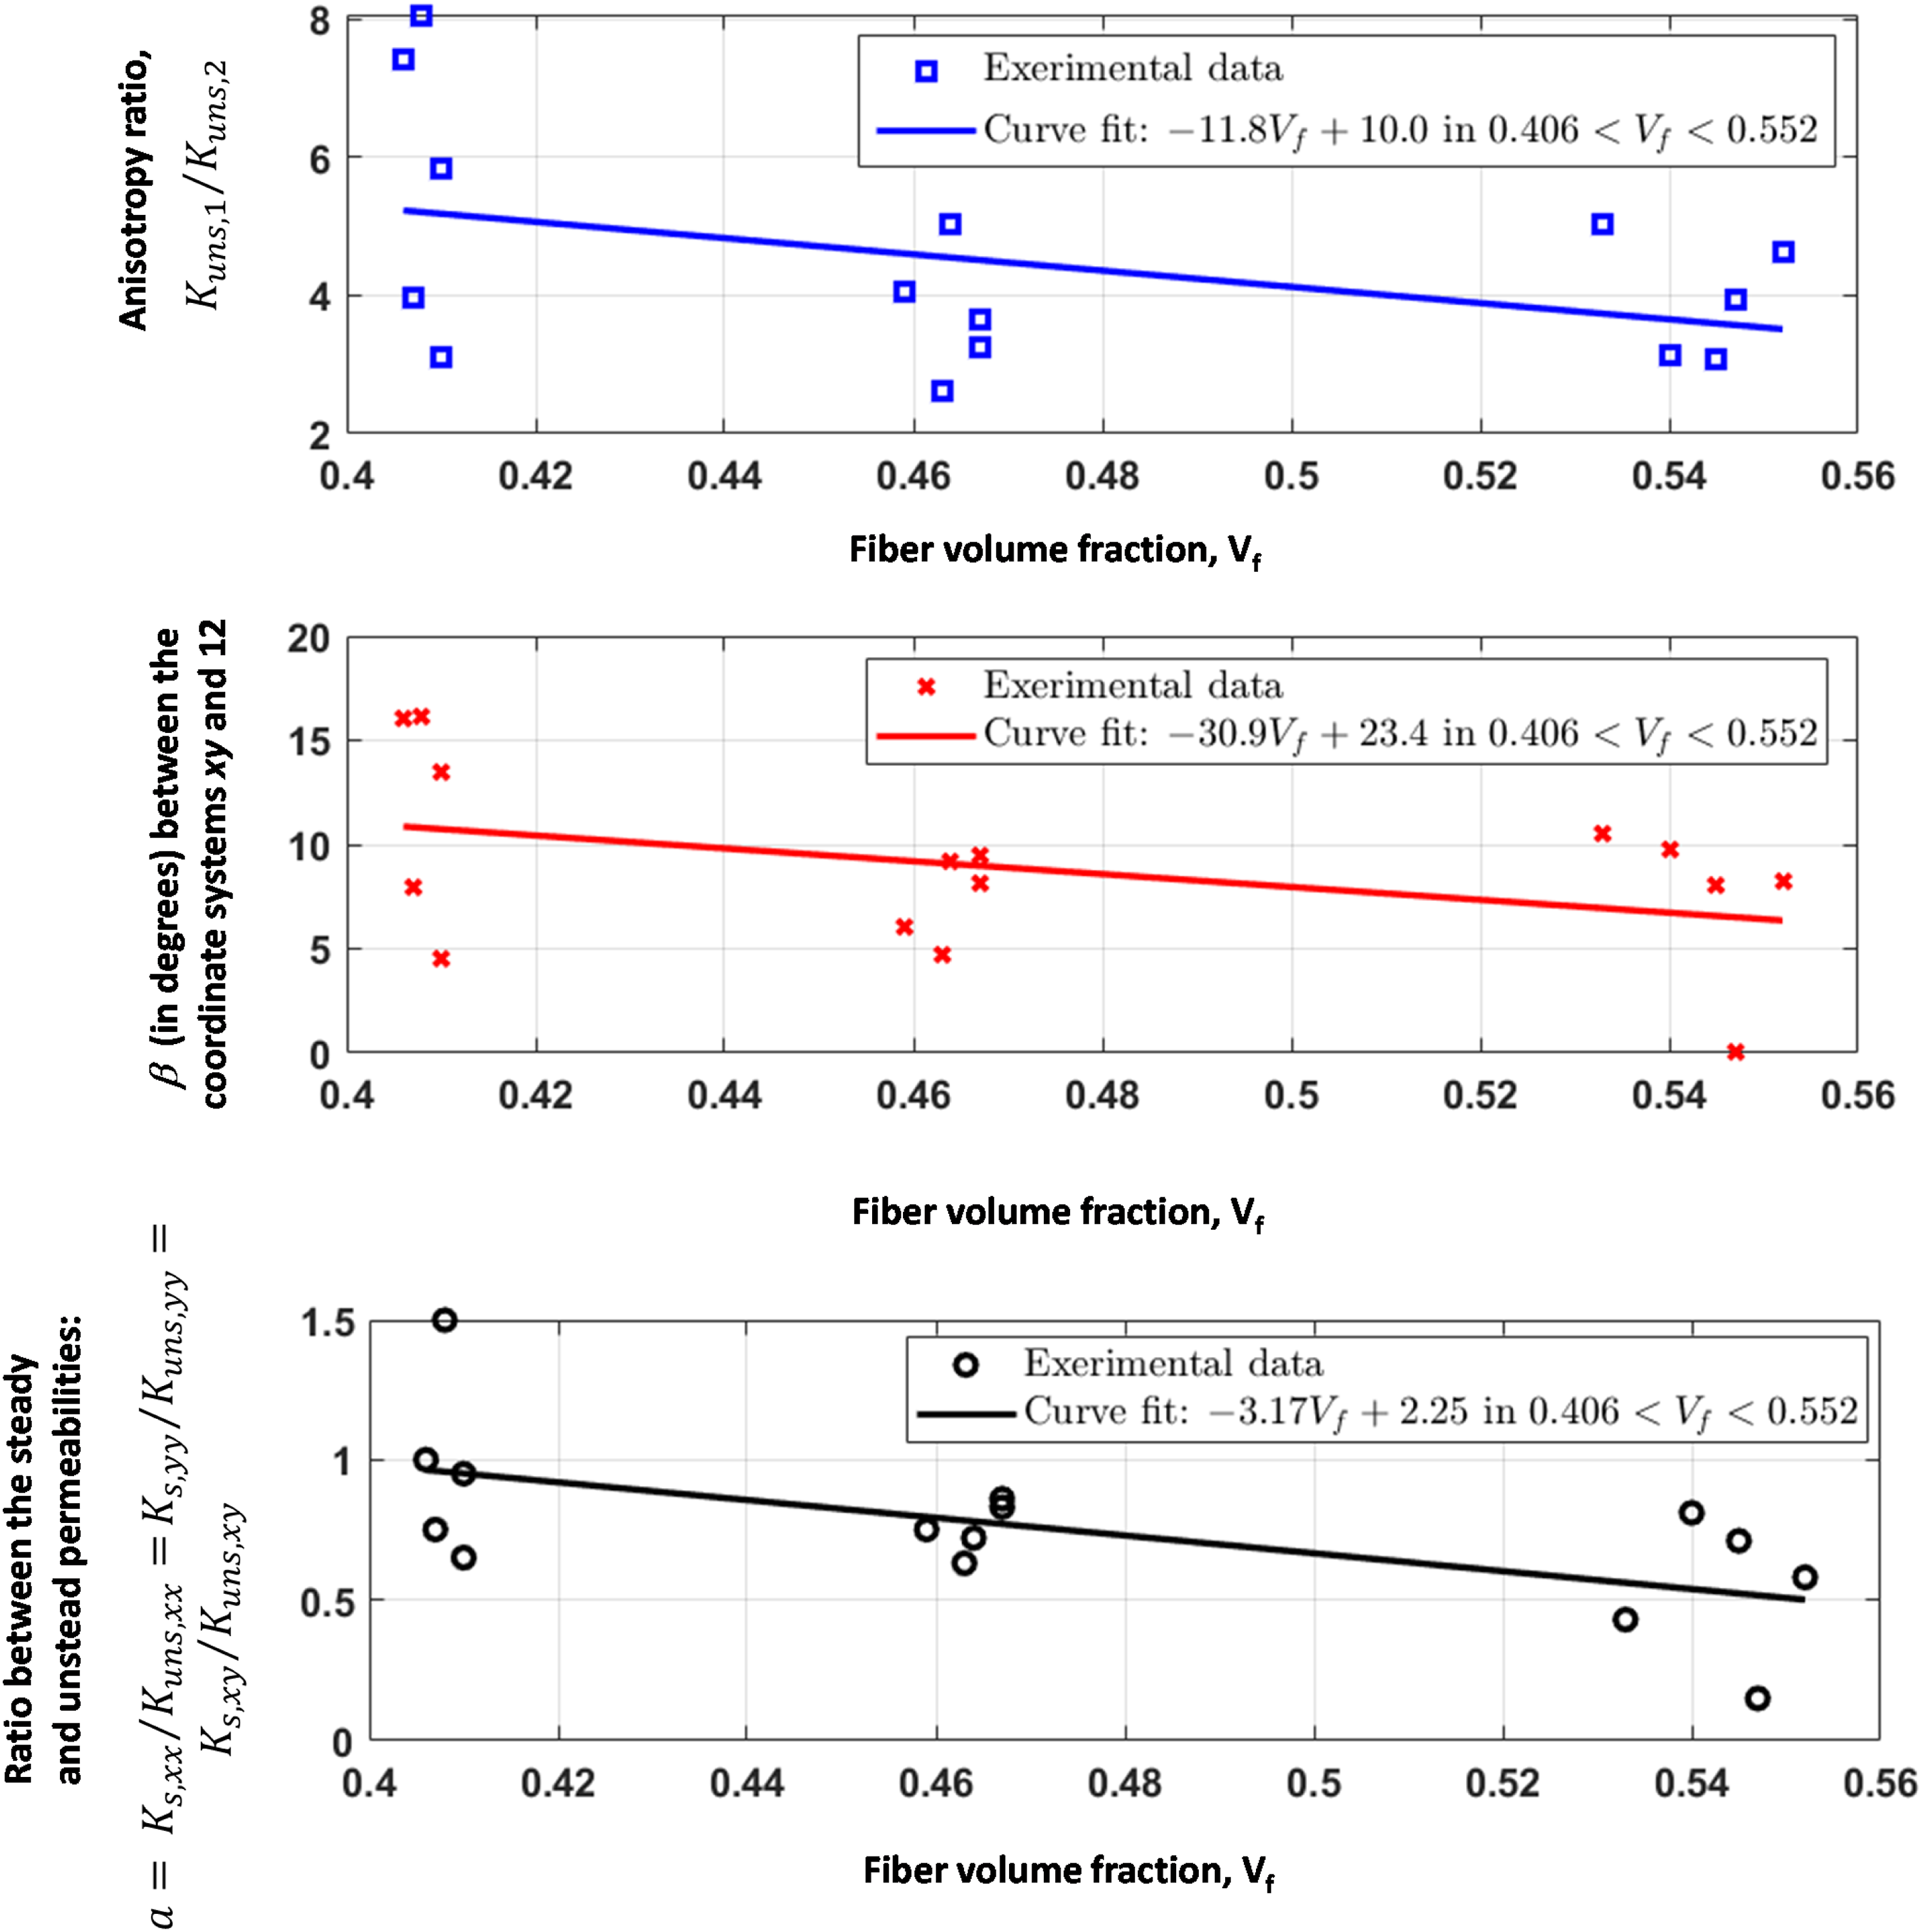
Recorded video of each experiment was post-processed to monitor the flow front propagation with time (see Figure 8 for an example). The results were discussed below. • Permeability components in x–y coordinate system: For the fabric specimen used in this study, resin flow front was an elliptical shape at any instant of mold filling due to a strong anisotropy (as seen in Figure 9 for all of the 15 experiments). This confirms that resin flow was faster in x-direction than y-direction. As seen in Table 3, • Principal permeability components in 1–2 coordinate system: As listed in Table 4, • As illustrated in Figure 10, the • For the same fabric (Metyx LT850 0/90), our results qualitatively agree with a previous study whose anisotropy ratio (the ratios of Elliptical flow front of resin at a sample instant. Analyses of the unsteady flow front propagation. Parameters used in permeability experiments; and permeability components in x–y coordinate system. Std and CV stand for the standard deviation and coefficient of variation, respectively. Anisotropy ratio, principal permeability components in 1–2 coordinate system, and ratio of a = Ks/Kuns. Analysis of the results; (top): anisotropy ratio, Kuns,1/Kuns,2; (mid) the rotation angle, β between x–y and 1–2 coordinate planes; and (bottom) the ratio between the steady and unsteady permeabilities:
Steady-state characterization
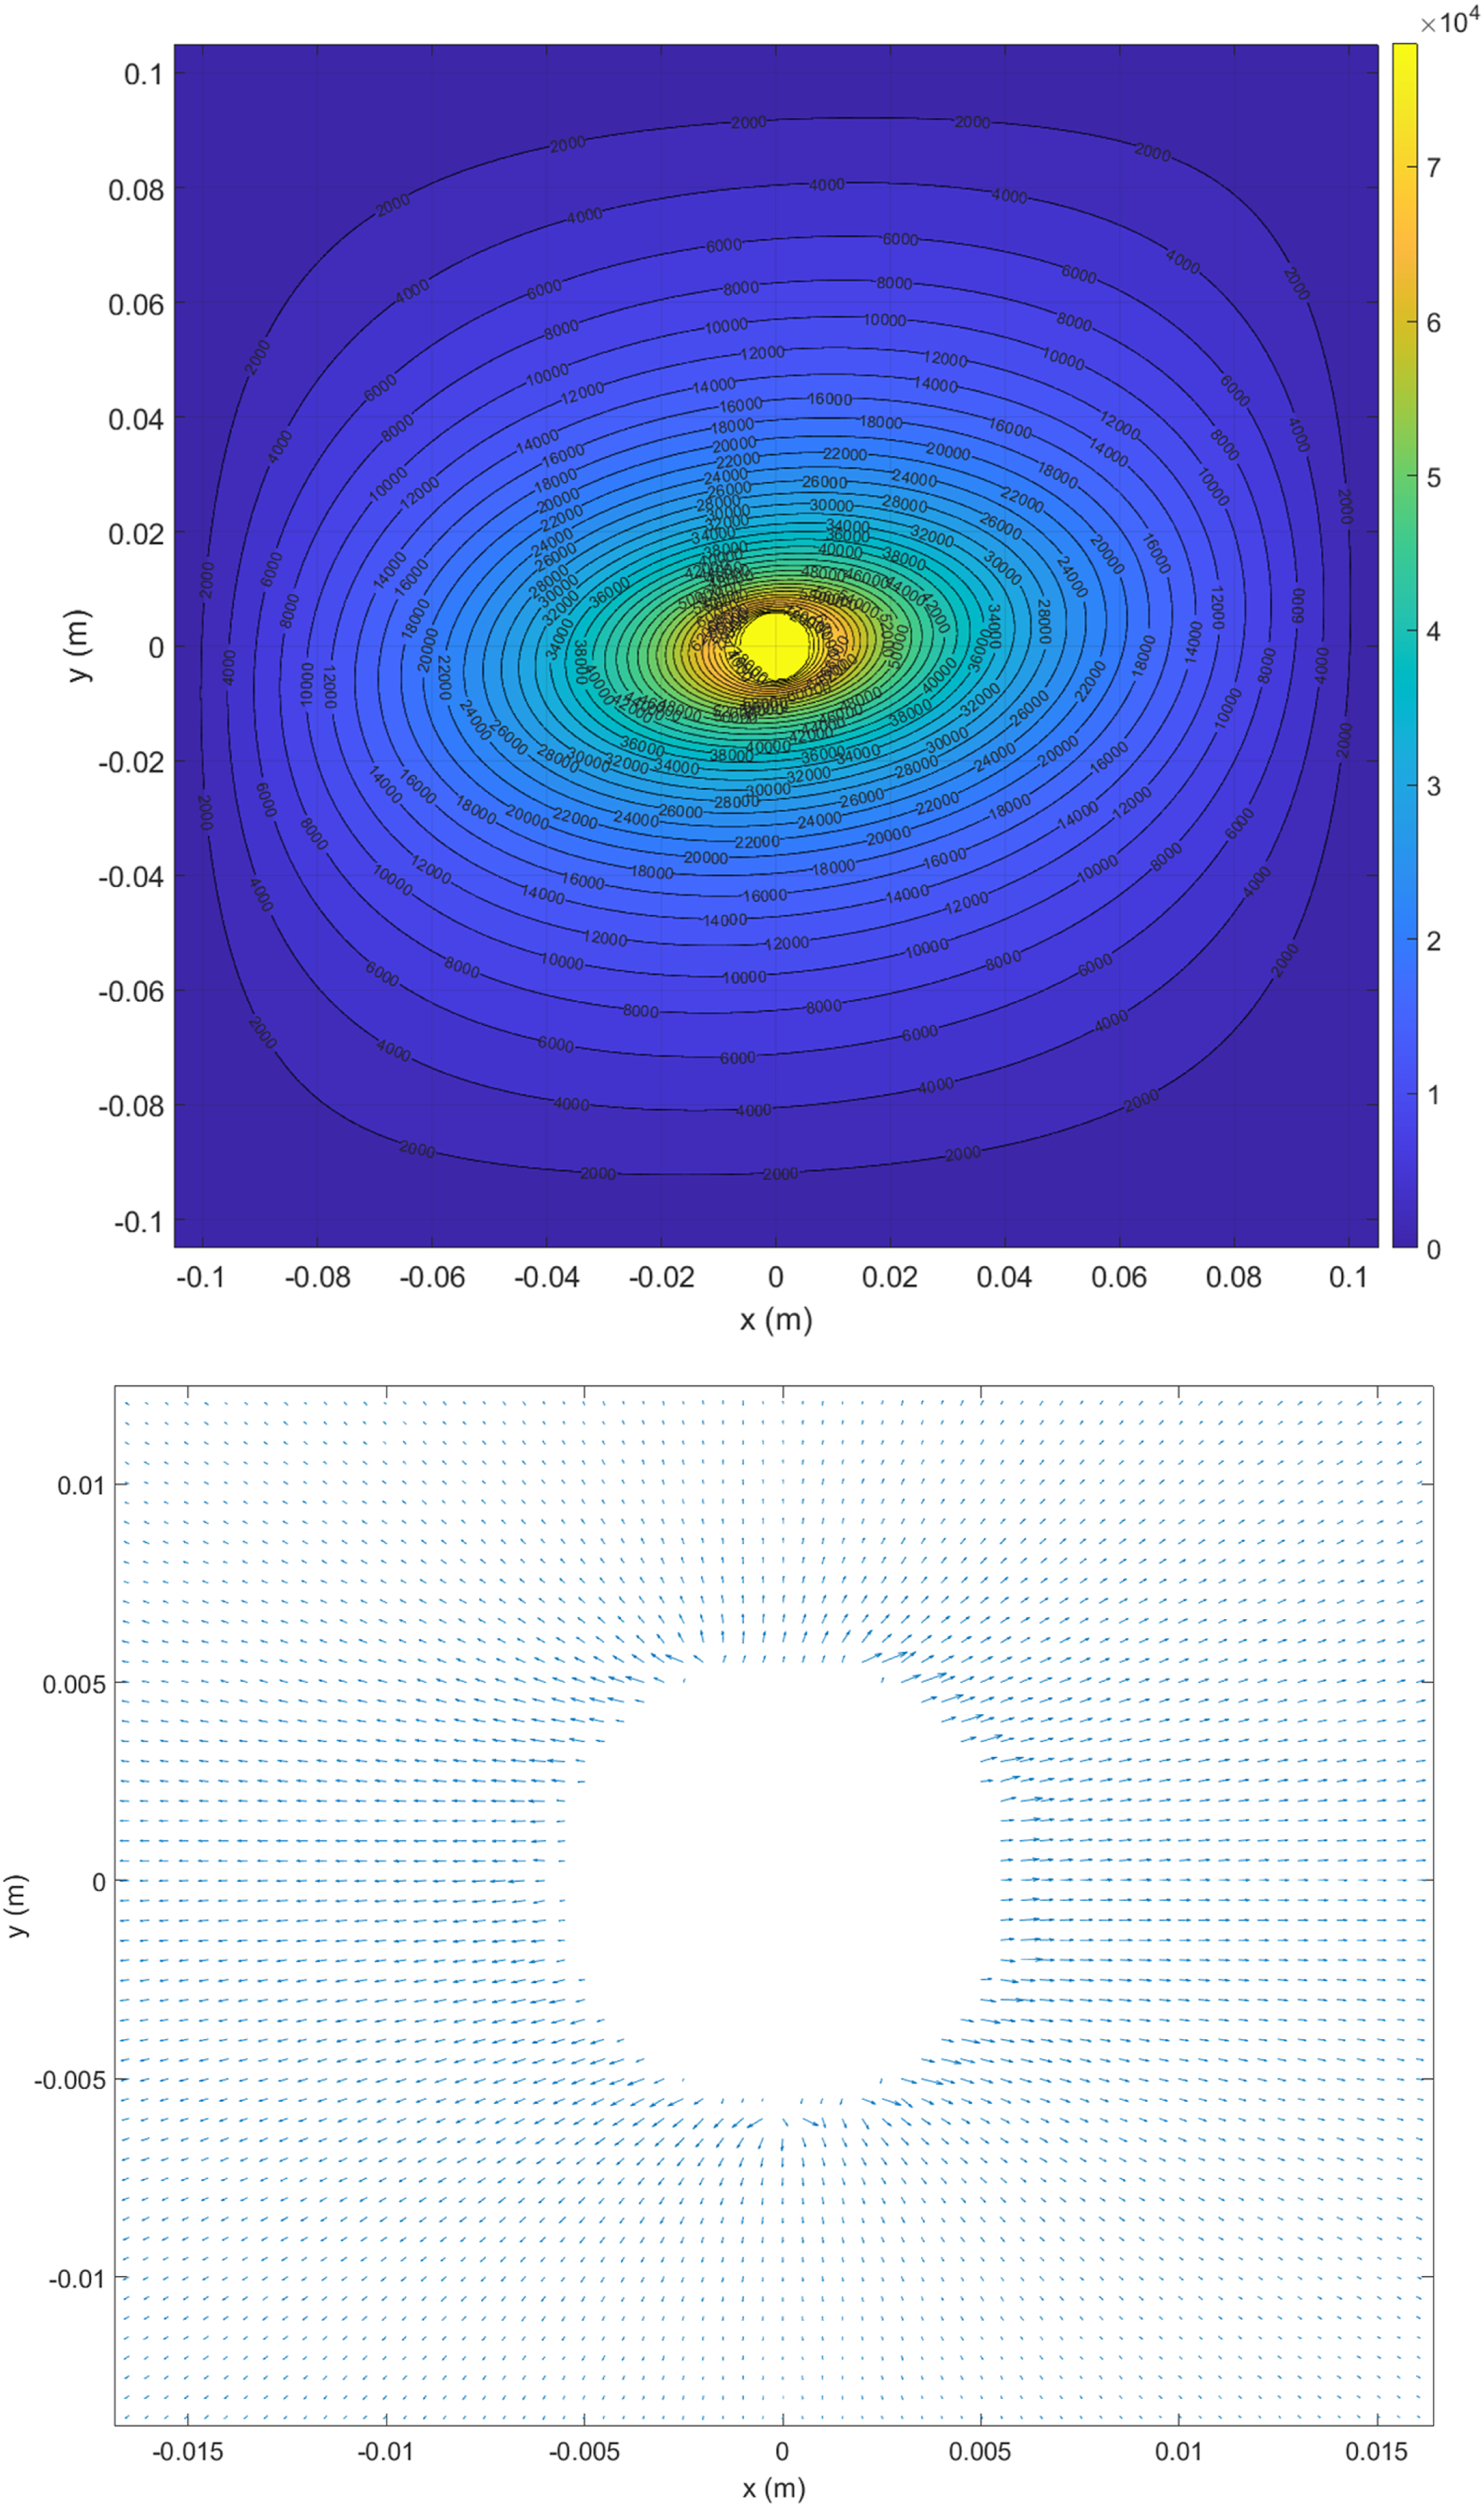
Experimentally recorded rate of change in mass, Principal permeability components: As shown in Table 4 and Figure 12, Numerically determined steady-state pressure distribution, P(x,y) in Pascals (top) and velocity field (bottom; around the inlet hole was shown here) for Experiment 7.
Comparison of the steady-state and unsteady-state permeabilities
As listed in Table 4, the • Although most findings in the literature report • This study does not provide definitive evidence for some behaviors (such as why anisotropy and the ratio of • The • Table 4 and Figure 12 show principal permeability components during both unsteady and steady flow regimes. They showcase two important observations: (i) a • Although there is considerable scatter in the experimental data (which is commonly observed in the literature and typically attributed to the nonuniformity of the fabric structure and the variability in fiber bundle placement during cutting and manual assembly), the general trend in β (rotation of the 12 system relative to the xy system) shows a decrease with increasing fiber volume fraction, which is consistent with the trends observed for the anisotropy ratio (
Principal components of unsteady and steady permeabilities of the fabric preform.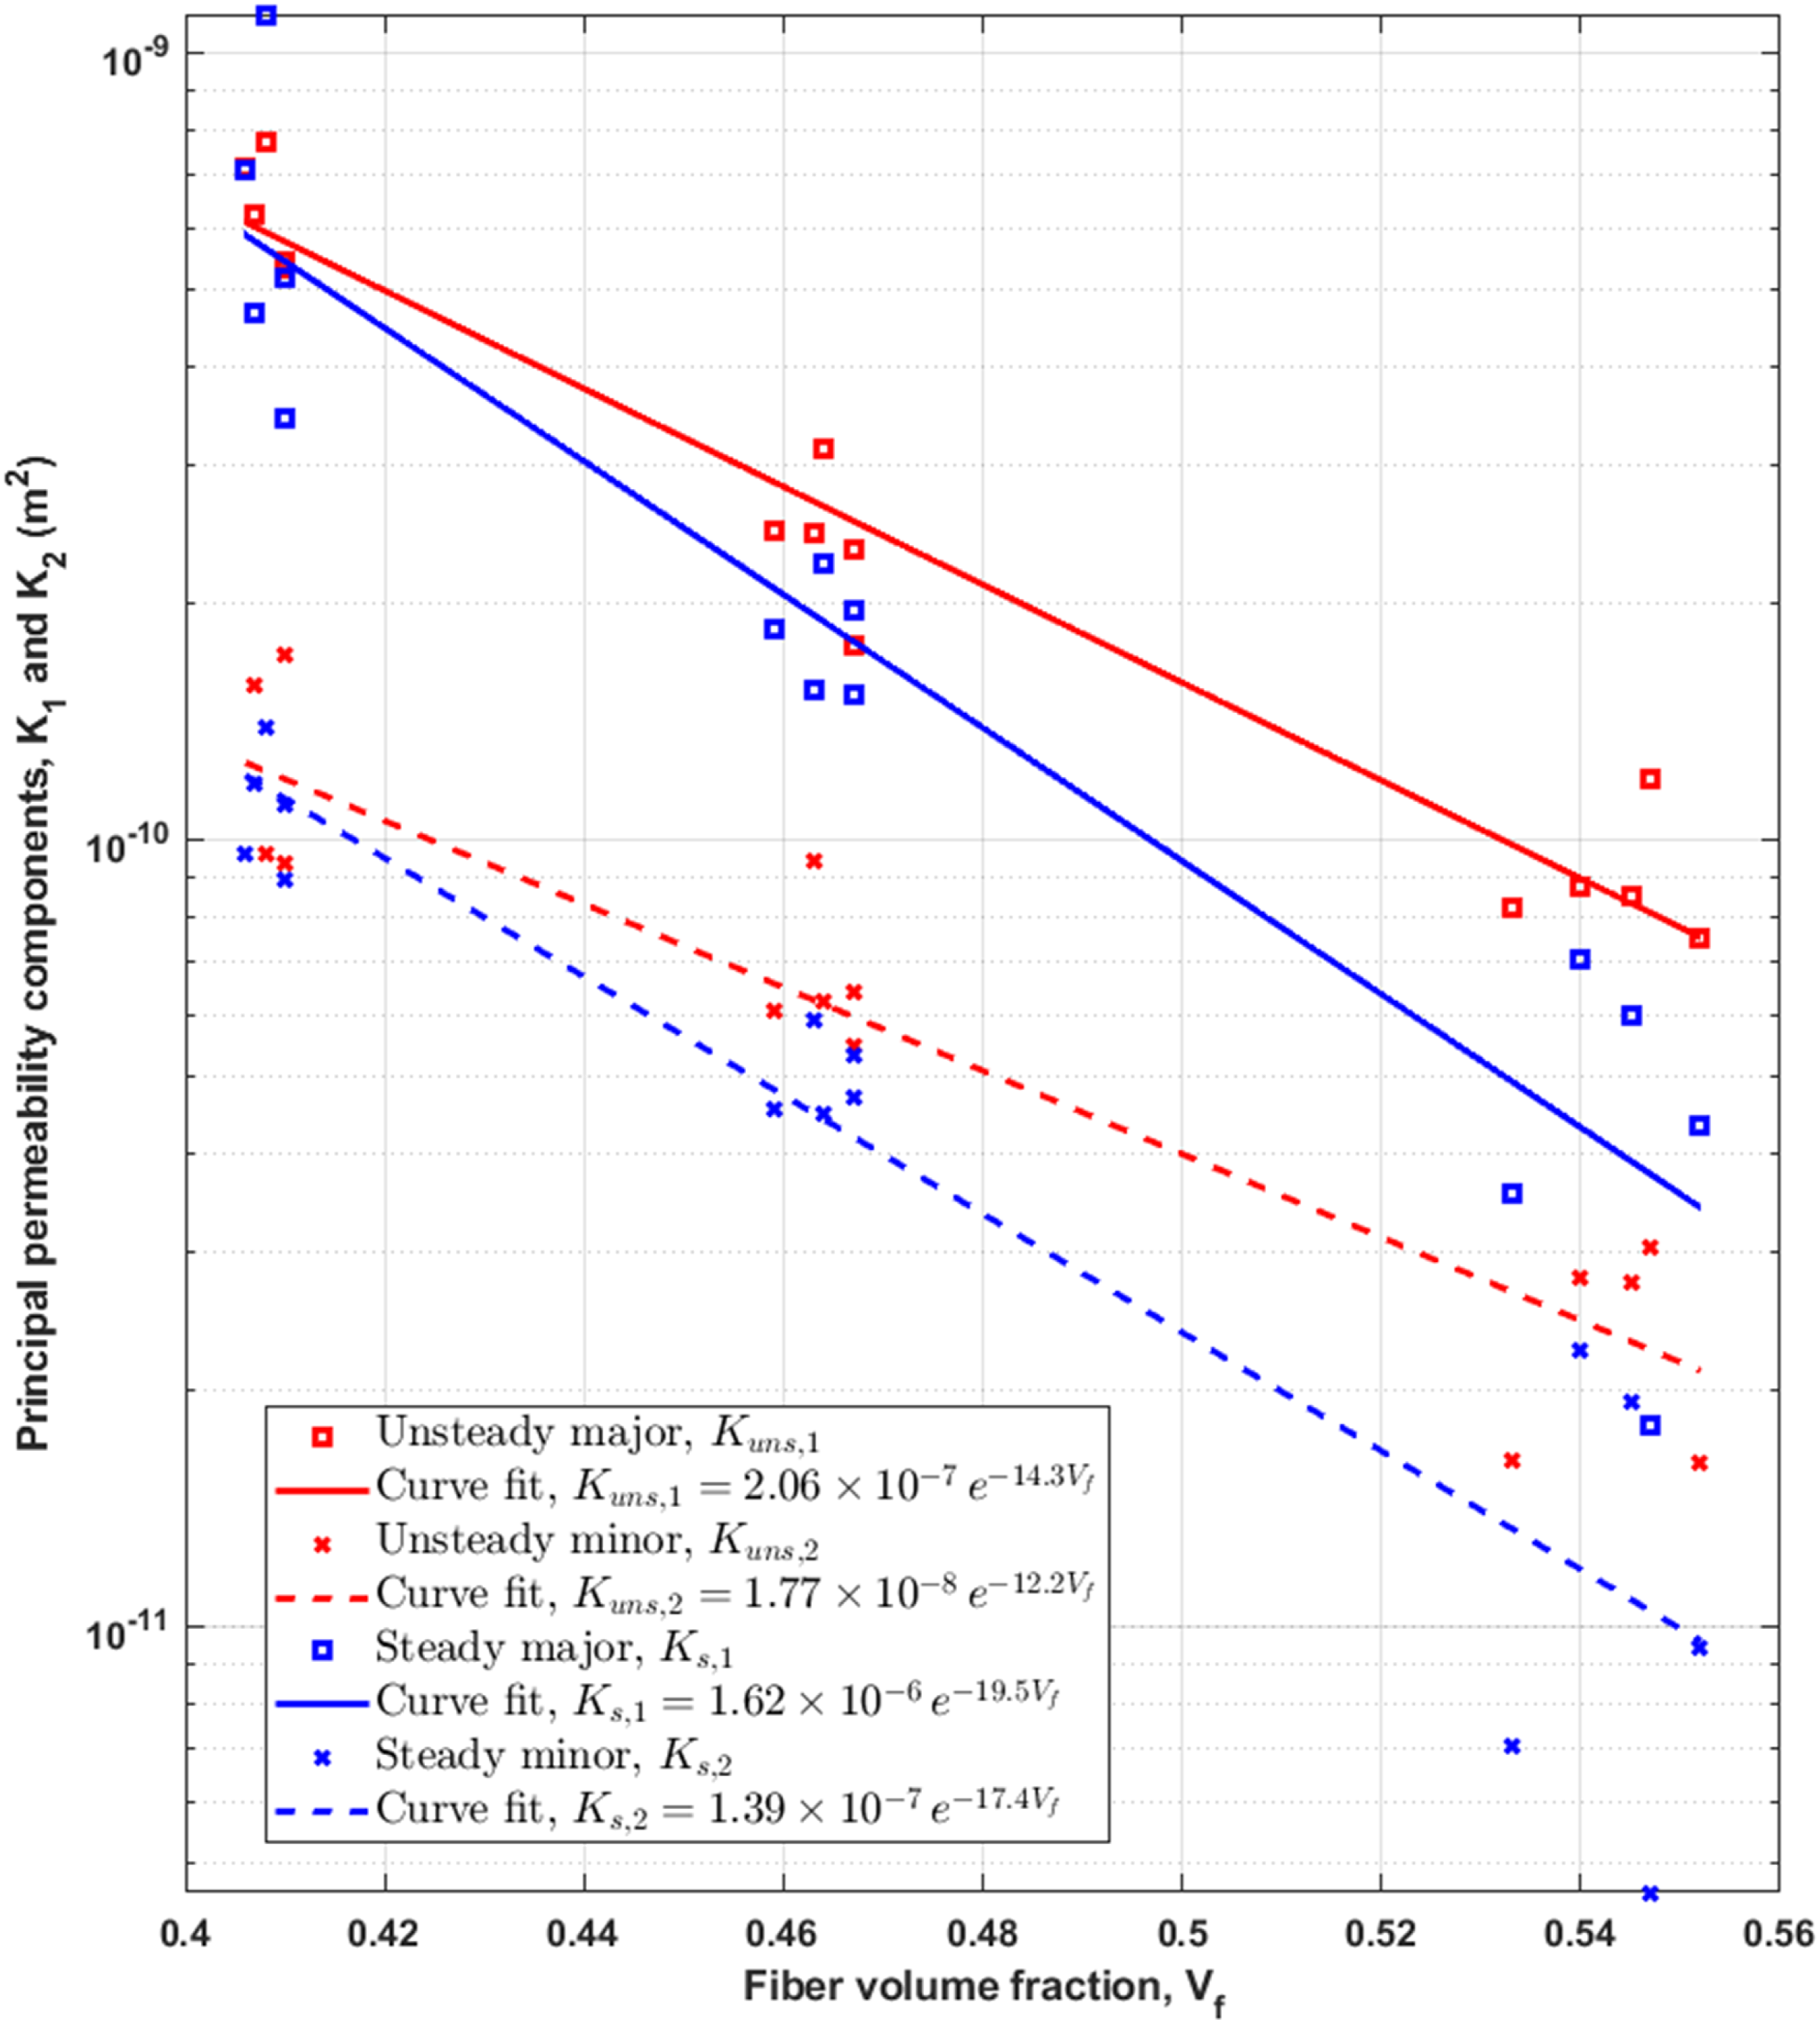
Comparison with literature
In general, Yenilmez et al.
24
and Yalcinkaya et al.
25
utilized the same biaxial fabric as this study. When used in Vacuum Assisted Resin Transfer Molding (VARTM), both previous studies found that the arrival of the flow front led to a reduction in thickness, caused by increased fiber nesting due to the lubrication effect. Consequently, the unsteady permeability of this biaxial fabric was anticipated to be higher than the steady permeability. Yalcinkaya et al.
15
reported that the unsteady 1D permeability of same biaxial fabric (eight layers of biaxial fabric in a domain of Diallo et al.
26
found the steady permeability consistently smaller than the unsteady permeability. On the other hand, another study
27
indicated that the ratio of average unsteady permeability to steady permeability
Comparison of the results from this study for 5-layer specimens under 2D (radial) experiments with those from a previous study by Yalcinkaya et al.
15
for 8-layer specimens under 1D experiments, using the same fabric. Note that only the permeability component along the x-axis was compared, as their analysis was conducted exclusively in that direction.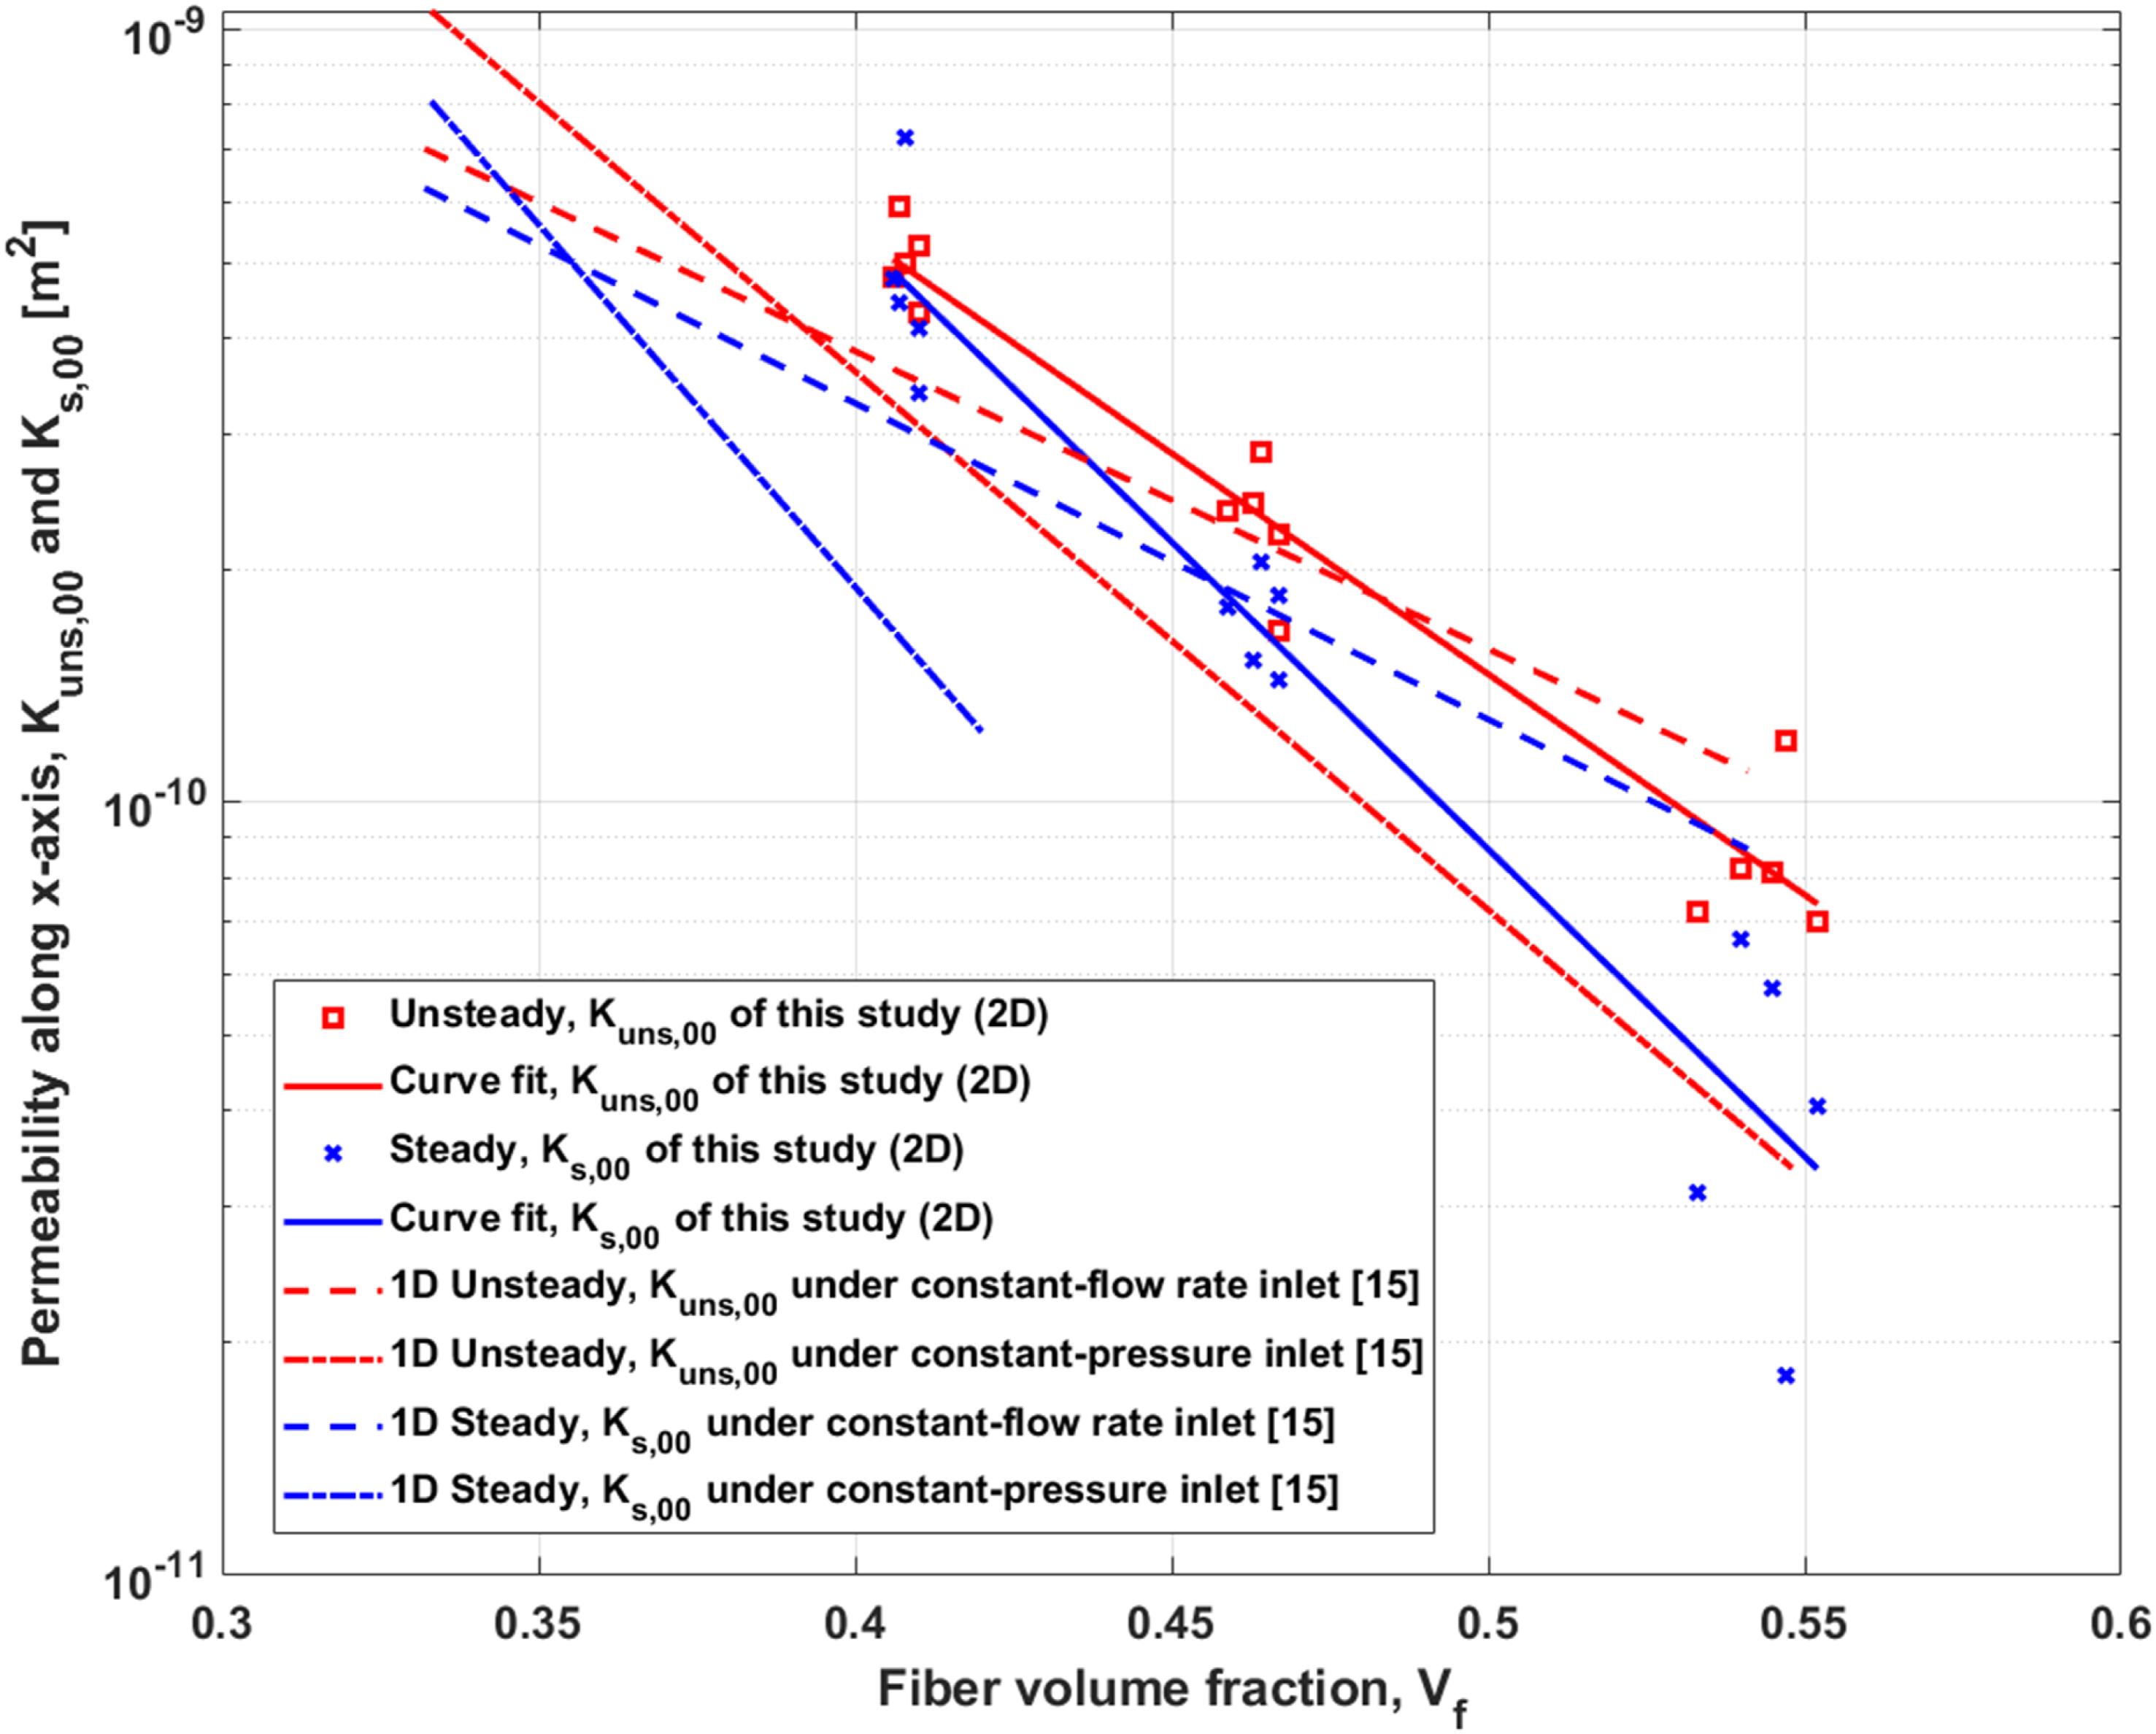
Conclusions
The 2D permeability of a 5-layer biaxial fabric preform was investigated under radial flow and central constant-injection pressure boundary condition at fiber volume fractions of
For steady permeability, a straightforward but yet effective approach was proposed here in this study. It was a combination of experimental data (flow rate) and an iterative numerical analysis. Steady permeability of a porous fiber structure is needed for stages such as resin-bleeding that takes place after resin arrival to all exit vents and thus steady resin flow occurs. This study will be helpful to measure 2D steady permeability components with the following steps: (1) it is assumed that the anisotropy ratio of unsteady permeability components and the rotation angle between x–y and principal 1–2 axes remains unchanged at steady state, and (2) permeability values are numerically iterated by calculating exit velocity components along all edges and matching the corresponding outflow rate (Qnumerical) to the experimentally measured flow rate in the characterization experiment (Qexperiment). Our characterization approach provides a time-saving approach for analyzing anisotropic preforms (compared to a set of 1D characterization experiments which are approximately twice time-consuming to conduct).
The anisotropy ratio,
All experiments except one (14 out of 15 experiments) resulted in a smaller steady permeability than the unsteady permeability. The ratio of steady to unsteady permeabilities,
To assess the scatter of permeability values, we calculated the variation with standard deviation (std) and coefficient of variation (CV) as presented in Tables 3 and 4. Various potential sources contributing to this observed scatter can be due to (1) fabric deformation during sample preparation, (2) material non-uniformity (caused by the irregular fabric roll and varying nesting of fabric layers during the stacking and compaction), and (3) non-repeatable labor (cutting and placement).19,28,29
In summary, this study provides valuable insights into the permeability behavior of biaxial fabric preforms. The proposed numerical solution allows determining in-plane steady state permeability calculation for circular or square molds (even though the flow front propagation and pressure distribution are elliptical). It provides straightforward computation of numerical volumetric outflow rate by using the unsteady permeability tensor, and then scales it to match the experimental flow rate. This approach can be utilized to improve the design and manufacturing of composite structures, especially during the resin bleeding (which is a quasi-steady control action usually used to settle the pressure and thickness distribution). The novel numerical approach presented here offers a promising tool for straightforward and yet effective permeability characterization of anisotropic materials, enhancing the understanding and prediction of composite manufacturing processes.
Footnotes
Funding
The authors received no financial support for the research, authorship, and/or publication of this article.
Declaration of conflicting interests
The authors declared no potential conflicts of interest with respect to the research, authorship, and/or publication of this article.
Data Availability Statement
Data sharing not applicable to this article as no datasets were generated or analyzed during the current study.