
Abstract
Low velocity impact on adhesive joints represents a worst-case scenario in a bonded structure, so their residual tensile strength is a crucial indicator for damage tolerance of the bonded structures. In this study, narrow double lap joints were tested under two transverse impact energy levels to provide a conservative assessment of damage tolerance. Residual tensile tests were conducted after impact, showing a 49% reduction of pristine joint strength after a 2J impact, and a further reduction (57% of pristine joint strength) post a 3J impact. Residual tensile strength of impacted double lap joints was found to correlate to that of the joints with a similar artificial defect length and location near the inner adherend. The failure mechanisms in the double lap joints were explained via X-ray computed tomography and high-speed photography. 2D FE models were developed using surface interactions based on a virtual crack closure technique in ABAQUS Standard. The FE models capture the residual tensile strength reduction trend, confirming the underlying mixed-mode fracture-controlled failure mode influenced by the asymmetrical damage and loading.
Introduction
Adhesive failure under impact and with disbonds
Literature on the impact performance of adhesive joints with composite adherends has been more limited compared to static loading. Most adhesive joints are designed to carry in-plane loads, but the damage mechanism during transverse impact and how this interacts with in-plane failure is not well understood. The existing works on residual strength of bonded composite joints post impact were mainly based on Single Lap Joints (SLJs). Low velocity transverse impact tests on composite SLJs and the corresponding residual strength tests were carried out by Farrow et al. 1 The specimen was a plate which was clamped at all edges. No adhesive bondline failure was reported, and delamination occurred instead. From the tensile tests on the impacted specimens a 50% reduction in the static tensile strength was found. It also showed that the critical case was when impact was applied close to the leading edge of the joint. Vaidya et al. 2 provided a summary for SLJs under transverse impact. They stated that the peel stresses caused by the eccentricity of the loading path caused significant bending in the adherends, which was more critical to the joint performance than the shear stresses. The authors stated that the peel stresses arising from impact are critical to failure due to the low through-thickness properties of the composite. The failure initiated under mixed-mode conditions compared to the in-plane test case where it was more shear dominated. Low velocity transverse impact tests were conducted by Kim et al. 3 on woven glass/epoxy SLJs bonded with adhesives. The authors stated that high shear stresses developed under the impact point forming localised debonding and interlaminar damage in the adherends. Debonding was also reported on the opposite side of the plate from the impact application due to high peel stresses. These failures were very difficult to detect visually, and a threshold impact energy was reported by the authors. Park et al. 4 analysed the effects of transverse high velocity impact tests on adhesively bonded composite SLJs using hailstones. The authors reported a threshold energy at which failure initiated for the composite joints. Past the threshold energy, the failure was catastrophic and delamination in the plies adjacent to the adhesive layer was the dominant failure mode. Wu et al. 5 conducted three-point bending tests and low velocity impact tests on SLJs. Initially, the load increased linearly with deflection. Due to the high peel stresses induced on the SLJ with the indentation force, cracks initiated at the edge of the SLJ which resulted in a load drop. The crack then propagated towards the ends of the joint until it failed completely. Thermal aging of bonded glass fibre composite joints post transverse impact was studied,6,7 showing a significant reduction of joint strength at high temperatures. Woven fibric SLJs were tested under transverse impact by Choudhry et al. 8 but no residual strength tests were done.
Compared to SLJs, a double symmetrical joint can reduce the tendency of bending under tension. There was only one experimental work found on a double strap joint subject to two transverse impact energy levels. 9 The specimens were fully supported by a flat pneumatic holder during impact and then tested under three-point bending post impact. It was not reported what impact damage was caused. No numerical modelling was done to the double strap joints tested.
There are limited studies of the influence of manufacturing defects or disbonds within the adhesive on joint strength. Ribeiro et al. 10 found that the adhesive type had a significant influence on the SLJ strength, for which the brittle adhesive failed at the limiting stress due to the inability to undergo plastic deformation. A more flexible adhesive failed at stresses close to global yielding. Fatigue of SLJs with defects at the adhesive/composite interface was investigated by Liu et al.. 11 Using a peel ply surface treatment and surface 0° ply, an initial crack propagated along the adhesive/composite interface followed by secondary cracks initiating and propagating at the opposite end. The fatigue disbond cases were subject to mixed-mode loading conditions.
Failure in adhesive joints: Modelling
Having accurate failure prediction tools for adhesively bonded joint failure is critical for a safe design. Volkersen 12 proposed a simple shear lag model, being the first to develop an analytical solution for adhesively bonded joints. This was based on 1-D adherends and assumed shear deformation in the adhesive layer in the longitudinal direction and uniform stress through the thickness of the adhesive layer. It was essentially a spring that only transfers the longitudinal forces from the inner adherend to the outer adherend by shear. Then Goland and Reissner 13 considered both shear and transverse normal deformation in the adhesive layer for a joint consisting of two beams, predicting the shear stress distribution accurately. Although these analyses provided advances in the stress analysis for adhesive joints, there were limitations, 14 such as not accounting for the variation of through thickness stresses in the adhesive.
Hart-Smith 15 considered the adhesive plasticity, giving analytical stress solutions for elastic-plastic as well as linear elastic adhesives. To study the effects of adherend deflection on the adhesive shear stress distribution, Oplinger 16 developed a layered beam theory. Tsai et al. 17 modified the analytical model for adherends with low transverse shear modulus such as composites, due to the large shear stresses present on the adherend surfaces.
Finite Element (FE) models have been developed to predict joint failures. The classical approach using continuum mechanics is to compare the material allowable values to the stresses and strain predicted using FE models. 18 For brittle adhesives, Adams et al. 18 used the maximum principal stress criterion to predict the failure mode, which occurred at right angles to the direction of the maximum principal stress. For ductile adhesives, due to adhesive yielding and non-linearity, instead of a stress based criterion, a maximum principal strain based criterion was used to predict the joint strength. 19 These criteria are however sensitive to the mesh size close to the discontinuity/defect, where there is theoretically a singularity. A numerical failure criterion using the maximum shear stress against the bulk adhesive shear strength was also used extensively to predict joint strength.20,21 However, this analysis worked best for short overlaps and brittle adhesives and ignored the normal stresses acting on the joint.
Disbonds are a common defect that can arise in bonded structures. Stress singularities are also present due to discontinuities within a structure such as the square end of a joint. Hence, for certain bonded joint configurations, a failure criterion based on fracture mechanics is needed. Linear Elastic Fracture Mechanics (LEFM) can describe the required loading conditions to propagate an existing crack. For a more ductile material however, the non-linear zone ahead of the crack tip can become large compared to the crack length and an LEFM model cannot work effectively. LEFM also requires an initial crack to be present, so cannot deal with damage initiation problems. The Cohesive Zone Model (CZM) can overcome some difficulties associated with LEFM. CZM assumes separation of the surfaces of the crack takes place resisted by cohesive traction. 22 CZM methods were used numerically to simulate interfacial fracture problems of adhesive joints. CZM can be implemented on one or multiple interfaces in the bonded joint and can take mixed-mode loading,23,24 and consider rate dependent effects. 25
So far, there have been neither reported studies of the residual tensile strength of a Double Lap Joint (DLJ) post transverse impact nor comparison of the effects of manufacturing defects and transverse impact damage in DLJs. In this study, DLJs were subjected to transverse impact with two energy levels and then tested under tension to assess their damage tolerance. Impact damage and crack migration in the DLJ were carefully examined via X-ray Computed Tomography (CT) scans, ultrasonic scans and high-speed photography. Artificial defects were also placed at two different locations with respect to the adhesive bondline, one near the outer adherend and the other near the inner adherend. The residual tensile strength of the impacted joints correlated to joints with a similar disbond length and location near the inner adherend, because it resembles the location of the impact damage. 2-D FE models using a Virtual Crack Closure Technique (VCCT) capture the residual tensile strength reduction trend post impact, confirming the underling mixed-mode fracture-controlled failure mechanism, influenced by the asymmetrical impact damage and loading.
Materials
The DLJ configuration used for the impact tests had an inner adherend thickness of 4 mm, two outer adherends 2 mm thick, a nominal adhesive thickness of 0.2 mm and a lap length of 36 mm. The stacking sequence of the Hexcel's HexPly® IM7/8552 adherends was [0/45/90/-45]2s. The specimens were made in two parts and bonded together. After curing and grit blasting the surfaces, 2 mm-thick adherends were secondarily bonded with Hexcel's Redux® 319 film adhesive to form two half single lap joints. Paste adhesive (Huntsman’s Araldite® 2014-1) was then used to bond the two half joints and form a symmetrical DLJ. The schematic of the DLJ is in Figure 1(a). Impact set-up.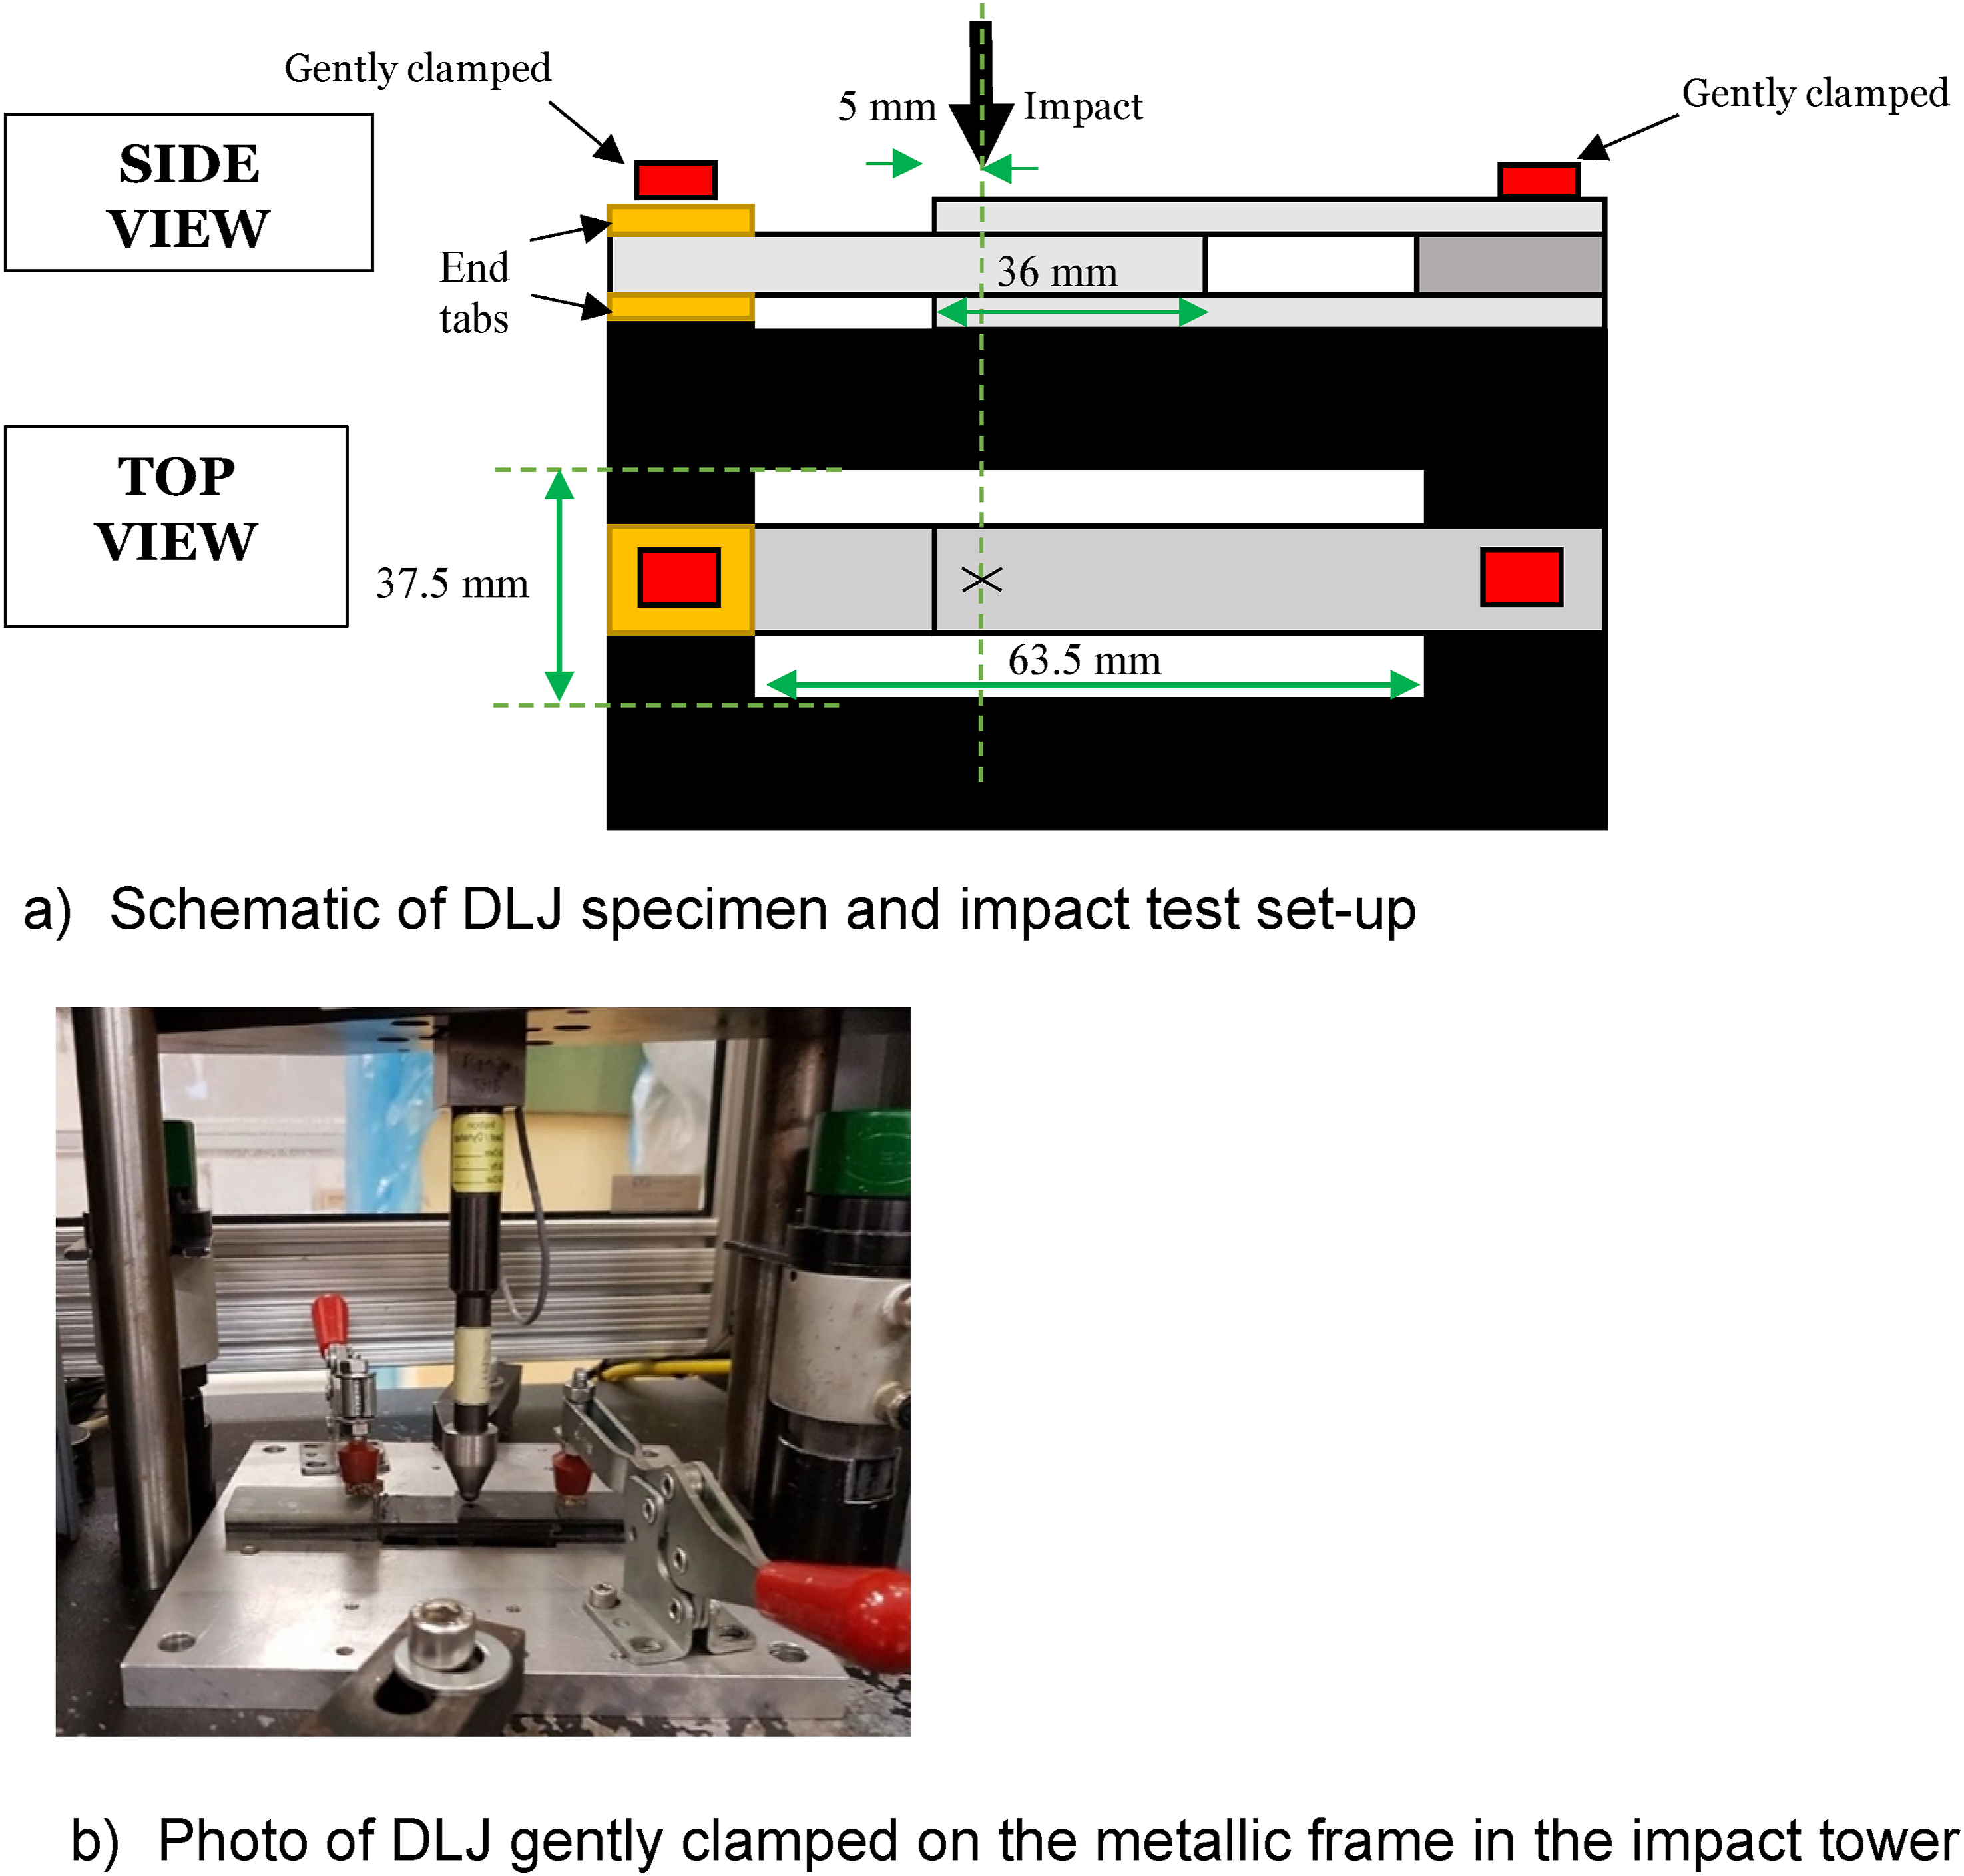
Impact tests
Impact testing configuration
The DLJs were subjected to transverse impact as shown in Figure 1(b). The impact location was chosen to be 5 mm from the leading edge of the specimen, as from the literature review it was found that this location presented the most critical case. Another point to note is that a beam configuration was used which leads to a uniform damage across the full width so provides a worst-scenario case in contrast to a plate. Only the two ends of the beam were gently clamped. The support window in which the specimens were placed was 37.5 mm × 63.5 mm. The indenter tip diameter used was 8 mm.
Static indentation tests
A static indentation test was initially conducted to understand the response of the DLJ under through thickness loading. The test was stopped when a load drop was observed at a force of around 2 kN with no visible damage on the specimen. To understand the failure mechanisms and damage occurring in more detail, X-ray CT scan images of the specimen were taken as shown in Figure 2. CT scan images from the indentation test.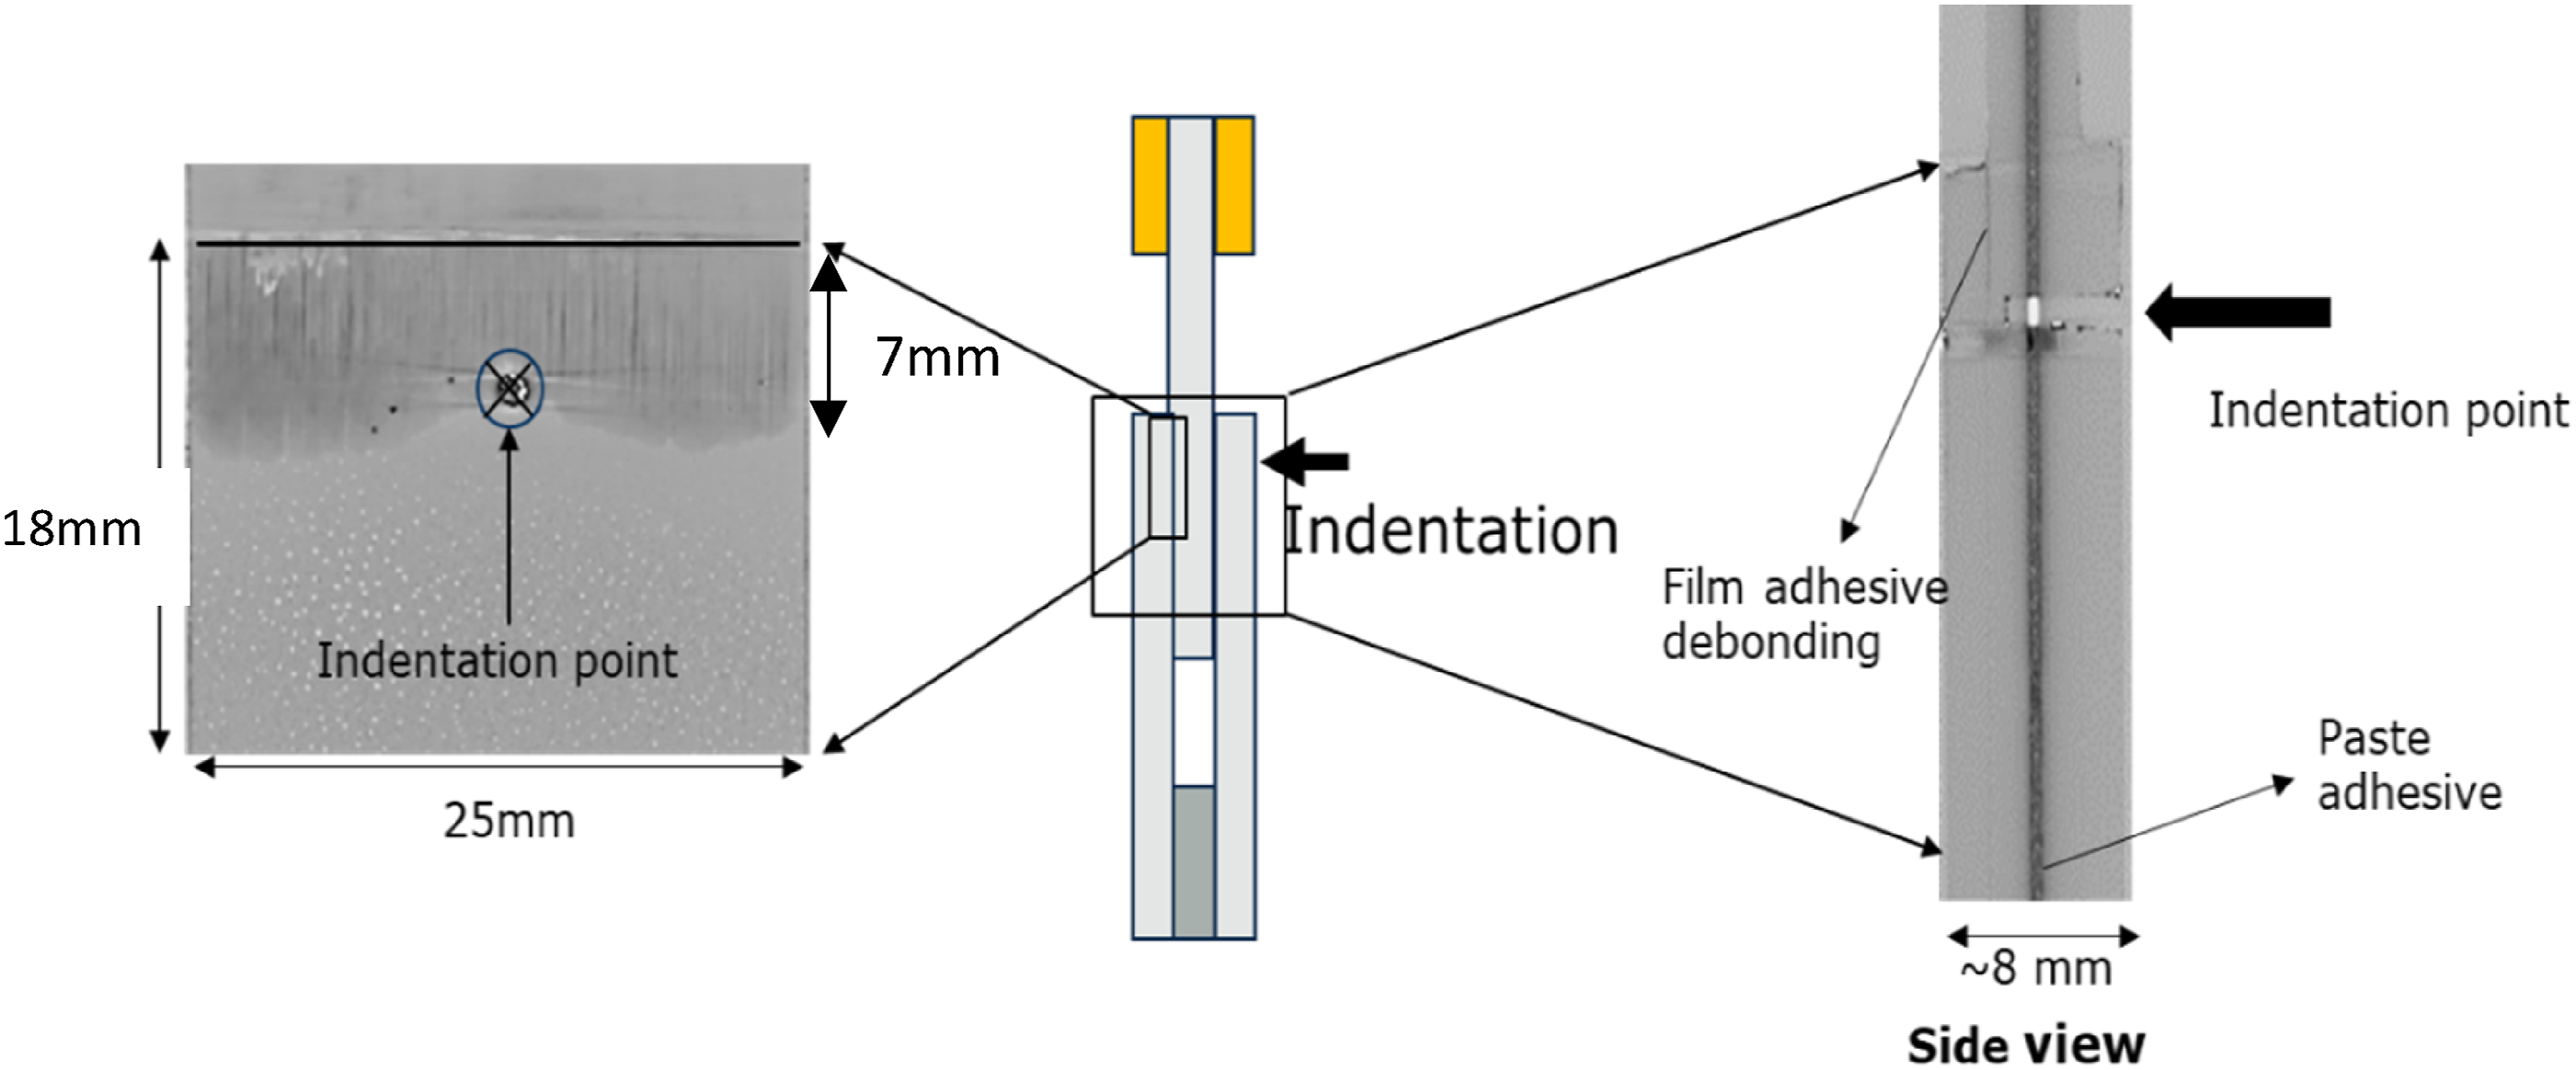
To prepare the specimen for the CT scan, a hole was drilled (1 mm diameter) at the indentation point so that dye penetrant could be absorbed through the specimen thickness to show any damage within the DLJ. From the CT scan debonding was observed at the inner adherend surface with 0° fibres visible in Figure 2. The debonding length for the first load drop was about 7 mm. The crack propagation was sudden when the energy reached a certain value.
Transverse impact tests
Through trial impact tests, it was found that a similar force to that in the static indentation test was achieved at 2J energy as shown in Figure 3(a). A higher energy level (3J) was also tested (Figure 3(b)). To analyse the damage, ultrasonic C scans were used using the DolphiCam, a handheld, mobile NDT scanning device. For one specimen for each impact energy case, CT scans were also taken which were then compared to the C scan images as shown in Figure 4. A good correlation was found, hence for all the impacted specimens, the C scan images were used to quantify the amount of damage. The CT scan images for the impact case revealed that the damage pattern was similar to that in the indentation case, with debonding occurring near the adherend/adhesive interface in the inner adherend. Impact test results. C scan images from impact tests.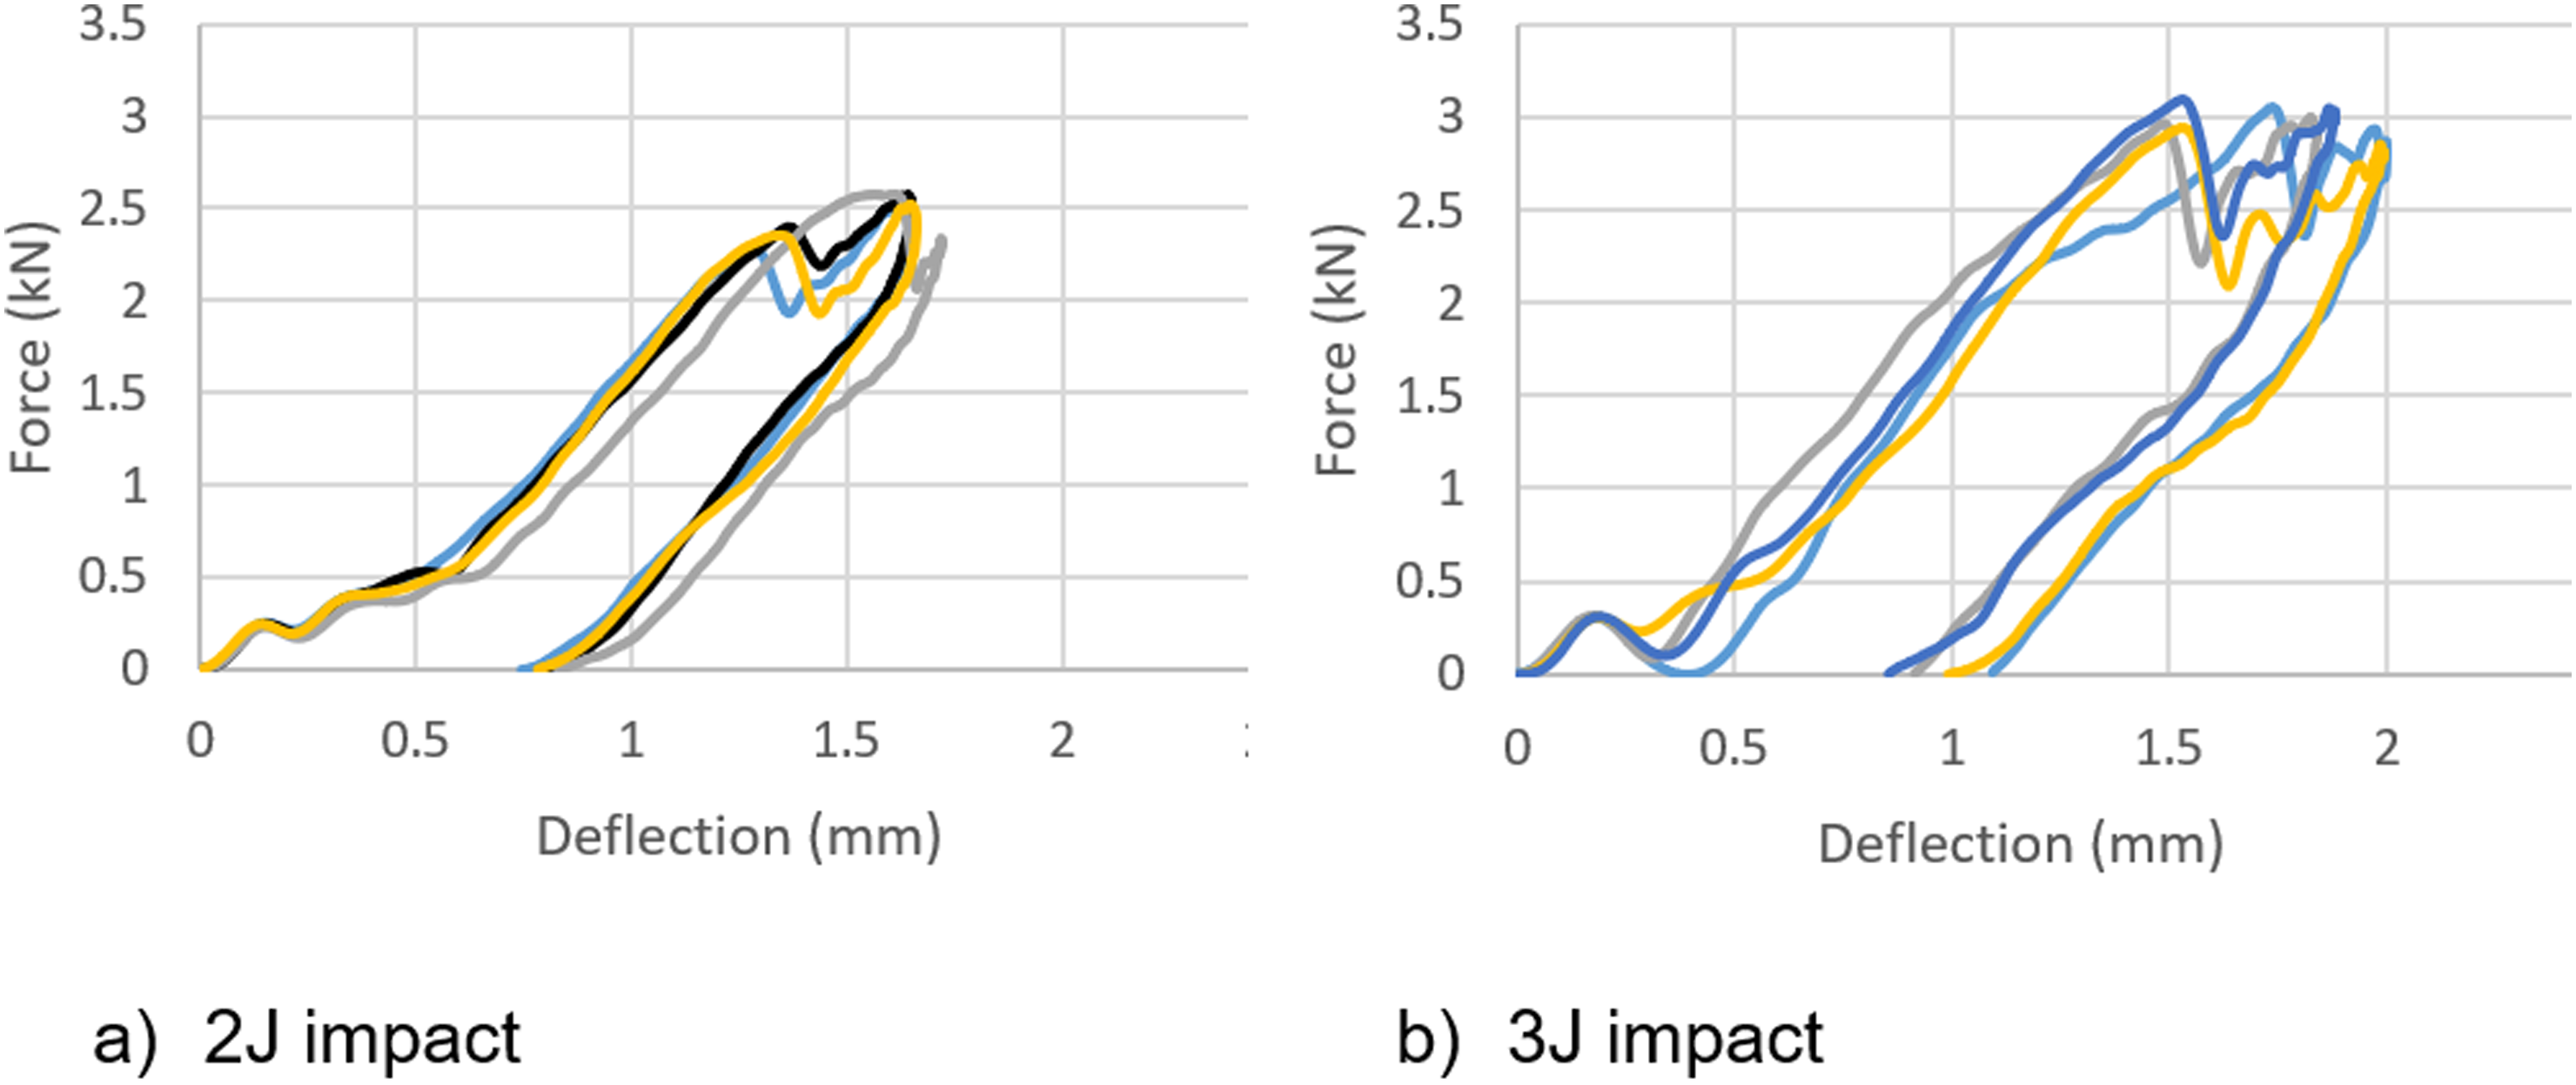
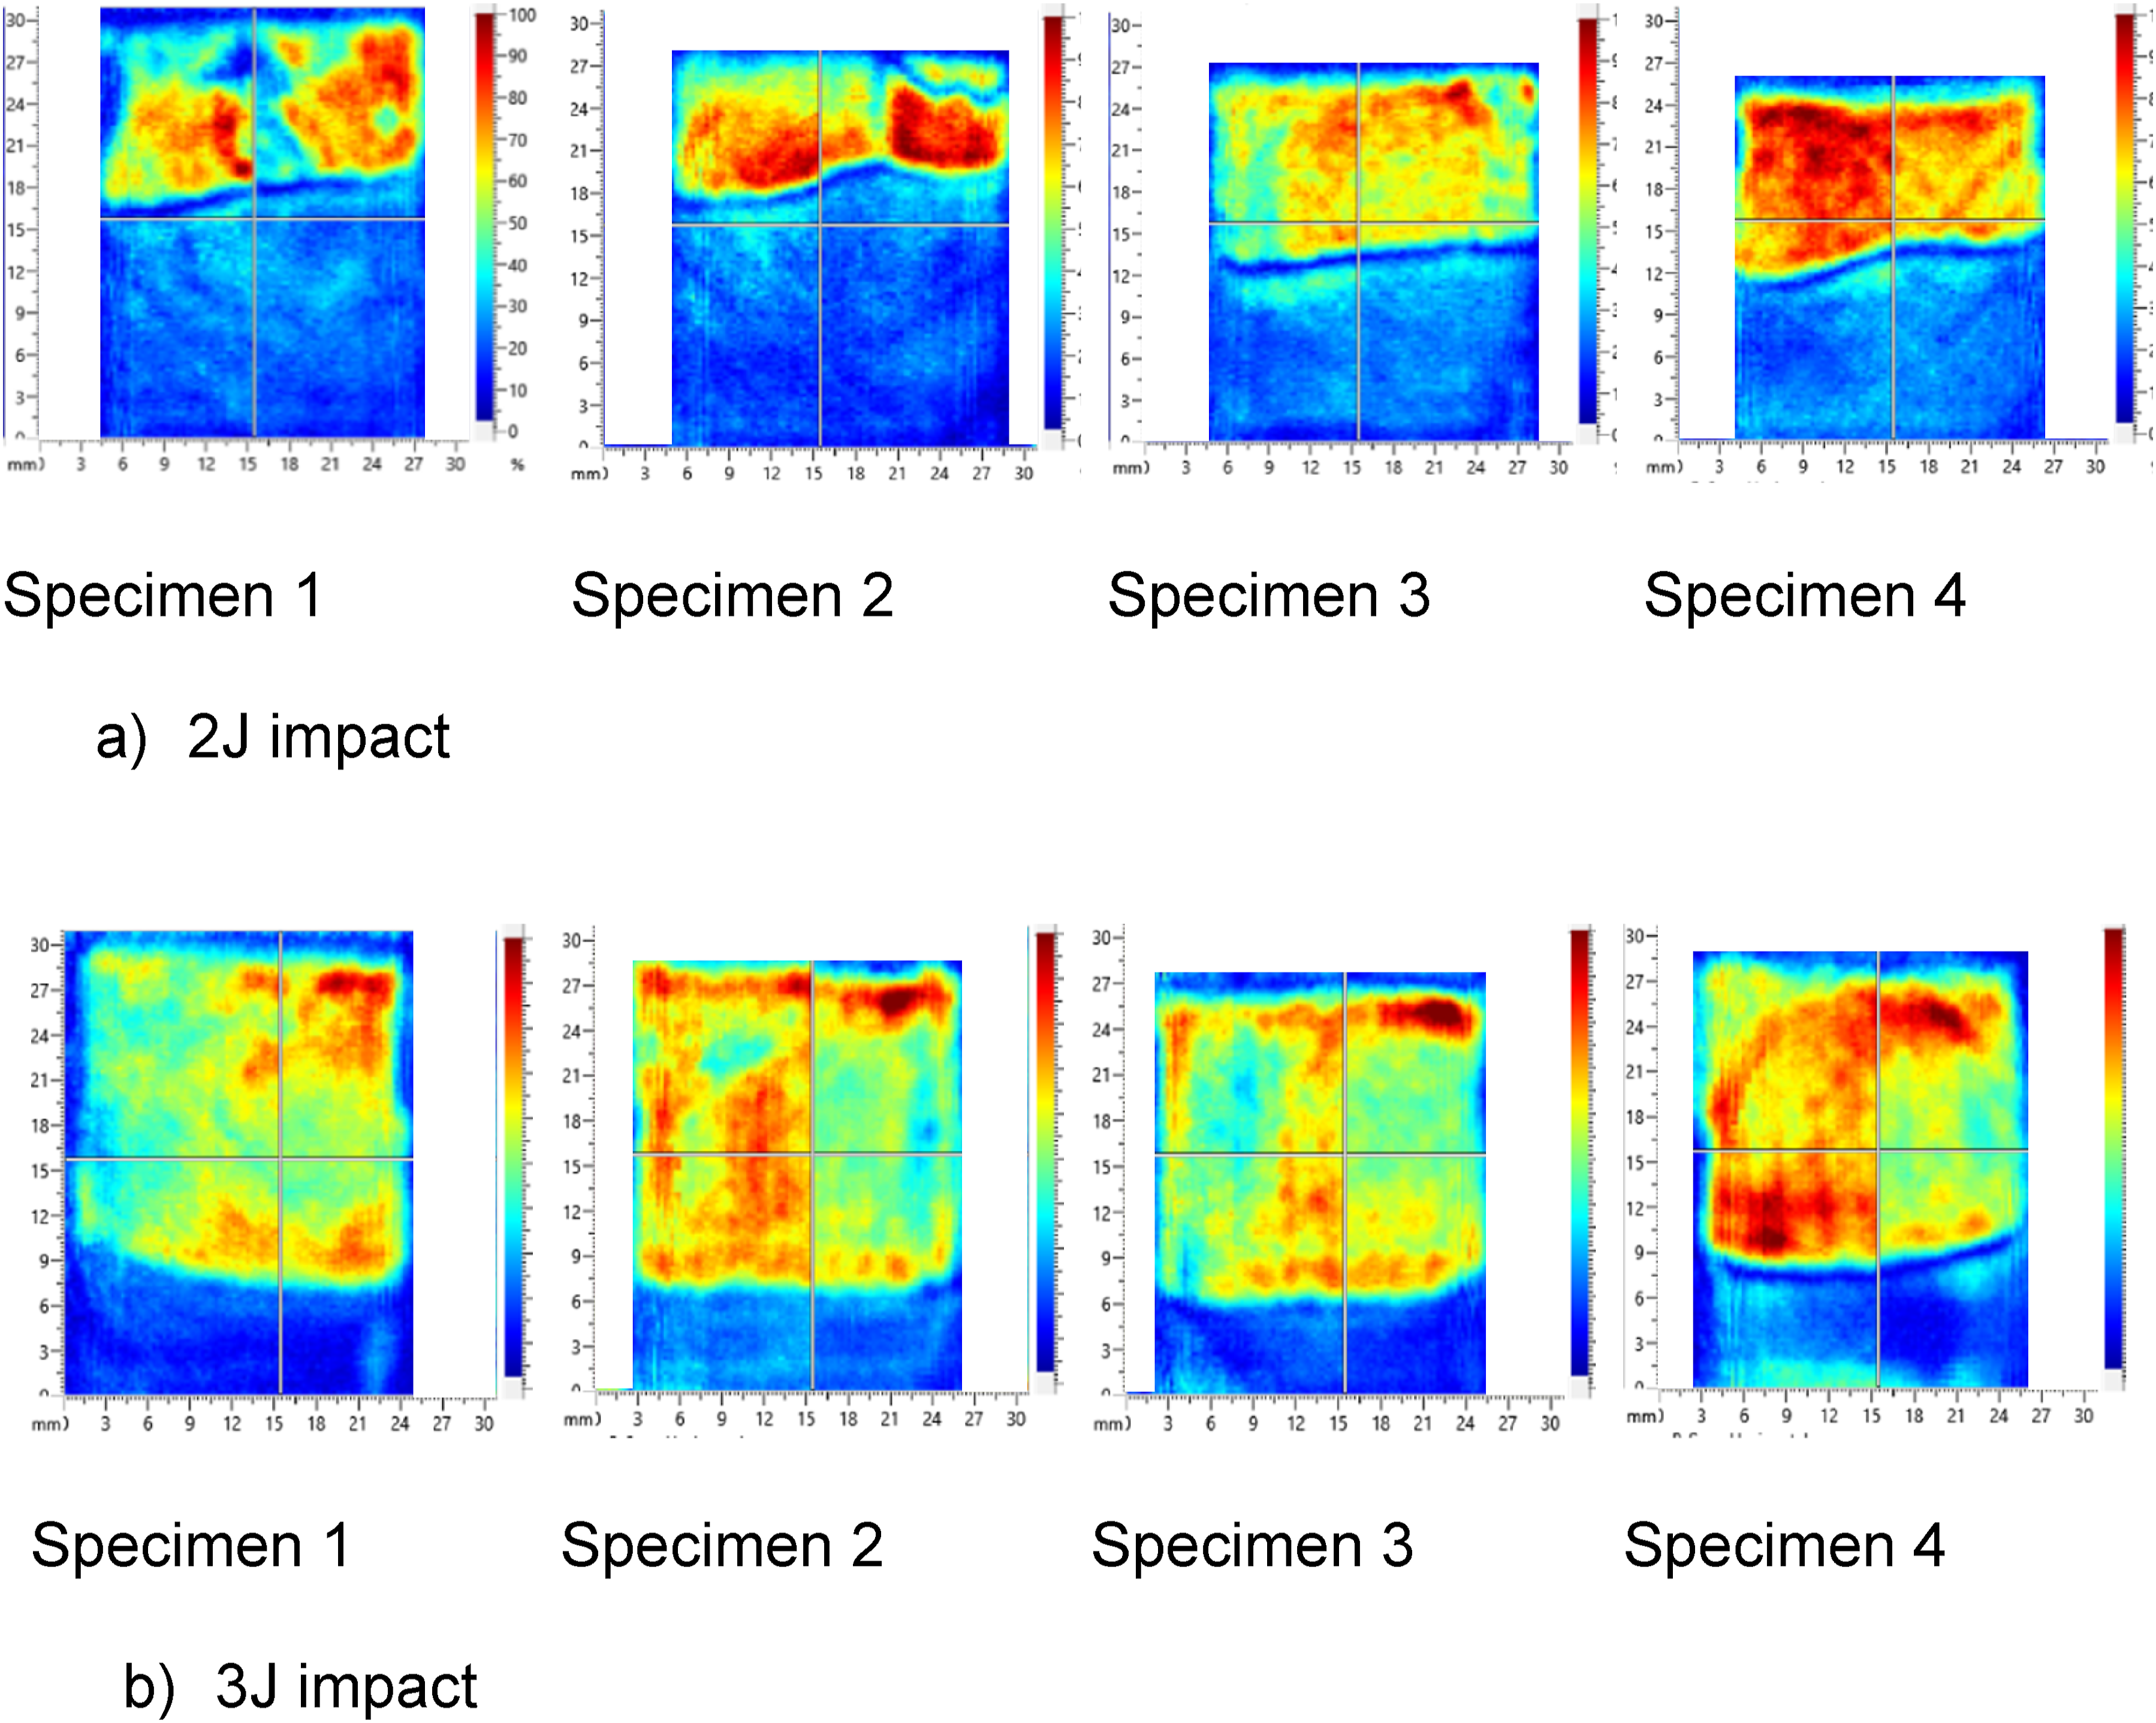
The impact force versus deflection for the 2J and 3J cases is shown in Figure 3. The load drops, when they occur, were at a similar level for each impact energy tested and represented the points when impact damage occurred. The C scan images for the two cases are shown in Figure 4. The average damage length for the 2J case was 13 mm, which represented approximately a third of the overlap length (36 mm), while for the 3J case the average debonding length was 22 mm, approximately two thirds of the overall overlap length. The damage occurred near the inner adherend/adhesive interface, opposite to the side at which the impact was applied.
Residual tensile tests after impact
Residual tensile test results.
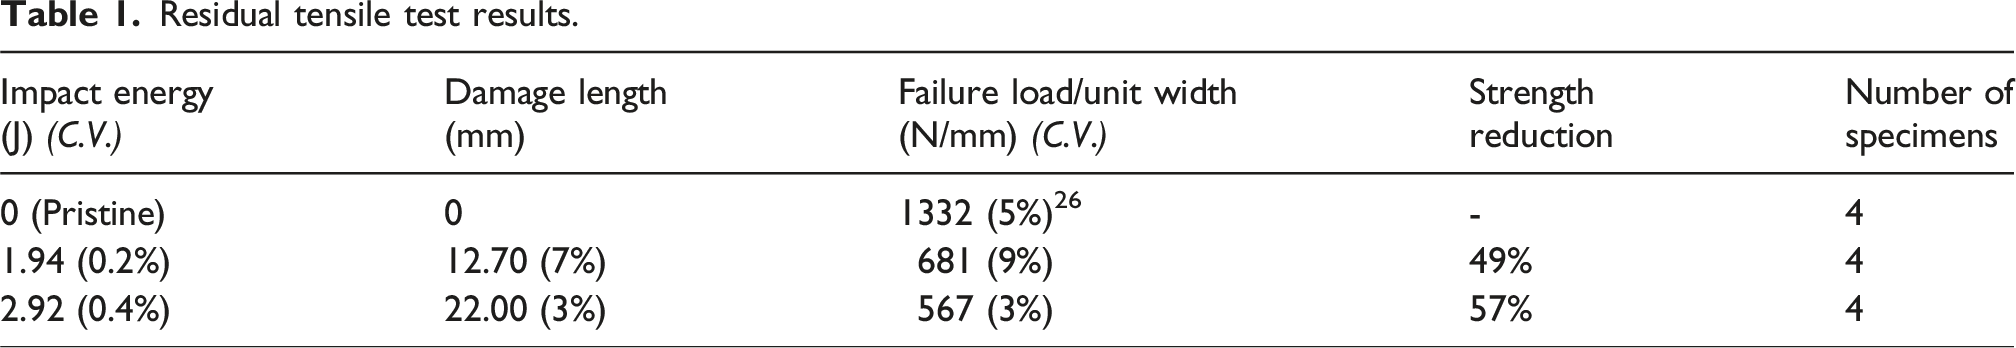
Under impact the peel stresses at the bottom edge (i.e. the other side of the joint from where the impact load is applied) were high. This led to the debonding initiation and propagation from this interface, close to the adhesive bondline. Increasing the impact energy from 2J to 3J resulted in a 42% increase in the debond length. The residual tensile strength was compared to the pristine case
26
in Figure 5(a). A linear force-displacement relationship was observed before catastrophic failure as shown in Figure 5(b). When the impact damage was present, a significant knockdown on failure load was observed when compared to the pristine case.
26
There is a 49% reduction of DLJ strength after a 2J impact, and a 57% decrease of DLJ strength post a 3J impact. This strength reduction is of a similar magnitude compared to the previous residual tensile test results of impacted SLJs (50%).
1
Summary of impacted DLJ results.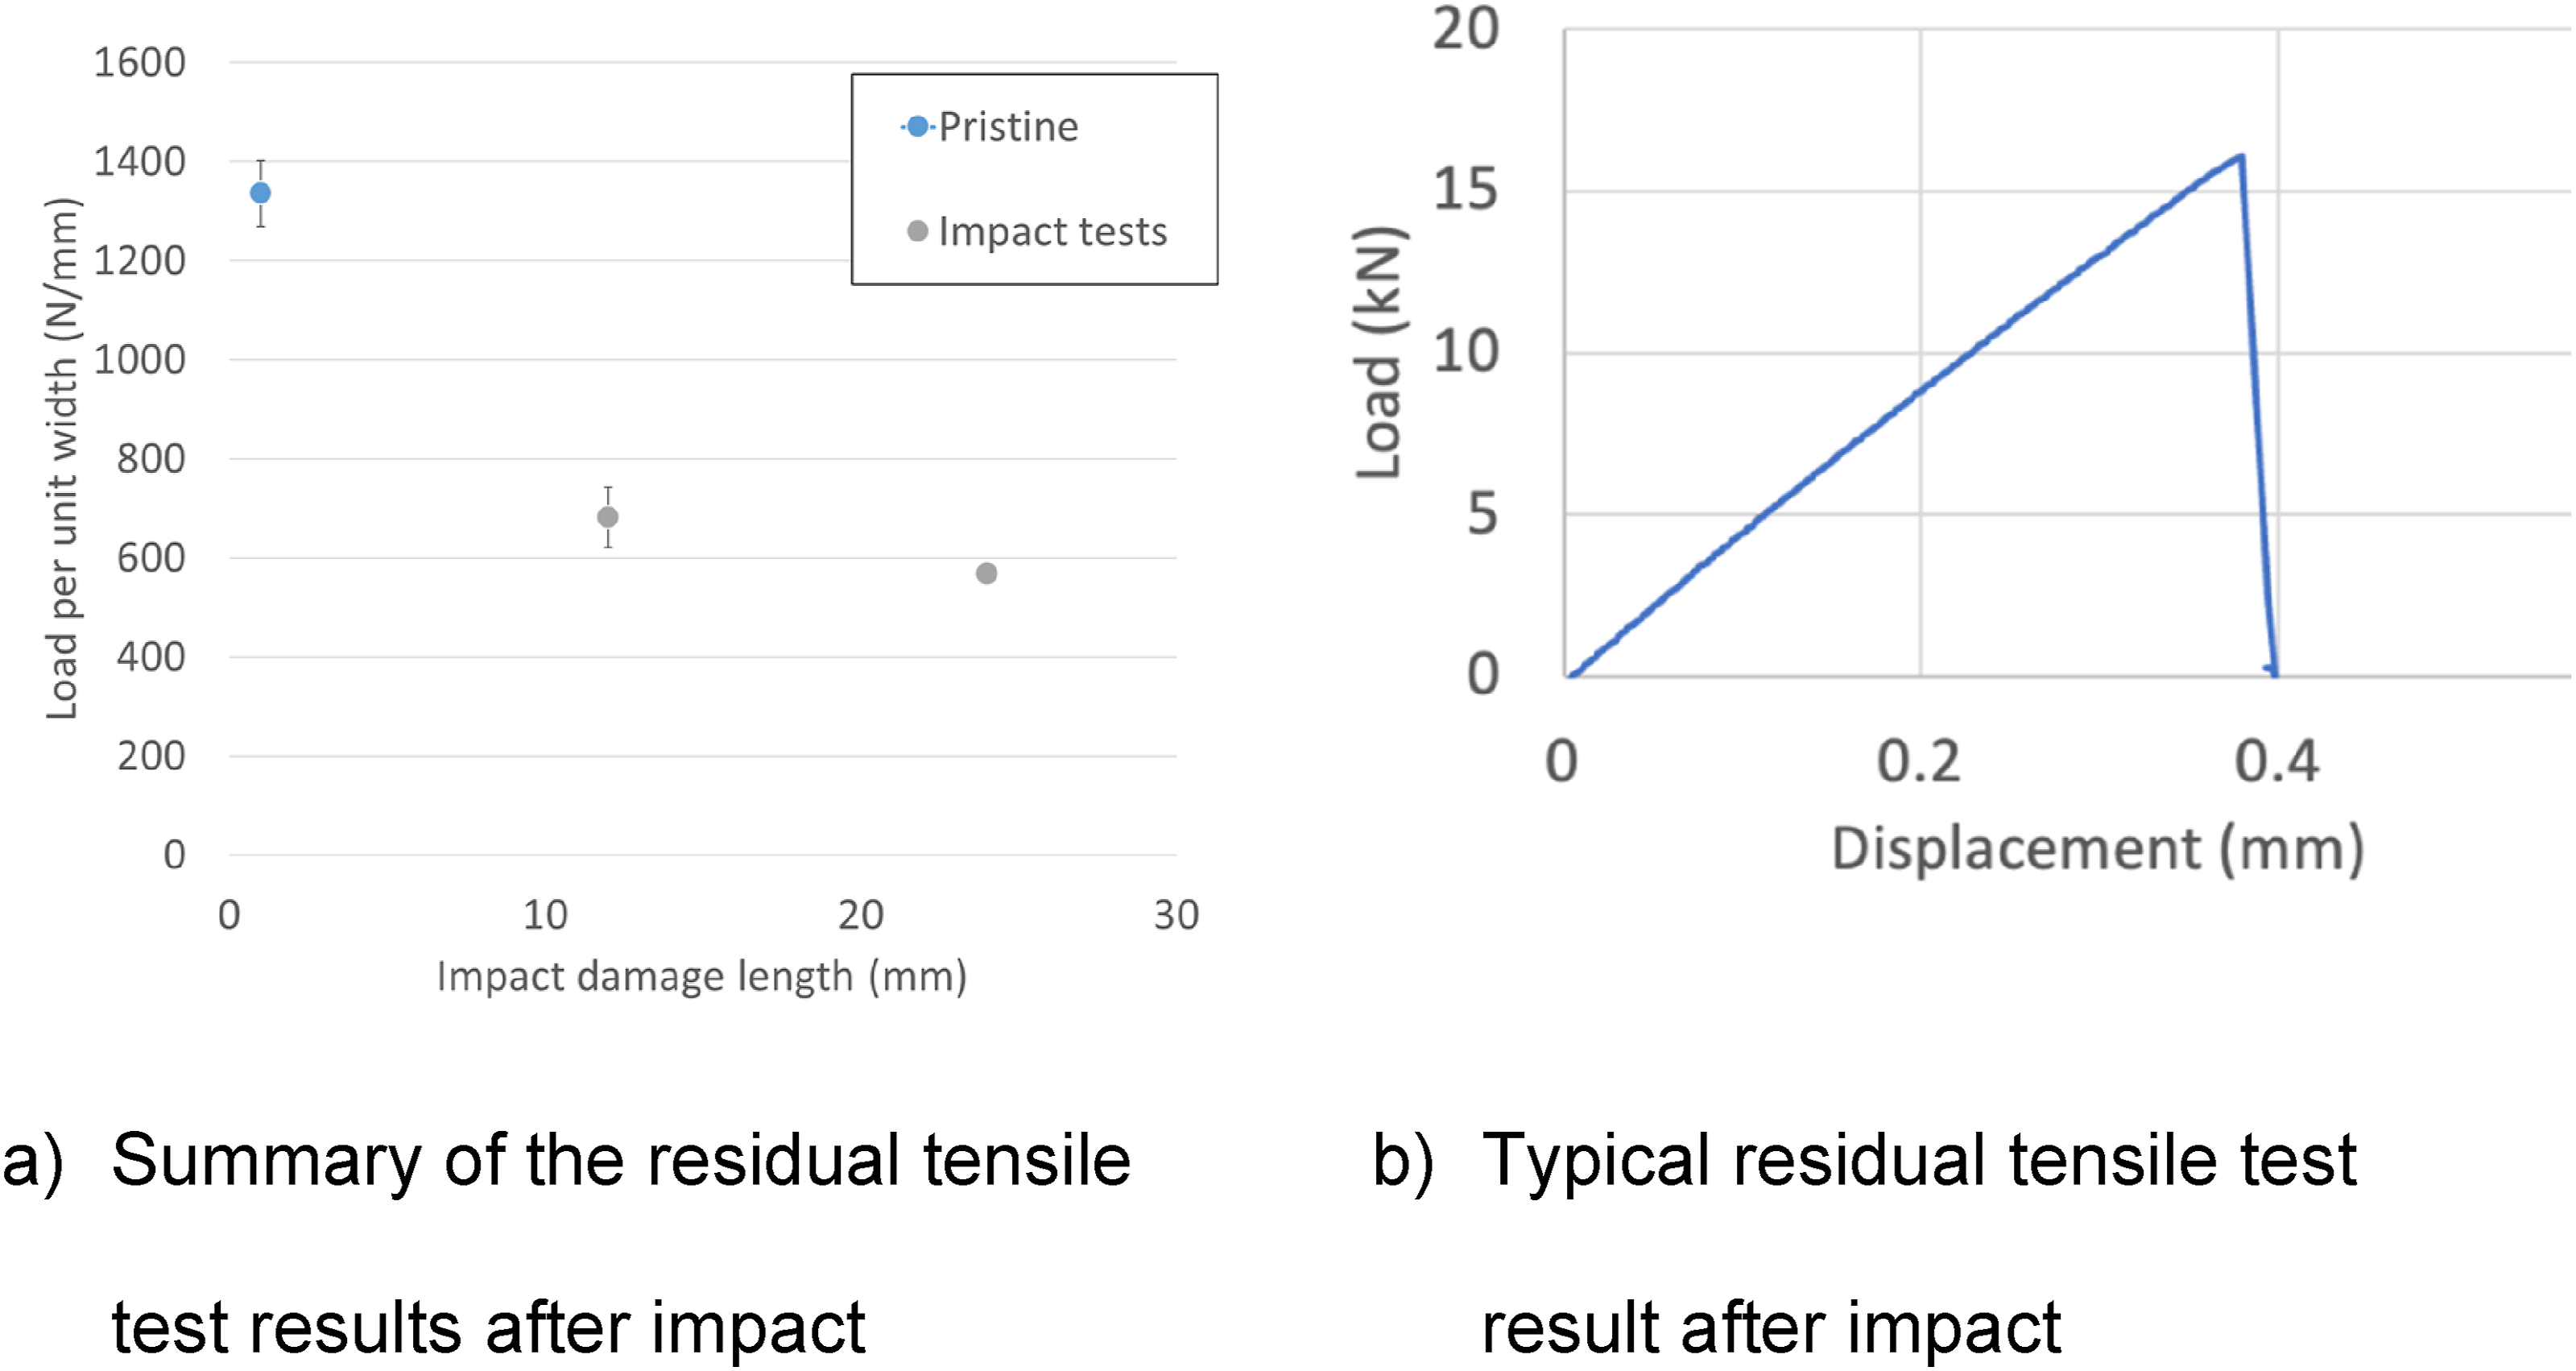
The failure schematics for the impact cases are shown in Figure 6 and the fracture surfaces are shown in Figure 7. In Figure 7, the impact damage is seen within the surface 0° ply in the lower half of the DLJ. The impact damage front is where the black colour meets the dark grey and labelled in red boxes. Failure schematic of lower half of DLJs. Fracture surfaces of impacted specimens after tensile tests.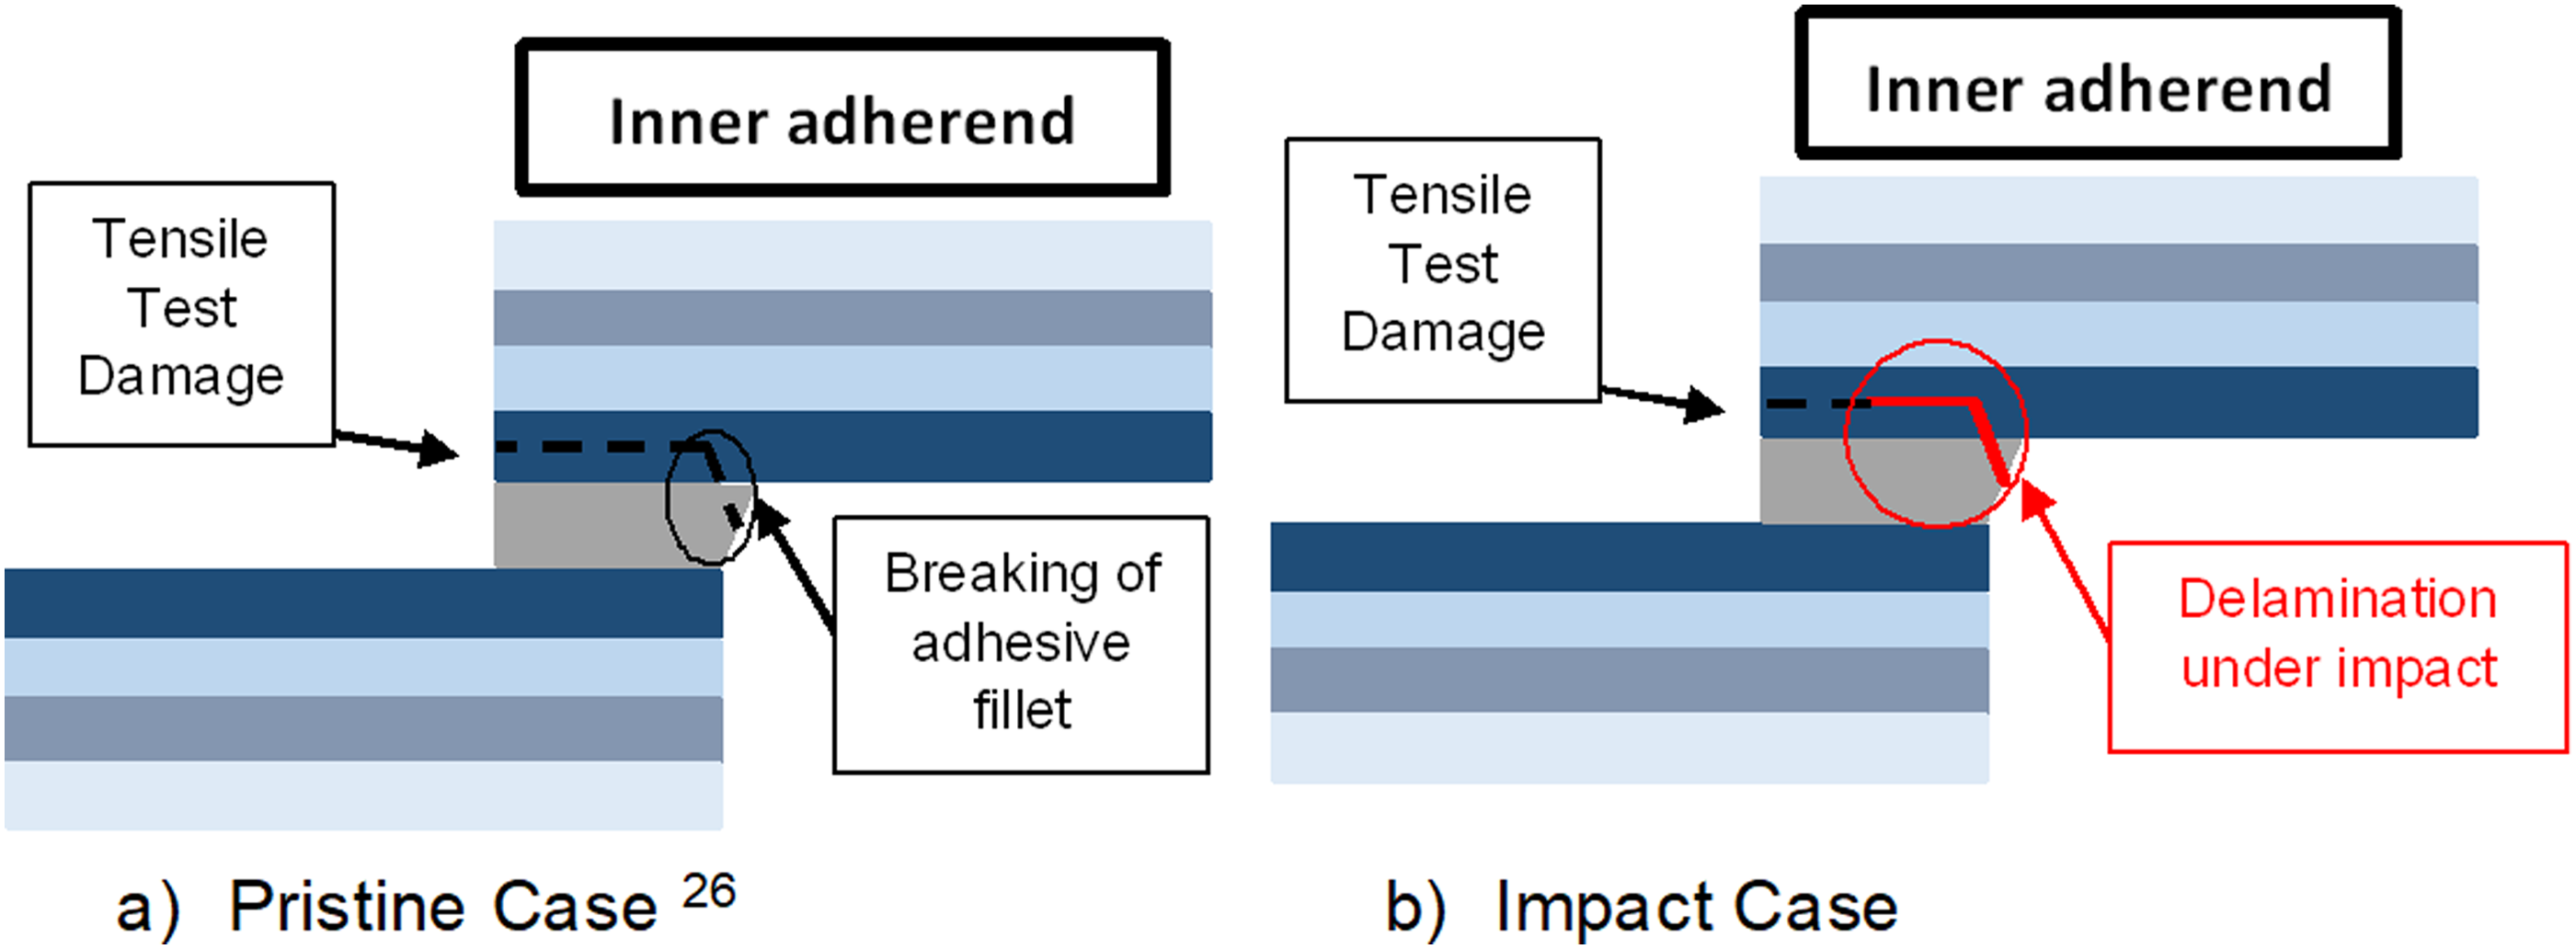
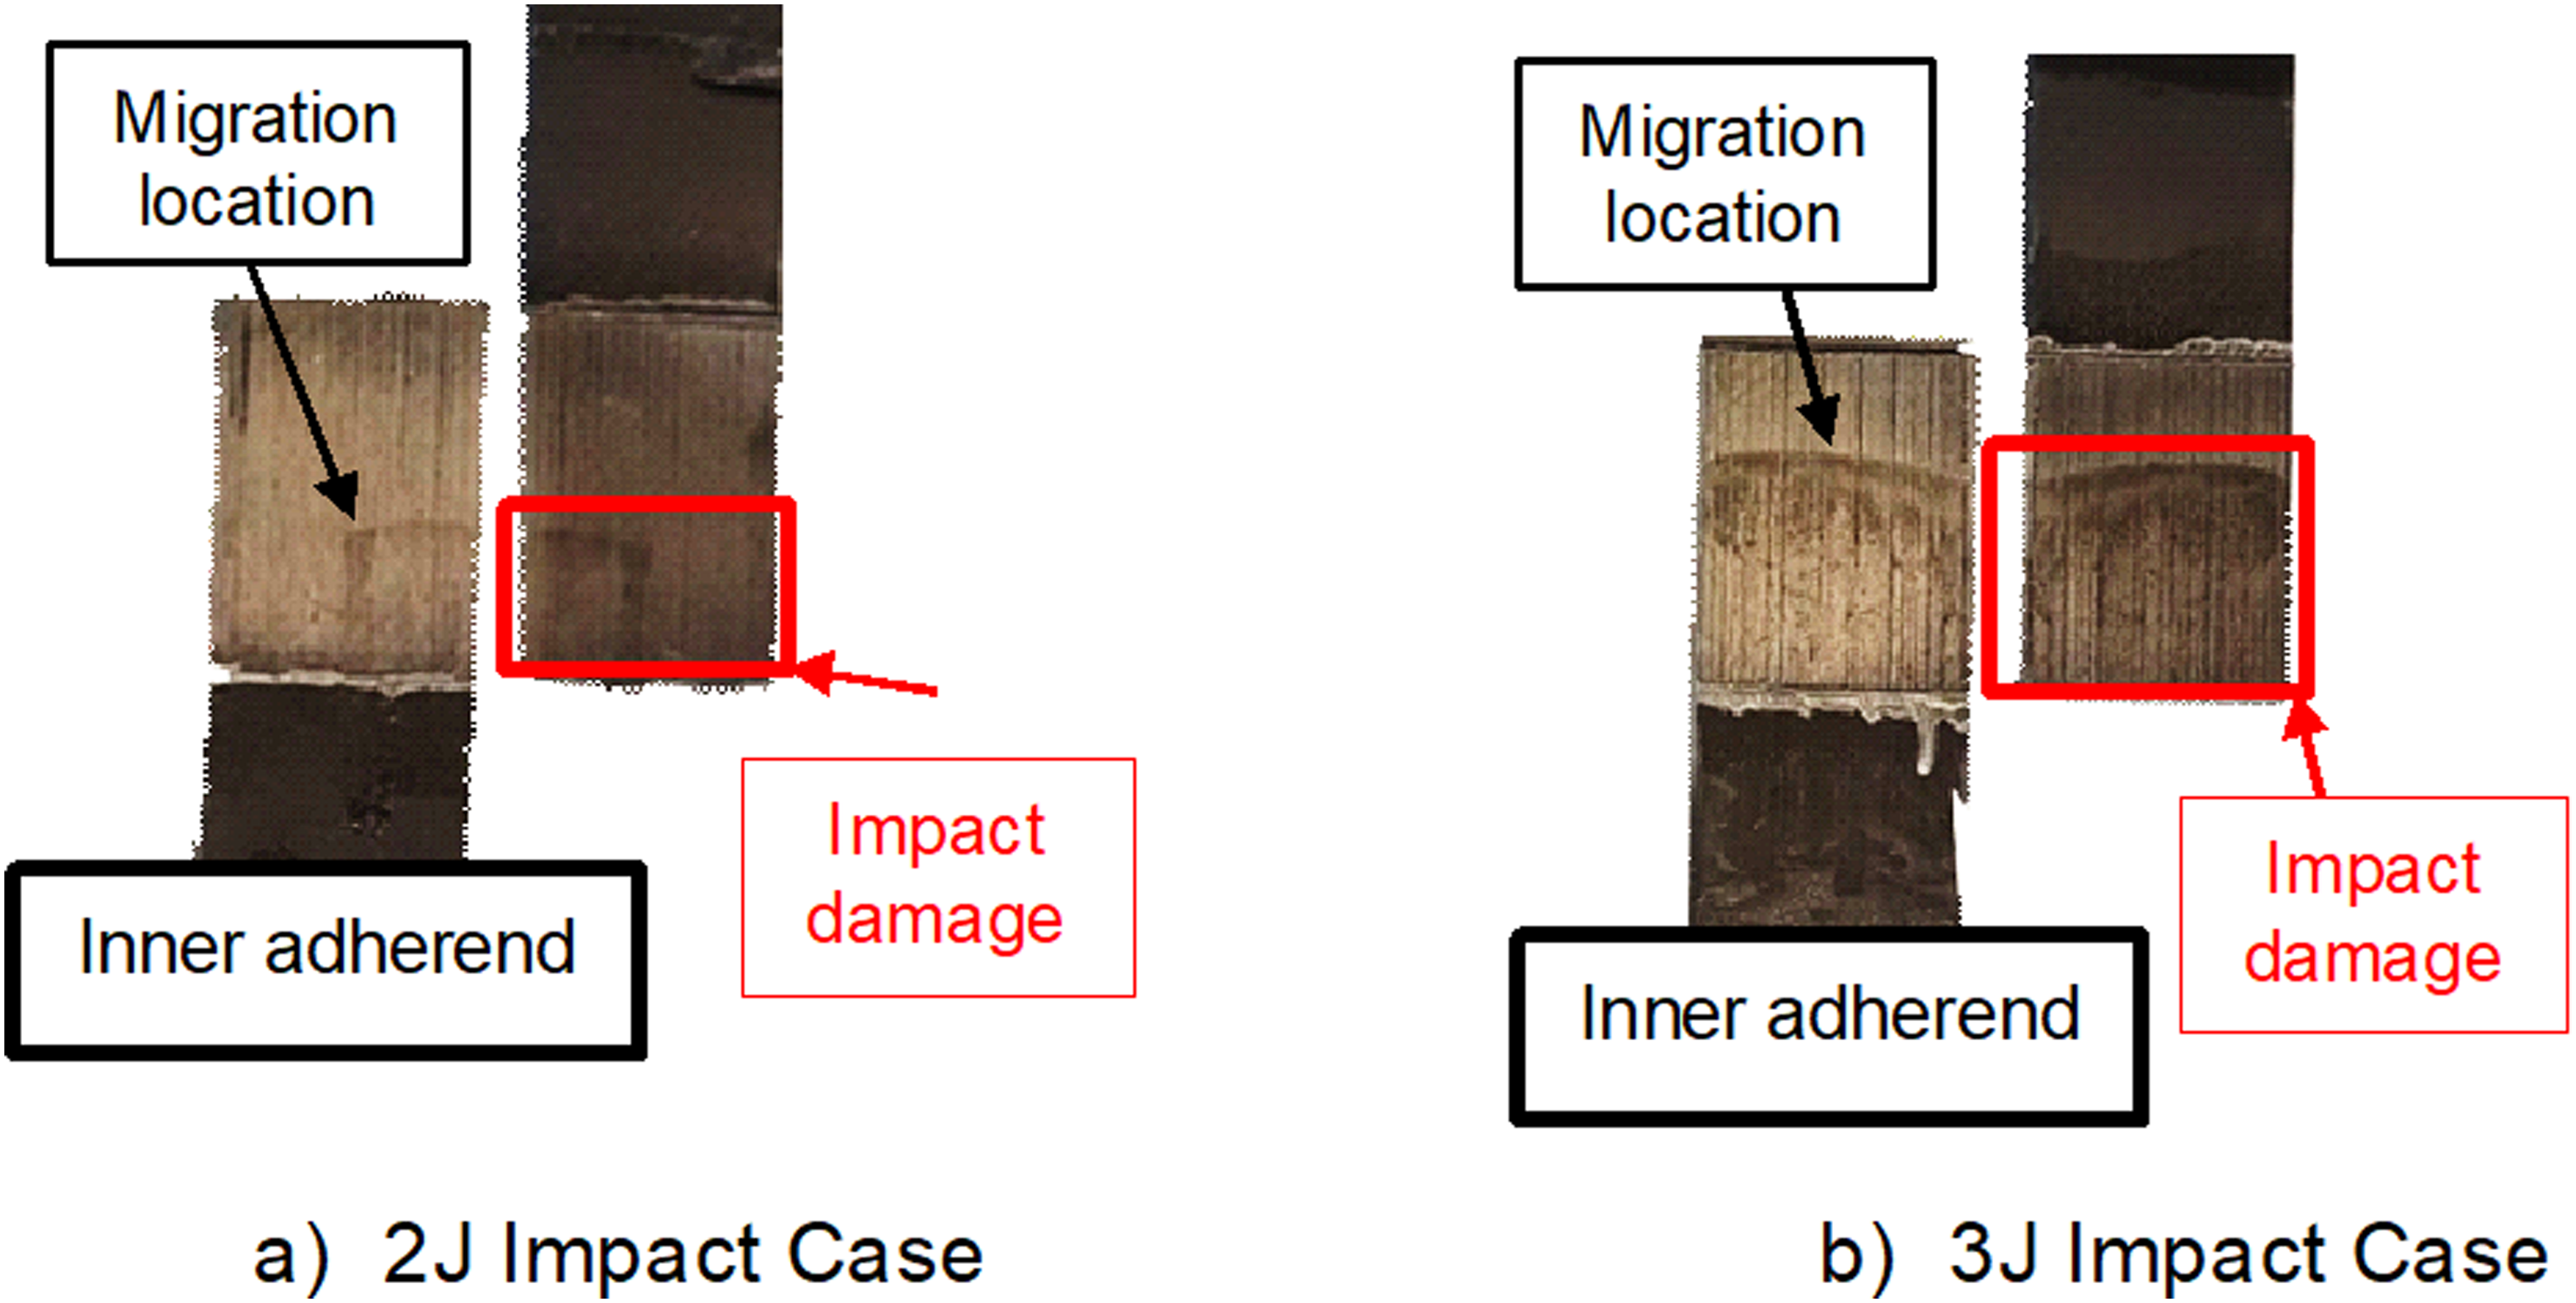
During the impact application, the crack initiated in the adhesive and then propagated into the 0° ply creating a sharp crack as shown schematically in red in Figure 6. The crack migration into the surface 0° ply was facilitated by the broken fibres due to grit blasting, as explained by Paul et al..
27
When the following residual tensile tests were conducted, the crack continued to propagate within the 0° ply until failure. This showed that the final crack propagation path for the impacted specimens under tensile loading was similar to the pristine case. Once the impact damage was present, a significant peel component was present during tensile load application along with the shear due to greater rotation from the asymmetrical loading as shown in Figure 8. Hence, the decrease in DLJ strength from the 2J impact to 3J impact case could be affected by a change in mixed-mode ratio with increased Mode I as well as the decreased effective overlap length (overlap length minus impact damage length). This will be investigated by the following FE analysis. Shear and peel component on impacted DLJ.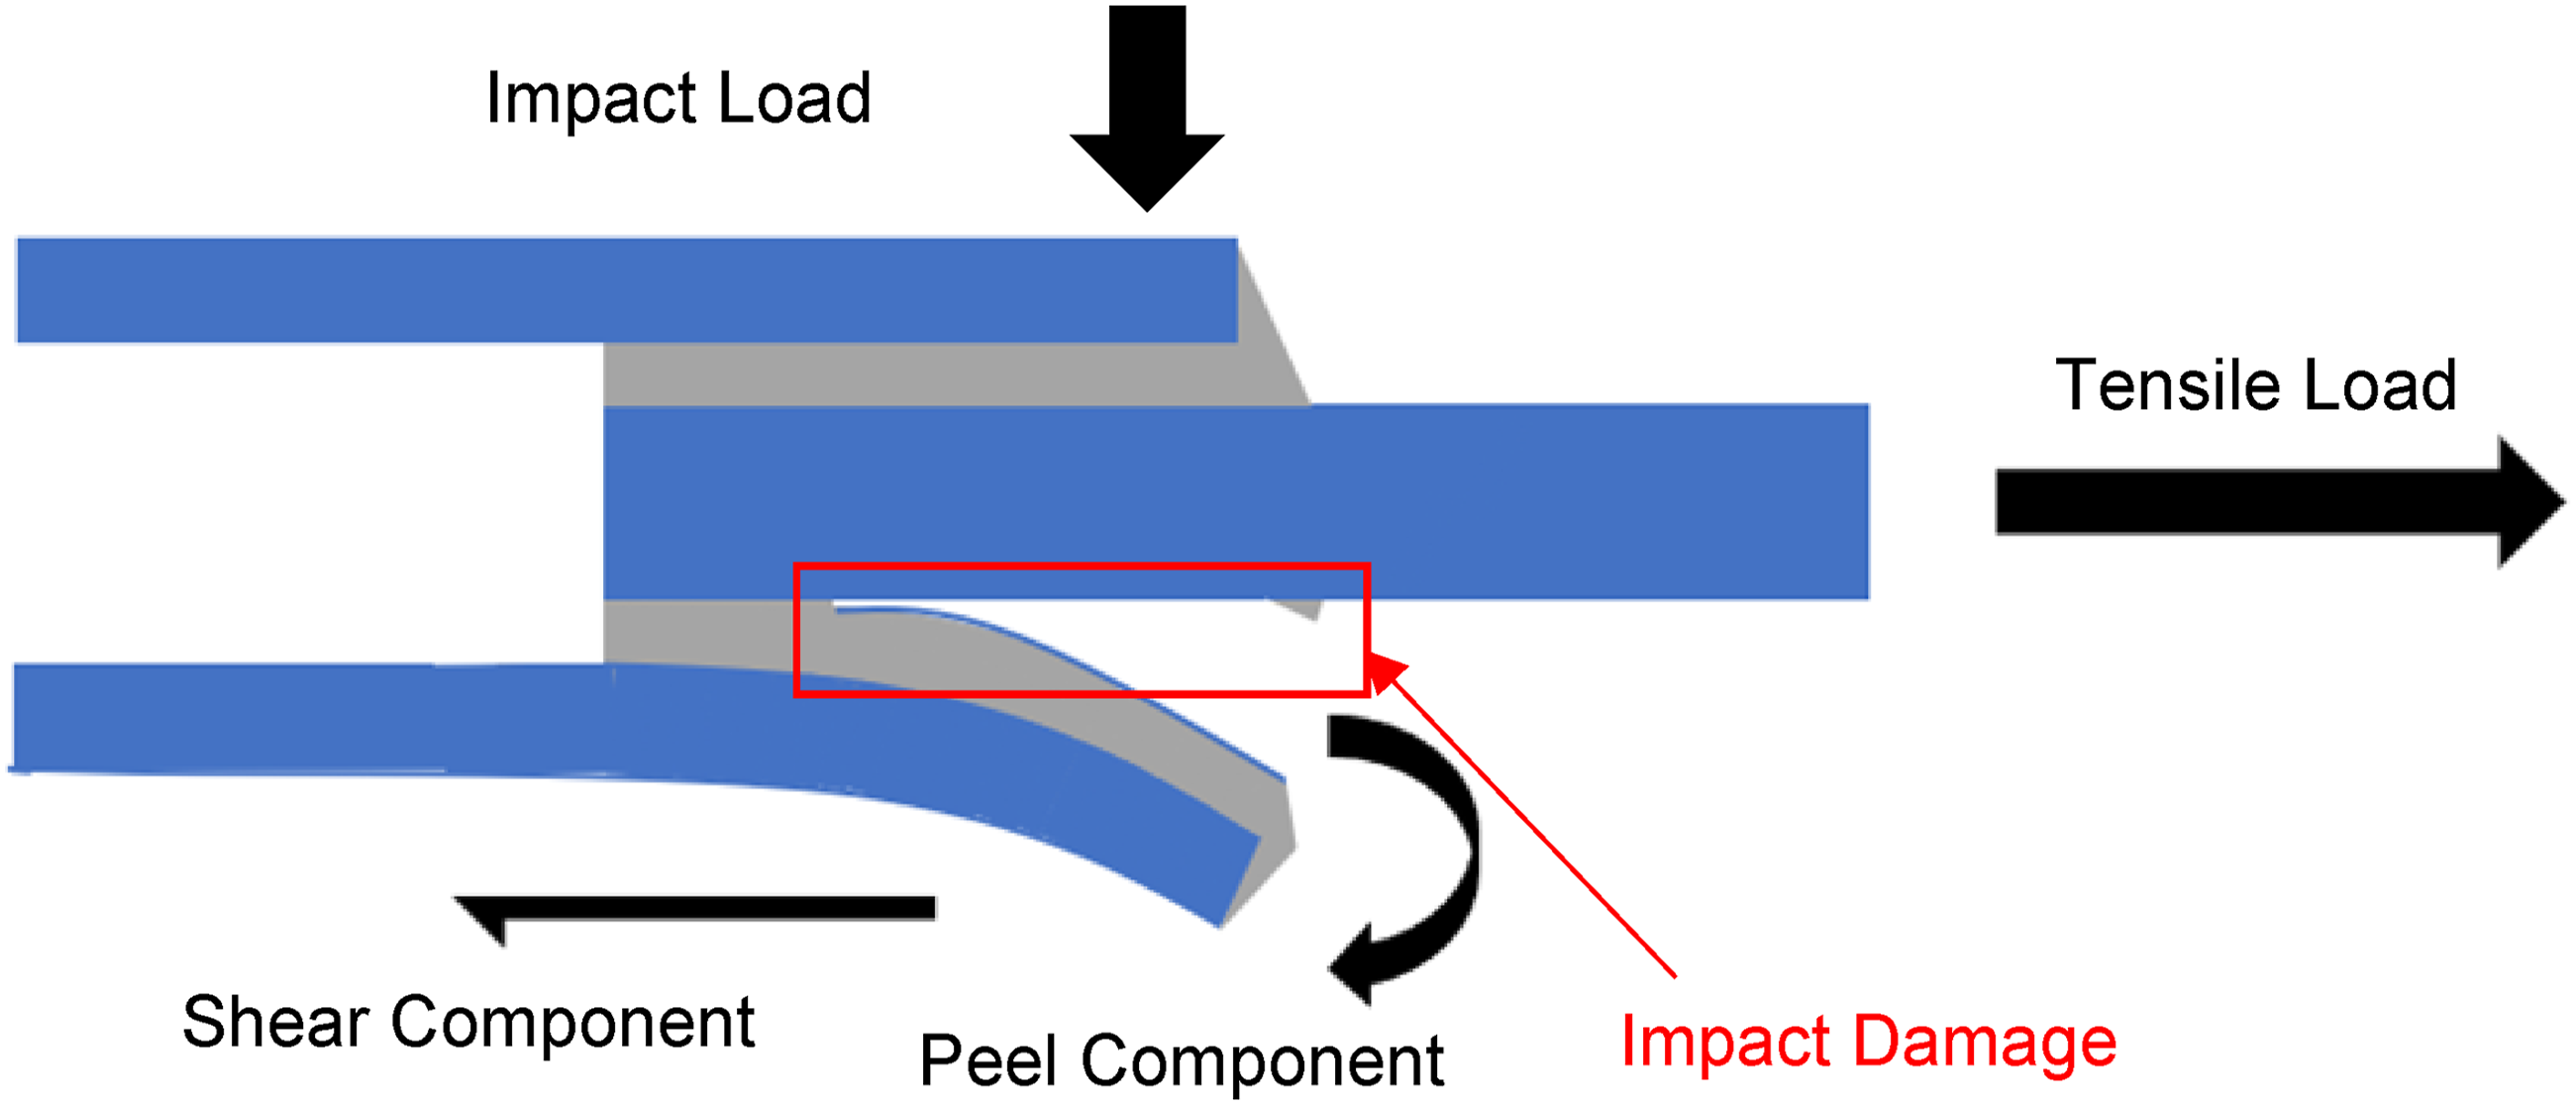
The failure of the pristine joints was found to be controlled by the Mode I fracture toughness of the adhesive at the tip of the fillet, 26 but for the impact cases it is controlled by mixed-mode fracture within the composite. This is because a crack was already present in the composite adherend before the tensile tests.
Disbond tests
Disbond configurations
The baseline DLJ configuration was with an overlap length of 36 mm, adhesive thickness of 0.2 mm and inner adherend thickness of 4 mm. Two disbond cases were considered to replicate the impact damage as shown in Figure 9. A film insert (12 μm thick) was placed across the full width between either the outer adherend and adhesive (Disbond A) or between the inner adherend and the adhesive (Disbond B) to represent the equivalent impact damage. Two disbond lengths of 12 mm and 24 mm were tested for each case. Schematic of disbond cases.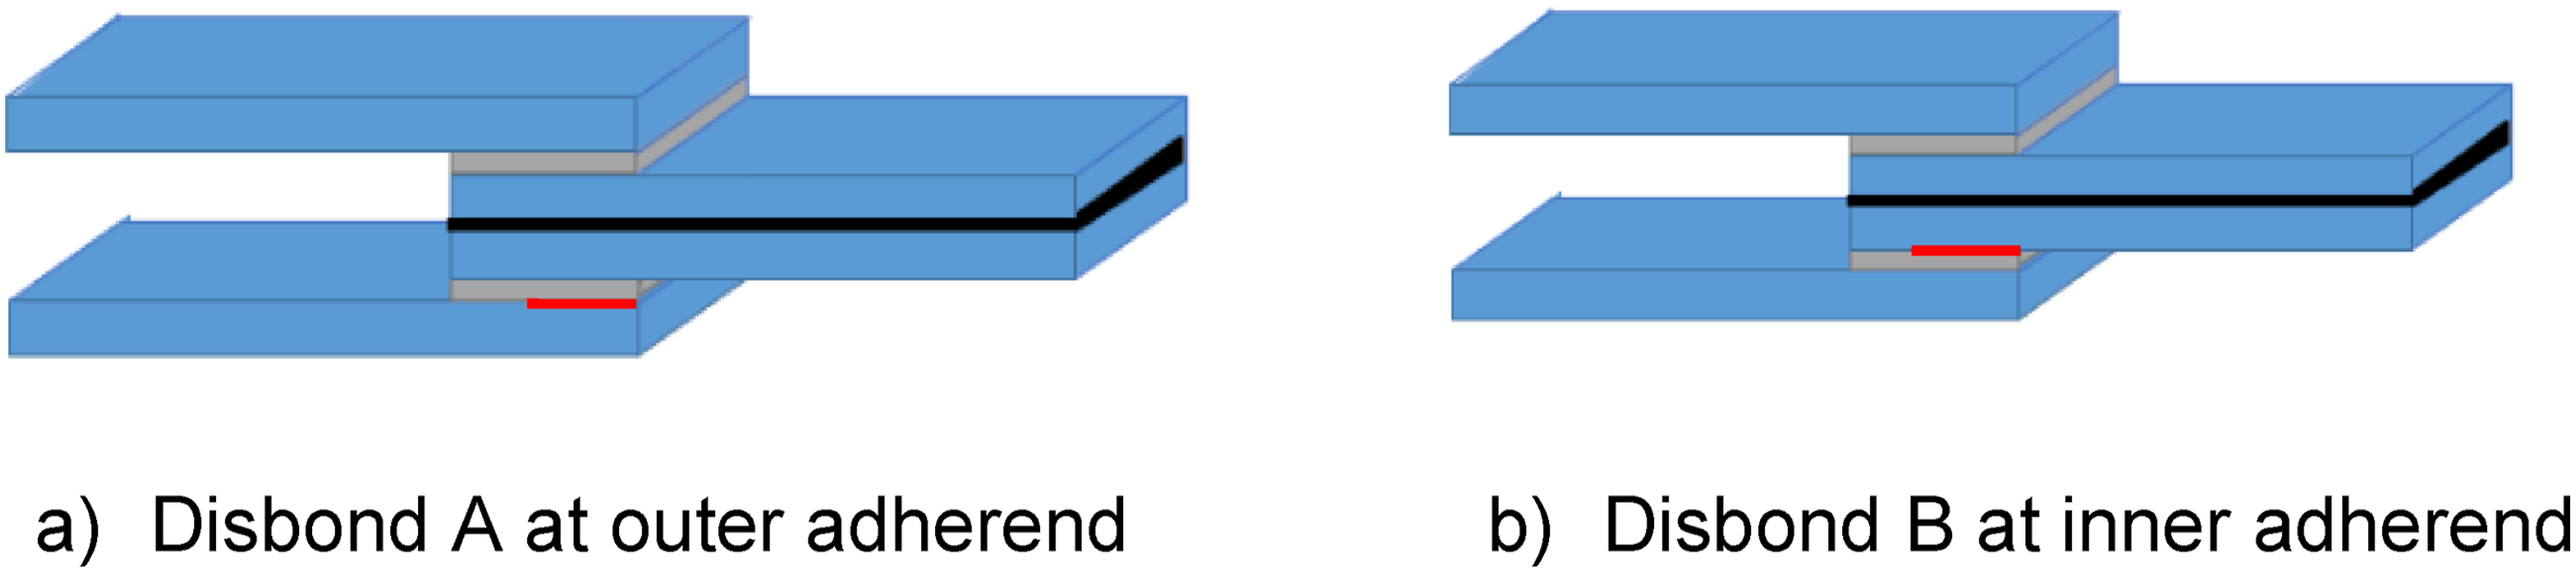
Disbond test results
Disbond tests summary.
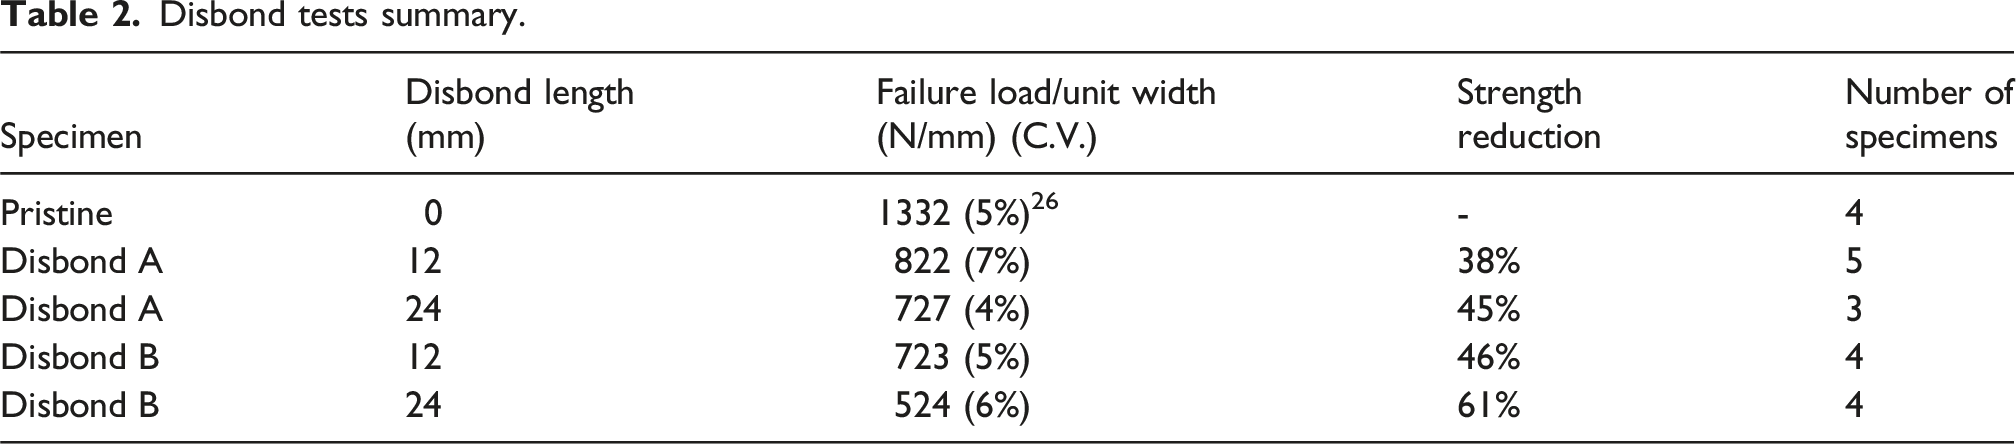
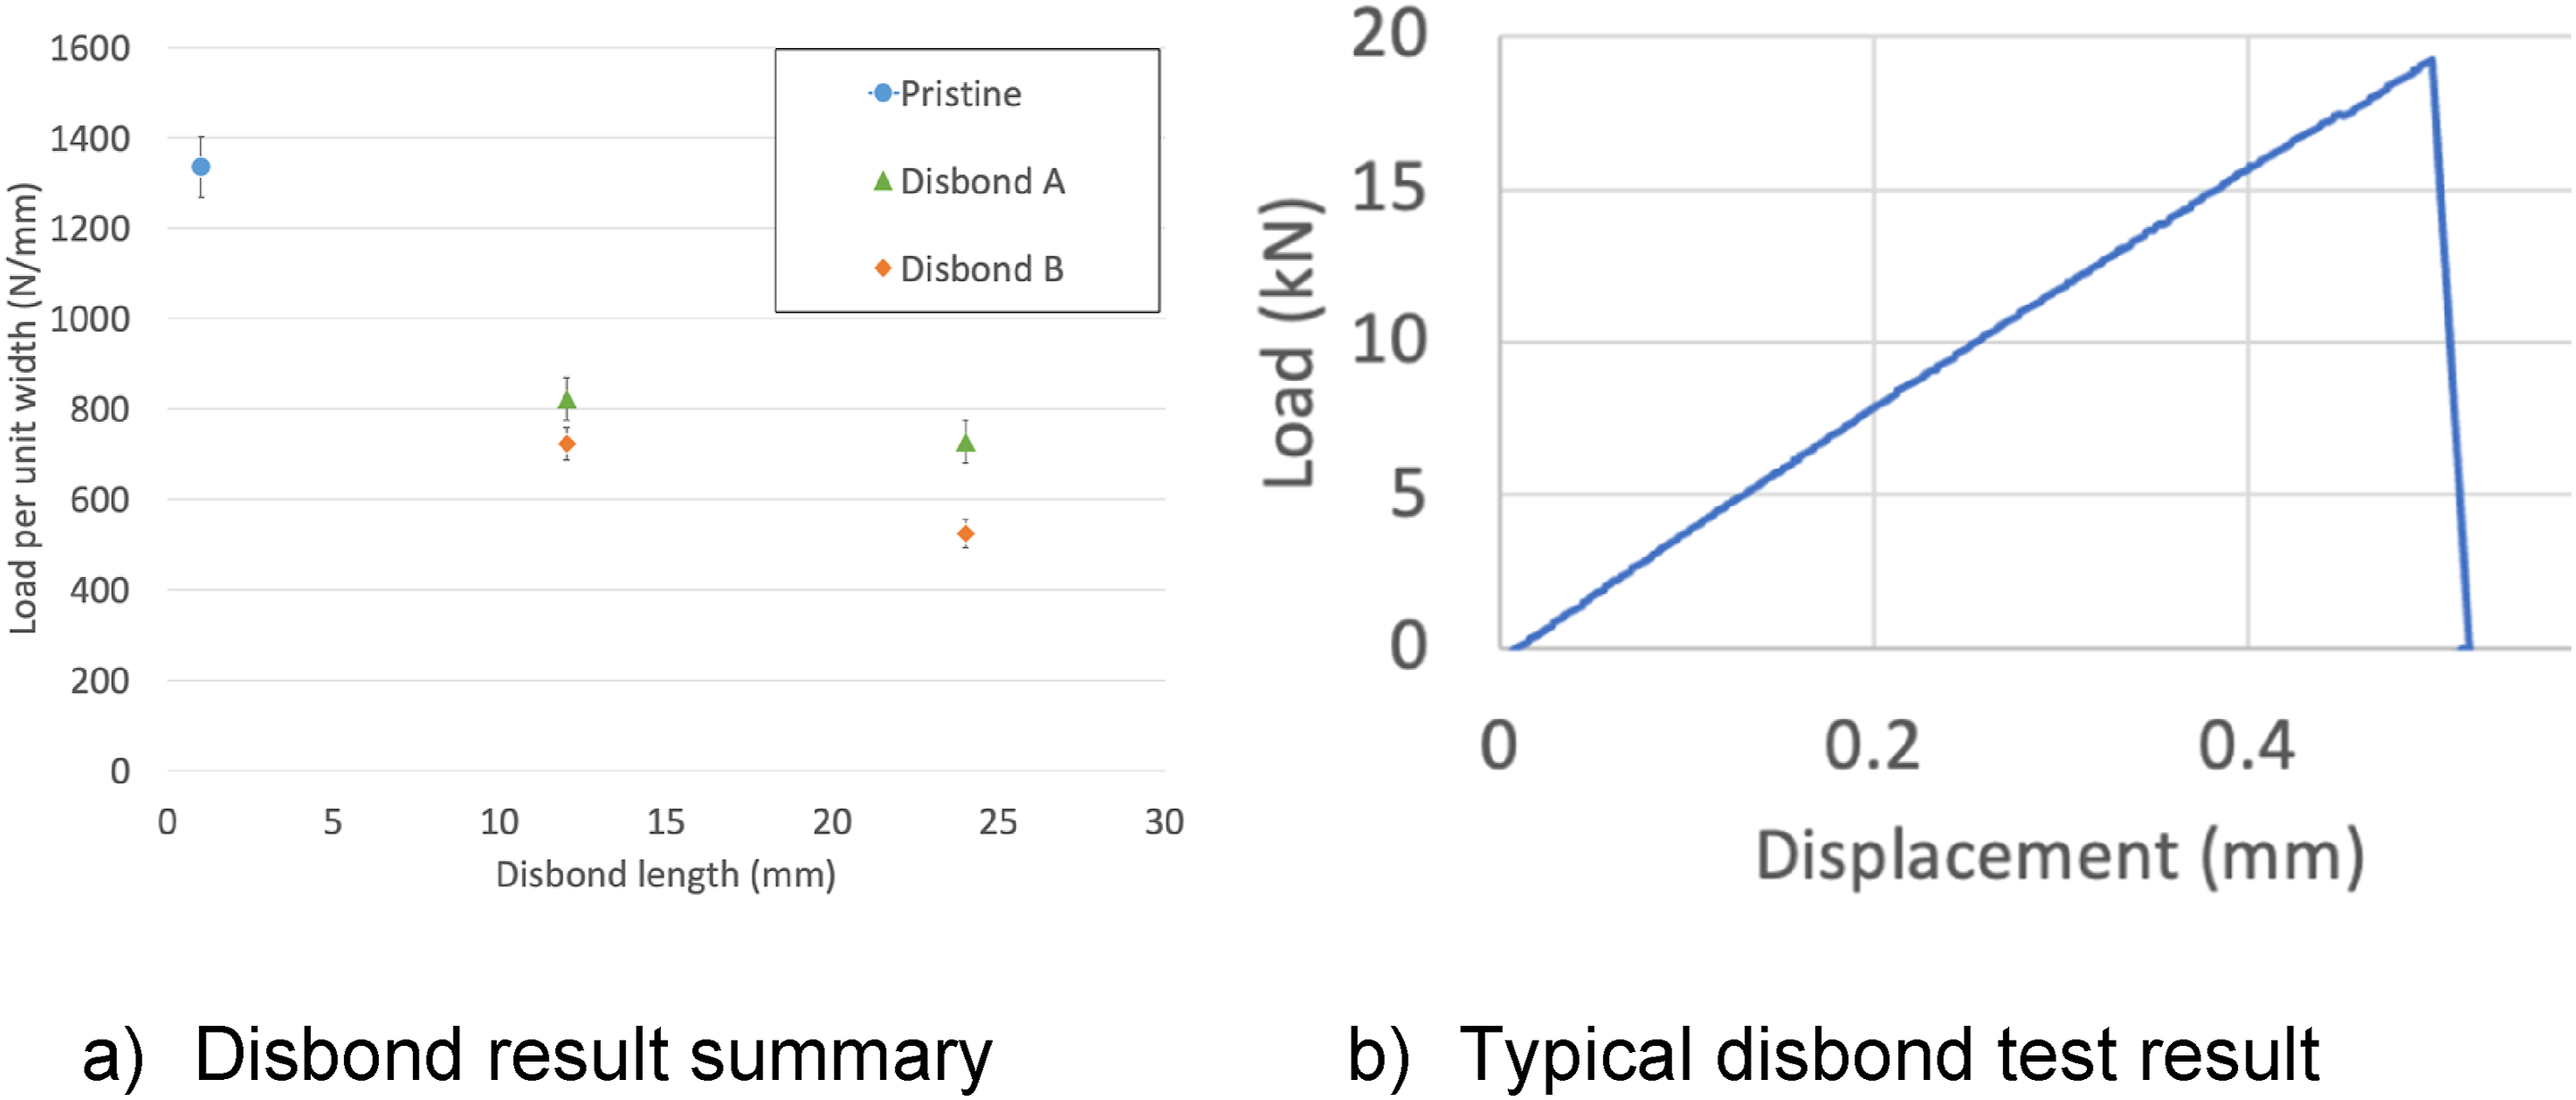
Summary of disbond results.
Disbond failure mechanisms
Images of the typical failure mechanism for the 24 mm disbond at the inner adherend/adhesive interface (Disbond B) were captured using a Photron high-speed camera in Figure 11. To achieve a high frame rate to capture the failure process in detail, the high-speed camera was focused at the disbond location reducing the overall resolution and achieving a frame rate of 100,000 frames per second. Analysing the high-speed camera images, no damage was visible prior to unstable failure, and the crack migration into the composite adherend was sudden. Paul et al.
27
explained the effects of the grit blasted surface treatment, which resulted in microscopic regions of broken fibres, and led to failure migrating into the composite rather than remaining in the tougher adhesive. The high-speed camera images show that the crack propagated from the insert film directly into the surface 0° ply in the Disbond B cases. Detailed high-speed camera of Disbond B case.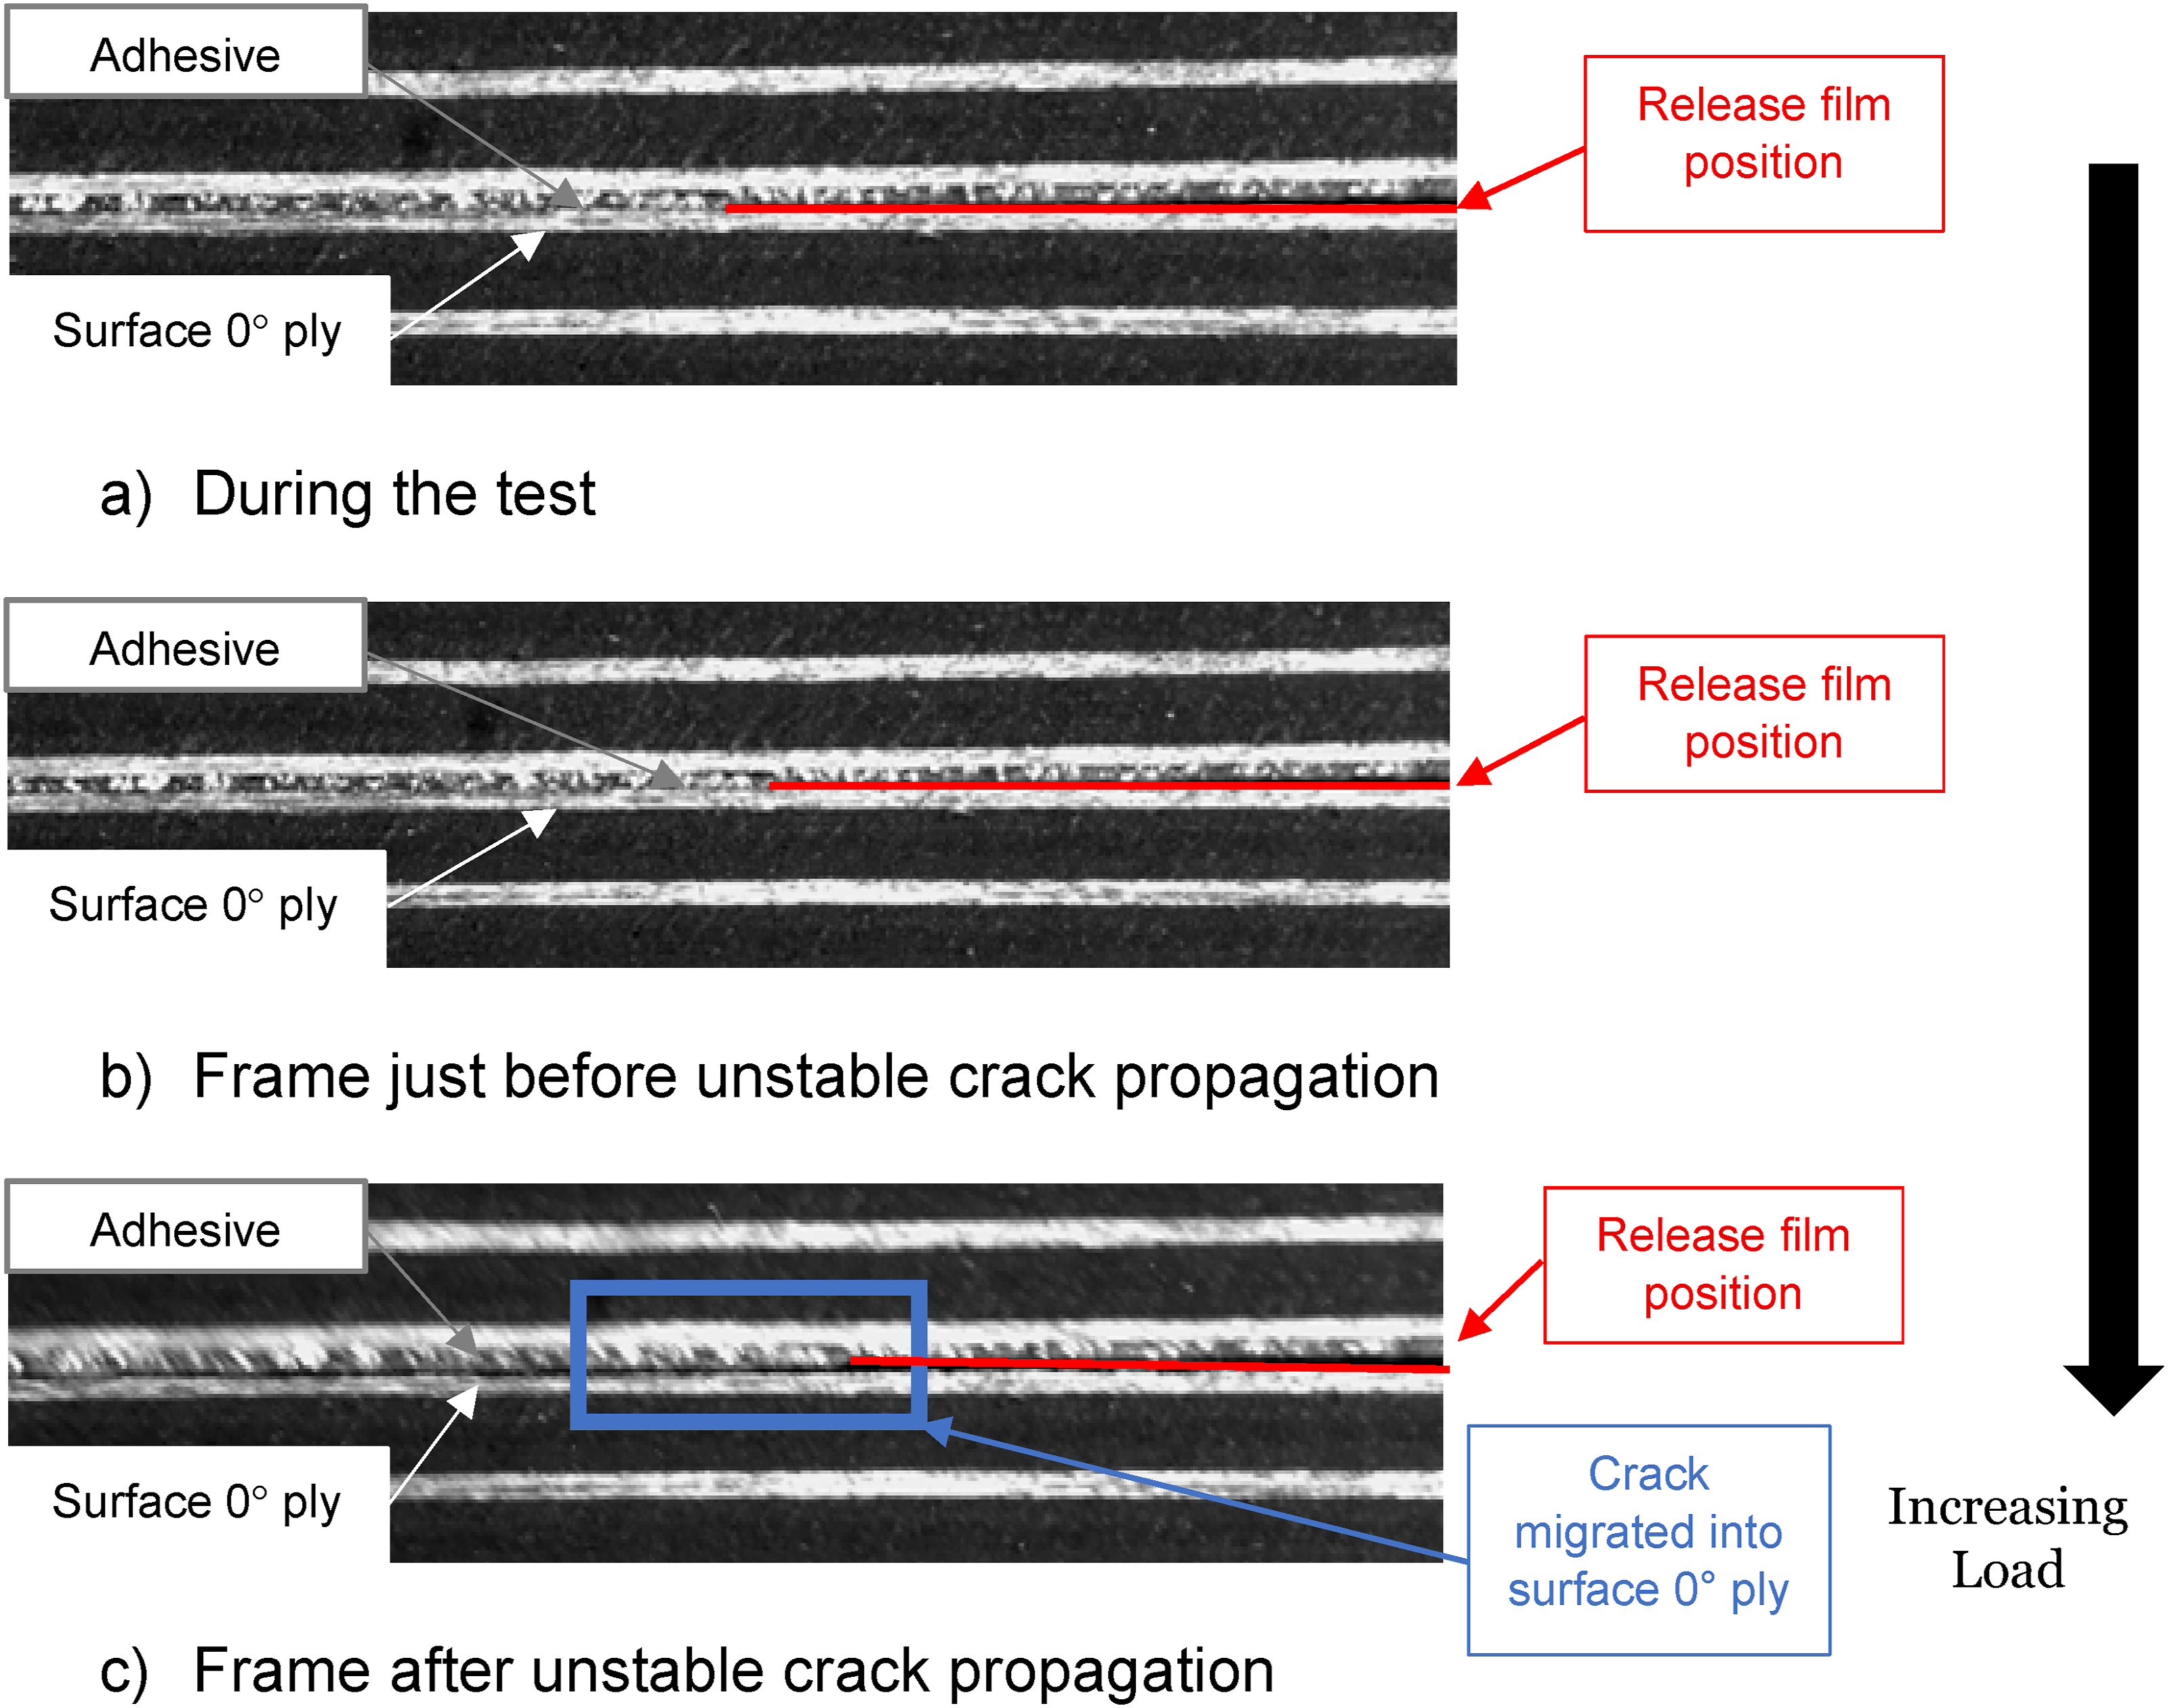
When the position of the disbond changed from the inner adherend to the outer adherend (Figure 12(a)), a significant difference in DLJ strength was observed. Analysing the fracture surface for these cases in Figure 13, a consistent failure surface was observed as the crack propagated along the 0˚ surface ply in the inner adherend for all disbond cases. The effect of changing film insert position was also visible in Figure 13. In Disbond A cases, there is a visible change of texture in the fracture surfaces at the inner adherend interface, because the film insert was initially above the adhesive and then jumped to the composites below the adhesive. In Disbond B cases, there is a no obvious change of texture in the fracture surfaces at the inner adherend interface, because the film insert was initially at the adhesive and inner adherend interface and then migrated straight into the composites below the adhesive. Disbond B (Figure 13(b)) resembles the fracture surfaces from the residual tensile tests after impact (Figure 7). Failure schematic of lower half of the Disbond cases. Fracture surfaces for disbond cases showing migration.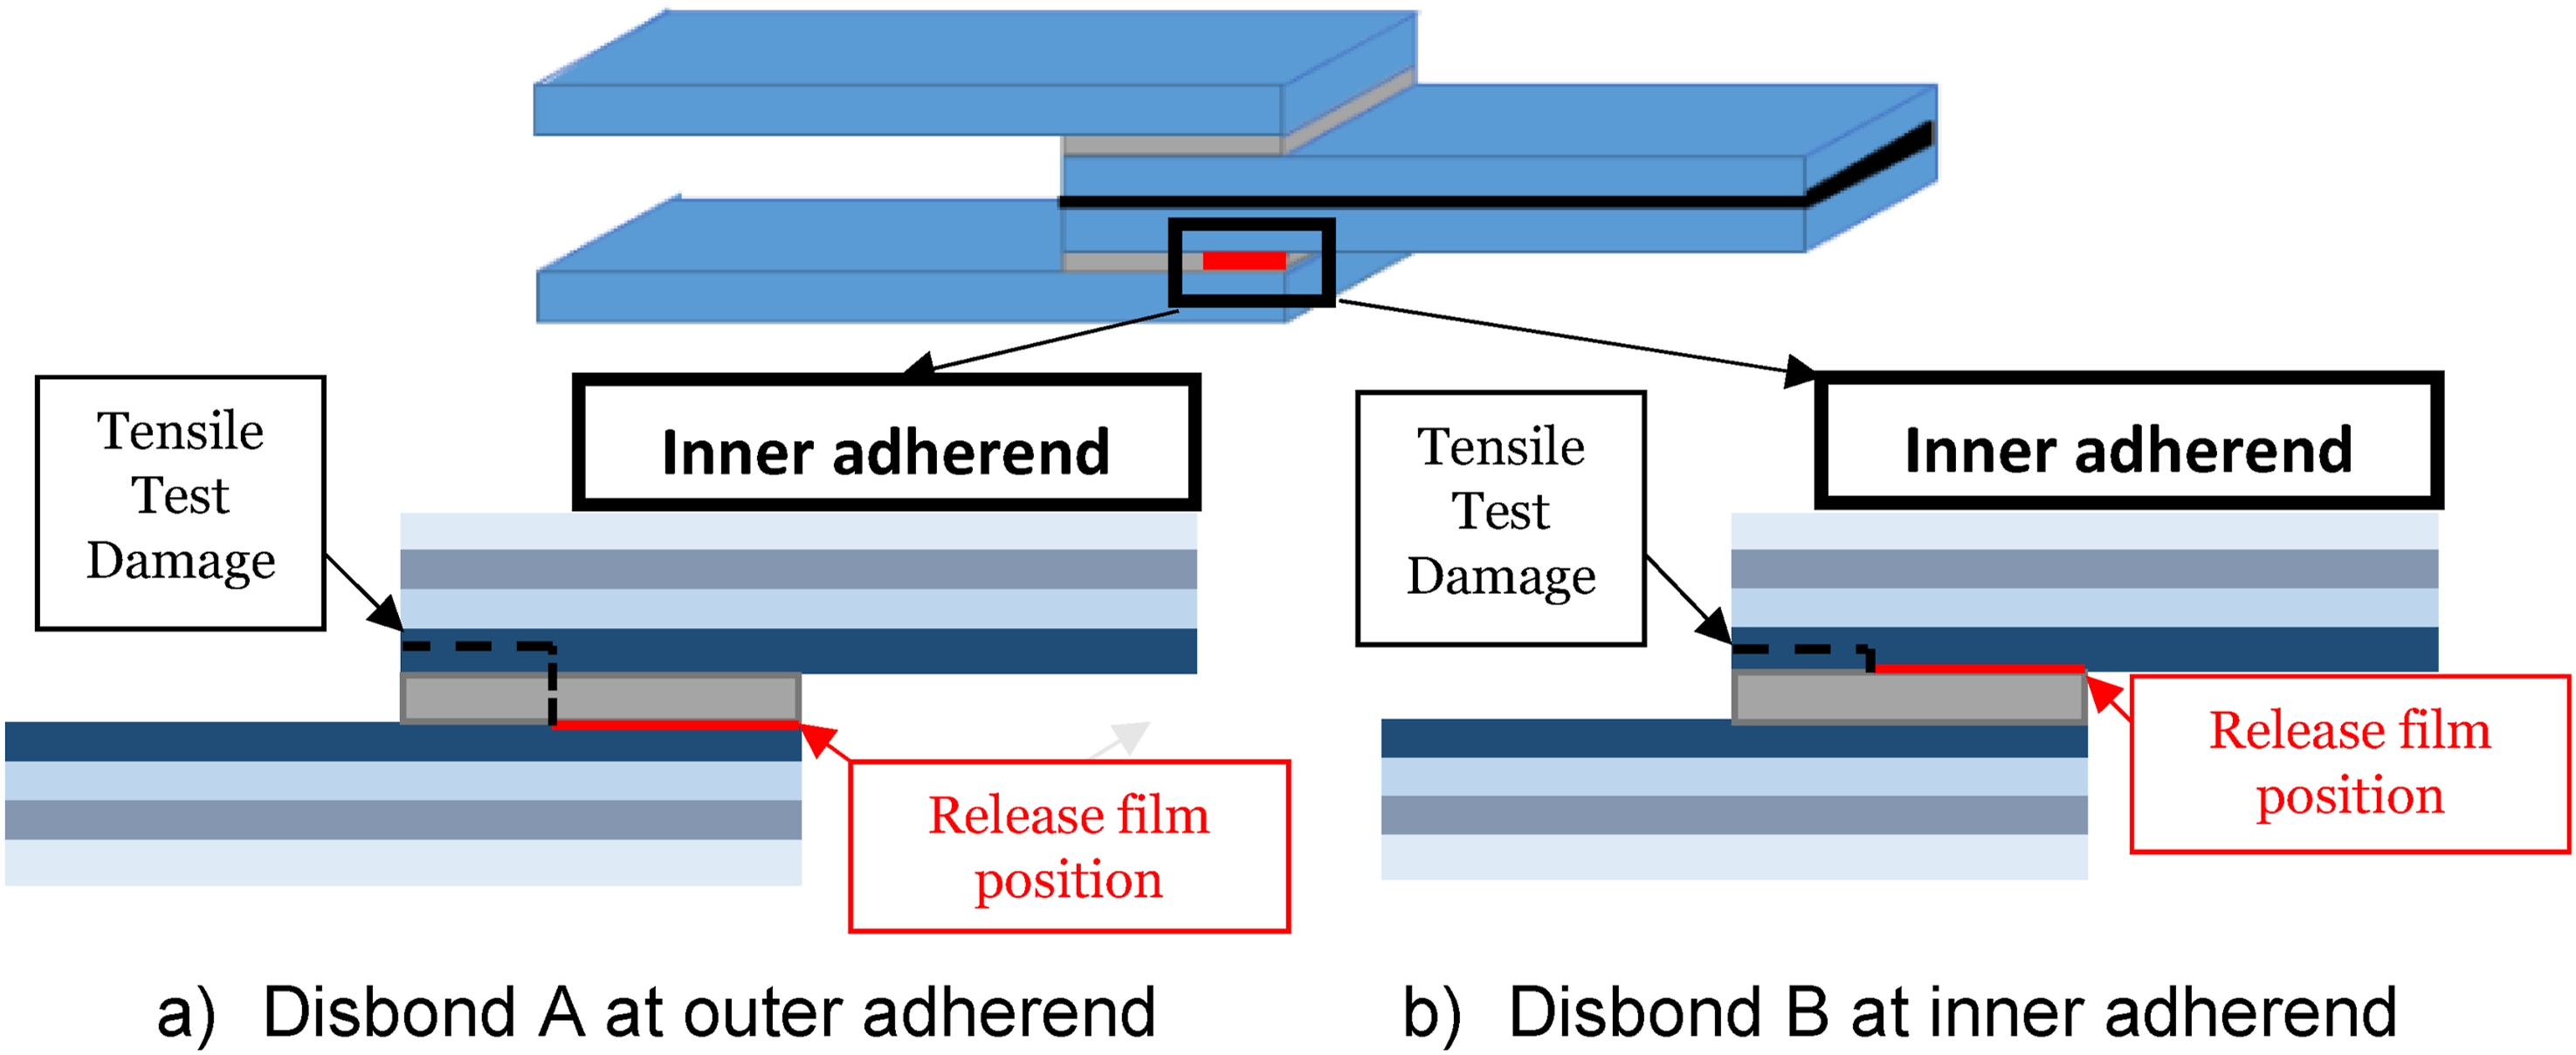
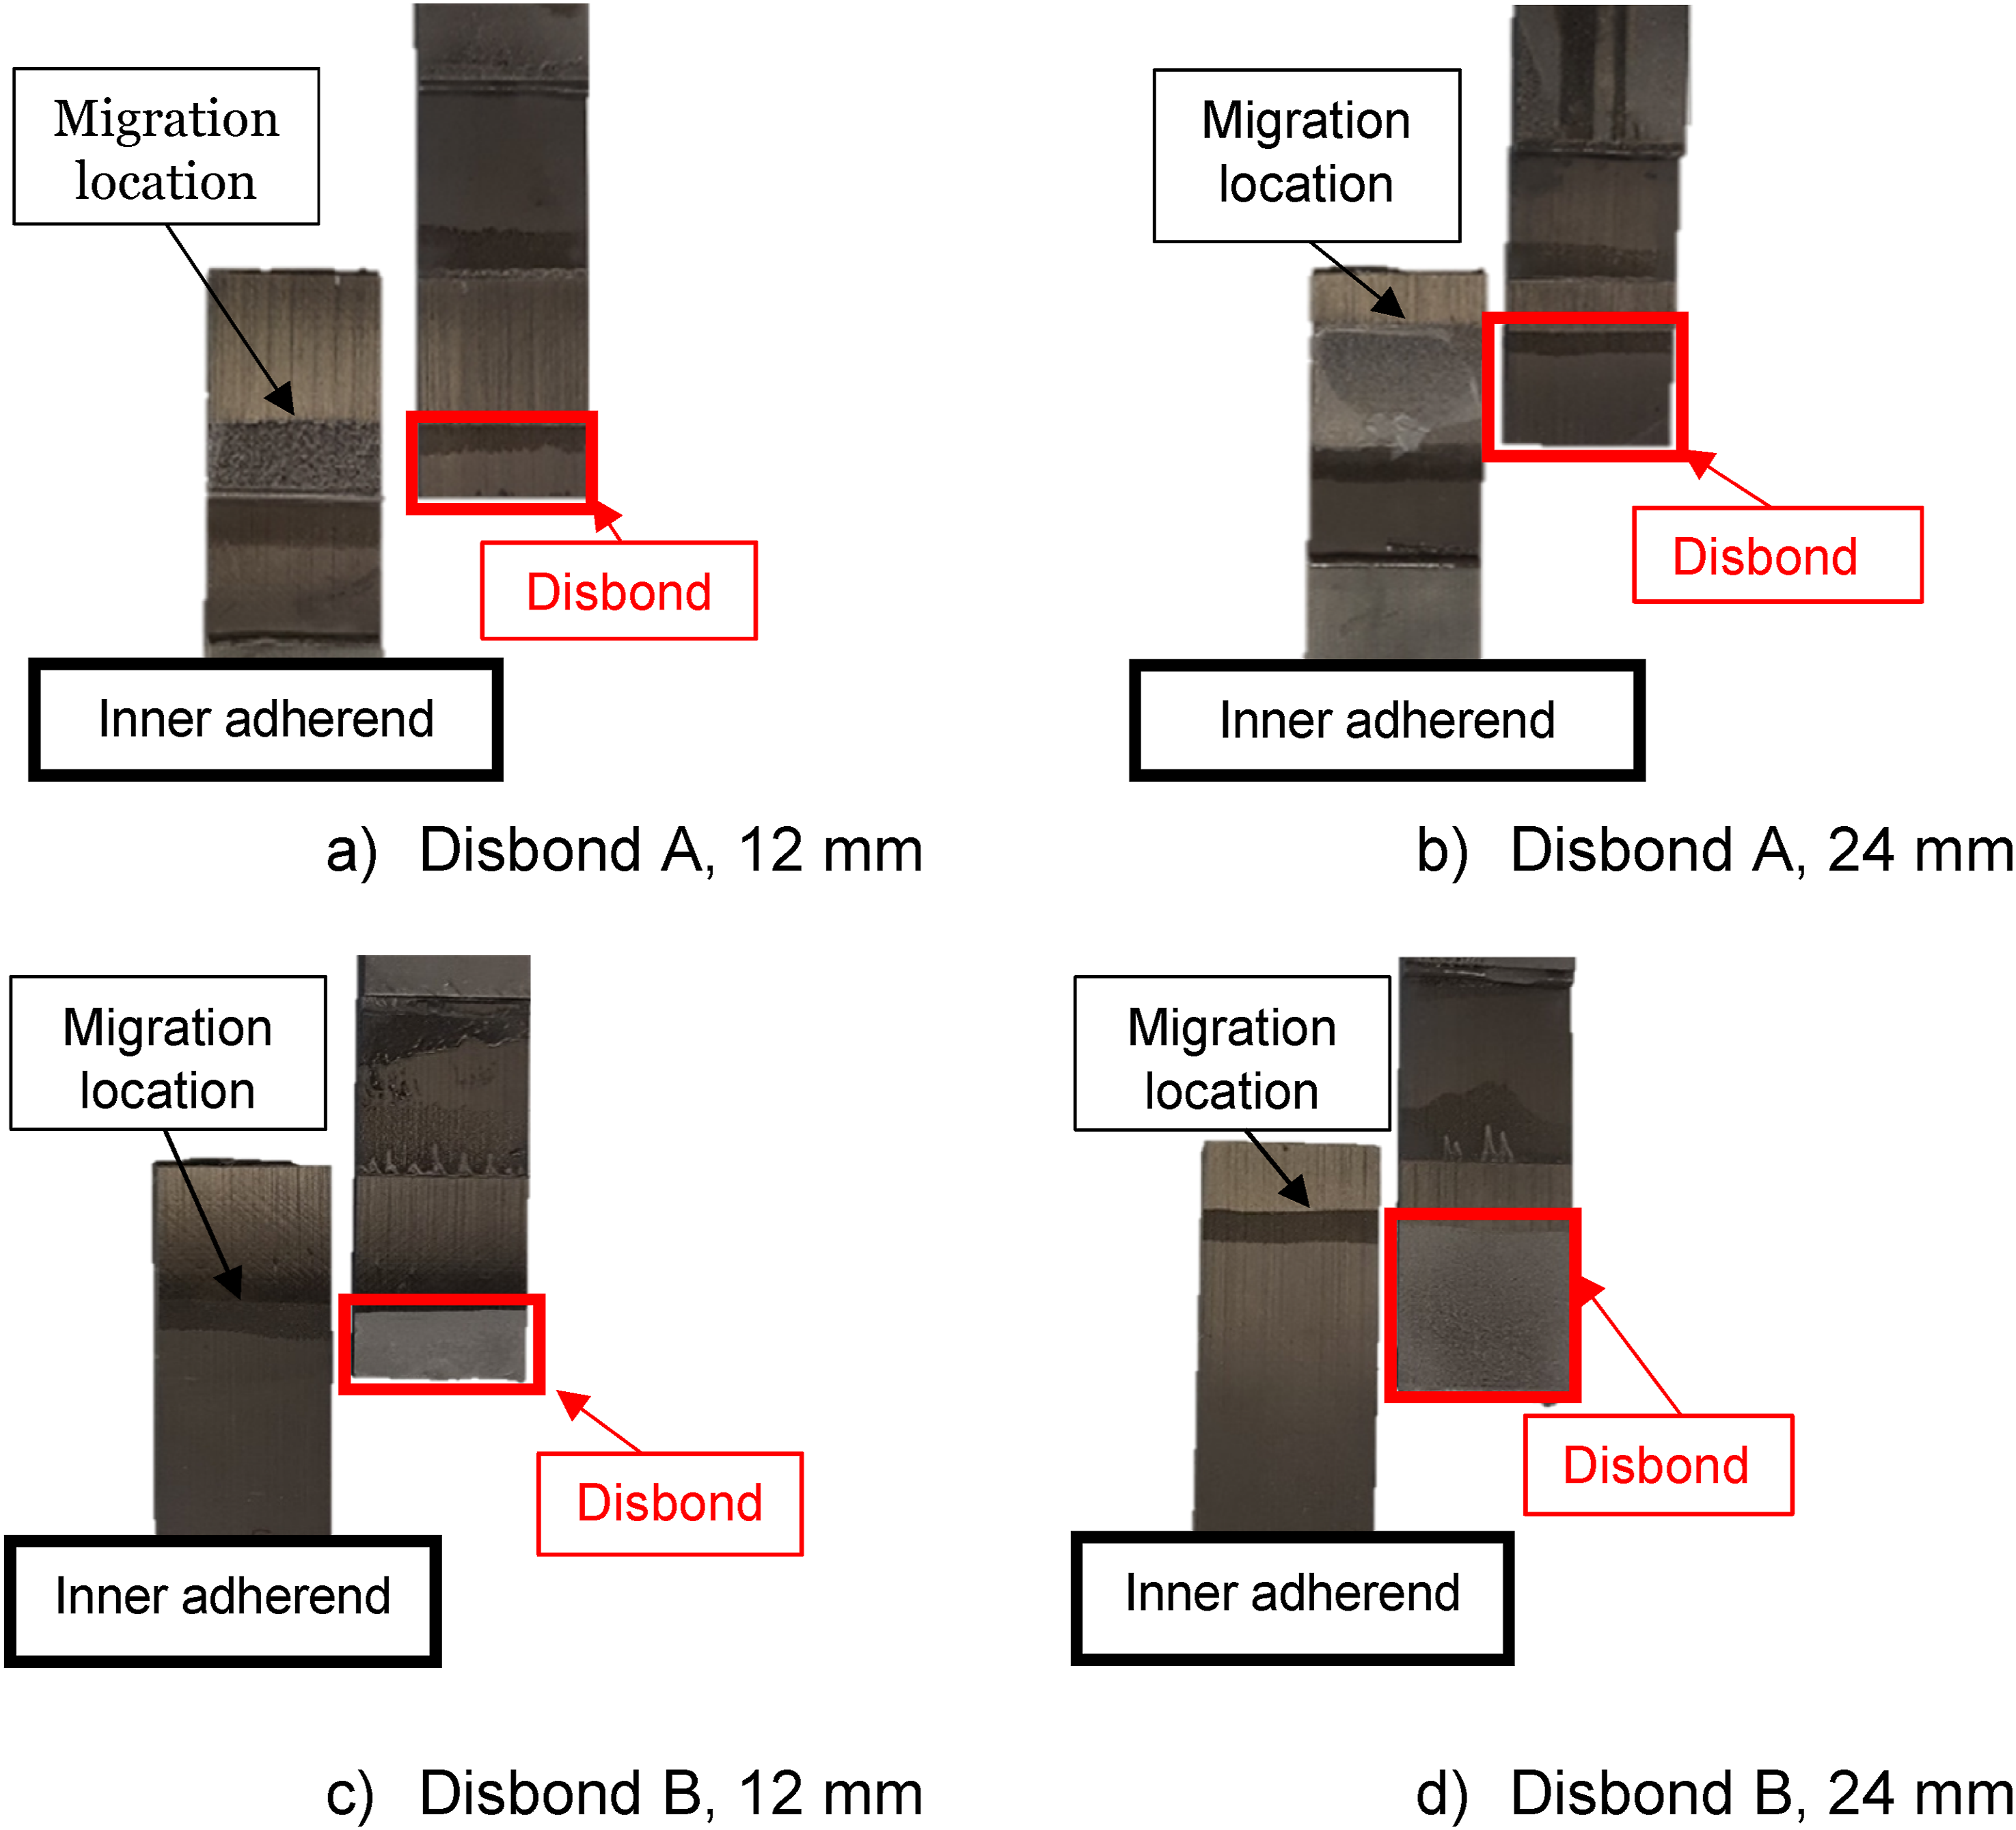
Figure 14 compares the residual tensile test results for the 2J impact energy case against the 12 mm Disbond B case, and 3J impact energy case against the 24 mm Disbond B case. The residual tensile tests after impact compared well with the Disbond B results. This is because in all impact tests the crack already migrated into the surface 0° ply at the inner adherend, and in the Disbond B cases the crack also migrated immediately into the surface 0° ply of the inner adherend from the film insert. Comparison of disbond versus impacted DLJ tensile test results.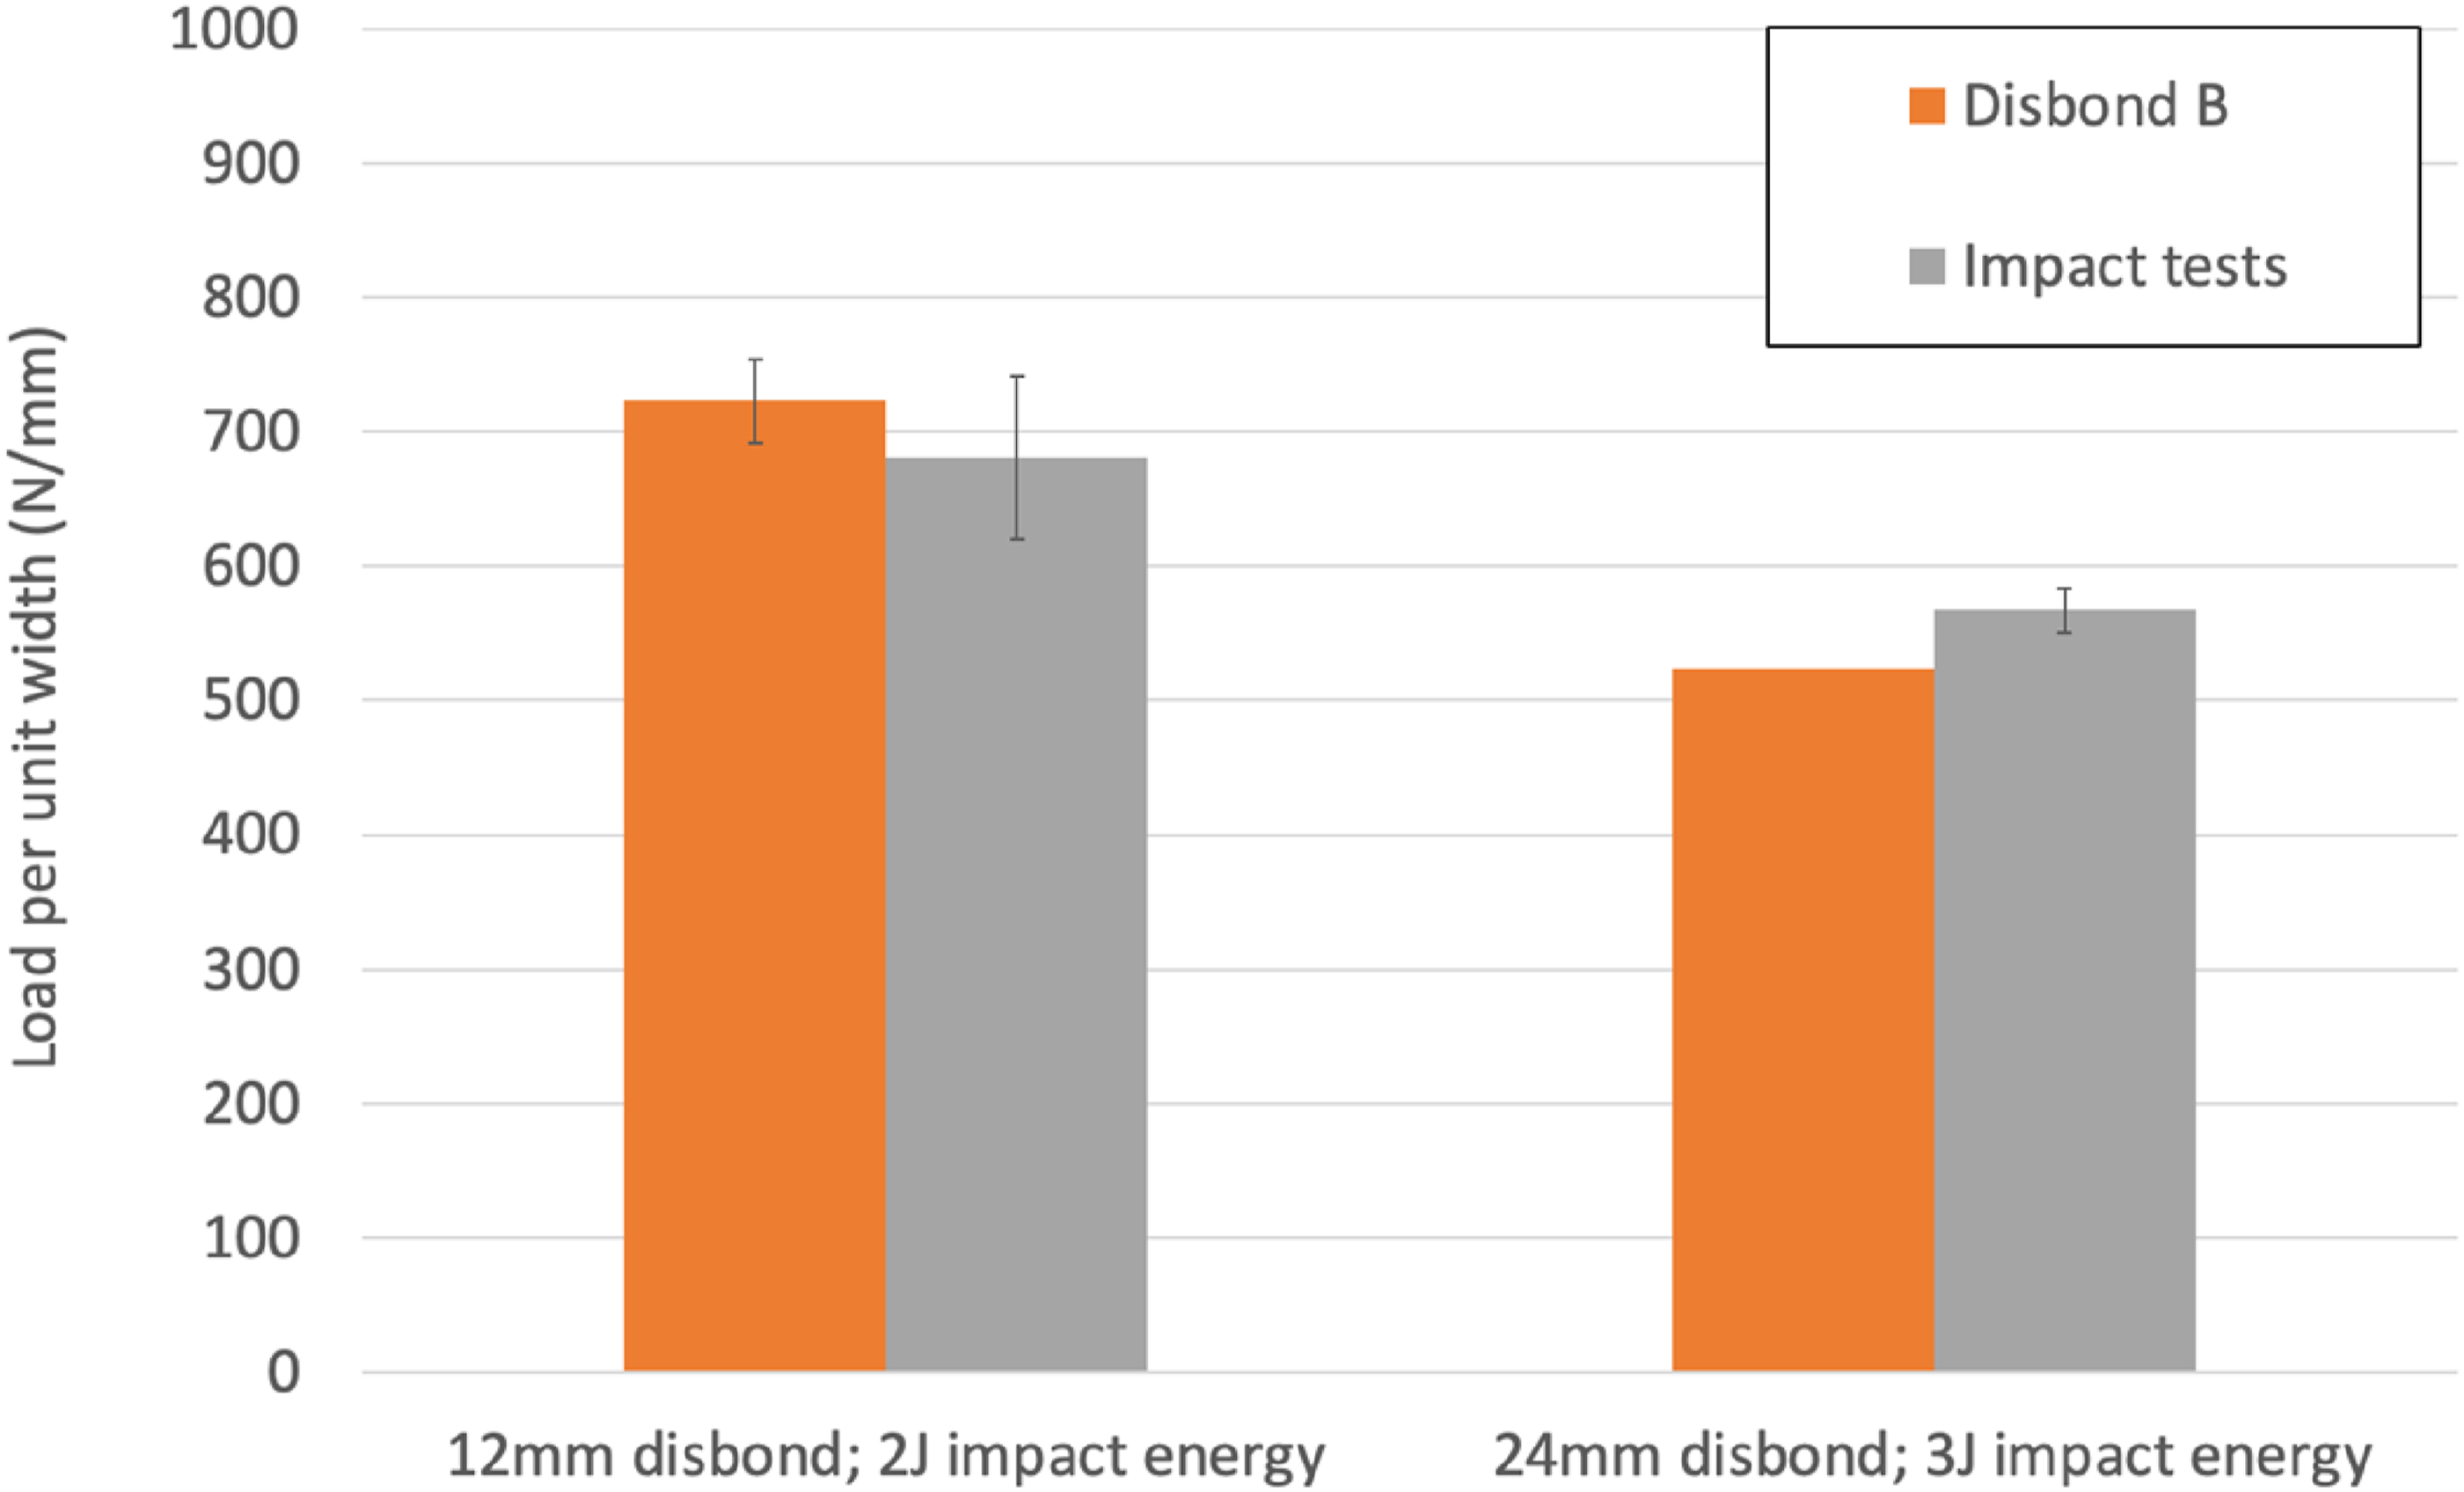
Numerical modelling
Model set-up in ABAQUS
Following the experimental study on the joint impact and disbond configurations, a numerical analysis was conducted to further understand the failure mechanism with impact damage using ABAQUS Standard.
The elements used were incompatible mode plane stress elements (CPS4I). The 2-D model had a uniform mesh (0.125 mm) as shown in Figure 15. A mesh sensitive study was conducted using even smaller elements (0.0625 mm), and the results were within 3.4%, so the mesh was considered adequate. The nodes at one end were fixed, with uniform displacements applied to the nodes at the other end horizontally. Adhesive bondlines were also modelled with a thickness of 0.2 mm (two elements through the thickness), taking the adhesive thickness loading offset into account. The material properties used for the adhesive are linear elastic and isotropic (E = 3.8 GPa, ν = 0.33). A temperature drop of 160°C was applied as a pre-defined field at the initial step before the displacements were applied to generate the thermal residual stress between the adhesive and adherend. FE mesh and boundary conditions.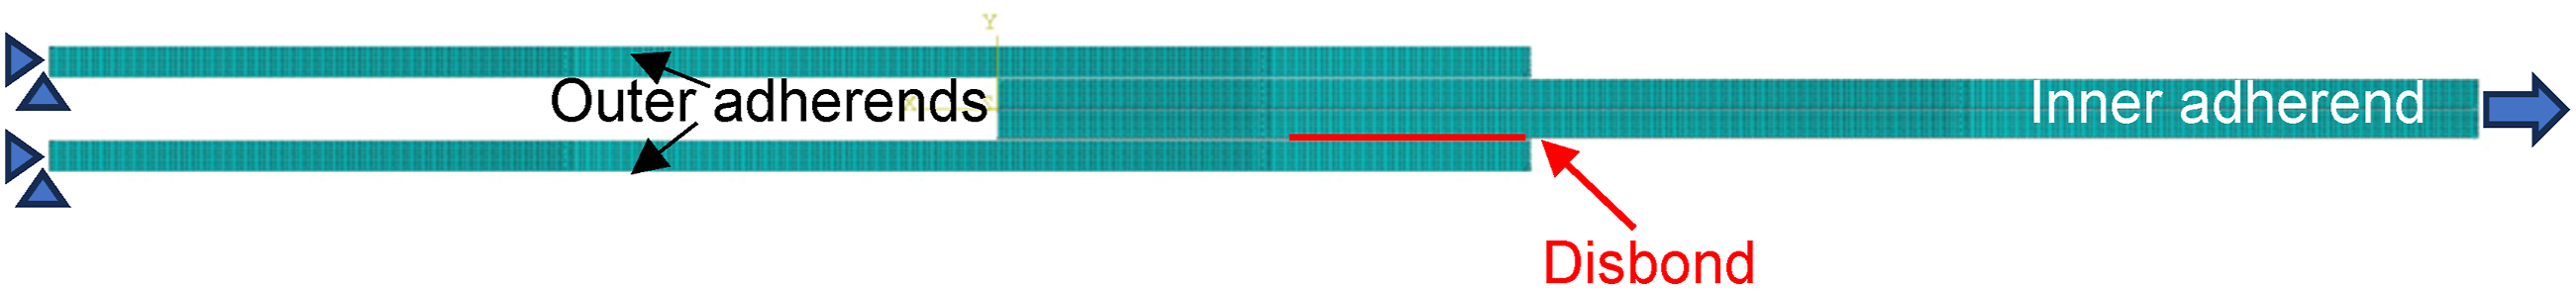
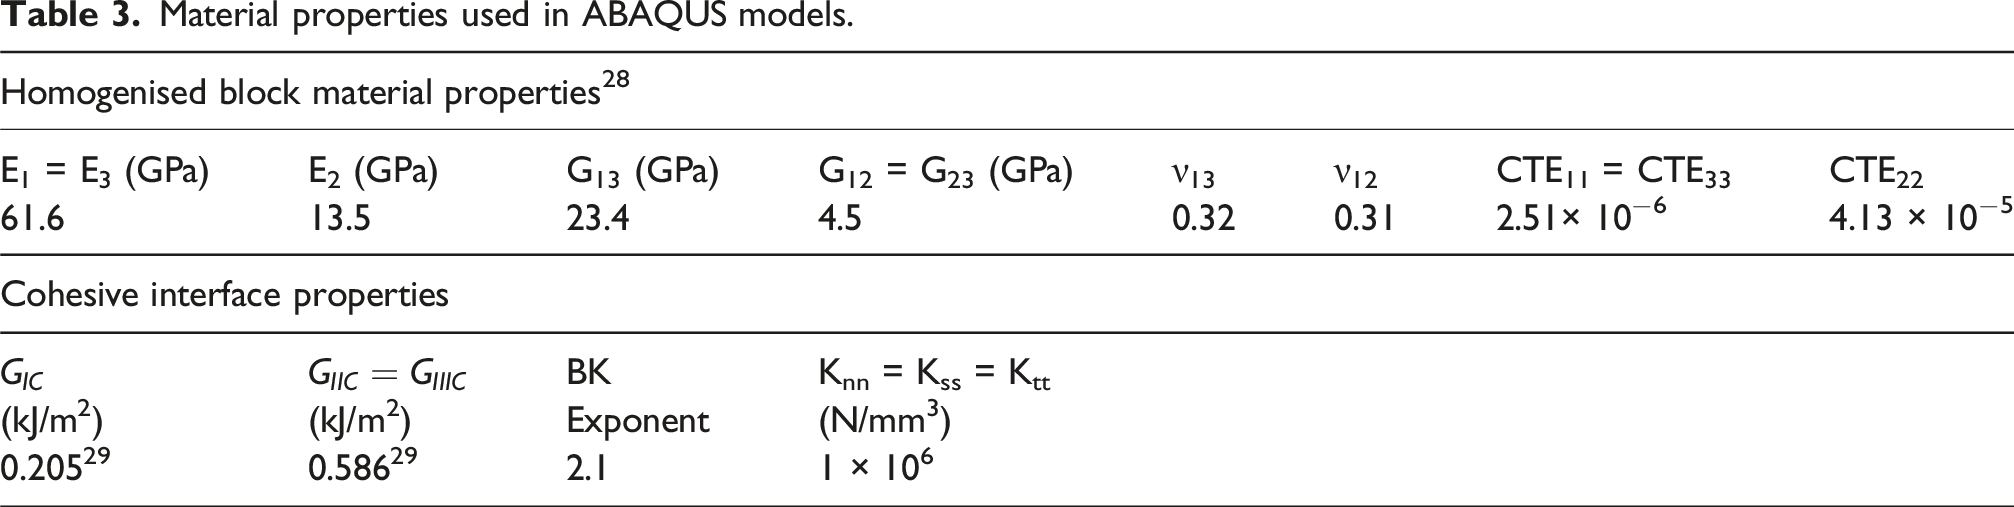
Surface interactions were used between the adhesive and the inner adherend to represent delamination like in the Disbond B case as shown in Figure 16. Two disbond lengths of 12 mm and 24 mm were represented by pre-defining different bonded node sets. Delamination from the disbond was simulated by using a fracture criterion based on the Virtual Crack Closure Technique (VCCT). The input parameters for VCCT were based on the fracture toughness of the composite adherends since the crack had already migrated into the composite inner adherend. All material properties used for modelling are listed in Table 3. The input properties are from the previously published data for the same material.28,29 Surface interactions near inner adherend. Material properties used in ABAQUS models.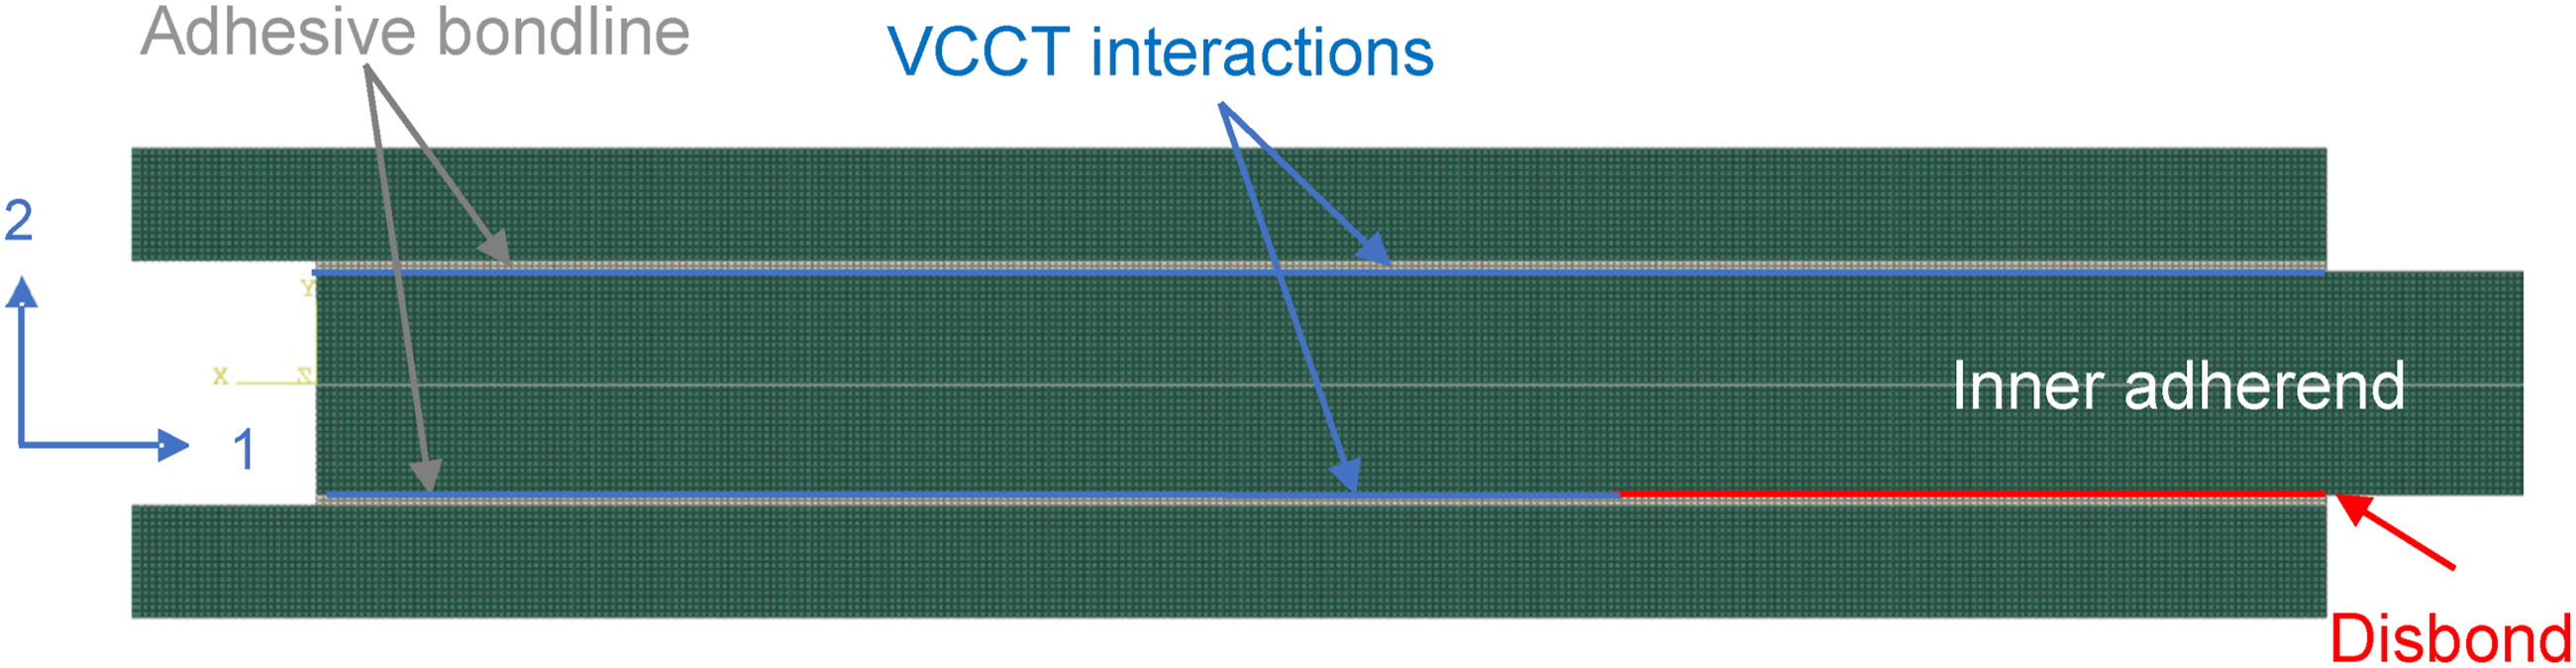
Modelling results
The ABAQUS models can capture the asymmetry of the damage, either a disbond at the inner adherend or impact damage, and the asymmetry of loading under tension. They predict delamination propagation after the crack has already migrated into the surface 0° ply. The predicted failure loads are the peak loads in the simulations as the surface separates.
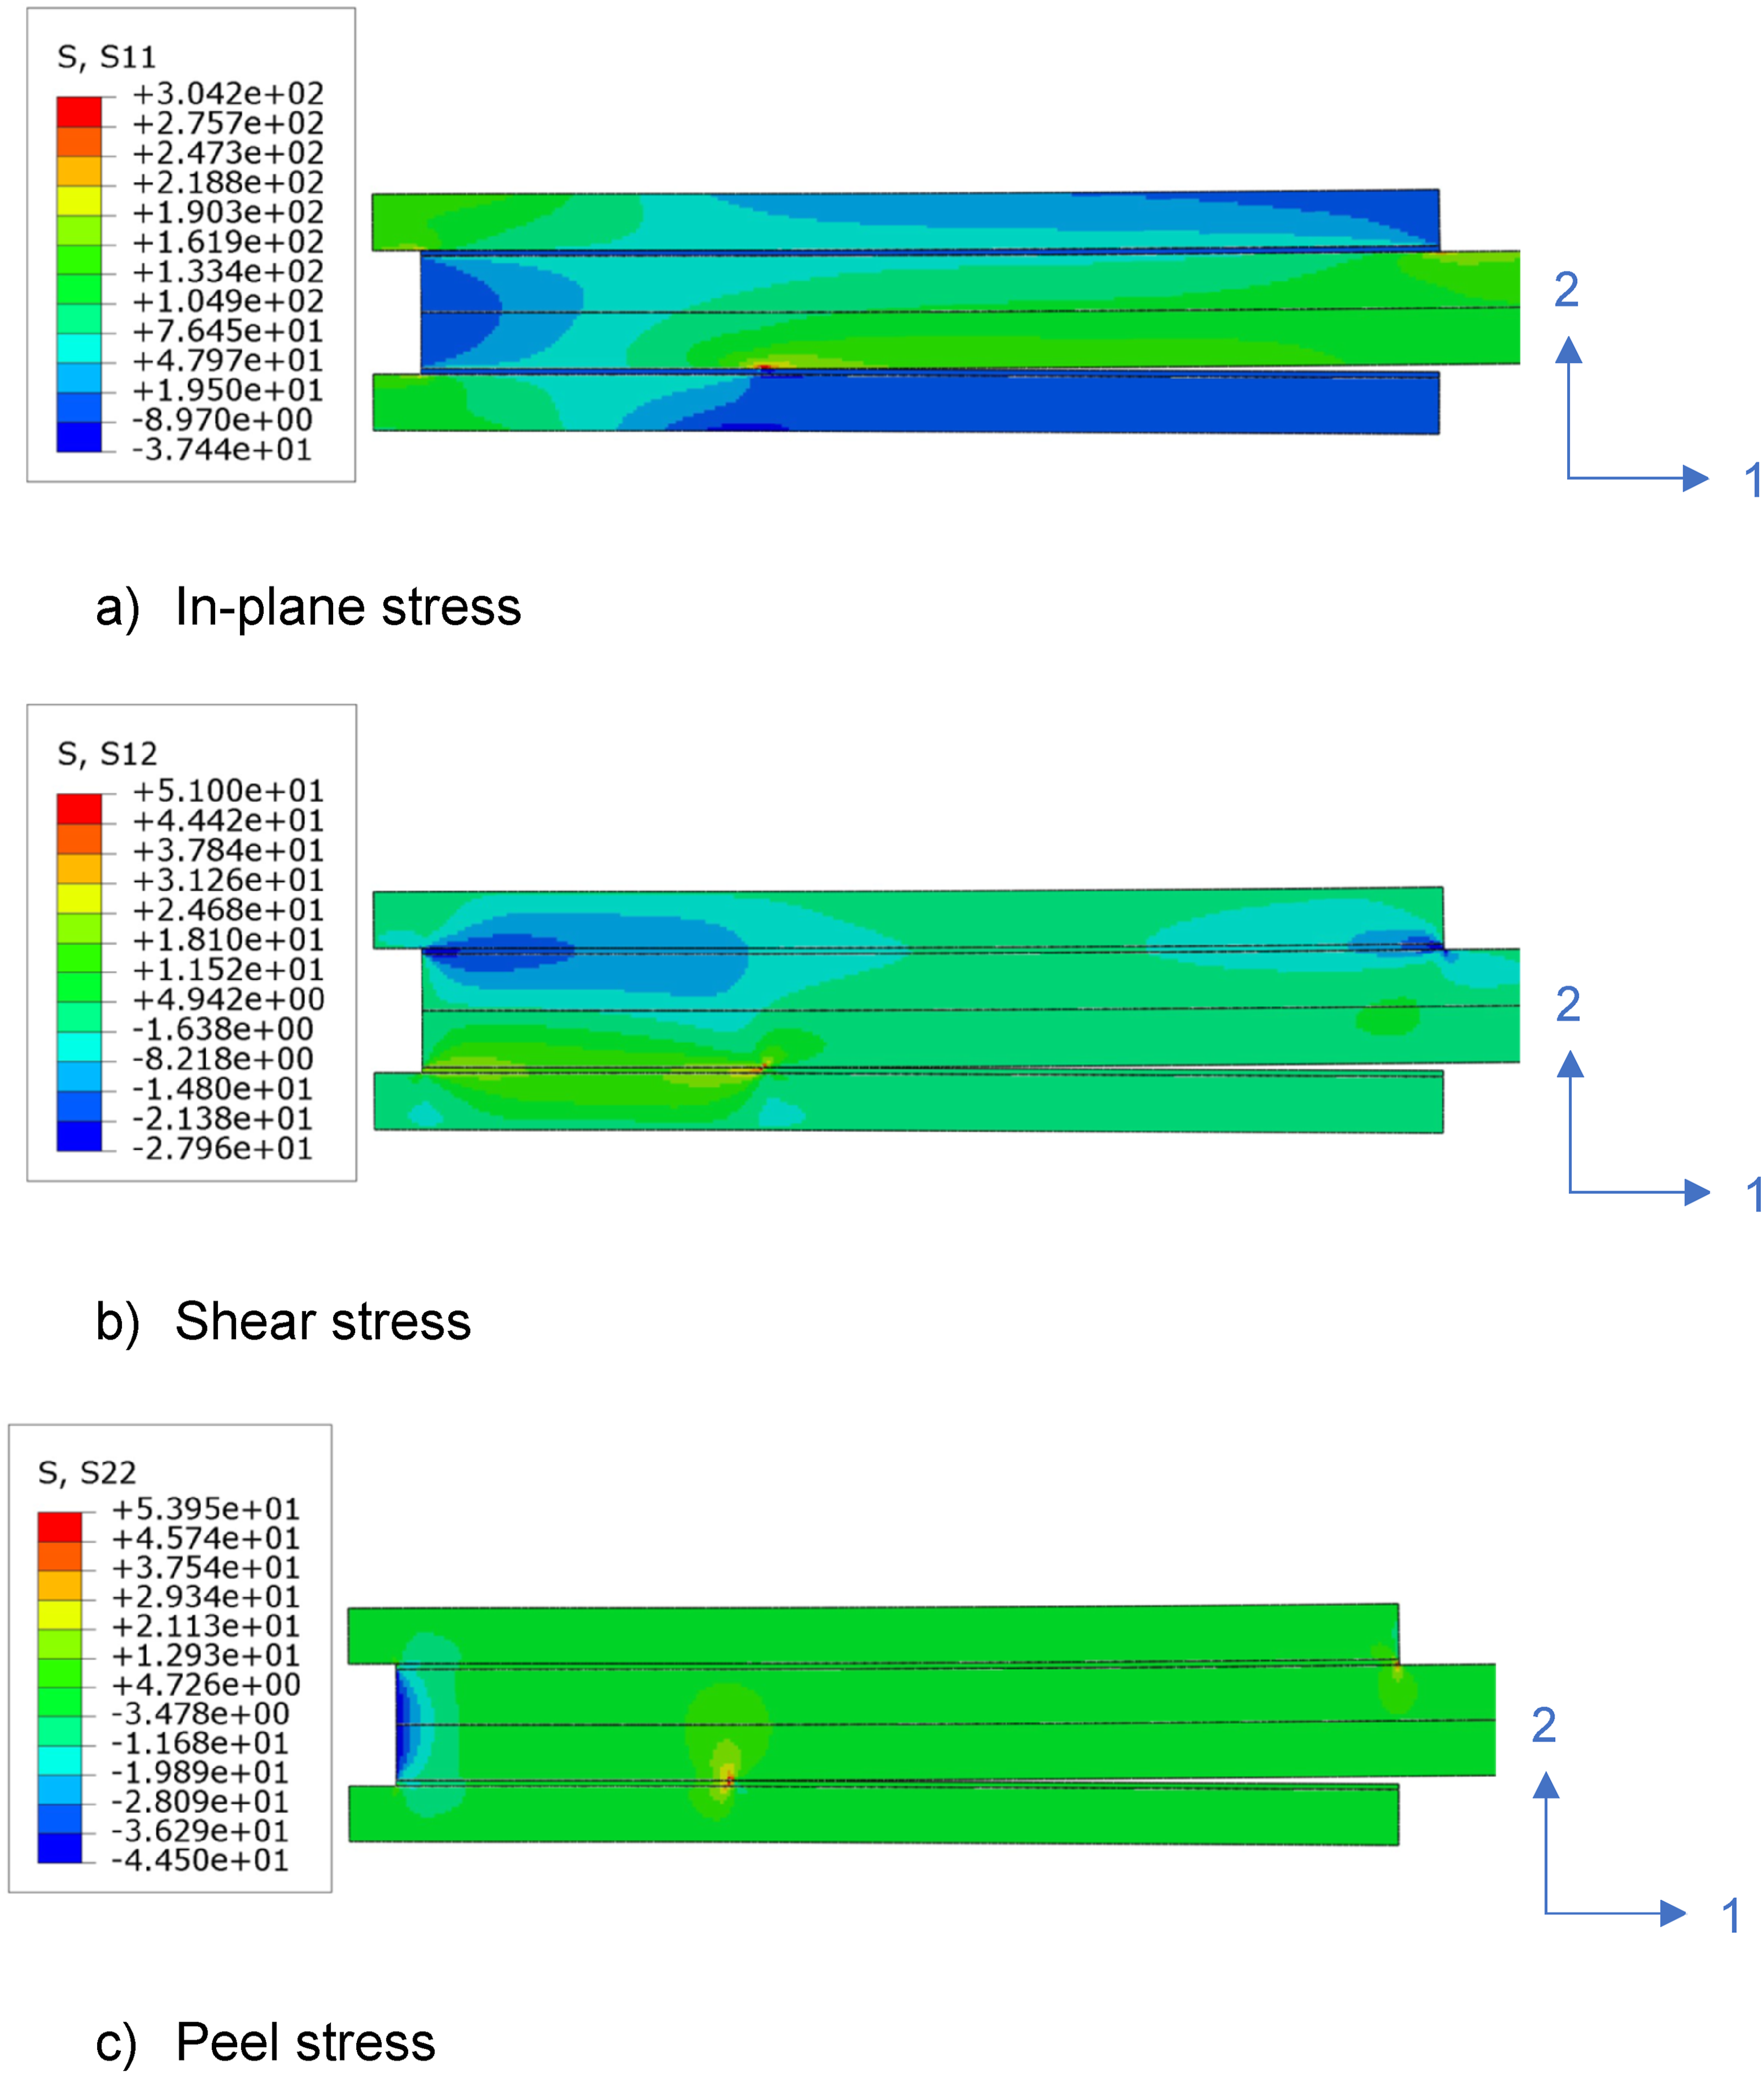
The numerical models correlate well with both sets of experimental results as shown in Figure 17. This is because ABAQUS VCCT can calculate accurately the energy release rates considering the asymmetry of damage and stress distribution within the DLJ as shown in Figure 18. As a result, the consequent mode mixity was found to decrease from 50% Mode II at 2J impact energy (approximately 12 mm disbond length) to 45% at 3J impact energy (approximately 24 mm disbond length) when delamination propagates. This indicates an increase of the Mode I peel component as impact damage grows. The VCCT based mixed-mode fracture criterion is therefore sufficient for predicting the residual tensile strength post impact. Disbond experimental and modelling correlation. Asymmetrical stress distributions in the DLJ model post 3J impact under tensile loading.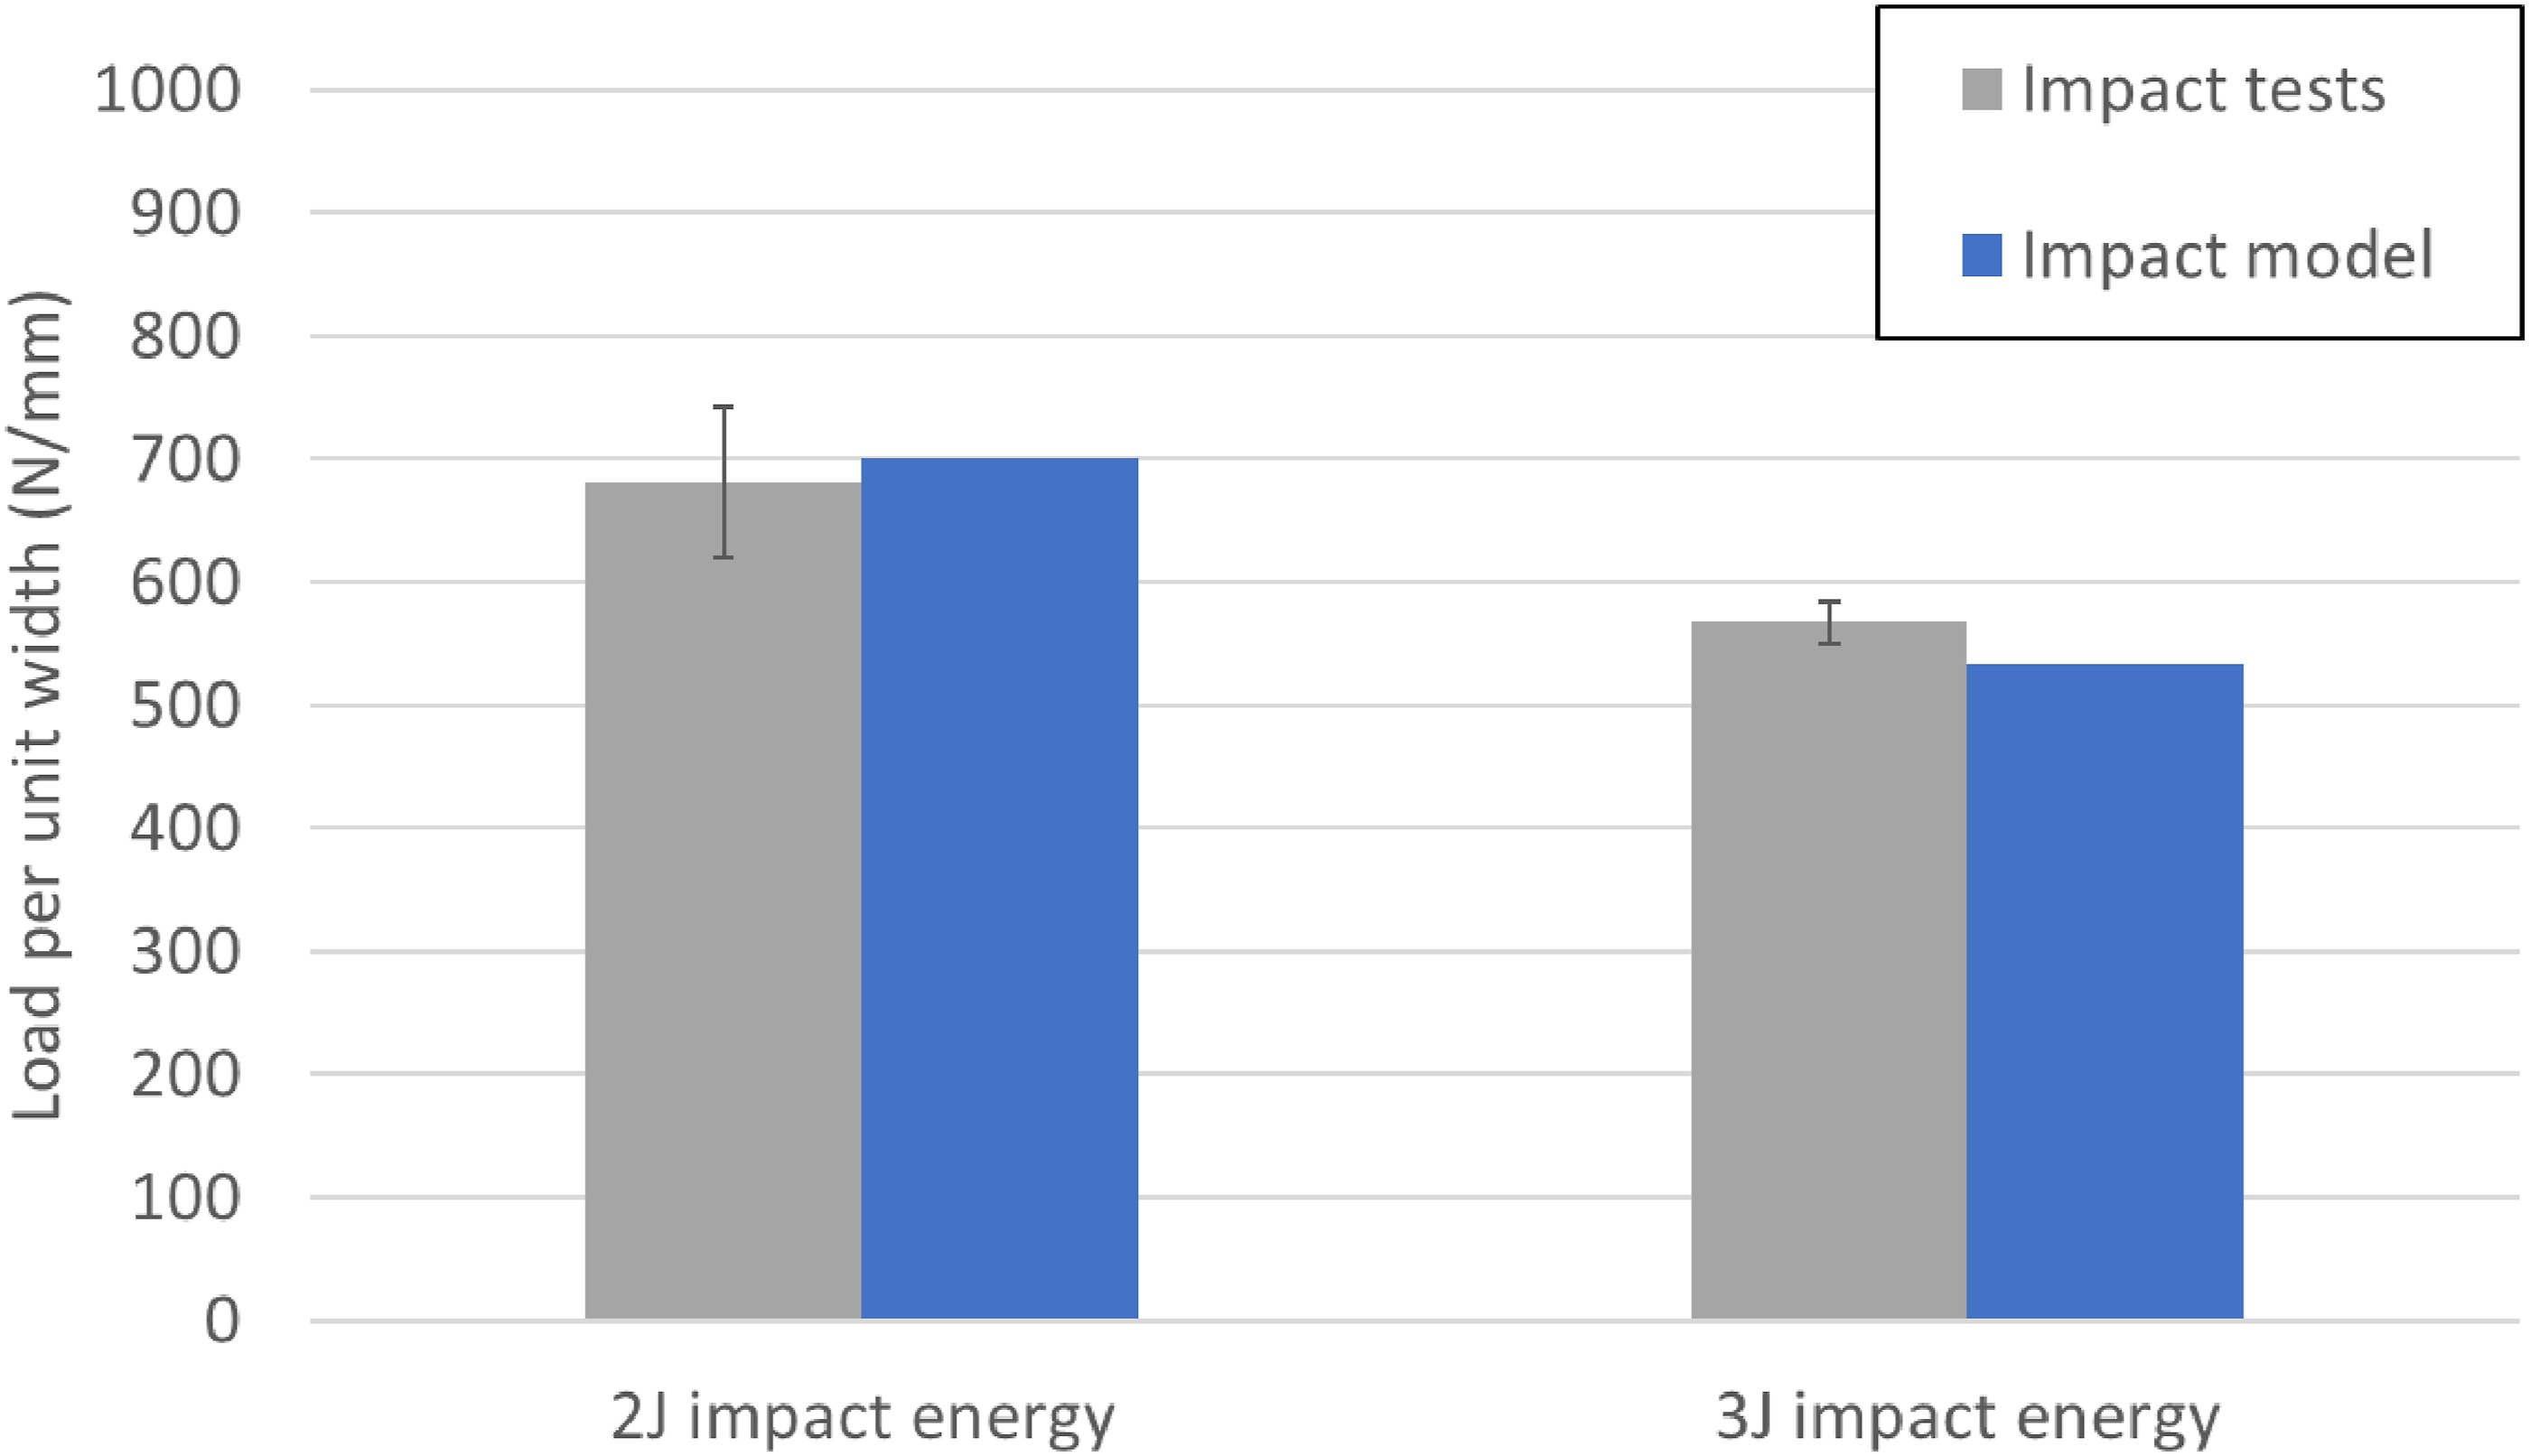
Conclusions
The residual tensile strength of DLJs post transverse impact was studied for two impact energy levels of 2J and 3J. The impact damage occurred in the surface 0° ply on the lower side of the inner adherend. From the residual tensile tests after impact, a 49% reduction of pristine DLJ strength after a 2J impact was measured compared to the reported pristine strength. A further decrease in DLJ strength (57% reduction of pristine strength) was found with the higher impact energy of 3J and resulting greater damage length.
Following the impact tests, joints with artificial disbond defects were tested to replicate the impact damage. Two disbond locations were considered, at the interfaces near the outer adherend and inner adherend. Increasing the disbond length decreased the DLJ strength for all cases. The crack migrated from the adhesive/composite interface into the surface 0° of the inner adherend during failure. It was found that the disbond near the inner adherend cases correlated with the impact cases due to the similar damage locations. However, the disbond nearer to the outer adherend gave a higher result, as it had to break the adhesive before being able to migrate into the composite.
A 2-D plane stress FE analysis using VCCT in ABAQUS standard was used to successfully predict the post-impact residual DLJ strength. Composite fracture properties were used to simulate delamination propagation since the sharp crack had already formed within the surface 0° ply post impact. The 2-D FE models captured the asymmetry of damage and stress distribution in the impacted joints and a change of mode mixity at different delamination lengths.
Footnotes
Funding
The author(s) disclosed receipt of the following financial support for the research, authorship, and/or publication of this article: This work was supported by Mitsubishi Heavy Industries LTD.
Declaration of conflicting interests
The author(s) declared no potential conflicts of interest with respect to the research, authorship, and/or publication of this article.
Data Availability Statement
The data that has been used is confidential.