
Abstract
Carbonous polymer matrix composites (PMCs) are considered among the potent candidates for piezoresistive sensing with their high gauge factor, high resolution, and applicability over large areas. However, non-linearity of their gauge factor at high strains and loss of sensitivity under cycling loading limit their widespread use. We produced a graphite-enhanced graphene nanoplatelet (GNP)/polyvinyl alcohol (PVA) composite piezoresistor to stabilize the gauge factor under various loading conditions. As a highly conductive ubiquitous material, graphite provided a backbone conduction pattern. GNPs in conjunction with the PVA matrix, on the other hand, introduced piezoresistivity to the composite paste. GNP/PVA piezoresistor pastes with graphite loadings from 5 wt.% to 40wt.% were tested both free standing and as applied on a plexiglass substrate. We report reliable and repeatable responses at a gauge factor of up to 40 and without sensitivity loss under cycling loading. The graphite enhanced GNP/PVA combining it with structural health monitoring (SHM) provided a failure prediction without the requirement of big data storage or high computational capability. We developed an in-house read-out circuit that was a low-cost replica of commercial multimeter to measure the change in resistance. We also developed an algorithm that determined the failure of a brittle material 350 s (first warning) and 10 s (second warning) before the actual failure.
Keywords
Introduction
Piezoresistive sensors are promising for long-term structural health monitoring (SHM). They can traditionally be divided into two groups with respect to their material types: (a) conductive (metals) and (b) semi-conductive materials. While S-shape metal sensors are the most prevalent ones in literature, semiconductor-based sensors offer a higher gauge factor than the metal ones. Therefore, their sensitivity is also higher. Micro or nano-scale silicon-based sensors are reliable thanks to their high sensitivity and state-of-the-art feedback designs. 1 However, their cost is high due to complicated production processes. Hence, they are not suitable for large-area implementation.
Alternatively, emerging carbon-based piezoresistive sensors, which are also the core of this paper, are promising due to their high sensitivity and low production cost. Carbon fibers, carbon nanotubes (CNT),2,3 graphene,4,5 graphene nanoplatelets (GNP),6,7 and reduced graphene oxide (rGO) 8 are the most common carbon-based filler materials for piezoresistive sensors. There are various studies about piezoresistive sensors, but the sensors in paste form are especially attractive. Their simple use and comparably low prices make them desirable in large-area applications. Their form allows fast application to any place in the structure, even for hard-to-reach areas. In this sensor type, polymers are mostly used as a carrier matrix, and a carbon material like CNT is used as the sensing element.
In long term SHM, piezoresistors are expected to have high environmental resistance in addition to sensitivity. In literature, there are several studies to improve mechanical properties as well as electrical properties with different matrix formations. Wei et al., 9 for instance, produced a pressure/strain sensor from a conductive composite hydrogel (CCH). They crosslinked polyvinyl alcohol (PVA) with glutaraldehyde (GA) to obtain noticeable fatigue resistance that lasted up to 1500 cycles with high elasticity (0–300%). Liu et al. 10 also reported a successful piezoresistive sensor. Their sensor utilized a wrinkled graphene film (WGF), interdigitated electrodes, and PVA nanowires instead of crosslinked PVA. High elasticity with high sensitivity (28.34 kPa-1) resulted from the synergy between the WGF and PVA nanowires. Liu et al. 11 took advantage of electrospinning to gather nanofibers of poly (3,4-ethylenedioxythiophene) and poly (styrene sulfonate) with PVA (PEDOT: PSS-PVA). They obtained a remarkable gauge factor of 396 and a high range of electrical conductivity from 4.8 × 10⁻⁸ to 1.7 × 10⁻⁵ S/cm. Zhang et al. 12 produced PEDOT: PSS-based PVA hydrogel with a crosslinker (glutaraldehyde). The composite hydrogel had 70 kPa tensile strength with 239 % elongation at the breakage point. Pan et al. 13 manufactured a proanthocyanidins (PC)/reduced graphene oxide (rGO)/PVA hydrogel-based electronic skin with high elasticity of over 5000 %. Its unique structure facilitated strain-sensitive and self-healing behavior (95.73% recovery in 3 s). Chen et al. 14 also designed a self-healing hydrogel from the PVA. An agarose/PVA double network was presented in their study. The dynamic borate bond provided full recovery of strength and elongation in about 10 s at ambient conditions. Xu et al. 15 produced a PVA-based flexible strain sensor using PEDOT: PSS/carbon nano coils. The sensor detected 1 to 10% strain under a constant temperature gradient of 30K.
The type of carbonous nanomaterials is also differentiated to obtain a highly conductive piezoresistor and/or better mechanical properties. Xu et al., 15 for example, used carbon nano coils to enhance the conductivity of their sensors, whereas Pan et al. 13 preferred to obtain the same advantage from rGO. Namdev et al. 16 produced epoxy nanocomposites and reinforced them with graphene nanoplatelet (GNP). They observed a tensile strength up to 67.5 MPa with an elastic modulus of 3.5 GPa. On the other hand, Sethy et al. 17 improved the electrical properties of their polymer matrix composite beam. They were able to manufacture a sensor with a gauge factor of 77 and an initial resistance of 21 kΩ. Qi et al. 18 also preferred to use GNP to improve the electrical properties of their cement composite piezoresistor. They additionally utilized rGO to enhance the sensor’s response to dynamic loading. Similarly, Tao et al. 19 selected GNP to increase the electrical response of their cement composite piezoresistor. They discovered that at low loads, GNP significantly affected the piezoresistivity.
The composite piezoresistor with carbonous materials is promising for SHM. Unfortunately, realizing a stable and repeatable response under cycling loading is still an elusive issue. Costa et al. 20 produced graphene oxide (GO)/styrene-ethylene-butylene-styrene (SEBS) and rGO/SEBS composites. Cycling loading test results of GO/SEBS showed a variation in gauge factor. Additionally, results of rGO/SEBS showed a decrease in sensitivity, even though they reached a gauge factor of 120. Gonçalves et al. 21 also recorded a similar fluctuation and a decrease in gauge factor when they tested their multi-walled carbon nanotube/polyvinyl alcohol samples. In 10 cycles under 10% strain loading/unloading, normalized resistance (ΔR/R0) decreased from 0.1 to −0.05 (the peak points’ values). Bosque et al. 22 proposed a GNP/PDMS sensor to monitor human motion. Filler ratios of 7, 9, and 11 wt.% were investigated under 1, 3, and 5 % strain cycles. All sensors responding to 1% or 5 % strain cycle showed an exponential decrease in the normalized resistance plot (a significant decrease in gauge factor). The 3% strain cycle plot showed gauge factor variations without a monotonous downward trend in the normalized resistance plot. The sample with lower filler ratios gave a more substantial reduction. Under a cycling loading, resistive response of graphene/PVA sensors demonstrated similar fluctuations in gauge factor by Mehmood et al. 23 In their study, the lowest fluctuation in the gauge factor was approximately 0.2. The study by Dios et al. 24 shared the cycling test result of 5wt.% CNT/SEBS sample. The normalized resistance value from the 1st peak to 10th peak decreased from 11 × 10-3 to 7.5 × 10⁻³ in their experiments. Additionally, the trendline of the decrease in normalized resistance had some oscillations. Cui et al. 25 developed GO/PVA samples. The sample with 0.5 wt.% GO showed fluctuations in gauge factor and, contrary to previous studies, an increase in the baseline of the normalized resistance.
A graphite-enhanced GNP/PVA composite was introduced in this study to address the stability issue. Graphite particles were expected to facilitate a pseudo backbone for conduction paths where the GNPs can provide an enhanced piezoresistive response. The synergy between them was assumed to yield a reliable, repeatable, and clear response.
However, commercial structural health monitoring (SHM) devices are often expensive, multifunctional, and require high maintenance, making them less accessible for widespread use. To simplify SHM systems and reduce costs, we developed an in-house Arduino-based device for data collection. Instead of employing computationally intensive algorithms that demand significant memory, we utilized a straightforward comparison method, which proved effective in predicting failures. This approach not only simplifies the SHM system but also enhances its practicality for real-world applications.
This approach aligns with recent research advocating for low-cost, efficient SHM solutions. For instance, Caballero-Russi et al. designed and validated a low-cost SHM system using a wireless sensor network and simple data analysis techniques, demonstrating its effectiveness in dynamic characterization of structures. 26 Similarly, a study published in Sensors highlighted the development of a low-cost, low-power edge computing system for SHM, emphasizing the feasibility of using simplified algorithms for effective monitoring. 27 These studies support the notion that in-house devices, coupled with simple algorithms, can provide sufficient accuracy for SHM applications, making them practical alternatives to more complex and costly commercial systems.
Methodology
Materials
Polyvinyl alcohol powder was bought from Bereket Kimya (Istanbul, Turkey). The viscosity is 24.9 mPa.s with a degree of hydrolysis of 87.16 %.
Graphene nanoplatelet powder was purchased from XG Sciences (Michigan, USA). The GNP used in this work is Grade C graphene nanoplatelets, characterized by a surface area of 120–150 m2/g, average thickness of 5–8 nm, and particle diameter of 1–2 µm.
Graphite powder was supplied from EMD Millipore Co. (MA, USA). Particle size is smaller than 50 μm. The density and the bulk density are 2.2 g/cm3 at 20°C and 280 kg/m3, respectively.
Paste preparation
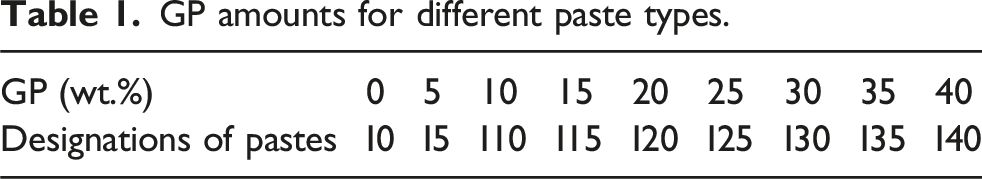
GP amounts for different paste types.
Sample preparation
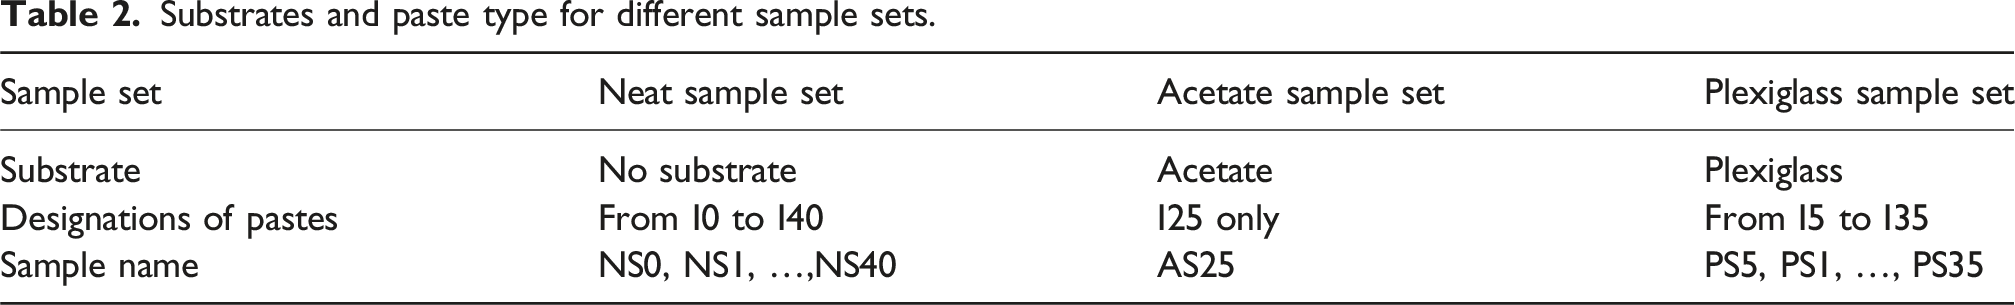
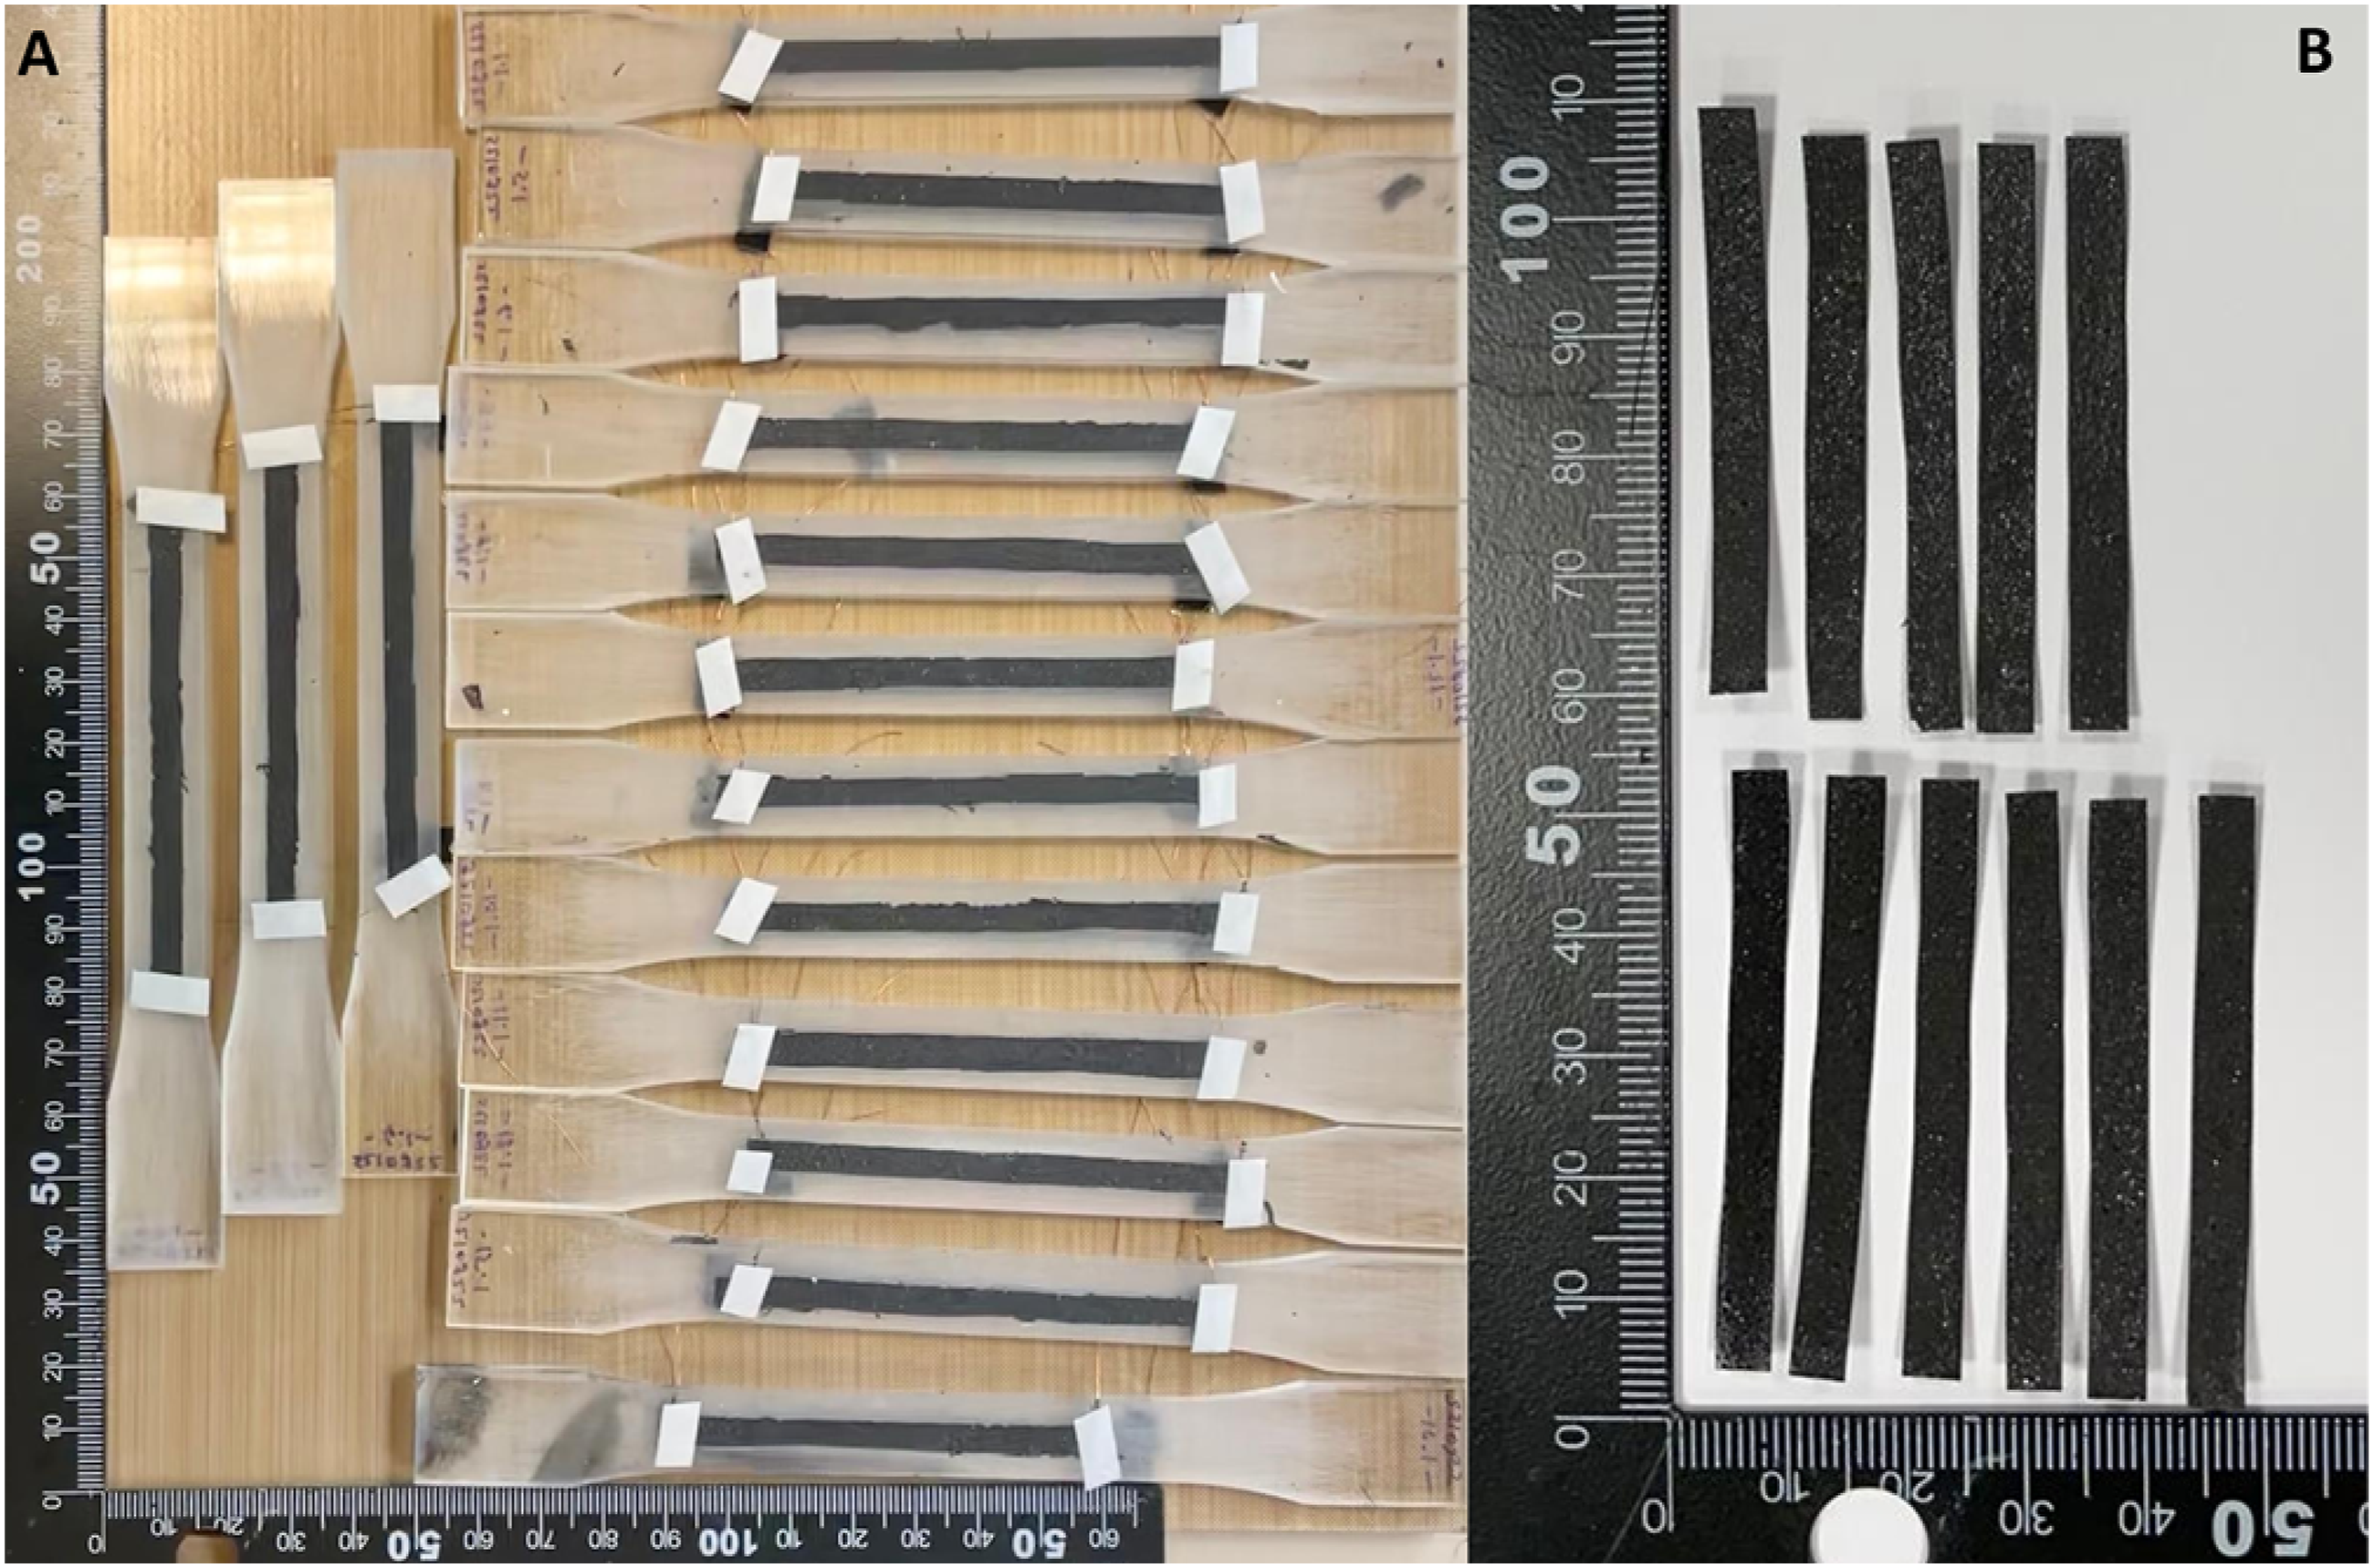
Acetate paper and plexiglass were used as the variant substrate materials. Adhesive folio paper was prepared with a 50 mm*5 mm cut-out to be used as a mask. These masks temporarily adhered to the substrates. Each specimen was coated with one of the candidate inks of Table 1. The paste was spread with a spatula (Figure 1). Two layers of paste were applied. Between the application of the two layers, the specimen was kept at 60°C for a faster and consistent drying process. The mask was then peeled off, and the sample was kept at 60°C for 45 min to dry completely. Plexiglass samples were ready to test (PS). Acetate samples (AS), on the other hand, were cut with a pair of scissors. Some of the acetate samples were then used to obtain so-called neat samples (NS) of thin film piezoresistors by peeling off the acetate paper. Wires were finally placed and stabilized on the edges of the coating for each type of sample set. The properties and names of samples are given in Table 2. The prepared samples are given in Figure 2. Screen printing method; cross-section view of plexiglass specimen (a) with a sticky mask; (b) application of paste; (c) after removal of the mask. Side view of the plexiglass specimen (d) with an adhered mask; (e) during application of paste; (f) after removal of the mask. Substrates and paste type for different sample sets. Prepared composite samples: (a) on plexiglass substrate; (b) free-standing without substrate.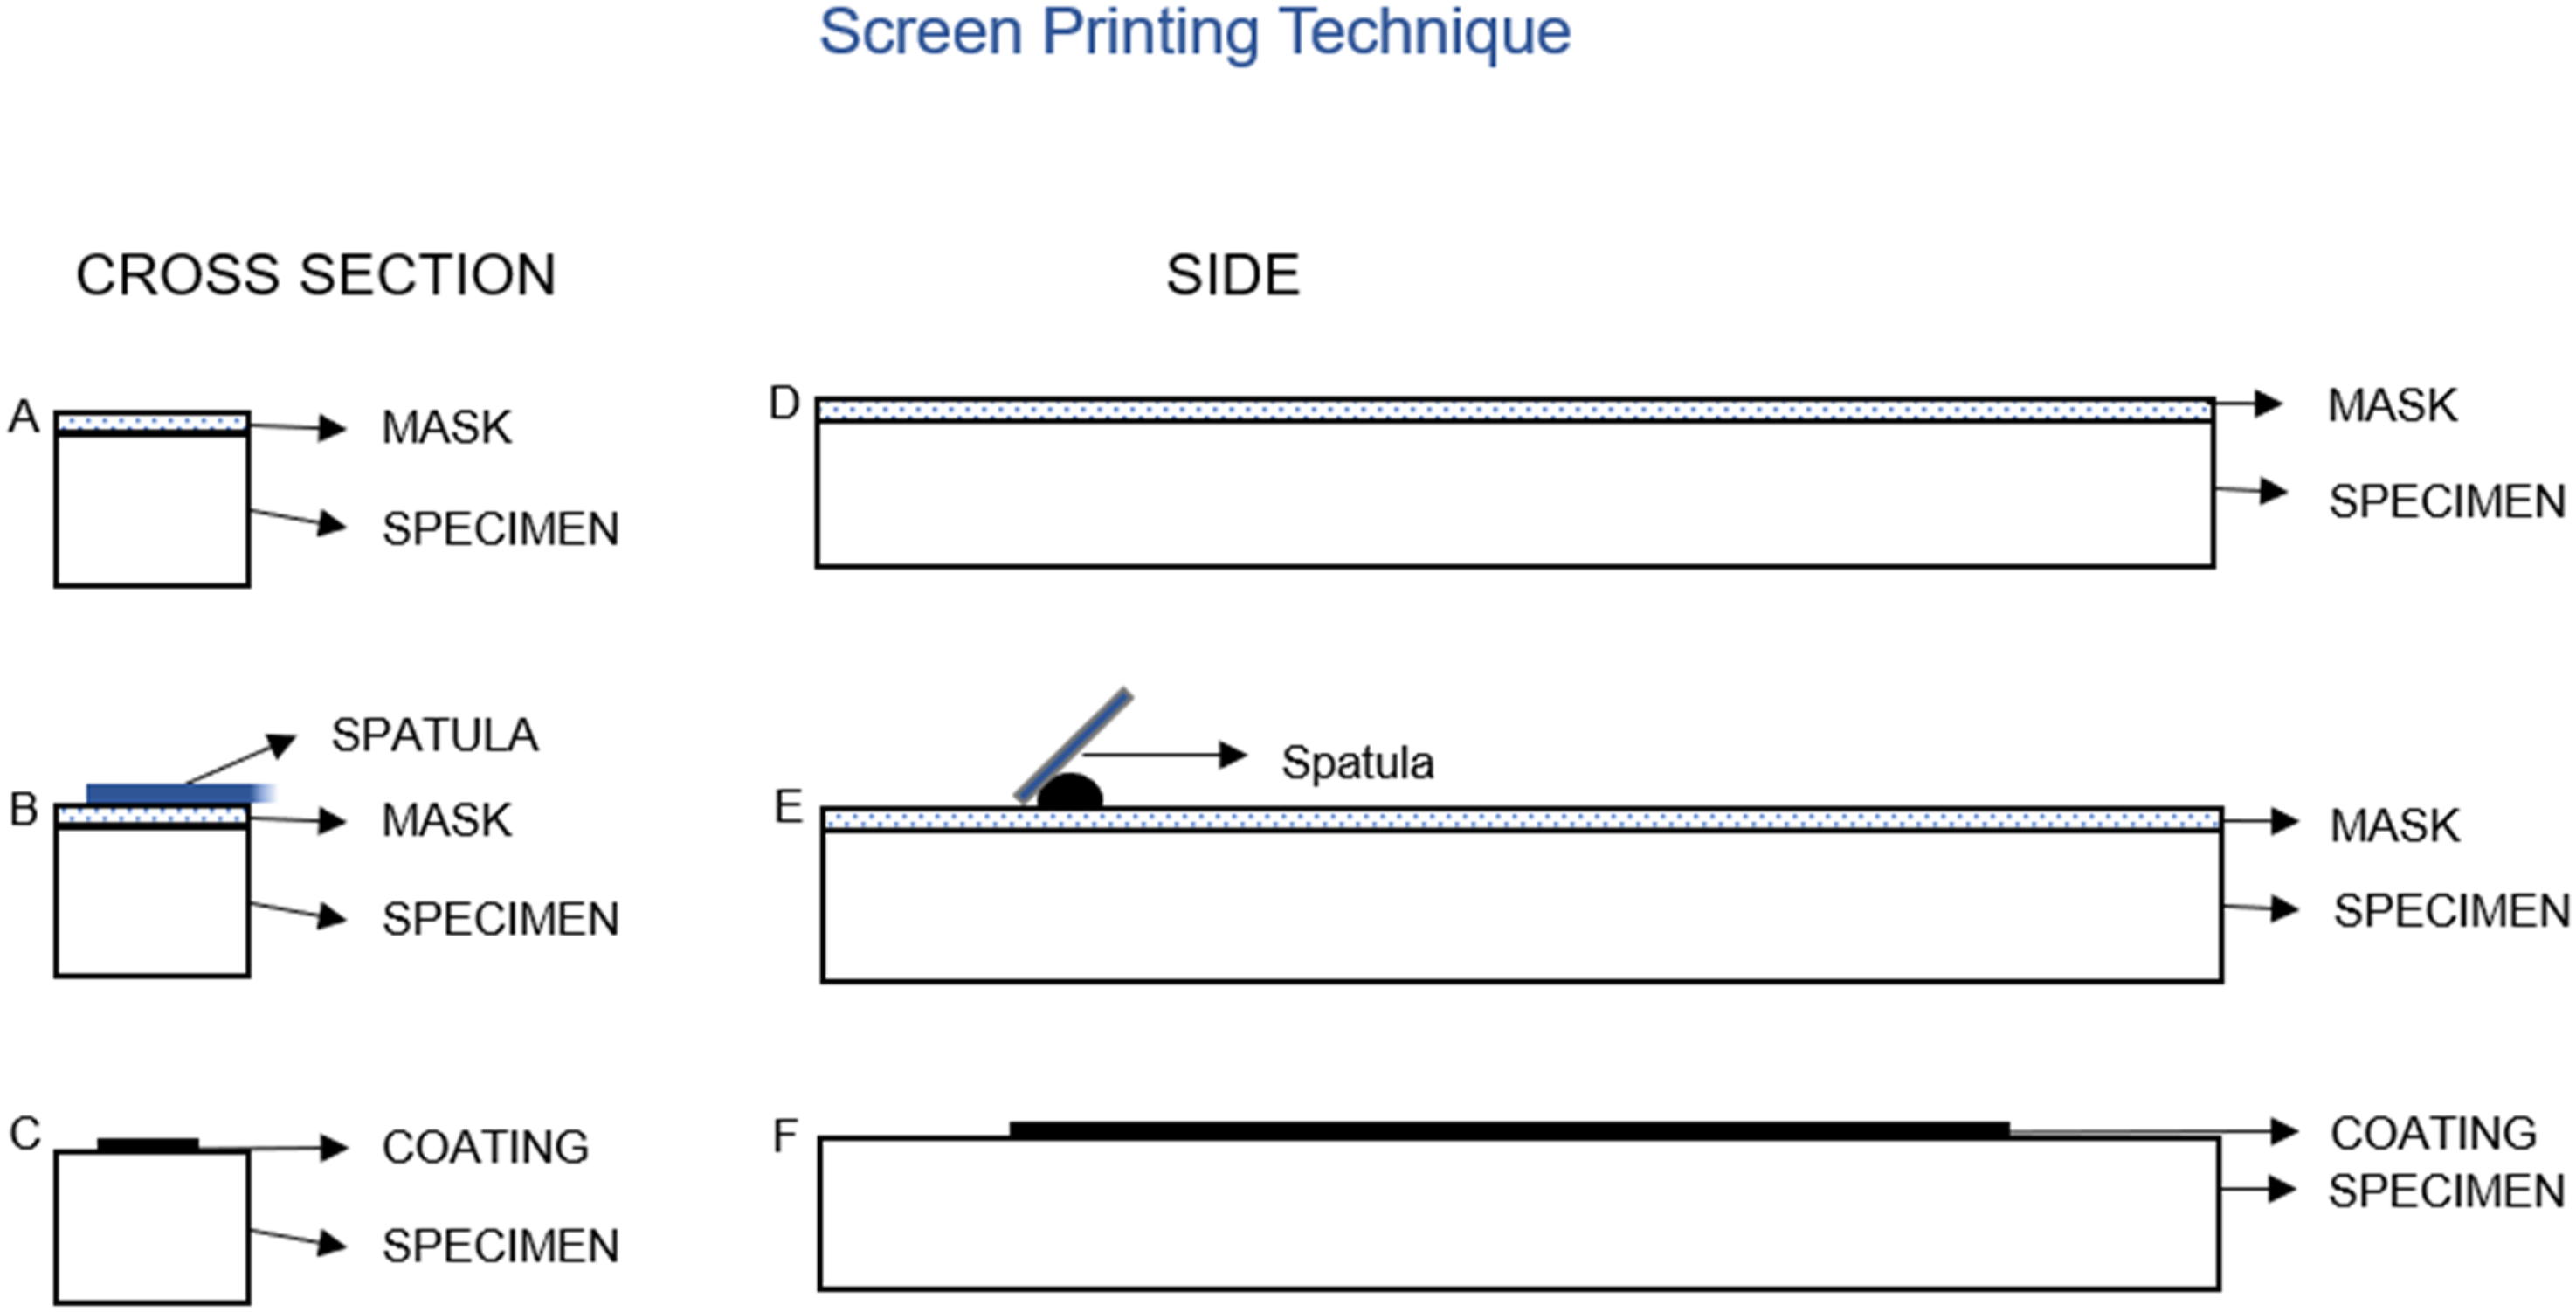
Test parameters, devices and algorithms
The universal testing machine (UTM) Proline 100 (Zwick Roell) was utilized for strain-controlled tensile loading. A strain-controlled tensile test was conducted for neat, acetate, and plexiglass samples. The tests were conducted with a 200N load cell and a pneumatic grip for the neat sample set (NS) and acetate sample (AS25). Pneumatic grips provide constant pressure on the sample for stabilizing throughout the test. The applied strain on the NS set was from 0.5 to 2%. The values were selected with respect to the elastic region of the material.
On the other hand, plexiglass samples (PS set) required higher capacity load cell which only have the standard wedge grips that are designed for break test. The design of the grips provided a tightening effect as the loading progressed. That is, the gripping force increased during loading to prevent the specimen from slipping. However, this may have a detrimental effect on the linearity of the applied strain particularly at the beginning of the loading. To minimize the effect of this behavior on the test data, the specimens were pre-loaded to 1%. In the PS set, since the plexiglass carrier (substrate) was more brittle, the maximum applied strain was 1.5%.
AS25 was produced for cycling loading. Cycling loading was applied on AS25 between 0.5 and 1% strain.
In-house device and the Rohde and Schwarz’s HMC 8012 digital multimeter were used to measure the electrical response of the sensors. The range of commercial multimeter for resistance measurement was up to 250 MΩ with 1 mΩ resolution.
In-house device manufacturing
In-house read-out circuit designs were made to demonstrate feasibility of a simple, low-cost and portable diagnosis system that can utilize the developed piezoresistive paste as the sensor. The device read out the two sensors simultaneously. Hence, two different Wheatstone bridges were installed. In order to increase sensitivity, tripots were used instead of constant resistors. The ADS1220 module was used to amplify the signal and improve the signal to noise ratio (SNR). It has a filtering feature that reduces the noise and has a programable amplification. It also converts analog signal to digital signal. Figure 3 shows a photo of the circuit with ADS1220 module. Test device: Photo of the circuit with ADS1220 module and Wheatstone bridge.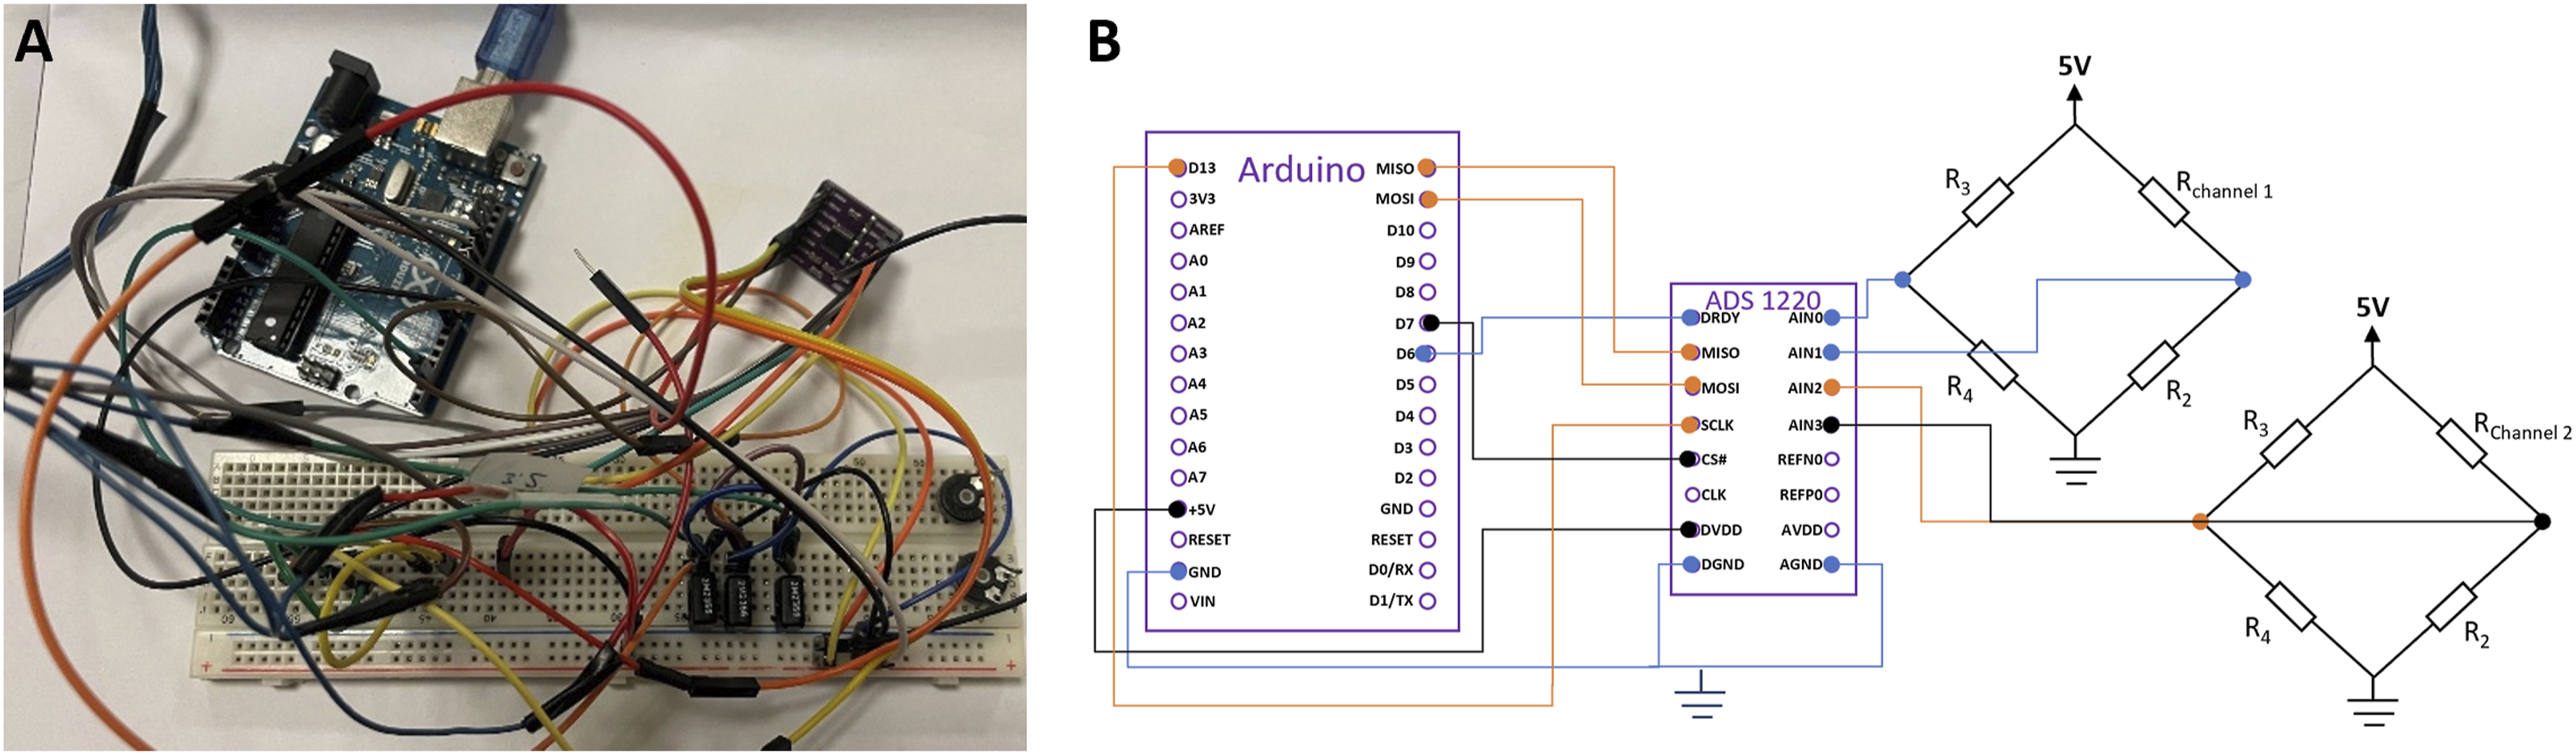
The Arduino IDE program, which is the interface of the Arduino microprocessor, was used. In the program, the library and sample code developed by “Ashwin Whitchurch” were used for coding the ADS1220 module and collecting data from the module (Copyright (c) 2018 ProtoCentral). This code has been developed for comparative data collection, data collection in the desired format and dual channel data collection. “ArduSpreadSheet” tool was added to the Arduino IDE interface to transfer the data to excel file. The collected data was saved in excel with “ArduSpreadSheet”. Figure 4 shows the test setup. Test setup for failure analysis of Plexiglass.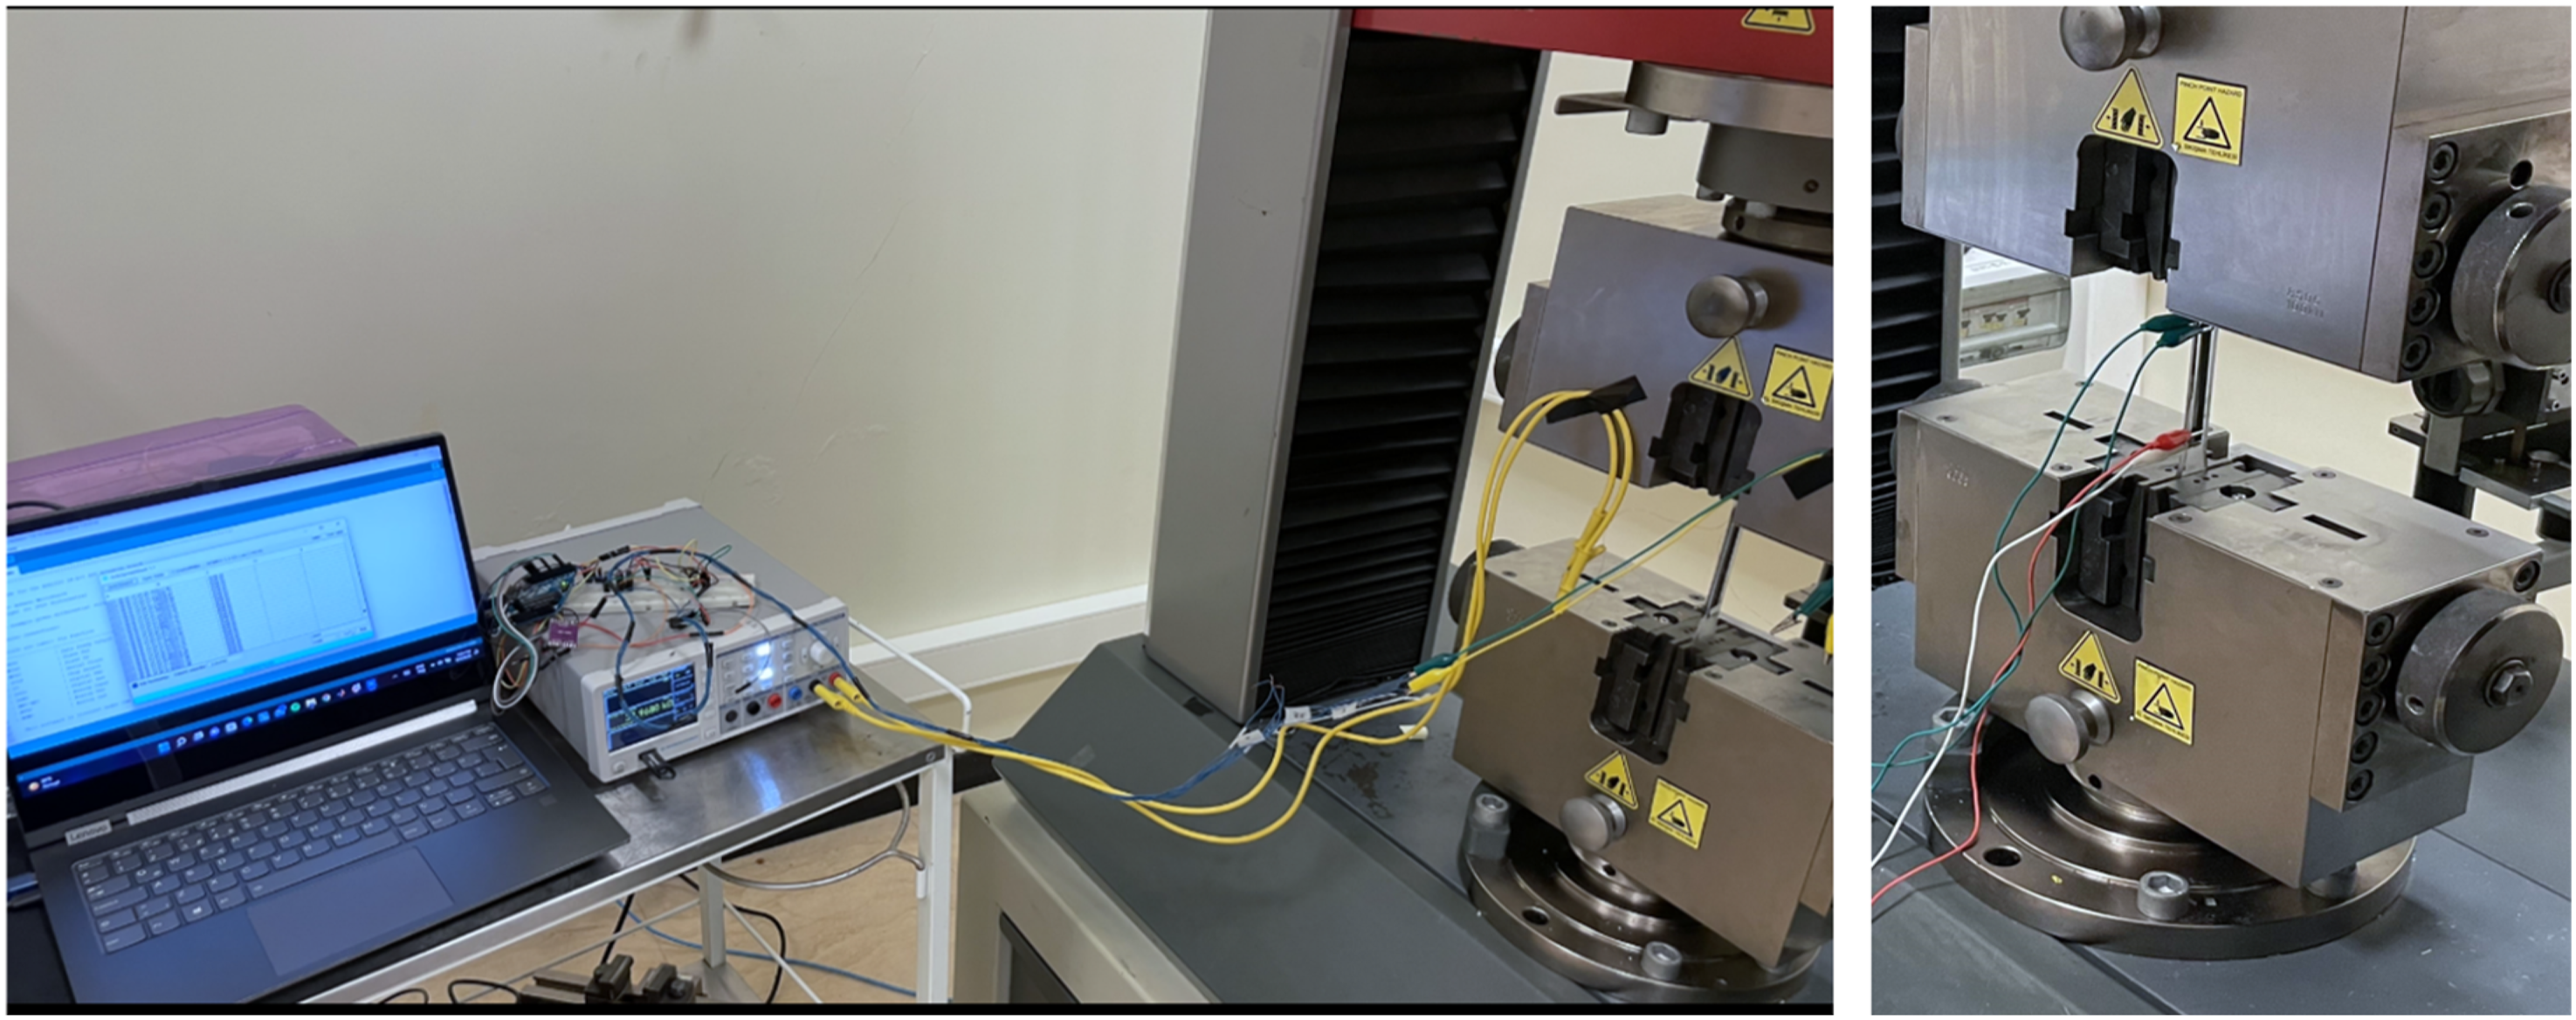
Prediction algorithm
The recorded data was extracted from the excel file by the MATLAB program. This data was used to evaluate the health of the material.
Figure 5 represents the algorithm schematically. The data collected from the two channels are normalized. The normalized data are proportioned with each other. The threshold value is then determined according to the proportion of the data taken from the region where the material is its reference healthy state. The data of subsequent cycles are analyzed in line with the determined threshold value. When the proportion of the data exceeds the threshold value, the user is notified that the material, hence the user is “at risk”. Schematic of the structural health monitoring system form sensor to MATLAB data evaluation, which processes data from two channels and provides binary results: “Safe Region” or “At Risk”.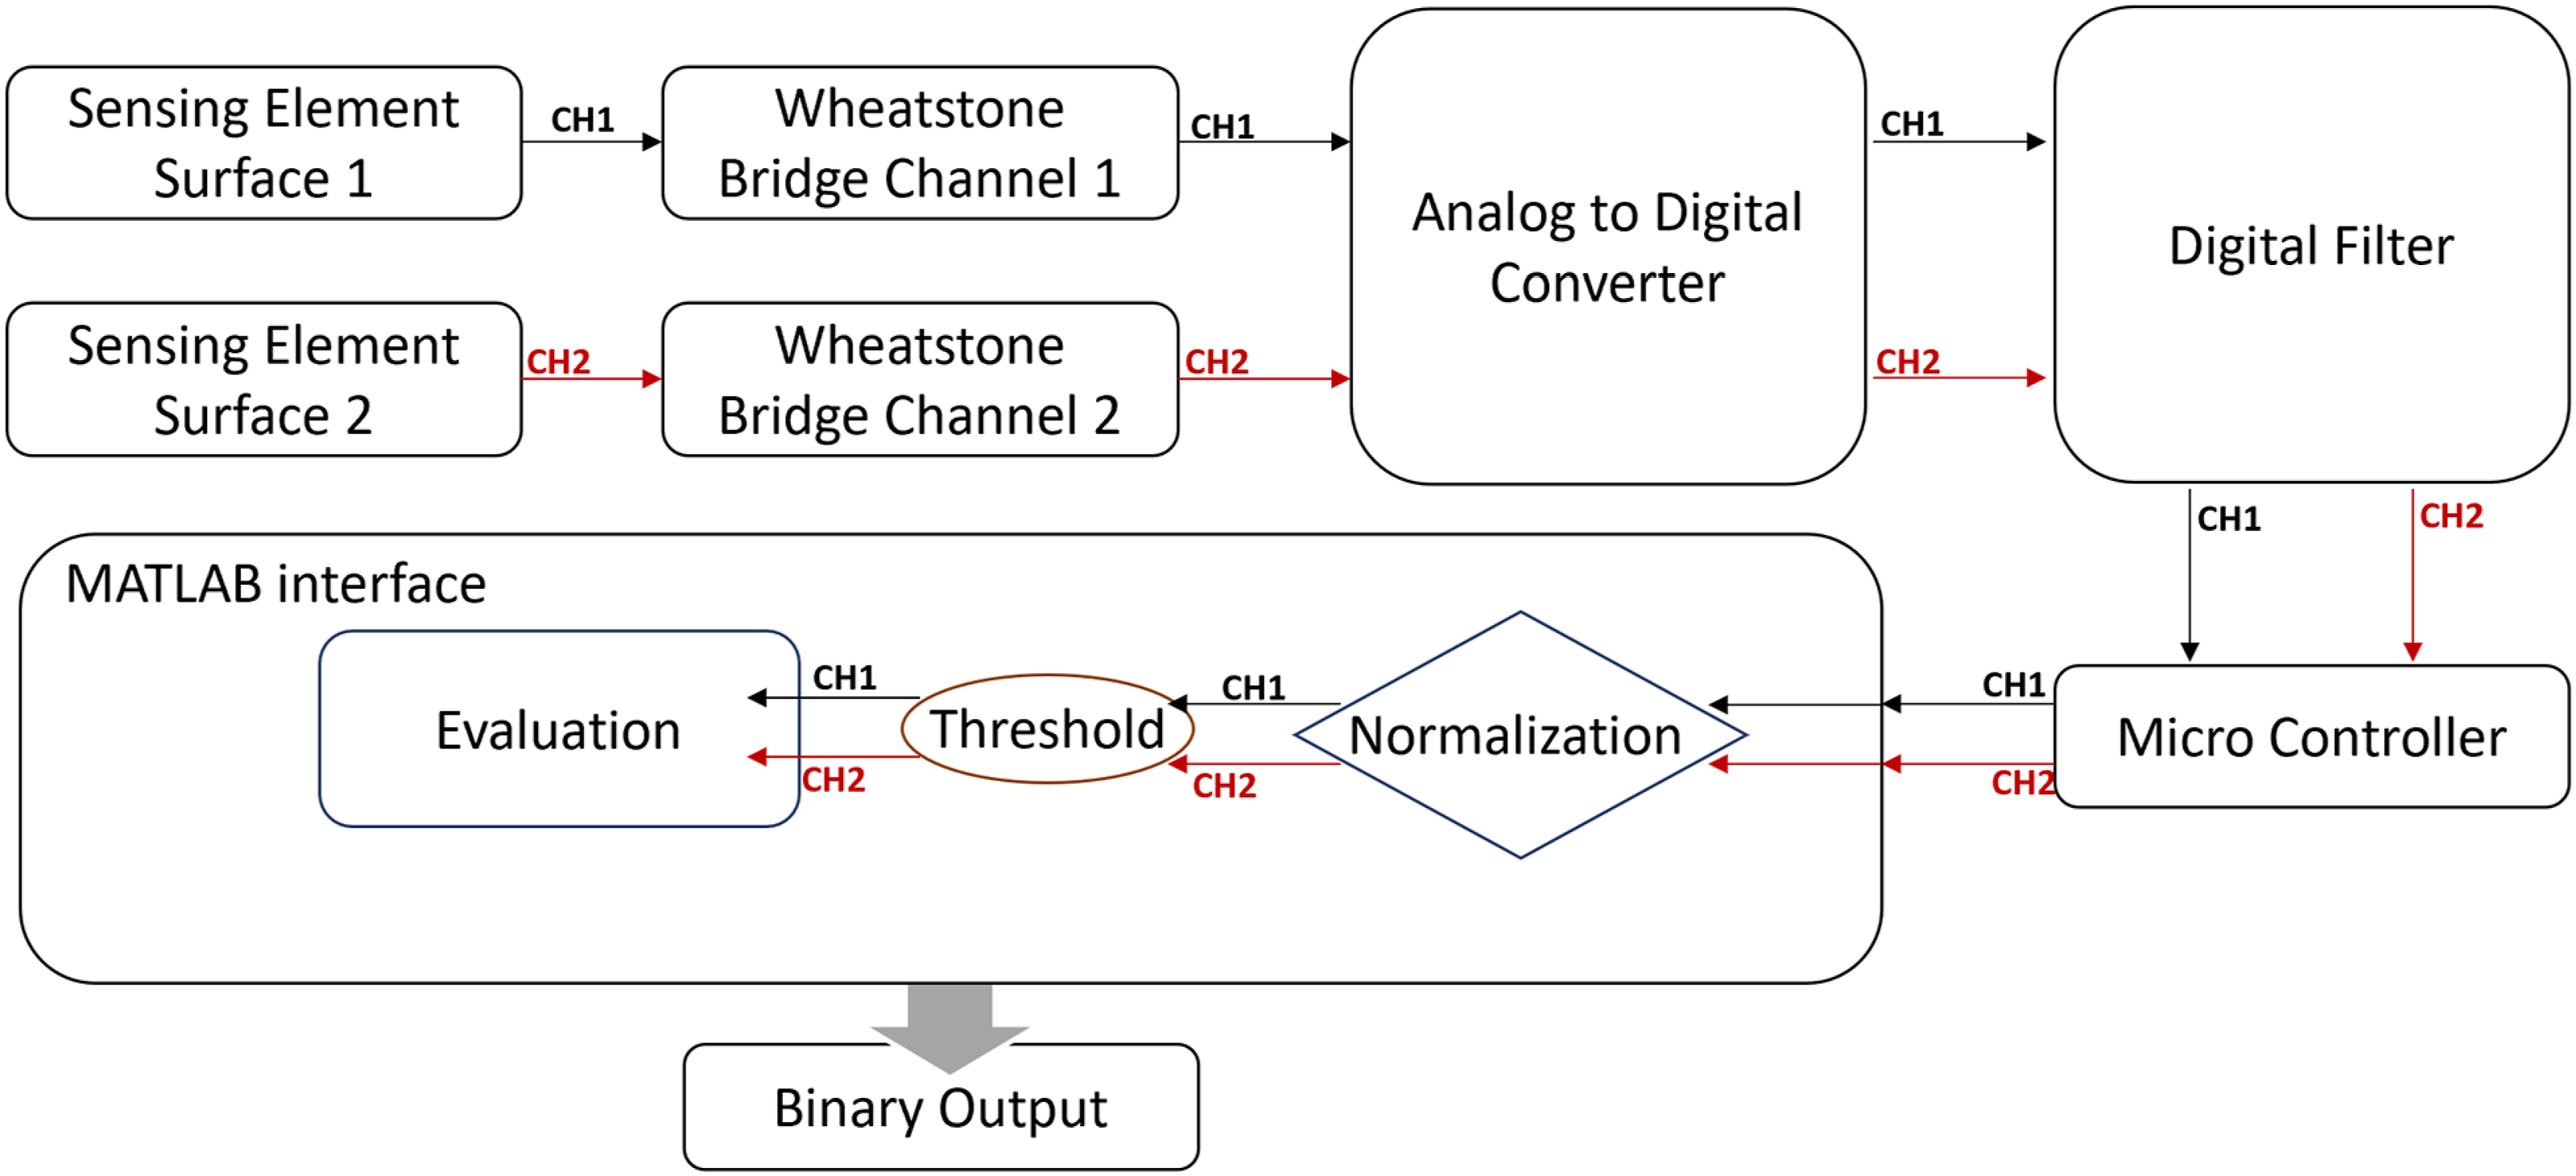
Results and discussion
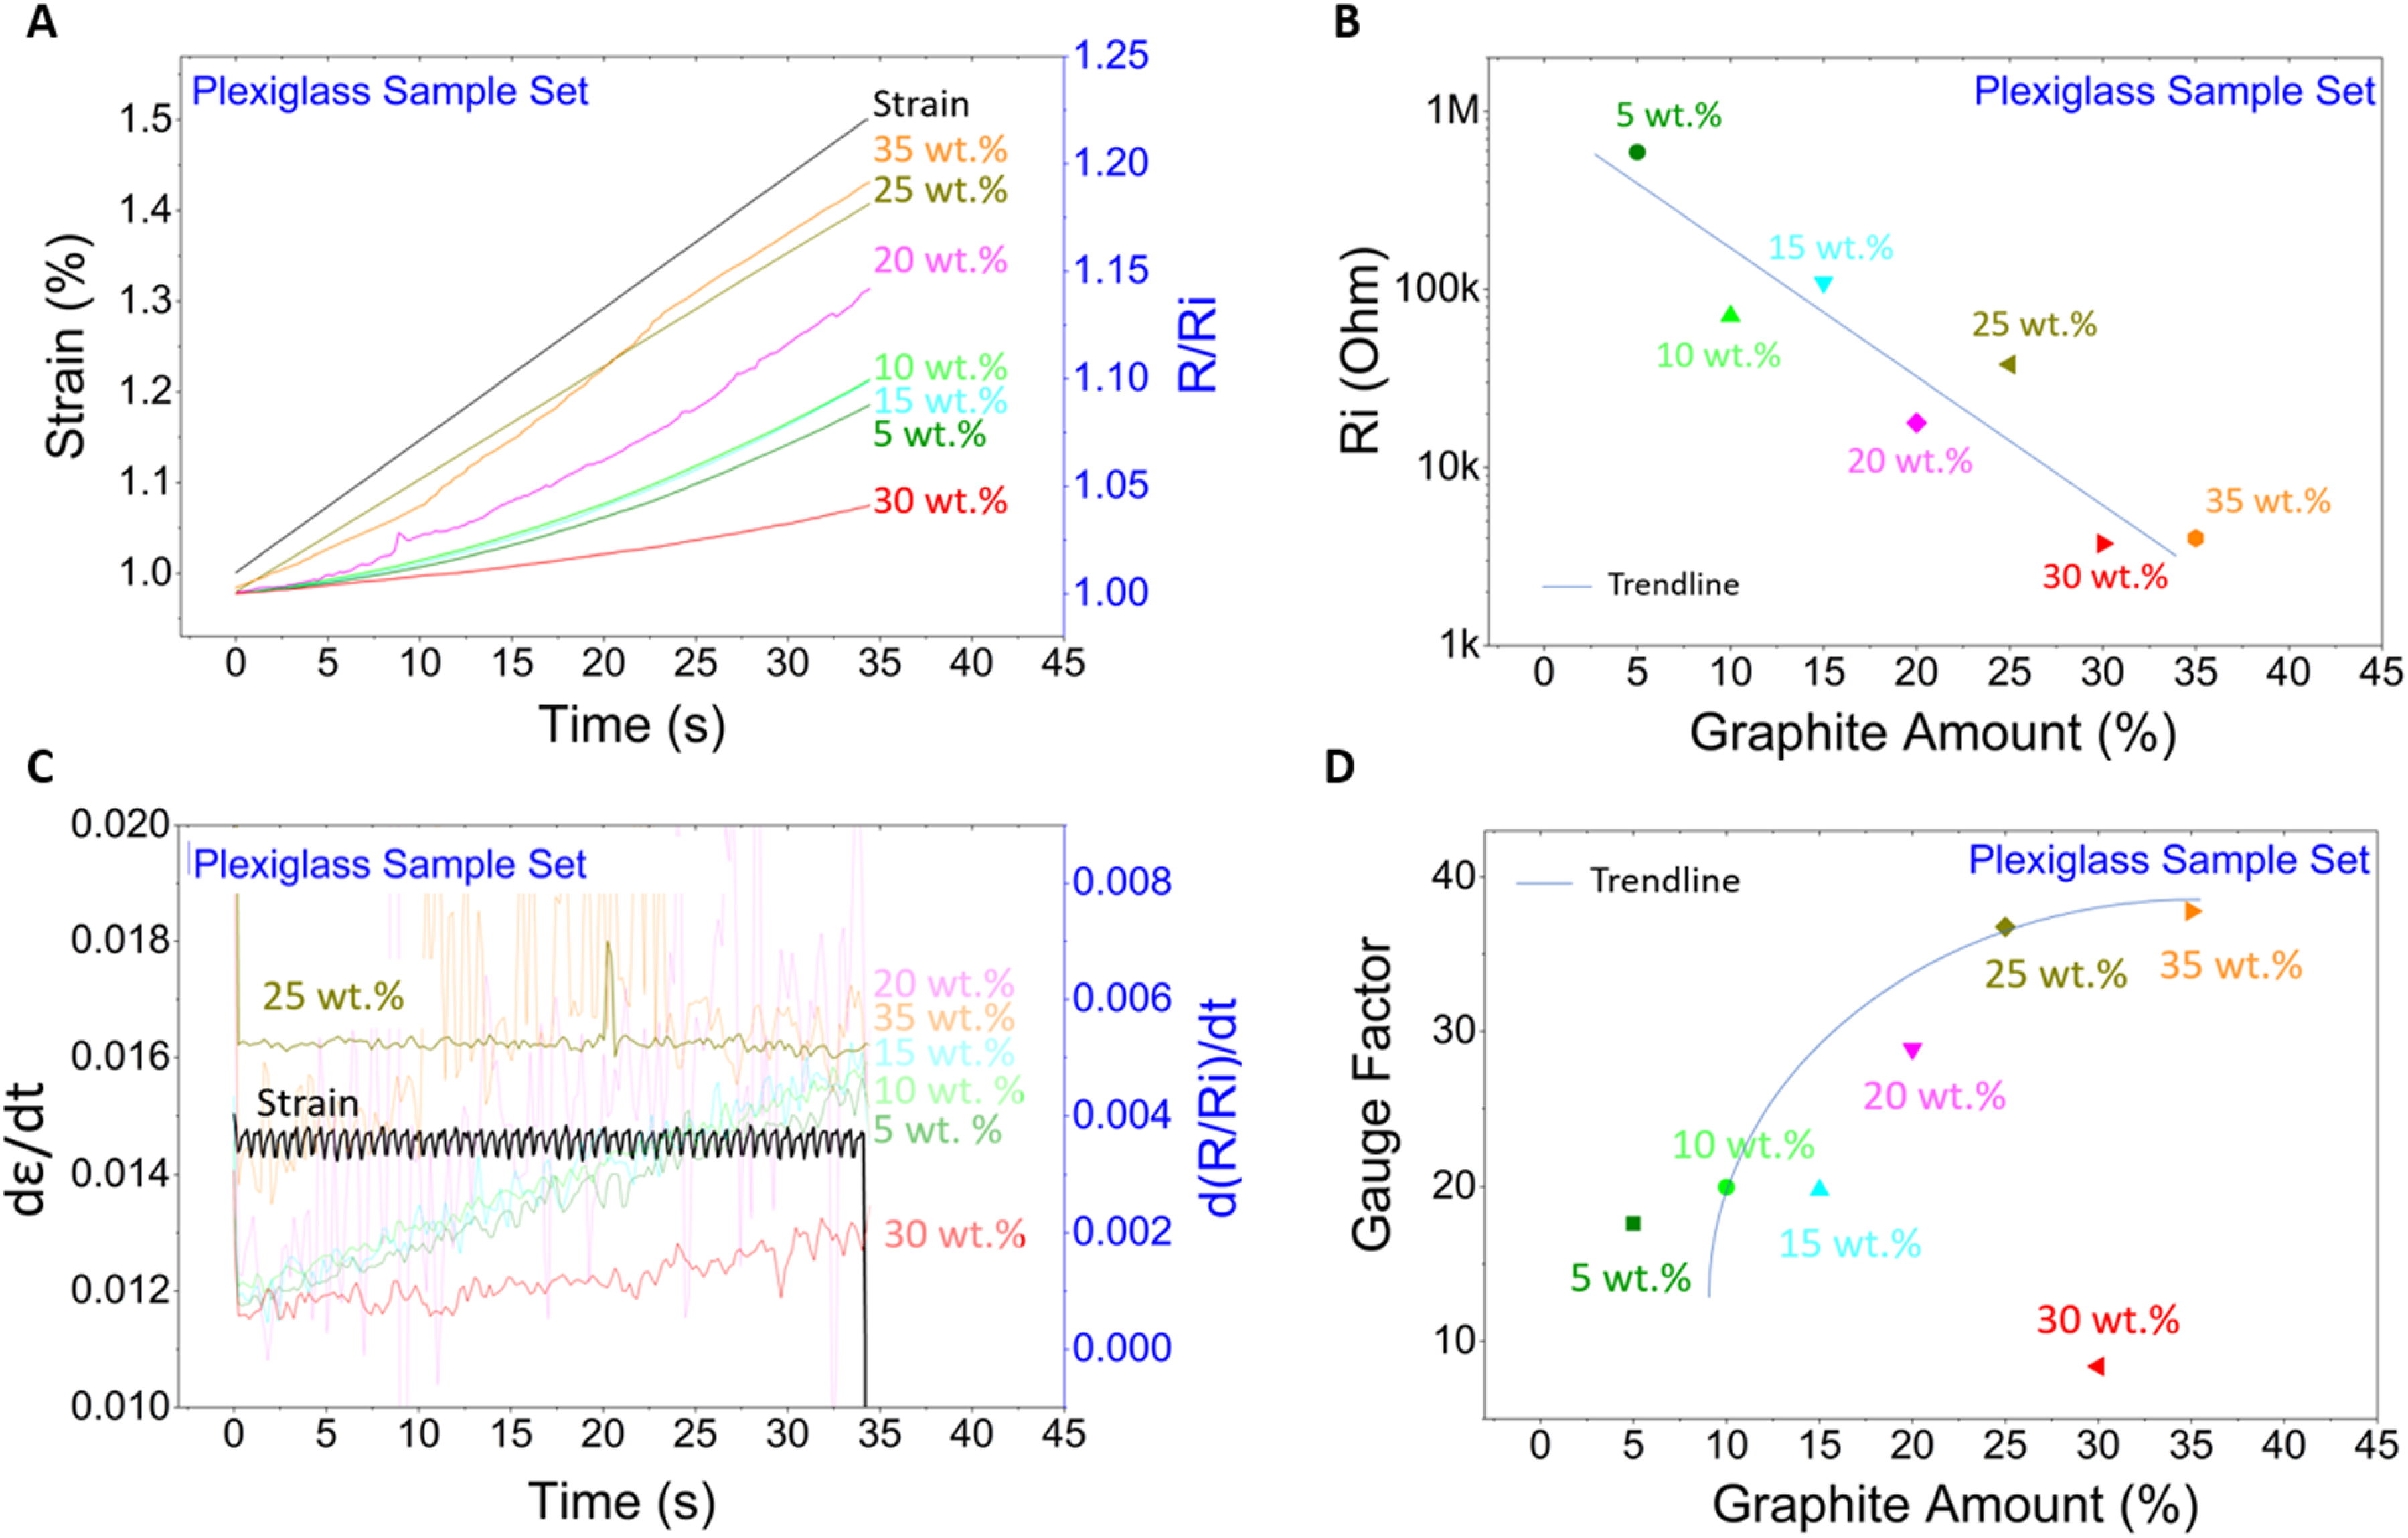
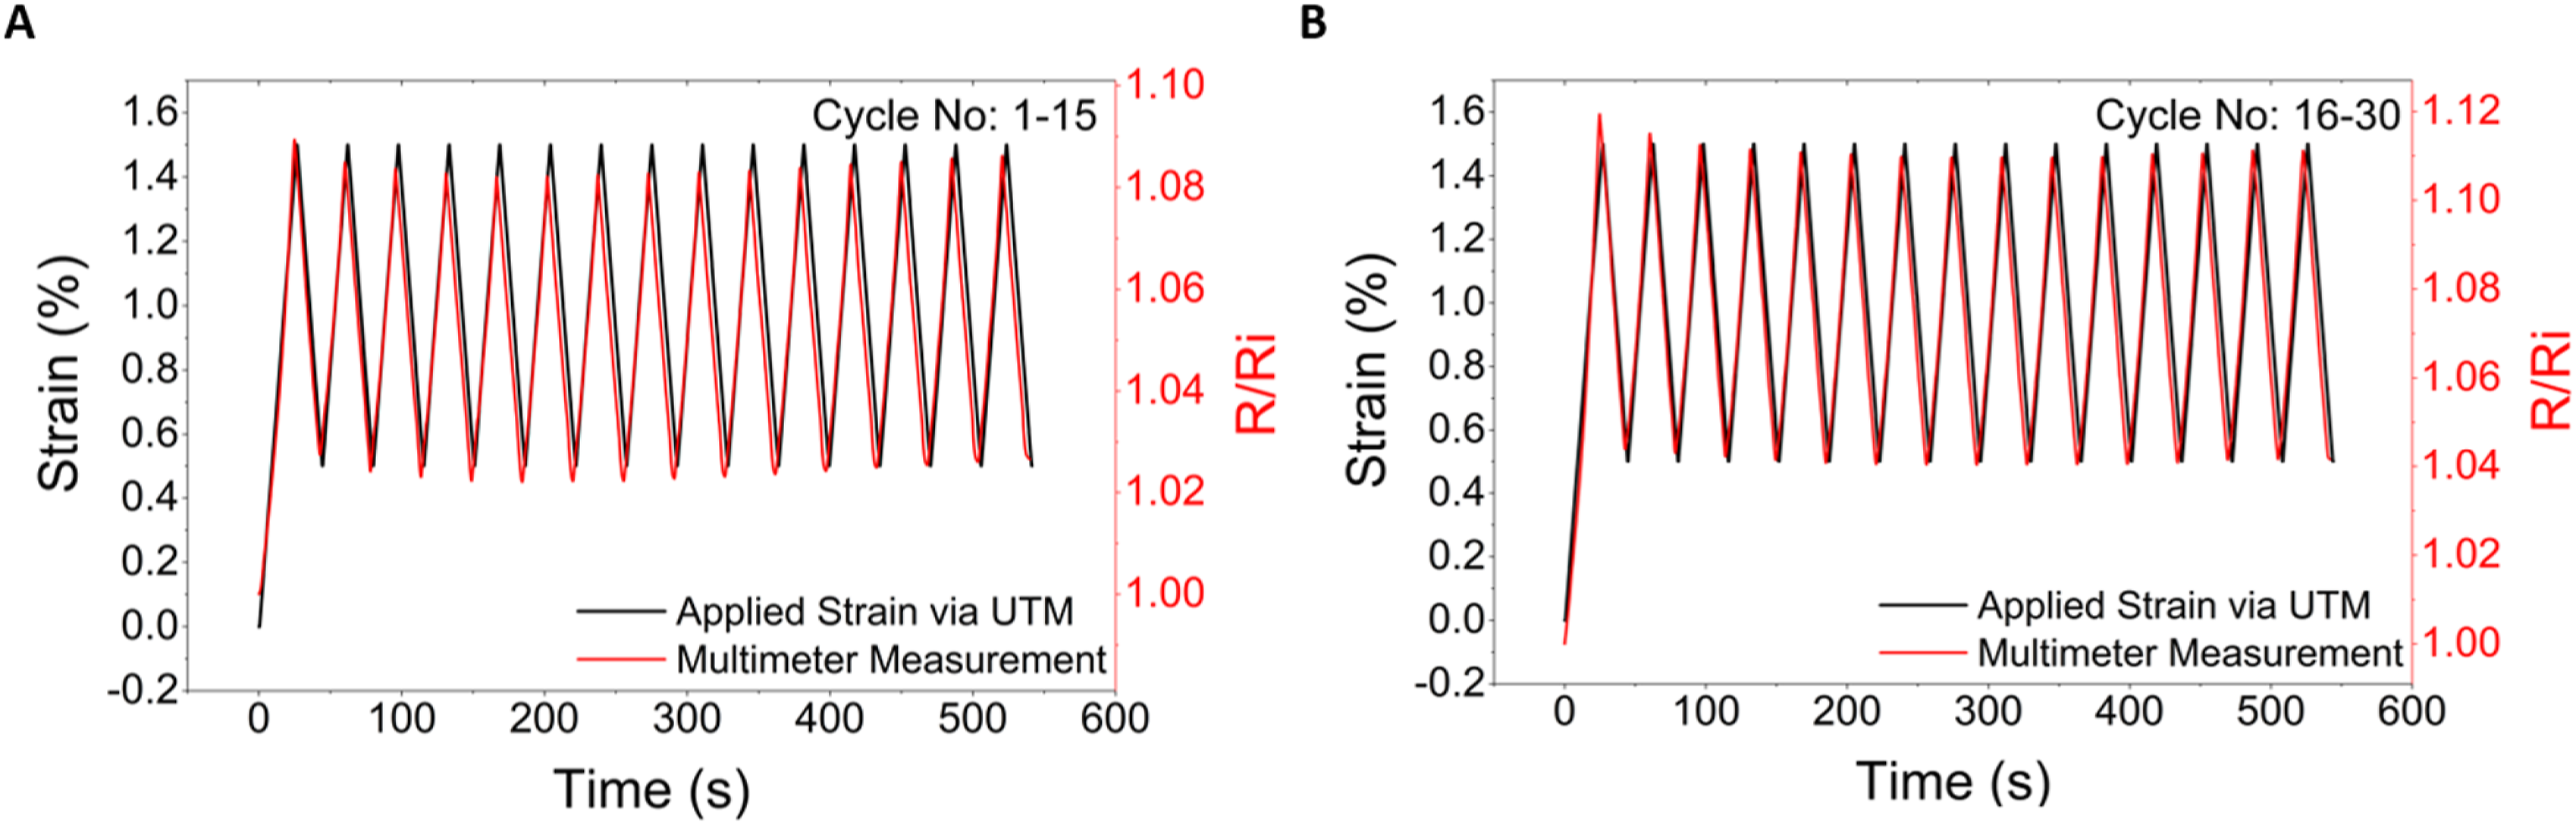
The mechanical and electrical responses of the samples were tested simultaneously. NS and PS sets results are given in Figures 6 and 7. The cycling loading test results of AS25 are given in Figure 8. Test results of the neat sample set (thin film composite piezoresistor): (a) Strain-time (applied) and normalized resistance-time plots (measured); (b) Initial resistance-graphite amount plot; (c) Derivatives of strain-time (left axis) and derivative of normalized resistance (right axis) versus time plot; and (d) Gauge factor-graphite amount plot. Test results of the paste-coated dog bone plexiglass samples: (a) Strain-time (applied) and normalized resistance-time plots (measured); (b) Initial resistance-graphite amount plot; (c) Derivatives of strain-time and normalized resistance-time plot; and (d) Gauge factor-graphite amount plot. Paste of 25 wt.% GP on acetate paper (AS25) was tested and measured with a multimeter. Cycling tensile loading was applied through strain control via the UTM. (a) The results of cycle numbers from 1 to 15 and (b) from 16 to 30 are given.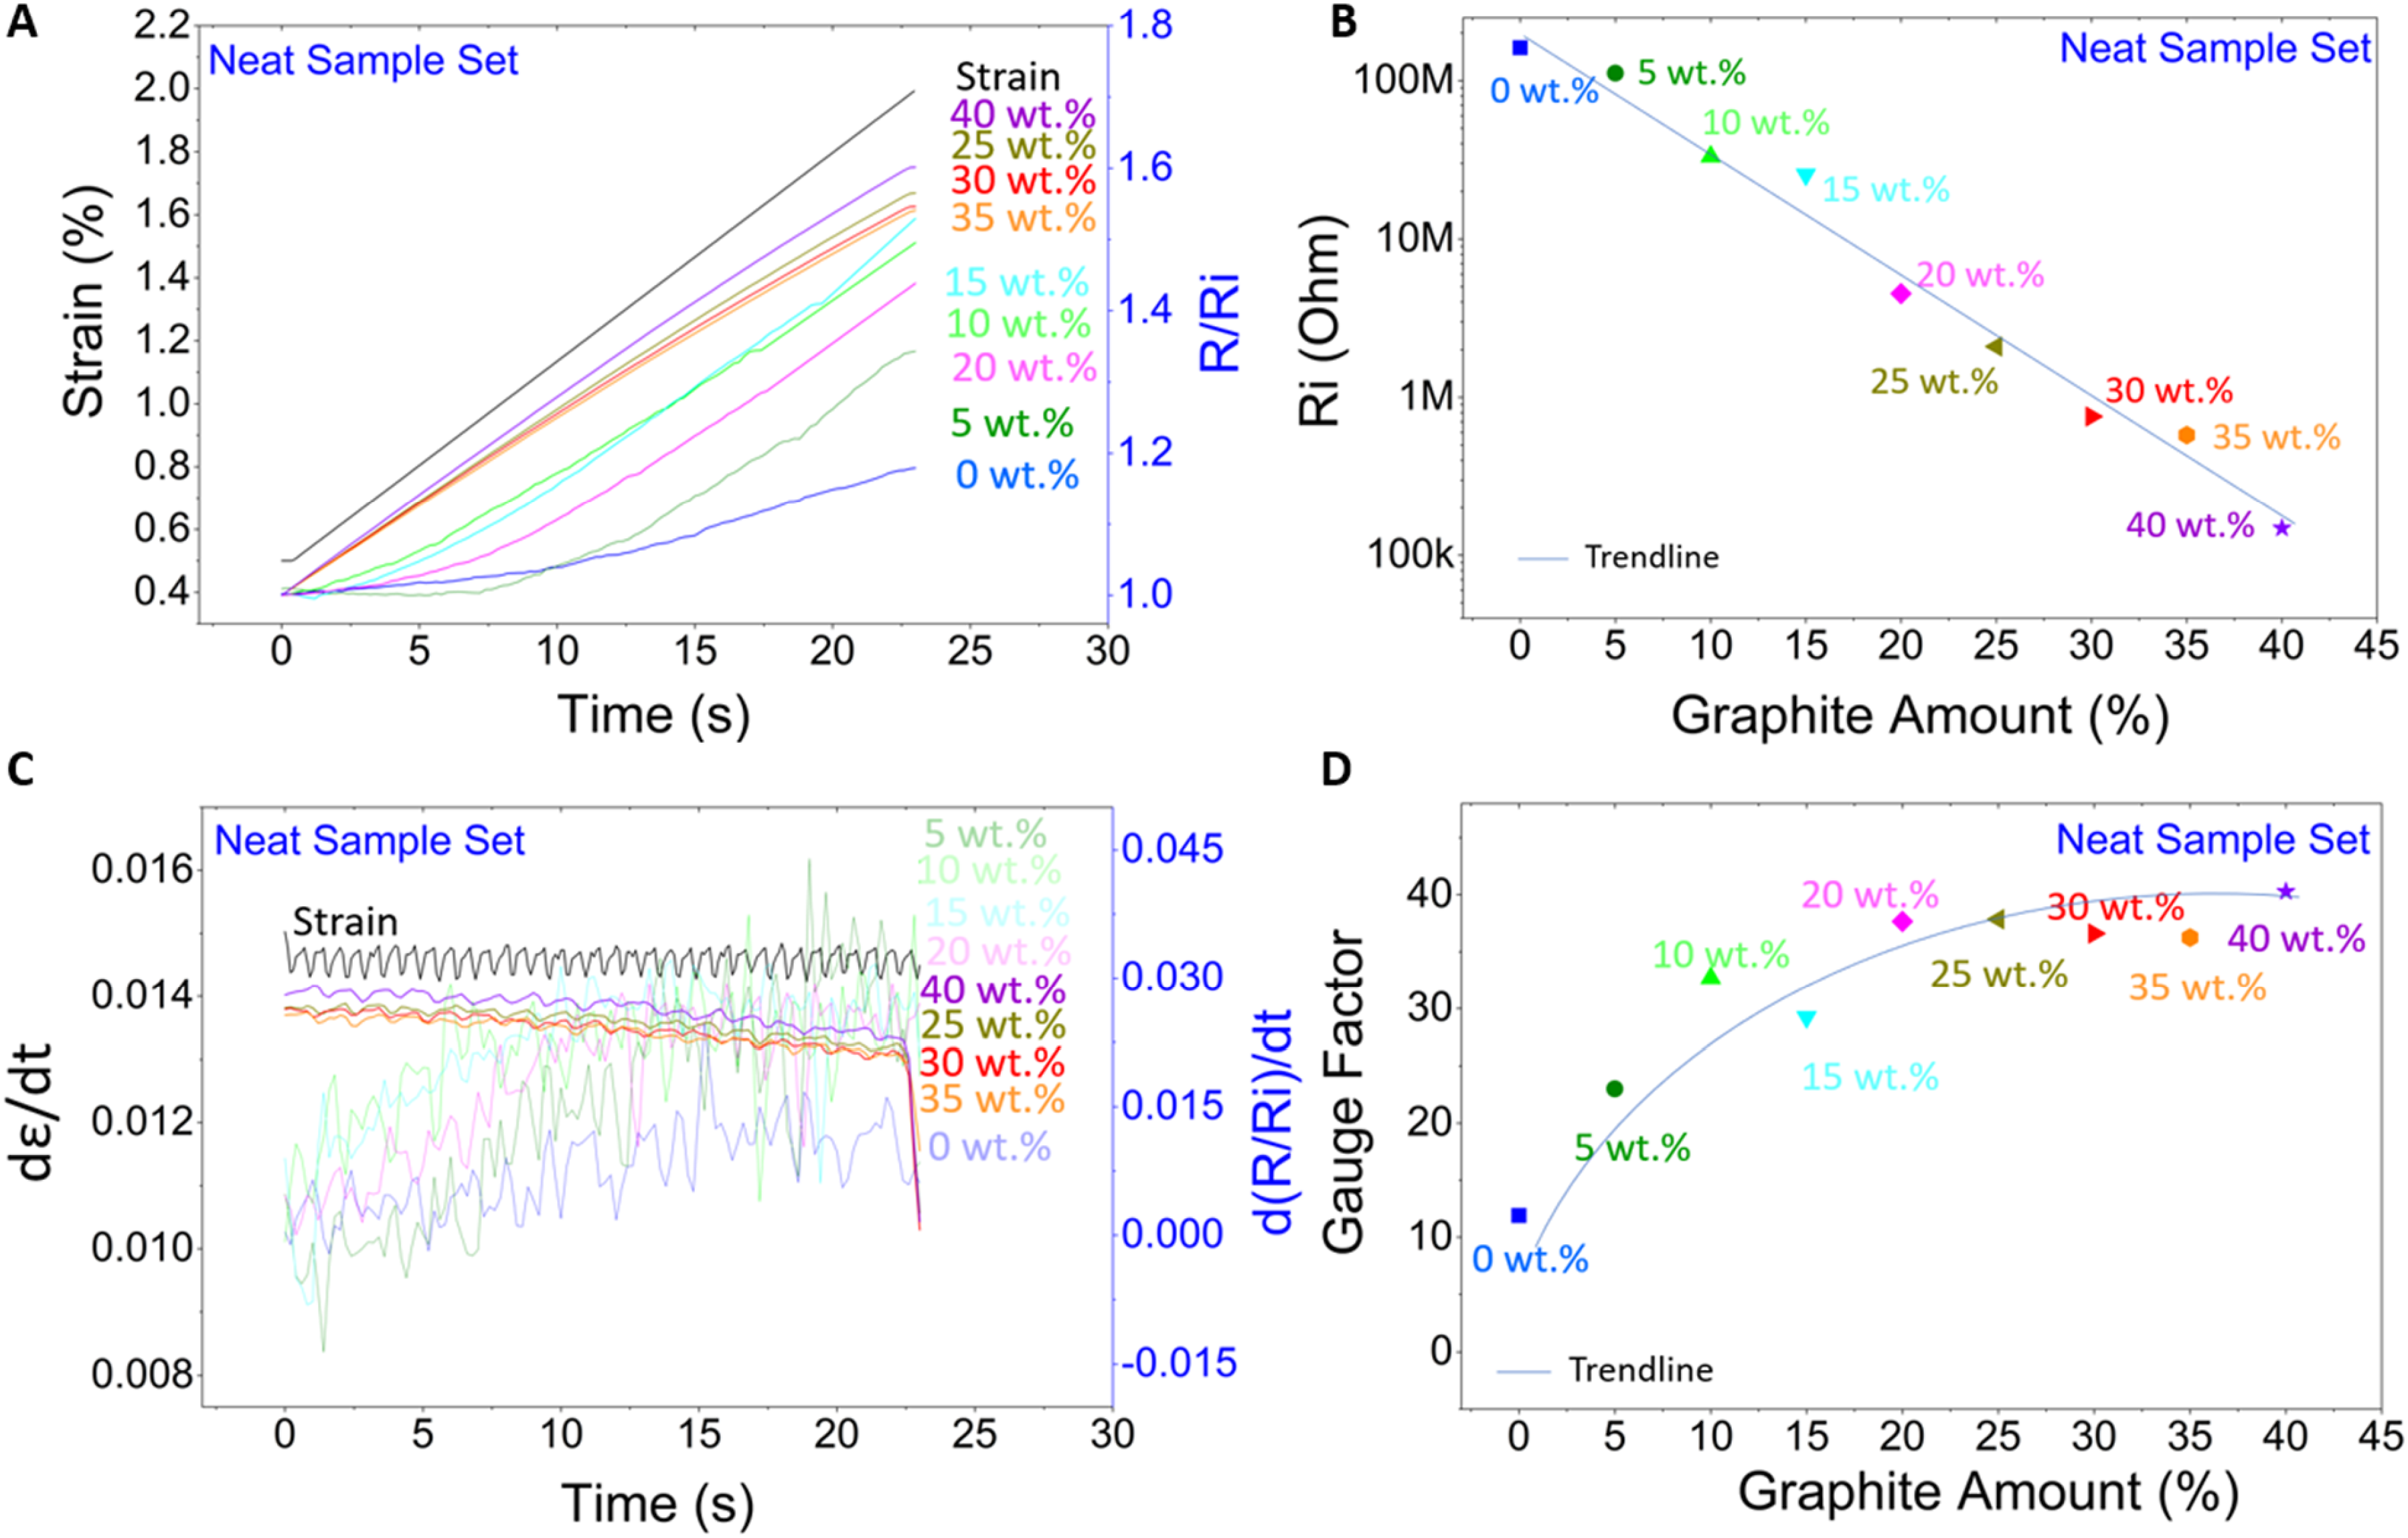
With the neat thin-film composite piezoresistor samples (Figure 6), two trends of sensor response to the constant rate of increase in strain were observed: exponential (i) or near-linear (ii) increase regimes. The neat sample with up to 20 wt.% graphite amounts measured an exponential increase with linearly increased strain. From lower (20 wt.%) to higher (40 wt.%) filler ratio, exponential behavior (i) changed into near-linear behavior (ii) under constant strain increase. The derivative of the normalized resistance-time graph in Figure 6(c) showed the variation of the slopes in Figure 6(a). Their derivatives indicated that the linearity of response by the samples from 25 to 40 wt.% filler ratio was consistent, whereas the samples with lower GP percentages (0 to 15 wt%) had a non-linear behavior.
Figure 6(b) demonstrates the initial resistance (Ri) values of composite piezoresistors. The results indicated that the Ri values exponentially decreased with the amount of GP (note that the Ri is shown on a logarithmic scale). In Figure 6(d), the gauge factor variation is given suggesting a logarithmic growth trend. Over 20 wt.% graphite filler ratio, samples illustrate nearly the same gauge factors, and they were as much as 4 times more compared to GNP/PVA (0 wt.%).
The plexiglass sample (PS) set (Figure 7), similar to the NS set, showed linear and exponential rising trends. The PSs with up to 20 wt.% graphite loading showed exponential increase with linearly increased strain. As the filler ratio increased, exponential behavior changed into linear behavior similar to the trend of NS set (the PS30 was excluded). The derivative of the plot (Figure 7(c)) illustrated the linearity of the response plots. As given in Figure 7(c), in general linearity increased from low to high filler ratio. However, the linearity and stability of PS20 and PS35 measurements were not as expected. Overall, the best results in terms of linearity and smoothness (high signal-to-noise ratio, SNR), were obtained from the PS25.
Figure 7(b) demonstrates the initial resistance (Ri) values of composite piezoresistors in the PS sets. Since the Ri is shown on a logarithmic scale, the initial resistance plot had an exponential decrease trend. It was similar to the NS set with a lower coefficient of determination (R2). The gauge factors of the PS set are given in Figure 7(d). From lower to higher filler ratio, an exponential increase was observed. The R2 value for the gauge factor plot in the PS set was lower compared to the results of the NS set.
The differences between the two sample sets were (i) the grip type, (ii) the thickness of the composite piezoresistor, and (iii) the existence of a carrier material (plexiglass). The thin film samples were tested using pneumatic grips and the PS set was tested with standard wedge grips. Since the behavior of the grips are slightly different from each other, to increase the similarity, the PS set was pre-loaded to 1%.
The second difference was the existence of a carrier material. The sensor on the PS set was a coating on top of the plexiglass substrate away from the gripping area, whereas the NS set was a thin film of produced paste directly gripped during the tests. Hence, the strain on samples of the NS set was arguably uniform through it, while the sensor coat on the PS set is not necessarily uniformly strained. The test results of the PS set included the effects of insufficient strain transfer between the piezoresistor and its plexiglass substrate. In this set, the strain is applied to the substrate, and hence, the coating responds to what is transferred from its plexiglass carrier. Therefore, the error margin may increase, and misleading results in the PS set could be expected. PS30 had an expected initial resistance, on the other hand, it had an unexpected response in terms of gauge factor and signal-to-noise ratio (SNR). Since NS30 had a similar response to NS25 and NS35, as expected, loss in SNR and non-linearity of the PS 30 can be explained with non-uniform strain transfer from substrate (plexiglass) to coating (i.e. detachment of the film from the Plexiglass substrate).
In general, the results of both NS and PS sets illustrated that the response of composite piezoresistor improved with a higher graphite amount. It also gave better linearity in piezoresistive response. Since the linear region of piezoresistors is typically defined as the range of a sensor, adding graphite increased the range of GNP/PVA composite piezoresistors. The best results in terms of linearity, sensitivity (gauge factor), and resolution (SNR) were achieved with samples containing 25 wt.% or more filler. Since the GP in composite piezoresistor was expected to be the main carrier for tunneling, the number of GP was expected to be equal or more than the GNP particle number. The amount of GNP was 25 wt.%, therefore, we expected that around 25 wt. % GP would provide a significant difference to solve the challenging stability issue. The results in both the NS and PS sets proved our hypothesis. Since a higher filler ratio decreases the yield strength of the thin film and the range of the sensor, 25 wt.% paste was selected for cycling loading assessment. The associated acetate sample (AS25) was tested. Strain-controlled cycling loading tests were conducted in two consecutive sets of 15 cycles. The applied strain and resistance changes with applied strain measured with the help of a multimeter are given in Figure 8. The results indicated that a linear and repeatable response was obtained by the addition of graphite into GNP/PVA composite piezoresistors.
In the cycling test results, some fluctuation of the gauge factor was observed in the response of the composite piezoresistor. The maximum difference was 0.04, 5 times less than any recorded fluctuation in the normalized resistance curve in Literature. There was no significant decrease in the gauge factor or decrease in resistance. The response to linearly increased strain was also linear. Up to 30 cycles, a repeatable and linear change in resistance was obtained in the strain-controlled cycling loading.
Failure analysis of plexiglass requires two simultaneous data set from the material. Hence, the paste (25 wt.%) was coated on two sides of the plexiglass material. One of the surfaces was measured by our handmade circuit and the other side was measured with a multimeter. The prepared samples were subjected to cycling loading until they failed. The stress, strain and resistance measurements of the sample, which failed at 48th cycle, was given in Figure 9. Cycling loading test results of sample 1 which was failed at 48th cycle. Test results of cycle no (a)1–5 cycles; (b) 6–10 cycles; (c) 11–15 cycles; (d) 16–20 cycles; (e) 21–25 cycles; (f) 26–30 cycles; (g) 31–35 cycles; (h) 35–38 cycles; (i) 39–44 cycles; (j) 45–48 cycles.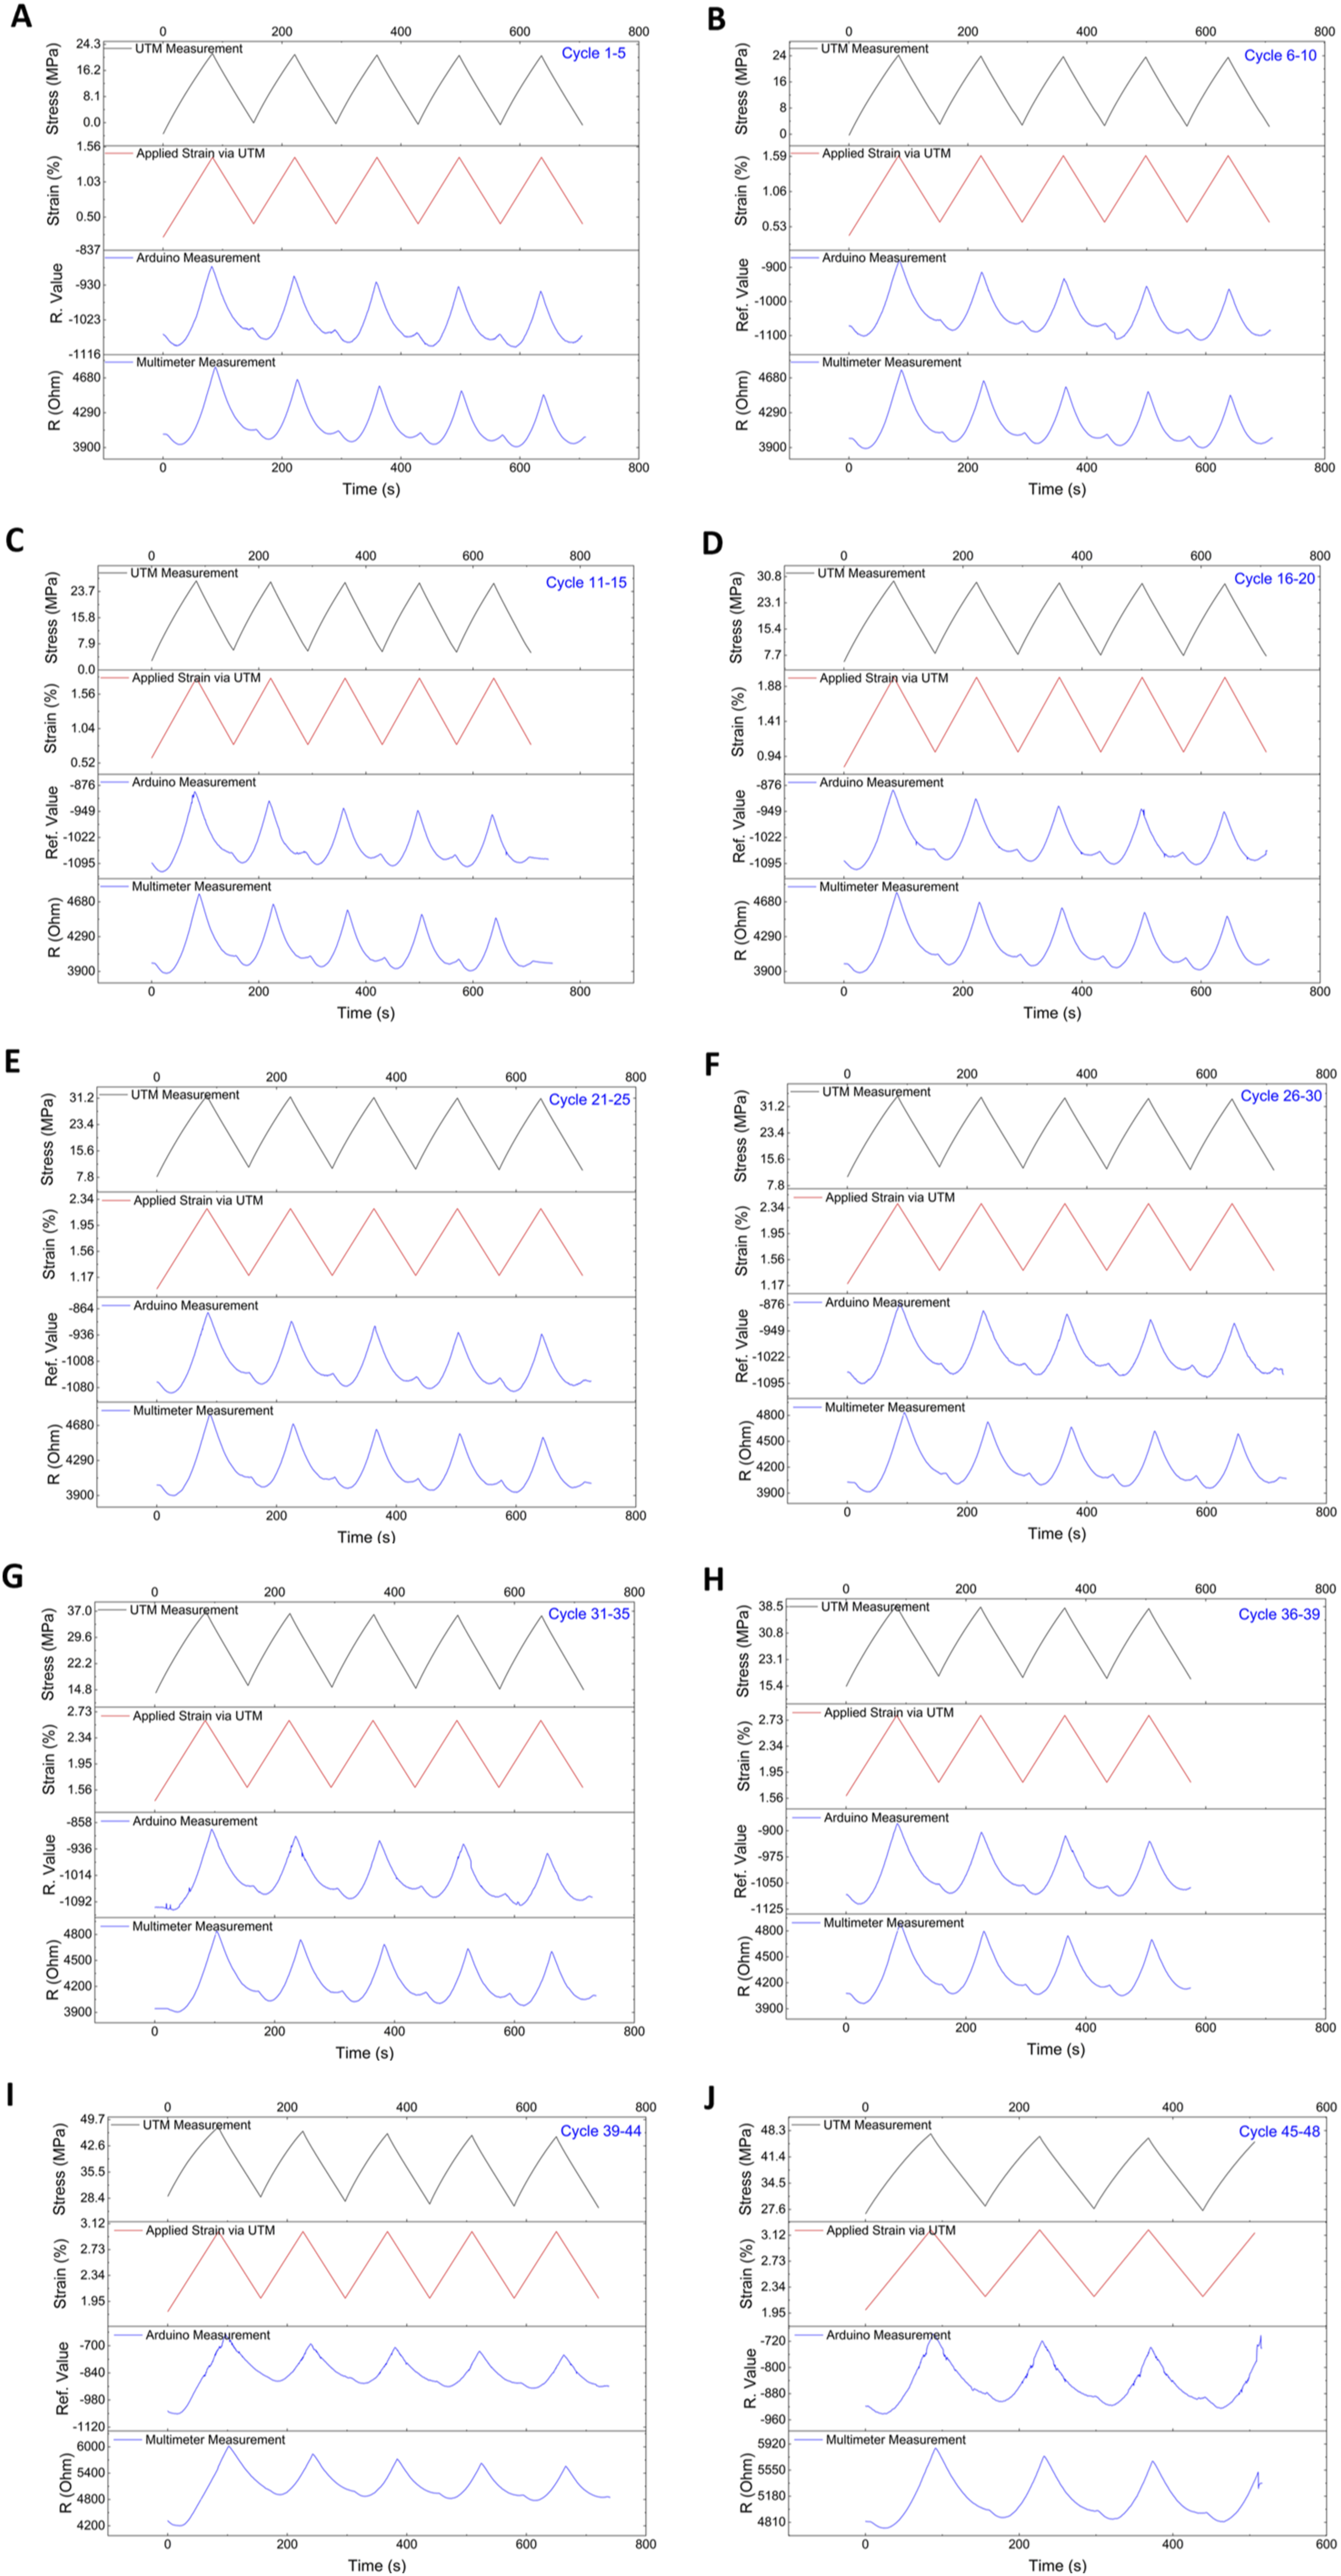
5 cycles per time was applied and between consecutive 5-cycles tests is a one-minute waiting period. The 5 cycles started at 0 and performed in the range of 0.5 and 1% strain. To accelerate the failure of the materials, initial and final applied strains were increased as given in Figure 9. Thanks to these increases, the material was broken at a low number of 48th cycle and the piezoresistance behavior of the material could be observed in the process leading to fracture.
In UTM results, sharp transitions were observed for peak and bottom points. Each cycle had a single peak. Step in strain was vaguely observed in both stress and strain plots. Stress response to the strain increase was slower.
In multimeter measurements, peak points were sharp. The transition from unloading to loading was smoother. A relaxation (decrease in resistance) was observed at the beginning of the loading. It was also observed at unloading.
Arduino collected data as a digital output. The reference value (R-Value) of resistance was given in Figures 9 and 10. Arduino based results suggest trends similar to the multimeter measurements. Peak points were sharp. The transition at the bottom was slower. Relaxation before the expected response (increase in resistance) was observed. The relaxation was also visible at unloading. Measurement results of paste applied on Plexiglas material. Tensile test with UTM device was applied as strain controlled. With 10 kN sensors, the resistance force of the plexiglass material was measured, and its stress was determined. The electrical resistance of one surface of the paste applied on two surfaces was measured with a multimeter (R) and the other surface was measured with Arduino (R. Value). (a) Measurement data of cycles 1–5 (b) Measurement data of cycles 45–48.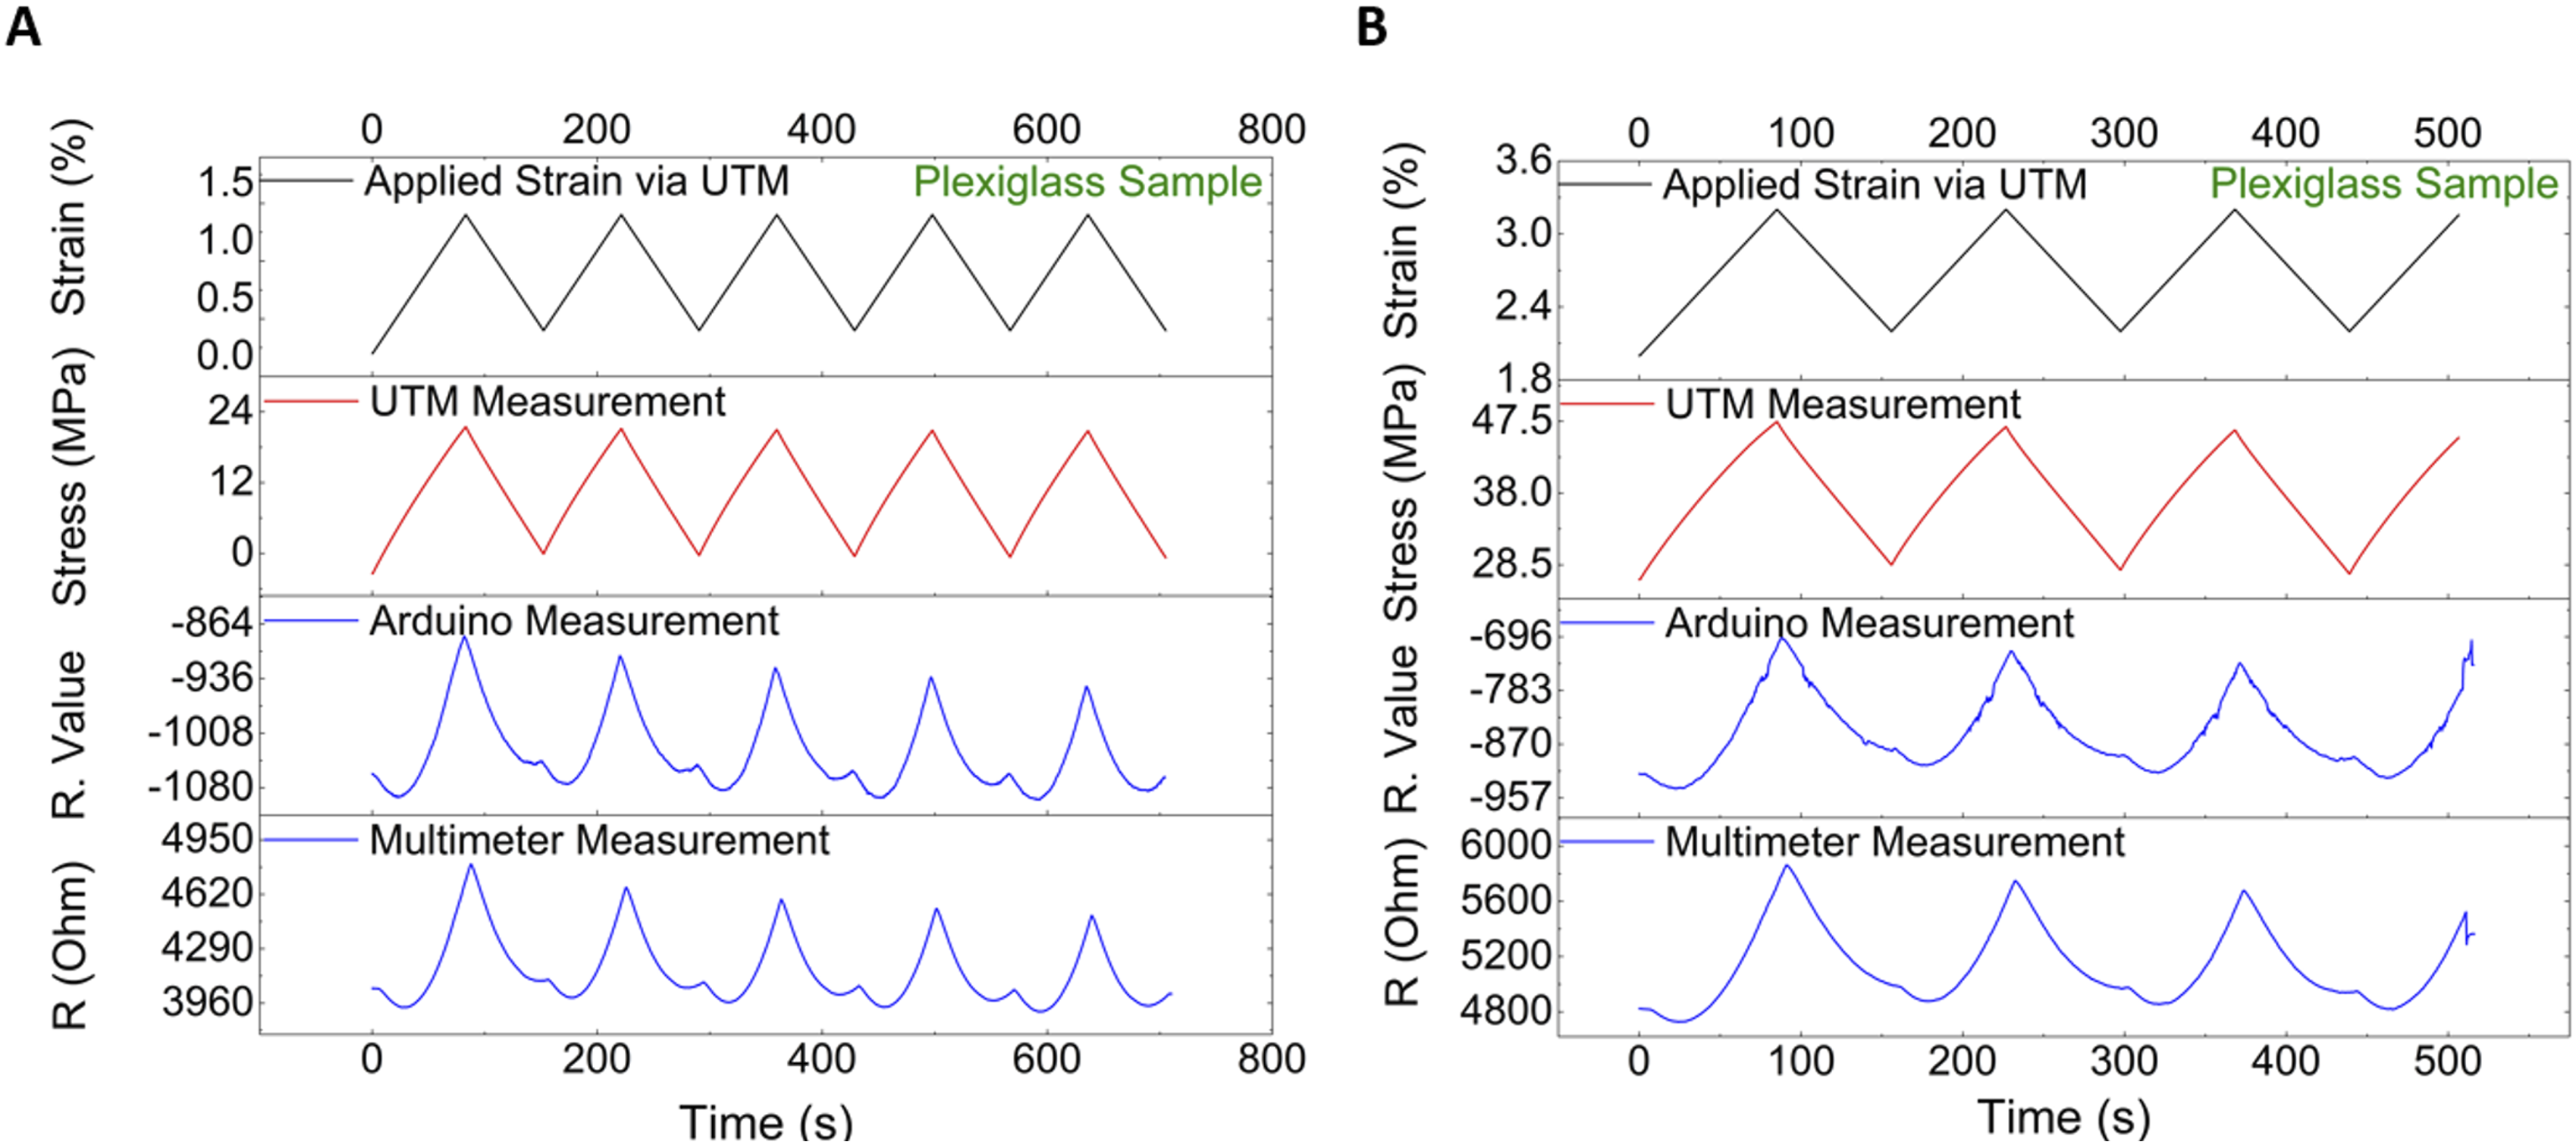
MATLAB algorithm evaluated the data from Figure 10. The algorithm normalized the resistance values for channels one and two. Channel one was multimeter measurement, and channel two was Arduino measurement. It took the ratio of two normalized values and plotted (Figure 11). The first evaluation, where the sample was still in the safe region, was used to define the threshold value. The second evaluation, therefore, was marked as risky when the compared R-value passed the threshold value. The first warning of the failure was approximately 350 s, and the second one was approximately 10 s before the real failure. MATLAB analysis results. Norm. R-Ch1 and Norm. R-Ch2 are normalized plots of channel 1 and channel 2 data. Compared R graph is the result of the ratio of the two-channel data. (a) Analysis results of cycles 1–5. (b) Analysis results of cycles 45–48.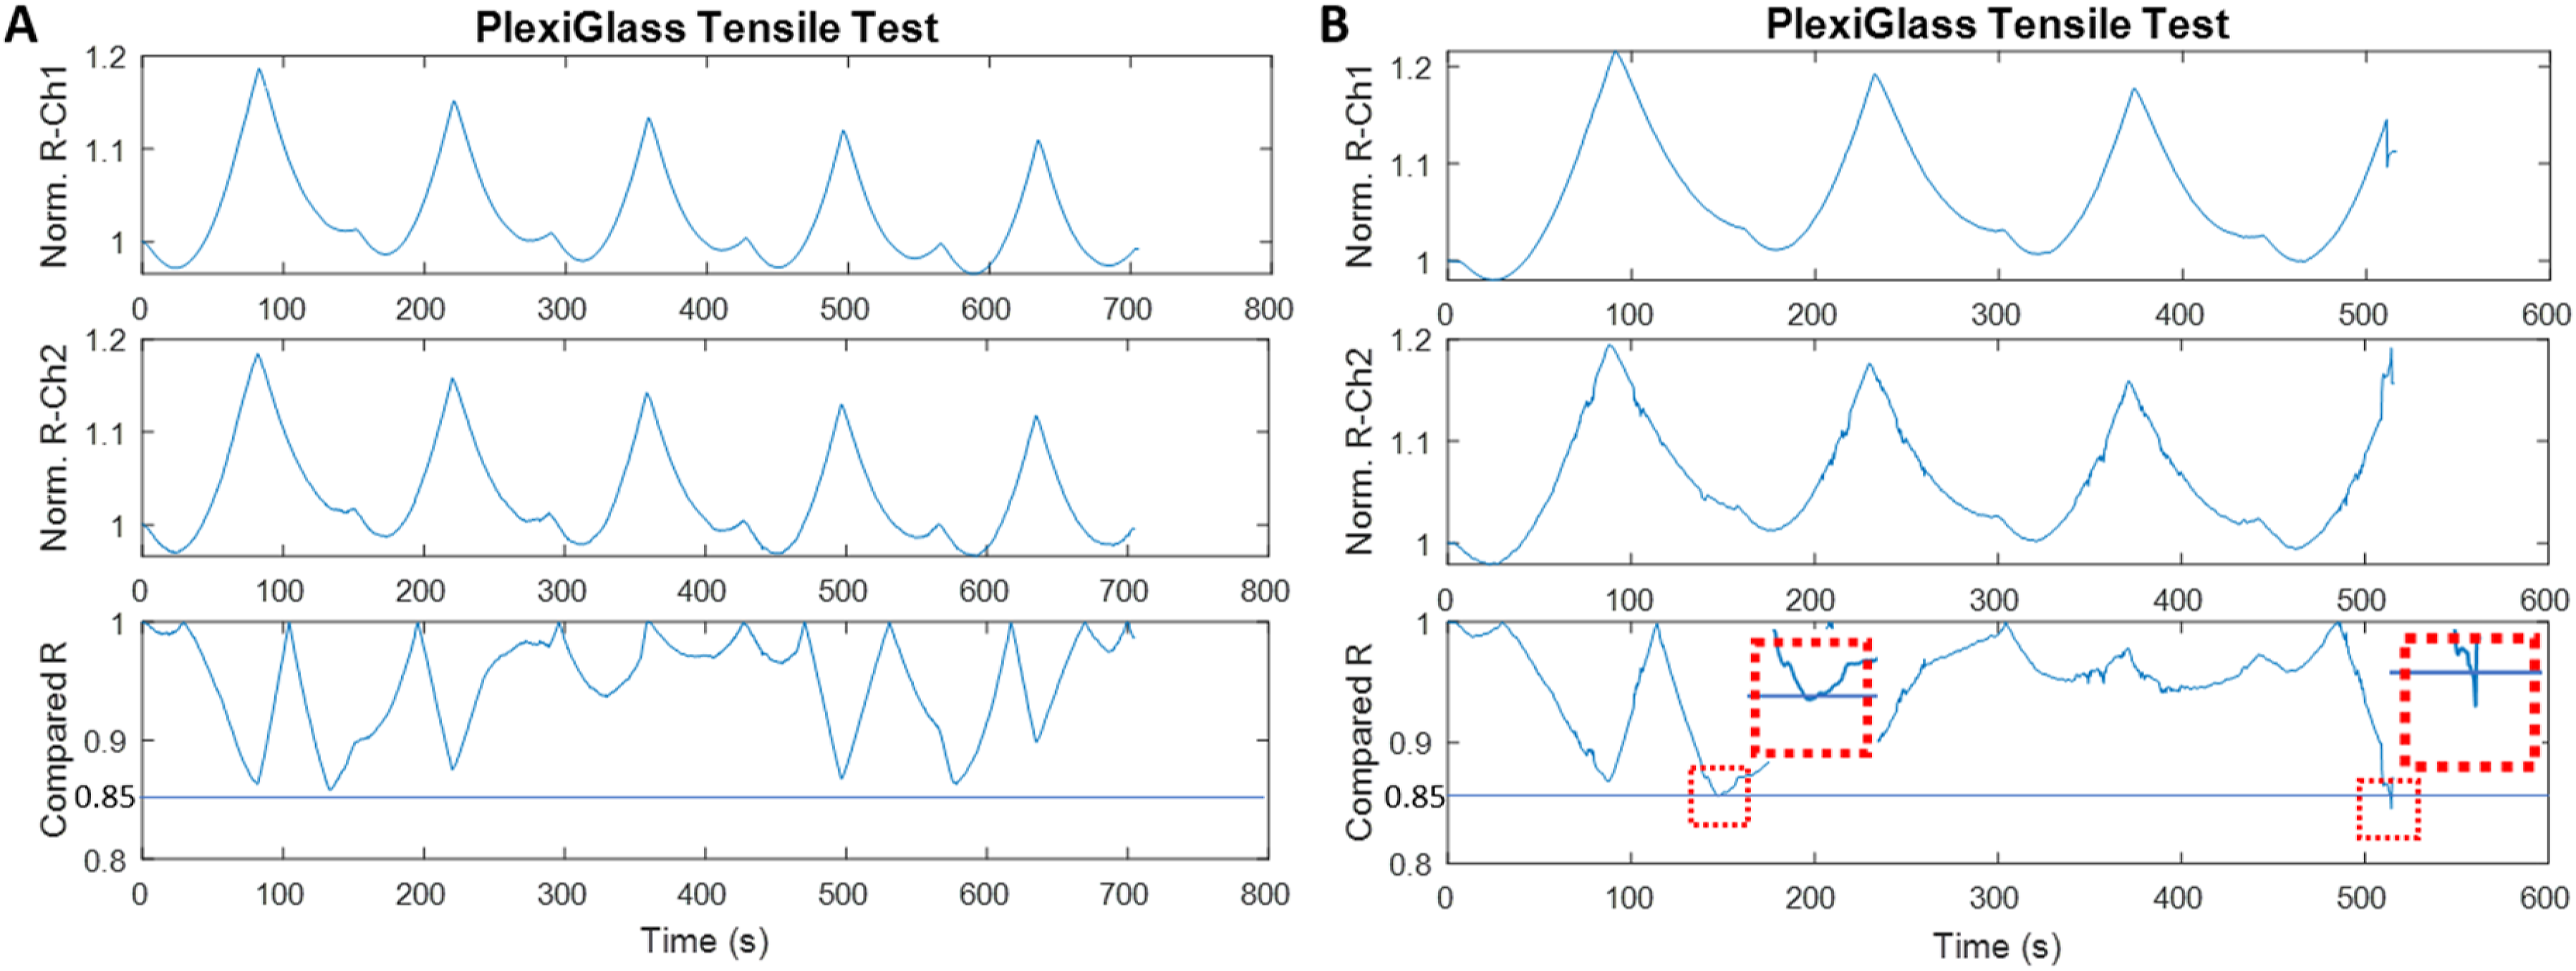
The results of cycles 1–5 and cycles 45–48 which are given in Figure 10 were vital for evaluation algorithm. Cycles no 1–5 were used for determining the threshold value where the cycles 45–48 were caused by warning for early detection of the failure.
In the measurements, the first warning was given 350 s before the material broke and the second warning was given 10 s before the material broke. MATLAB analysis data and results with warning points marked are given in Figure 11.
Composite piezoresistor for both sides showed a similar change in resistance while the material is in a safe region. Comparison of the two responses provided differences that were used to predict failure. Algorithm results pointed out that early prediction of failure was possible. The failure difference indicator was slightly different from the safe region. The threshold value and the tolerable indifference were too close to each other. This suggests the algorithm is conservative. The materials that have a larger plastic deformation region in the stress-strain curve have a higher difference. Hence, this structural health monitoring (SHM) method will be more effective for them.
For further studies, the algorithm can be developed to assign the threshold value. Live evaluation can be added. The circuit can be connected to Bluetooth or wireless modules. Different carrier types can be tested. Environmental resistance of the paste can be tested and improved.
Conclusion
In this study, a graphite-enhanced GNP/PVA composite piezoresistor was proposed and demonstrated as an answer to stability issue. Graphite was used to create a backbone for conduction patterns by increasing the driving force for tunneling through graphite particles. Graphite-enhanced PVA/GNP gave a reliable and repeatable response under cycling loading. The acetate paper sample results indicated that in the first 30 cycles, there was no sensitivity loss. The gauge factor under the same strain deformation was nearly constant in each cycle. The baseline decreases over loading cycles were eliminated. The thirty-cycle test results showed no sign of any decrease or significant fluctuations in the gauge factor. The results demonstrated more sensitive measurements (higher gauge factor) with increasing graphite amount. The sample with 40 wt.% GP had a gauge factor of 40, 4 times higher than the PVA/GNP composite piezoresistor (0 g neat sample). A new insight emerged from the results in which resistivity ρ in resistance law may be a function of the filler amount, width, length, and thickness of the composite piezoresistor suggesting tunability of the piezoresistor paste performance.
For the plexiglass sample, a 100 kN load cell was used with the original wedge grips. These grips tighten when the sample is loaded. They loosen when the sample is unloaded. The relaxation behavior is attributed to the wedge-type gripping mechanism for 100 kN load cells.
A circuit configuration with an Arduino microcontroller, ADS1220 module, and Wheatstone bridge were produced. Plexiglass sample results indicated that the produced circuit configuration provided a similar signal-to-noise ratio (SNR) as the commercial multimeter. Results illustrated similar sensitivity, SNR, and resolution as a commercial multimeter.
An algorithm was constructed to evaluate the collected data. The comparison of the two channels was used to evaluate the results. A threshold value for comparison was manually defined through the maximum difference of the safe region. Evaluation results predicted the failure 350 s earlier than the real failure. Results highlighted that this type of algorithm/SHM technique was more useful for ductile or elastomer materials.
Footnotes
Credit author statement
Melike Nur Önder: conceptualization, methodology, software, experiments and data collection, data curation, visualization, writing-original draft preparation. Melih Papila and Mehmet Ali Gülgün: conceptualization, methodology, supervision, writing-reviewing and editing.
Funding
The authors disclosed receipt of the following financial support for the research, authorship, and/or publication of this article: This work was supported by the National Research Foundation of Turkey (TUBITAK) grant funded by the Government of Türkiye (No. T.A.CF-22-02463 - 221M150).
Declaration of conflicting interests
The authors declared no potential conflicts of interest with respect to the research, authorship, and/or publication of this article.
Declaration of generative AI and AI-assisted technologies in the writing process
During the preparation of this work the author(s) used ChatGPT in order to editing the sentences. After using this tool/service, the author(s) reviewed and edited the content as needed and take(s) full responsibility for the content of the publication.
Data Availability Statement
The datasets generated and/or analyzed during the current study are available from the corresponding author on reasonable request.