
Abstract
The wide application of curved composite profiles across various industries raises questions about transferring findings from standardised tests to curved structures. Particularly for low-velocity impacts, understanding the deformation and damage behaviour of curved structures is crucial to achieve their lightweight potential. Carbon fibre reinforced polymer (CFRP) composites often show no surface visible damage after low-energy impacts, but barely visible impact damage (BVID) can compromise load-bearing capacity under continuous loads. This study aims to evaluate the effectiveness of self-reporting thin-ply hybrid composites as coating layers for structural health monitoring in curved panels, focusing specifically on enhancing the visual detection of BVID. Quasi-isotropic curved composite panels made from IM7 carbon/8552 epoxy were first manufactured, and their mechanical response under quasi-static indentation was analysed and compared to flat panels. Next, a hybrid composite—comprising a layer of unidirectional S-glass/epoxy and thin-ply YS-90A carbon/epoxy—was applied to the outer surfaces of the curved panels. To simulate a real-world application, the curved panels were designed with dimensions similar to those of composite hydrogen storage tanks. The results indicate that the hybrid composite sensors functioned satisfactorily and provided direct correlations between visible surface damage on the surface and BVID. The visual inspection results are connected to data obtained from the load-displacement graphs, enabling a thorough analysis of sensor performance in visualising different stages of BVID.
Keywords
Introduction
In today’s advanced manufacturing world, curved composite structures play a key role in different industries, from aircraft fuselages and wings in aerospace and the car body panel in automotive sectors to curved roofs and bridges in construction and wind turbine blade and solar panels in renewable energy sectors.1–3 Notably, curved fibre reinforced polymer (FRP) composites also feature prominently in hydrogen storage tanks as they offer several advantages, including a lightweight, high strength-to-weight ratio, high corrosion resistance, and high safety and durability. These are particularly of great interest in sectors embracing hydrogen as a clean energy carrier, including the automotive and aerospace industries. 4
Two primary types of damage to the composite hydrogen storage tanks reported in the literature are internal damage caused by the cycles of charge and discharge and external damage caused by impact. 5 The latter may happen due to a drop impact and foreign object impact during transportation, dismount, and service, resulting in multiple damage modes such as matrix cracking, dents, fibre breakage, and delamination.6,7 Although significant research has been conducted on the impact damage and behaviour of flat FRP composite structures,8–10 there has been comparatively less emphasis on curved FRP composites. The research on curved composite structures under out-of-plane loading has mainly focused on the influence of different structural and impactor geometrical parameters on the impact response11–23 and very limited studies have explored the health monitoring of curved composite structures under low-velocity impact. 7 For instance, Choi studied the impact response with respect to the “stiffness change” induced by cylinder stress from internal pressure, 12 Saghafi et al. 16 investigated the influence of the pre-load and boundary conditions, Yang et al. 13 analysed the influence of impact energy and impact position, Gemi et al. 15 studied the effect of the impact velocity and the pipe diameter, Wan et al. 20 scrutinised the influence of the curvature diameter, and Seifoori et al. 14 investigated the effect of the shape of the projectile nose on the impact response. Moreover, the influence of the geometrical parameters on the impact behaviour of curved composite structures was studied in.21–23 Rocha et al. 7 applied fibre Bragg grating sensors on a composite overwrapped pressure vessel for hydrogen storage to monitor the impact damage. The sensing array strategy allowed to detect and locate barely visible impact damage (BVID) resulting from drop-weight impact tests. However, there were errors as small as 17 mm and up to 56 mm between the predicted and ‘real’ impact locations.
Hybrid thin-ply composite sensors were first introduced by Czel and Wisnom. 24 They were later applied for monitoring damage in flat composite panels under tensile and fatigue loading,25–27 as well as under out-of-plane loading (impact and indentation) in.28,29 However, in many composite industries, such as aircraft panels, wind turbine blades or hydrogen storage tanks, curved composite panels are utilised. Therefore, this paper investigates the feasibility of using these sensors to visualise BVID in curved composite panels. This paper aims to investigate the potential application of the hybrid composite sensors, previously demonstrated in, 29 for impact damage monitoring in curved composite structures. This sensing technology is much simpler than other non-destructive evaluation (NDE) methods and has shown promising performance in improving the visual inspection in flat composite panels, 30 but it has not been applied to curved composites to evaluate the performance for detecting BVID. This necessitates testing and analysing curved composite panels equipped with the hybrid sensor to understand its effect on mechanical properties such as stiffness, indentation, and impact behaviour. Harris et al. 21 reported that the impact behaviour of curved plates was found to be largely representative of impact testing on a complete cylindrical pipe section, broadly producing a similar delamination threshold at a given load value. Hence, in this research, with a focus on hydrogen storage tanks as a case study, curved composite panels resembling the dimensional features of composite pressure vessels for hydrogen storage are fabricated. These panels are outfitted with hybrid sensors and subjected to static indentation and low-velocity impact tests to evaluate the effectiveness of the hybrid sensor in detecting BVID. Furthermore, while the substitution of static indentation and low-velocity impact tests has been extensively explored in the literature for flat samples, there is currently a lack of information regarding its validity in the context of curved structures. The outcomes of this research provide valuable insights into the implementation of self-reporting thin-ply hybrid composites as coating layers for structural health monitoring (SHM) in real-life curved panels, with a specific focus on enhancing the visual detection of BVID.
Materials and methods
Two sets of curved composite samples, including Reference and Sensor samples, were manufactured for this research. The former features 32 plies of unidirectional IM7 carbon/8552 epoxy prepregs with quasi-isotropic lay-up of [45/0/90/-45]4s. In the latter, a hybrid composite sensor composed of a layer of unidirectional YS-90A carbon prepreg and a layer of unidirectional S-glass/913 epoxy prepreg, both with a 90° orientation, was also applied on both the front face (impacted face) and back face (non-impacted face) of the Reference samples. The total laminate thickness of the Reference and Sensor laminates are 4 mm and 4.16 mm, respectively. The Reference samples were cured at 110°C for 60 minutes, followed by 180°C for 120 minutes under a constant 0.7 MPa pressure, as recommended by the manufacturer for IM7/8552 prepregs.
29
The manufacture of the Sensor samples followed a two-step process, where the substrate was cured first, and the next day, the sensor was applied on either side, and the entire structure was cured at 125°C for 60 minutes under a constant 0.7 MPa pressure, as recommended by the manufacturer for S-glass/913 prepregs.31,32 A curved metal mould with a radius of 130 mm was utilised, and a conventional hand lay-up method was used to stack layers onto it. The sample dimensions (radius of the curved mould = 13 cm) were designed to match those of composite hydrogen storage tanks, serving as a practical case study application. Subsequently, a standard vacuum bagging method was applied to the curved aluminium plate, with additional silicone sheets placed over the laminates to ensure a smooth surface and uniform pressure distribution within the autoclave (see Figure 1). Due to limited data on out-of-plane testing of curved composite structures, two samples were manufactured for every single indentation and impact test in this research, repeating each test twice to ensure repeatability and reliability. Different manufacturing stages of the curved composite panels: (a) a flat metal sheet transformed into a curved mould with desired curvature radius (13 cm) to stack the layers that were cut into standard dimensions, (b) the autoclave was set up according to the curing cycle of the prepregs, (c) the edges of the cured samples was trimmed using a cutting machine to achieve precise dimensions and smooth edge finish.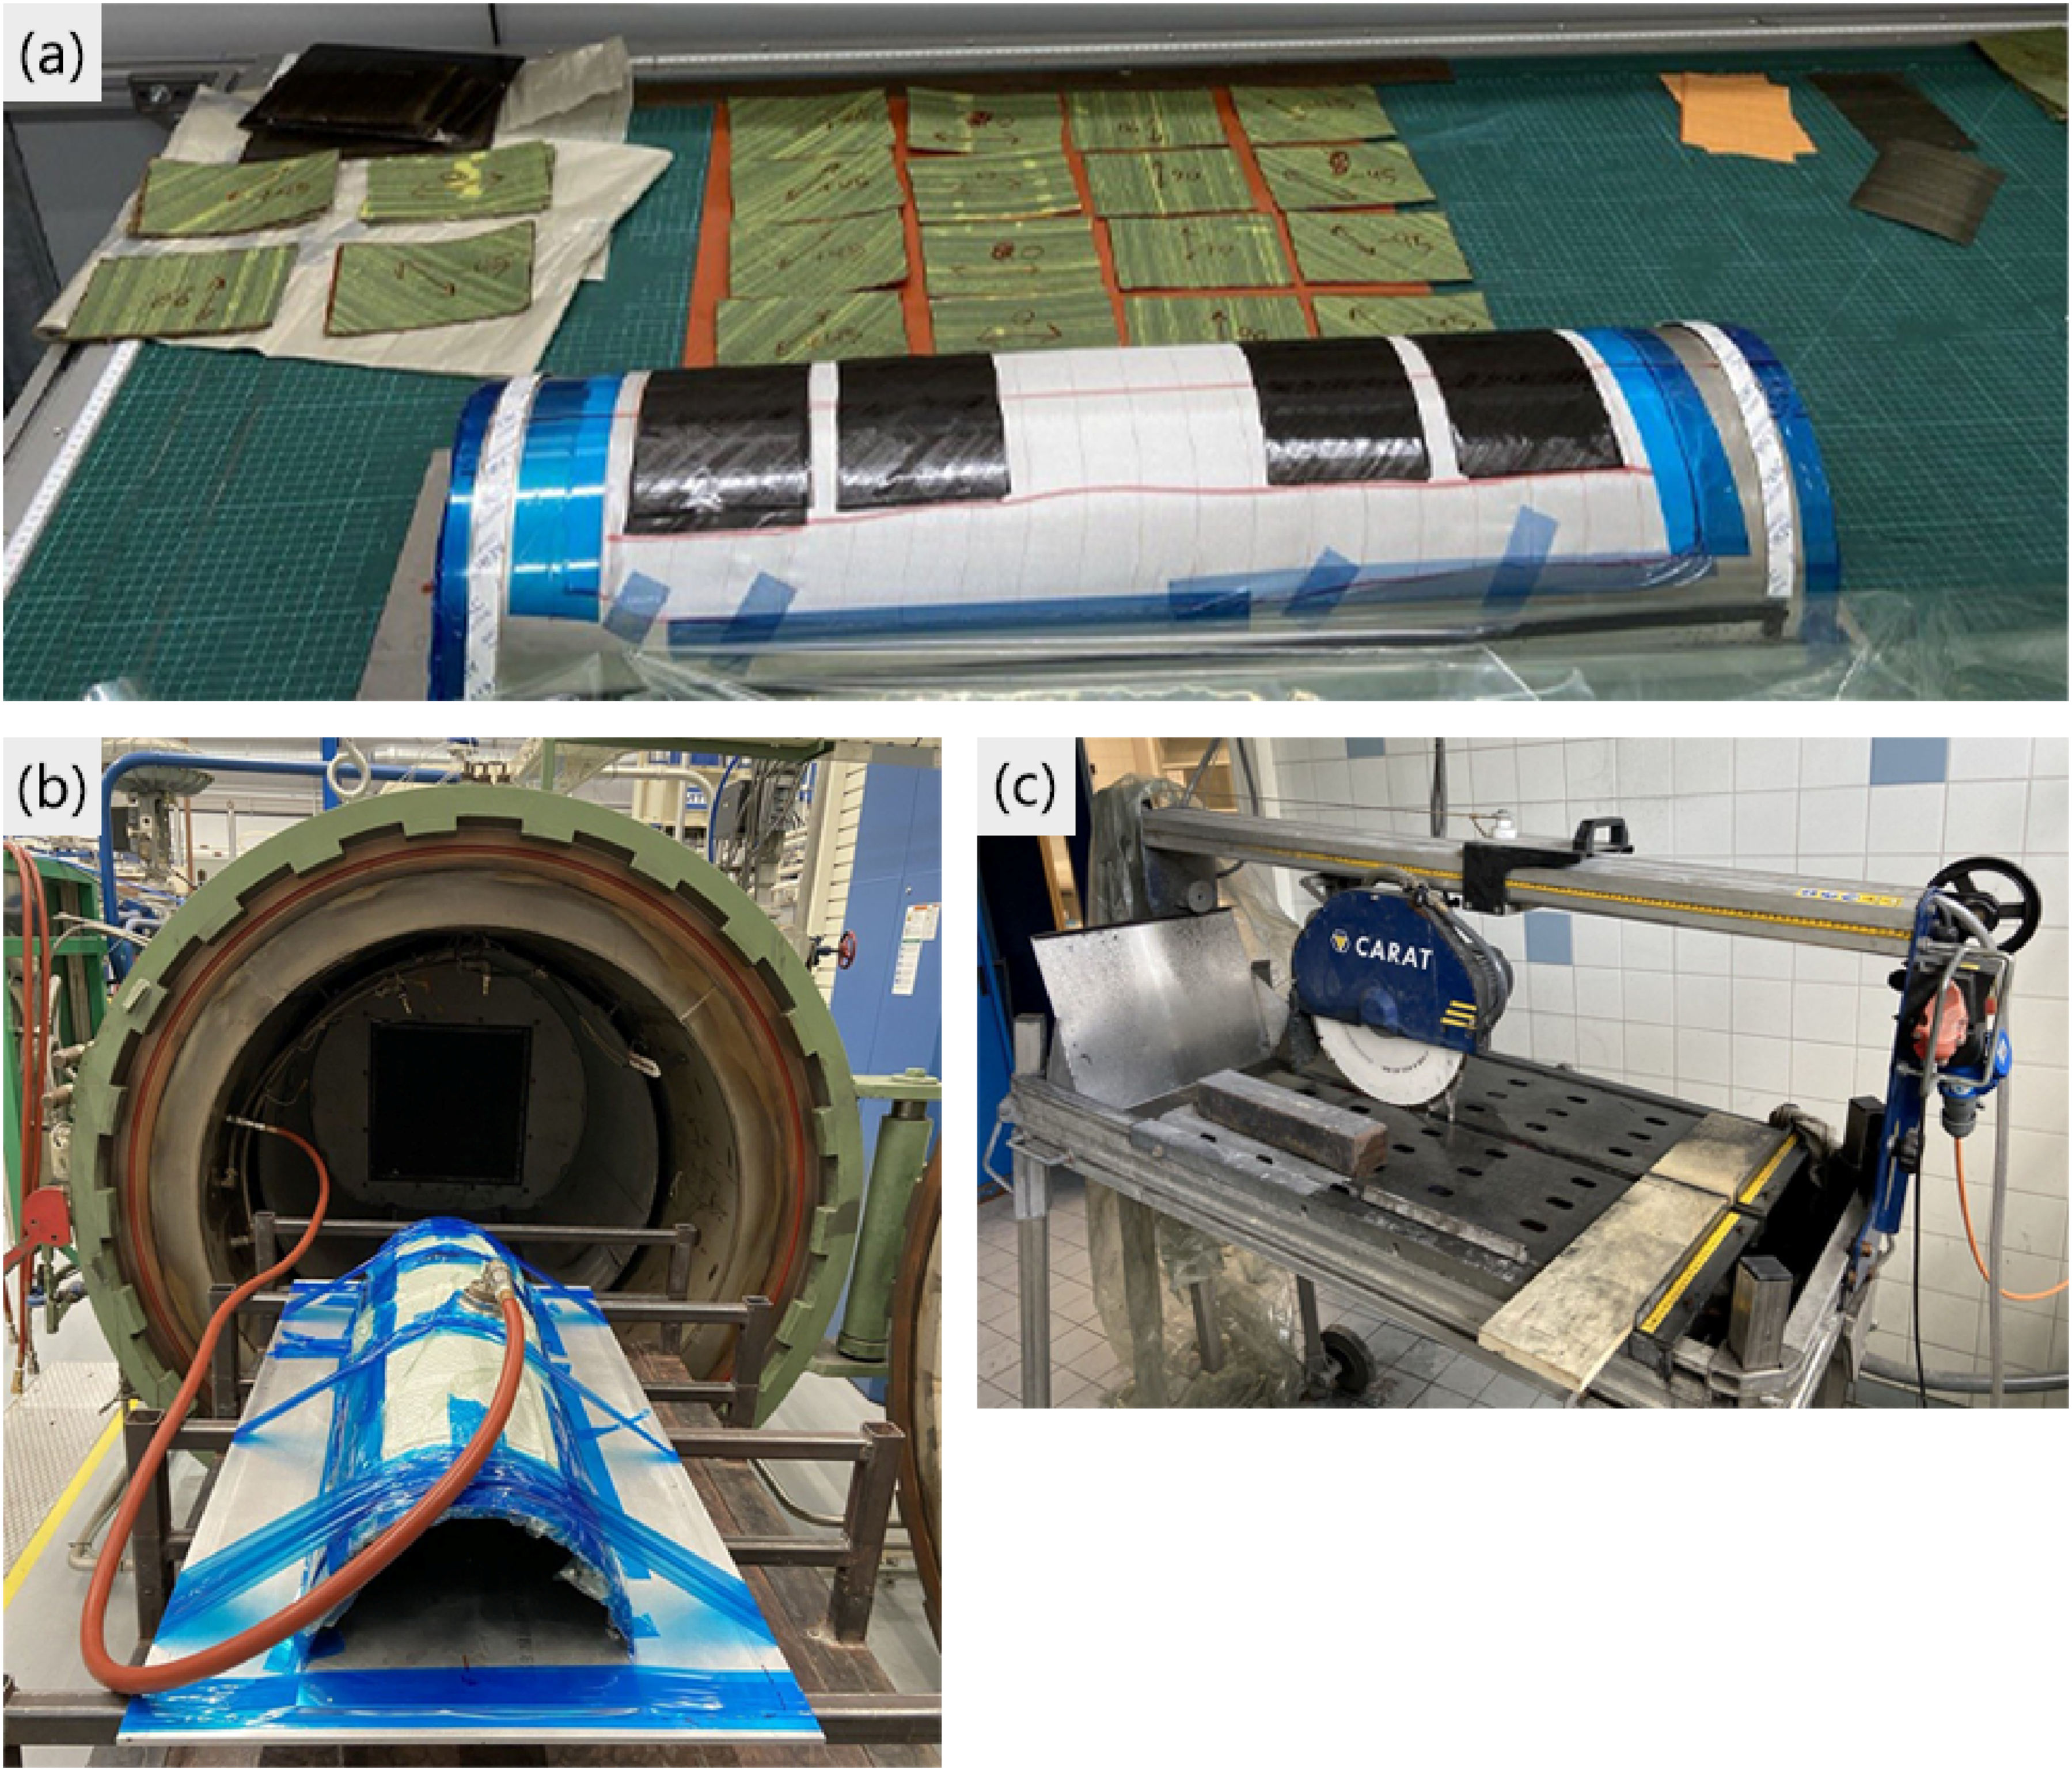
Following the completion of sample manufacturing, quasi-static indentation tests were initially conducted and analysed, followed by low-velocity impact tests at various impact energies. The setup for both indentation and impact tests was similar to that of flat samples (as detailed in a previous paper 29 ). However, due to the curved shape of the samples, a custom-designed supporting window and clamping fixture system was created using SolidWorks software and subsequently manufactured and assembled.
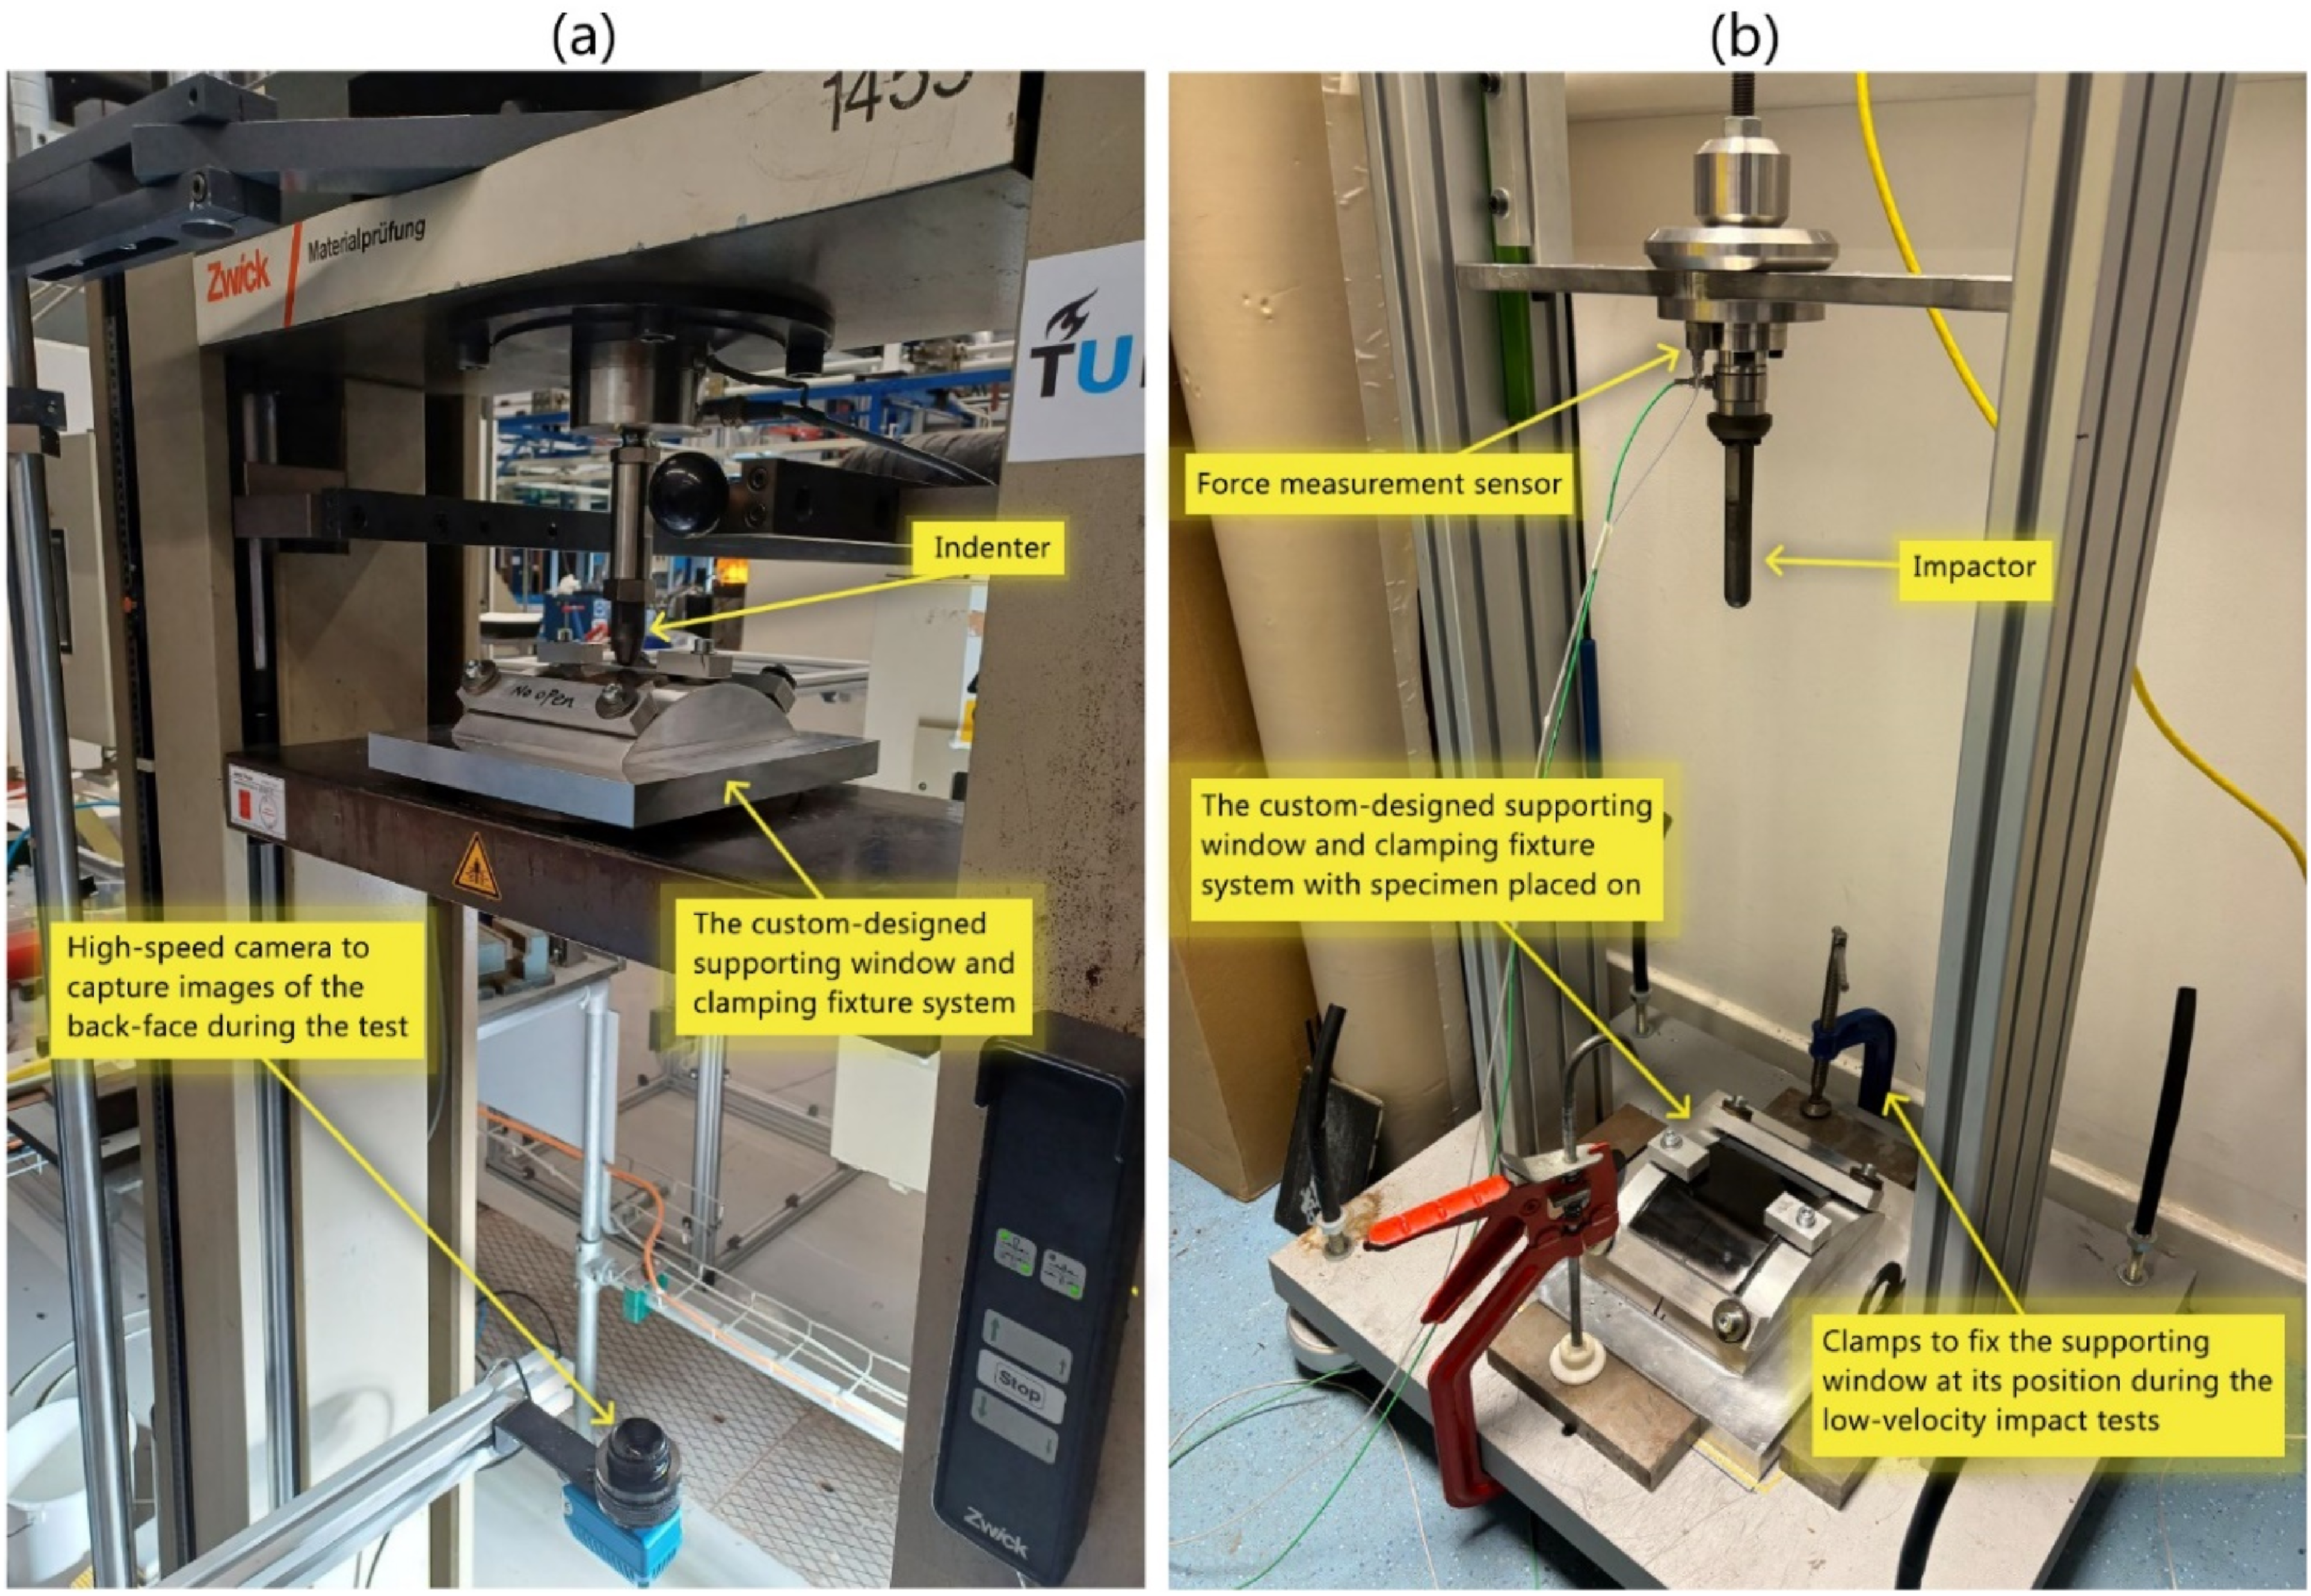
The custom-designed window was made to closely match the one used for flat samples. It includes six points where screws are used to fix the sample from the top side, along with a central empty rectangular area measuring 75 mm*125 mm, where the sample (100 mm*150 mm) is placed, ensuring consistent boundary conditions for testing. Note that the sample is secured along its entire length on the shorter side (see Figure 2). This design establishes a reliable platform for comparing the results of both flat and curved sample tests. Moreover, the custom-designed window was utilised for both indentation and impact tests, allowing for a meaningful comparison between the static indentation and low-velocity impact test results on curved composite samples. Visual inspection was performed after completing impact tests to evaluate the surface damages. All tests (indentation, impact, visual inspection) were performed at room temperature, and all other test parameters (such as indentation rate, setup of the camera for capturing images of the back face during indentation test, calculation of displacement and energy in impact tests etc.) were similar to those of testing the flat panels (Figure 3).
29
(a) The custom-designed supporting window and clamping fixture, (b) top view of the supporting windows used for testing of flat and curved samples. The test setup: (a) quasi-static indentation, (b) low-velocity impact.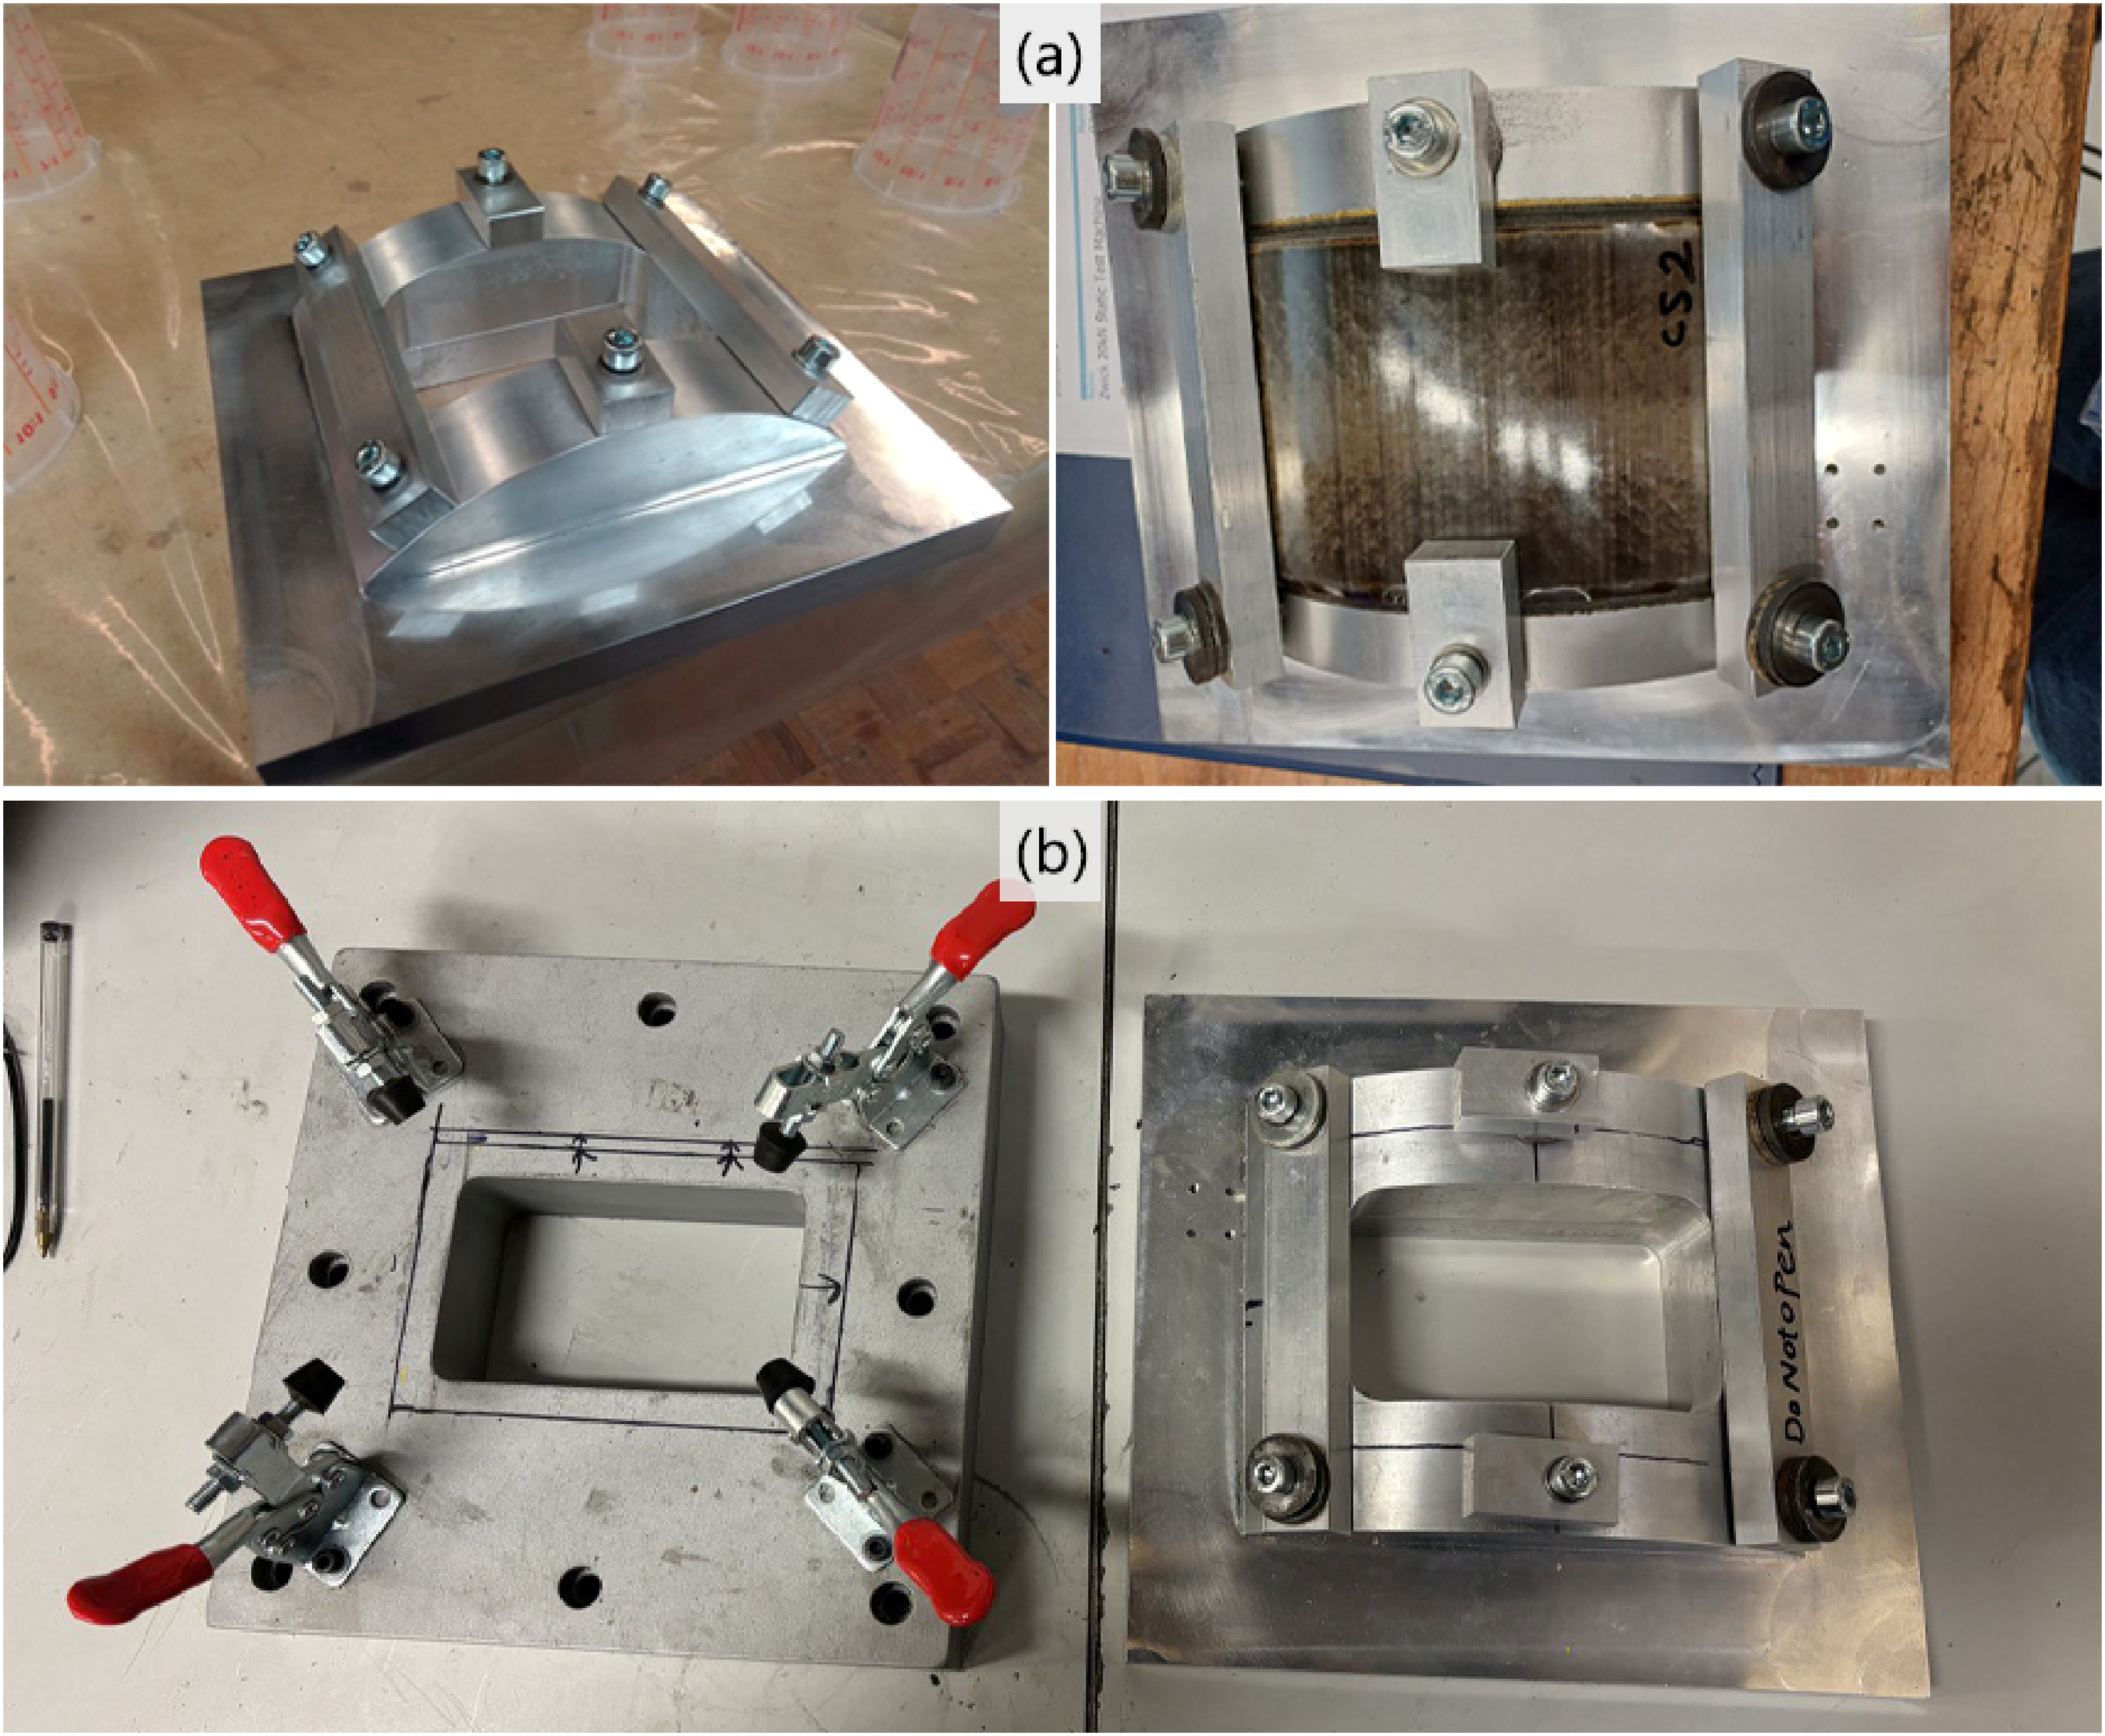
To assess internal damage, such as delamination and matrix cracks, the impacted samples were cross-sectioned using a Dremel equipped with a cutting disk designed for carbon fibre composites. The cross-sections were then examined under a microscope with 5x magnification. This process is shown in Figure 4. Sample preparation process for internal damage analysis under microscope: (a) post-impact test samples, (b) marking the sample for targeted sectioning, (b) utilising a Dremel with a cutting disk optimised for carbon fibre composites, (c) polishing the cross-section to enhance surface quality, using both machine and papers with wet/dry process, (d) capturing microscopy images of the prepared cross-section.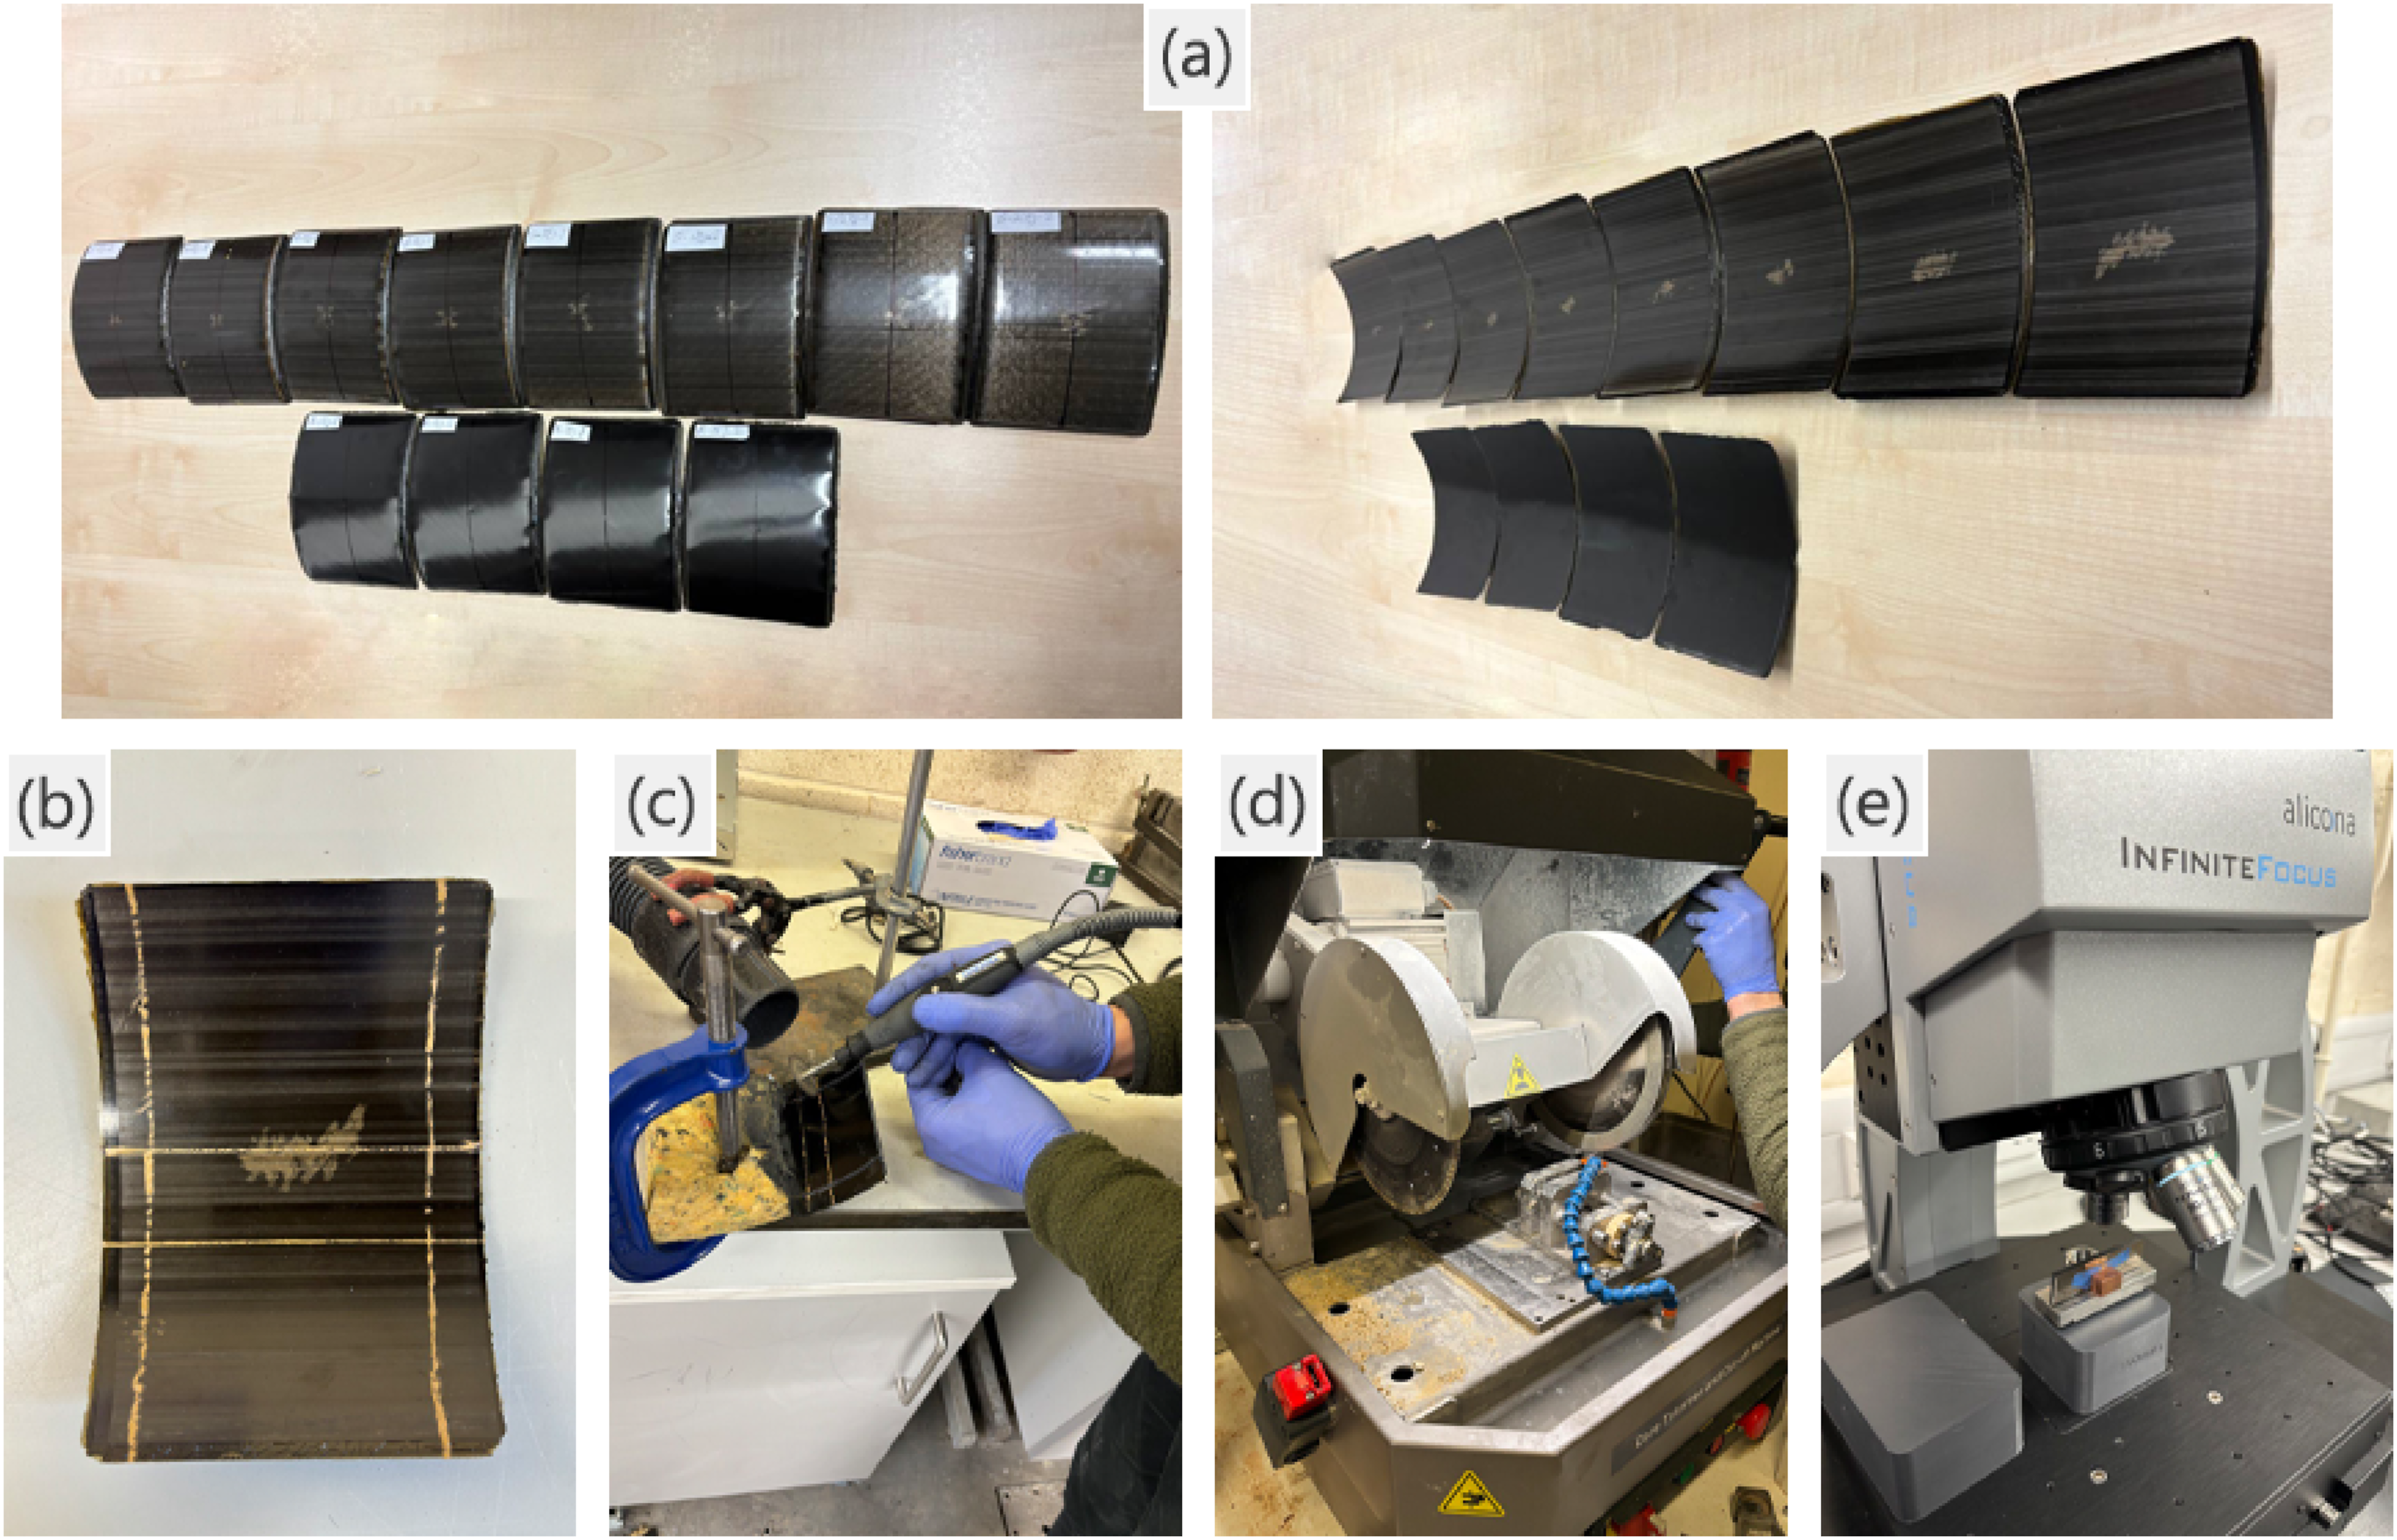
Results and discussion
Quasi-static indentation results
Global behaviour and influence of adding sensors on indentation properties
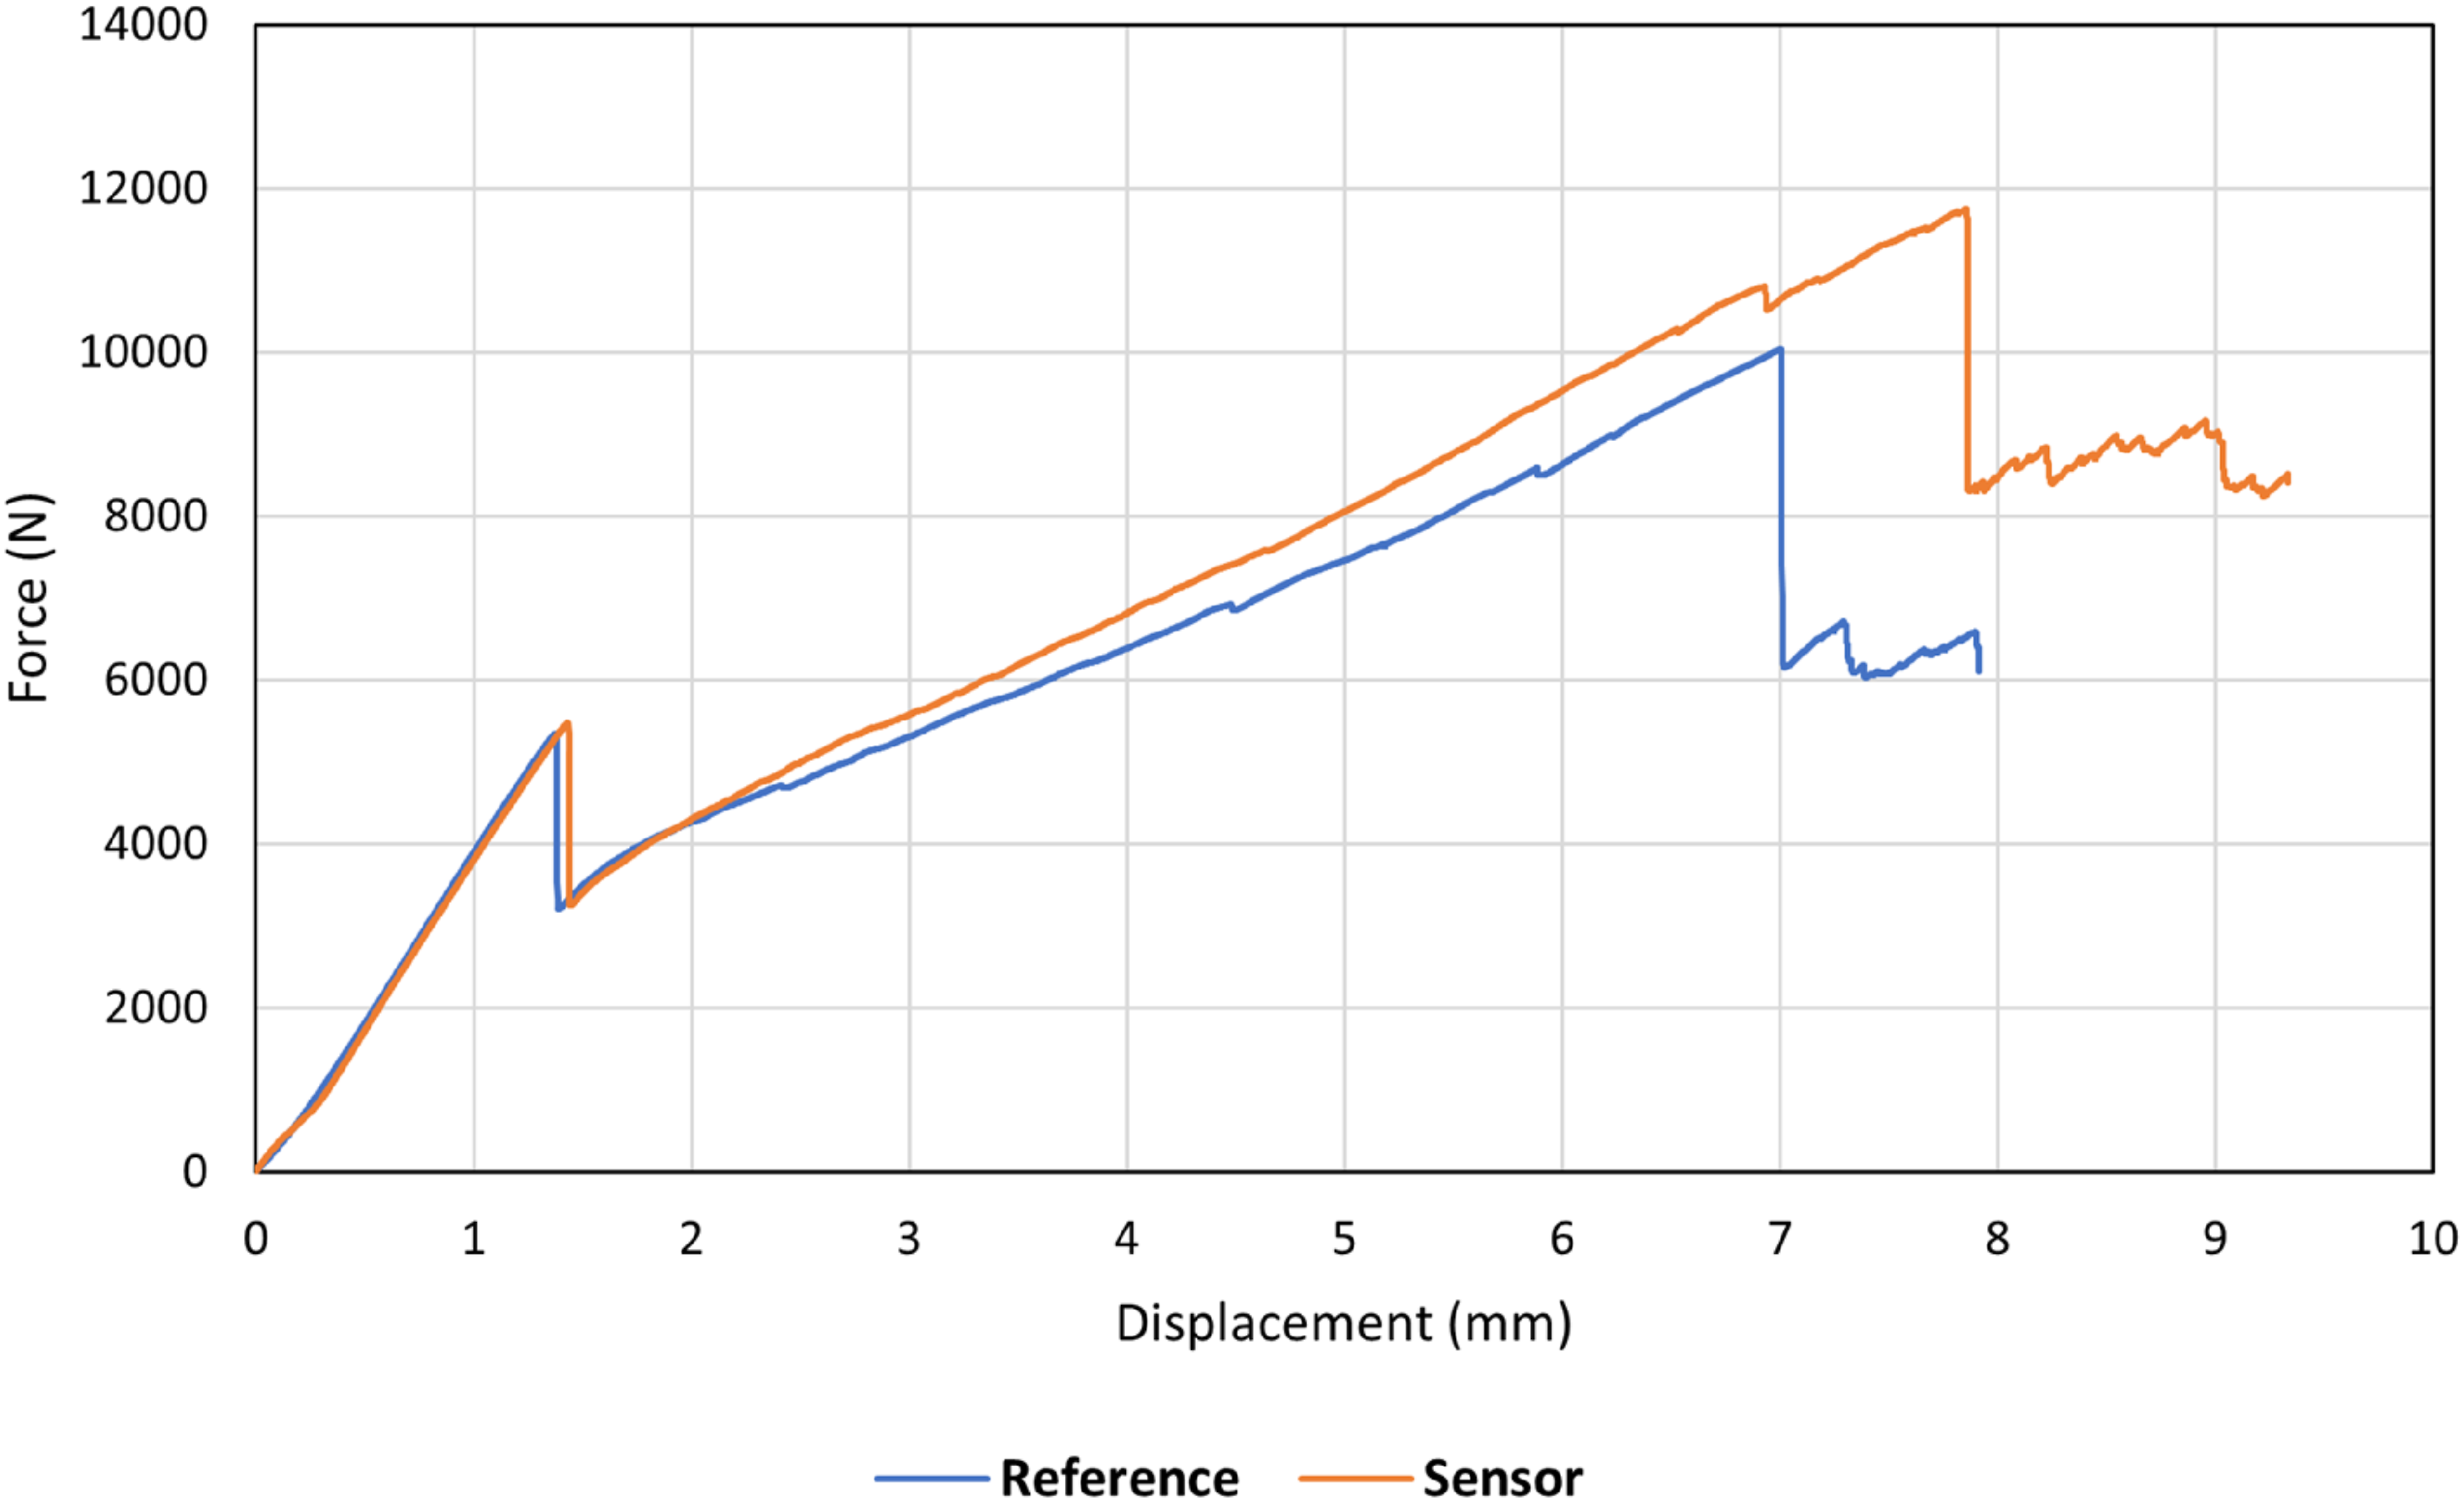
Figure 5 shows the indentation test results of Reference and Sensor samples, where for each sample group, the test was conducted two times to ensure repeatability. All samples follow a similar pattern, where a near-linear behaviour is seen until a notable load drop at force and displacement of approximately 5500N and 1.5mm, implying the delamination onset. Then, the graph continues non-linearly up until a second significant drop, which occurs at slightly different forces for different samples, indicating the fibre failure damage. After that, the load does not rise significantly while displacement (deformation) increases. This is highlighted by multiple small load drops, demonstrating that the structure cannot undergo further damage through deformation, and the perforation may happen at any time. The graphs indicate a high level of repeatability across the samples of each group, where there is a notable overlap between the curves before the first load drop, and they gradually differ with an increase in force. A comparison of Reference and Sensor graphs shows a slightly higher structural stiffness in both Sensor-1 and Sensor-2 specimens than in Reference-1 and Reference-2, suggesting that adding sensors can marginally increase the rigidity, and as the force increases, this becomes more pronounced. It can also be mentioned that adding sensors can increase the fibre failure load threshold to a small extent. To better represent a comparison of the Reference and Sensor samples, Figure 6 depicts the graphs associated with Reference-1 and Sensor-1 samples. Note that in the rest of this paper, the Reference and Sensor refers to Reference-1 and Sensor-1 samples, respectively. Static indentation test results of all curved samples. Comparison of indentation response in Reference and Sensor samples.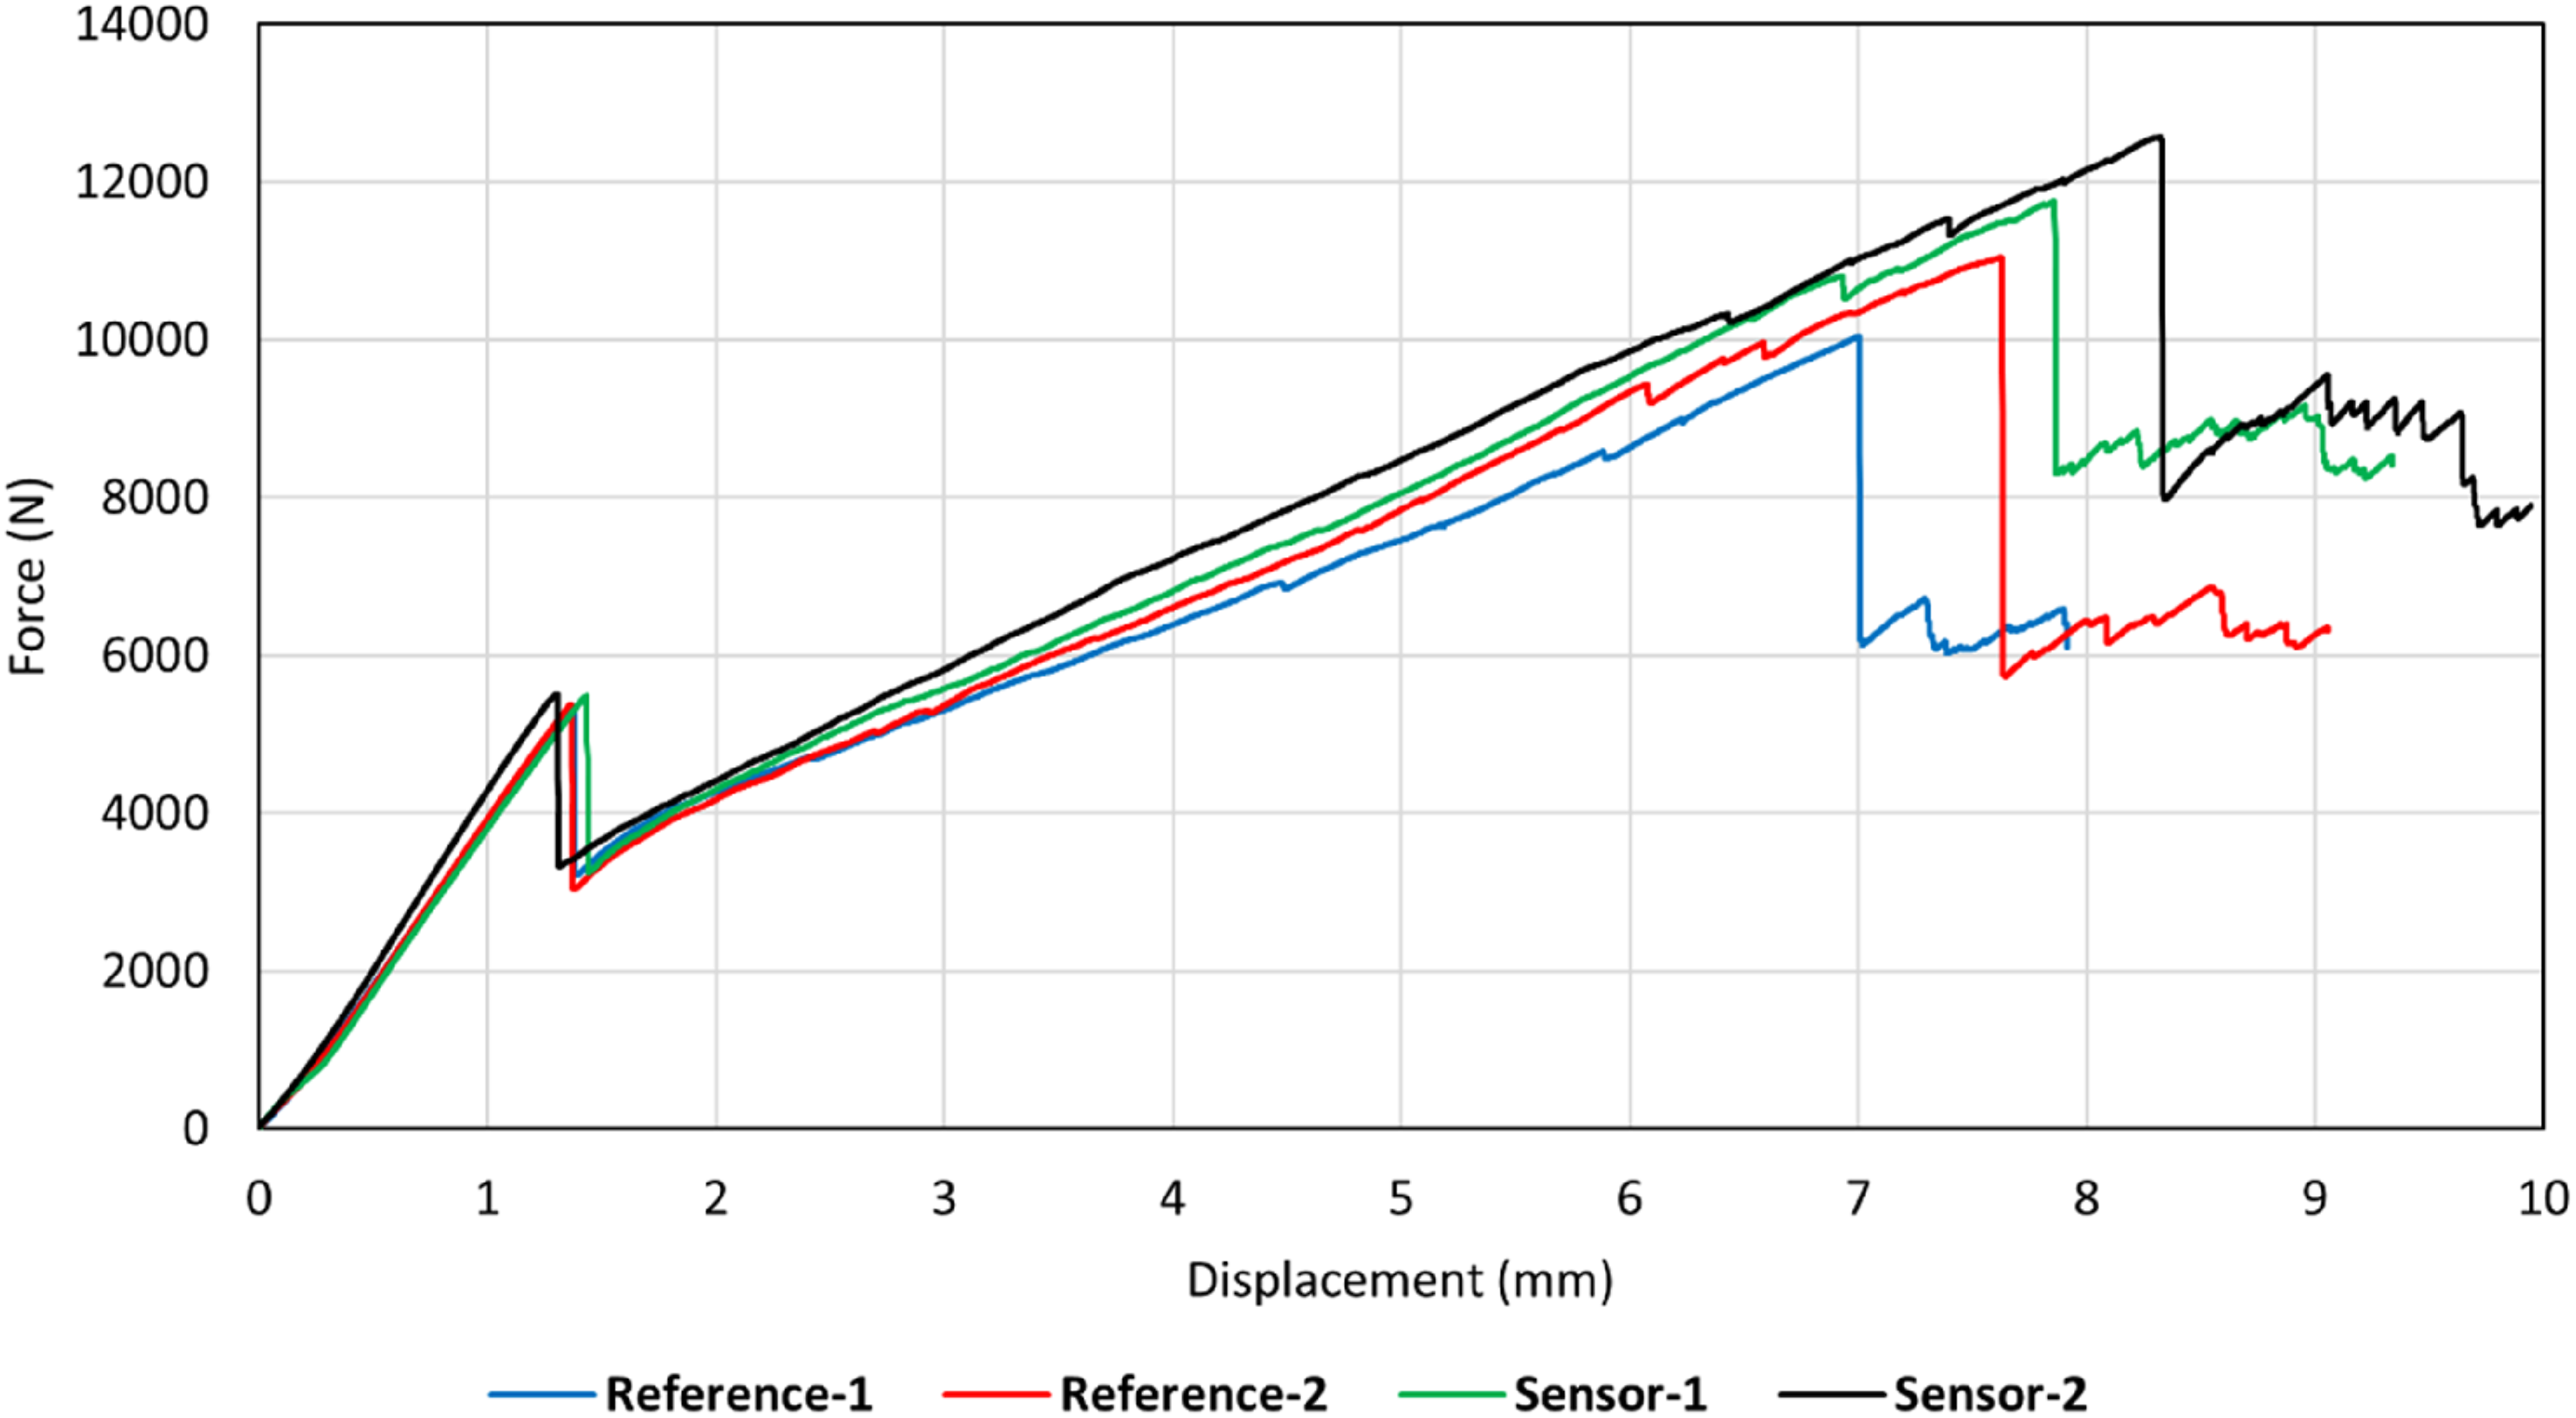
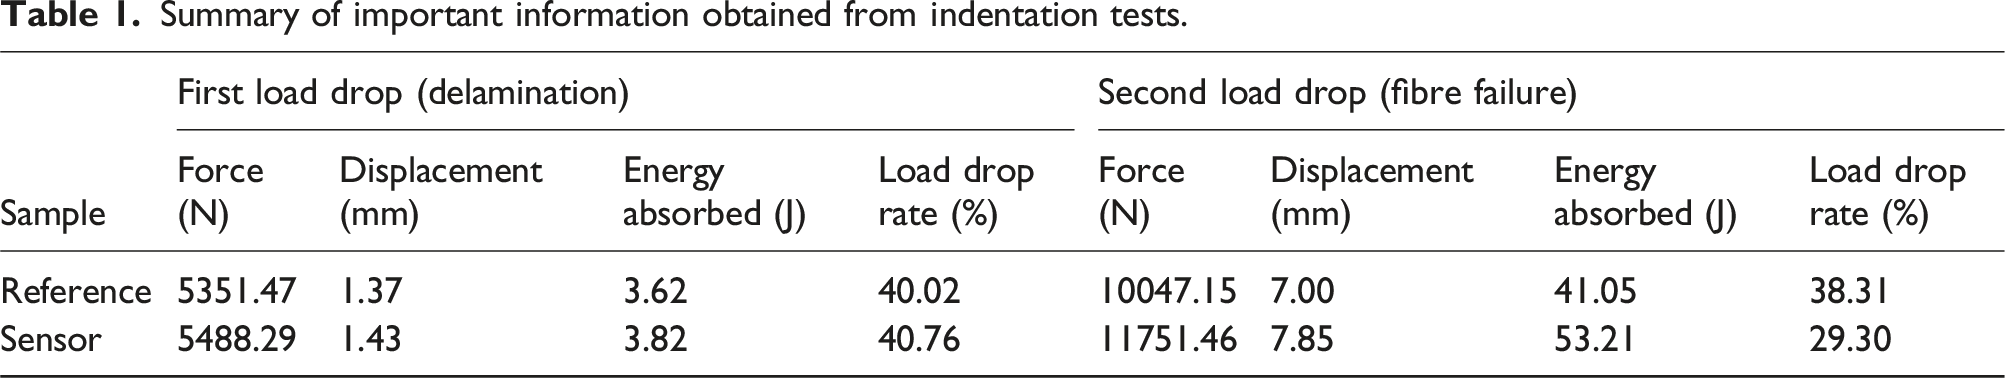
Summary of important information obtained from indentation tests.
Sensor activation and visual inspection
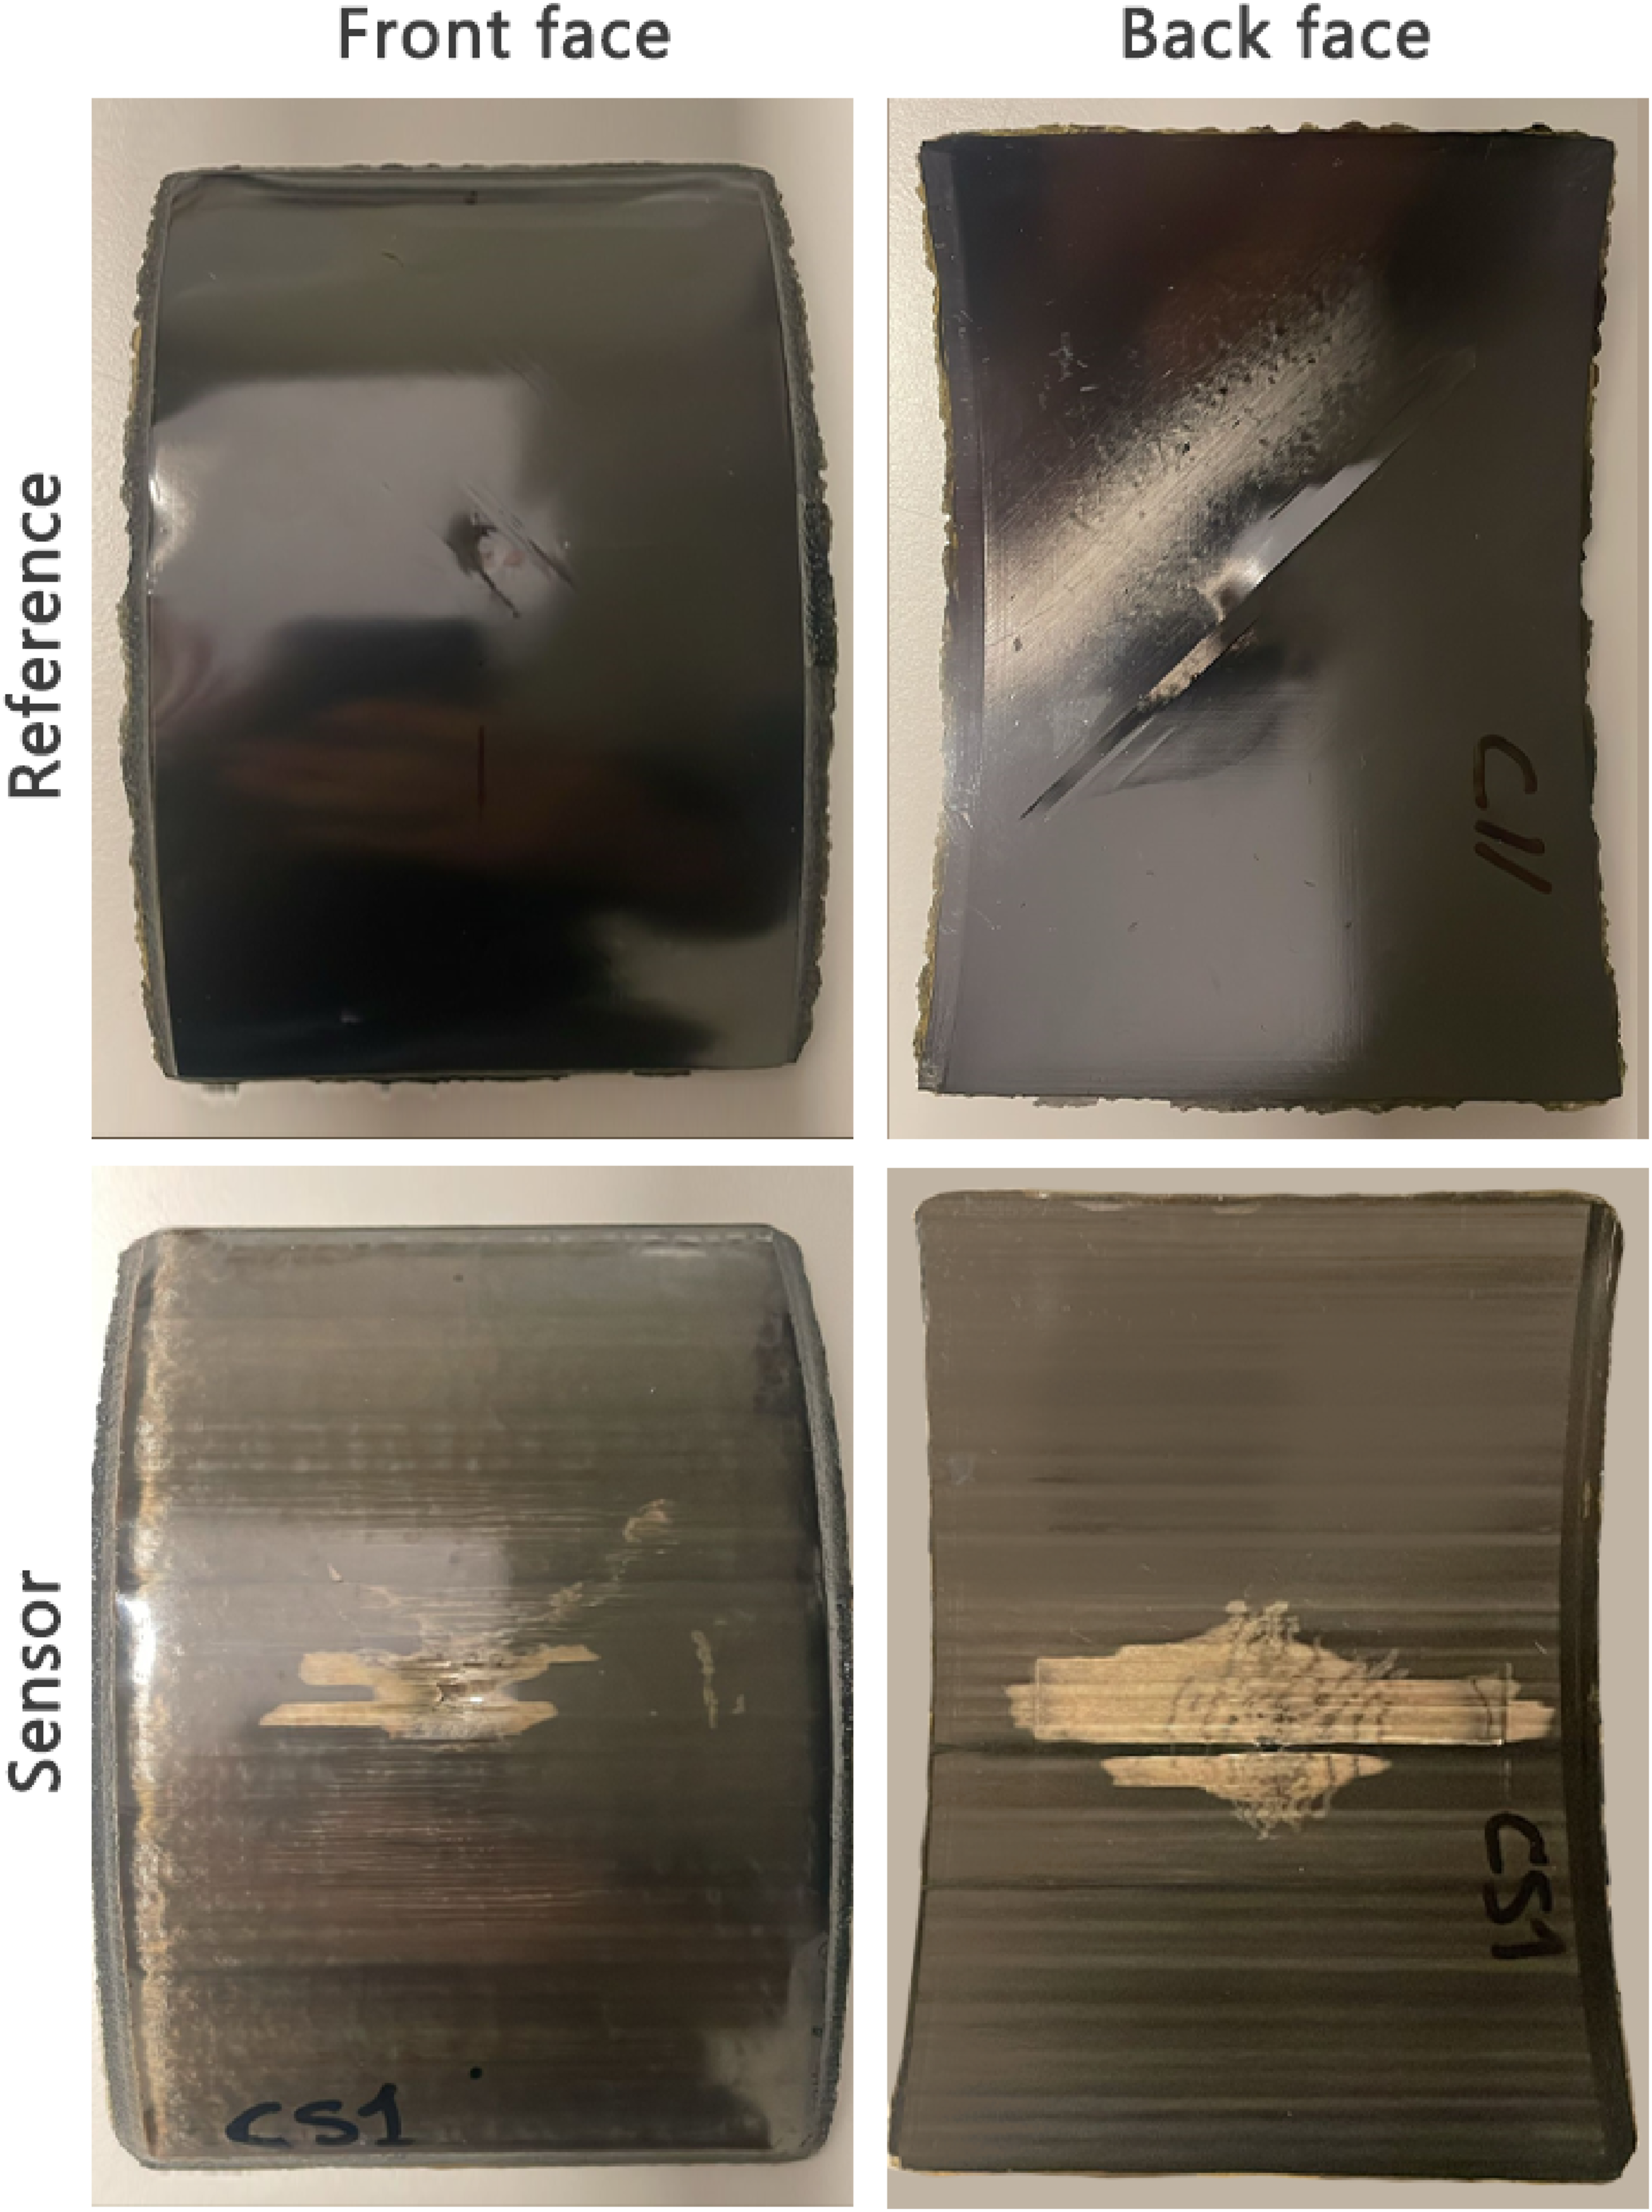
Figure 7 shows force-time graphs of Reference and Sensor samples during the indentation test, along with selective images of the back face taken at different stages of the test. Figure 7(a) demonstrates that the damage on the back face is not visible both before and after the first load drop, meaning that delamination remains undetected upon visual inspection. Notably, one cannot visually detect the damage long after the delamination onset, extending up to the second load drop, meaning that damage is not detectable even at the onset of fibre failure. It could only become visible shortly after the second load drop. This suggests that the damage could be visualised through visual inspection of the surface only after the structural failure. When comparing Figure 7(b), illustrating the visual inspection results of Sensor samples, with Figure 7(a), interesting observations become apparent. Figure 7(b) shows that damage in Sensor samples could be visually detected at a force level as low as nearly 4000N. This is a few seconds before the onset of delamination, making the sensor an excellent tool for detecting and preventing delamination in curved composite structures. The visual damage pattern on the surface becomes larger as the force increases, and, particularly, there is a noticeable change in the shape and size of the activated area at force thresholds for delamination and fibre failure. Note that the images showcased here were captured using a black-and-white camera available at the time of testing. For a more comprehensive interpretation of the images and to observe the colour changes induced by the sensor, please refer to the post-indentation images depicted in Figure 8. Visual inspection and sensor activation during static indentation experiment: (a) Reference, (b) Sensor. Post-experiment visual inspection: (a) Reference, (b) Sensor.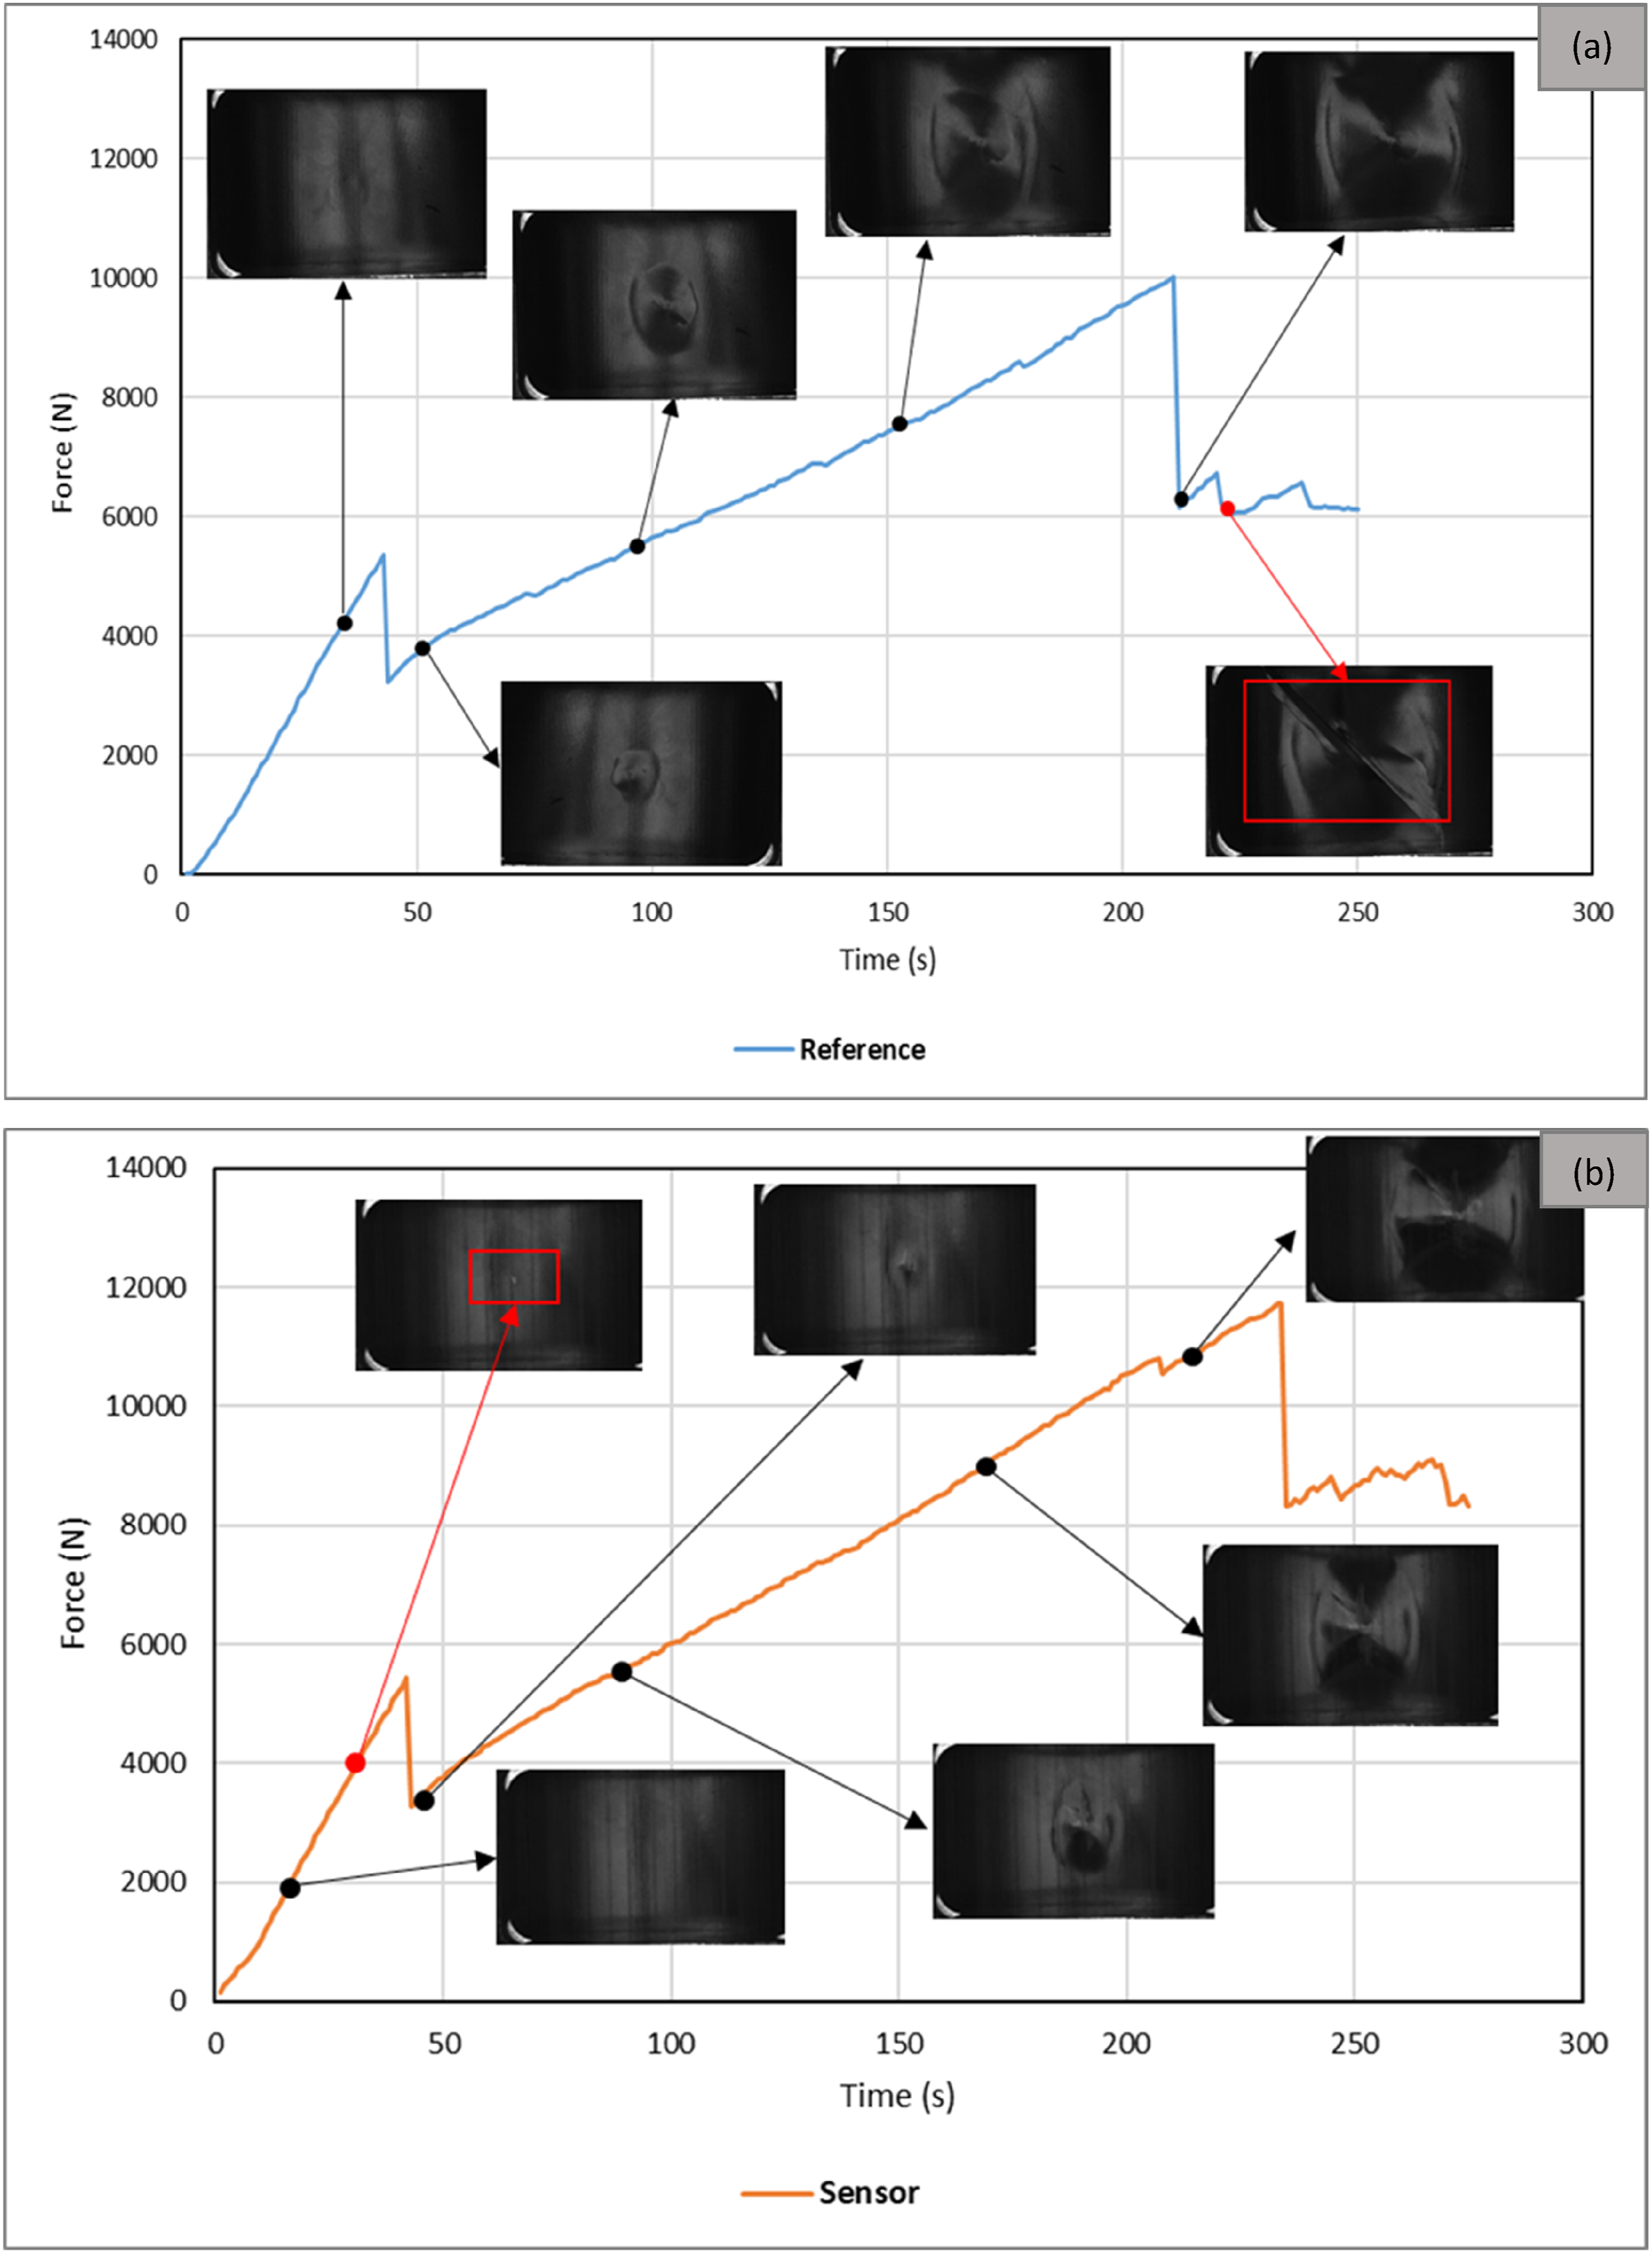
Threshold energies for visually detectable damage (on the back-face).
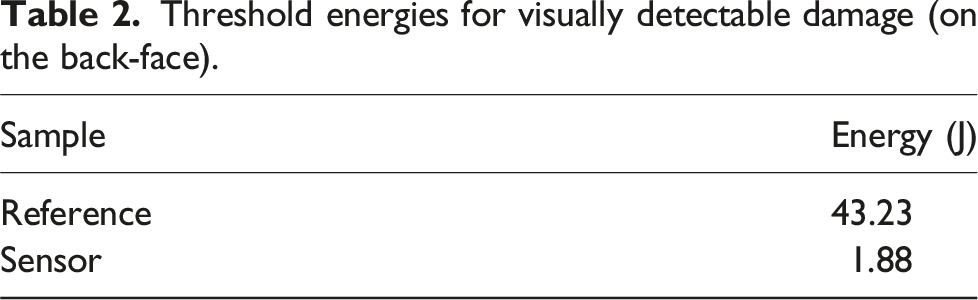
Figure 8 illustrates the post-experiment visual inspection images of the front face and back face of both samples. Looking at the front face in the Reference sample, we can see a discernible dent that is surrounded by a few cracks parallel to the fibre direction (45
Comparison of indentation behaviour in curved and flat composite structures
Comparing flat and curved structures offers valuable insights into their respective performances under out-of-plane loading, thereby facilitating the estimation or prediction of the response of curved structures potentially based on the testing of flat structures. This comparative analysis proves especially beneficial considering the potential cost and complexity associated with assessing curved structures. This section outlines a comparison of indentation response, with a subsequent section providing insight into a comparison of impact behaviour. As shown in Figure 9, both graphs indicate two noticeable load drops, where a linear response is seen before the first load drop. After that, the flat sample continues a linear response, while the curved sample demonstrates a non-linear response and multiple small drops. Interestingly, while the force level at both the first and second load drops is very close in the two graphs, the displacement differs notably. Before the first load drop, the curved sample illustrates a more rigid response as its deformation is considerably lower than that of the flat sample under the same force level. This is mainly due to the curvature of the laminate that can enhance bending stiffness.
21
After the first load drop, however, the curved sample shows a less rigid response than the flat sample, reaching the critical fibre failure load at a higher deformation level. In other words, for the flat structure, the slope of the curve after the first load drop changes slightly, while for the curved sample, the slope after the first load drop decreases significantly. Damage localisation and subsequent large deformation support the delamination propagation along the circumference in the curved sample.
11
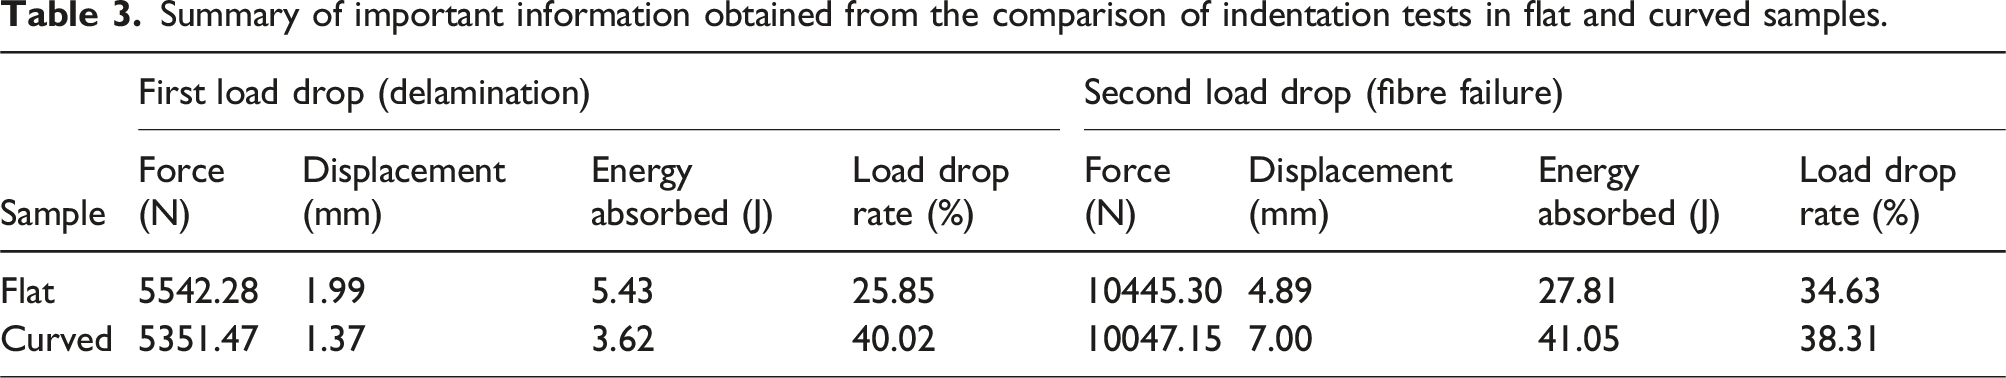
Important information obtained from this figure is summarised in Table 3. This table highlights two notable differences between the flat and curved samples. The first one is the rate of the first load drop, which is considerably higher for the curved sample, suggesting a larger delamination damage area in the latter. The second notable difference is the absorbed energy associated with the fibre failure damage (at the second drop), which is much higher for the curve panel. Based on these results, the flat and curved structures appear to sustain relatively similar energy levels before undergoing delamination. However, in terms of fibre damage, the curved structure seems to tolerate higher energy levels (approximately 47% higher than the flat sample). In terms of the influence of adding sensors on indentation response, both flat and curved structures show a slightly higher structural stiffness when equipped with the sensor. However, the difference between the Reference and Sensor samples for both flat and curved structures is not significant. Comparison of static indentation response in curved and flat Reference composite samples. Summary of important information obtained from the comparison of indentation tests in flat and curved samples.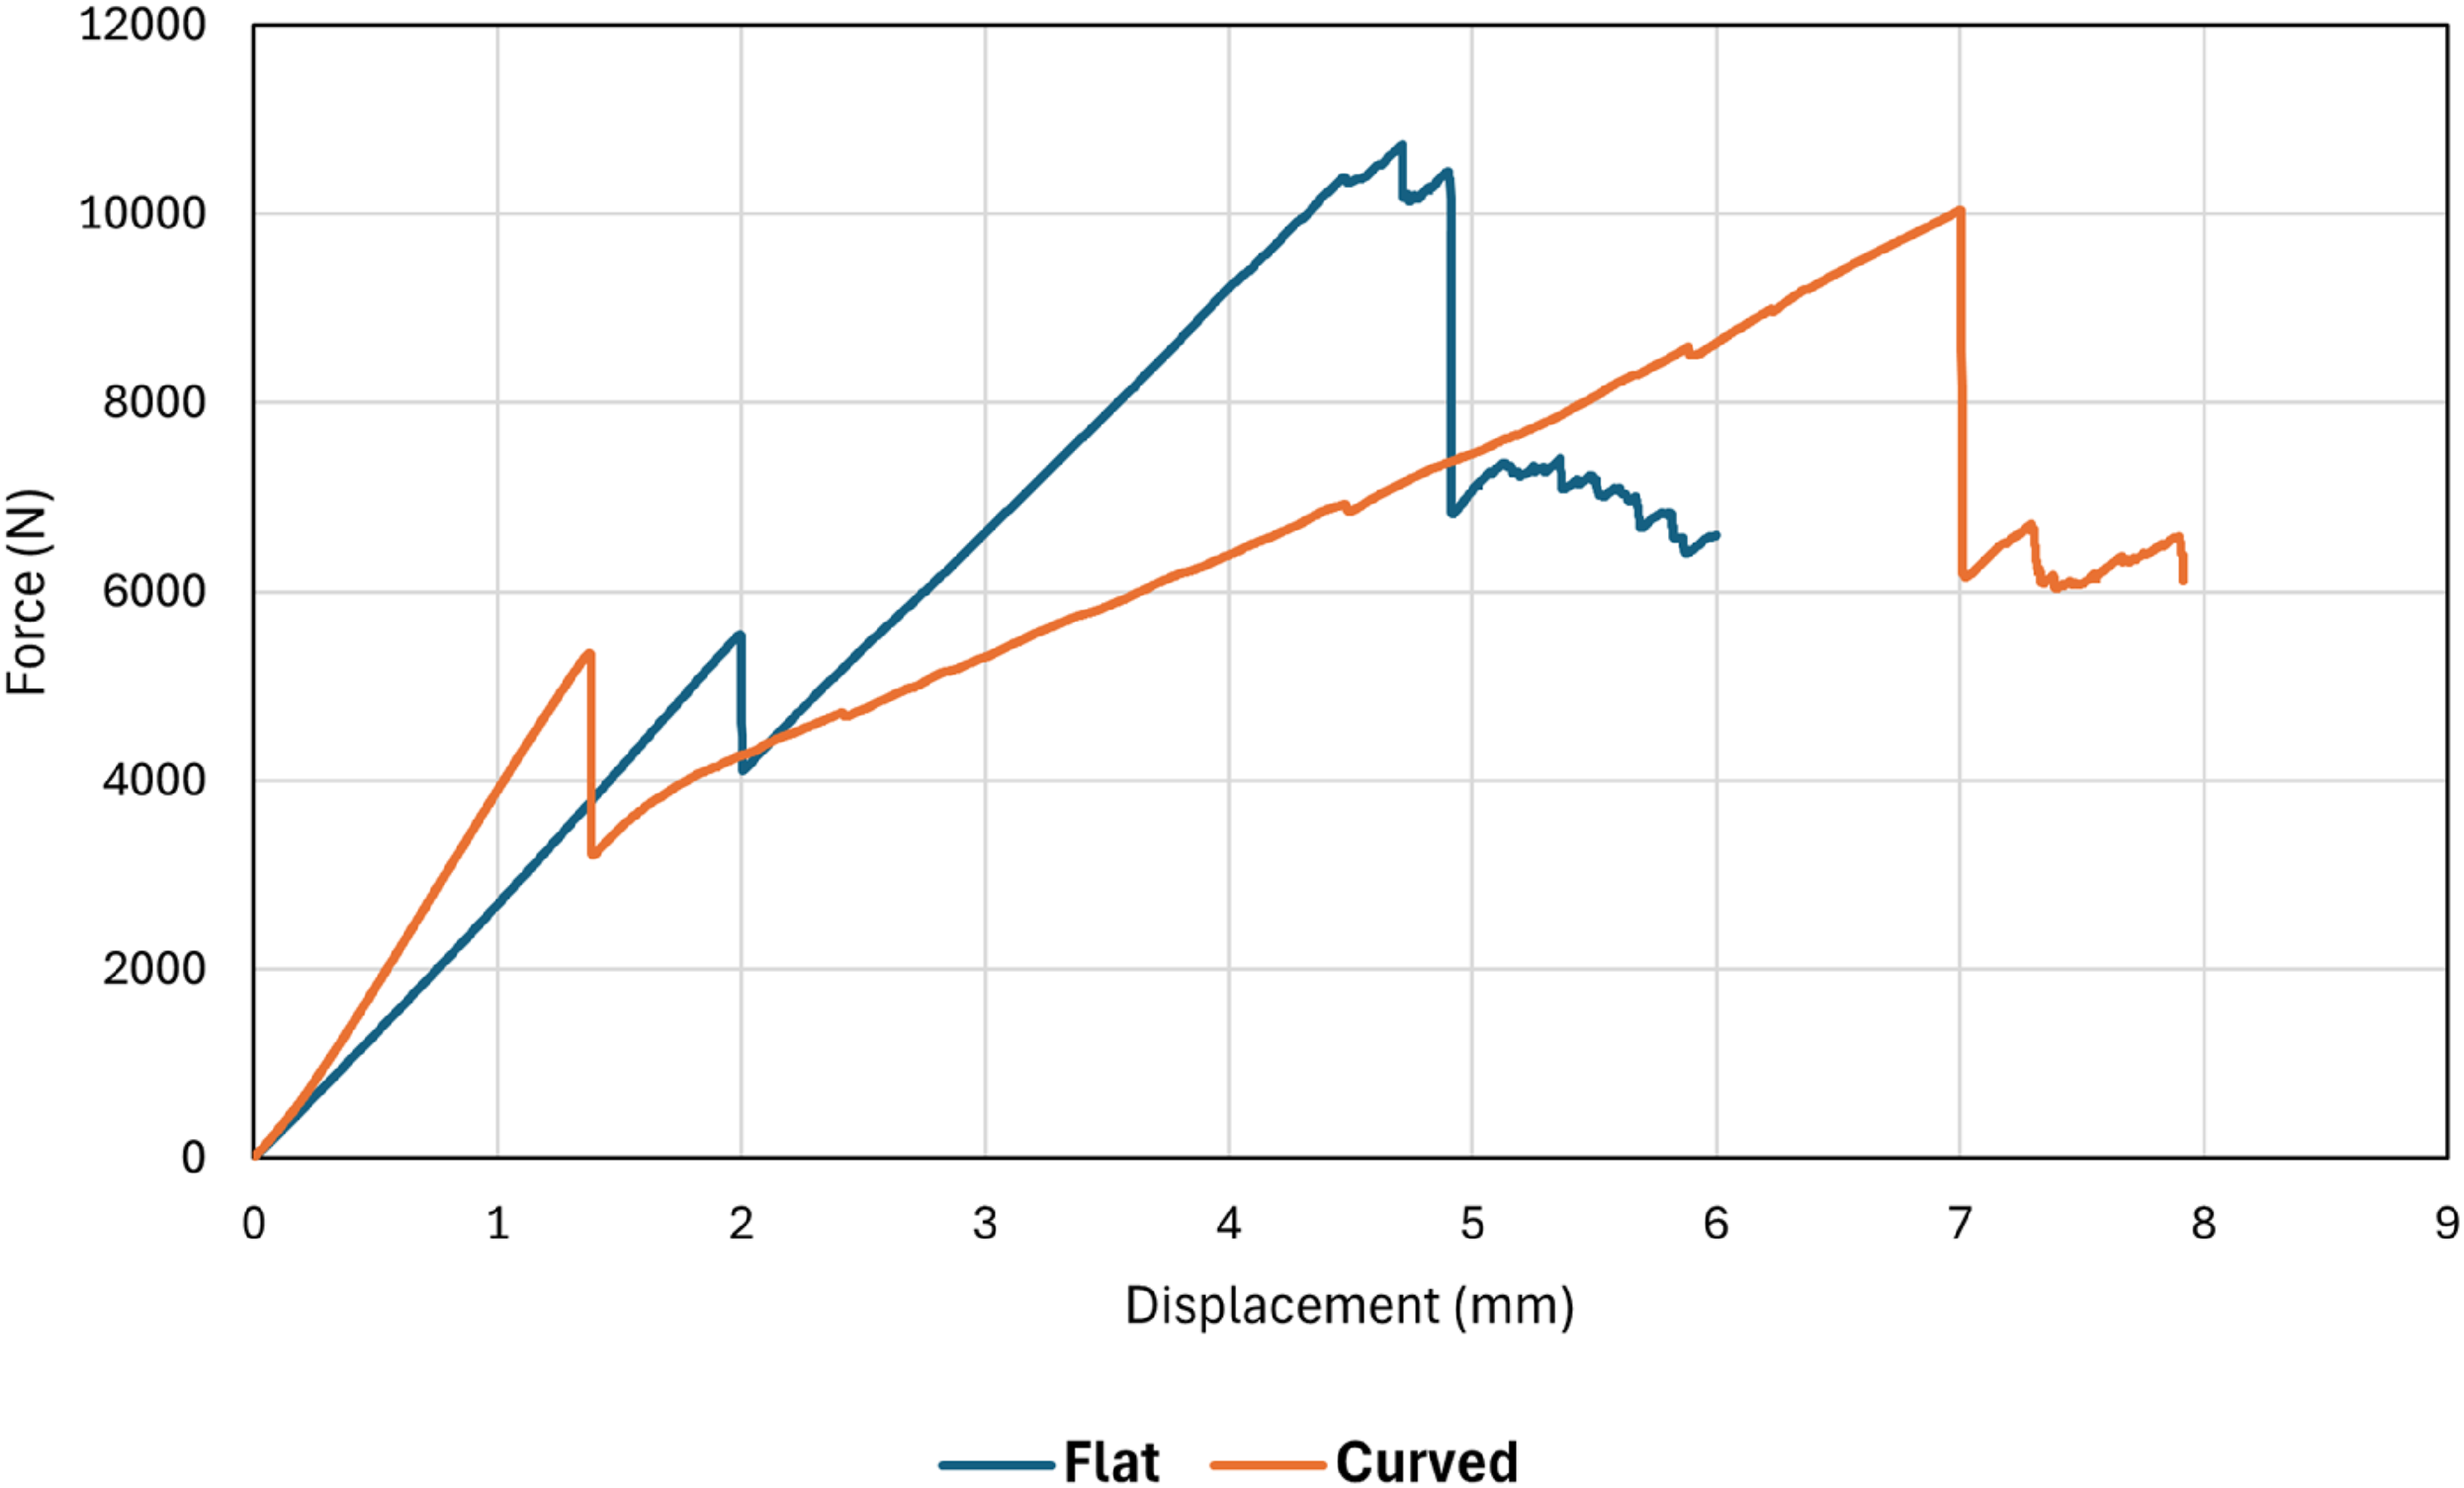
Low-velocity impact results
Global behaviour and influence of adding sensors on impact properties
The results presented in the previous section suggested a delamination threshold energy of 3.82 J under indentation. As indicated in,
32
and discussed in a previous paper,
29
the impact energy required to induce BVID in quasi-isotropic composite panels was estimated to be 40% higher than the critical energy level derived from the indentation test. Therefore, for the Sensor samples, a minimum impact energy of 6J is considered as the lowest impact energy here. Note that impact energy includes both elastic and absorbed energies (see Figure 14(c) in 29). Moreover, three higher energies, including 12J, 18J, and 27J, are considered. For the Reference samples, only 12J and 18J are tested. Figure 10 presents the force-displacement graphs of all impact tests conducted on curved samples. Low-velocity impact test results of all curved samples: (a) Reference, (b) Sensor.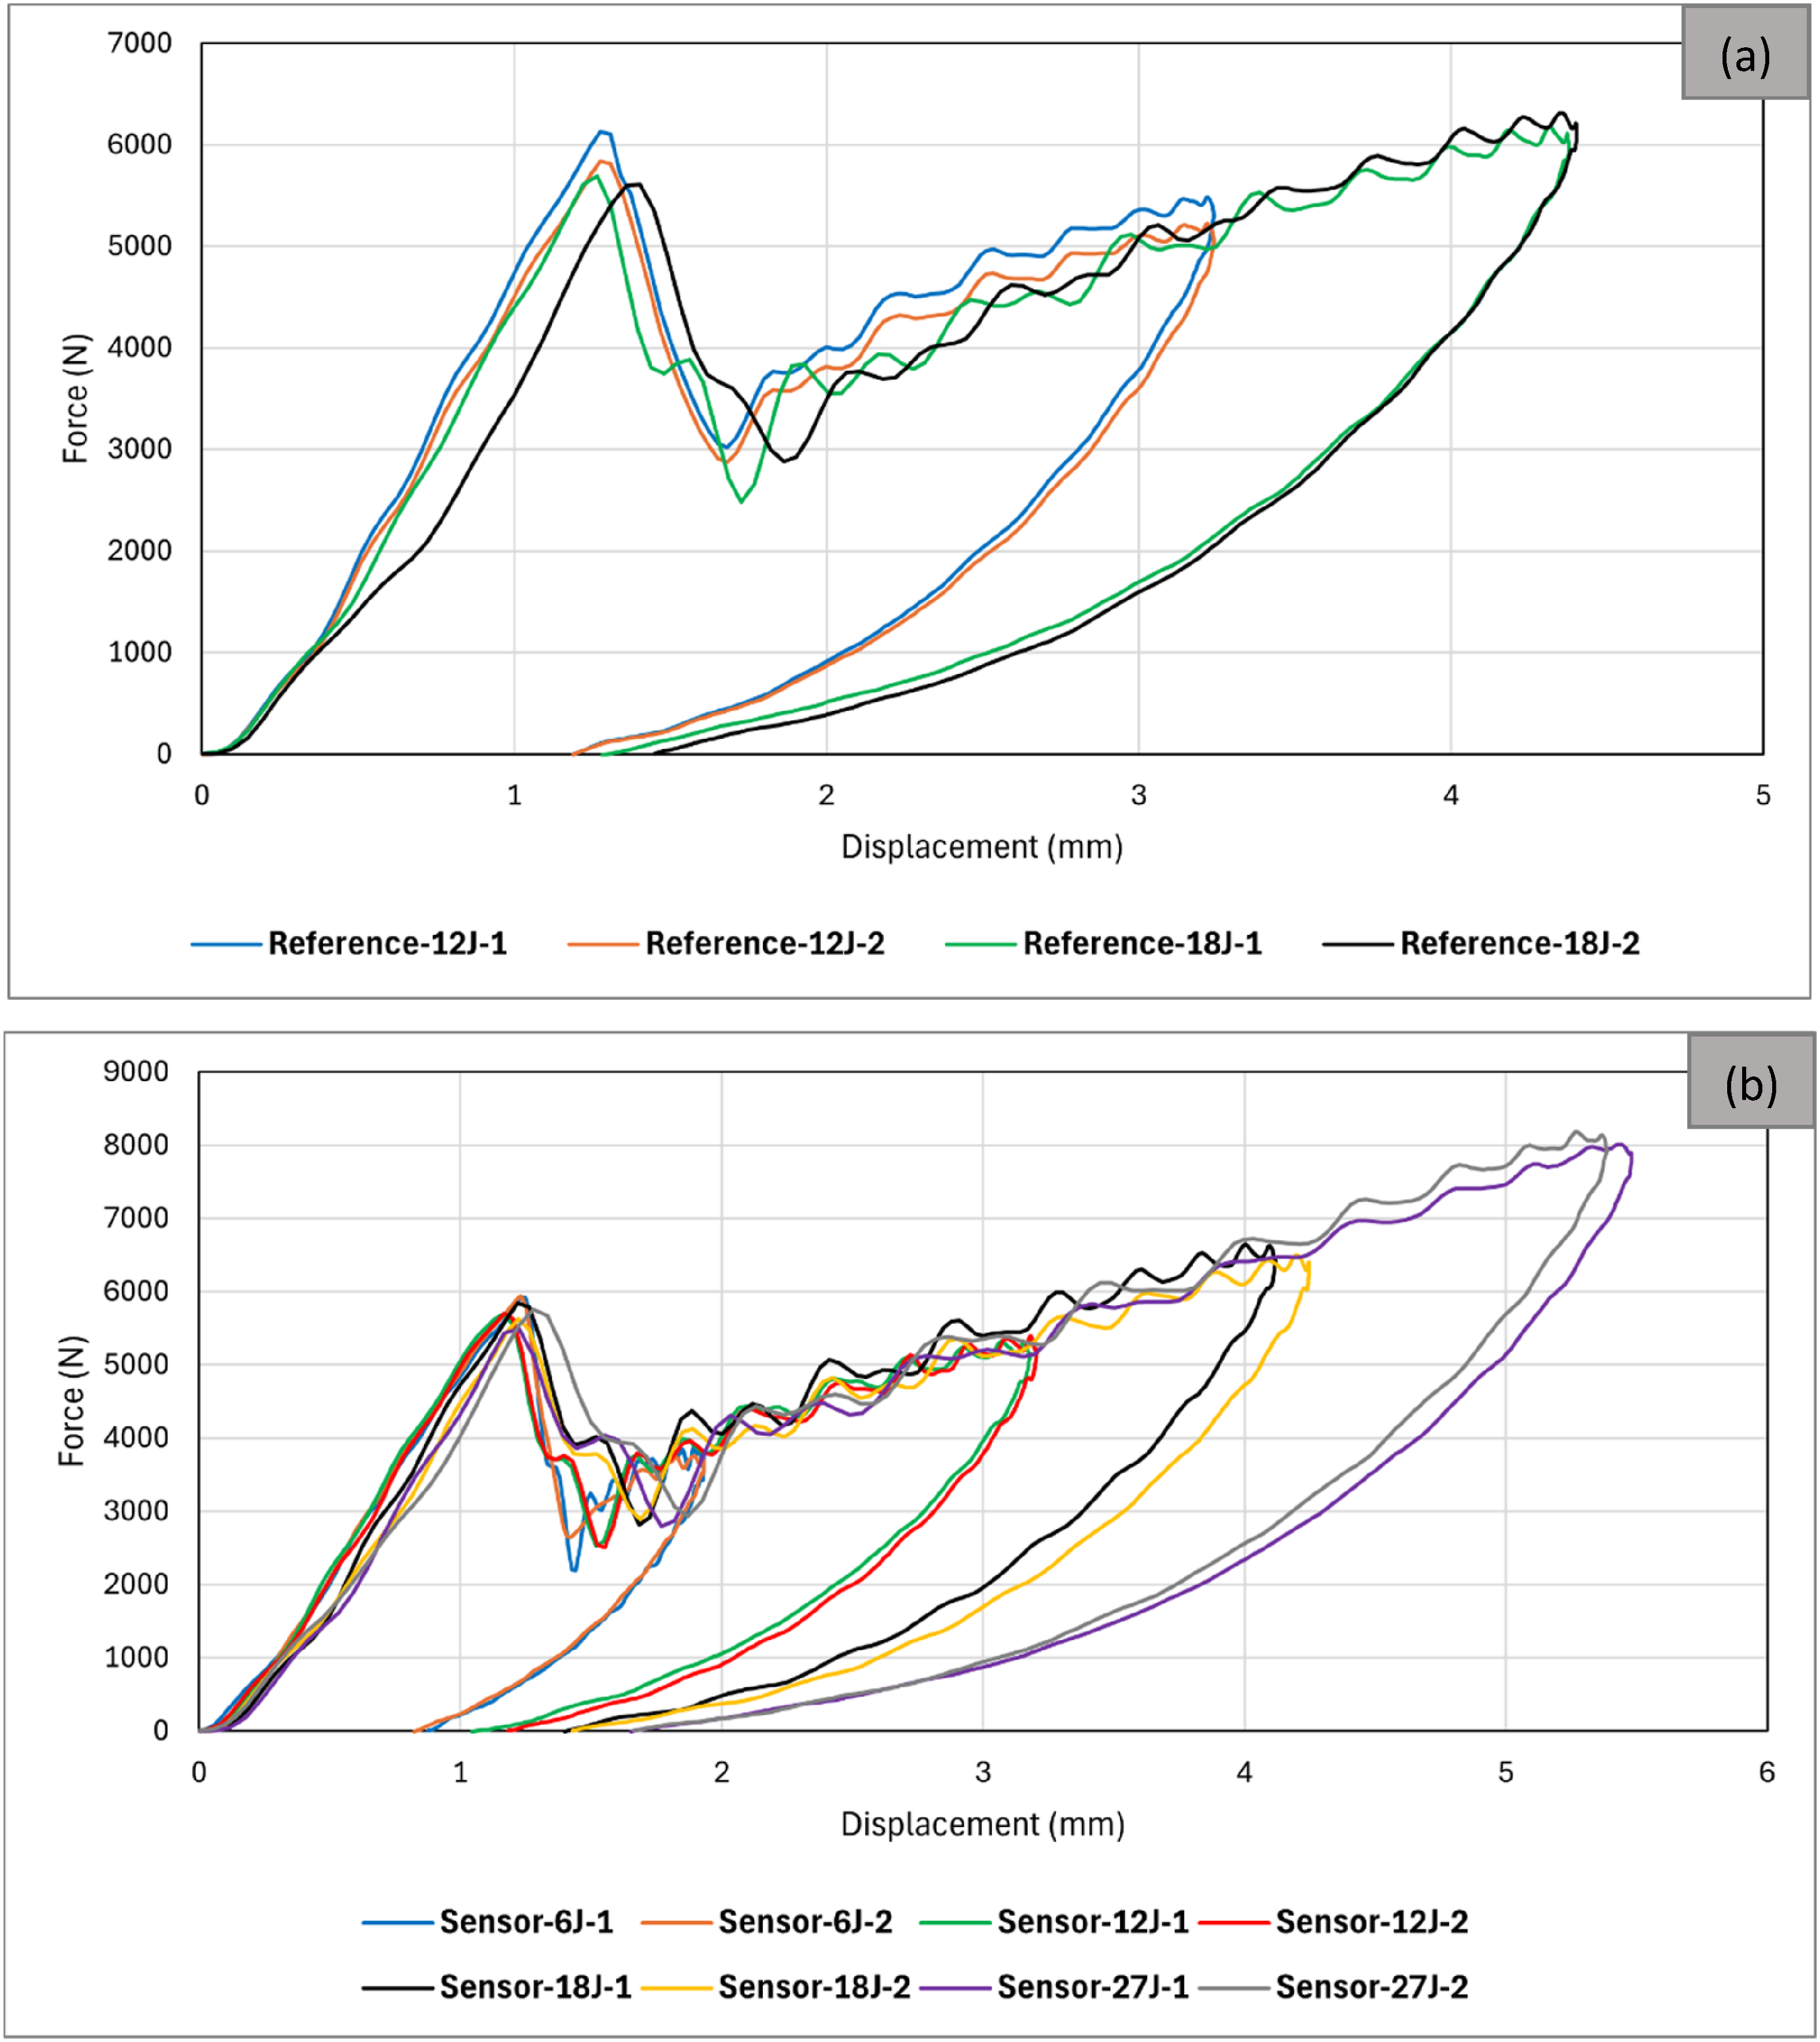
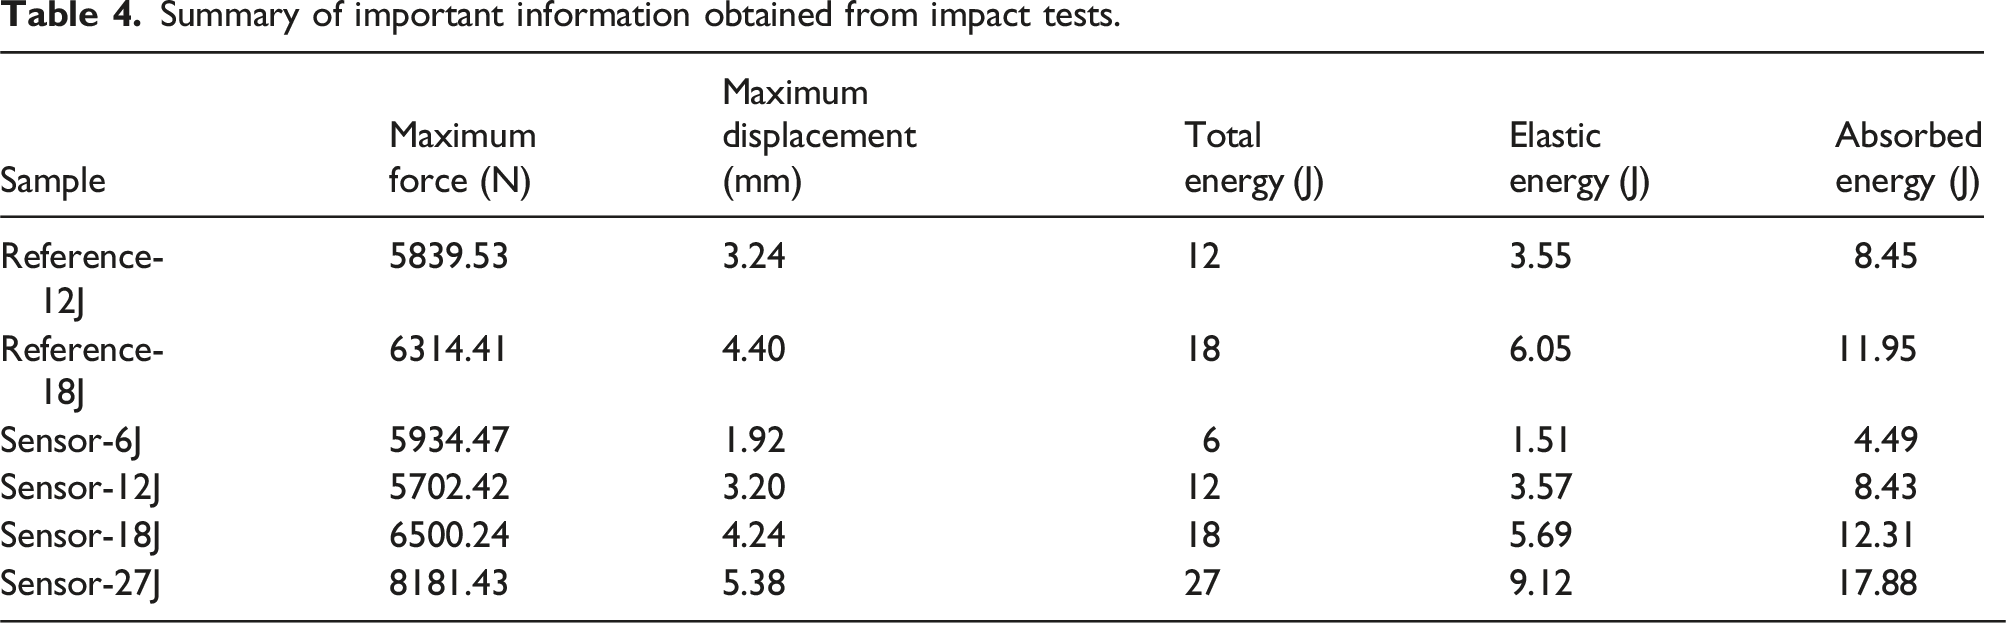
As observed in the graphs, each energy measurement demonstrates excellent repeatability, thereby confirming the accuracy of the impact test results. All graphs demonstrate a near-linear response from the beginning of the test until the force level of approximately 6000N, then show a load drop, followed by a non-linear response until the curve reaches its maximum force and displacement. The load drop confirms the occurrence of delamination. The graphs and visual inspection demonstrated that no penetration, perforation, or fibre failure happened at any of these energies. To better analyse the impact test results, Figure 11 presents a comparison of Reference and Sensor samples at two impact energies, and important information obtained from all tests is summarised in Table 4. The results signify that in both the Reference and Sensor groups, the absorbed energy and maximum displacement increase with an increase in impact energy. However, a different trend is observed for peak force (maximum force). At 6J and 12J energies, the peak force corresponds to the point where the initial near-linear behaviour ceases, marking the onset of the first load drop. In contrast, for 18J and 27J energies, the maximum force aligns with the maximum displacement, signalling the beginning of the decline in both force and displacement towards zero. Another interesting observation is that in both groups, with an increase in impact energy, the force threshold for the first load drop decreases. This was also reported for curved panels under low-velocity impact in.
20
Figure 11 shows that adding sensors slightly increases the initial structural stiffness, the maximum displacement, and the force level at the maximum displacement. Comparison of impact response in Reference and Sensor samples. Summary of important information obtained from impact tests.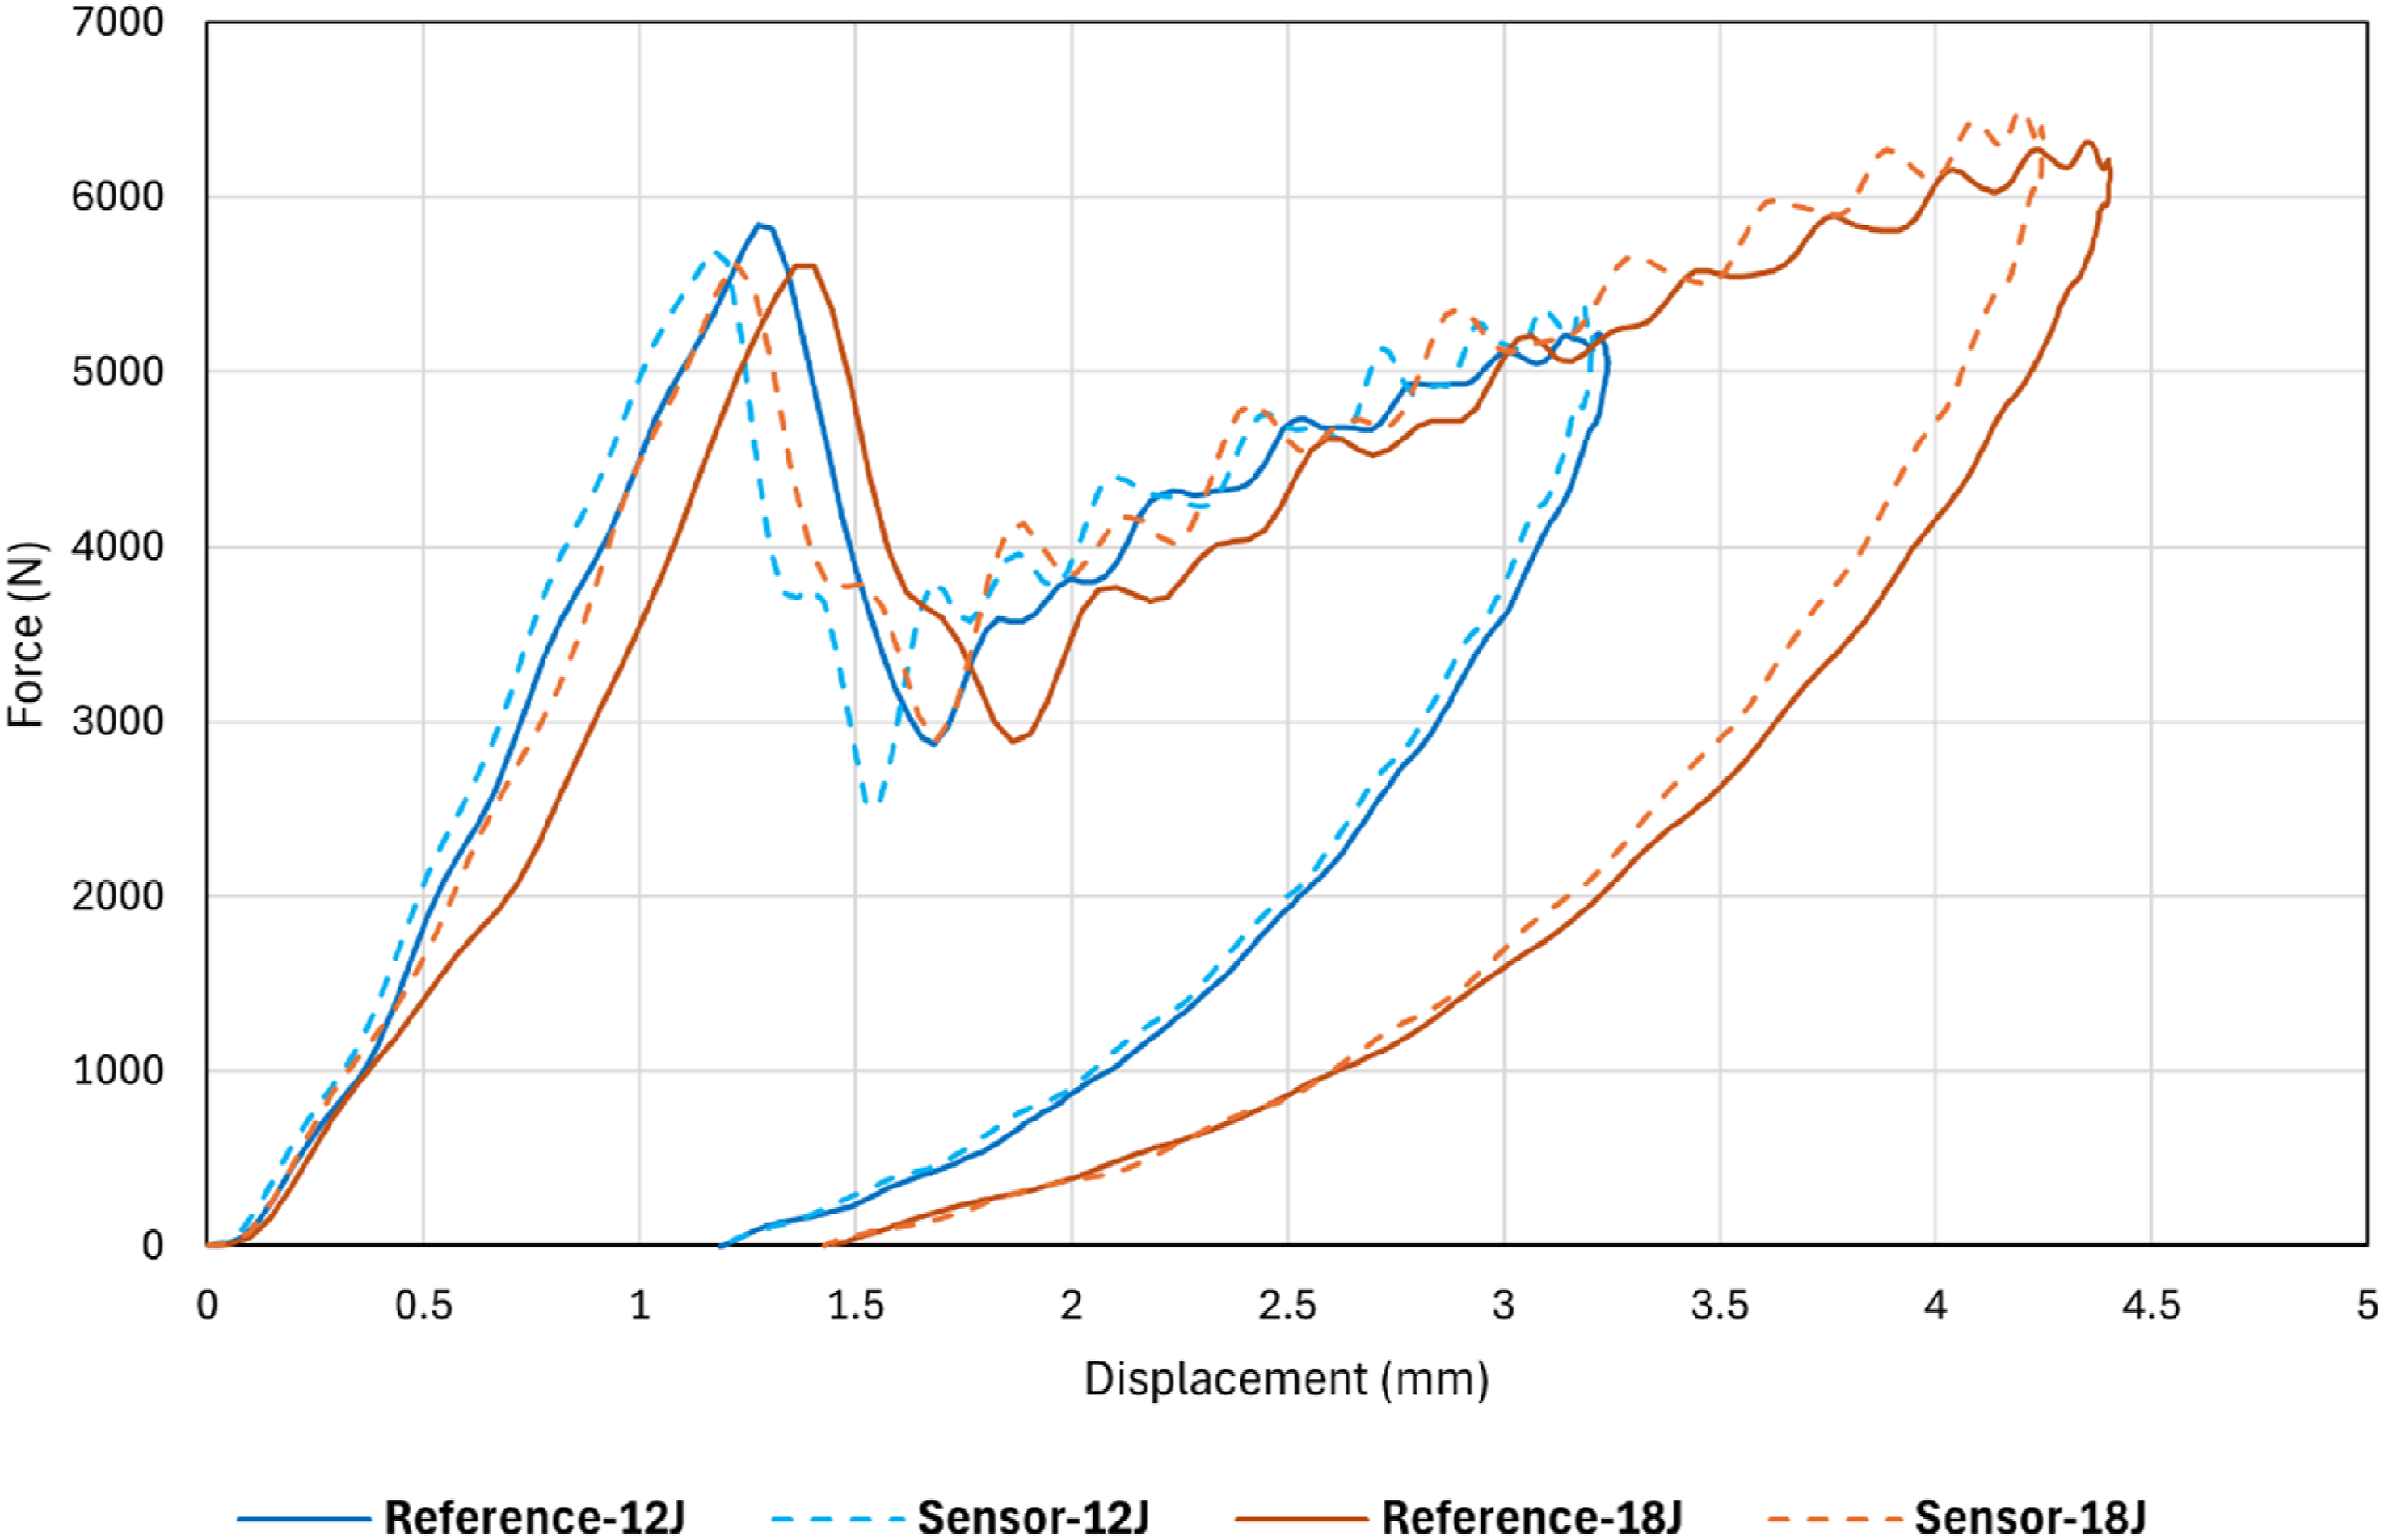
Visual inspection and microscopy images
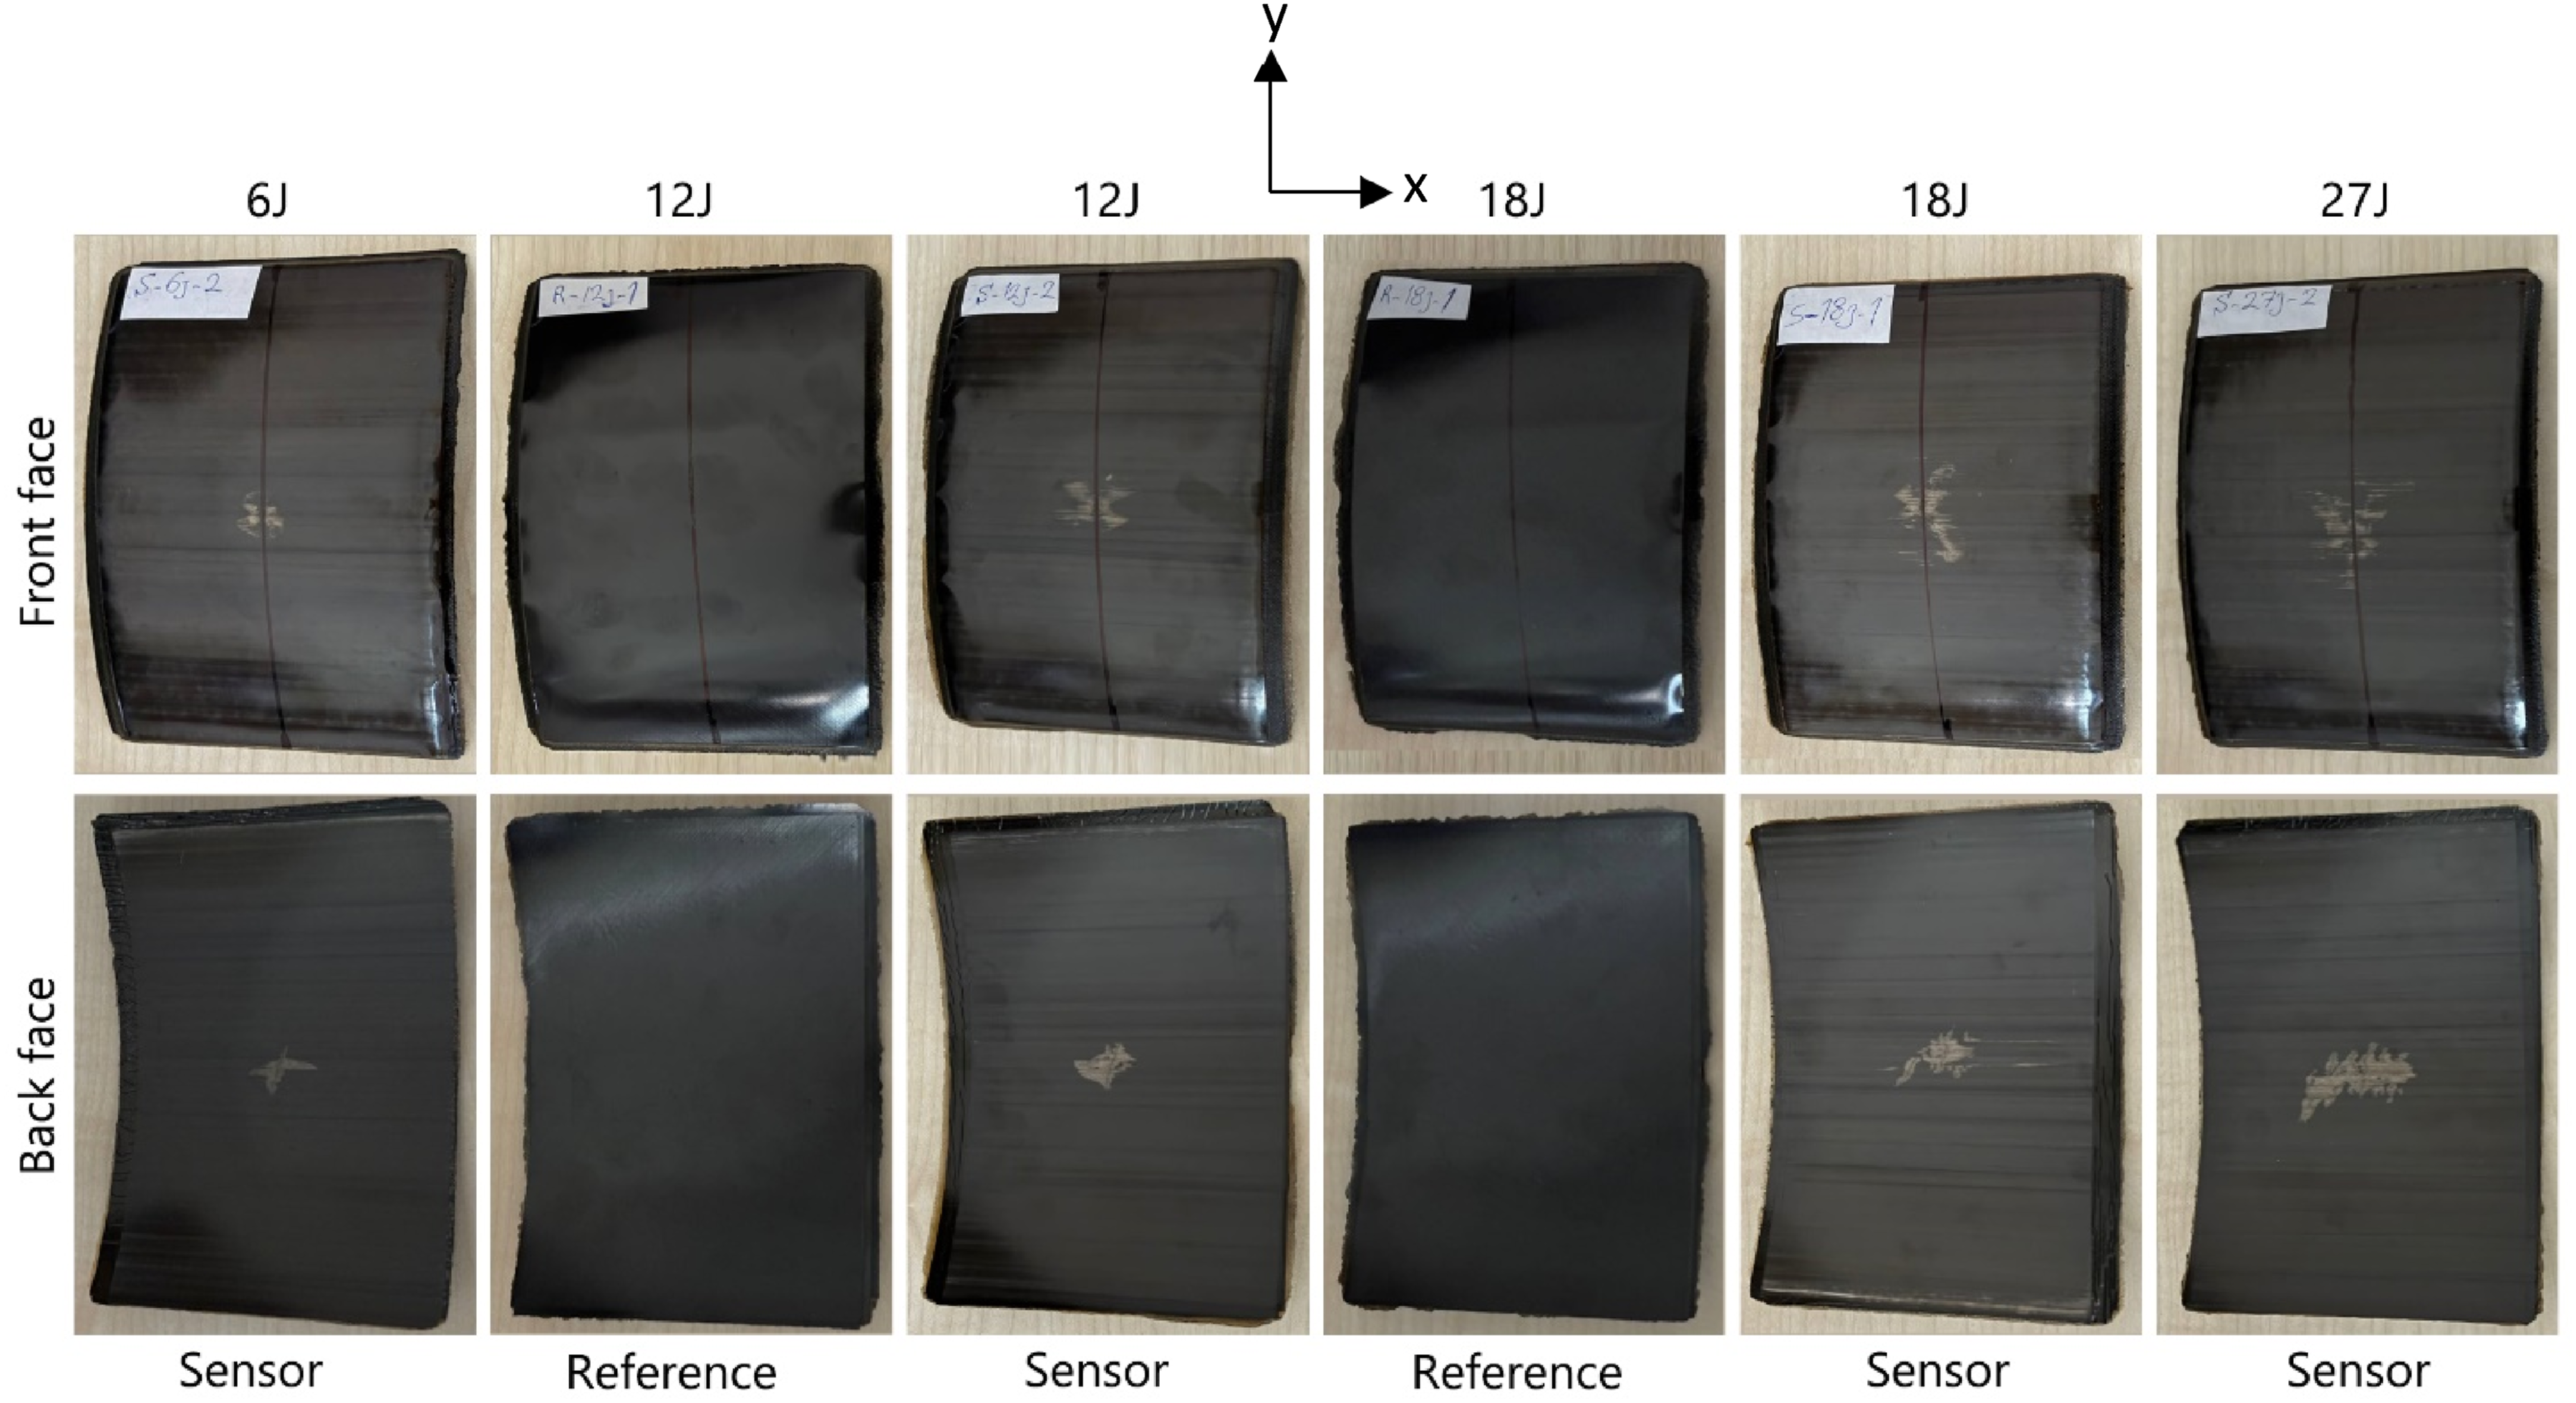
This section evaluates internal and surface damage using microscopy and visual inspection images, respectively. The microscopy images reveal internal damage, including matrix cracks and delamination within the plies, across all impact energies ranging from 6J to 27J, observed in both Reference and Sensor samples. The severity of damage increases with increasing energy levels, evident in the 27J image displaying more pronounced delaminations compared to the 6J image. Additionally, the microscopy images of Sensor samples exhibit comparatively lesser damage than Reference samples. This is attributed to the energy absorption by the fracturing of the sensor, thereby reducing the damage experienced by the substrate. This highlights the load-bearing capabilities of the sensor for applications requiring impact resistance (see Figure 12). However, the results of visual inspection reveal that damage at both 12J and 18J is not visibly apparent in Reference samples. In contrast, for Sensor samples, damage becomes visible even at lower energies, such as 6J. A clear correlation emerges between the area activated by the sensor and the impact energy, with the surface damage pattern increasing alongside energy increases. Comparing flat and curved samples, the damage pattern on the front face appears similar. Yet, on the back face, in curved panels, the damage pattern tends to extend horizontally (x direction) with increasing impact energy, unlike flat samples where it spreads in both directions.29,32 This may be attributed to the curved shape of the former (see Figure 13). Overall, the findings of this section suggest that hybrid sensors are capable of detecting BVID both on front face and back face of curved panels. Microscopy images demonstrating different internal damage types, such as shear matrix cracks and delamination at various impact energies: (a) Reference-18J, (b) Sensor-6J, (c) Sensor-27J (all images cover a length of approximately 200 mm). Visual inspection results of impacted Reference and Sensor samples at various energies.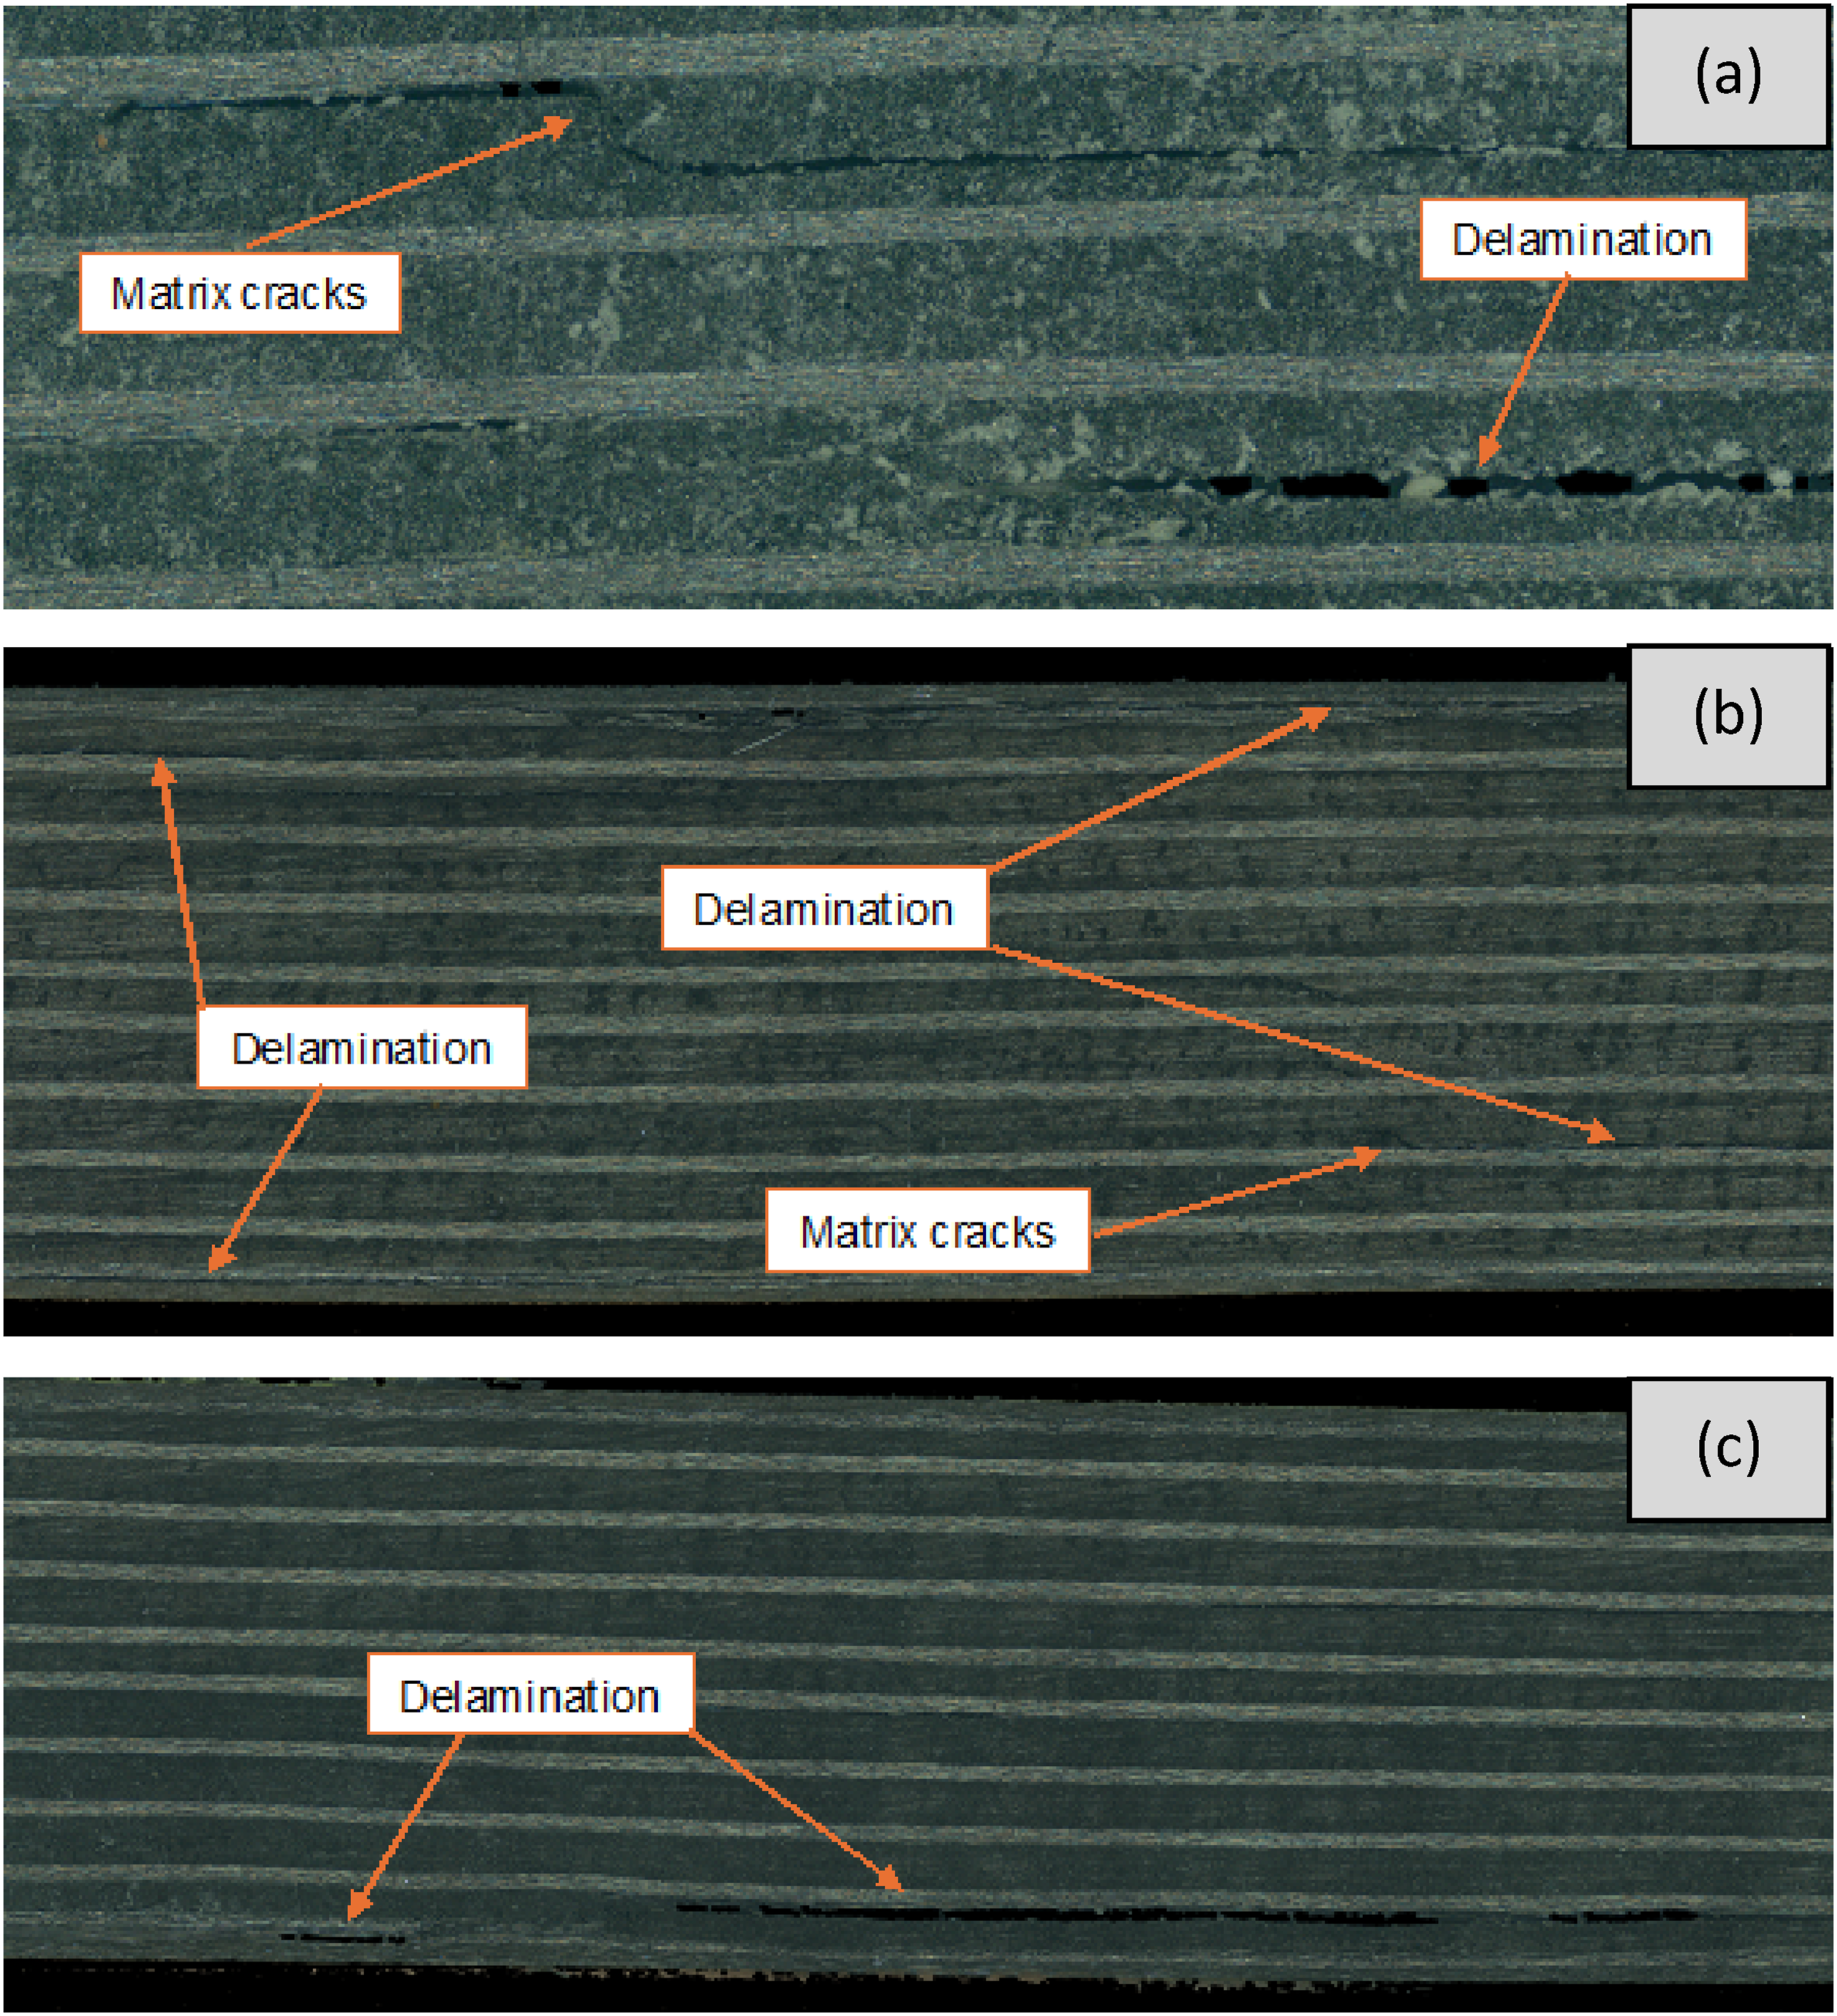
Comparison of impact behaviour in curved and flat composite structures
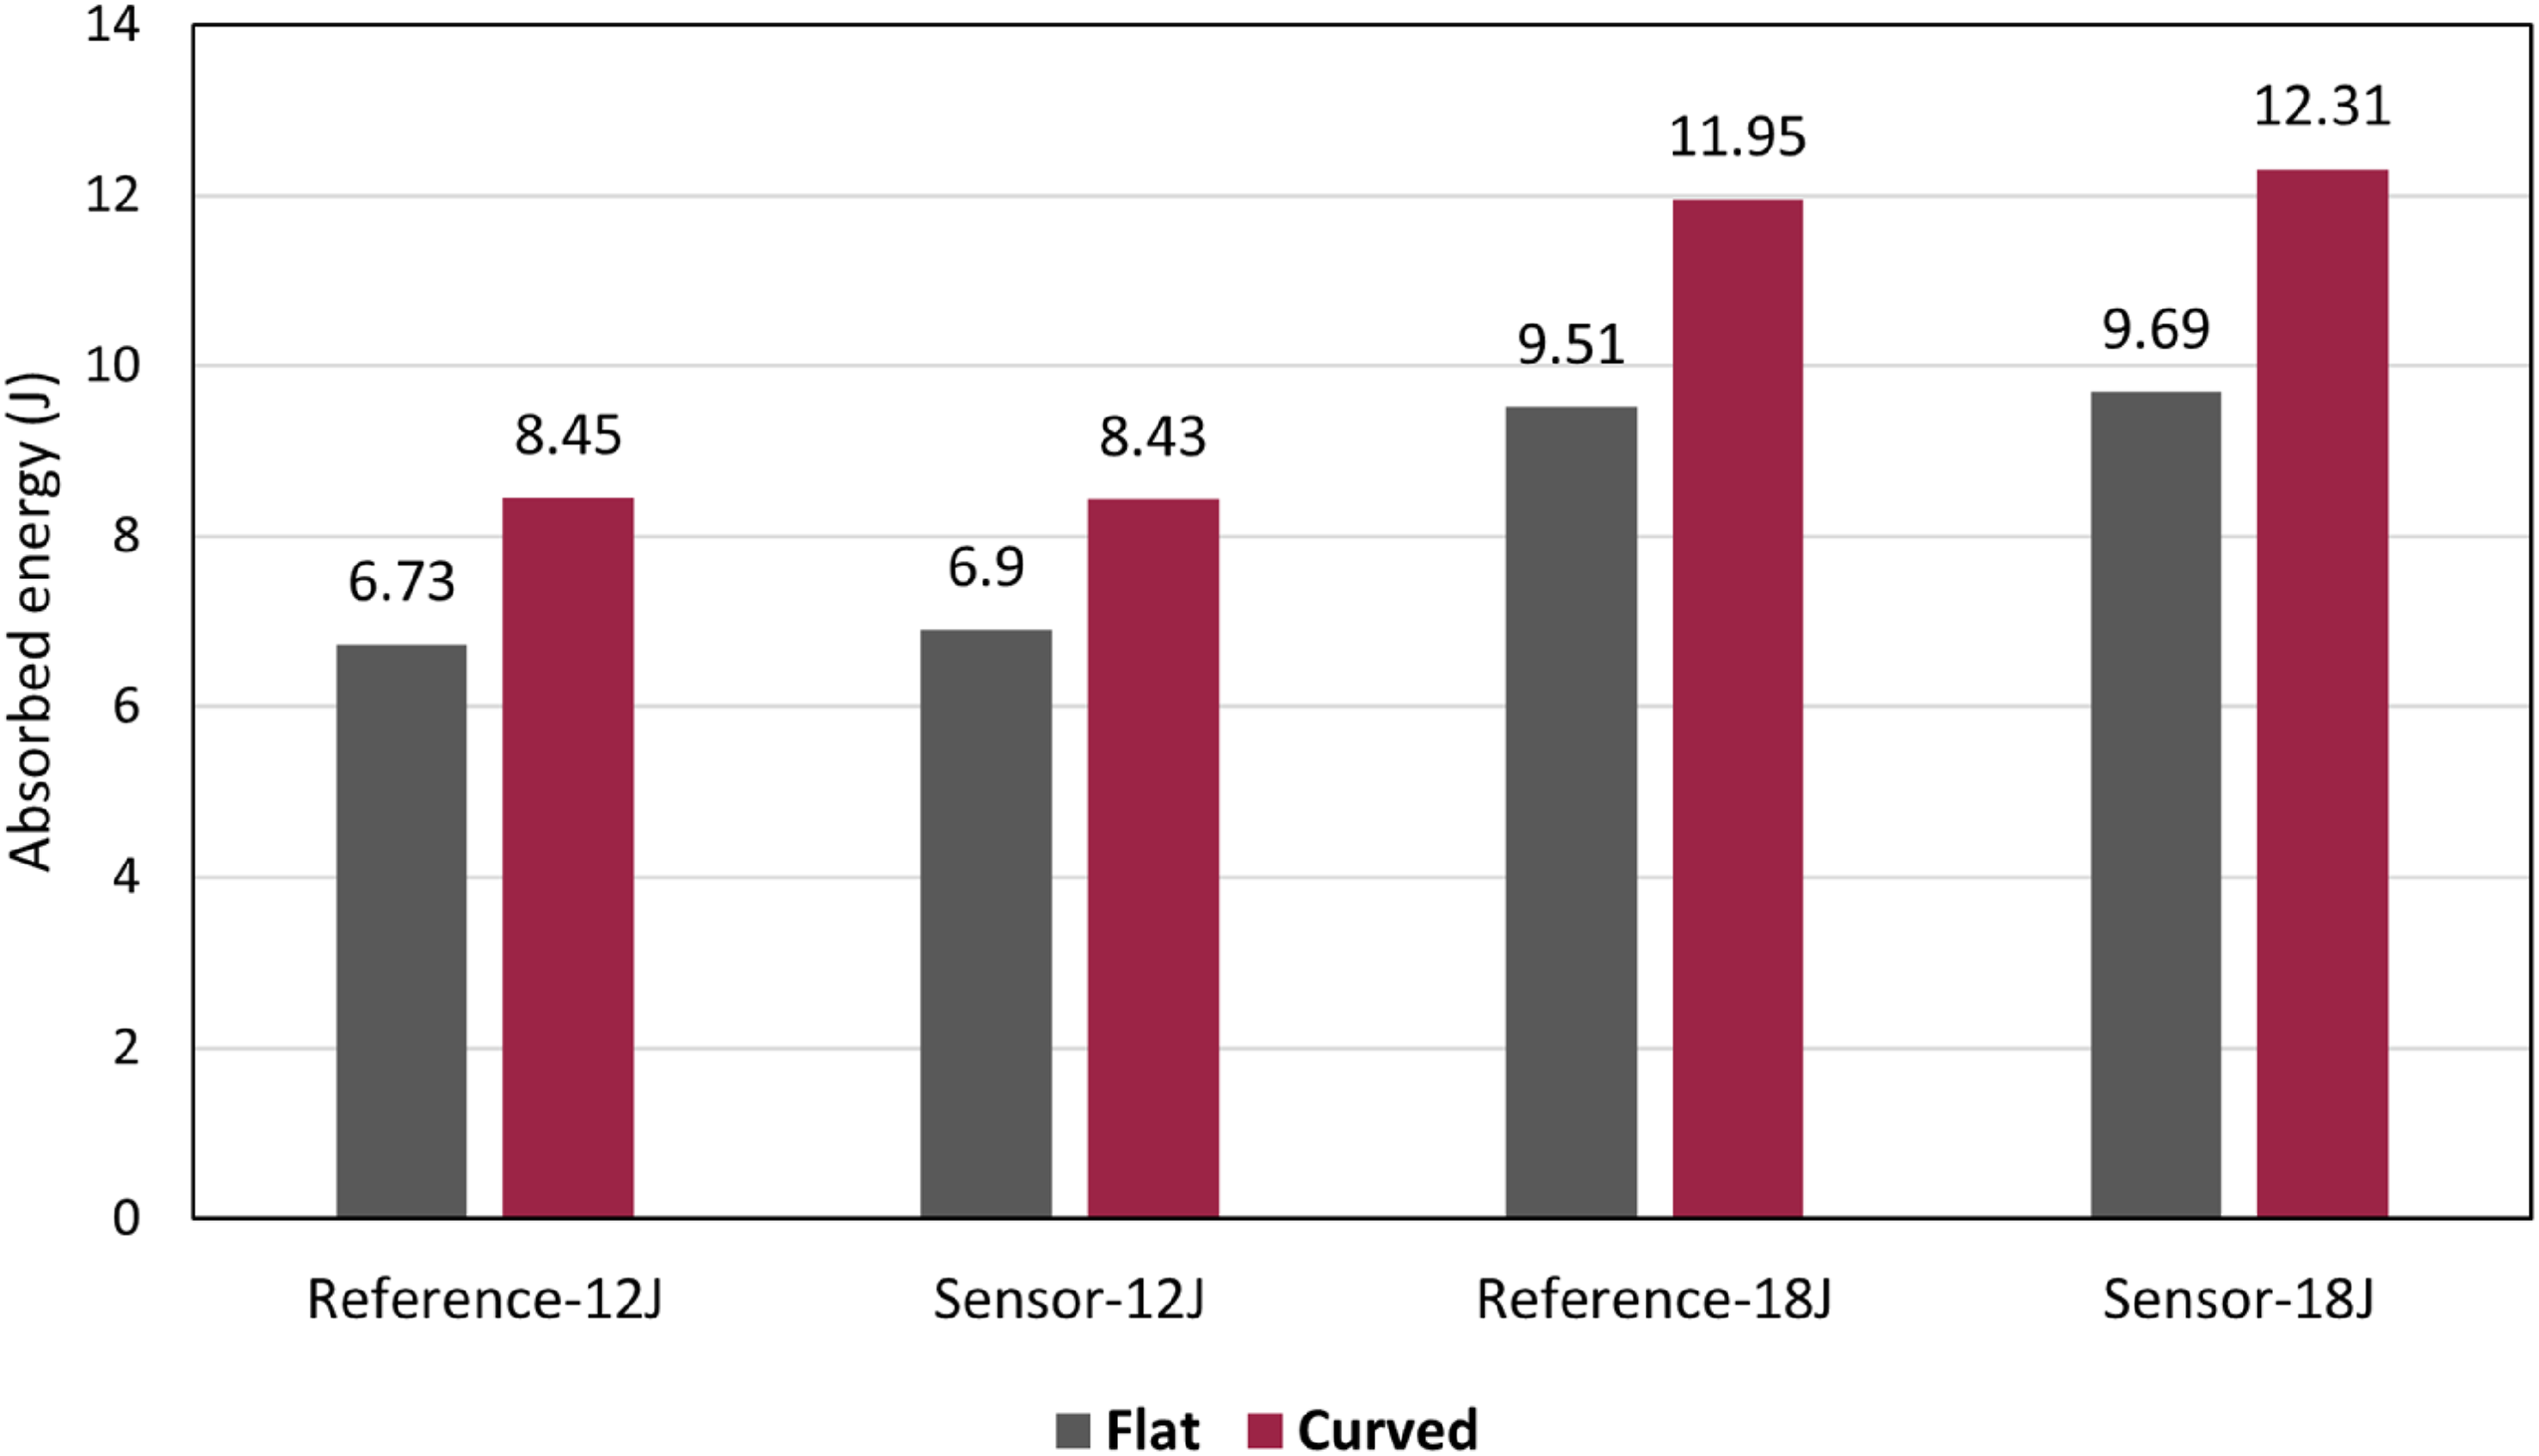
A comparison between the impact response of flat and curved samples for both Reference and Sensor samples at two different impact energies (12J and 18J) is presented in this section. Figure 14 represents the force-displacement graphs. A comparison of the energy absorption between the flat and curved samples at different energies and across both Reference and Sensor groups is depicted in Figure 15. It is seen in all graphs of Figure 14 that the initial structural stiffness of the curved samples (the stiffness before the first load drop) is higher than that of the flat samples. Moreover, the level of the load drop is more significant in curved samples than in flat samples in all graphs. This was observed when comparing the indentation test results of flat and curved samples, too. Another interesting point highlighted by the graphs here is that the maximum displacement of the flat and curved samples is always close to each other, while the maximum force of the flat samples is always higher than that of the curved samples, and this difference becomes more significant at a higher impact energy of 18J compared to 12J. Interestingly, however, the absorbed energy calculation results show higher absorbed energy in curved structures than in flat structures across all sample groups and energies (Figure 15). This is because of the more rigid (stiff) nature of the curved samples, specifically before the first load drop, due to their curved shape. Similar results on the comparison of energy absorption in flat and curved composite panels were reported by reference 23. Comparison of low-velocity impact responses: (a) Reference samples, (b) Sensor samples. Comparison of absorbed energies during low-velocity impact tests of flat and curved samples.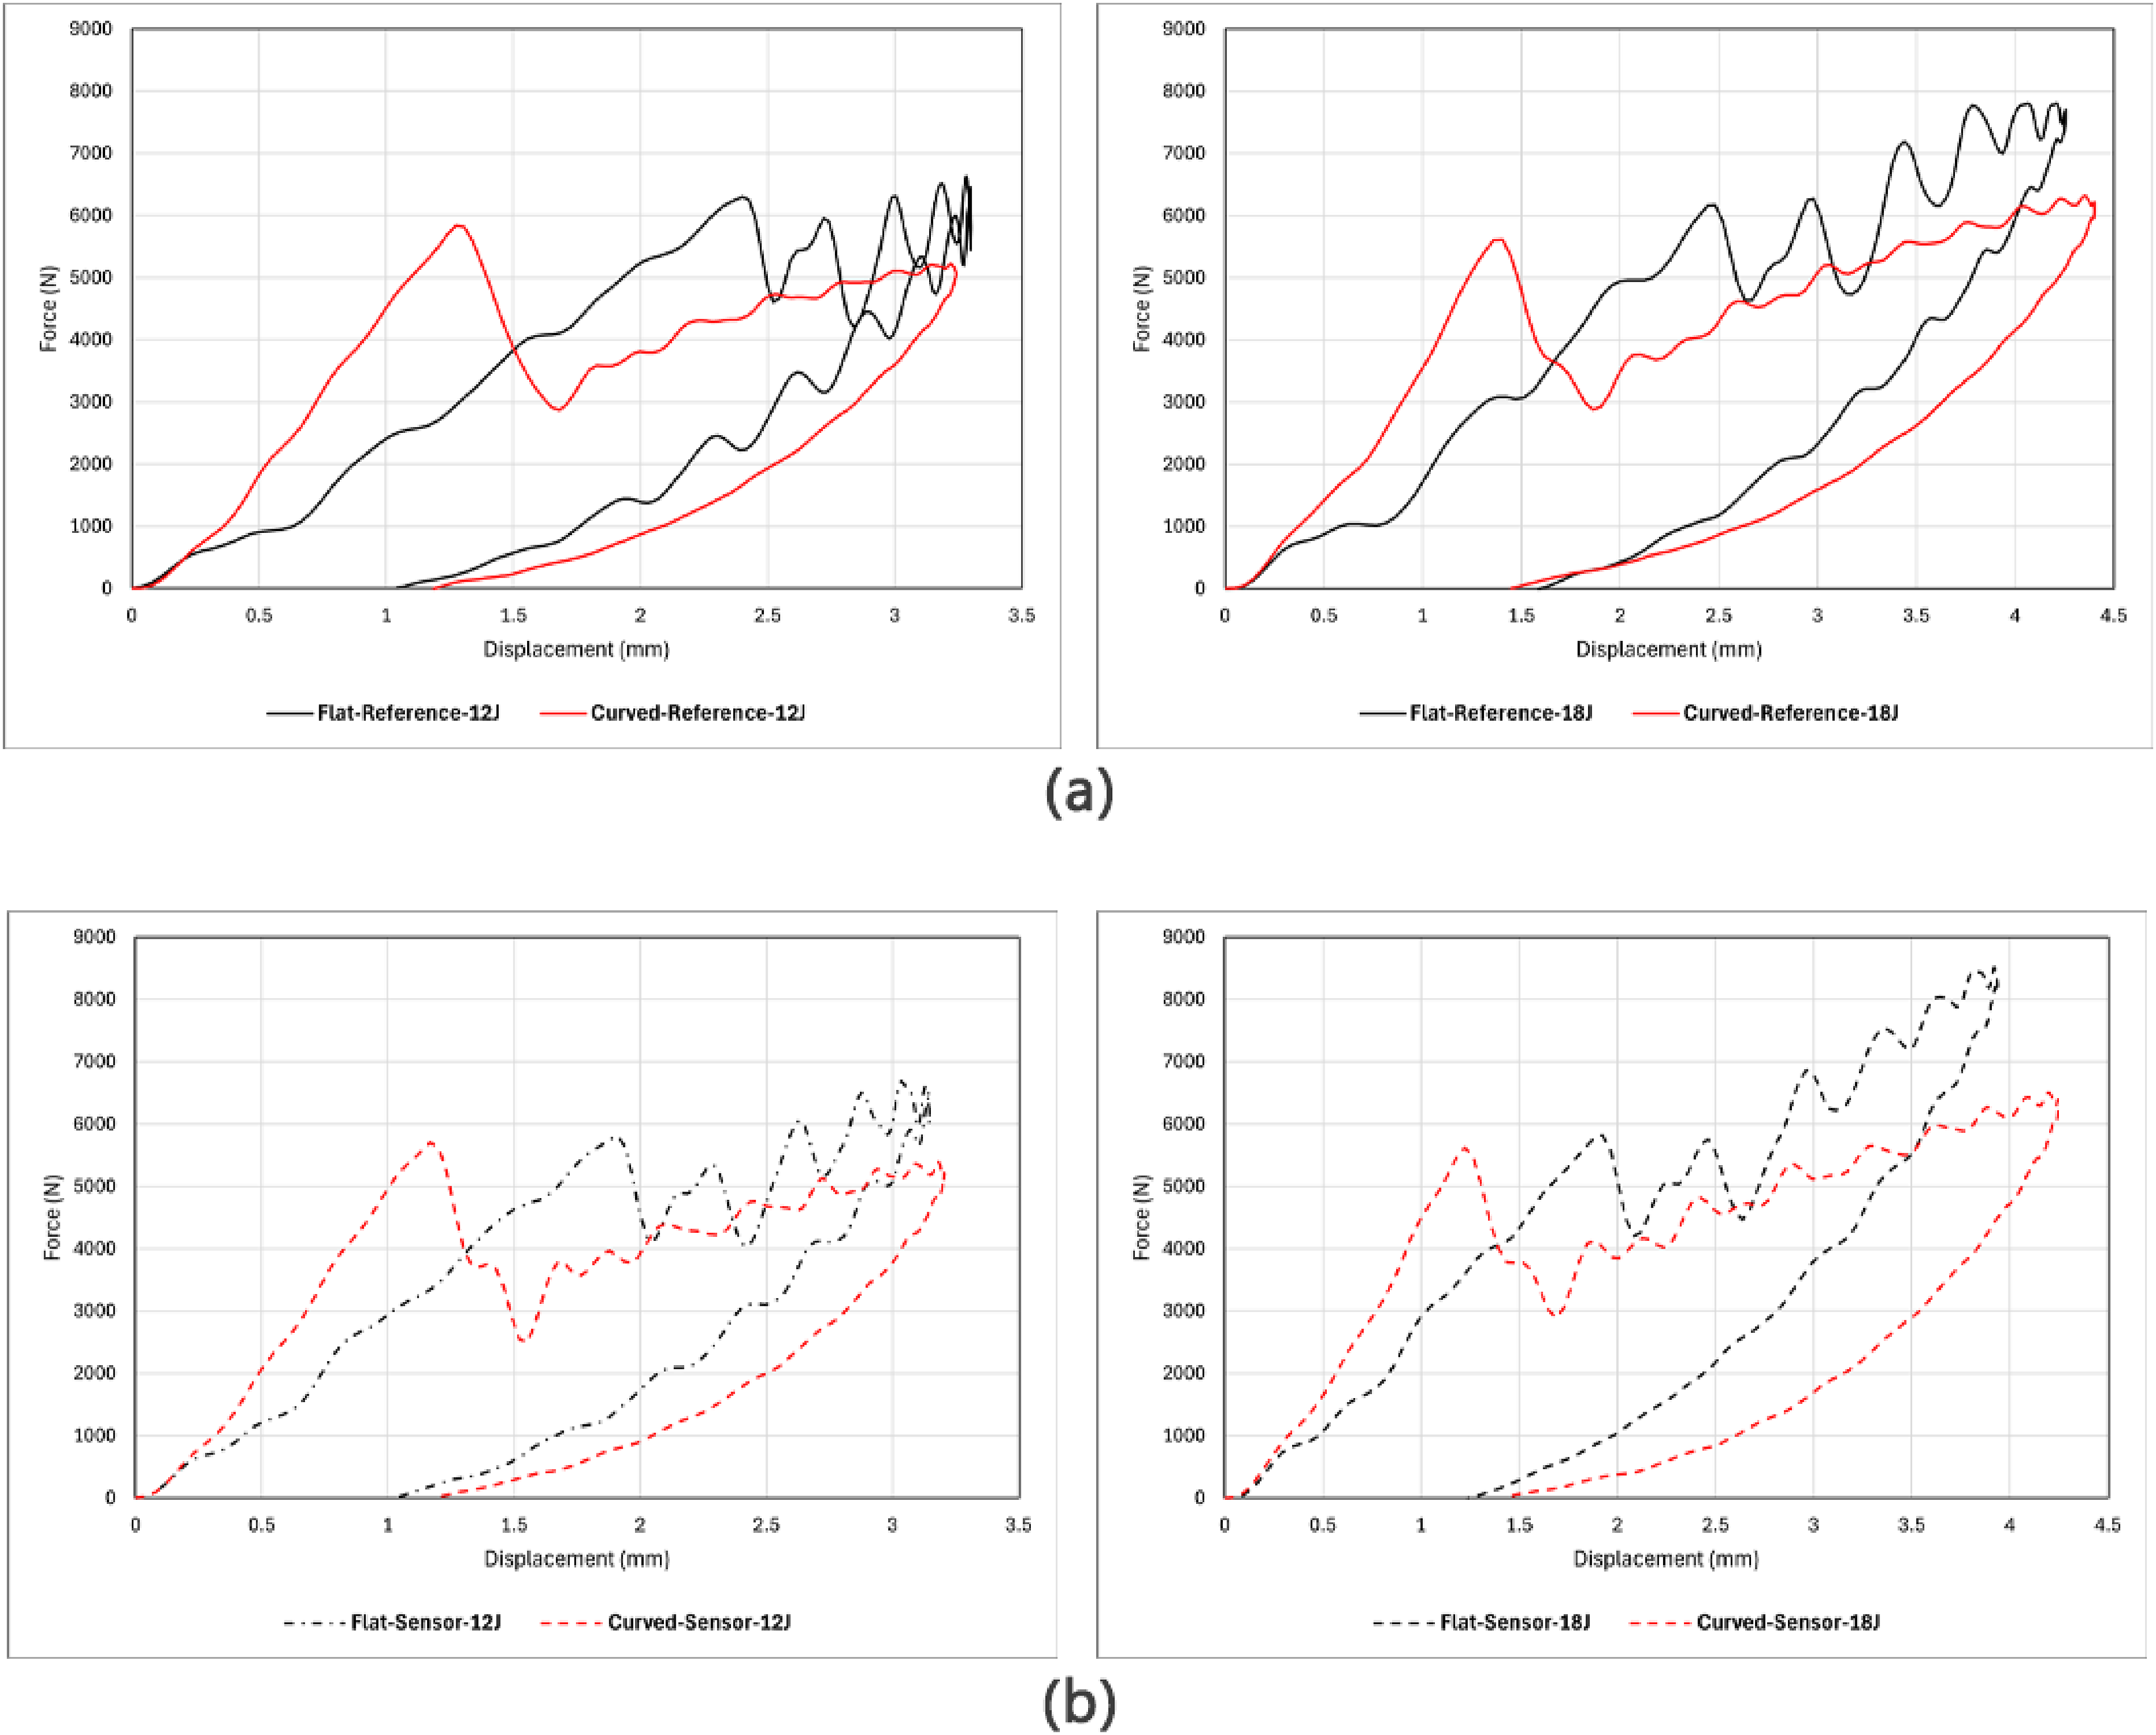
Comparison of low-velocity impact and quasi-static indentation (in curved composite structures)
A meaningful correlation between the results of the static indentation and low-velocity impact responses of flat composite laminates with quasi-isotropic lay-up was presented in.
29
The findings indicated that the critical delamination load identified through the low-velocity impact test surpasses that determined by the static indentation test by approximately 15% to 30%. Here, two distinct graphs are presented, where one graph compares the two tests within the Reference samples (Figure 16(a)), while the other graph does so within the Sensor samples (Figure 16(b)). Both graphs show a similar initial structural stiffness for the indentation and impact tests. Similar to the results obtained for the flat samples, the critical delamination load (first load drop) attained through the low-velocity impact test surpasses that of the static indentation test. However, the disparity is minimal. In the case of Reference samples, the discrepancy between the critical delamination load of the static indentation test and an average of the low-velocity impact tests at different energies is merely 7%, while in Sensor samples, it stands at a mere 5%. The comparison results presented here suggest that estimating the impact critical delamination load based on the indentation tests appears to be a valid approach for curved FRP composite samples with quasi-isotropic lay-up. Comparison of quasi-static indentation and low-velocity impact responses in curved composite structures: (a) Reference samples, (b) Sensor samples.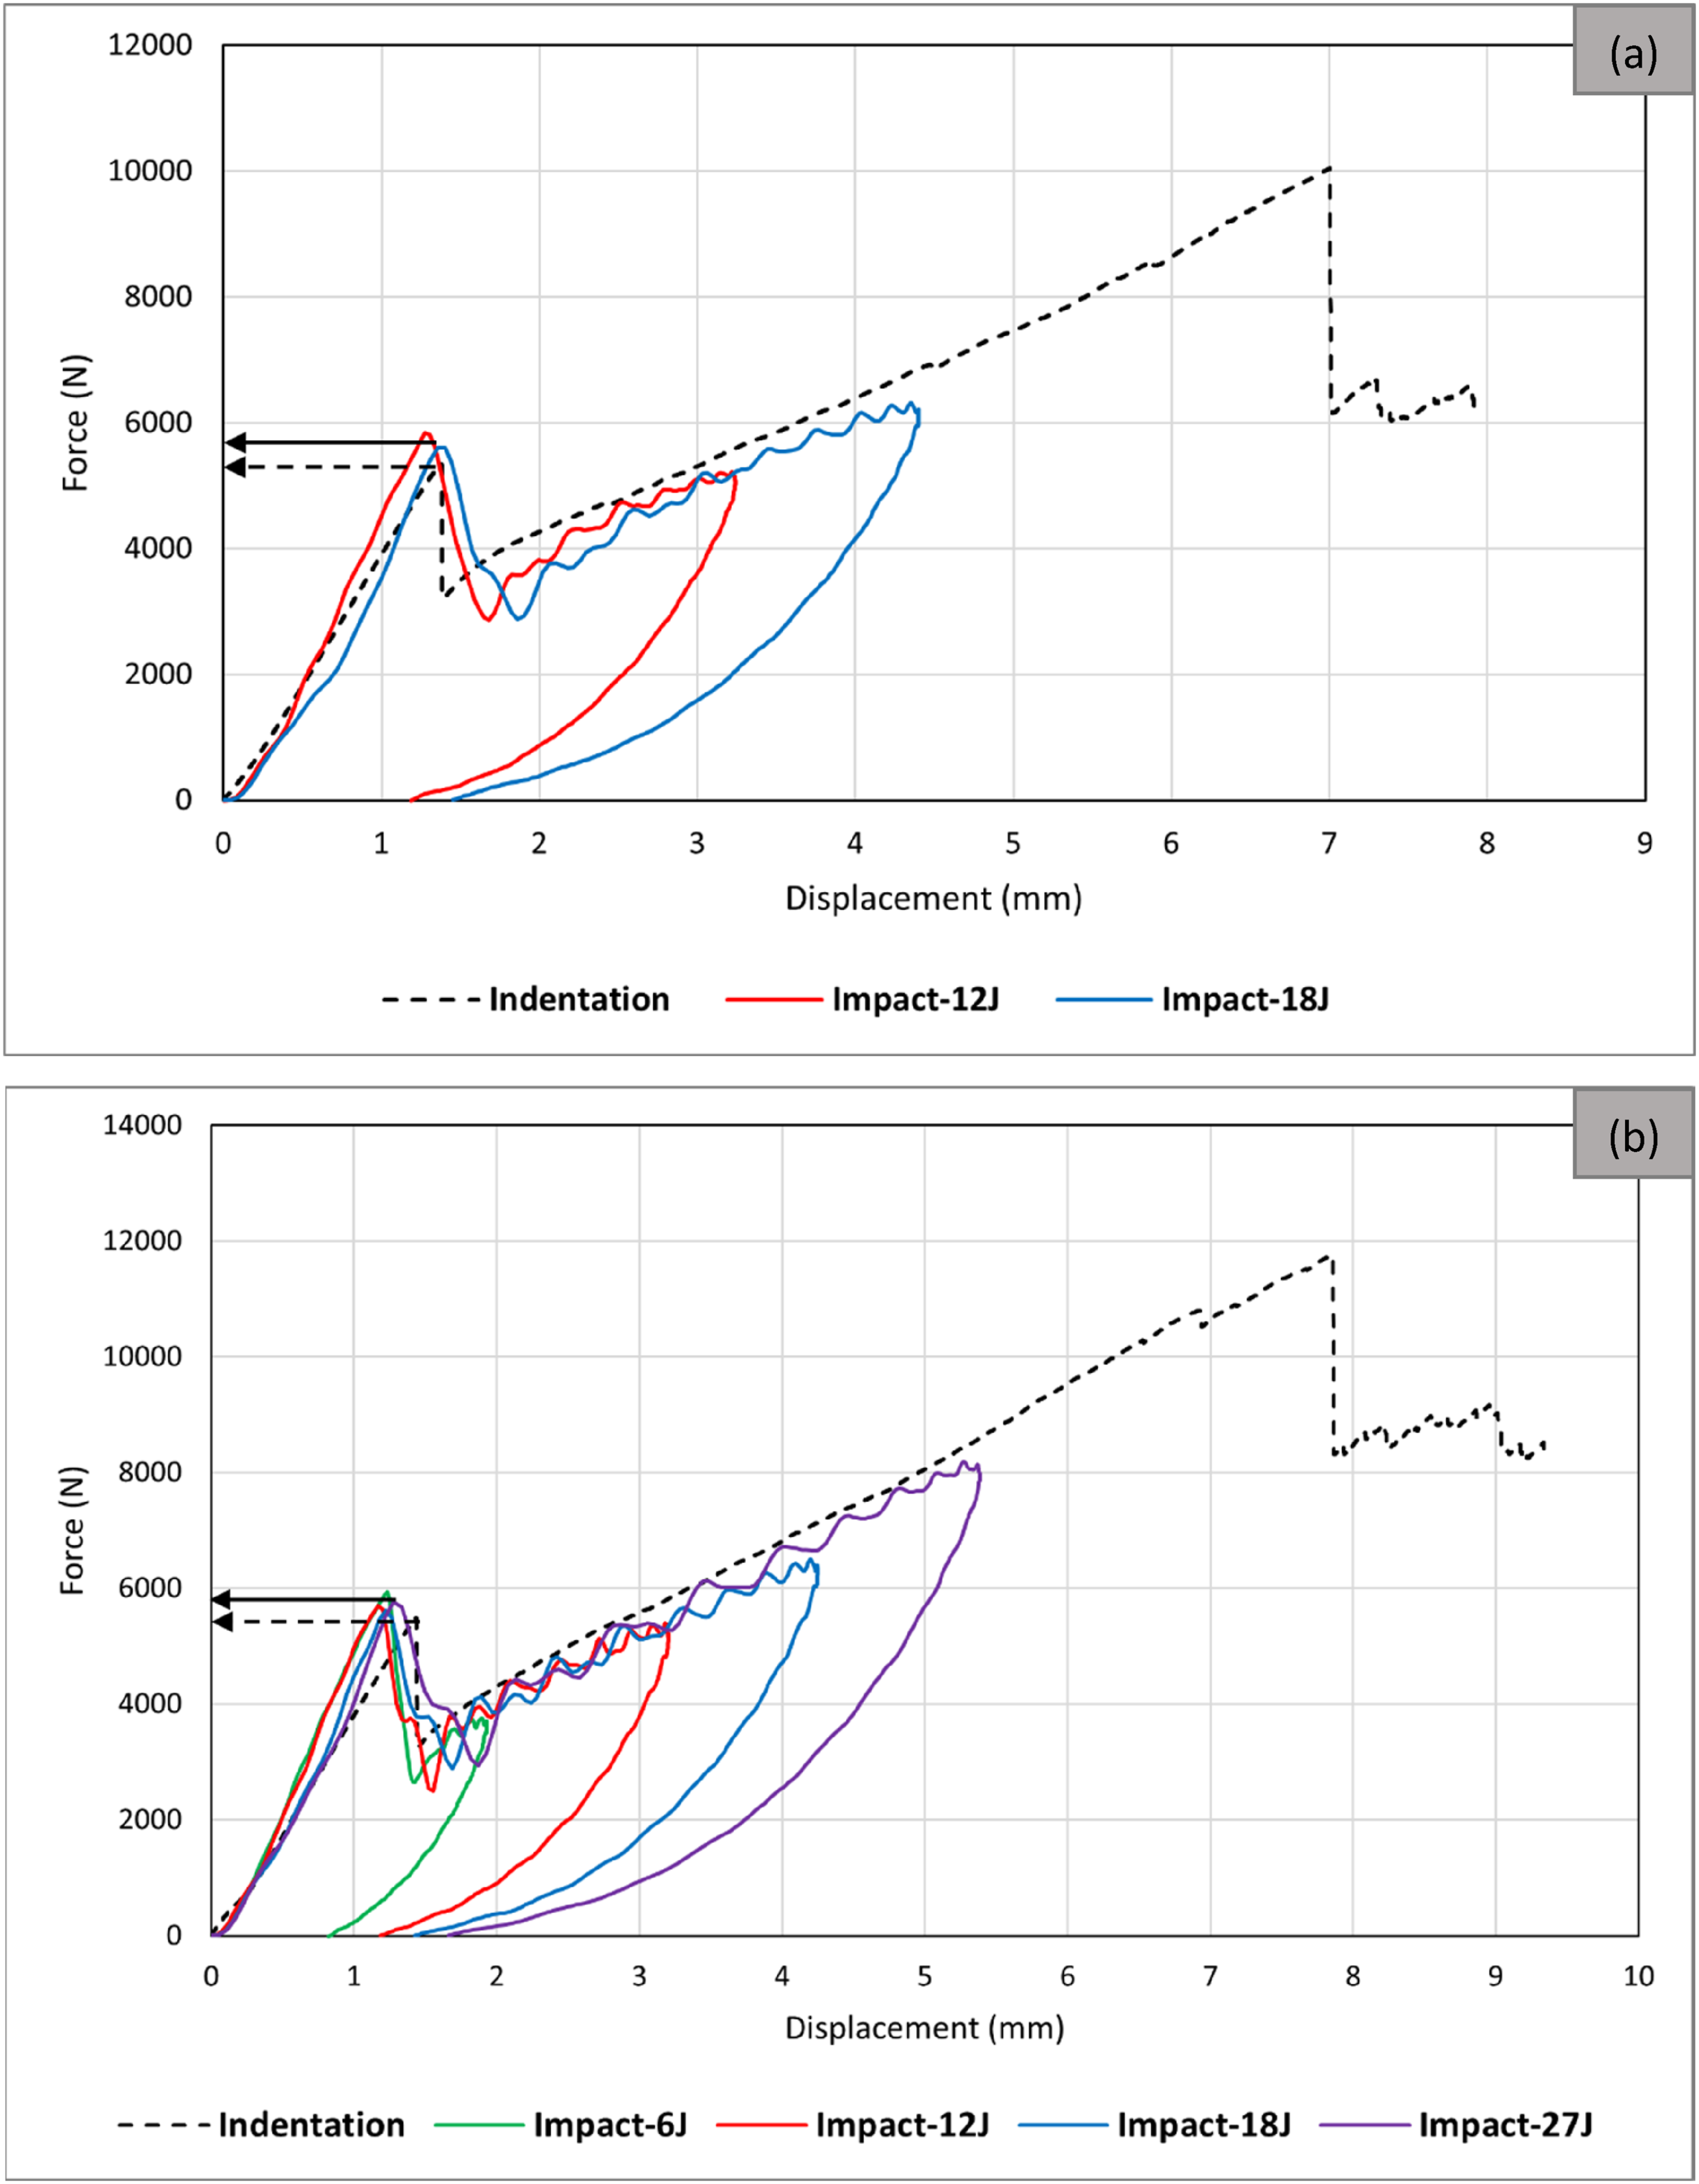
Conclusions
This paper showcased the application of self-reporting thin-ply hybrid glass/carbon sensors in enhancing the visual detection of BVID within curved composite panels. These panels were manufactured to replicate the dimensions of hydrogen composite storage tanks, providing a real-life case study. A new testing setup suitable for curved panels was developed, facilitating static indentation and low-velocity impact tests at various energy levels on both Reference and Sensor samples.
Indentation test results indicated a slight increase in energy absorption and structural stiffness as a result of adding two sensors on the two sides of the panels. This change was minimal before the delamination onset and became greater as the test progressed towards the end. Analysis of images taken during the test and visual inspection images showed excellent performance of the sensor in visualising damage caused by indentation. Specifically, the energy threshold for visually detectable damage on the back face of the Reference sample decreased significantly from approximately 44J, occurring post-fibre failure, to nearly 2J in a Sensor sample, occurring just prior to delamination onset. This suggests the sensor’s effectiveness in detecting and monitoring delamination in curved composite profiles.
Furthermore, the impact test outcomes demonstrated sensor activation on both the front and back faces across all tested impact energies. This highlights the sensor’s potential as a practical tool for detecting BVID in curved composite laminates. Notably, a correlation between the extent of the activated area and the level of impact energy was observed, implying that the sensor could serve as a means to estimate damage severity as well. Microscopy images of the cross-section revealed a lesser damage extent in Sensor samples than Reference samples, highlighting the load-bearing capabilities of the hybrid sensors.
Four notable differences emerged between the two curved and flat panels. In both indentation and impact tests, it was observed that the rate of the initial load drop, linked with delamination, was significantly higher in the curved samples. Moreover, impact test results revealed greater energy absorption across various impact energies in both Reference and Sensor samples within curved panels compared to flat panels. Another interesting difference was related to the correlation between the impact energy and delamination threshold force in force-displacement graphs obtained from impact tests. In the flat panels, the delamination threshold force tends to increase with rising impact energy. However, in the curved panels, the trend is reversed, indicating that the delamination threshold force decreases as impact energy increases.
Finally, in terms of similarities between static indentation and low-velocity impact tests, a notable observation was made regarding the consistency, particularly in deriving the delamination force threshold, which was markedly higher for the curved panels compared to the flat panels. The difference between the delamination force thresholds obtained from static indentation and low-velocity impact tests for the curved panels was less than 8%, whereas for the flat panels, this difference ranged from 15% to 30%.
Footnotes
Author contribution
Ali Tabatabaeian: Conceptualization, Investigation, Methodology, Data curation, Formal analysis, Visualization, Writing – original draft, Writing – review & editing. Reza Mohammadi: Supervision, Investigation, Methodology. Philip Harrison: Supervision, Writing – review & editing. Mohammad Fotouhi: Project administration, Supervision, Writing – review & editing, Funding acquisition.
Declaration of conflicting interests
The author(s) declared no potential conflicts of interest with respect to the research, authorship, and/or publication of this article.
Funding
The author(s) disclosed receipt of the following financial support for the research, authorship, and/or publication of this article: The research presented in this paper was financially supported by the UK Engineering and Physical Sciences Research Council (EPSRC) Grants EP/V009451/1, which focused on the development of high-performance impact-resistant composites with visible damage.
Data availability statement
All data supporting this study are provided in full in the Results and discussion section of this paper.