
Abstract
Modern approaches to exploring the impact behaviour of composite components involve computer models such that the components are virtually tested. However, for these virtual tests to be trusted they require careful validation using experimental data. This study demonstrates a quantitative validation approach for confirming the effectiveness of a simplified impact model. A set of six asymmetric laminates was impacted at 30 J whilst their bottom surface was monitored using high-speed cameras. The camera images were processed to obtain full-field strain which was then used to validate the model by the orthogonal decomposition technique. The validation procedure has confirmed that the model provides reasonable predictions of impact behaviour and gives insights into how it could be improved. The overall approach demonstrates how virtual testing of composite components can be vigorously validated. Validated virtual testing can then provide a low-cost and rapid route to the certification of lightweight composite structures.
Keywords
Introduction
The application of composite materials is vital for the reduction of emissions across a wide range of sectors. This is due to their use in lightweight vehicle structures, as well as being the principal structural material for the generation of clean electricity by wind. The reason for this stems from their microstructure, which typically combines high-strength fibres with a tough polymer matrix. However, this microstructure adds substantial complexity when considering the damage tolerance of composite structures, in particular when subjected to impact damage. 1 As such there is a need to characterise the behaviour of new material systems when developing composite structures. Historically this characterisation has been performed experimentally with great cost to manufacturers. With increasing levels of computational power, it is becoming possible to virtually test new materials to determine their suitability for applications.2,3 These virtual tests often require high levels of complexity to simulate all the damage mechanisms involved.4–6 The extent of this complexity tends to vary with the length scales at which the model is defined. The benefit of the virtual testing approach is that it allows for many more loading scenarios to be considered. It also reduces the amount of expensive experiments and thus is increasingly applied to more complex structures. 7 However, for virtual test results to be used in place of experimental studies it is essential that the models that underpin the virtual testing are fully validated.
Validation is a key process to establish confidence in computational models and their outcomes, within the scope of their intended application. 8 The process consists of comparison between model outcomes and physical measurements taken under equivalent conditions. This can be performed qualitatively, such as visually evaluating similarities or data trends, 9 and quantitatively by employing statistical approaches, with latter approaches preferred to quantify the agreement between datasets. The quality and quantity of physical measurements can directly affect the outcomes of the validation process and consequently confidence in a model. Obtaining high quality physical measurements is important, but it is also necessary to efficiently utilise the data and extract as much information from as few experiments as possible. Simulations based on computational models produce complicated 3D maps, such as strain fields, which contain gigabytes of data. Advances in digital cameras have allowed similar 3D maps to be obtained from experiments with the aid of optical measurement systems, such as digital image correlation (DIC). These datasets can be presented as images and thus visually compared to validate model predictions. However, a direct quantitative comparison is challenging due to differences in scale, mesh and coordinate systems. It has been previously demonstrated that the quantitative comparison between predicted and measured strain fields can be performed by implementing orthogonal decomposition. 10 This technique reduces the dimensionality of 2D and 3D datasets 11 into feature vectors, while preserving key strain features.
Models of composite impacts are often validated through the comparison of one-dimensional data such as force-time data from the impact machine.12,13 More specific comparisons can be made through comparisons of final damage morphology, such as comparing the shape predicted by finite element analysis with X-ray computed tomography data. 13 Other approaches focus on specific defects, such as delaminations predicted using cohesive layers in models with experimental data from ultrasonic C-scans. 12 More recently, methods of obtaining full-field stress data during impact events have become available through the use of high-speed DIC. 14 High-speed DIC of composite impact has been used for a number of applications such as damage assessment 15 as well as qualitative, side-by-side validation of models of damage propagation 16 and quantitative validation of impact dynamics. 17
Composite structures are typically laminate structures, where each lamina is orientated in a particular direction to impart desired strength characteristics to the composite. Whilst the laminae within the laminate can have highly varied orientations, in most applications they are arranged such that they are symmetric around the midplane of the laminate. This is to prevent complicated coupling effects, where in-plane forces result in out-of-plane deformation and vice-versa. There are however some situations where this effect is potentially beneficial, with particular attention given to it for aerodynamic and hydrodynamic applications. For example, turbine blades can be designed that twist to reduce loads at different rotation speeds, 18 and lifting surfaces can deform to maintain an optimal angle-of-attack at different speeds. 19 As these sorts of laminates are not widely applied there has been limited experimental study into the damage tolerance of asymmetric laminates and no quantitative validation of models of asymmetric laminates during impact.
In this study, finite element analysis is used to model asymmetric composite laminates as they are impacted to estimate deformation behaviour and damage creation. A novel technique is used to obtain the material properties for the model based on a small number of mechanical tests. The model is then validated through quantitative comparison with strain data captured using high-speed DIC of six specimens undergoing low-velocity impact. The paper is structured as follows, in the next section the experimental method for the impact experiment is described. Then the approach for obtaining the full elastic properties from a small number of experiments is introduced and used to provide the inputs for a finite element model. The results section explains the qualitative and quantitative validation of the model results, and the following section discusses the validation procedure as well as the strengths and limitations of the model. The paper is concluded in the final section.
Experimental method
Six asymmetric laminates with a stacking sequence of [02/902]4 were produced using unidirectional prepreg (RP542-4, PRF Composite Materials, UK). This prepreg is a mid-temperature cure epoxy resin with 12K carbon-fibre tows, where the fibres have an areal weight of 300 g/m2. The specimens were cured in a hot press operated with a pressure of 6 bar at a cure temperature of 120°C, according to the manufacturer’s recommendations. The pressure was first applied and then the specimens were heated to the cure temperature and held at this temperature for 60 minutes. After curing, the specimens were left to naturally cool to room temperature before pressure was removed. Finally, the laminates were cut down to 100 mm by 150 mm specimens using a wet diamond saw (Versatile Power Pro Bridge Saw, Vitrex, UK).
The asymmetric specimens were then impacted using a drop-weight impact machine (CEAST 9340, Instron, Italy) equipped with a 16 mm hemispherical tup and a mass of 4.215 kg. The tup is the part of the falling weight that makes contact with the specimen during the impact. All six specimens were impacted at an energy level of 30 J, a similar energy to that imparted by tool drops. During the impact events force data was measured by the tup at a rate of 2 MHz. A high-speed DIC system (Q-450, Dantec Dynamics, Germany), operated with two high-speed cameras (Phantom v711, Vision Research, USA) was used to monitor changes in strain fields as specimens were being impacted. Both cameras were fitted with 100 mm focal length lenses (Makro Planar 2/100 T*, Carl Zeiss, Germany) and were set to record the impact events at a frame rate of 10 kHz. The camera recording was triggered by a light gate built into the test machine. A speckle pattern was a key requirement for the DIC system to track changes on laminates as they were impacted. The pattern was created using a white base coat (Matt White, PlastiKote, USA), followed by black speckles (Carbon Black, Liquitex, USA) to introduce a random texture for optical tracking. Istra4D (Dantec Dynamics, Germany) was then used to process these captured images to calculate surface displacement data with a facet size of 25 pixels and grid spacing of 10 pixels.
Ultrasonic characterisation was performed on all impacted specimens to obtain damage information using a pulse-echo ultrasound machine (Midas-NDT, UK). This involved an ultrasonic transducer emitting ultrasound at a frequency of 5.88 MHz, chosen as it was the closest selectable frequency to the ply resonance frequency of 6 MHz. Time-of-flight C-scans were captured to obtain accurate measurements such as the size, shape and location of damage formed in the specimens after impact. During the scans the ultrasound machine operated in a raster pattern with a line spacing of 0.2 mm and measurements captured every 0.1 mm along each line.
Elastic properties of the composite material were required for the model. To obtain these, a set of 25 mm wide coupons was produced to determine material properties in the axial and transverse directions. Five specimens with a [0]4 layup and five with a [90]8 layup were produced using the same curing conditions as described previously. Eight layers of prepreg were used for the 90° specimens as these were expected to fail at much lower stresses than the 0° specimens. The additional thickness meant that the failure load was well within the effective range of the test machine’s load cell. A similar speckle pattern to that used on the impact specimens was applied to these coupons. The coupons were then quasi-statically loaded to failure using a servo-hydraulic load machine (8501, Instron, USA) according to ASTM D638 whilst axial strain was measured using a stereoscopic DIC system (Q-400, Dantec Dynamics, Germany). This DIC system consisted of two cameras (Manta G-505B, Allied Vision Technologies, Germany) located a metre away from the specimens to measure three-dimensional displacements. Both cameras had a resolution of 2452 by 2056 pixels and were equipped with a pair of 25 mm lenses (FL-CC2514-2M, RICOH, Japan). All specimens were recorded using an aperture of f8.0 and illuminated with a LED light source (Dantec Dynamics, Germany), ensuring good light exposure during the experiments. The same facet size and grid spacing as used during the impact experiments was used to obtain surface strain on the specimens. These tests provided measurements of the ultimate strength and elastic moduli in the axial and transverse directions of the composite material. These properties were then further processed using a method described in the next section to obtain the full elastic properties of the composite.
Finite element analysis of impact events
Estimation of orthotropic material properties
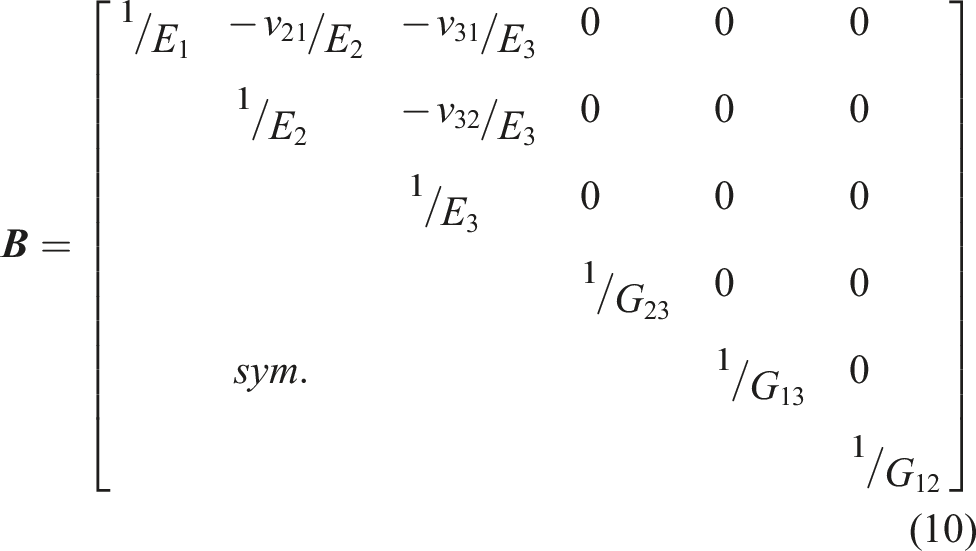
To model the deformation and failure of composite specimens during impact it is necessary to have a large number of material properties. It is common practice in academic studies for such properties to be taken from multiple sources, often for very different material systems. As this study involves quantitative validation it was necessary to obtain more accurate estimations of material properties. A full experimental characterization of a new material system would be prohibitively expensive. Thus, a hybrid approach that uses experimentally measured properties in orthogonal directions was used to obtain estimates of the full orthotropic material properties. The composite material properties for the volumetric stress state of a unidirectional carbon-fibre reinforced polymer layer can be estimated using the rule of mixtures, however, this does not take account of fibre shielding, where the rigid fibres result in low stresses in parts of the matrix when loads are transverse to the fibres.
20
Numerous methods exist for adjusting the rule of mixtures to account for shielding, for this study, a method that accounts for fibre shielding by defining a second fibre volume fraction for the transverse direction was used.
21
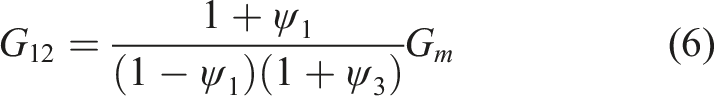
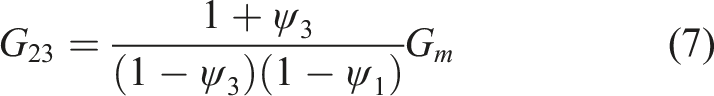
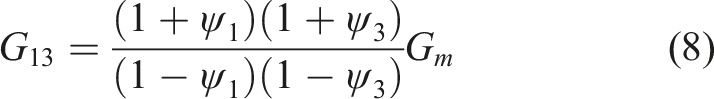
Using this method for orthotropic materials, the calculated dependencies of elastic characteristics for a fibre-reinforced layer can be calculated as follows:
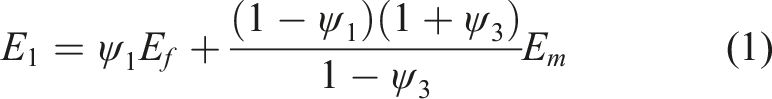
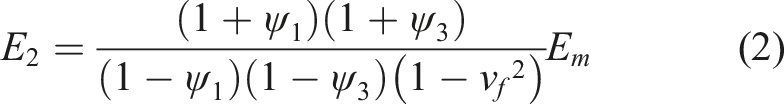
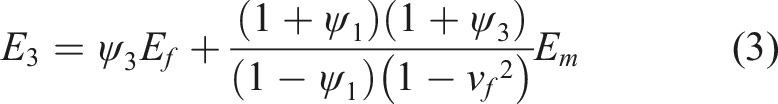
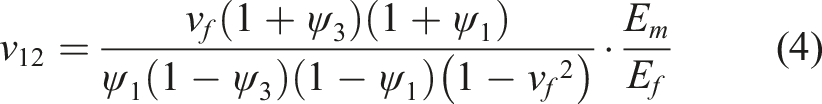


Input data for determining the composite elastic constants.
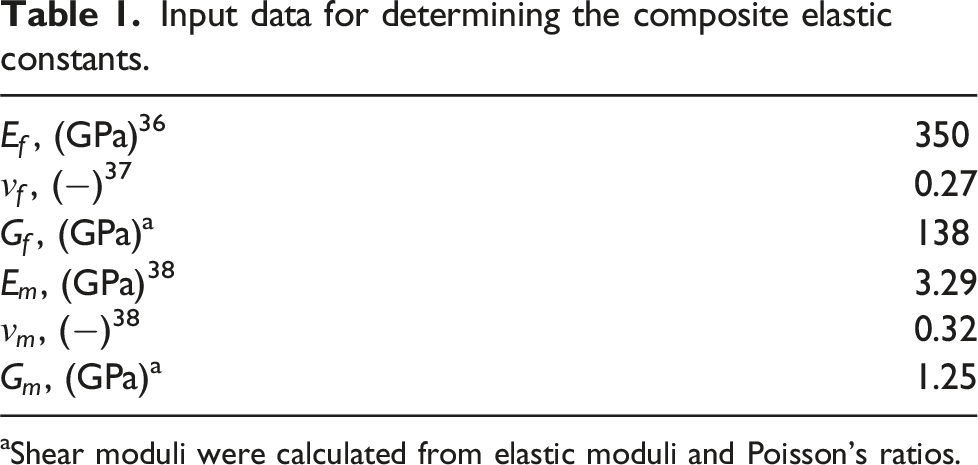
aShear moduli were calculated from elastic moduli and Poisson’s ratios.
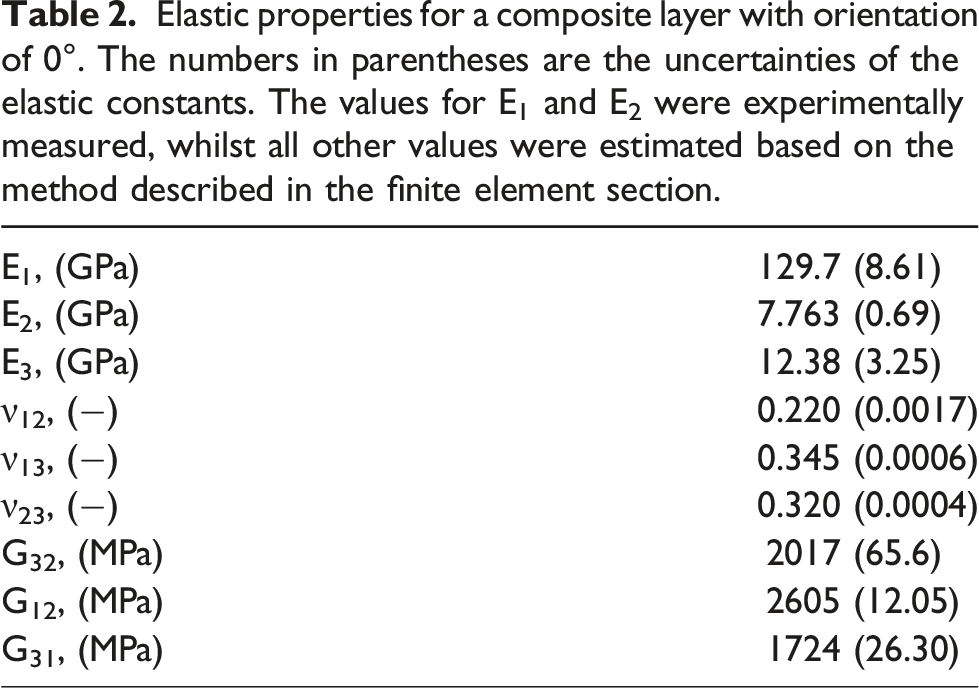
Elastic properties for a composite layer with orientation of 0°. The numbers in parentheses are the uncertainties of the elastic constants. The values for E1 and E2 were experimentally measured, whilst all other values were estimated based on the method described in the finite element section.
Modelling of impact event
The experiment was conducted in accordance with ASTM D7136/D7136 M and thus the specimen on the impact fixture was modelled in Ansys (2024 R1, Ansys Inc., Pennsylvania) with the following assumptions. The fixture base was assumed to be a steel plate with dimensions of 300 mm in width, 300 mm in length, and thickness of 20 mm, with a rectangular planar cut-out of 75 mm by 125 mm. In the experiment the specimen was held over the cut-out by four rubber feet, for simplicity these were neglected. The impact tup was modelled as a steel hemisphere.
The centroids of the test specimen, the cut-out in the fixture base, and the steel hemisphere were aligned along the direction of the impact direction. At the beginning of the model’s simulation, the laminate made contact with the fixture base through hinged movable supports along the perimeter of the contact line between the specimen and the rectangular cut-out of the support fixture. The contact was assumed to be frictionless. The fixture base was rigidly clamped along its outer edges. Delamination between the eight plies was simulated through the interface delamination failure model in Ansys.22–24 The possibility of crack formation through each ply from the centre of the specimen along the reinforcement directions was simulated using debonding model interfaces based on separation distance. 25 The impact load on the system was assumed to arise kinematically through the corresponding displacement of the flat boundary of the hemisphere. A static simulation was performed such that the dynamic properties of the material did not need to be determined.
For meshing, the specimen was divided into a set of 3D finite elements consisting of 81,500 hexahedral SOLID186 elements for all bodies except the tup and 9706 tetrahedral SOLID187 elements for the tup hemisphere. The SWEEP method and path confirm method were employed, with element counts specified in the respective directions. Contact between pairs of opposing surfaces of the test specimen with the fixture base and the test specimen with the tup hemisphere were simulated using 4902 contact elements CONTAC174 and 4902 target elements TARGE170. Additionally, 26,600 interface elements INTER204 were defined between the unidirectional layers of the test specimen to model the regions susceptible to delamination using the cohesive zone modelling method built into the package. These delaminations were anticipated between layers reinforced in different directions and within the plane formed by the reinforcement direction of the layer and the normal to the opposing surface, passing through the centre of the corresponding opposing surface. The elastic properties of the specimen were taken from Table 2. The hemispherical tup and fixture were modelled as a generic steel, with an elastic modulus of 250 GPa and Poisson’s ratio of 0.33. In total, the mesh consisted of 459,562 nodes and 91,206 elements.
The final number of elements was determined by an iterative process of gradually refining the mesh, ensuring convergence of the results of the stress-strain state compared to the results of reactions of the tup. The computational mesh of the structural model has been created using sweep and tetrahedron methods, allowing for a complete decomposition of the model into finite elements. The sweep method predominates in the model (used for all the elements except the impact tup), resulting in a structured mesh. The placement of nodes in the structured mesh was clearly defined, predictable, and implicitly linked from a programming perspective. This enabled efficient programming through data storage and led to efficiency in execution time and utilisation of system resources. 26 Quadratic elements utilizing a nonlinear shape function have been employed. Displacements between nodes were interpolated using higher-order polynomials. Such elements are better suited for representing complex geometries and bending deformations.
Due to the use of the tetrahedrons method, an unstructured tetrahedral mesh has been constructed on the impact tup. Employing the patch conforming method approach, this bottom-up approach involves building the mesh starting from the edges of faces and then moving into the volume. All faces and their boundaries adhere to and connect, creating a high-quality, clean mesh. The primary advantage of unstructured meshes lies in their ability to be generated on complex geometries, often absent in structured grids. The main criteria for mesh quality evaluation included orthogonal quality and skewness. It was recommended to use mesh models where the minimum orthogonal quality value was greater than 0.1 or the maximum skewness value was less than 0.95. 27
The overall quality of elements was assessed based on the ratio of volume to the sum of the squares of edge lengths for two-dimensional quadrilateral and triangular elements. For three-dimensional elements, it was the ratio of volume to the square root of the cube of the sum of the squares of edge lengths. In the model, the dimensional range of elements varied from 0.22842 to 1, where a value of 1 indicated an ideal cube or square, while a value of 0 indicated that the element had zero or negative volume. The aspect ratio for the sides of a triangle provides a comparison of the height and width of the triangle, ranging from 1 to infinity. For quadrilaterals, the aspect ratio was defined as the ratio of the long side to the short side of the quadrilateral. In the considered problem, this ranged from 1 to 8. The finalized mesh is shown in Figure 1. Computational mesh viewed from above (top), the side (middle), and a close up view of a cross-section through the tup in contact with the laminate (bottom).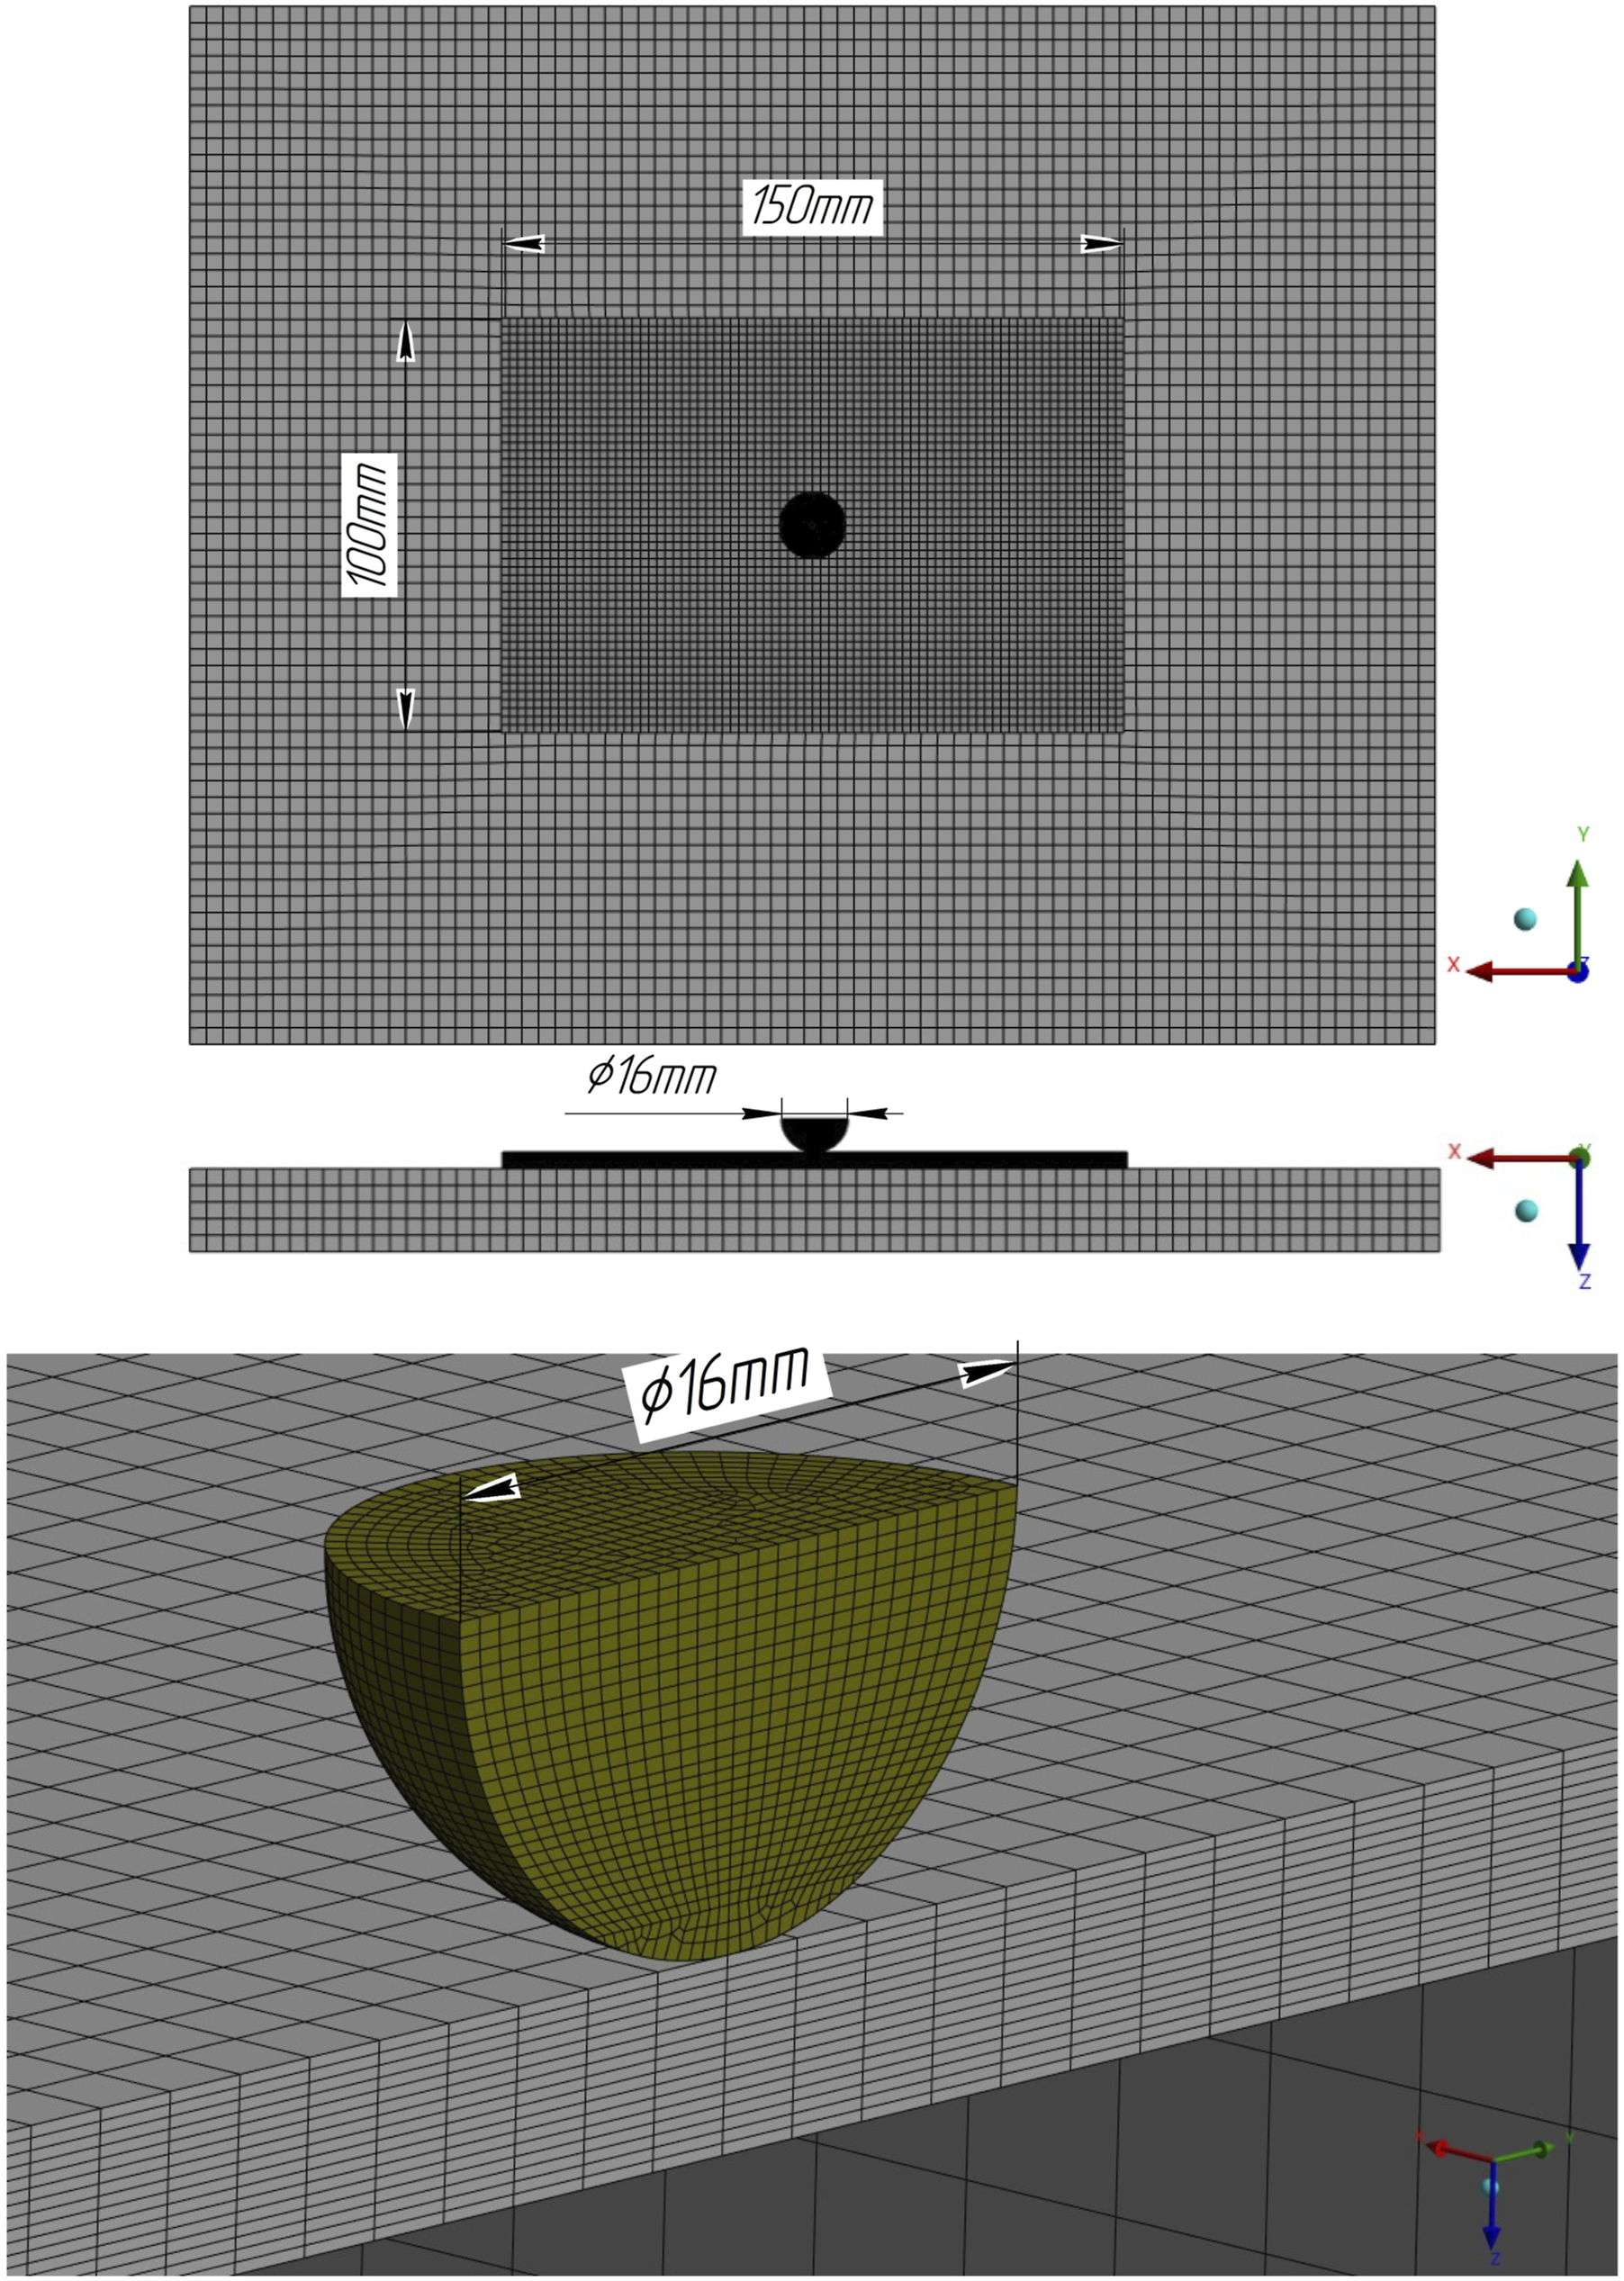
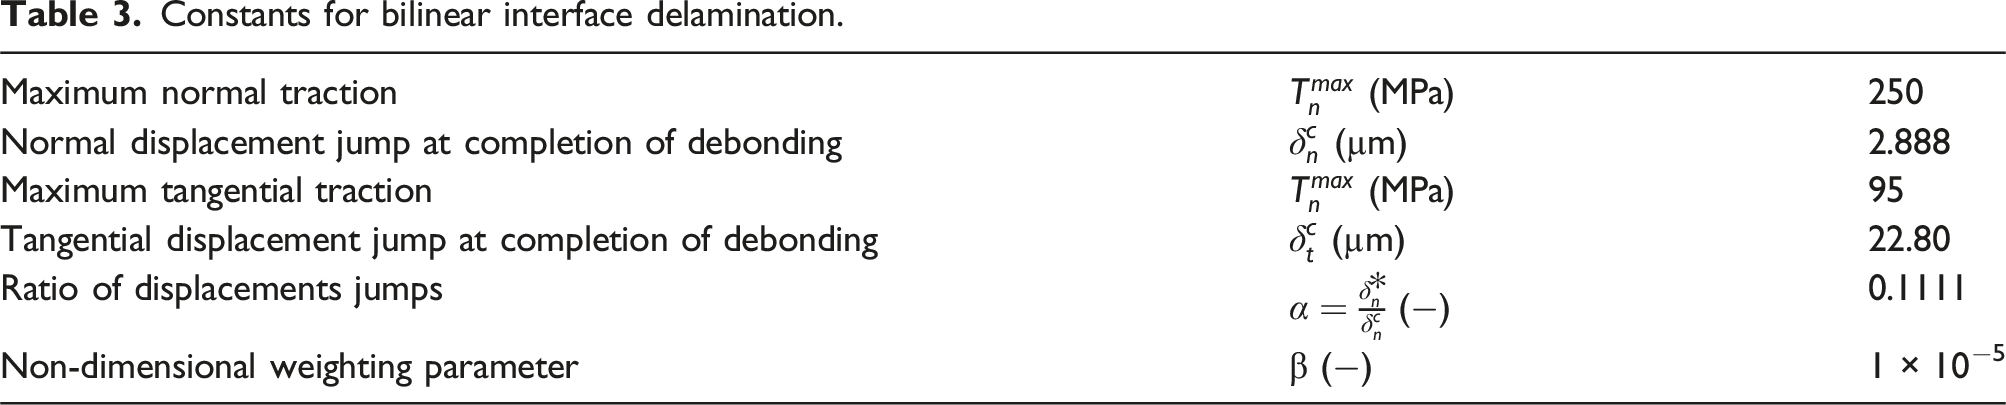
Constants for bilinear interface delamination.
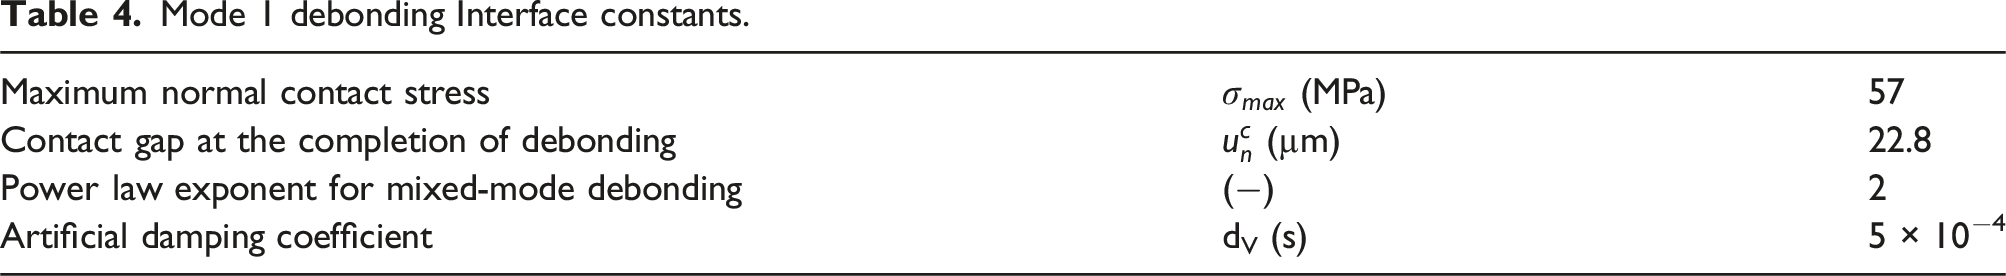
Mode 1 debonding Interface constants.
Results
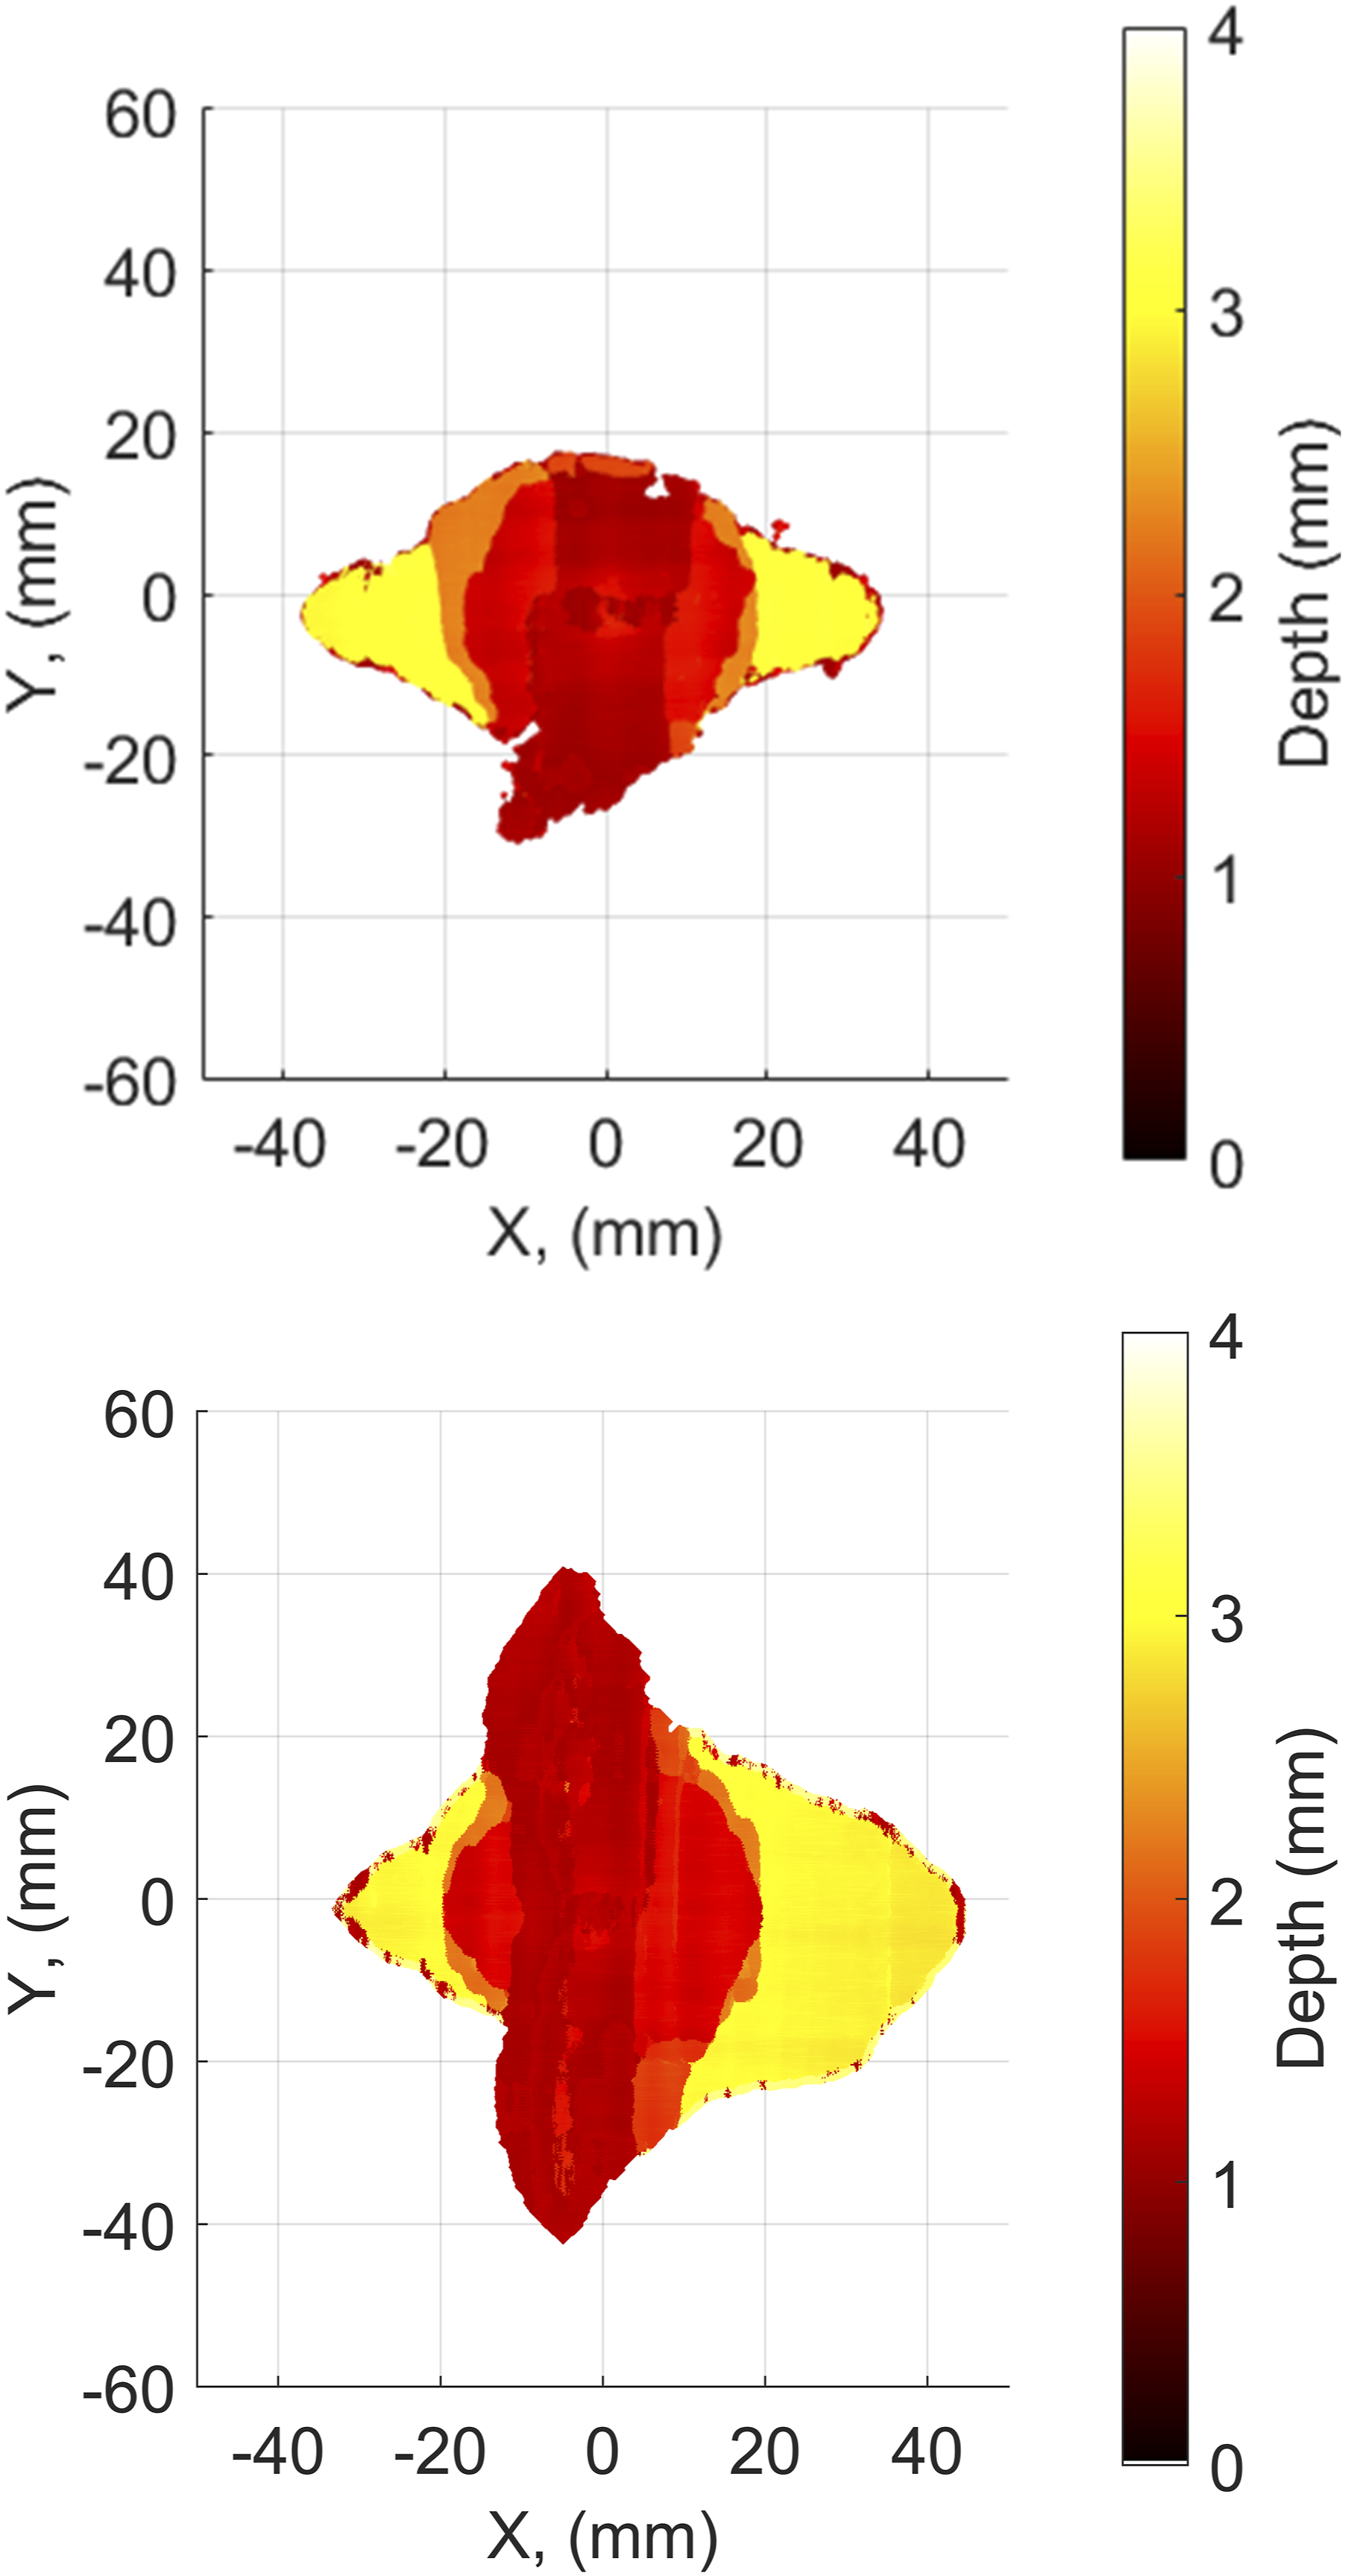
Six asymmetric laminates were impacted at 30 J. During these impacts the test machine recorded the force data from the moment the tup first contacted the specimen until after the tup left the specimen. This force data demonstrated that there was significant variation in the dynamics of the impact event, with specimens typically having a similar force-time profile but with variation in peak force and impact duration, see Figure 2. This variability in impact behaviour was also seen in the ultrasound scans performed after the impact event. Using these scans a typical impact damage morphology can be seen where delaminations are created at the interfaces within the laminate, increasing in size with depth, as shown in Figure 3. However, there was variation in the projected damage area and some delaminations near the top and bottom surfaces of the specimens appeared irregular in shape, an example of this irregularity is shown at the bottom of Figure 3. Force-time data captured by the impact machine showing variability in specimen behaviour. Ultrasound scans for two specimens impacted at 30 J, corresponding with specimen 1 (top) and specimen 6 (bottom) from Figure 2.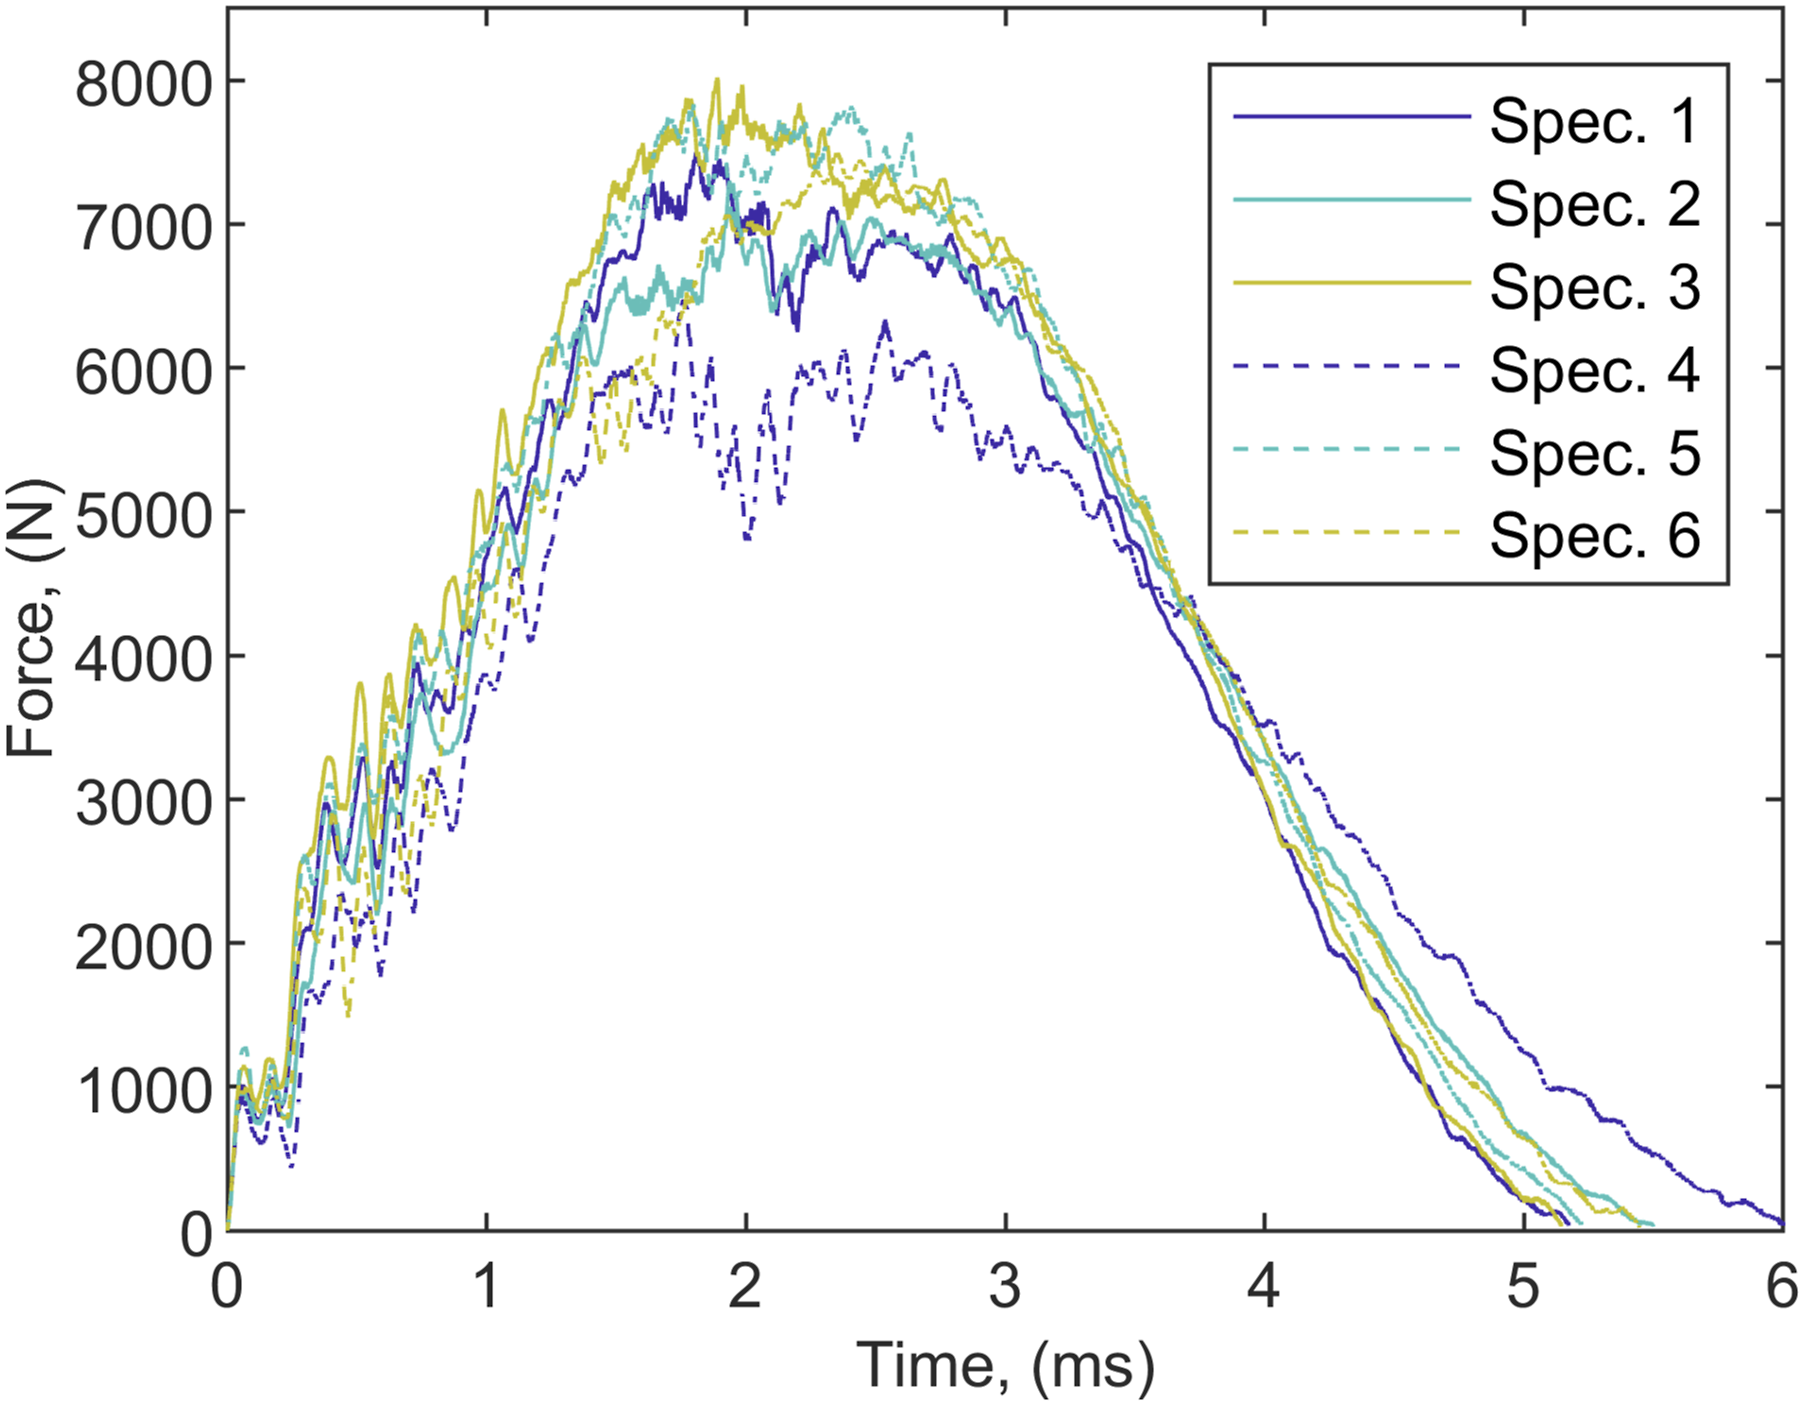
The simulation process was divided into steps according to a unified time scale from 0 to 1 s, where at 1 s the displacement applied by the simulated tup was 6 mm. Initial approaches for comparison between experimental measurements and model predictions focused on comparing damage visible on the rear surface of the specimens. Finding an adequate method for measuring the length of the crack on the back surface was a non-trivial task. A visual optical method of flaw detection was chosen. To avoid chemical damage to the specimen surfaces, the option of colour flaw detection was discounted. To verify the adequacy of the measurements, two techniques were selected for obtaining the crack lengths in the specimens: using a digital microscope and using a photo scanner. For the digital microscope, the length was determined by an aperture grid with an accuracy of ±15 µm, based on accumulated error of three measurements. Whilst the photo scanner had a resolution of 1200 dpi, equivalent to 47 px/mm. The dimensions measured using the photo scanner were verified by direct measurement with a calliper of the longer sides of the specimens with an error of ±5 µm, according to the reported precision of the instrument. The scanned digital images did not allow for the exact position of the crack tip to be determined, with the crack tip only visible if it happened to occur on a black speckle. Considering the aforementioned uncertainties, the overall uncertainty for the crack lengths amounts to ±15 µm. Across all the specimens, the mean crack length on the bottom surface was 2.03 mm with a standard deviation of 6.04 mm. An exemplar scanned specimen with the rear surface crack marked is shown in Figure 4. Bottom surface of a specimen after impact showing the speckle pattern and with the extent of the bottom surface crack indicated (top) and zoomed in view of crack tip (bottom).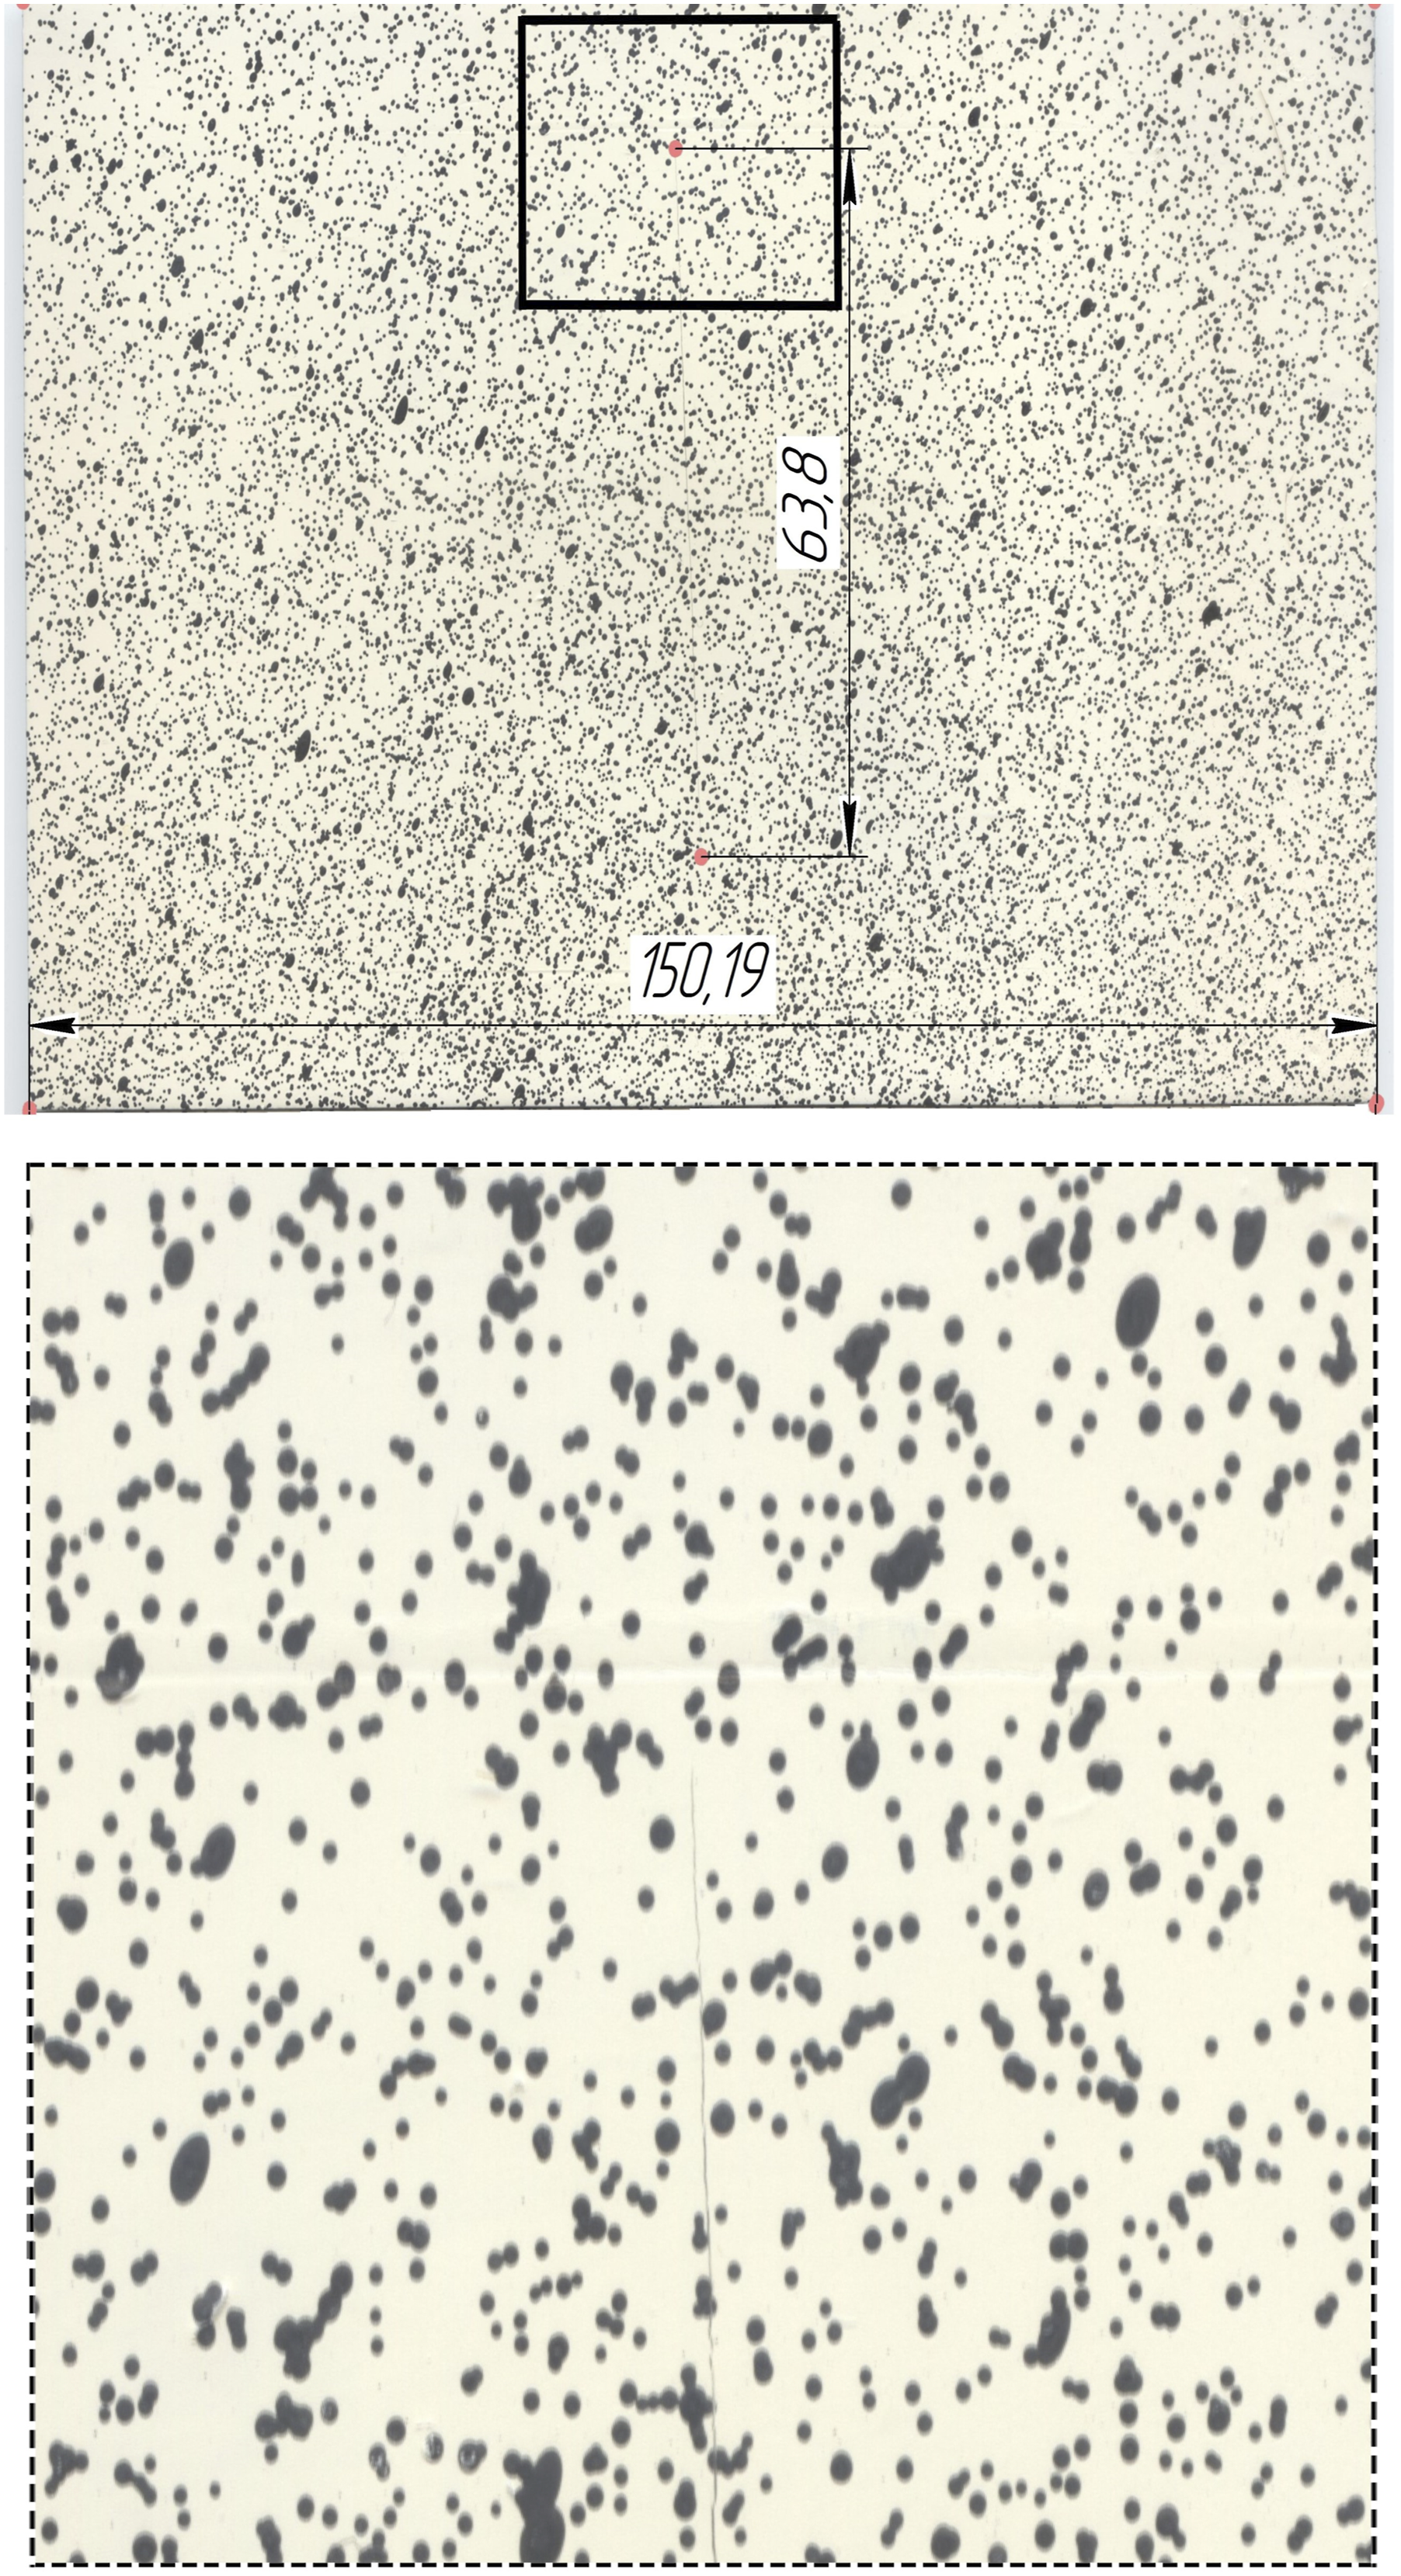
The simulated crack length value of the specimen was determined at the moment the tup had been displaced by 6 mm in the model. This corresponds to the average value of the measured vertical displacements of the tup upon impacting all specimens. The crack opening as measured between the nearest nodes of the interface elements, whose mutual displacement exceeds the contact gap at the completion of debonding
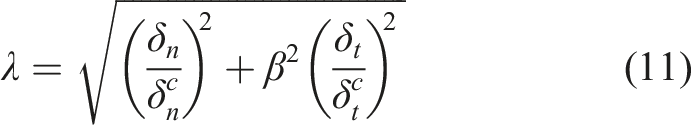
Due to the variability encountered during the experiments, it was decided to base further model validation efforts on the strain field on the bottom surface of the specimens, which was measured using digital image correlation during the impact event. To study deformation behaviour throughout the duration of the impact event and validate the model, the interest lies in the model predictions at specific displacements of the impact tup hemisphere in the simulation at 2, 3, 4, and 5 mm. For the experiments the time these displacements were reached was estimated by twice integrating the force data measured by the load machine with respect to time. An example of the tup displacement is shown for one of the specimens in Figure 5, where the instances that were modelled are shown as square markers. Thus, the displacement of the hemisphere and the actual time elapsed since the contact of the tup with the laminate were obtained and the specific DIC strain fields at these times were selected for comparison with the strain predicted by the simulation. These specific instances are shown in Figure 5 as the square markers. For validation, strains from the simulation and experiment were converted to the planar Lagrangian principal strains. This measure of strain was used to prevent any influence on results due to the different coordinate systems of the simulation and the DIC system. A visual comparison between the simulation and one of the experiments at a displacement of 2 mm is shown in Figure 6. Displacement-time data captured by the impact machine for a specimen where positive displacement indicates the top surface of the specimen has been pushed down. The squares indicate the instances that were modelled and compared with the DIC data. First (left column) and second (right column) principal strains captured by the DIC system at a tup displacement of 2 mm (top row) and corresponding model predictions (bottom row).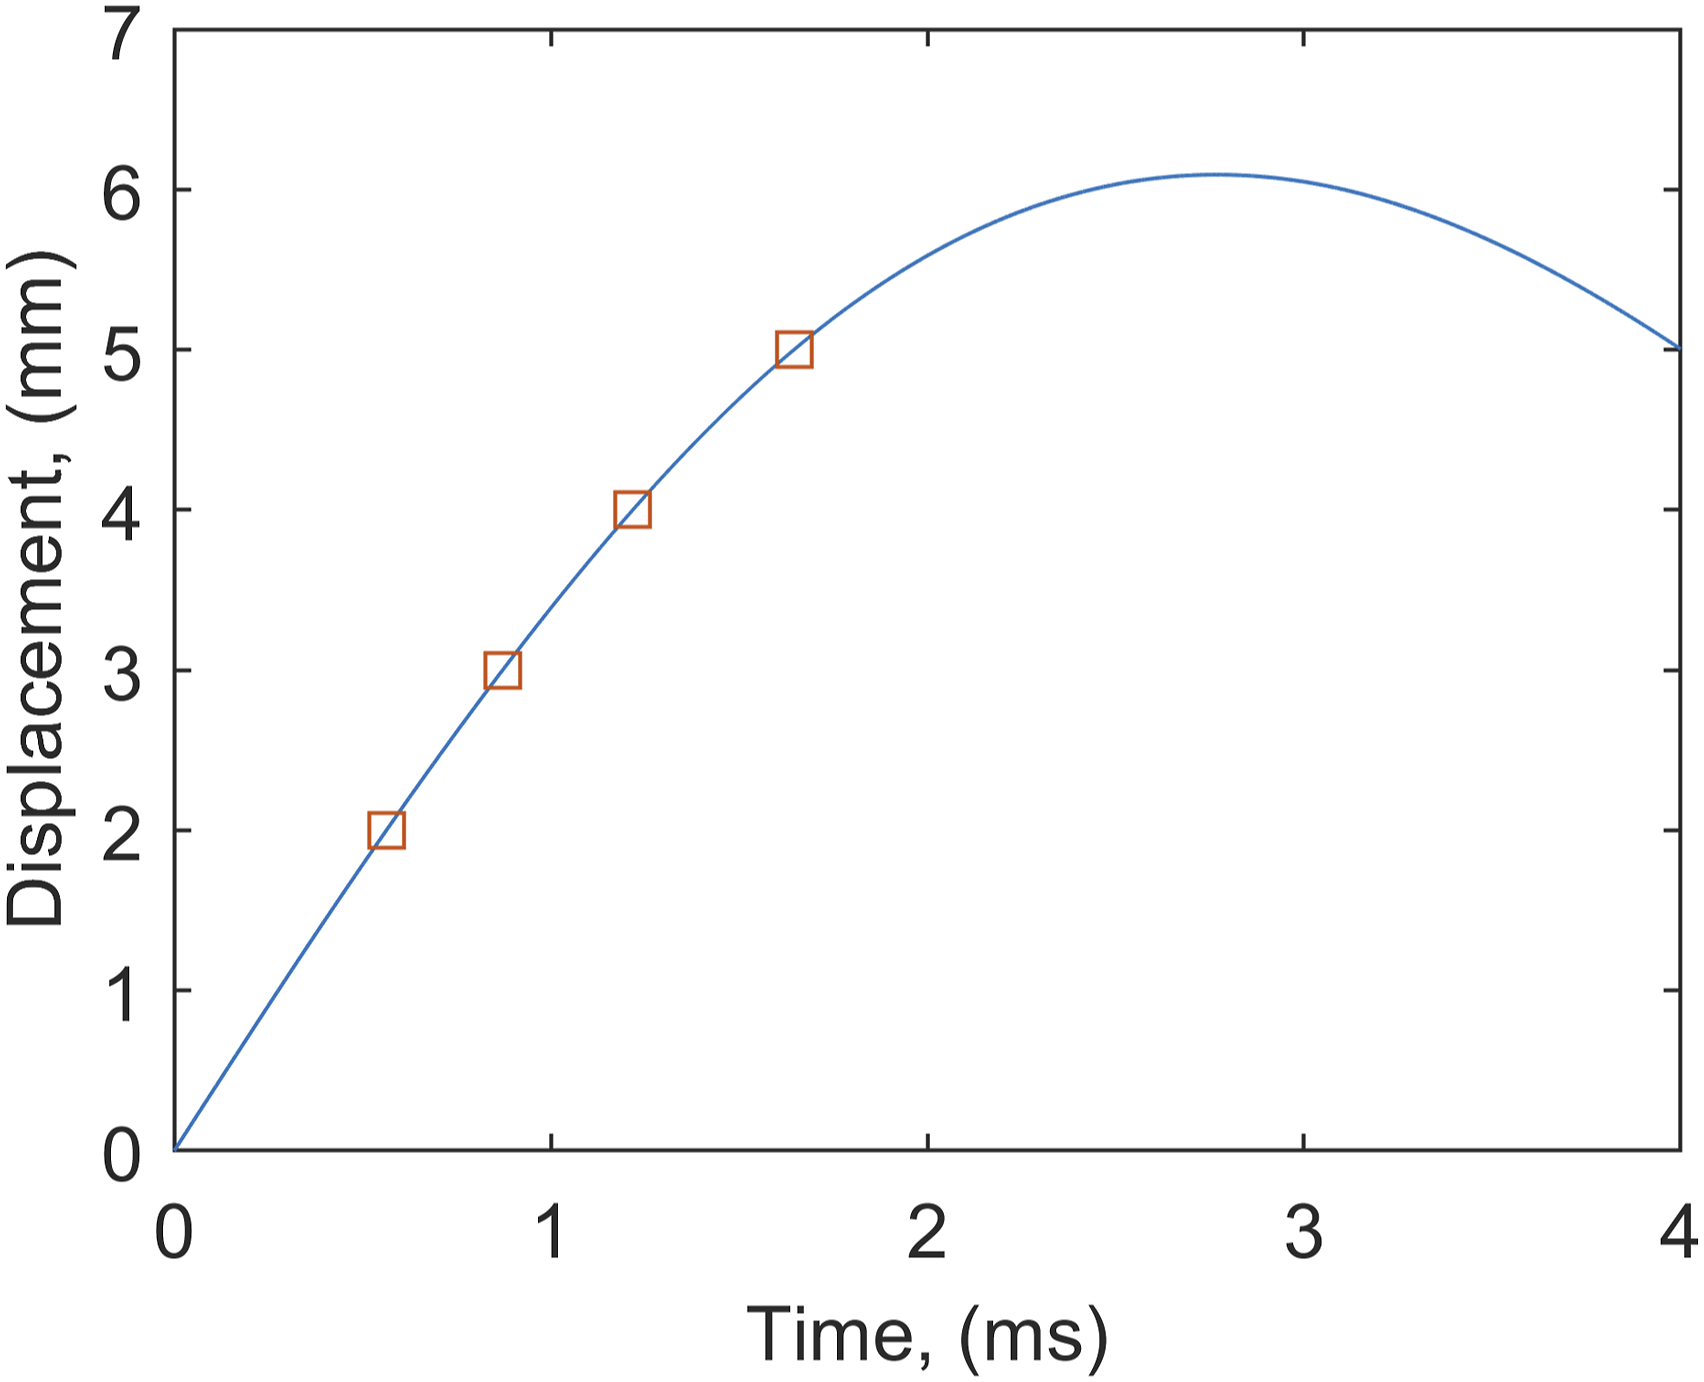
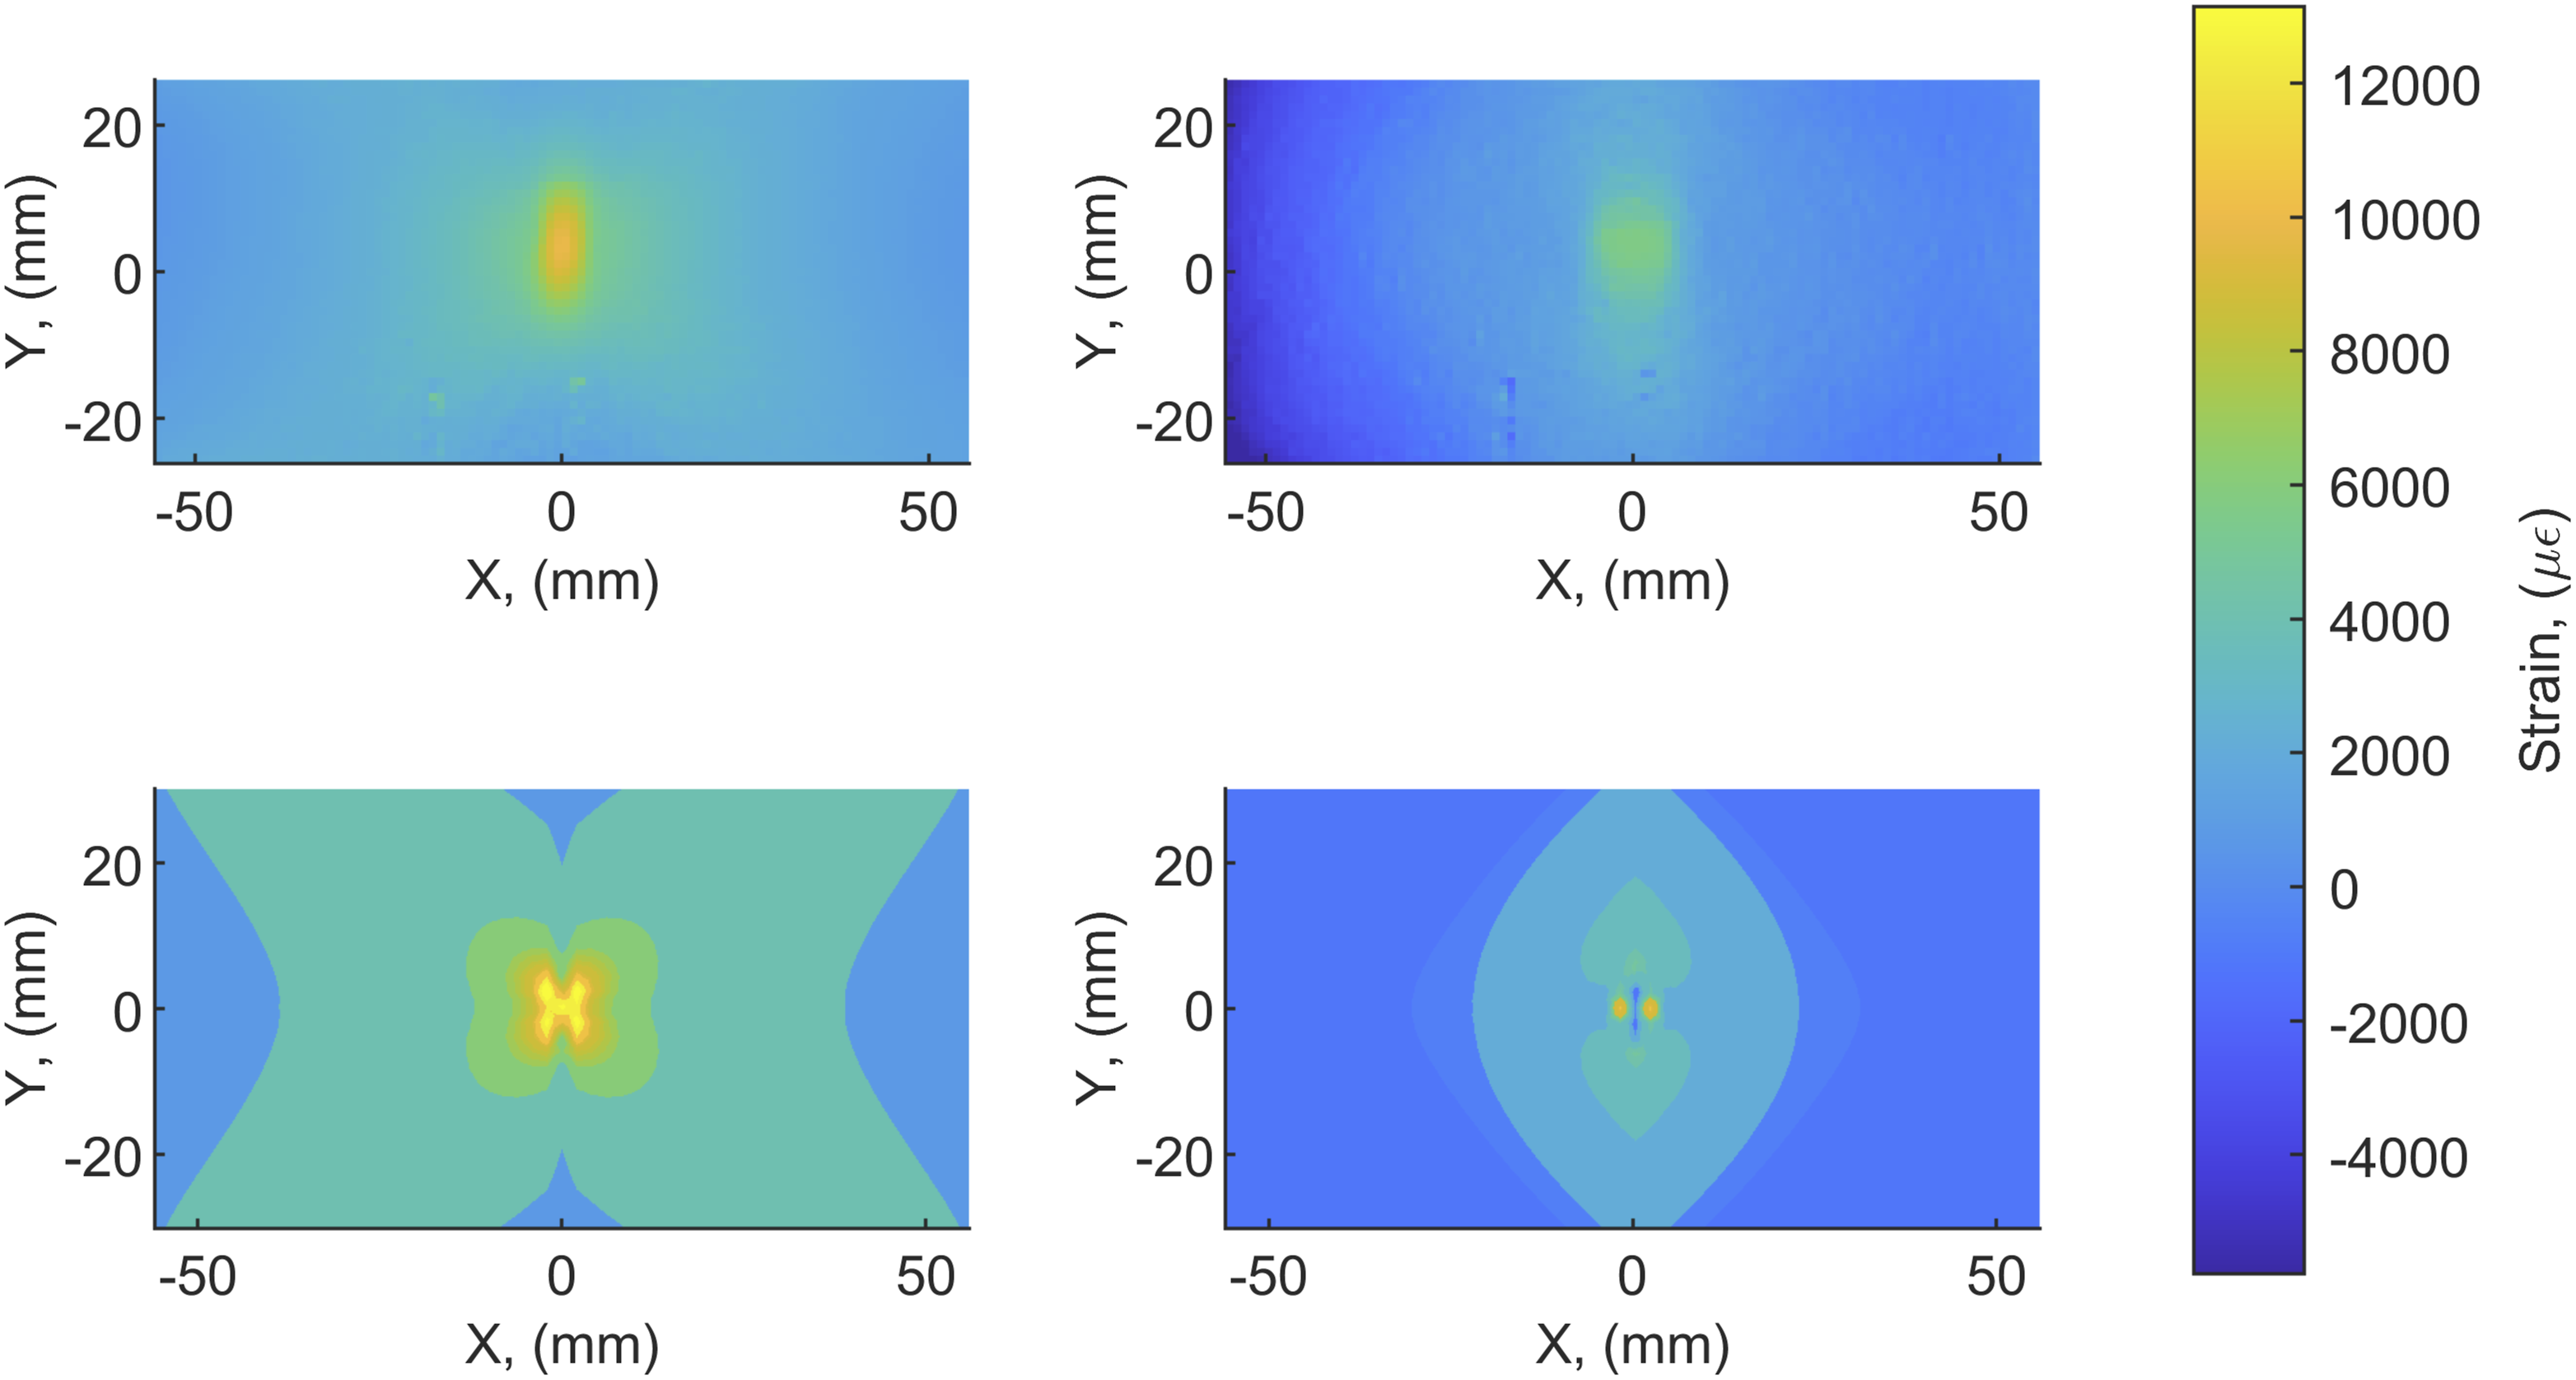
Whilst there are differences between the experimental and modelled strain fields it can be difficult to determine how much of these differences are due to measurement uncertainty in the DIC data. As evident in Figure 6 there are also some visual differences due to the model data being plotted as contours with a finite number of levels resulting in blocks of colour whilst the DIC data is more continuous. Thus, to avoid subjective comparisons a quantitative validation approach was used based on orthogonal decomposition. The mathematics for performing decomposition are described in detail in Ref. 10 but are briefly summarised here. In this method, the strain fields, 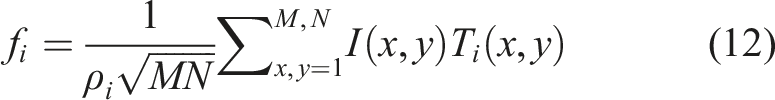
The experiments were repeated six times and thus for each displacement interval six comparisons could be made. However, there are multiple formulations of strain that could be used during the validation process, with the first and second principal strains being the leading contenders as they fully define the strain state at every surface location, as shown in Figure 6. To choose which formulation to use during the validation process, it was decided to choose the quantity where the deviations between the simulation and experiment were greatest. The feature vector difference, defined as the Euclidean distance between the pairs of model and experiment feature vectors,
32
was used to determine when the deviation was greatest. It was found that the deviation between the model and experiment increased as the displacement was increased and that it was consistently higher for the first principal strain, shown in Figure 7. Thus, quantitative validation was performed using the first principal strain only. Increase in feature vector difference due to greater uncertainties at higher tup displacements for both first (red) and second (blue) principal strains. The trends are indicated by a pair of linear lines-of-best-fit (LoBF).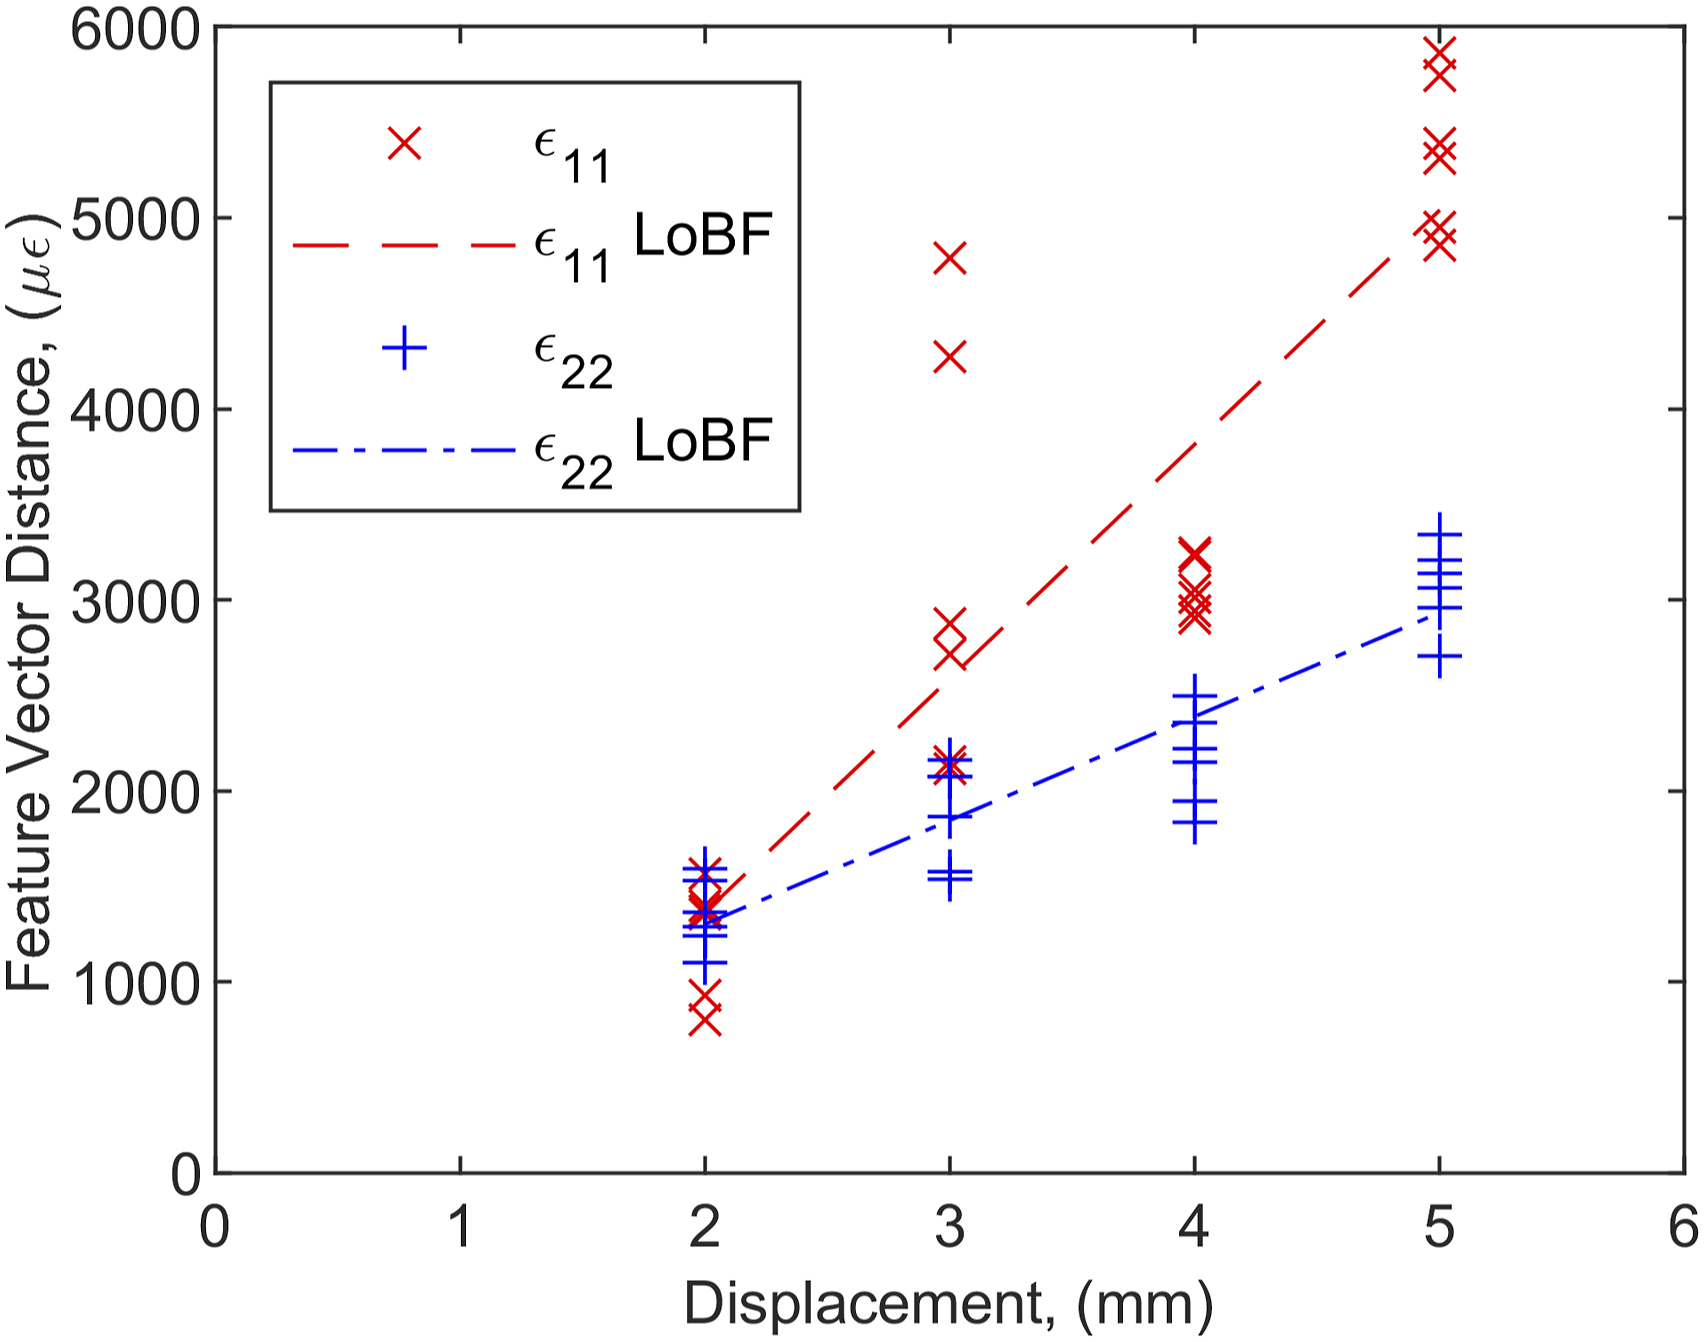
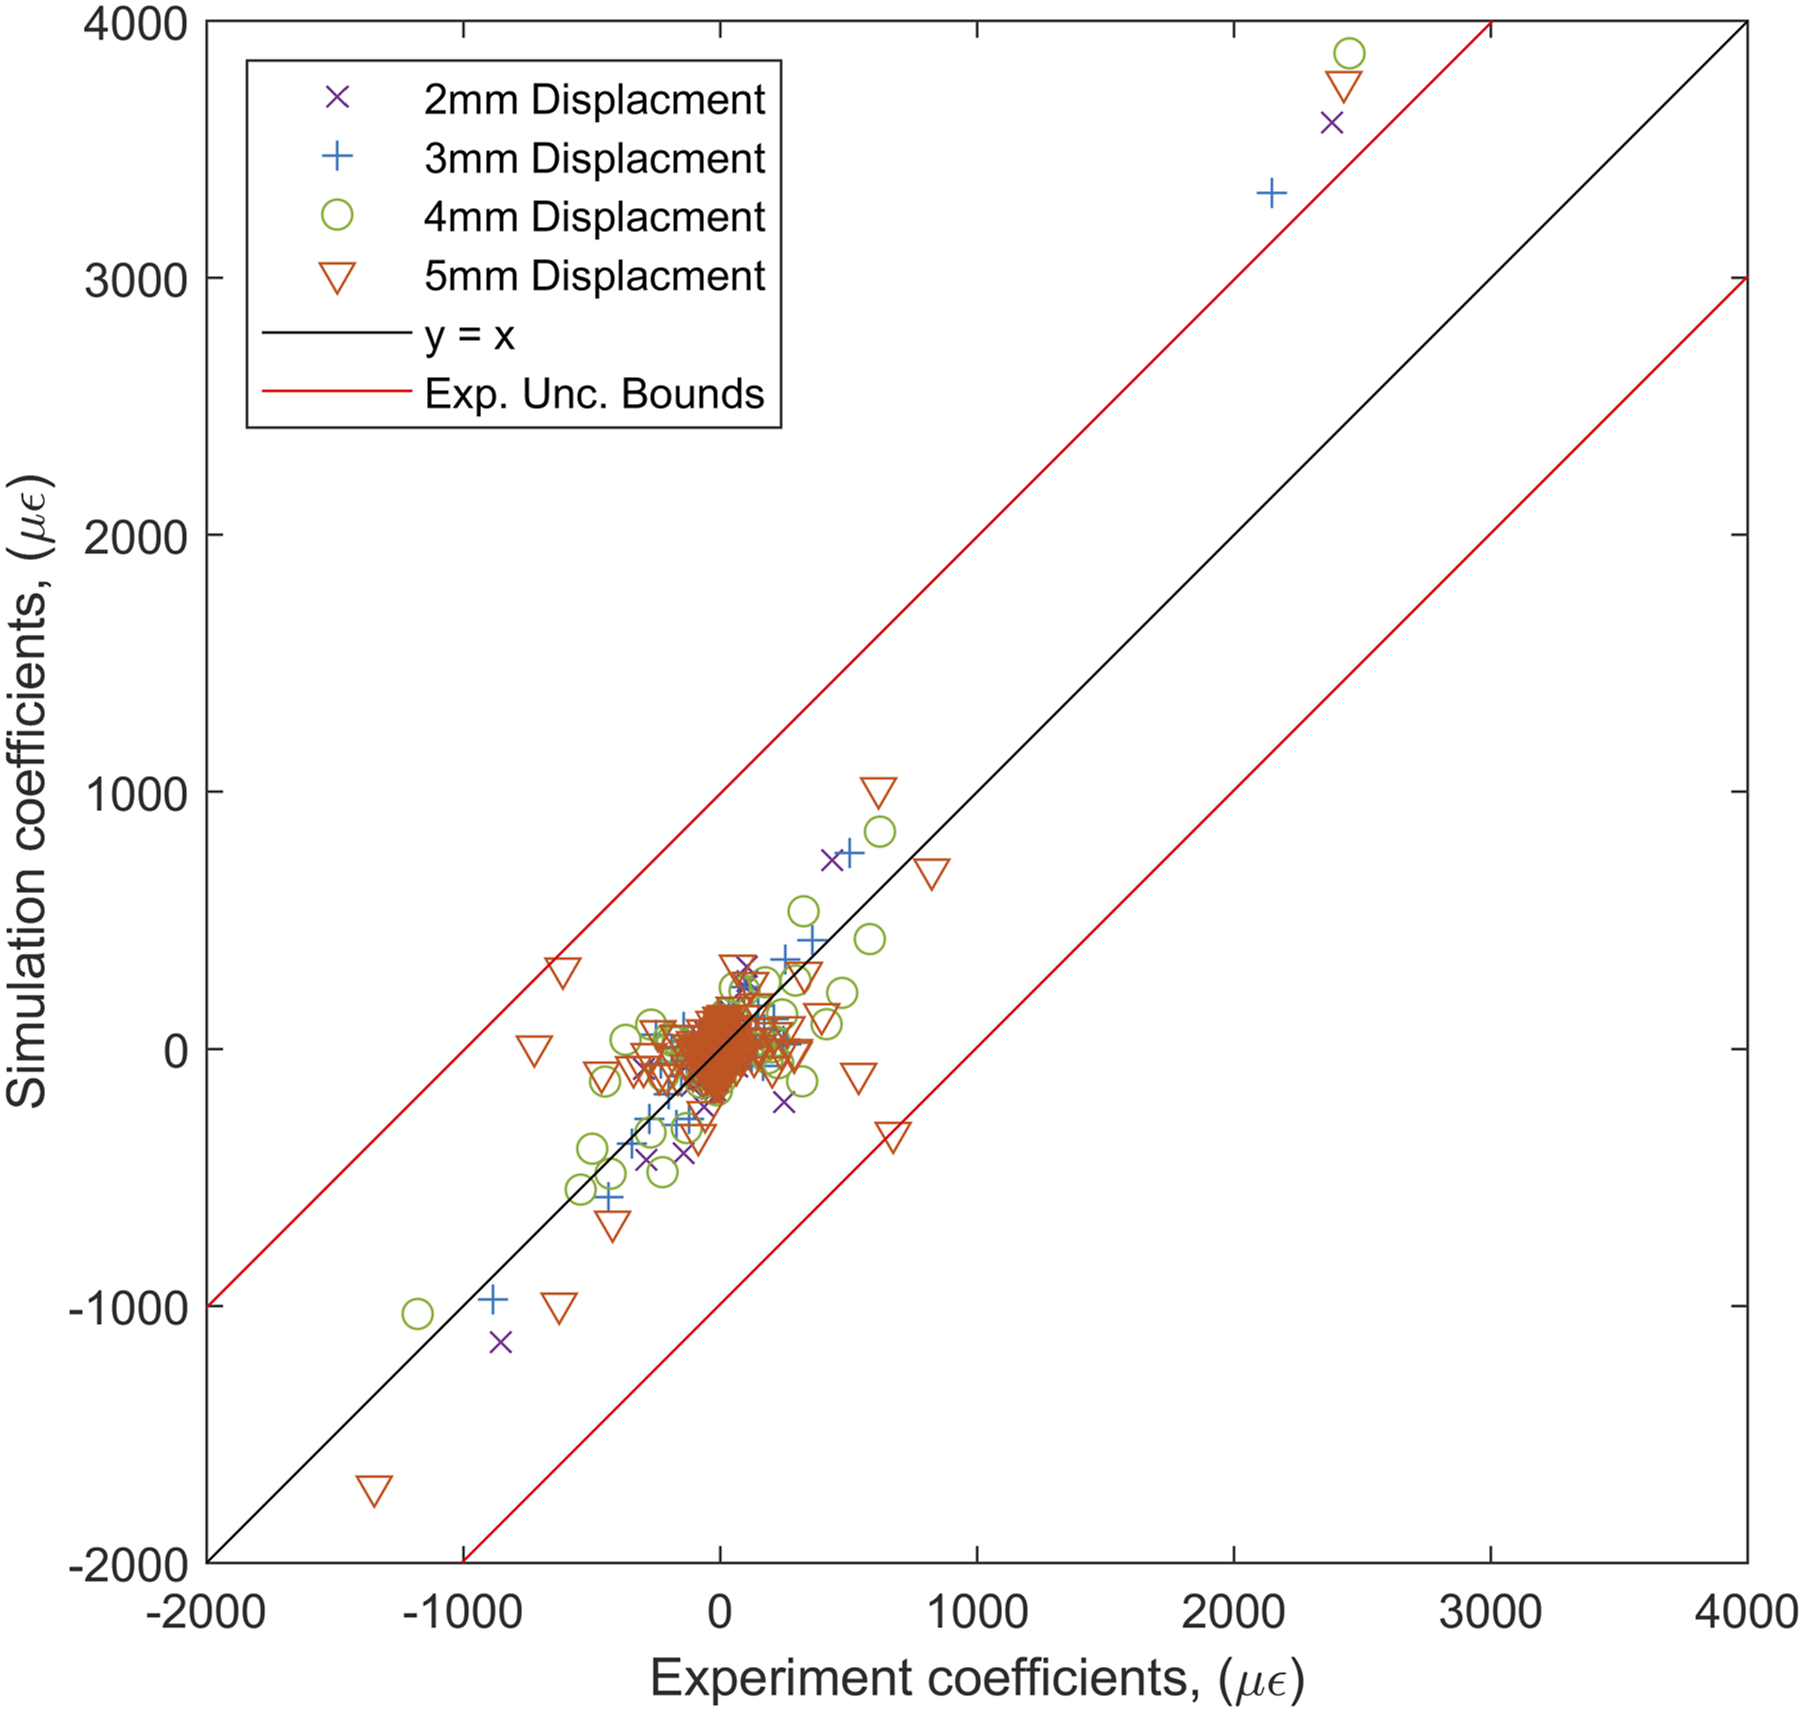
Two approaches to validation were used in this study. The first provides a simple binary output regarding whether the deviation of the model predictions from the experiment can be explained by the measurement uncertainty of the DIC system. This approach is described in Ref. 10 and involves plotting the pairs of coefficients from the two feature vectors to be compared against each other, shown in Figure 8. If each coefficient in the simulation feature vector is the same as the corresponding coefficient in the experiment feature vector then it would lie on a straight line, Validation diagram showing how coefficients are more scattered within the expanded uncertainty (Exp. Unc.) bounds as tup displacement increases.


To quantify the deviations in relation to the expanded uncertainty a validation metric has previously been defined.
33
In this study the metric was implemented by first normalising the errors between the experiment and model coefficient pairs as,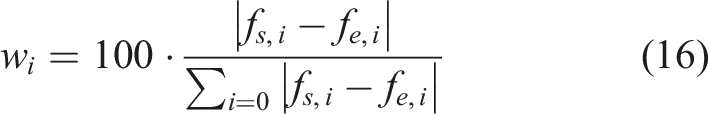
Next, the expanded uncertainty was similarly normalised to obtain a threshold value,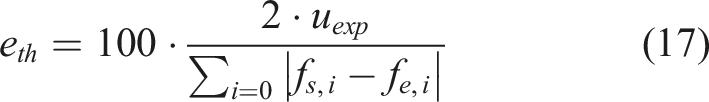
Finally, the normalised errors that are less than the threshold given by equation (16) were summed. This results in a scalar value that is 100% if every normalised error is less than the threshold indicating that the simulation is valid given the measurement uncertainty of the DIC system. For this study, the validation metric was calculated for each data pair, i.e. 24 times, and was found to have a median value of 88.9%. The interquartile range, indicating the spread of values of the metric, was 9.2%.
Discussion
Whilst the model was validated when considering some of the simulated instances of the impact, the differences for the majority of instances were greater than can be explained by the measurement uncertainty of the DIC system. This is to be expected as the complex microstructure of composite materials and the variability in impact behaviour means that it is challenging to accurately simulate what will happen to a specimen. The variability in the impact behaviour of composites is well reported and typically stems from the material microstructure as well as slight variations in impact angle and velocity. 34 Thus, the intention of this study was not to generate a highly complex accurate model, but to see how well a simplified model based on cohesive zone and brick elements can simulate typical damage creation in composites. Such a model will allow scaling up to layered composite thin-walled and medium-thickness shell structural elements in the aerospace industry, enabling the simulation of low-velocity collision problems of foreign object damage. Thus the approach used here would only be suited to simulating impact energies that result in barely visible impact damage. Higher velocity impacts would require reducing the interaction time and thus necessitate accounting for wave effects in the stress-strain state propagation through the layered shell. This would mean solving the transient problem or the explicit dynamic problem. Under these conditions, further research and the creation of appropriate non-classical rheonomic CZM models would be required. Overall, experimental data show that the simulation reliably estimates the extent of crack formation and delamination using the semi-inverse modelling method even with reduced interaction time, as material stiffness increases with strain rate at least in the initial deformation stage. The complexity of a model can be set at any level, with the most basic being simulating the whole laminate as a single layer of orthotropic bricks. Recent techniques such as extended finite element models allow damage propagation to be simulated at the fibre length scales however are computationally intensive. 35 The mechanisms that are simulated can also vary. In this study inertia and strain rate effects have been neglected as the impact velocity was just 3.773 ms−1, well below the velocity at which dynamics affect damage propagation. 34 Specifying the required complexity of a model is often based on maximising it based on the computational resources available. The approach used to characterise the performance of the model in this study allows an optimal balance between model complexity and confidence in model results to be determined.
The validation metric demonstrates that all strain fields simulated by the model are close to the measured ones. This suggests that by making small modifications to the model it may be possible for it to be fully validated. There are a lot of potential areas where the model could be modified, such as reducing the number of assumptions. For example, it was assumed that transverse shear and compression stresses at the contact boundary are equal. These stresses are considered here because they are complementary to the internal force components in the tangential and normal linear displacements relative to the interface surface, respectively. The rigid layer contact was achieved through interface elements with CZM behaviour in a zero-thickness layer in the delaminated area. It was assumed that in some local areas of the layer, interface elements provide one-sided contact between the rigid layers based on a bilinear model: a linear trend between the linear displacements and complementary internal force stress factors unfolds and continues to decrease linearly to zero. An approach to improving the cohesive zone is through the possible replacement of the bilinear failure model with an exponential one.
Regarding crack formation in the quasi-homogeneous layer, it should be noted that the influence of tangential stresses through the application of the mixed debonding interface is not obvious. Although it requires further research, the deformation state shows the minor influence of such stresses on average and thin (in terms of shell class) layer thicknesses. The expected impact may concern local stability losses of a limited edge area due to the explanation of the cracked face surface.
For obtaining the elastic properties for the simulation, an approach based on experimental measurements and laminate theory was able to obtain good material properties. However, no such approach exists for material properties associated with damage propagation. Determining and experimentally refining the constants of the CZM and debonding interface models is thus needed for a more accurate simulation. These vary in each experimental sample, and the individual determination of such constants should significantly refine the simulation results, especially with a developed deformation pattern. Changes to these constants by small amounts could yield approximately similar stress-strain states and crack lengths, allowing for an upper-bound estimate of the maximum strength of laminate constructions.
The work described in this study is the confluence of two highly complex efforts. The high-speed measurements capturing the strains on the rear surface of a specimen during impact are non-trivial to obtain due to the expense of the measurement systems involved and test speeds. Similarly, due to the complex mechanics involved under impact of composites, there are a lot of potential different ways of modelling the impact event. By utilising these experimental measurements, it is easier to trial different approaches to modelling composite impact and determine the best approach whilst minimising the computation power required. Once such a modelling approach is found and validated, it is then possible for the model to be modified to more closely represent structural details which are too challenging to experimentally impact.
Conclusions
Ensuring impact tolerance of composite materials is essential for the application of laminates in aerospace and clean energy generation structures. However, exploring the damage behaviour of composite laminates under impact is a highly challenging procedure requiring substantial effort from the modeller as well as computational resources. In this study quantitative validation has been used to confirm that simplified modelling schemes can predict the damage behaviour of composite laminates during the early stages of impact events. A set of six asymmetric carbon fibre reinforced laminate specimens were manufactured and then impacted whilst their bottom surface was monitored using a high-speed digital image correlation system. The same laminates were modelled using finite element analysis to yield predictions of the first and second principal strain fields during the impact. Orthogonal decomposition was used to quantitatively confirm the validity of the model predictions during the early stages of the impacts, with the differences between model and experiment increasing as the extent of damage created in the specimens increased. By confirming the extent of validity for the simulations it is possible to identify the simulation parameters that need refinement. This makes it simpler to achieve the right balance between model fidelity and computation time, helping to reduce development costs for new composite structures.
Footnotes
Acknowledgments
This work is the result of a visit by Dmytro Zhyhylii and Oleksandr Pozovnyi to the University of Liverpool in 2023 as part of a Universities UK International’s (UUKi) UK-Ukraine R&I twinning grant funded by Research England. We are grateful to Professor Igor Potapov of the University of Liverpool for his work in securing the grant.
Author Contributions
Declaration of Conflicting Interest
The author(s) declared no potential conflicts of interest with respect to the research, authorship, and/or publication of this article
Funding
The author(s) disclosed receipt of the following financial support for the research, authorship, and/or publication of this article: Visit by Dmytro Zhyhylii and Oleksandr Pozovnyi to the University of Liverpool was funded by Universities UK International’s (UUKi) UK-Ukraine R&I twinning grant funded by Research England. Eric Y.H. Chai received a scholarship from the University of Liverpool and National Tsing Hua University dual PhD programme.
Data availability statement
Data available on request.