
Abstract
Woven composites are widely used across various applications, characterized by the warp and weft tows that intersect perpendicularly to form a weave pattern. Often, the weave architecture is neglected during analysis. This study explicitly models the weave pattern and the undulation of the tows using the NASA Multiscale Analysis Tool, incorporating statistical constituent material properties and measurements of unbalanced composite microstructures. Experimental data and multiscale modeling results were compared for carbon fiber composites manufactured with different tow sizes in the two in-plane directions, resulting in four distinct unbalanced reinforcement patterns. Multiple tensile tests were conducted for each pattern. Using statistical input data, 1000 random model instances were created for each unbalanced composite, predicting distributions of the composite’s Young’s modulus and tensile strength. The predictions demonstrated good agreement with test data, highlighting unique aspects of the modeling approach.
Keywords
Introduction
Yarn based textiles can be broadly classified into three categories, namely meshed yarn systems (e.g., knits), crossed yarn systems (e.g., weaves and braids) also known as crimp systems, and layered yarn systems also known as non-crimp systems. Crimp refers to the waviness or undulation of the yarn within the textile. Crimping may also refer to the filament waviness in a yarn, which usually provides its unique elasticity and bulkiness in a textile, for example in wool. In this study, undulation is considered at the yarn scale. A yarn is made of many filaments, e.g., a T700SC-24000 carbon fiber yarn from Toray has 24000 carbon filaments. A yarn is also called a tow.
Woven composites consist of a woven fabric (see Figure 1) which is embedded in a suitable resin system. A weave consists of two or more tow system that are perpendicular to each other, called the warp tow and the weft tow. The crossing of these tows creates a weave pattern or a weave texture. Woven fabric, with plain weave pattern.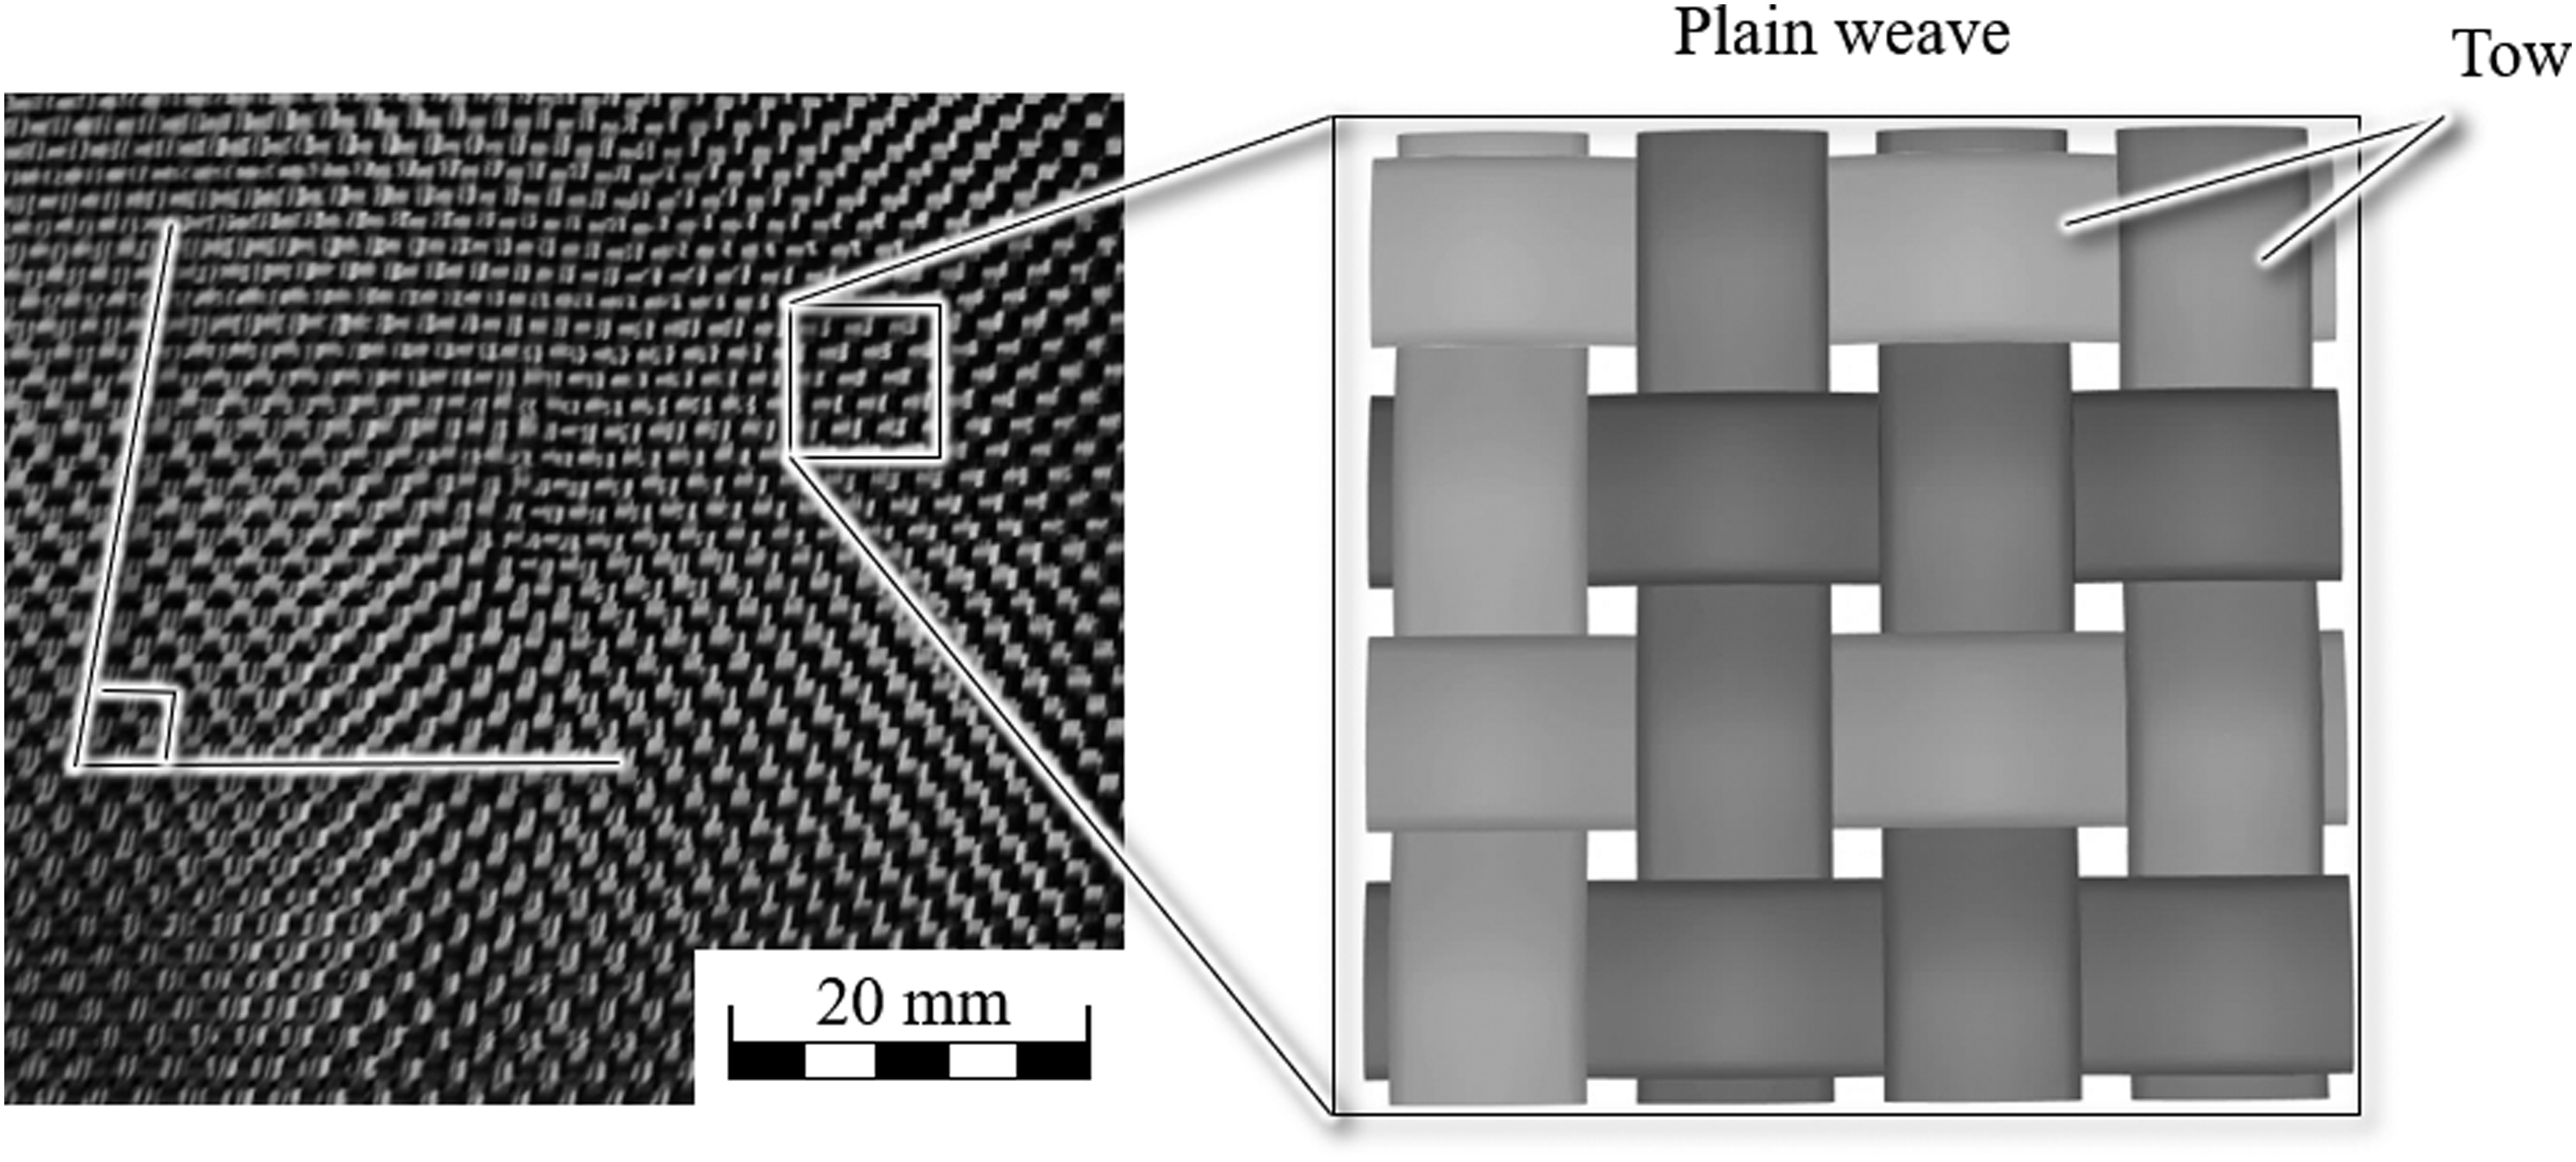
Three common weave patterns are plain, twill and satin weaves. 1 Based on these, various woven structures can be designed. They can be either two-dimensional or three-dimensional fabrics. In a 3D-weave, the yarns not only interlace in the plane but also in the thickness direction, giving the material thickness and a true three-dimensional structure. Two-dimensional weaves are most commonly used, primarily due to their low cost of manufacturing and ease of application. Some examples of applications include wind turbine blades, aircraft wings, fuselages, and airbags. Typical characteristics of a weave are the orthogonal tow direction of the weft and the warp tows as shown in the Figure 1.1,2
Analysis of woven composite has been the subject of research for many decades and continues to be an active area in the field of composite materials.3–19 Various aspects have been investigated, including their mechanical behavior under different loading conditions, manufacturing process, and failure mechanisms. A variety of models and software have been developed for this purpose (e.g., TexGen, WiseTex, TexCAD). For simple weave geometries, these software tools provide streamlined solutions.
As indicated by Prodromou et al., 12 analysis techniques available in the literature can be divided into four major classes: (1) analytical models, mostly based on lamination theories and on the assumption of isostrain or isostress.7,8,16,18,20–22 Byström et al. compares some of the analytical models and their applicability to predict the effective elastic properties. 23 Ayranci and Carey extended the analytical models from flat woven fabric to analyze 2D braided tubular composites, accounting for the component curvature 24 ; (2) inclusion models, which are based on mean field theories; 25 (3) voxel method or method of cells26,27; (4) Finite Element Method (FEM) for more complex modeling and analysis using micromechanical failure analysis.17,28–30
Increasing the modeling efficiency means minimization of computational cost (time and processor power), while maximizing model fidelity. Analytical techniques are more efficient, but falter when trying to capture the complex weave geometry and formulate realistic boundary conditions. Hence, most of the analytical models consider an idealized tow cross-section, weave pattern, fiber volume fraction, fiber orientation, and mean property distribution for the analysis. In reality, variation exists across all parameters. 31
The limitations of the analytical techniques are typically addressed by employing more rigorous techniques such as the FEM, which allows for the consideration of the actual geometries and complex loading conditions. To capture the effects at different scales, the FE2 approach32–34 can be applied. This method bridges the gap between different component scales, i.e., the micro scale, concerning fiber-matrix interactions, and the macro scale, concerning component behavior, which is not feasible in the traditional continuum mechanics approach. However, this approach may result in significant computational costs. Furthermore, in the majority of the models, including those using micromechanics, variations in parameters such as the weave geometry and other material properties like fiber volume fraction, filament strength, diameter, modulus has not been accounted for. For progressive failure analysis, the distribution of these properties may have significant influence.
In this study, a distribution of the weave parameters and material properties have been considered as inputs, from which one thousand model instances have been analyzed to obtain predicted distributions of strength and stiffness of test coupons. The focus of this work is the analysis of unbalanced plain weave composite under tensile loading. The term unbalanced means that the two orthogonal fiber directions do not have the same number of filaments. This is explained in in the next section. For the modeling and analysis, the NASA Multiscale Analysis Tool (NASMAT), developed at the NASA Glenn Research Center, was employed.35,36 The multiscale recursive micromechanics (MsRM) framework within NASMAT allows for various micromechanical theories to call each other or themselves recursively. This enables consideration of an arbitrary number of length scales, which is ideal for modeling textile composites. For example, Pineda et al. 37 used NASMAT to obtain the stress-strain response for a 3D-woven composite accounting for manufacturing defects.
NASMAT software enables use of a number of leading semi-analytical micromechanics theories, such as Mori-Tanaka, the Generalized Method of Cells (GMC), and the High-Fidelity Generalized Method of Cells (HFGMC), 38 at any length scale. Though all the three theories can be used, the HFGMC theory is used in this work. GMC’s first-order displacement field lacks coupling between shear and normal stresses. Bednarcyk and Arnold show that this has a significant impact on the predicted properties of woven composites, but it can be largely overcome by using a two-step homogenization approach. 26 GMC/HFGMC as implemented in NASMAT require orthogonal (parallelepiped) subvolumes, making modeling non-orthogonal and curved surfaces more challenging, although parametric HFGMC enables isoparametric subvolumes. 39 HFGMC employs a quadratic displacement field, and thus includes normal to shear coupling, resulting in accurate predictions for woven composites.35,40–42This manuscript is organized as follows. First, the coupon manufacturing and experimental results are presented. Following this, the experimental measurements are used as input for the multiscale modeling using NASMAT. Last, experimental results are compared with the simulation predictions.
Experimental analysis
To analyze the effect of undulation, experiments were conducted at the coupon scale, focusing on tensile loading. The distribution of filament strength and stiffness parameters, filament diameter, tow geometry in a composite, and fiber volume fraction were determined. This section presents some of the critical aspects of the experimental techniques used in this work.
Coupon preparation
A primary consideration for this analysis is the difference in tow undulation in composites with different unbalanced plain weaves. Figure 2 represents two different such weave configurations. Due to the unbalanced weave pattern, where the warp tows have 24k filaments and the weft tows have 12k filaments, the undulation of the 24k tows is smaller compared to the case where both tows are 24k. The loading direction for tensile testing in this work is always the 24k direction. Further undulation angles are obtained by employing 3k tows and mono-filament configurations while maintaining 24k tows in the primary direction. Schematic representation of two weave configurations resulting in a variation of fiber undulation.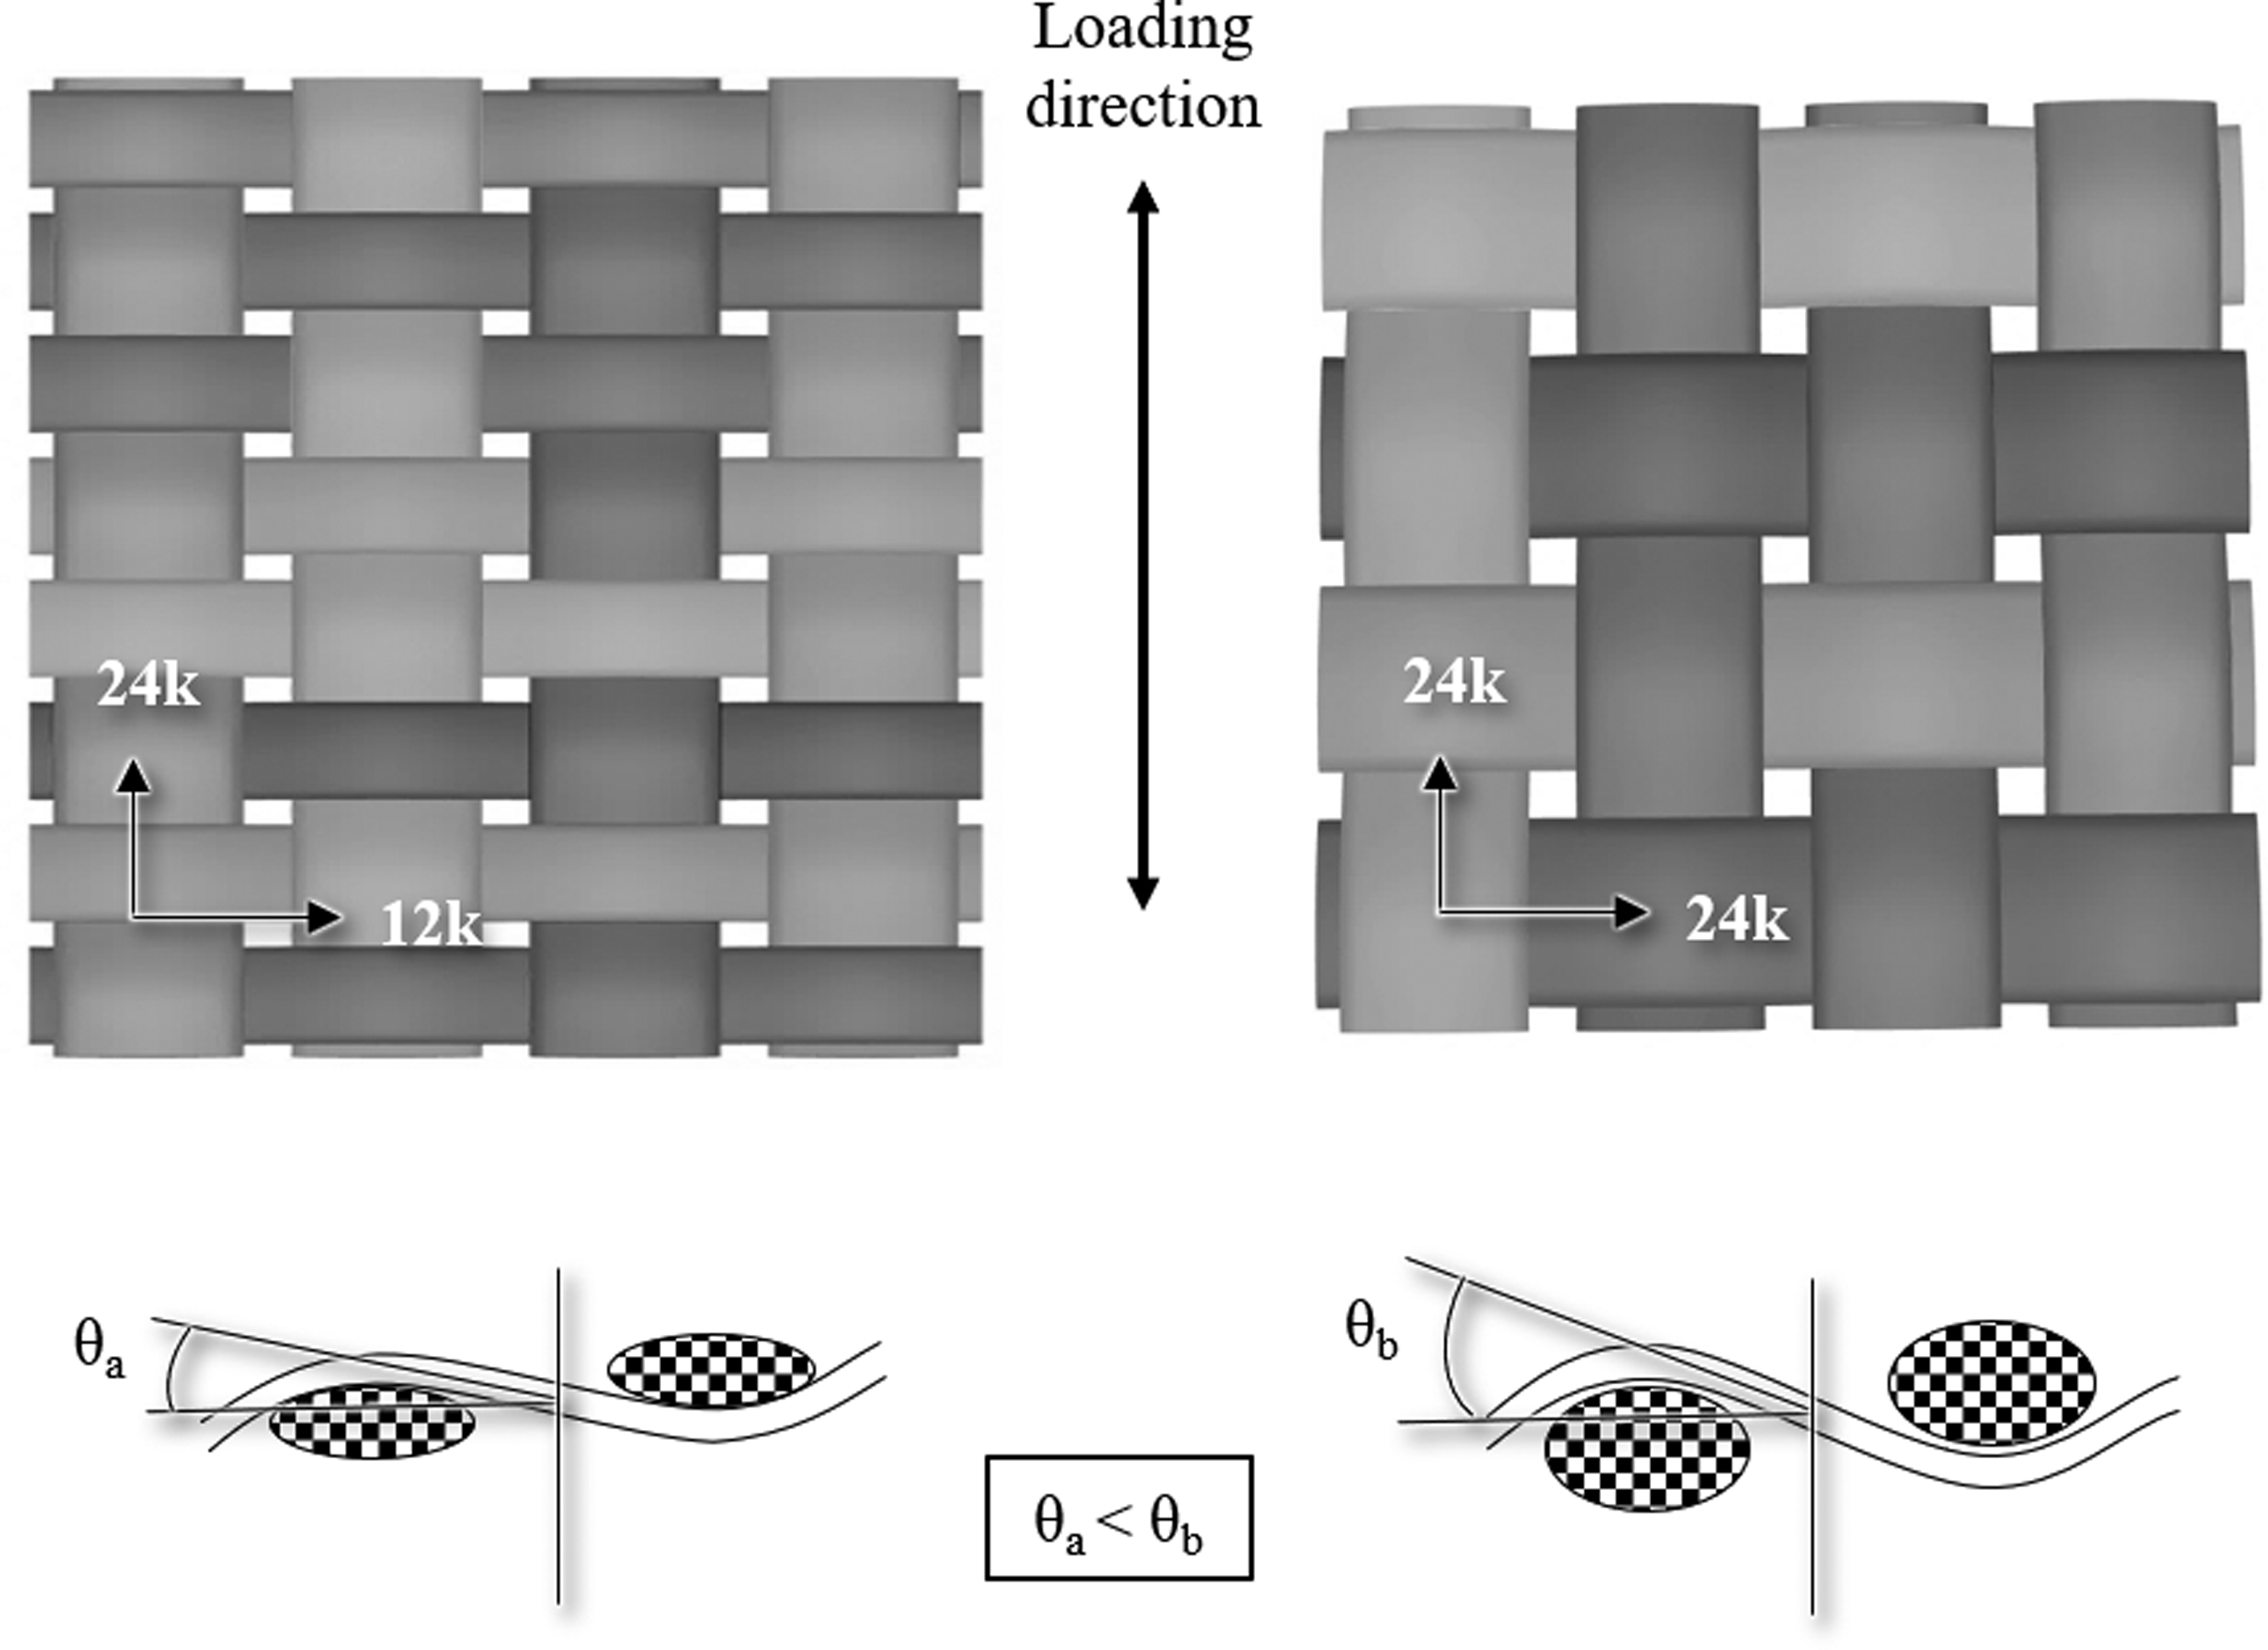
A radial braiding machine (RF-144) from Herzog GmbH, Germany, was utilized for the textile manufacturing process. In a braiding machine, two sets of bobbins move in opposite directions and follow sinusoidal paths, resulting in a braid. The manufacturing process is illustrated in Figure 3. Tubes with a diameter of 75 mm were braided using the selected tow combination. This combination is obtained by using fibers with different linear weights (tex), the details of which will be provided in the subsequent section. The number of tows in both the directions remain constant for all variations. The braiding angle was set to 45°, thereby achieving orthogonality between the tows. The braided layer was secured using appropriate techniques and subsequently cut along its length. The layer was opened, forming a 2D textile layer. Epoxy resin (Hexion RIMR426) was infused using vacuum bagging techniques. Following room temperature curing of the composite panels for a minimum of 10 hours, coupons were cut, and loading tabs were mounted using Araldite® 2-component glue with tempering at 100°C for 3 hours. The width of the coupons was approximately 25 mm. Coupon manufacturing process.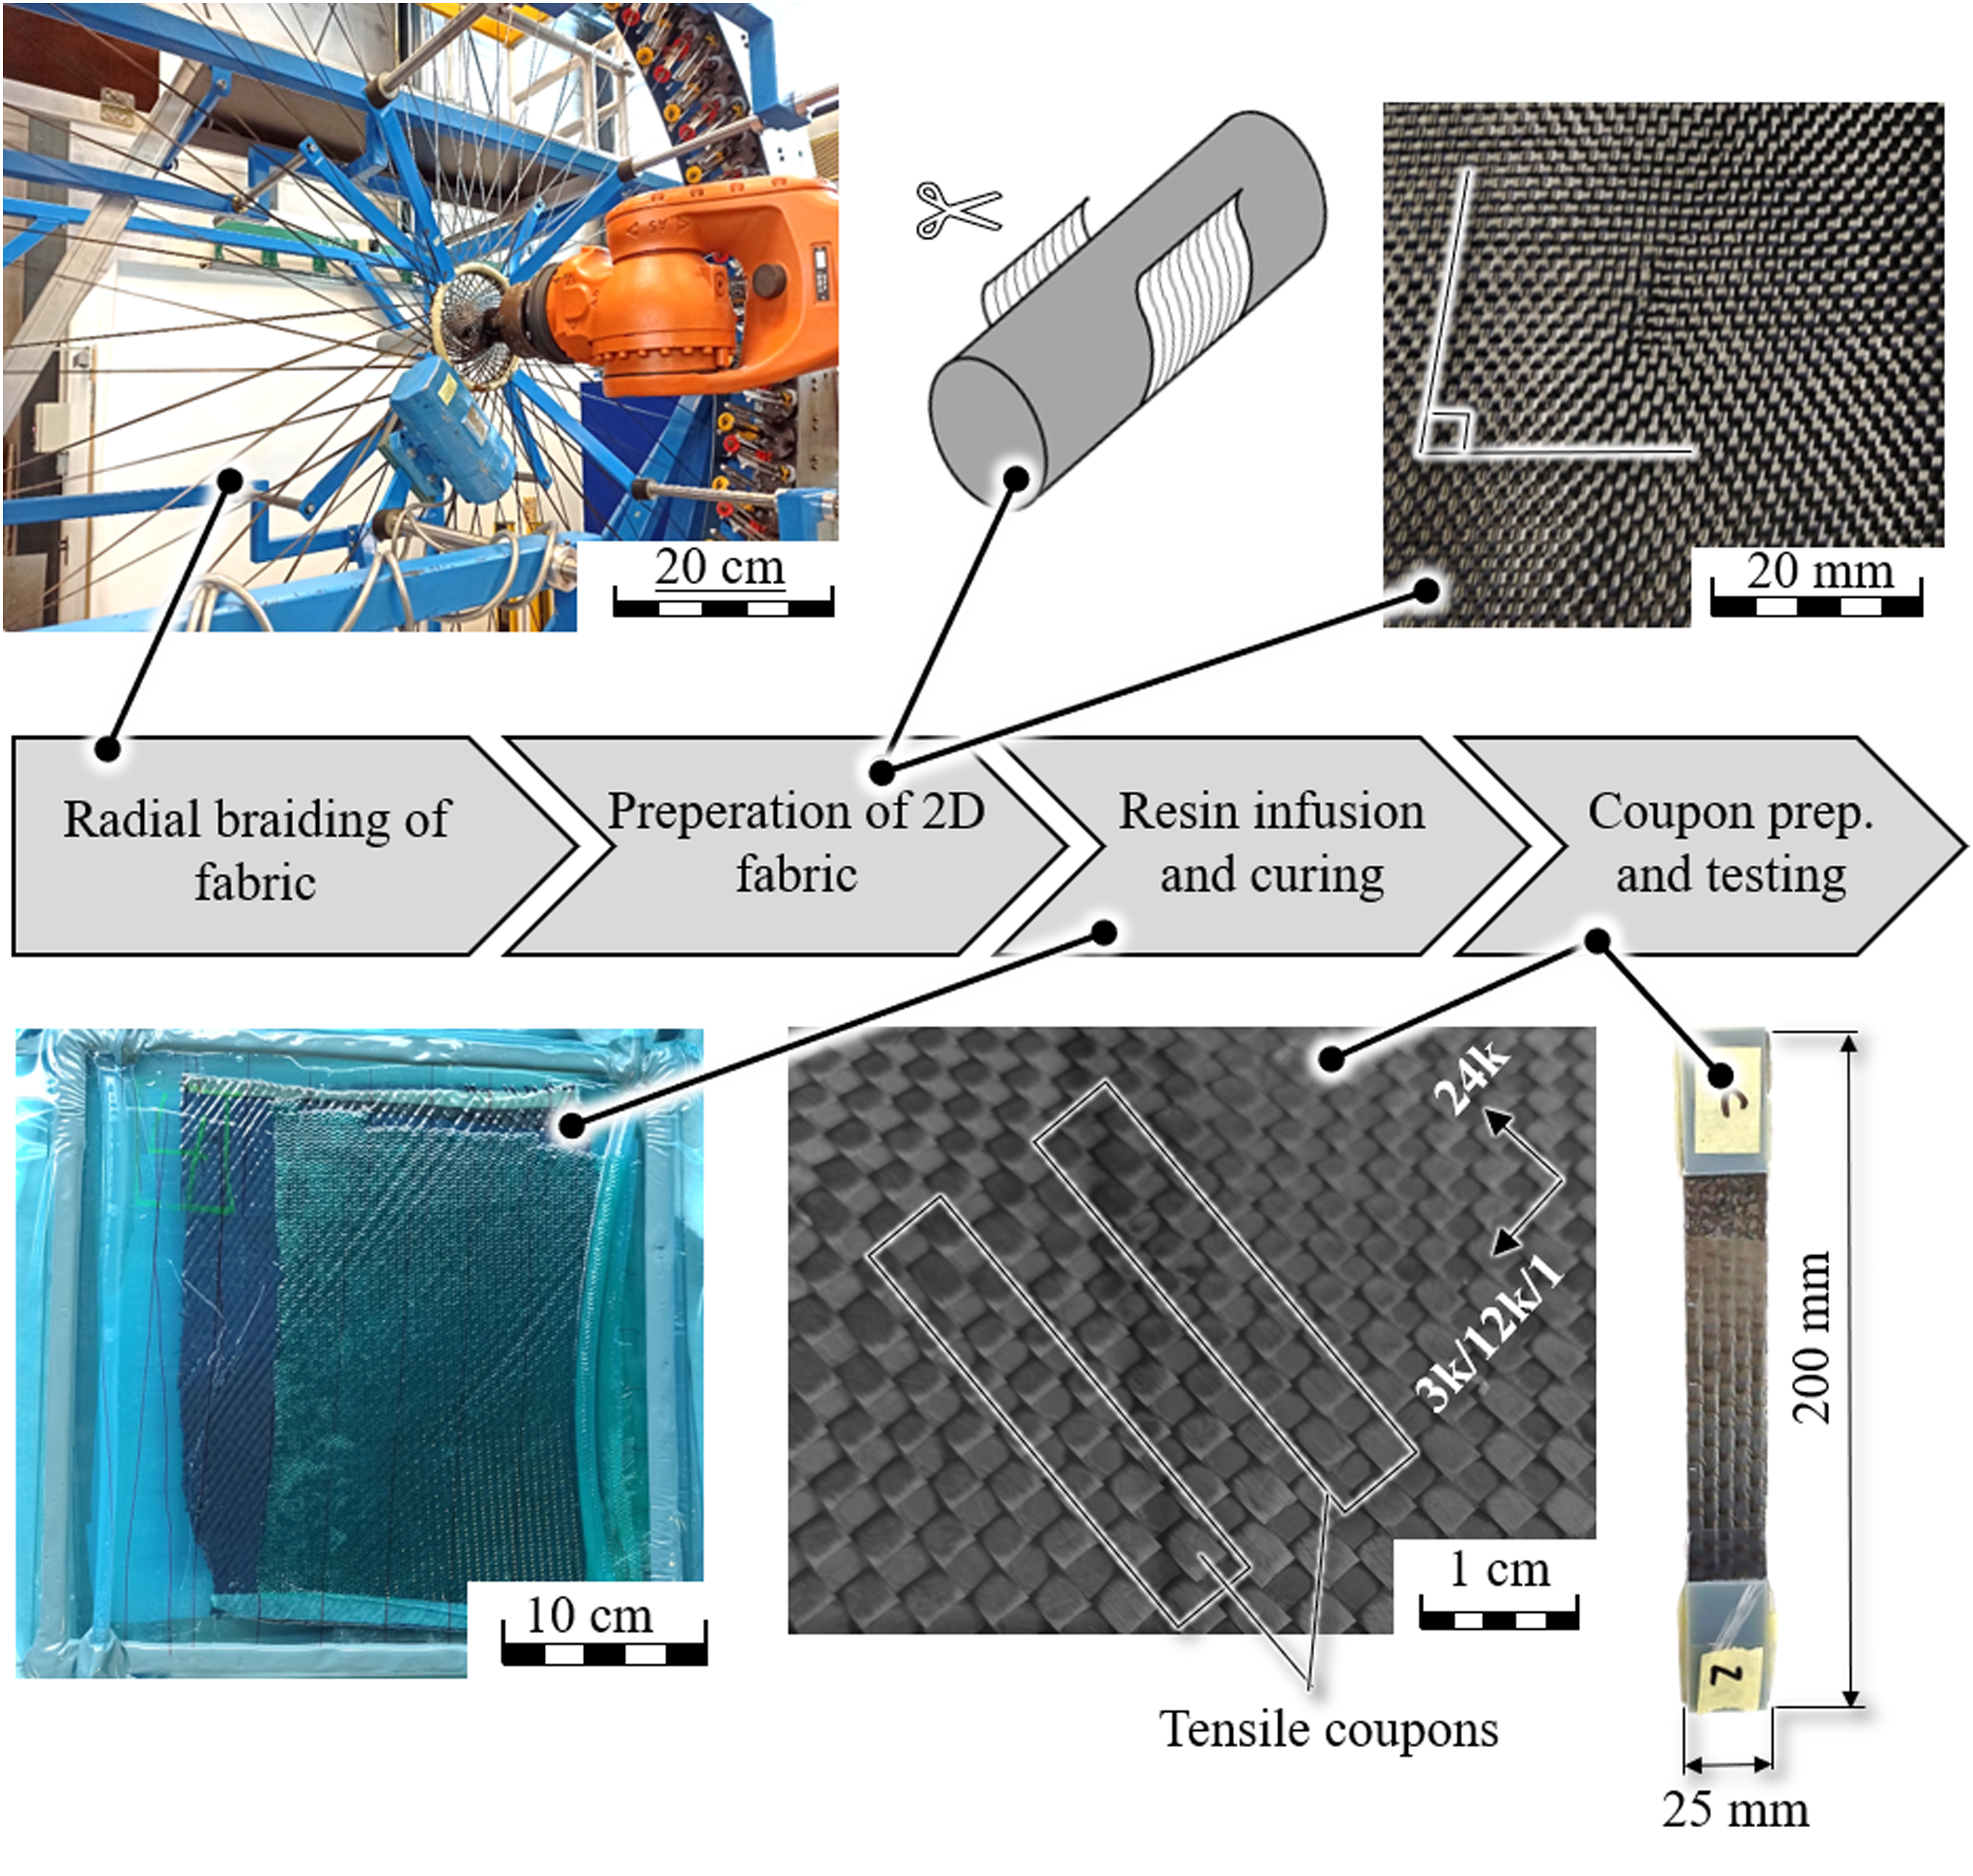
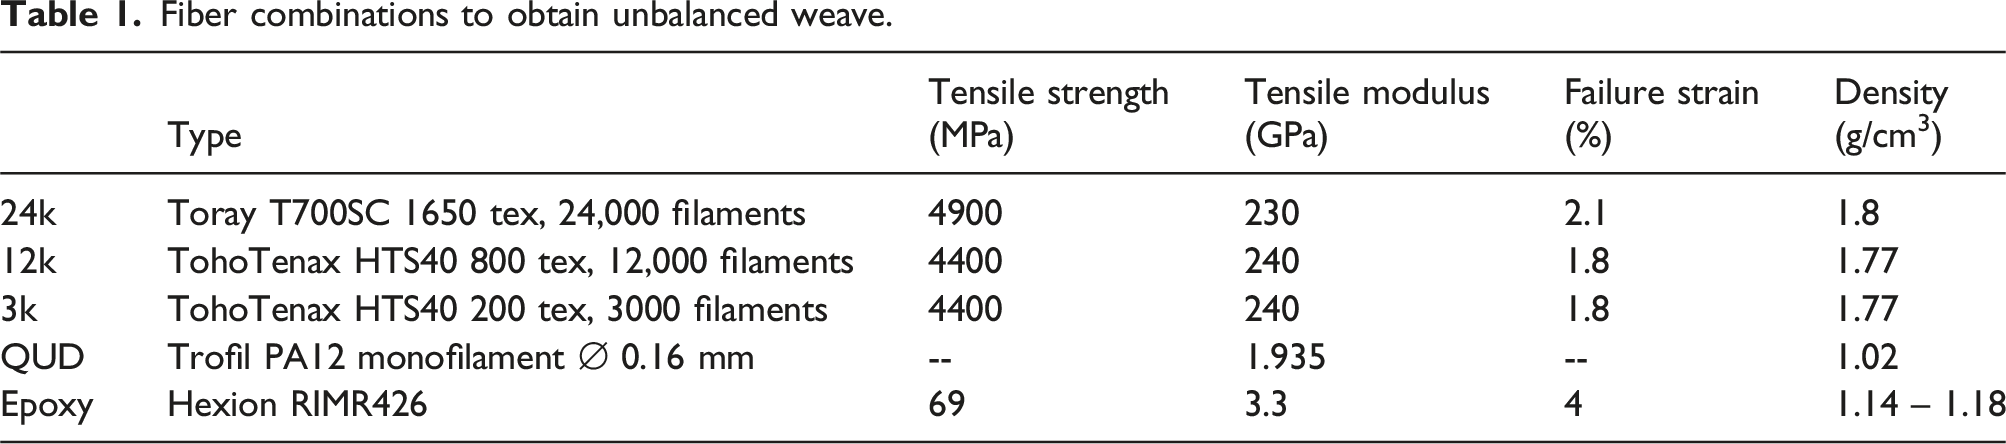
Fiber combinations to obtain unbalanced weave.
Measurement of physical parameters
To quantify the physical properties, such as tow area and post-cure fiber volume fraction, computer tomographic (CT) images were captured, as shown in Figure 4. Using a Python code with the computer vision (CV) library, the cross-sectional images were processed to determine the area fraction of the tow. When the code read each image, it represented the image as a list of row vectors, each vector containing pixel data. The length of each row vector corresponded to the number of pixels spanning the image width, and the length of the list of row vectors matched the number of pixels along the image height. Computer tomographic image of 24k × 24k and 24k x 12k coupon.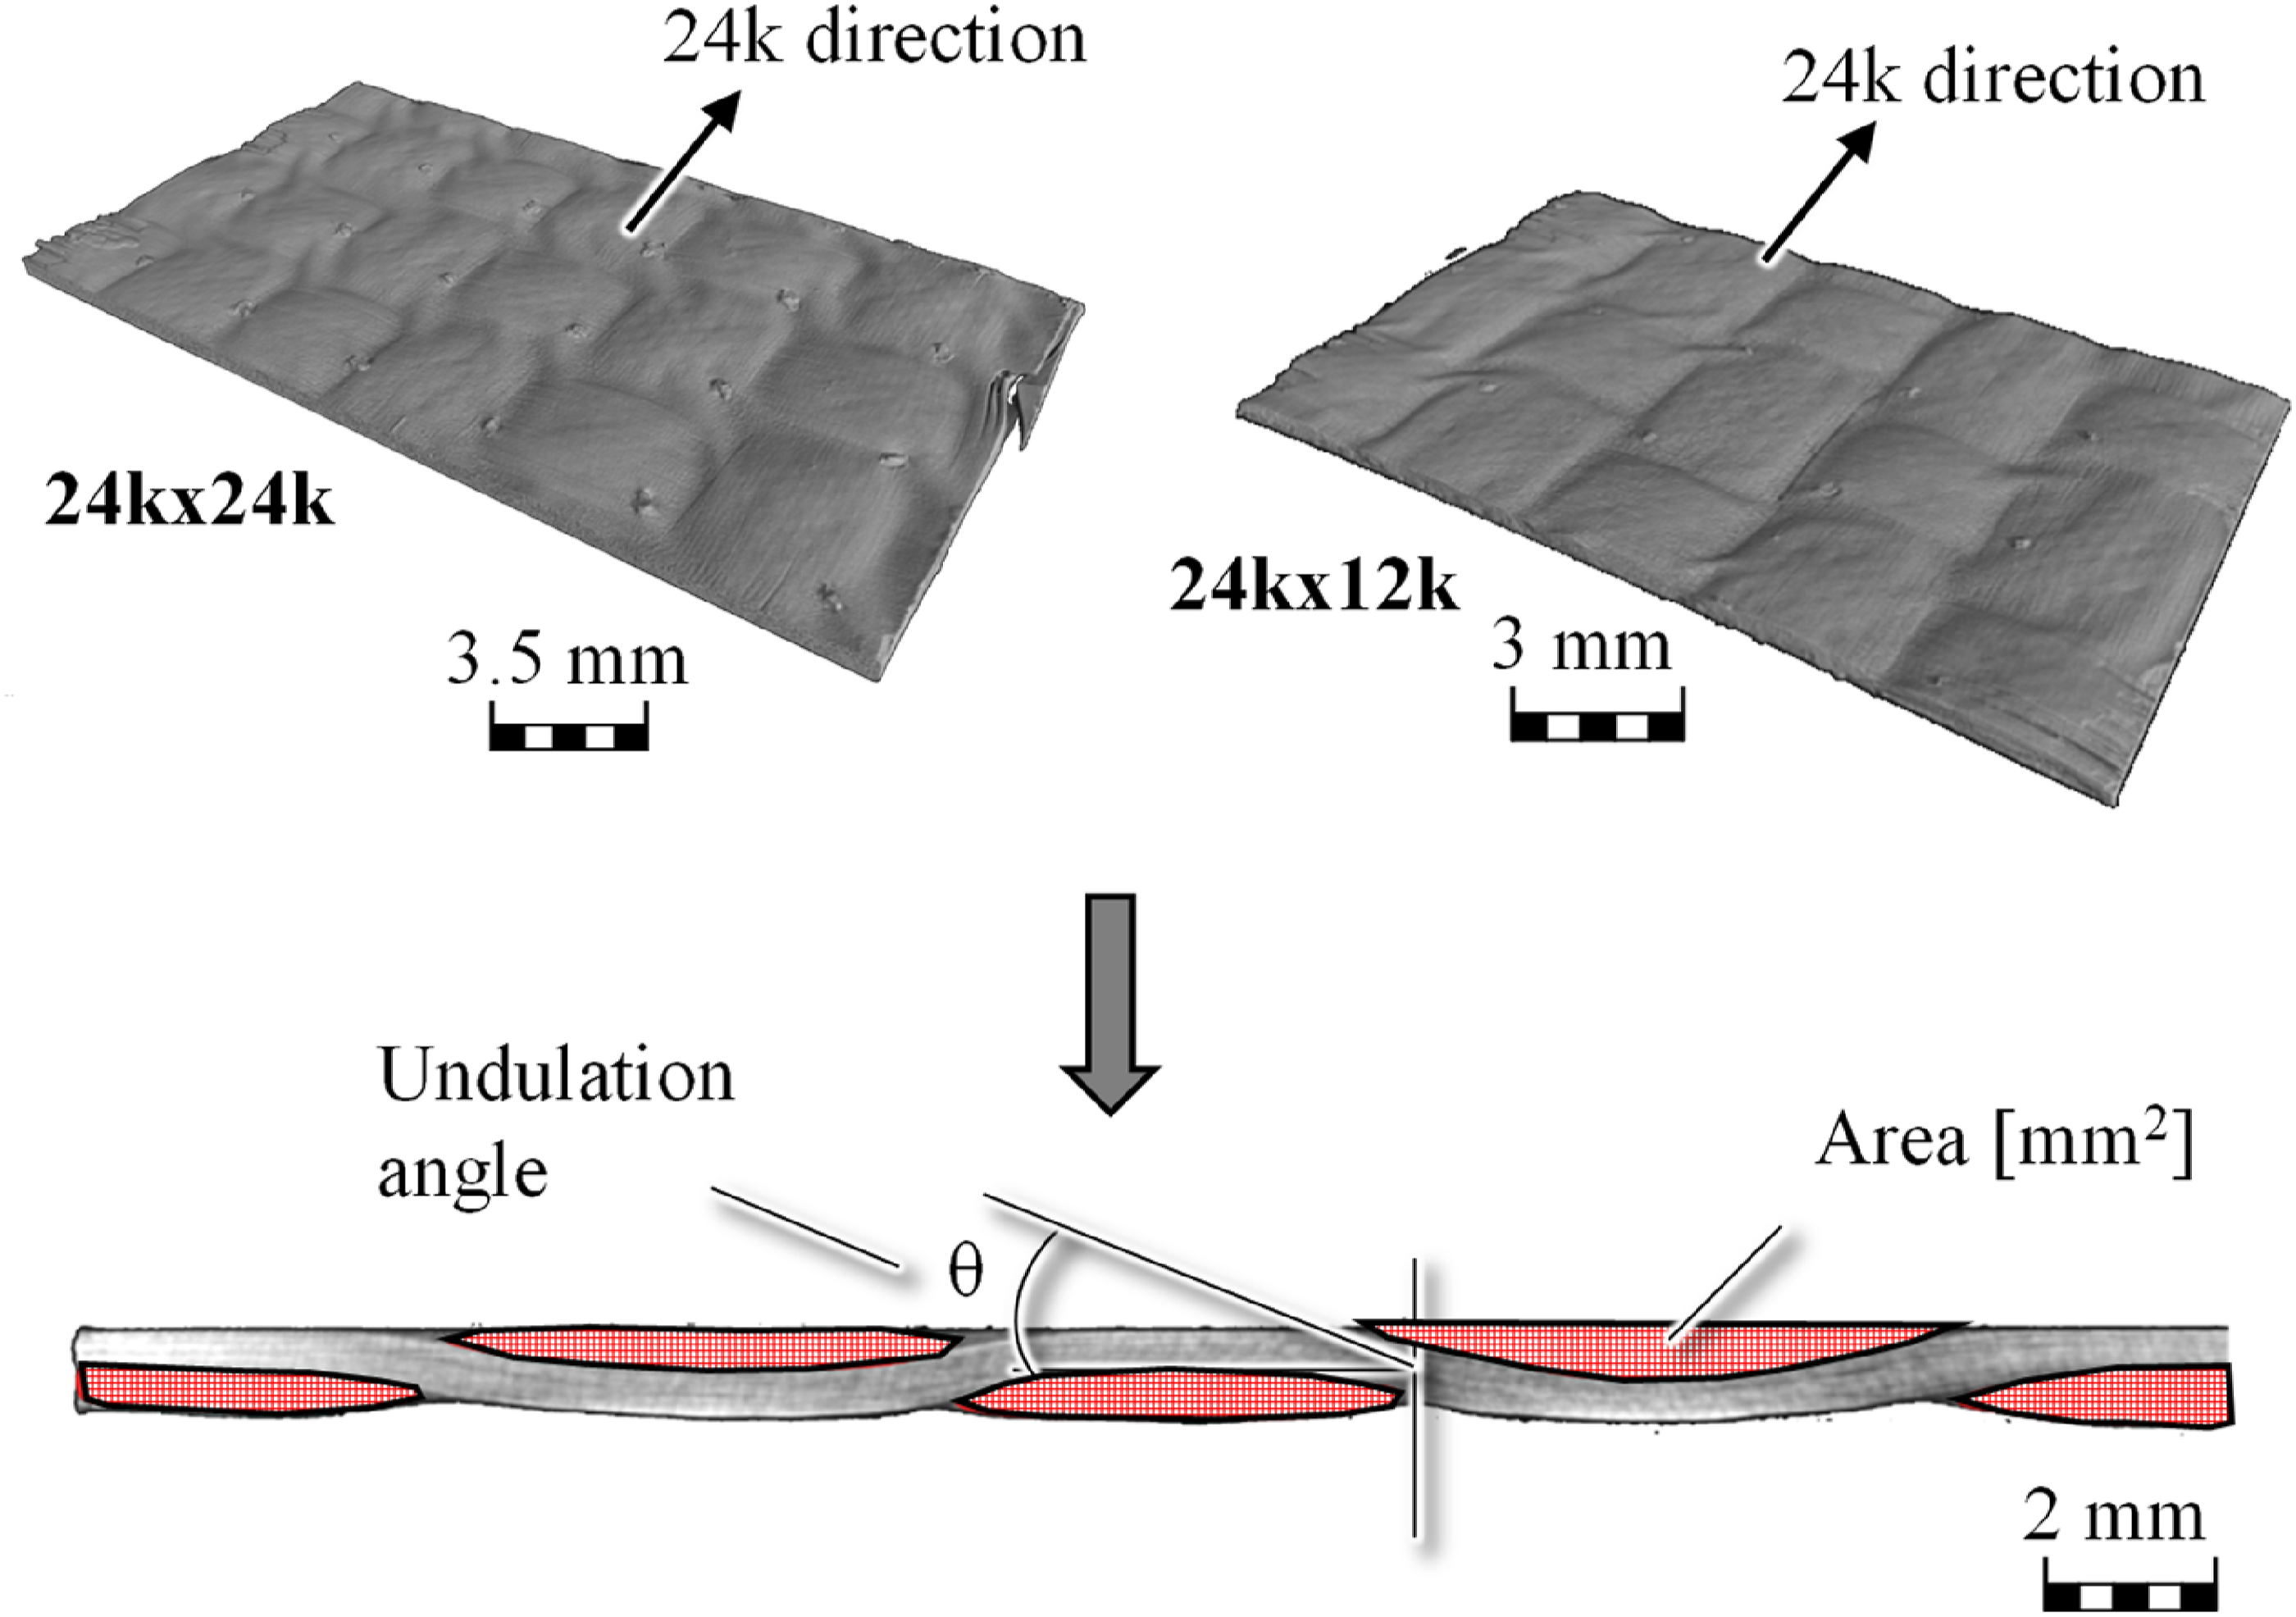
Each pixel was assigned a numerical value representing its brightness level in the greyscale color space. In CT imaging, materials of varying densities are depicted as pixels with different brightness levels. The regions containing both carbon fiber and matrix, the tows, exhibited higher brightness levels. To determine the volume fraction of the tows, the pixels corresponding to brightness levels of carbon fiber/epoxy regions were counted and divided by the total number of pixels in the measured domain. This can be expressed with the following formula: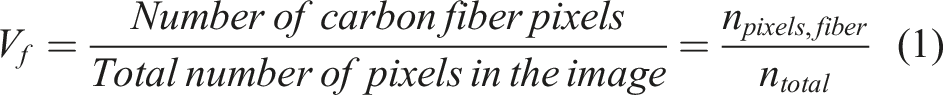
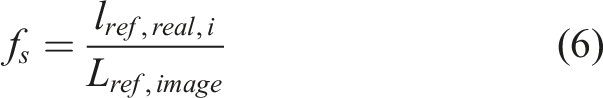
Furthermore, to capture the geometric variations inherent in the manufacturing of each braided specimen, the area of each tow in each image was computed. This was accomplished using the Python CV library, which identified regions of pixels based on their brightness levels and their connectivity to adjacent pixels of the same brightness. Once these regions were identified, the total area of each region was determined by counting the pixels within those regions.
To do this, the area of a single pixel needed to be determined by:
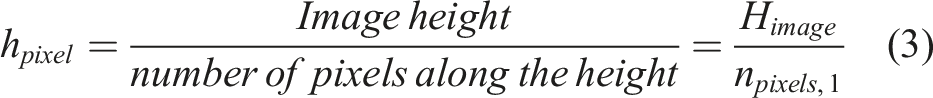
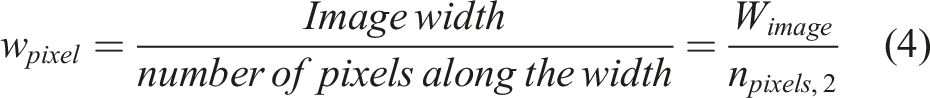
Thus, to determine the area of a specific region in the image, simply take the sum the areas of each pixel in that region: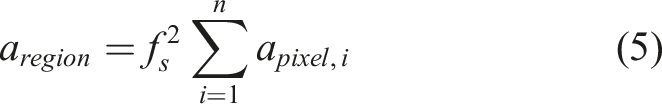
Physical properties of the tow measured using image analysis of the computer tomographic images.
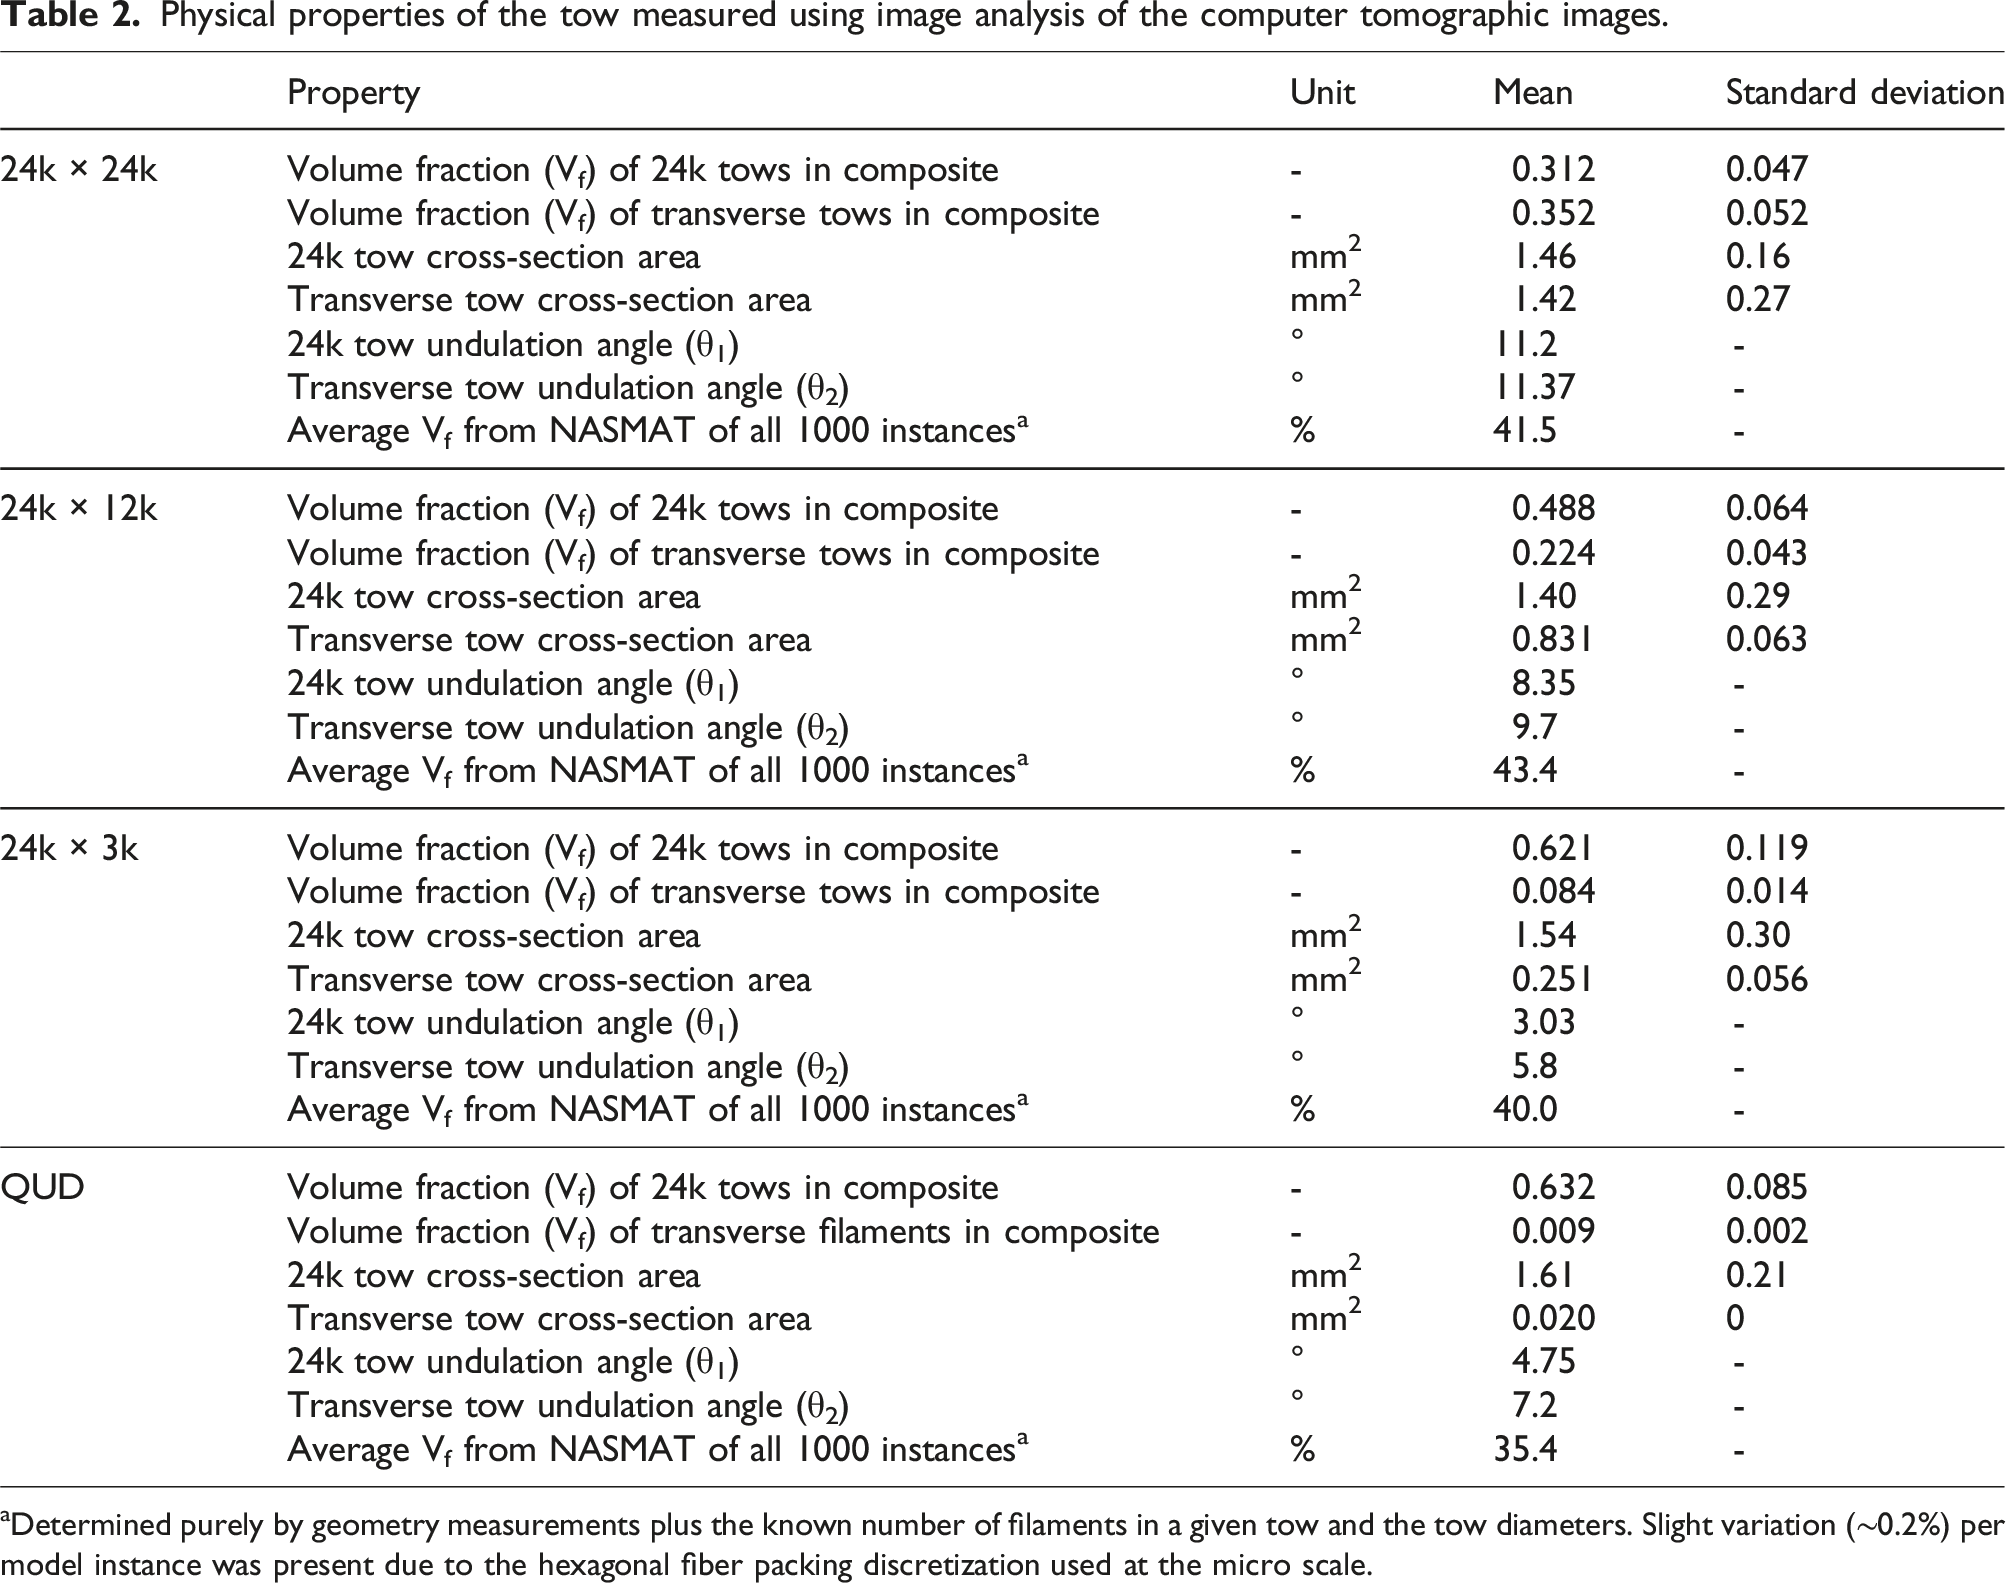
aDetermined purely by geometry measurements plus the known number of filaments in a given tow and the tow diameters. Slight variation (∼0.2%) per model instance was present due to the hexagonal fiber packing discretization used at the micro scale.
Experiments
Experimental analysis was divided into two parts. Firstly, to account for the mechanical property variation at the filament scale, single filament testing on both types of carbon fiber was performed. Following this, the tensile testing results from the unbalance woven composite coupons are presented.
Statistical material properties used in the modeling.
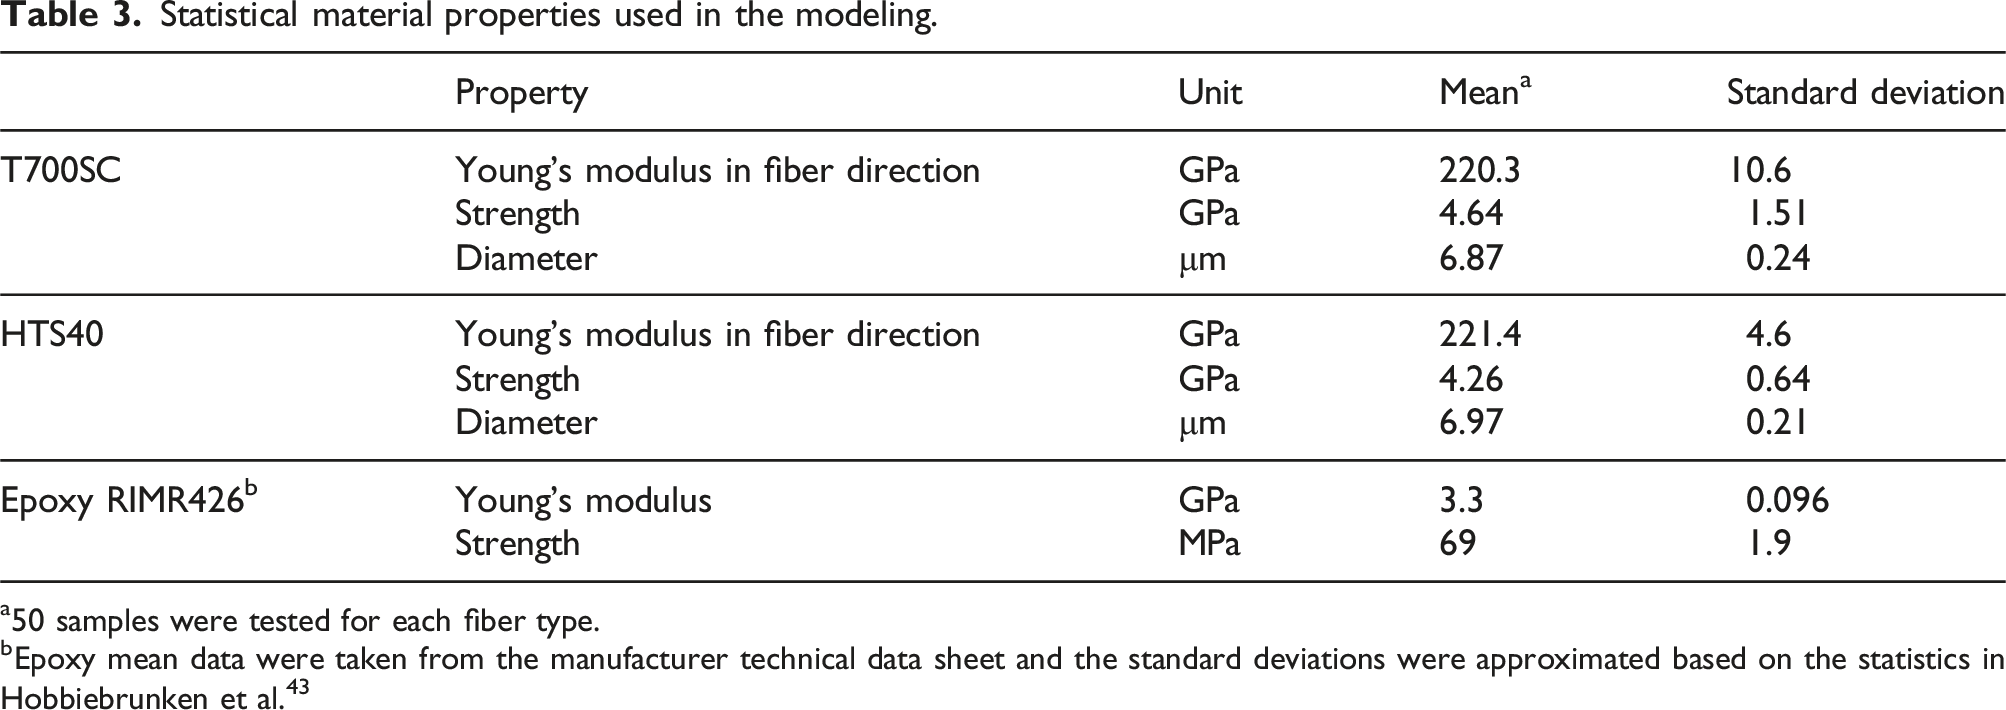
a50 samples were tested for each fiber type.
bEpoxy mean data were taken from the manufacturer technical data sheet and the standard deviations were approximated based on the statistics in Hobbiebrunken et al. 43
Subsequently, the manufactured coupons were tensile tested using a Zwick Z100 testing machine, based on the DIN EN ISO 527-4 standard. A displacement rate of 2 mm/min was used for testing. Displacement measurements were obtained via an optical extensometer. The resulting experimental stress-strain curves are illustrated in Figure 5 and Table 4. All measurements are plotted as grey line and the mean for each configuration is plotted in black. The color contour shows the bounds for each weave type. The results exhibit considerable variations in strength and stiffness across different weave types. Tensile testing results for all the configurations. Tensile testing results.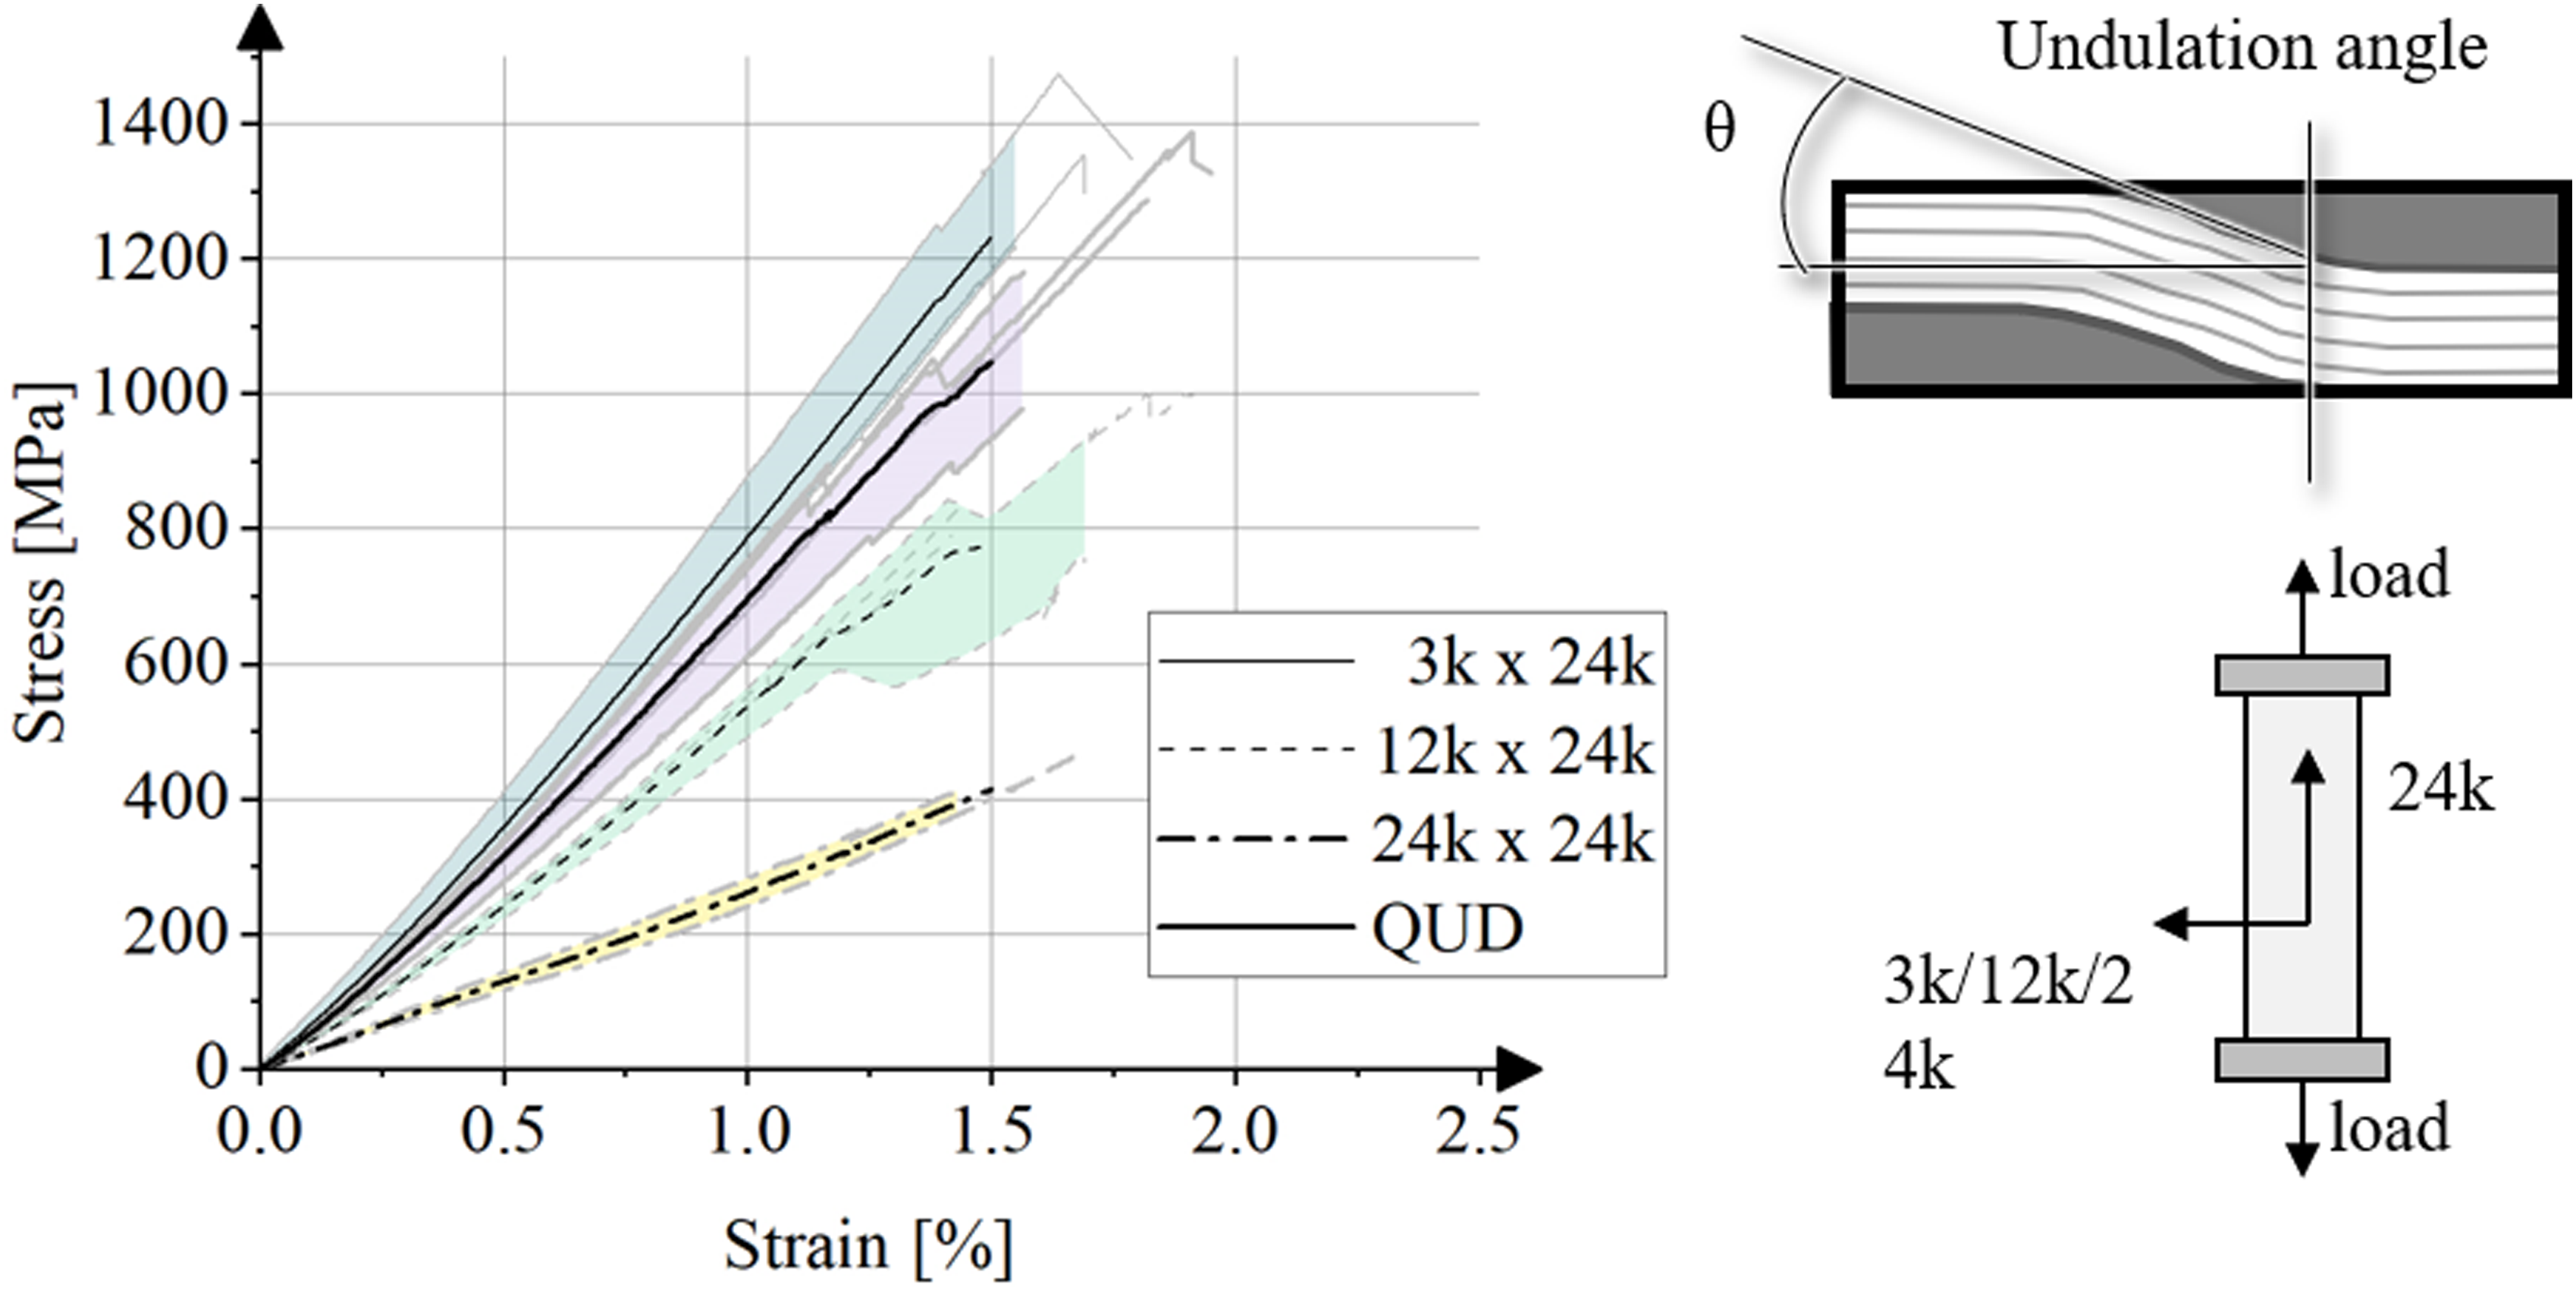
Interestingly, the 3K configuration demonstrates greater stiffness than the UD configuration, which might initially appear counterintuitive. This phenomenon could be explained by the larger thickness of the monofilament fiber compared to the 3K tow, resulting in a larger undulation angle (see Table 2).
It can be observed from Figure 6 that 24k × 24k and QUD have a notable difference in their final failure mechanisms. Due to the interlacing of the fibers in the 24k × 24k, the crack propagation is seen in these fibers. The rupture is seen to occur at the point of undulation of the fibers in the loading direction. One the other hand, in the QUD case, due to the absence of loadbearing interlacing fibers, individual fibers fail at various positions. Debonding of individual fibers is evident. This phenomenon is akin to what one typically observes in filament wound components. Example failure modes in the coupons.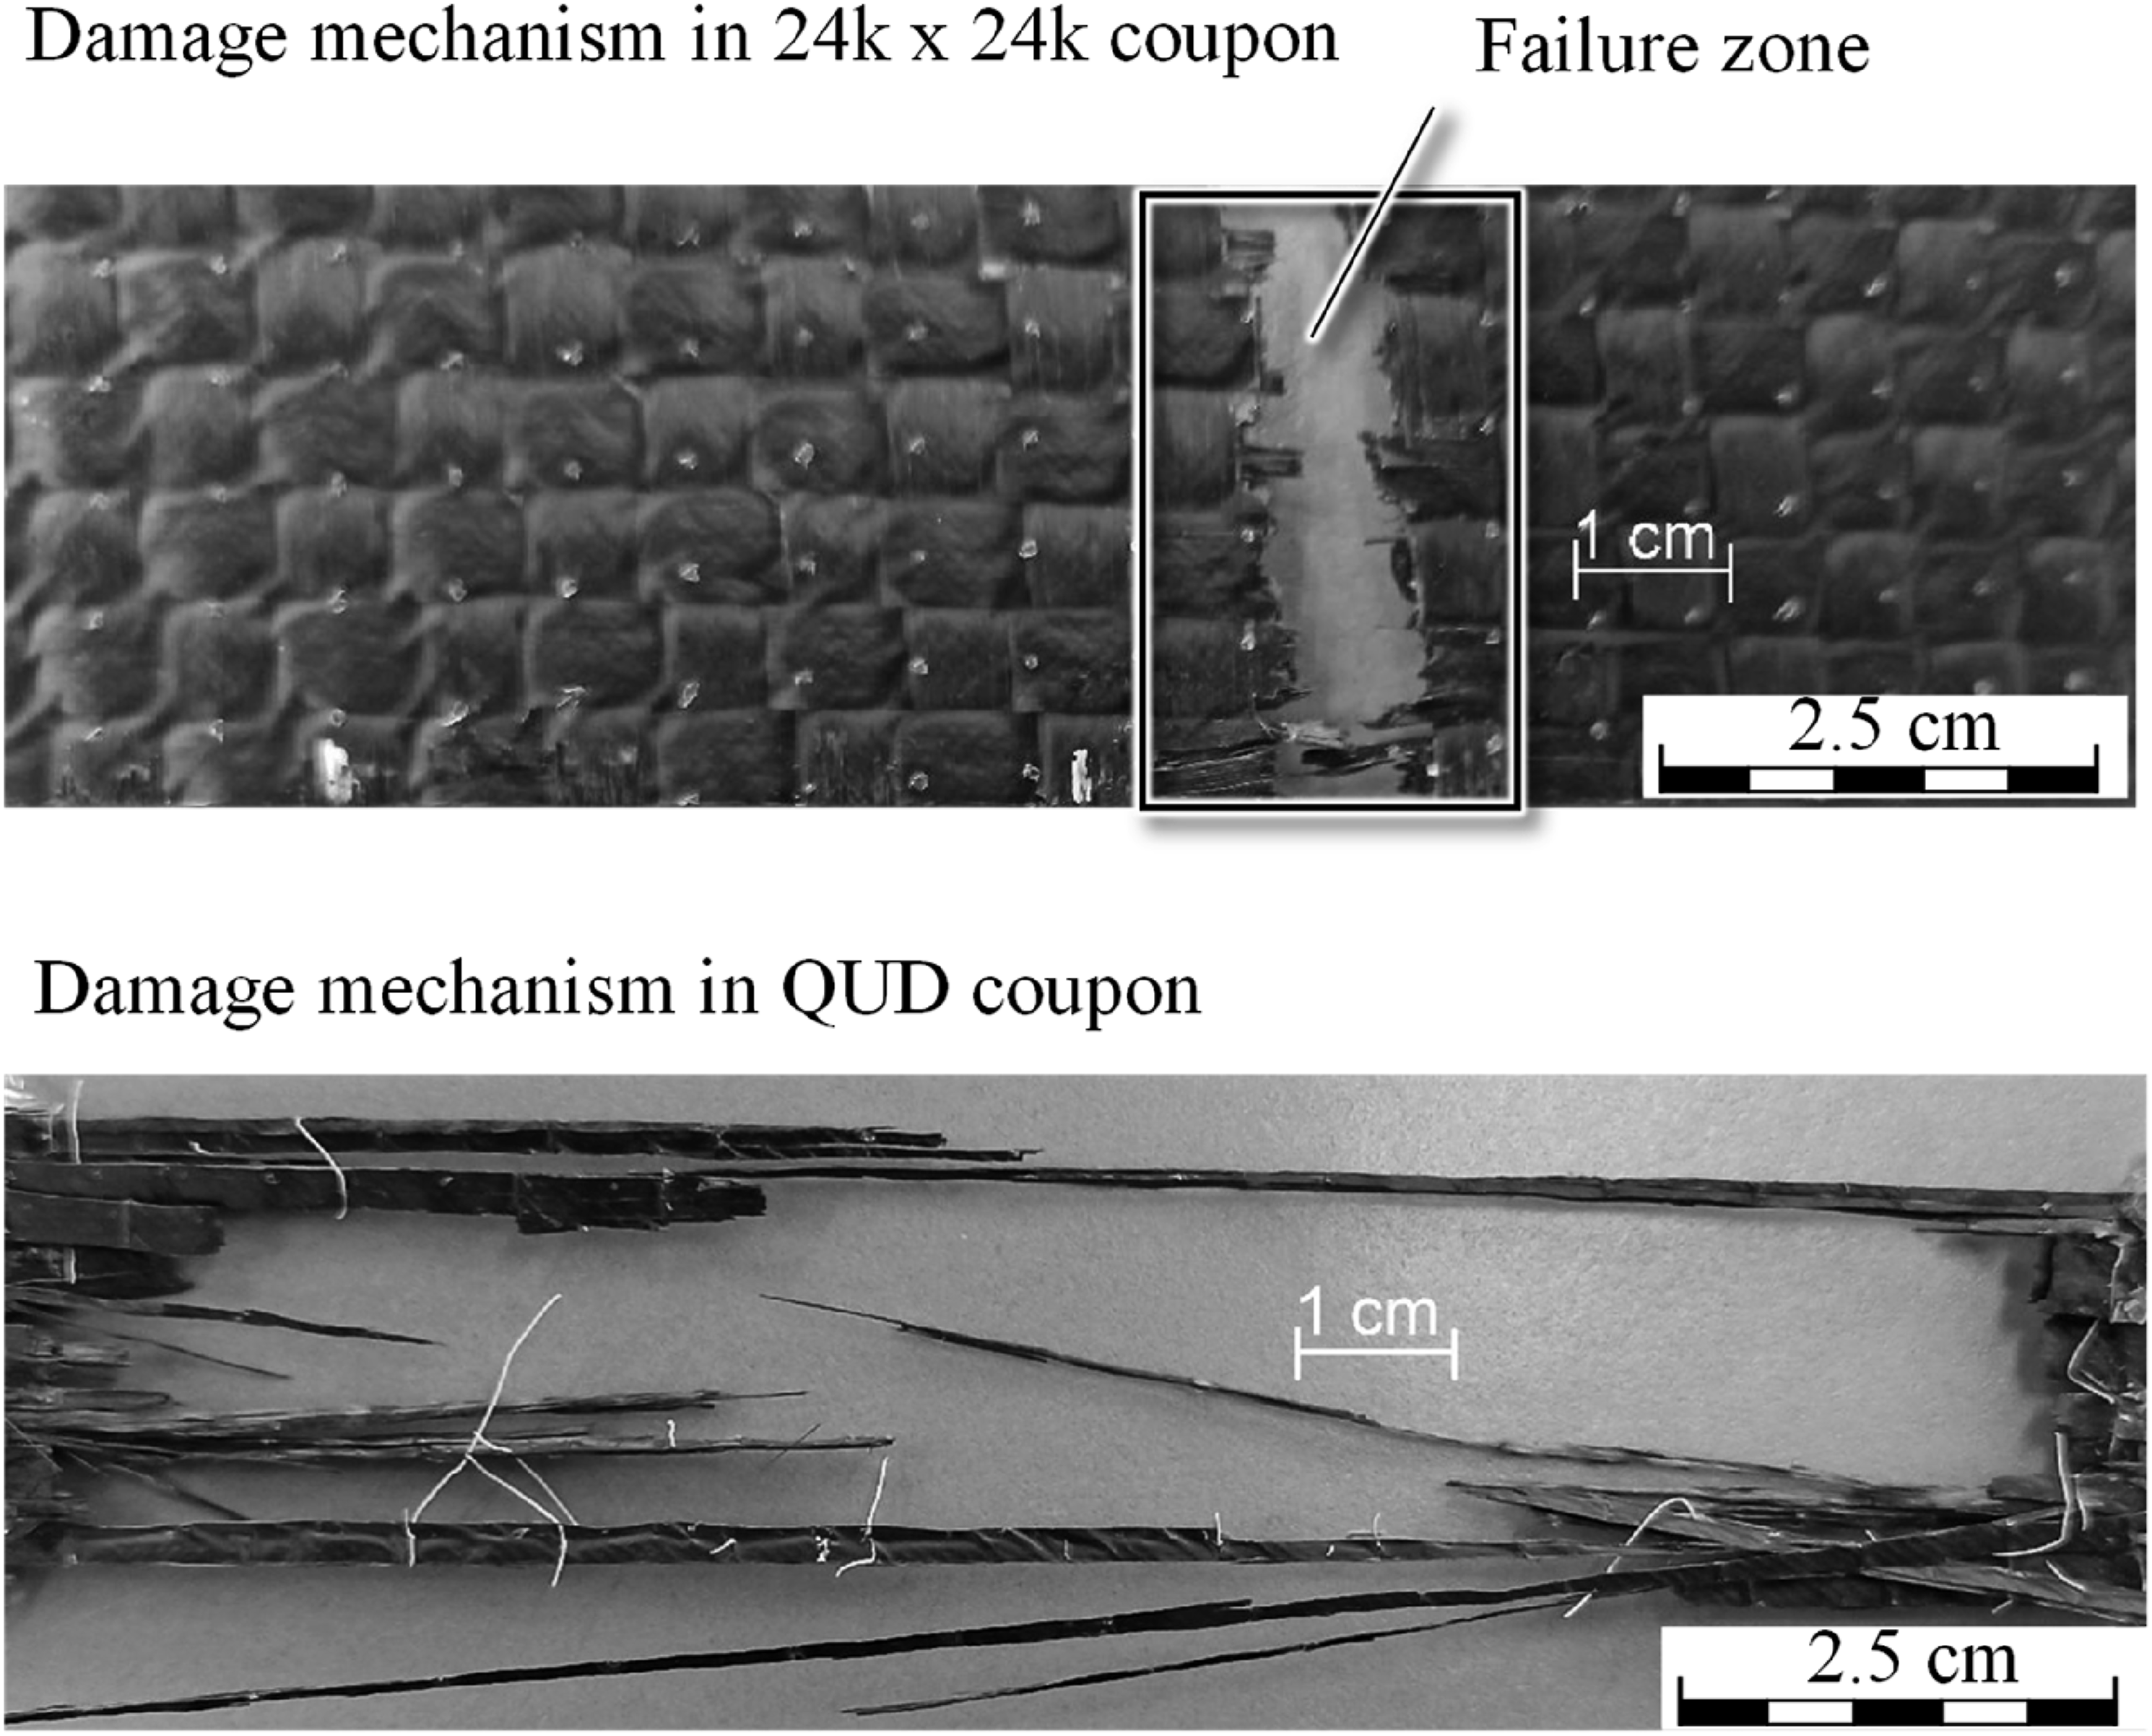
Multiscale micromechanics
The Multiscale Recursive Micromechanics (MsRM) approach, shown schematically in Figure 7, is designed to model materials with multiple heterogeneous microstructures across different length scales.41,42 As shown, MsRM utilizes repeating unit cell (RUC) micromechanics models embedded within each other to capture the microstructural geometry at any number levels of scale. The effective stiffness matrix for the RUC is passed up the length scales from Level k to Level 0 during homogenization. The subvolume strains are passed down the length scales from Level 0 to Level k and applied to the subscale RUC. Local and global stresses are calculated using the strains and stiffness. For additional details, the reader is referred to Ref. 35. Multiscale modeling of other physics, such as thermal/electrical conductivity, diffusion, and magnetic permeability
44
can also be conducted with MsRM.
45
Schematic detailing the multiscale recursive micromechanics (MsRM) approach whereby separate micromechanics models can be embedded within each other to capture microstructural features of interest across any number of length scales. Each level represents a length scale, with level 0 being the highest, global length scale, and level k being the lowest length scale.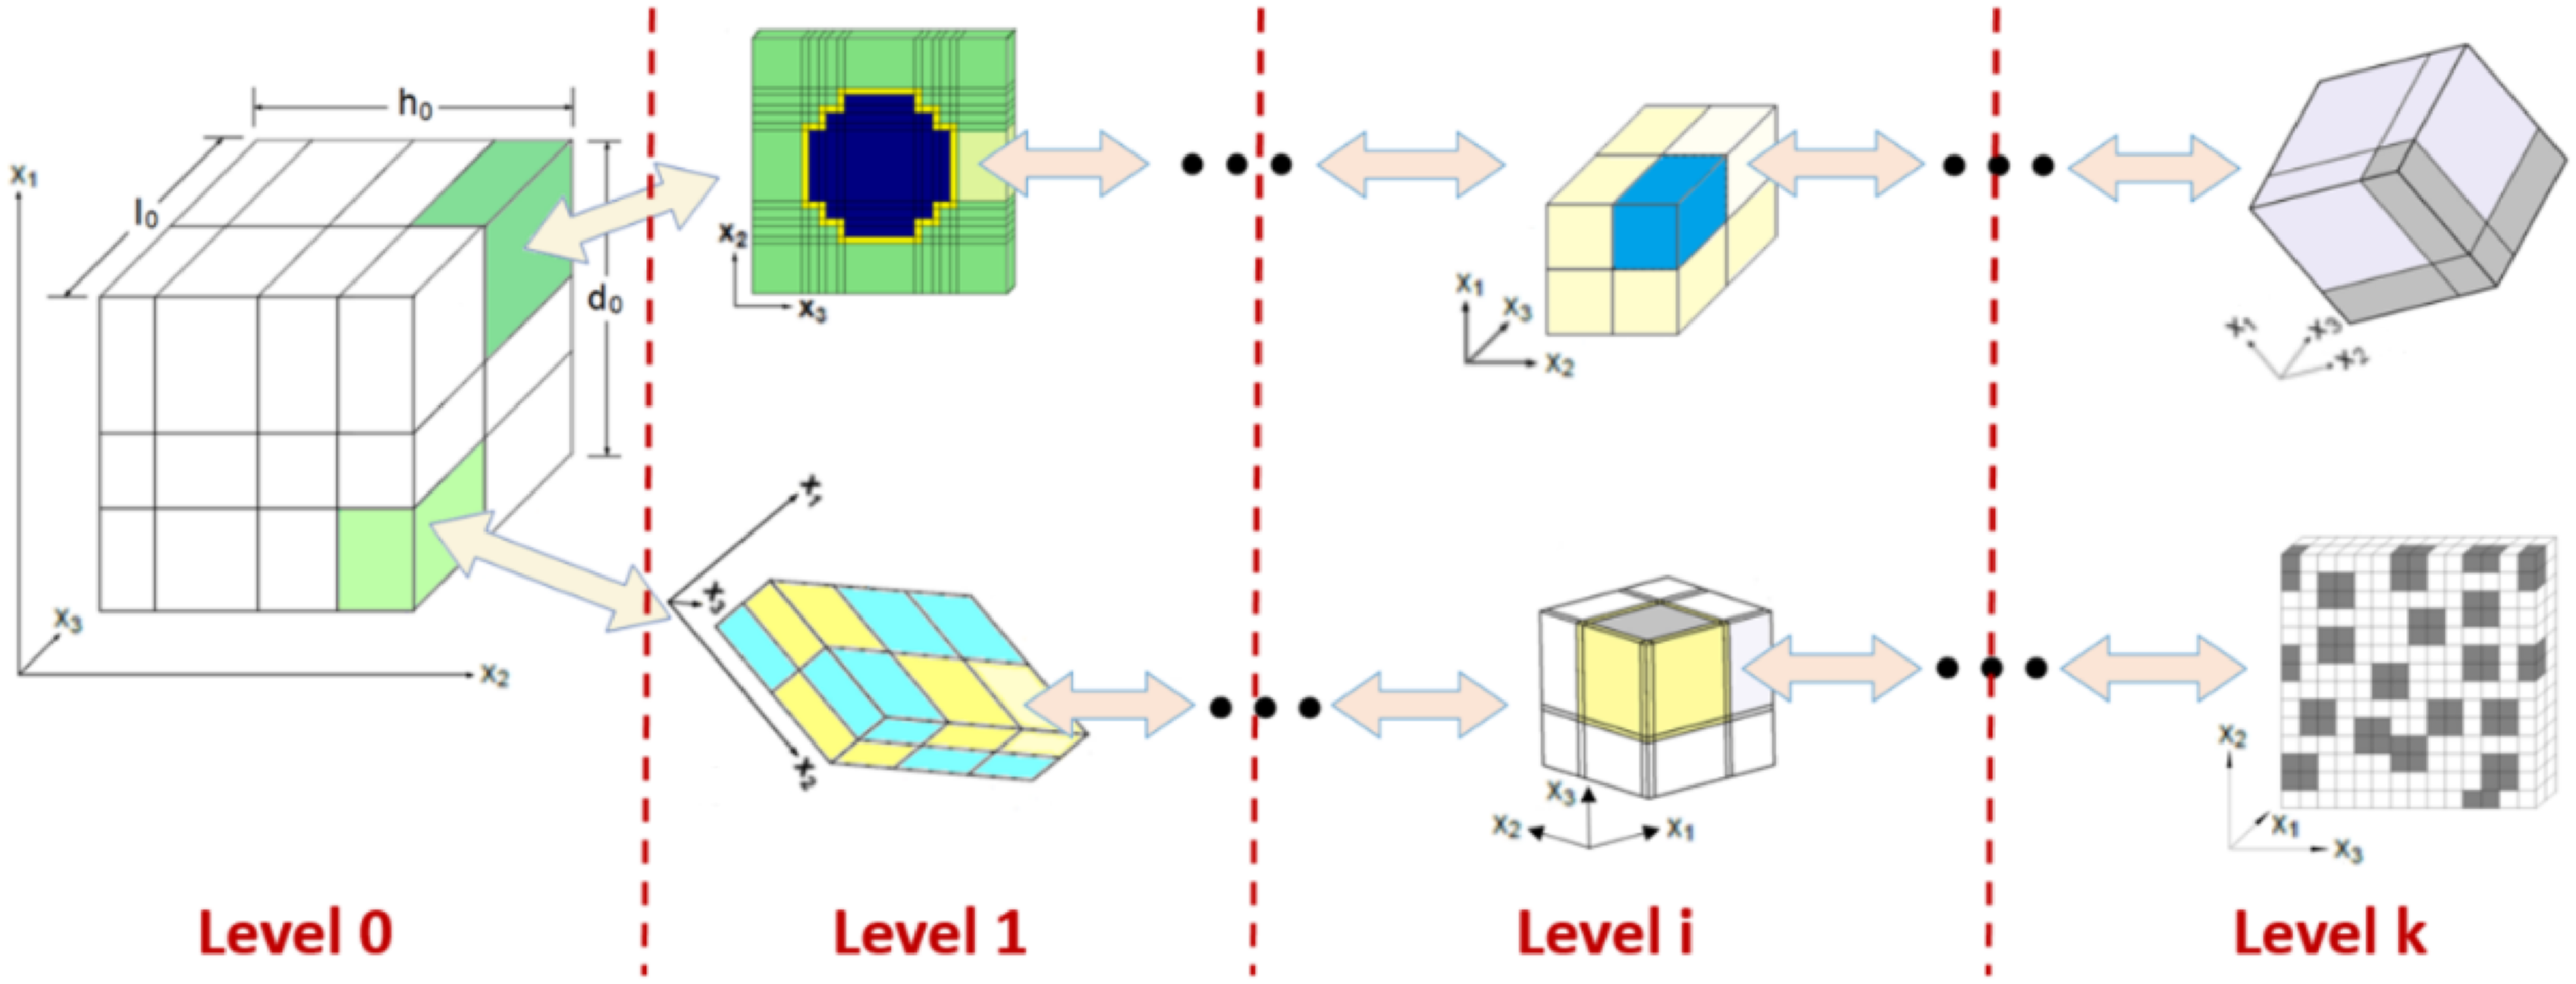
MsRM has been implemented in the comprehensive software suite, NASA Multiscale Analysis Tool (NASMAT). 46 This software enables the use of a number of leading semi-analytical micromechanics theories, such as Mori-Tanaka, the Generalized Method of Cells (GMC), and the High-Fidelity Generalized Method of Cells (HFGMC), 38 at any length scale. In addition, multiple nonlinear damage and viscoplastic constitutive models are available, and NASMAT links with commercially available finite element codes to enable micromechanics analysis at the integration points in a structural finite element model. 47
Woven and braided composites can be readily analyzed with MsRM within NASMAT as these materials typically exhibit heterogeneous microstructures at a minimum of two length scales. At the higher length scale, the weave pattern geometry can be considered, while, at the lower length scale, the filaments and matrix, which constitute to the woven/braided fiber tows, can be modeled. This approach, as shown in Figure 8, was taken herein to model the unbalanced woven composites. At the highest length scale, the simplest RUC that still captures the key aspects of the weave pattern was employed. It consisted of 7 × 4 × 4 subvolumes representing the tows and the pure matrix regions between the tows. The HFGMC micromechanics theory
38
was used at this scale. The sizes and volume fractions of the tows in each direction are captured, as are the undulation angles (θ1 and θ2). In addition to these undulation angles, the dimension a1, a2, b1, b2, and t were sufficient to fully characterize the higher scale woven composite RUC microstructure. At the lower length scale, representing the tows in the woven composite, a hexagonally packed microstructure with 32 × 56 subvolumes, was employed, and, once again, the HFGMC micromechanics theory was used at this scale. Note that, by changing the number of subvolumes occupied by the filaments (shown in blue in Figure 8), the fiber volume fraction within the tows can be altered as desired. The physical property measurements shown in Table 2, along with the known tow filament counts, were sufficient to fully characterize the needed woven composite RUC geometric parameters, including the Vf within each tow. Note that the fiber volume fraction in each of the two orthogonal weave directions is a primary driver of the material response, and the constructed RUC, while coarse, correctly captures this feature. Furthermore, these fiber volume fractions are maintained across all statistical cases that will be considered. Example repeating unit cells (RUCs) for the unbalanced woven composite weave pattern (higher length scale) and within the tows (lower length scale).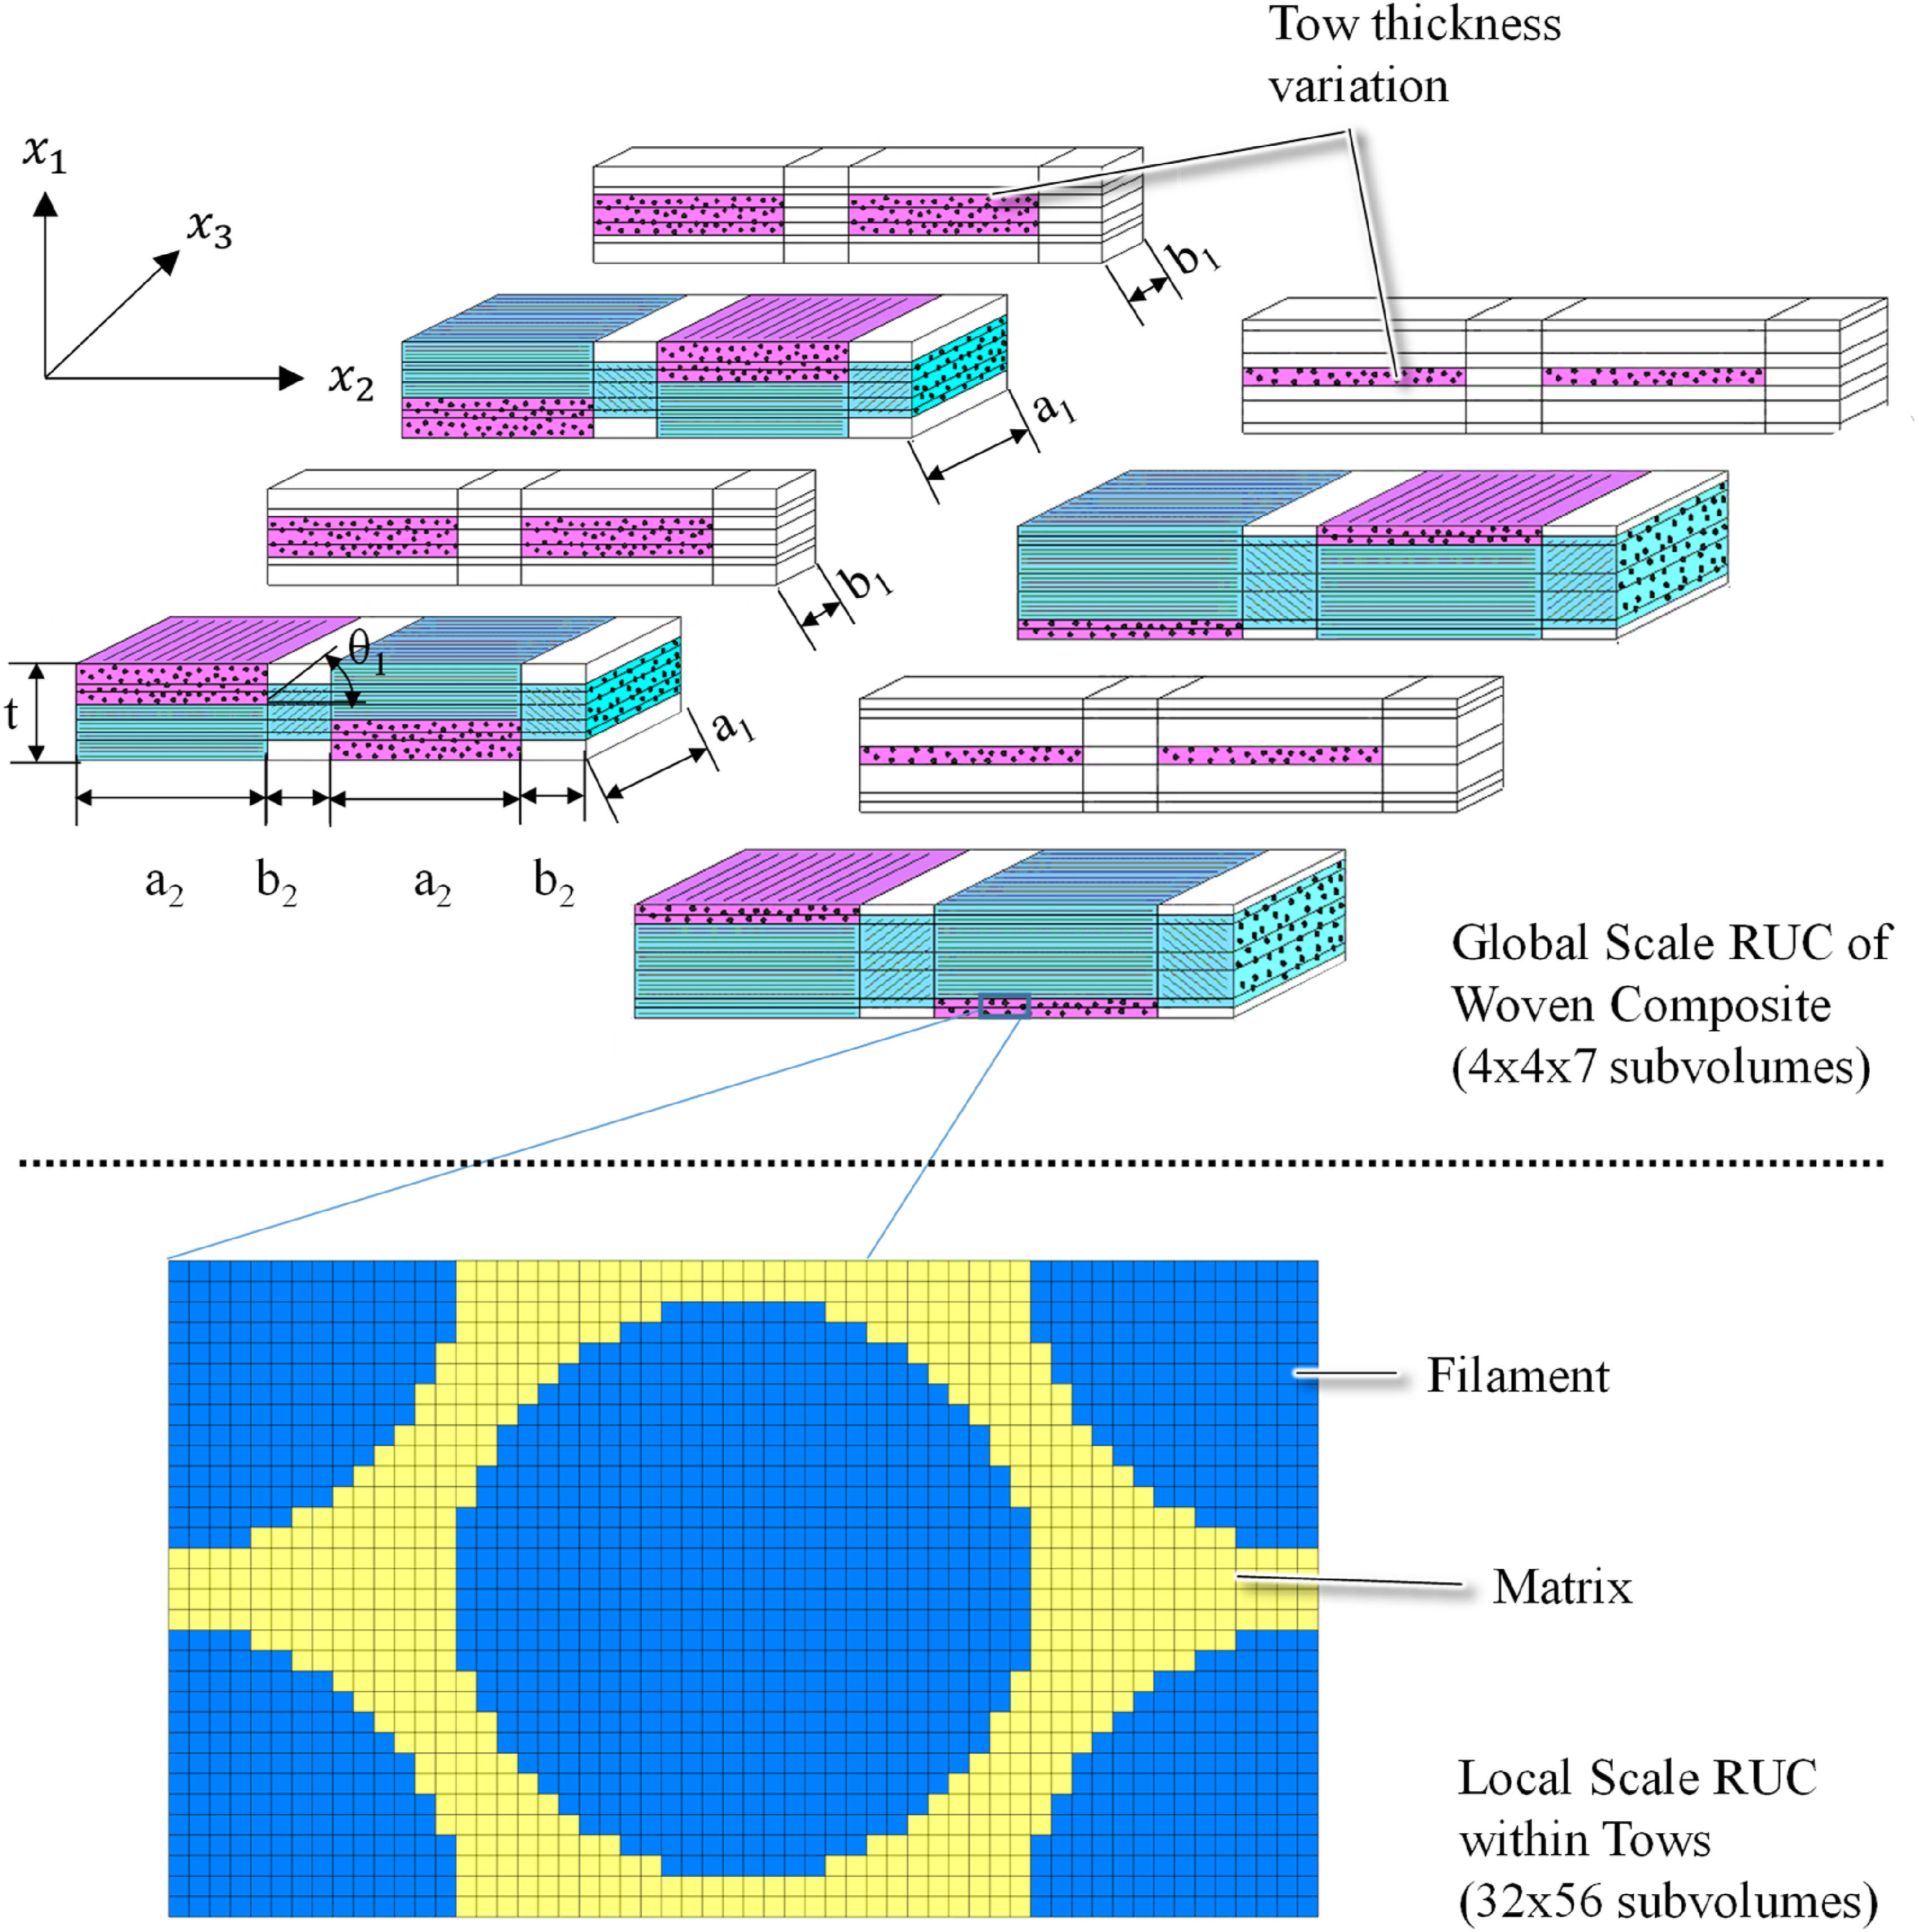
Predictions of the unbalanced woven composite stress-strain response were conducted using NASMAT by applying incremental strain-controlled uniaxial loading in the direction of the 24k tows to the higher scale composite RUC (while maintaining zero for all the non-loaded stress components). The effective elastic properties result from first homogenizing the tows, and then homogenizing the composite RUC. Note that appropriate coordinate transformations are necessary for the tows in the undulation subvolumes. Conversely, based on the applied strain level, localization provides the strains in the composite subvolumes, which are then localized again within the tows to obtain micro scale strains in the tow subvolumes. To predict progressive damage and failure, the simple subvolume elimination method 42 was employed. In this approach, the constituents are assigned strength or allowable values (stresses or strains), and then, once a selected failure criterion is met or exceeded in a given subvolume, that subvolume’s stiffness components are immediately reduced to nearly zero. Herein a reduction by a factor of 104 was used to effectively eliminate the failed subvolume’s contribution to the composite stiffness, along with the maximum stress failure criterion. As such, even though the subvolume elimination approach simulates abrupt, brittle failure, because this occurs at the level of the subvolumes within the tows (and between the tows), the overall failure of the composite can be quite progressive. That is, for example, when a single matrix subvolume fails within a tow, this will only slightly affect the homogenized properties of the tow, which then will have only a slight effect on the homogenized properties of the woven composite RUC. As the incrementally applied global composite strain increases, more and more fiber and matrix subvolume fail, eventually resulting in significant loss of global composite stiffness, at which point the composite material may be considered failed. The maximum global stress that is reached in the simulation can then be treated as the predicted composite strength. The maximum stress criterion is thus applied only at the constituent scale, and through homogenization, the effect of the damage is manifested at the higher length scales. No failure criteria are needed for any length scale higher than the constituents.
Results and discussion
Predictions based on mean input values
Using the NASMAT model presented in the previous section, tensile predictions were first conducted wherein the mean values were employed for all input parameters. Figure 9 shows a comparison of these predicted tensile test results with the experimental results for the four weave types. The large drops in the predicted stress strain curves indicate the points at which local failures have accumulated such that, globally, the composite can no longer support any additional load. This has been considered composite failure, and the maximum stress attained in the model prior to this point has been taken as the predicted composite strength. NASMAT progressive failure predictions, compared with tensile test data, using mean values of all input data, for the four weave types.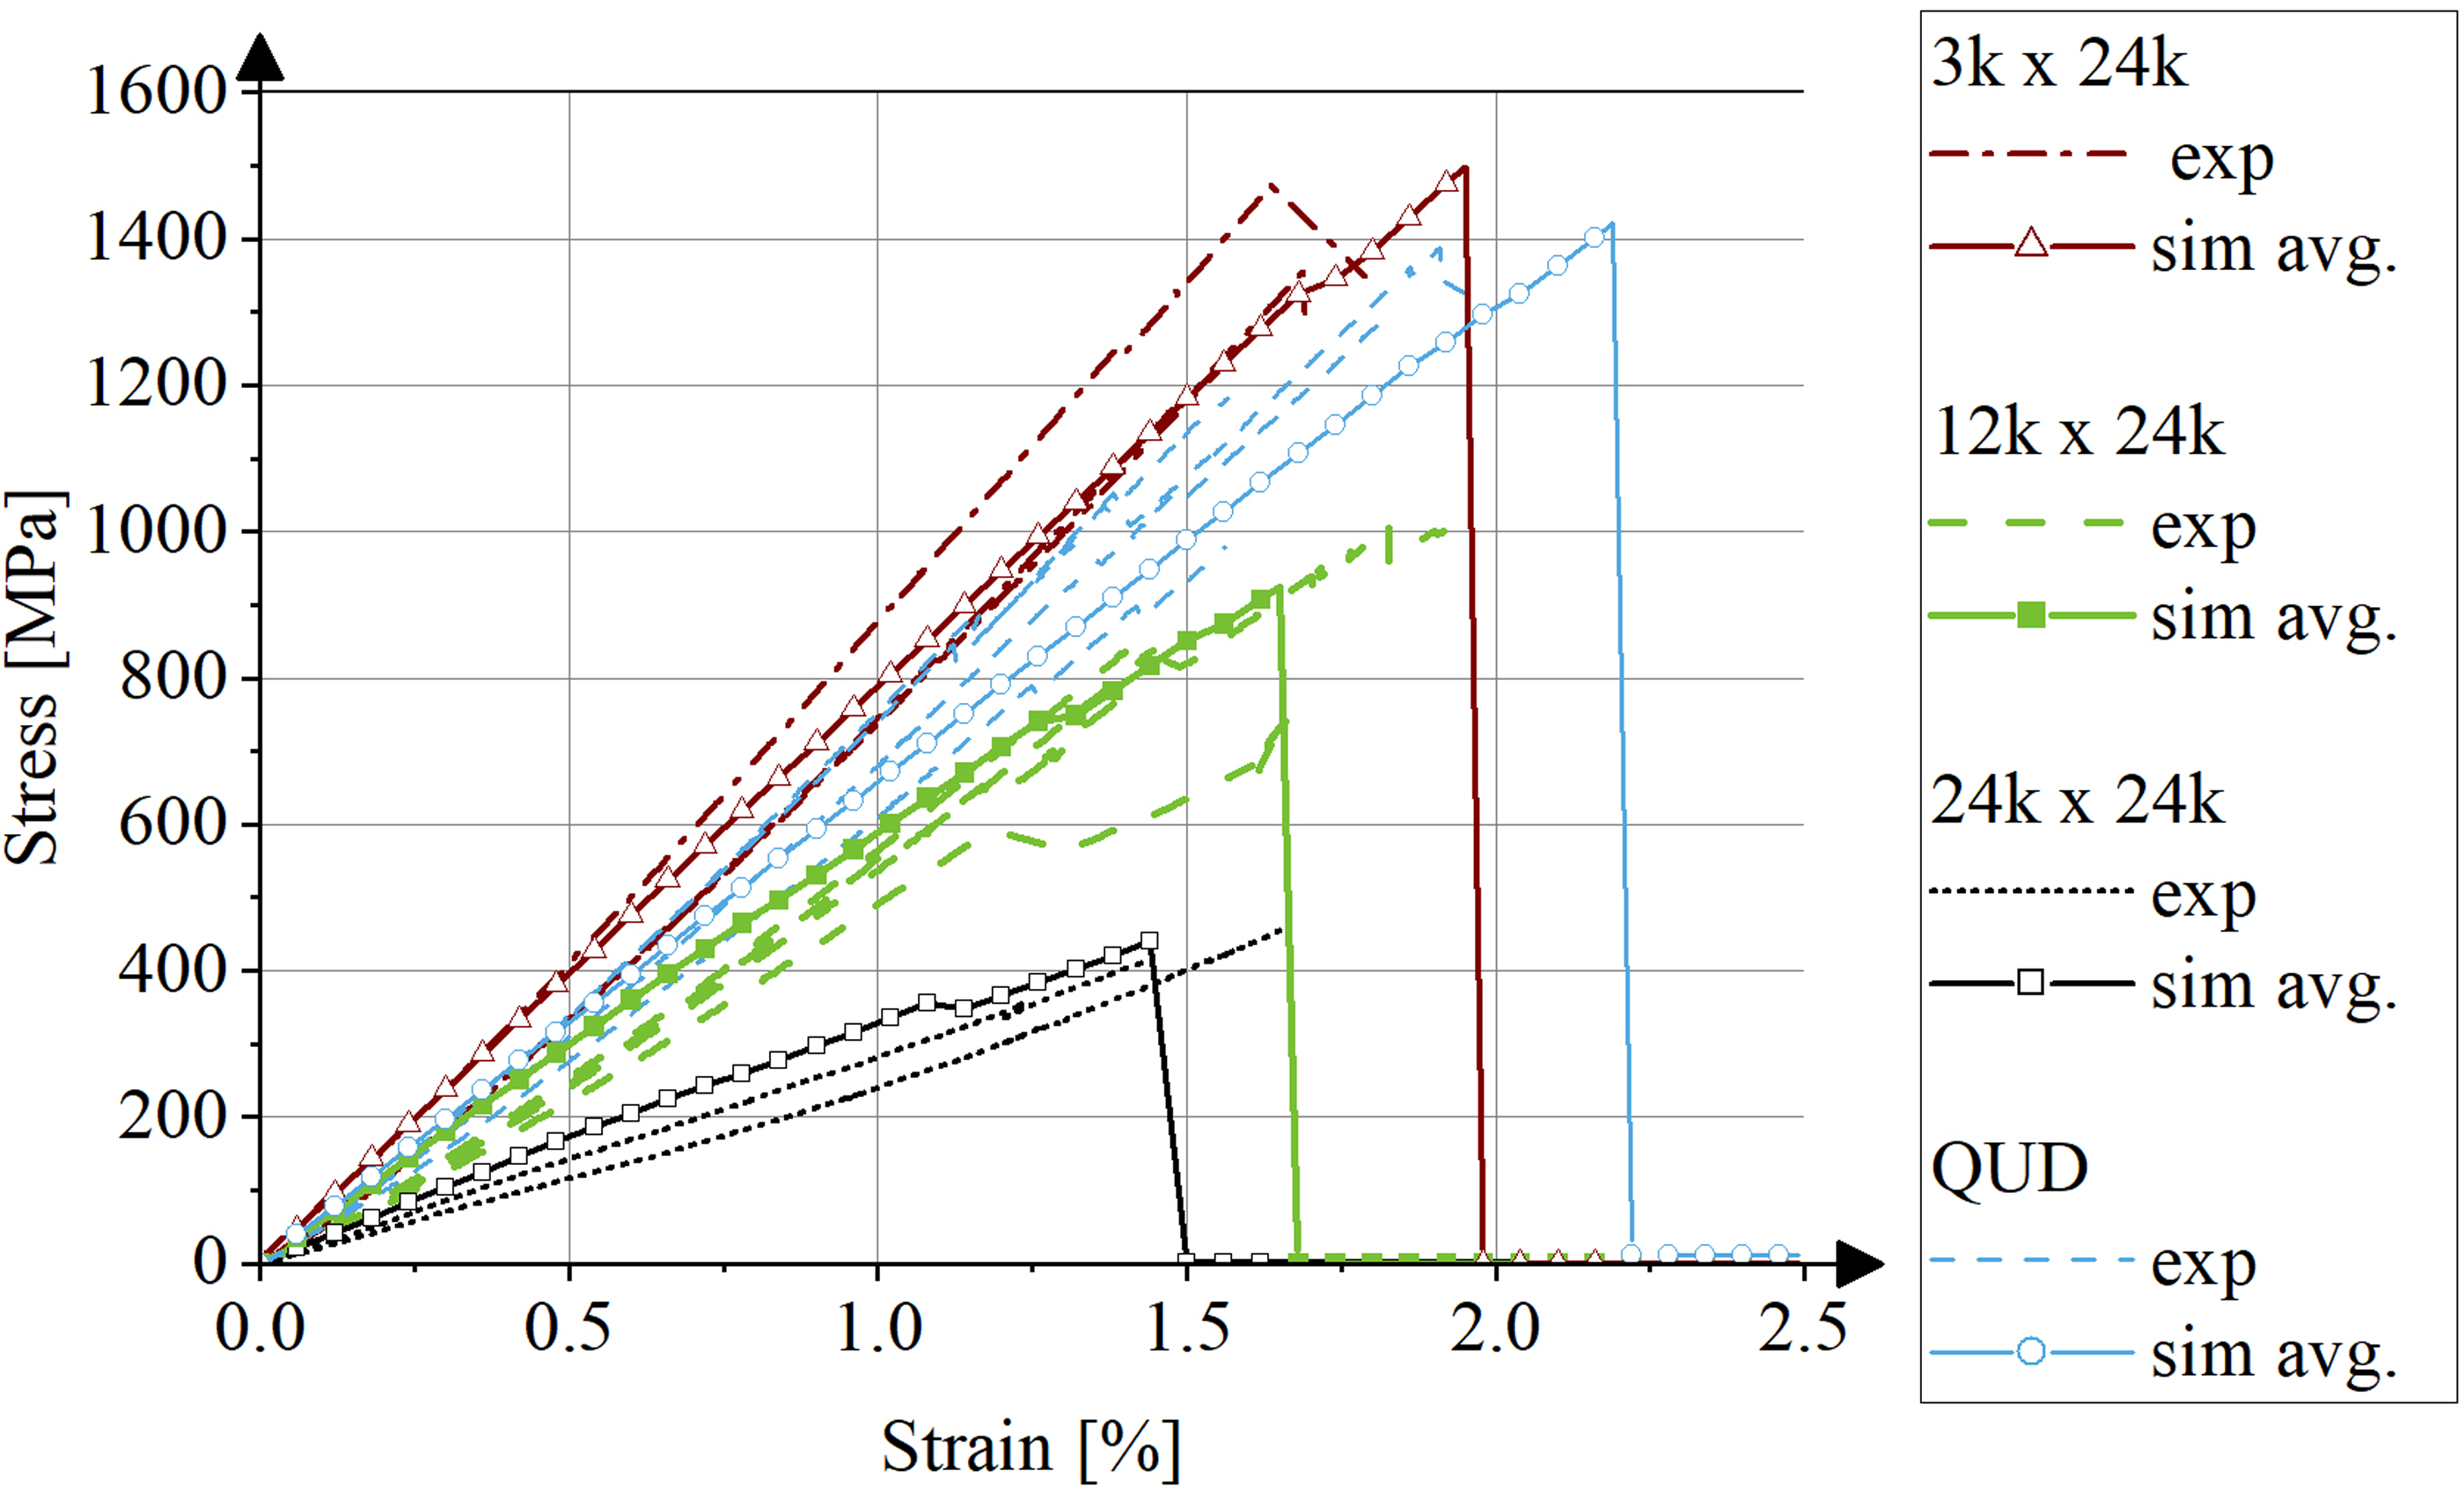
Clearly, the predictions shown in Figure 9 demonstrate reasonably good agreement with the experimental tensile curves. Notably, the lower stiffness and strength of the QUD case compared to the 24k × 3k case is correctly captured by the model. It is also noteworthy that the stiffening exhibited in the test data has not been captured as no such mechanism is present in the current model. However, this may be considered in future work as NASMAT contains large fiber rotation capabilities, which have been applied in the past to dry woven fabrics. 48 Each simulation required approximately 1 minute to execute on an i7 processor laptop.
Effect of input property variation
To estimate the impact of the constituent material property and woven composite geometry statistics, a script was written to randomly sample the random input variables given in Table 2 and Table 3. NASMAT is quite amenable to scripting because it can be driven by an ASCII input file. For each random sample of the input variables, the script generated a single instance of a NASMAT input file. For each woven composite type, 1000 such instances were generated, along with a batch file containing the 1000 NASMAT execution commands. This batch file was then used to run the 1000 NASMAT cases serially, with each run taking approximately 1 minute (or 16.7 hours for all 1000 cases), again on an i7 processor laptop. Note that execution of these cases could be quickened by running individual cases simultaneously on multiple processors, or by running each batch of 1000 cases (per weave type) on its own processor simultaneously.
Figure 10 shows the 1000 instances of the NASMAT tensile test simulations compared to the test data for each weave type. The model prediction line colors indicate the mode of the final failure. Red lines indicate simulations which failed, due fiber breakage, whereas blue lines indicate that final failure occurred due to complete matrix section failure without failure of the fibers. First, Figure 10 indicates that the multiscale model instances have done a reasonably good job of reproducing the experimental tensile curves. The initial stiffness predictions match better for the QUD and 24k × 3k weaves, whose experimental responses exhibited less stiffening. For the 24k ×12k and 24k × 24k weaves, which exhibited more stiffening experimentally, the model is overpredicting the initial stiffness, but matches the instantaneous stiffness better as the strain is increased and the experimental stiffening occurs. In terms of strength, the ranges of predicted strengths encompass the test data, as they should. It is interesting that out of the 1000 instances per weave type, there are some very low predicted strengths, which are always red curves, indicating final failure due to fiber failure. In fact, it is clear that the simulations that exhibited final failure due to the expected fiber failure mode were consistently the lower strength predictions. This is because these instances were assigned (based on the statistics, see Table 3) low 24k (T700SC) fiber strengths, causing predicted final failure prior to the development of the alternative mode, complete matrix section failure (blue lines). Note that the coefficient of variation of the T700SC fiber was measured to be 30% (see Table 3). Of course, because many geometric parameters and material properties were random, some intermingling between these predicted final failure modes was observed. Finally, recall that the geometric variations have been applied to reproduce the correct known volume fraction of fibers in each direction for each weave. Therefore, none of the variation in the predictions is due to changes in the overall composite fiber volume fraction; it is due only to microstructural and property variation. 1000 random NASMAT progressive failure prediction instances, compared with tensile test data (solid black lines), for the four weave types. (a) QUD, (b) 24k × 3k, (c) 24k × 12k, (d) 24k × 24k. The model prediction line colors indicate final failure via fiber breakage (red) and complete matrix section failure (blue).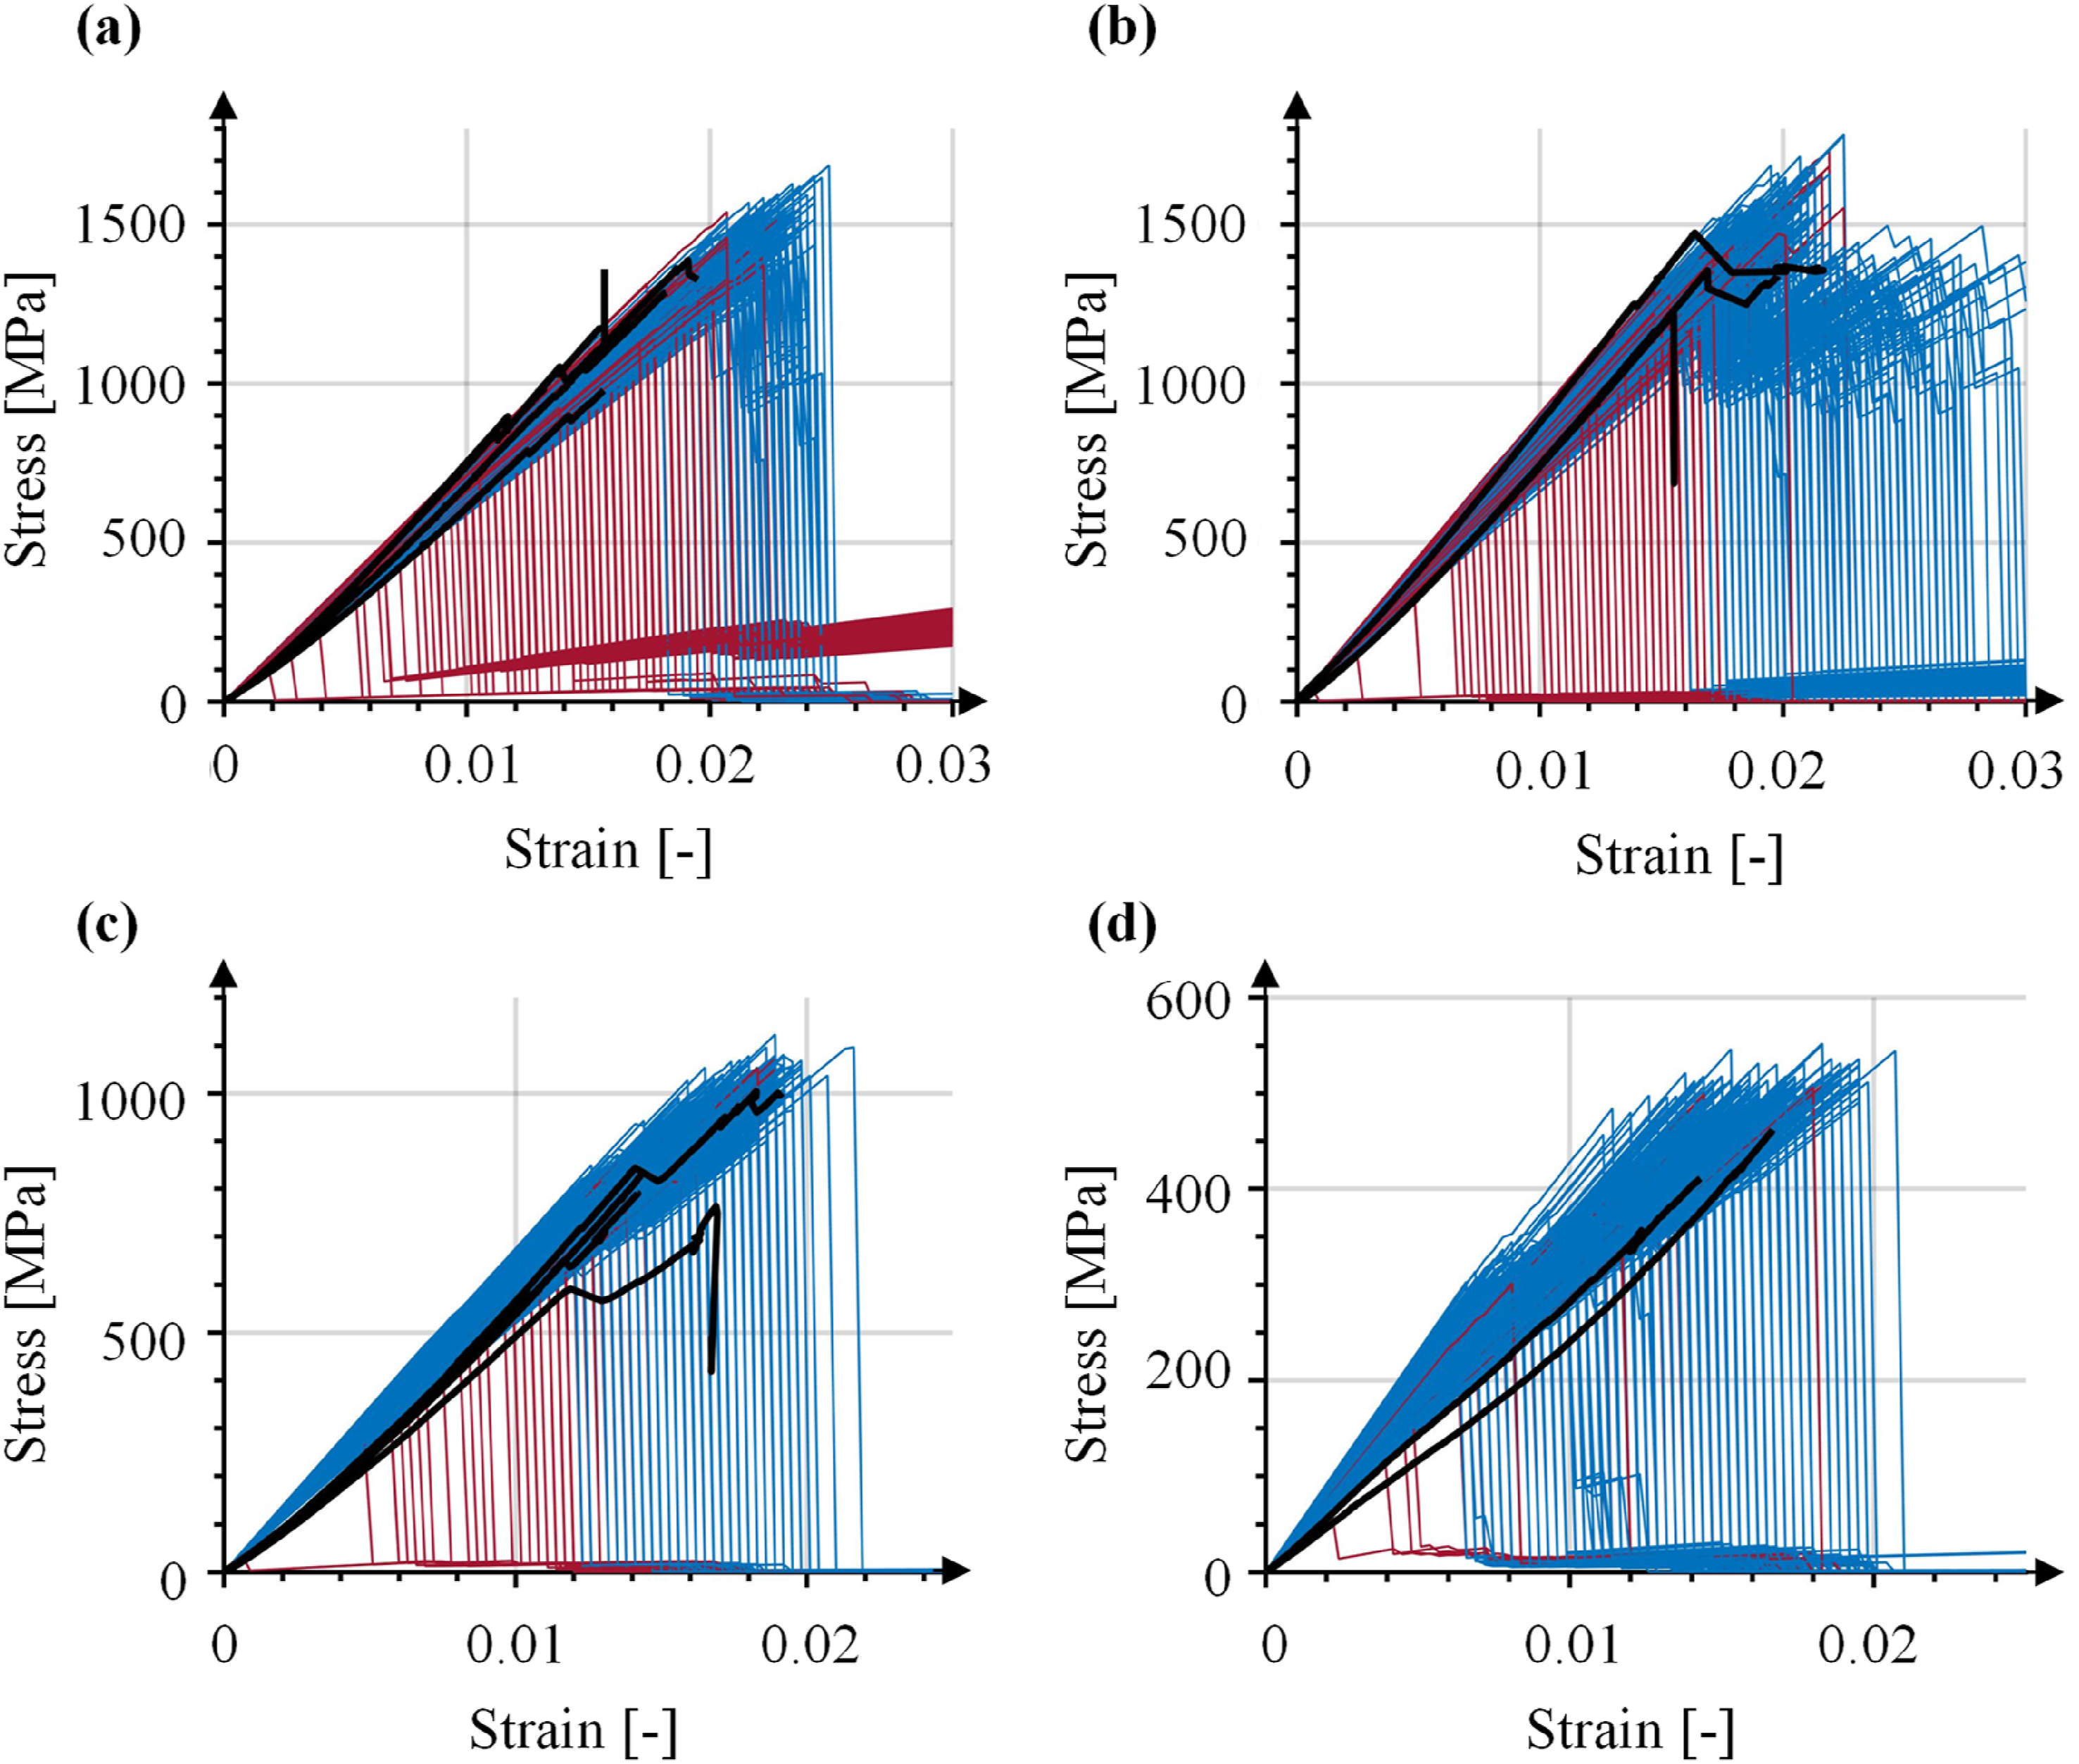
Investigation into the unexpected complete matrix section failure mode indicated that it occurred when the matrix in the undulation subvolumes (see Figure 8) fails completely, which then results in a near zero effective stiffness for the composite in the applied loading direction. In these cases, the model is thus predicting failure of the composite without failure of the fibers. Obviously, this is not realistic, and it is actually an artifact of the scale separation in the multiscale modeling approach coupled with the aforementioned current inability of the model to consider large fiber rotations in woven composites. It can be explained by considering a subvolume from the tow undulation region (see Figure 8), as depicted in Figure 11. The transformation between the local (x1 - x2) and global (X - Y) coordinates results in a global Young’s modulus in the Y direction
49
of, A single subvolume from the tow undulation region of the woven composite RUC, with the local and global coordinates, along with the undulation angle, indicated.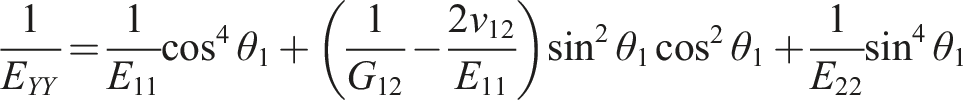
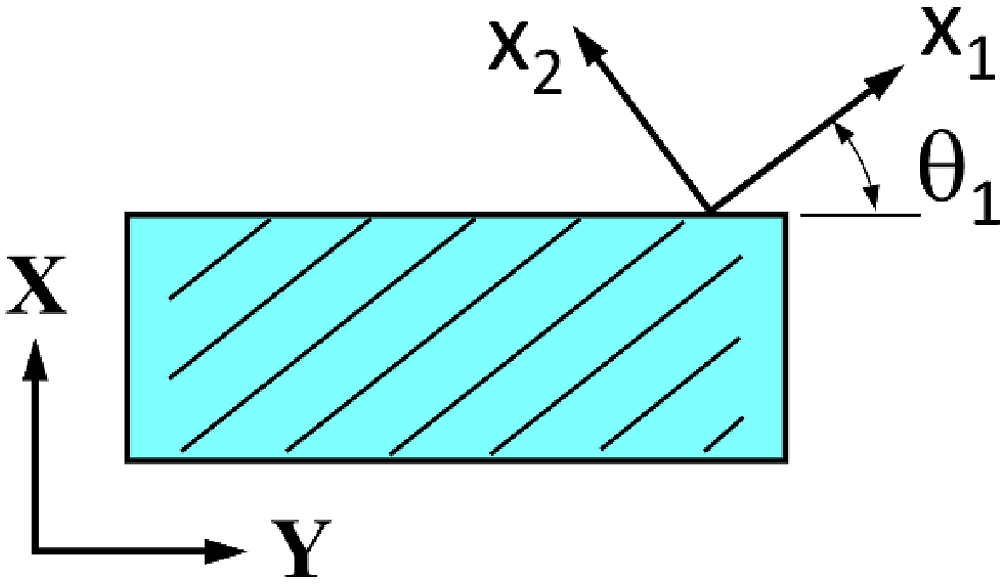
Figure 12 presents the model and experimental cumulative distribution function (CDF) plots for the strength distributions for all the four weave types. The CDF is a fundamental concept in probability and statistics, representing the probability that a random variable Comparison of the test and simulation cumulative distribution functions (CDFs) for the four weave types.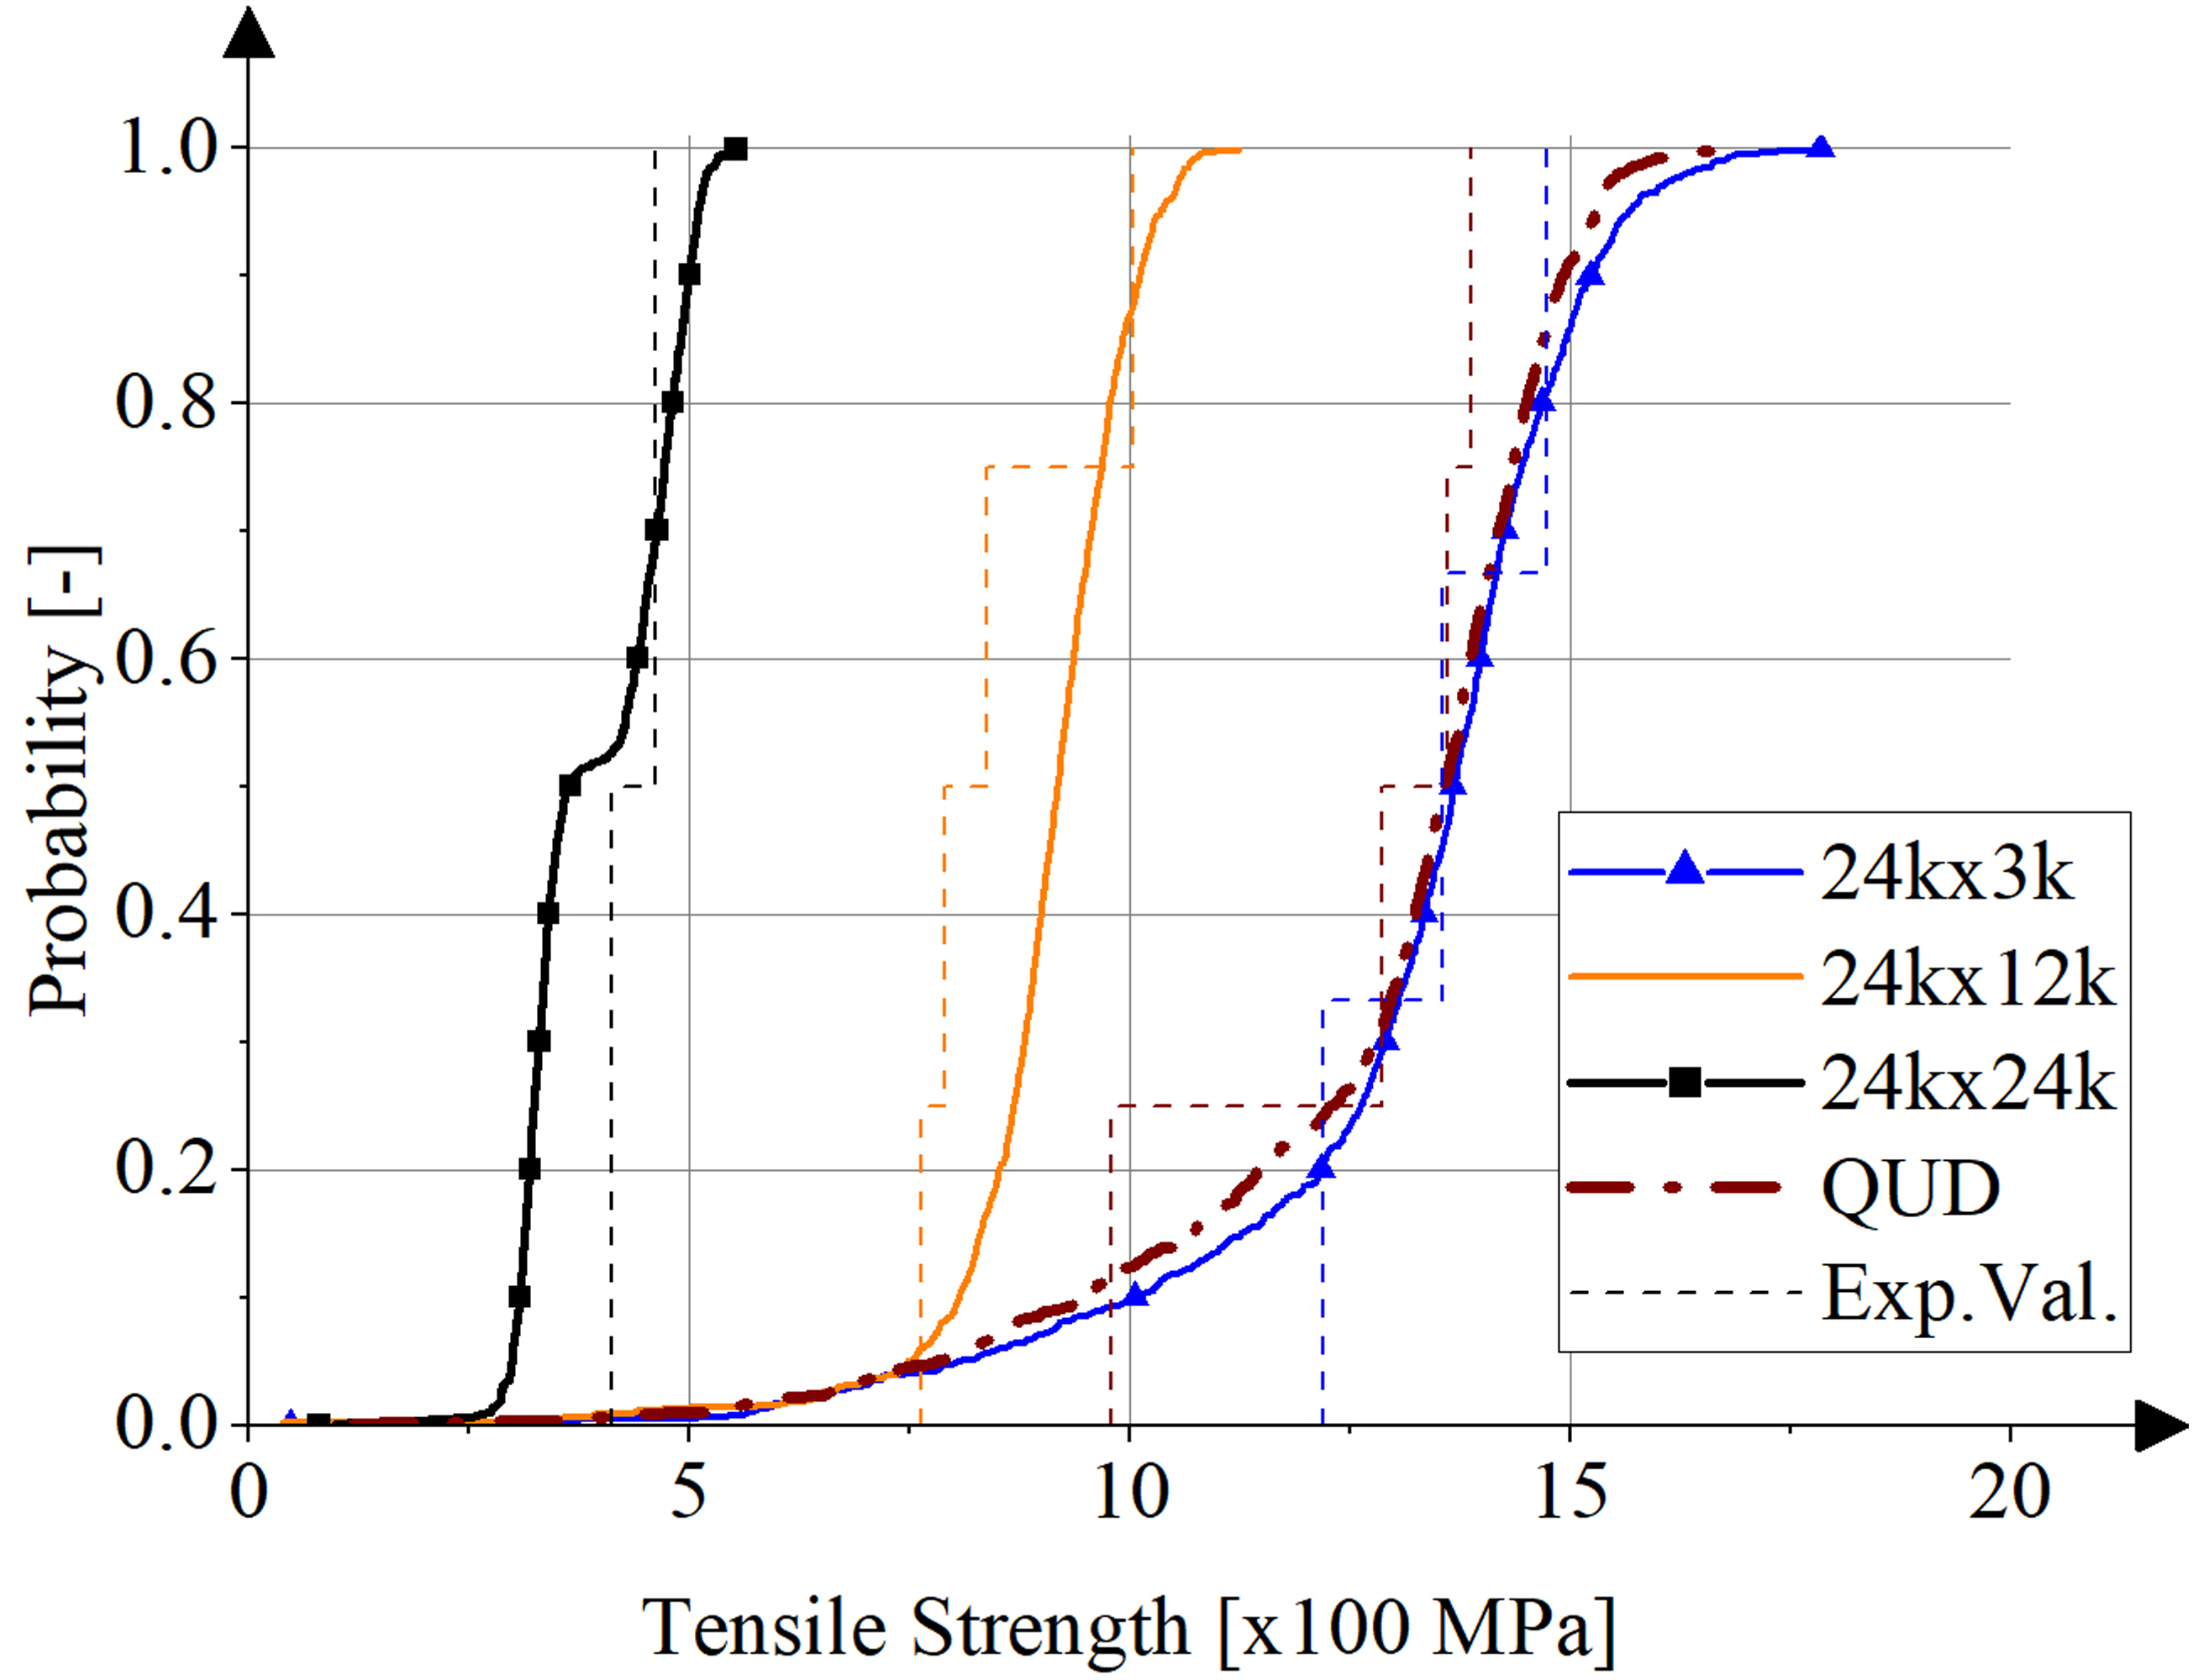
Figure 12 indicates that, statistically, the model predictions for the unbalanced woven composite strength match quite well with the experimental data. While the QUD and 24k × 3k predicted CDFs match better with experiments, there is reasonable overlap for the 24k × 12k and 24k × 24k as well. Of particular note in the predicted CDF of the 24k × 24k composite is the jog that occurs just above a 50% probability, while the predicted CDFs for the other composites remain smooth. Examining the probability distribution function (PDF) for this 24k × 24k case (Figure 13), the reason for the jog is clear: the model has predicted a bimodal strength distribution (which was not predicted for the other weave types). Further, this bimodal strength distribution is clearly not due to the two types of failure modes discussed early as, from Figure 10(d), very few of the 24k × 24k simulations exhibited the fiber failure mode, whereas each mode in Figures 12 and 13 encompass close to half of the simulations. Simulated probability distribution function (PDF) for the 24k × 24k woven composite.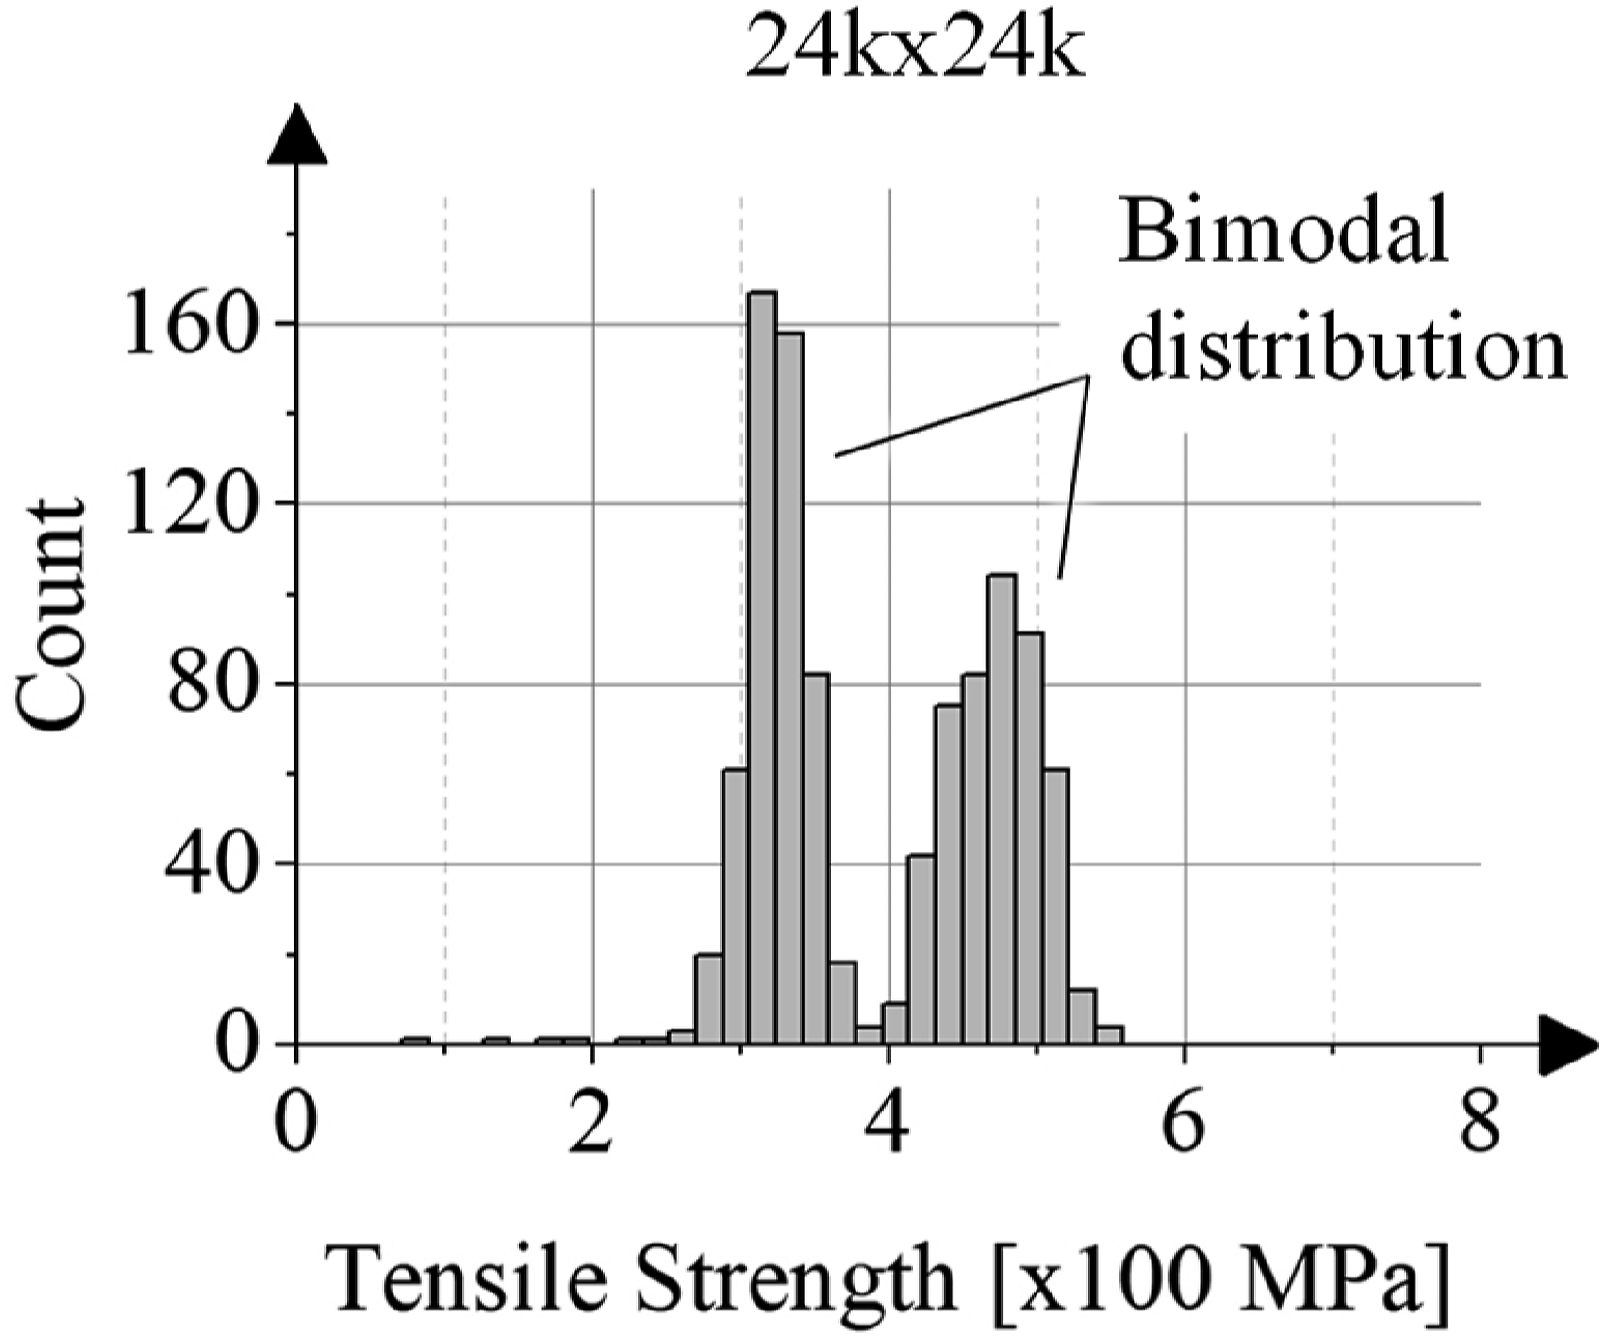
To examine the source of the bimodal strength distribution predicted for the 24k x 24k composites, a simulation from each of the populations has been plotted in Figure 14. The embedded contour plots show a top view of a damage magnitude, which considers the change in all of the diagonal components of the compliance matrix (squared, summed, square root taken, and normalized) such that 0 indicates no damage and 1 indicates complete damage. Note that these damage contours represent homogenized values through the thickness, not simply the damage on the top of the RUC. Comparison of two 24k × 24k woven composite tensile simulations, one of which resulted in a higher strength in the PDF (see Figure 13) and one of which resulted in a lower strength in the PDF. The embedded contour plots show the damage magnitude at the indicated points along the stress-strain curves.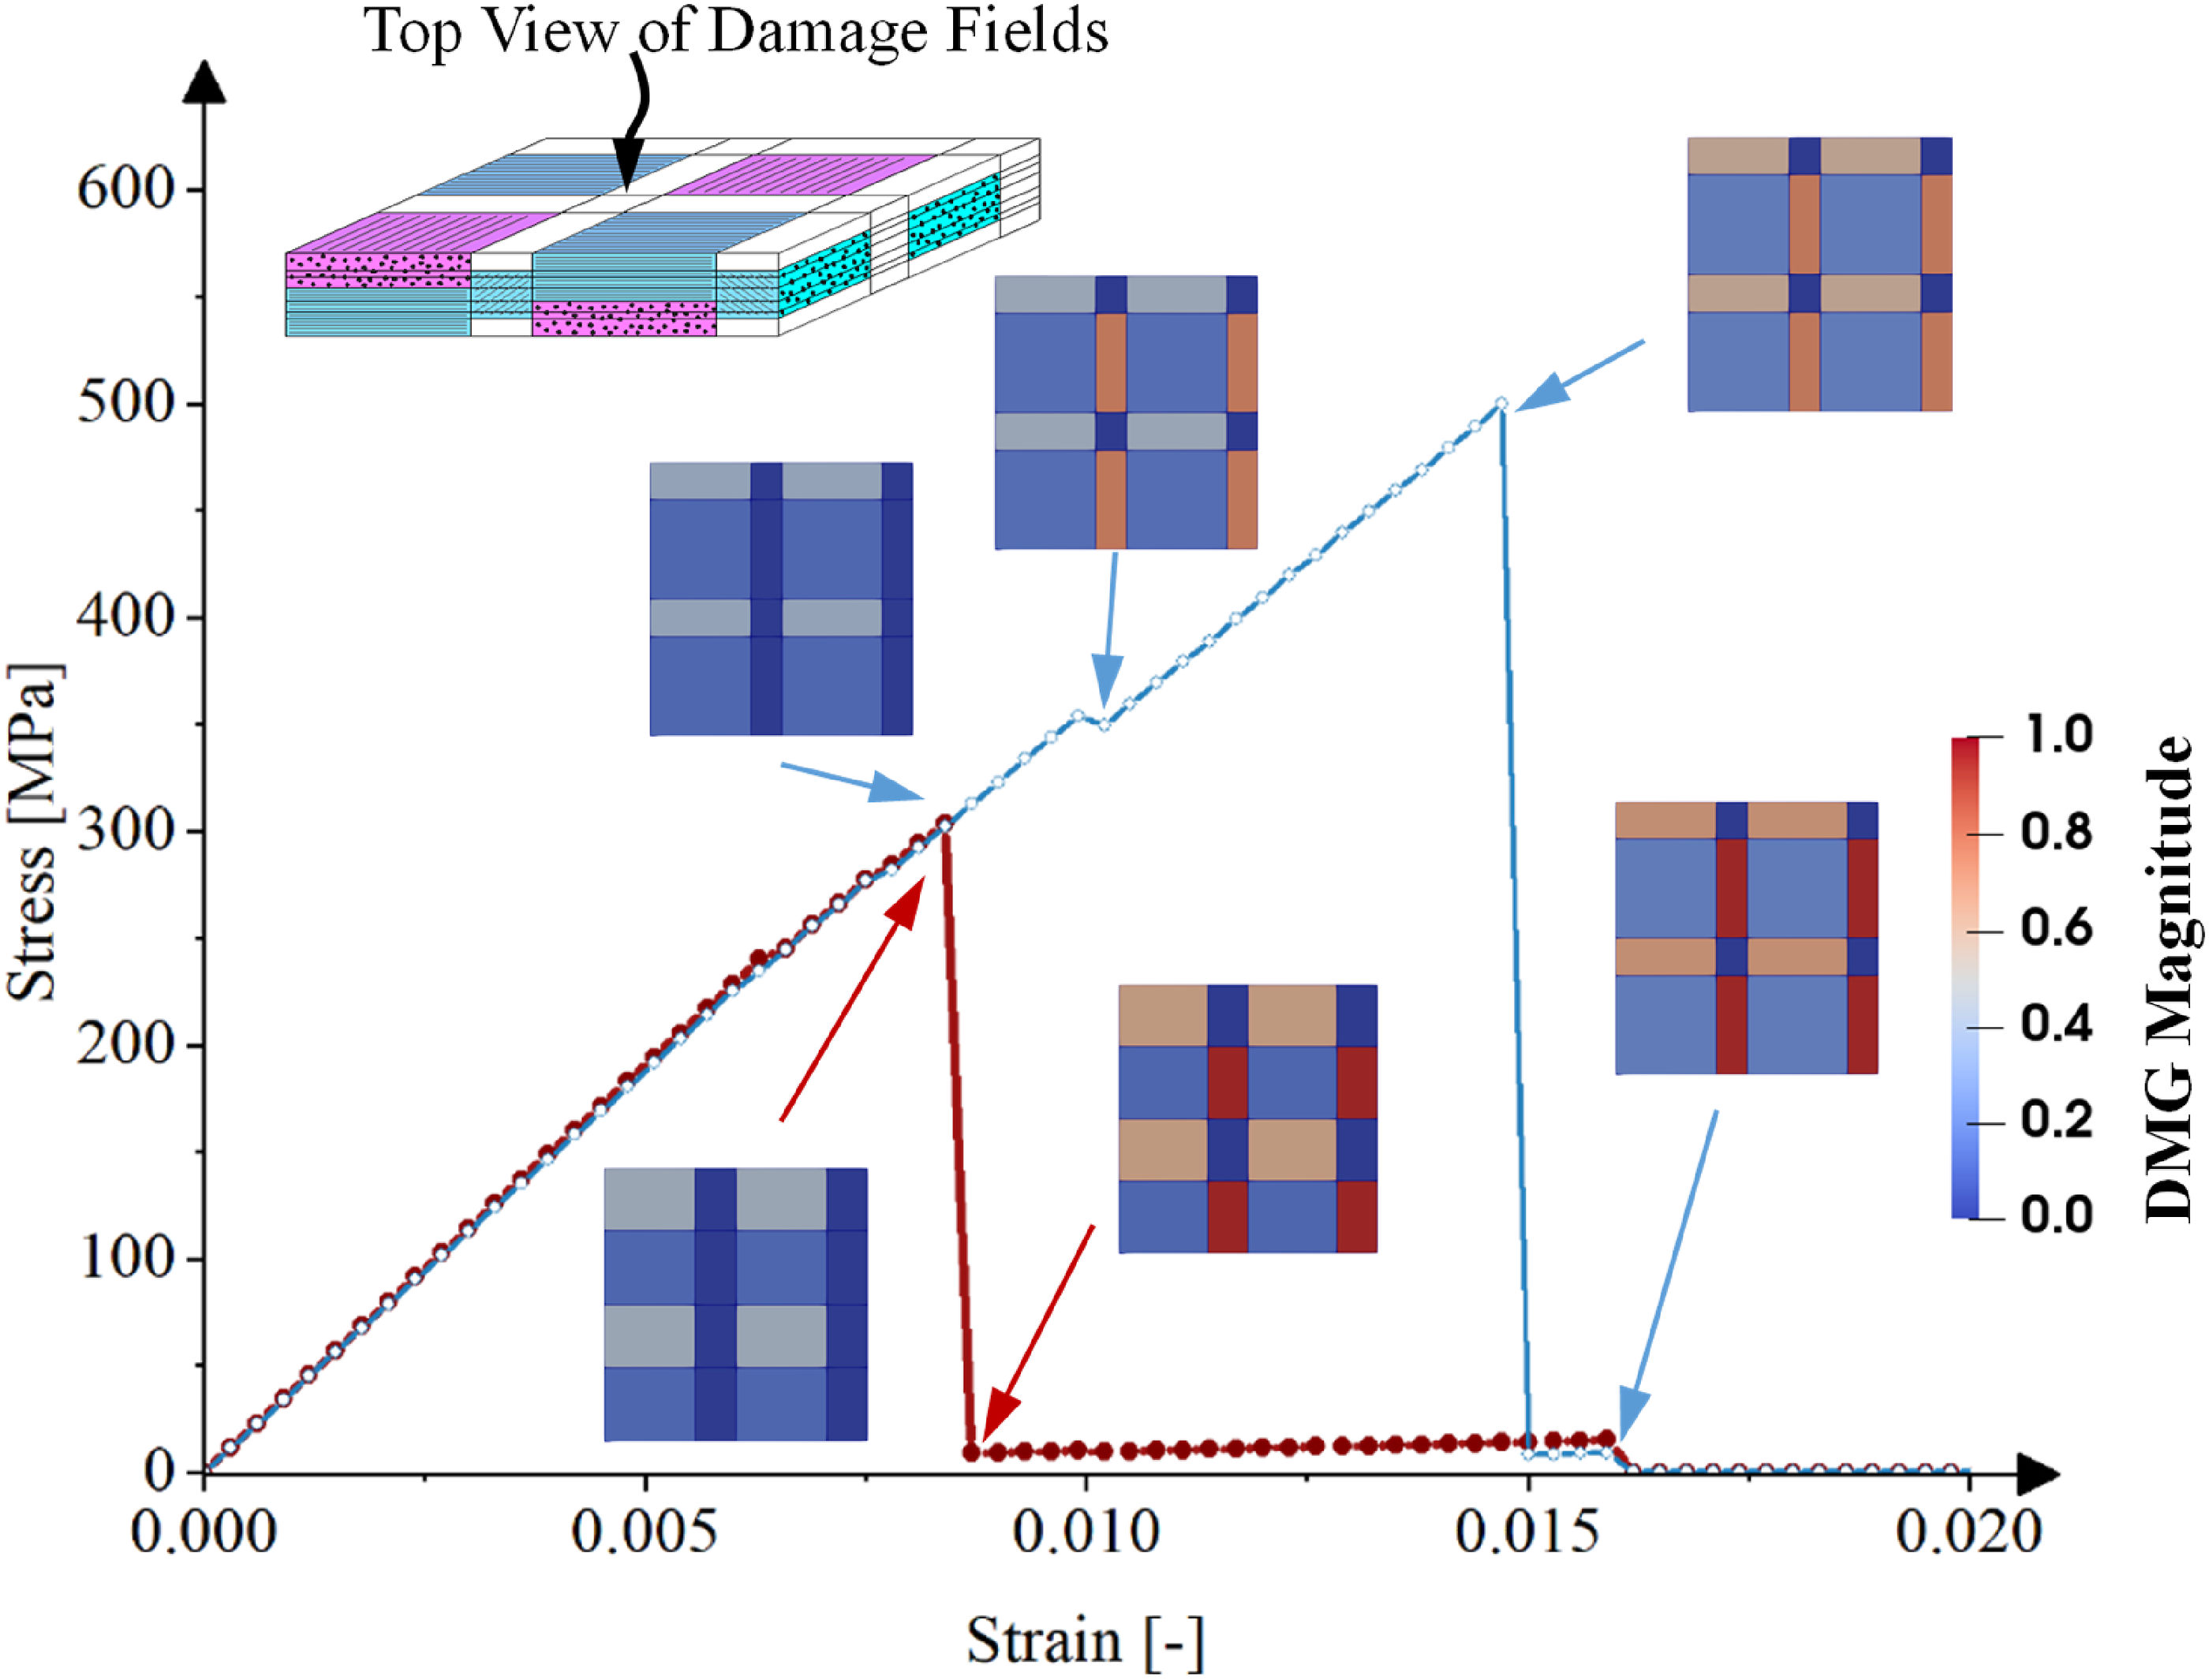
In Figure 14, the red (lower strength) stress-strain curve exhibits some minor damage in the undulation tows oriented transverse to the loading direction prior to final failure at approximately 300 MPa. At this point, the undulation tows oriented in the loading direction fail completely, as do the previously damaged undulation tows oriented transverse to the loading direction. The blue (higher strength) stress-strain curve also exhibits some minor damage in the undulation tows oriented transverse to the loading, but the damage of the undulation tows oriented in the loading direction is delayed to approximately 350 MPa. More importantly, this damage is less severe compared to the lower strength case and it does not couple with additional damage in the previously damaged undulation tows oriented transverse to the loading direction. As such, while there is a slight drop in the stress, the composite survives to a stress of approximately 500 MPa, at which point additional damage has accumulated in the undulation tows oriented transverse to the loading direction. This then leads to complete failure of the undulation tows oriented in the loading direction and the large stress drop indicative of global failure. Thus, the main discriminator between the two failure mode populations shown in Figure 13 for the 24k × 24k composites is the ability to survive damage initiation the undulation tows oriented in the loading direction (which appears to be dependent on many of the random input variables). Interestingly, the final damage pattern is quite similar between the two cases shown in Figure 14, even though the path taken is very different. Finally, note that the damage contours show that no damage is predicted in the four pure matrix regions between the tows. This is because the pure matrix is very low stiffness, and thus these regions experience little stress and contribute little to the overall composite stiffness (although they will eventually fail).
Obviously, the above discussion is applicable only to the 24k × 24k simulation results. There was no indication in the test results of a bimodal strength distribution, nor the discriminator between the populations demonstrated in the predictions. However, only two 24k × 24k tests were performed.
As a final comparison between the model and the test results, Figure 15 shows the mean Young’s modulus and tensile strength. For the simulated results, both the deterministic prediction using mean input properties (from Figure 9) and the mean of the 1000 random instances (from Figure 10) are shown. As discussed, due to the lack of a stiffening mechanism in the model, the Young’s modulus is over predicted. In addition, the predictions of the model using mean input properties match closely with the mean of the 1000 random instances. In contrast, for the tensile strength, there is quite some difference between the predictions of the model using mean input properties and the mean of the 1000 random instances. Further, the means of the 1000 random instances provides better agreement with the mean of the test data in all cases aside from the 24k × 24k. Comparison for the woven composite predicted and experimental (a) mean Young’s modulus and (b) mean tensile strength. For the simulated results, both the deterministic prediction using mean input properties and the mean of the 1000 random instances are shown.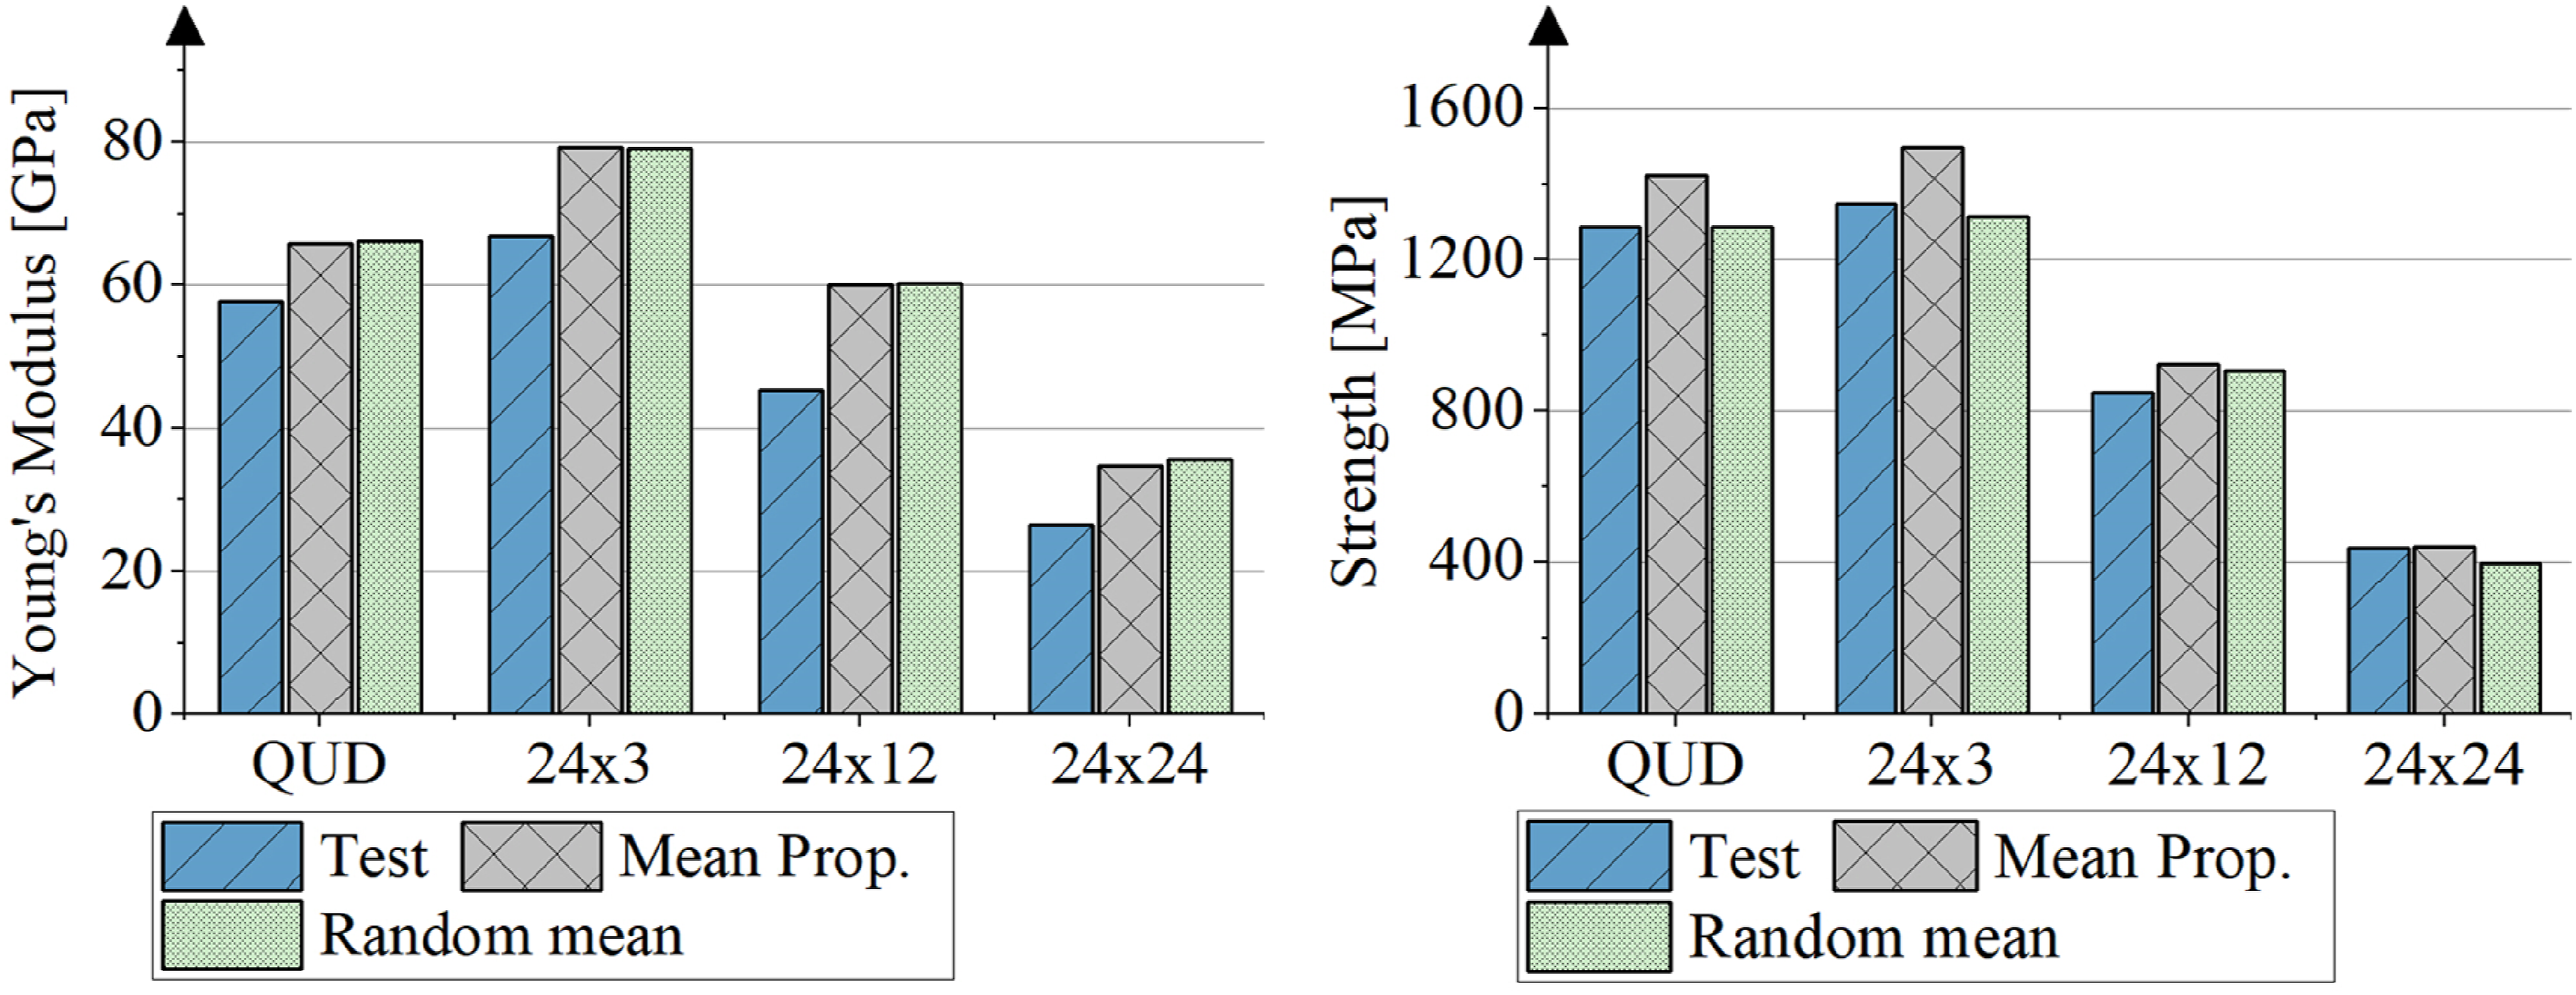
Conclusion
Tensile testing and statistical multiscale model have been executed on unbalanced plain weave composites, created using tows of different sizes in the two in-plane directions. The Multiscale Recursive Micromechanics model in NASMAT software was employed to capture progressive damage at the constituent material level within and between the tows. Microstructural measurements and carbon filament testing provided the necessary statistical constitutive data for the multiscale models. Four types of unbalanced weaves were examined, with 1000 random simulations conducted for each to predict the tensile response and failure strength. Model predictions aligned well with limited experimental results, including the cumulative distribution functions of composite strength. Experimental tensile curves exhibited stiffening that the model did not account for, leading to an overestimation of initial elastic Young’s moduli, but better alignment at intermediate strains. Many simulations indicated failure due to complete matrix section failure, rather than fiber failure, attributed to the model’s scale separation and fiber orientations in the tow undulation regions, resulting in near-zero load-bearing capability once the matrix failed. In reality, significant fiber rotation would occurs, aligning fibers with the load and allowing fiber failure—a capability planned for future model updates. For the 24k × 24k weave, a bimodal strength distribution was predicted. Due to the limited number of experiments, it remains uncertain if this reflects reality, but model results explained it through the ability to withstand damage initiation in the loading-oriented undulation tows. The lower strength group failed shortly after this damage initiation, while the higher strength group did not experience immediate damage progression.
Integrating micromechanical models into the design process makes it possible to account for variable properties at constituent level. In most of the design exercises, though a distribution of material data is available, often a mean value is considered. Incorporating this distribution data in to the micromechanical model developed in this study offers a more comprehensive understanding of the failure mechanisms thereby enhancing the accuracy and reliability of the analysis.
Footnotes
Acknowledgments
The first author acknowledges support from the German Federal Ministry for Economic Affairs and Climate Action for funding the project TowpregBraid (KK5055931KU1) as part of the ZIM innovation program. The authors thank the German federal and state government (BMBF & MWK) for funding the Theodore von Kármán Fellowship (GS132) under the Excellence Strategy. B.A. Bednarcyk acknowledges the NASA Space Technologies Mission Directorate Cryotank Technology for Exploration Applications (CTE-A) project.
Declaration of conflicting interests
The author(s) declared no potential conflicts of interest with respect to the research, authorship, and/or publication of this article.
Funding
The author(s) disclosed receipt of the following financial support for the research, authorship, and/or publication of this article: this work was supported by the German Federal Ministry for Economic Affairs and Climate Action; KK5055931KU1 and Theodore von Karman Fellowship; GS132.
Data availability statement
All relevant data is available in this manuscript.