
Abstract
Composite laminates, known for their strength and flexibility, are widely used but can delaminate under certain barely visible impact. Ultrasound Transmission (UT) scans can detect such failures, but the noise in the scans makes automation of delamination morphology challenging. Machine learning could solve this, but it requires substantial training data. Furthermore, given the considerable time and cost of conducting impact tests on composite laminates, such data remains sparse. This study overcomes data sparsity by enlarging UT scan dataset using image augmentation techniques and synthetic data generation methods. A combination of rotation and elastic deformation of real UT images produced augmented data. Synthetic data was generated by mimicking the statistical variations in real data, including delamination length and rotation per ply, and adding gradients to match the original image noise. A U-Net based machine learning segmentation approach was utilized to capture local and global information through a series of convolutions to apply per-pixel classification. Systematic experimentation was conducted to study the influence of adding augmented and synthetic data on segmentation accuracy. The results show that the use of augmented data increases accuracy significantly. With the addition of synthetic data to the augmented data, there is a marginal improvement in accuracy. However, feature edge accuracy is significantly improved. The preliminary results presented here show the promising use of machine learning techniques for complex, non-destructive inspection methods.
Introduction
Composite laminates are used in various complex applications in aerospace structures due to their high strength-to-weight ratio, adaptability, and distinct material properties. 1 However, due to the laminated nature of the composite structures, it is especially susceptible to delamination damage under impact loads, in which the ply of the composite begins to pull apart, negatively affecting properties such as compressive strength.2,3 Delamination caused by low-velocity impact (LVI) is especially dangerous2,4 because extensive interior damage may have little or no visible indications on the impact surface. When not detected, this can cause catastrophic structural failure.
Several non-destructive evaluation methods have been used to find these internal barely visible impact damage (BVID) delamination areas, 5 including infrared thermography and sherography. 6 The primary drawback of any of these techniques is the difficulty of translating damage information obtained to the criticality of the damage. The criticality of delamination can only be understood by linking the damage to other measures like compression after impact (CAI) strength, delamination growth, or lifing measures. Such measures generally require accurate delamination information, not just as an overall delamination but also ply-by-ply delamination. Of all these methods listed, an ultrasound scan provides a reasonable estimate of delamination area morphology. Moreover, ultrasound scans also provide the depth information of the delamination areas, 7 in the form of A, B, and C scans. The information is then conveyed to the operator, who decides the next action. Typically, this is a choice between repair, pass, or fail. Furthermore, certification agencies or airframers have yet to have a consensus on the criteria used for such decisions. Therefore, there is a need for a more objective decision-making approach to provide operators with the means to make informed decisions. One approach would be automating the post-processing of information collected from UT scans, which first converts raw UT information to machine-readable or segmented and categorized UT data. However, automating the segmentation of these scans for per-ply delaminations is challenging because the delamination within the interface varies in depth. Moreover, ultrasound scans, in general, are susceptible to noise and are relatively difficult to overcome, especially when used in the field with human operators. 8
Traditionally, segmenting these images has been done using a variety of methods. Douglass et al. found and segmented hidden simulated delaminations using a combination of pitch-catch ultrasound testing and an agglomerative clustering method. 9 Multiple studies have attempted simple thresholding operations to get a binary map to find defects.10,11 In contrast, others have attempted to use edge detection for segmentation.12,13 Some have created applications using a combination of all of the above.14,15 Several recent advances have been made to categorize and segment such images. One of these recent advancements is the increasing application of convolution-based networks. These networks are commonly used in the segmentation of ultrasound scans for medical purposes, 16 such as detecting breast tumoral tissue, 17 analyzing lung regions, 18 finding fetal head locations, 19 and detecting Hepatocellular Carcinoma areas. 20 However, such usage has been spread to non-destructive testing as well. Pyle et al. 21 showed that training convolutional networks based on finite element and ray-based simulated ultrasound scan data can accurately characterize crack characterization in an inline pipe better than traditional methods. Duan et al. used various deep learning models to find the overall impact damage area of several types of fiber reinforced composites using ultrasound scans. 22 Other studies, such as those done by Sammons et al. 23 have patched and fine-tuned convolutional neural networks to find individual simulated and real delaminations of different intensities in composites. Meng et al. 24 used deep learning networks on wavelet coefficients to denoise, compact, and clarify an A-scan signal, which is then used to create a segmented C-scan ultrasound image.
Various popular convolutional neural networks (CNN) are used, such as Resnet, Alexnet, GoogLeNet, PSPNet, and VGG 16 Networks.25–27 One of these networks is U-Net, a highly accurate and flexible architecture used for segmentation tasks.28,29 This architecture applies pixel-wise semantic segmentation through its ability to capture global and local context information through encoder-decoder networks. 30 One common limitation of using CNNs is that they require a large amount of data to train on to attain high accuracy. 31 Another limitation is that the training takes a significant amount of time, depending on the data used and the model size. There have been various approaches proposed to overcome these limitations; for example, the addition of synthetic and augmented data to the training dataset can improve the accuracy of the results,32–34 and reduce the amount of overfitting of data, in which the model memorizes noise and does not generalize data trends. 35
With the challenges associated with UT-based inspection listed above and the advancement of machine learning techniques like CNN, the current study explores the use of CNN in segmenting UT scans of delaminated composites to obtain ply-by-ply information. Among the various CNN methods available, this study focuses on U-Net-based image segmentation of physical ultrasound c-scans, given only sparse real data sets, which are then expanded using augmented and synthetic data. The section below details the data collection, data augmentation, and synthetic data generation. Following this, the U-Net CNN model is described. Then, in the methodology section, studies conducted to understand the influence of augmented and synthetic data are detailed. The paper finishes with results and conclusions as the final two sections.
Data sets
The three types of data sets used to train and test machine learning were real data (RD), augmented real data (AD), and synthetic data (SD). This study utilized a BVID delamination pattern for 16-ply composite laminate with stack-up angle [45, 0, −45, 0, 45, 90, −45, 0] s as reported in Seamone et al. 2 The interfaces studied are numbered from the impact side, which is also the scan side, to the bottom of the laminate. The sections below detail the generation and processing of each dataset.
Real data set
The ultrasound scans used here were from Seamone et al.,
2
where laminate samples were impacted with varying impact energies. Panels of 178 mm × 178 mm, secured within a 152 mm × 152 mm fixture with simply supported boundary condition, were impacted at the center of the panel with a steel impactor of 25.4 mm diameter and 8.53 kg. The post-impact scanning process utilizes a phased array ultrasound transducer that captured a 32 mm × 32 mm area at a time, as shown in Figure 1. When delaminations extend beyond a single capture area, scans were stitched together using the system’s built-in image processing capabilities. The Time Of Flight (TOF) signal provides information about the delamination depth within each sample by recording the time taken for a signal to penetrate the material, reflect off the damage, and return to the transducer. It is important to highlight that a UT signal reflects off the closest delamination to the transducer. Therefore, the UT signal does not provide information about delaminations below the first reflected layer. Consequently, the UT scan only offers a top-down perspective of the damage and does not capture the entire damage pattern. The depth of damage was calculated by combining TOF data with the signal’s speed and the known thickness of the sample. Dolphicam portable UT scanner with 32 mm × 32 mm 5 MHz phase array transducer probe used in measuring delamination present within impacted test panels. The probe is place in position, with Sono gel, and slight pressure is applied by hand and image is captured.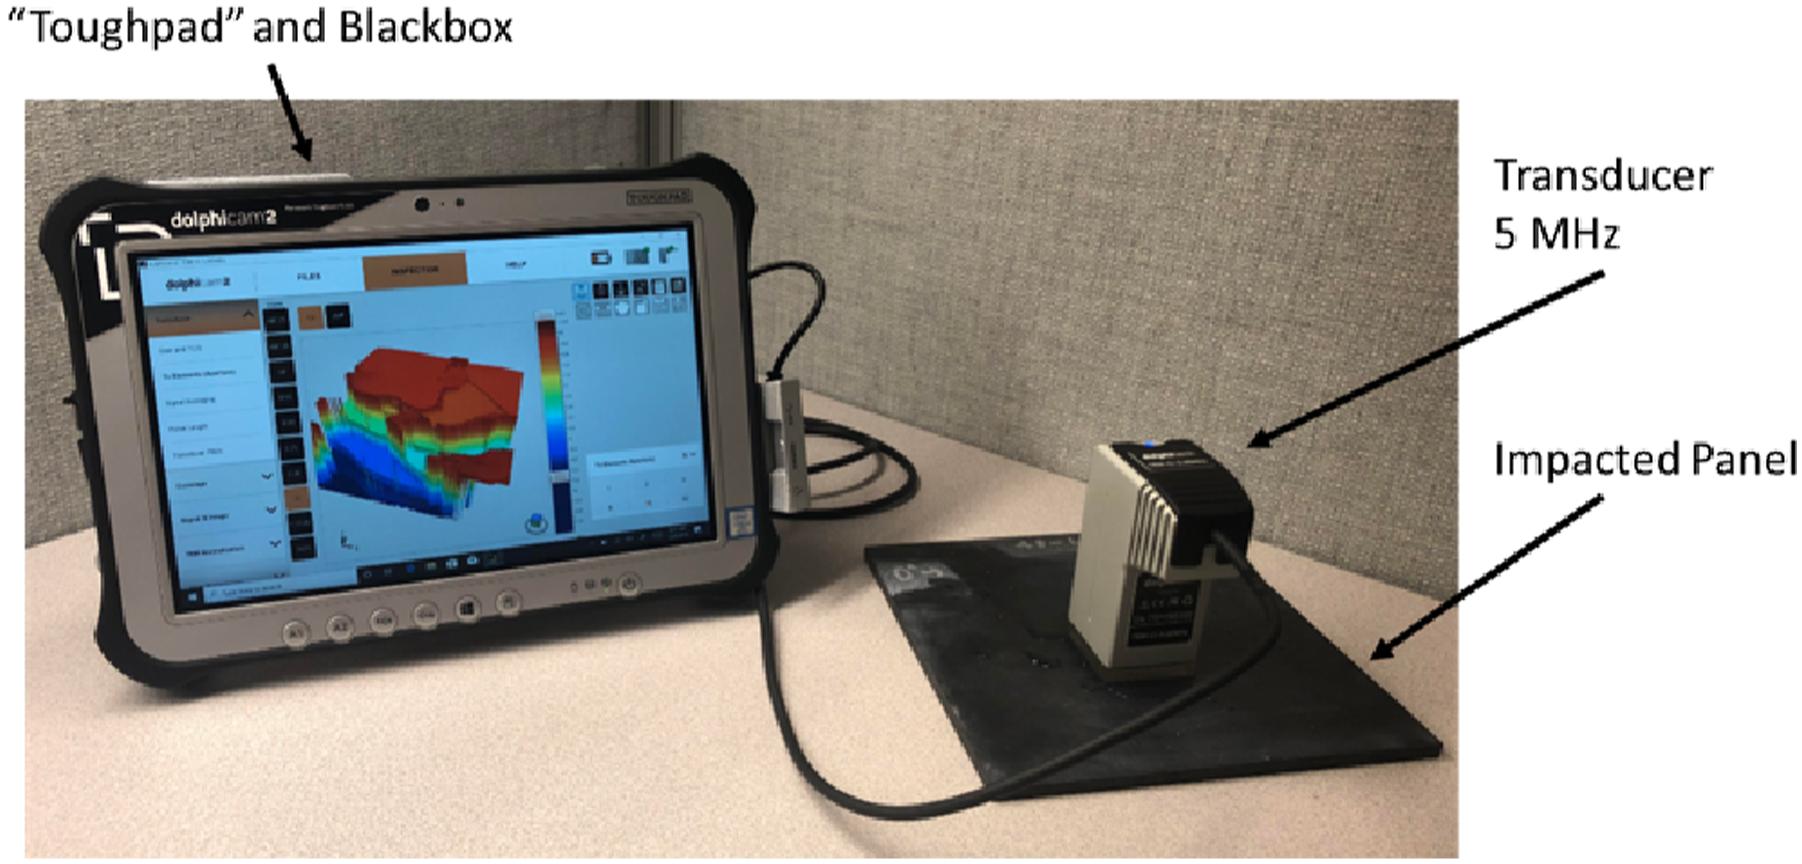
A real data (RD) set of 19 UT scans obtained as raw HD5 files was converted to 512px × 512px colored PNG image, using H5PY and NumPy library. Figure 2 shows a complete set of images. Note that the color map used in the figure is only for representation of delamination depth and is inconsequential to the actual machine learning model as all images were automatically converted to greyscale for training and testing. Real data (RD) set of 19 images in total, all scaled to 512 × 512 px size. Scanned from 16 Ply, 15 interface composite. Depth [mm] from the top impact surface and the scanning surface.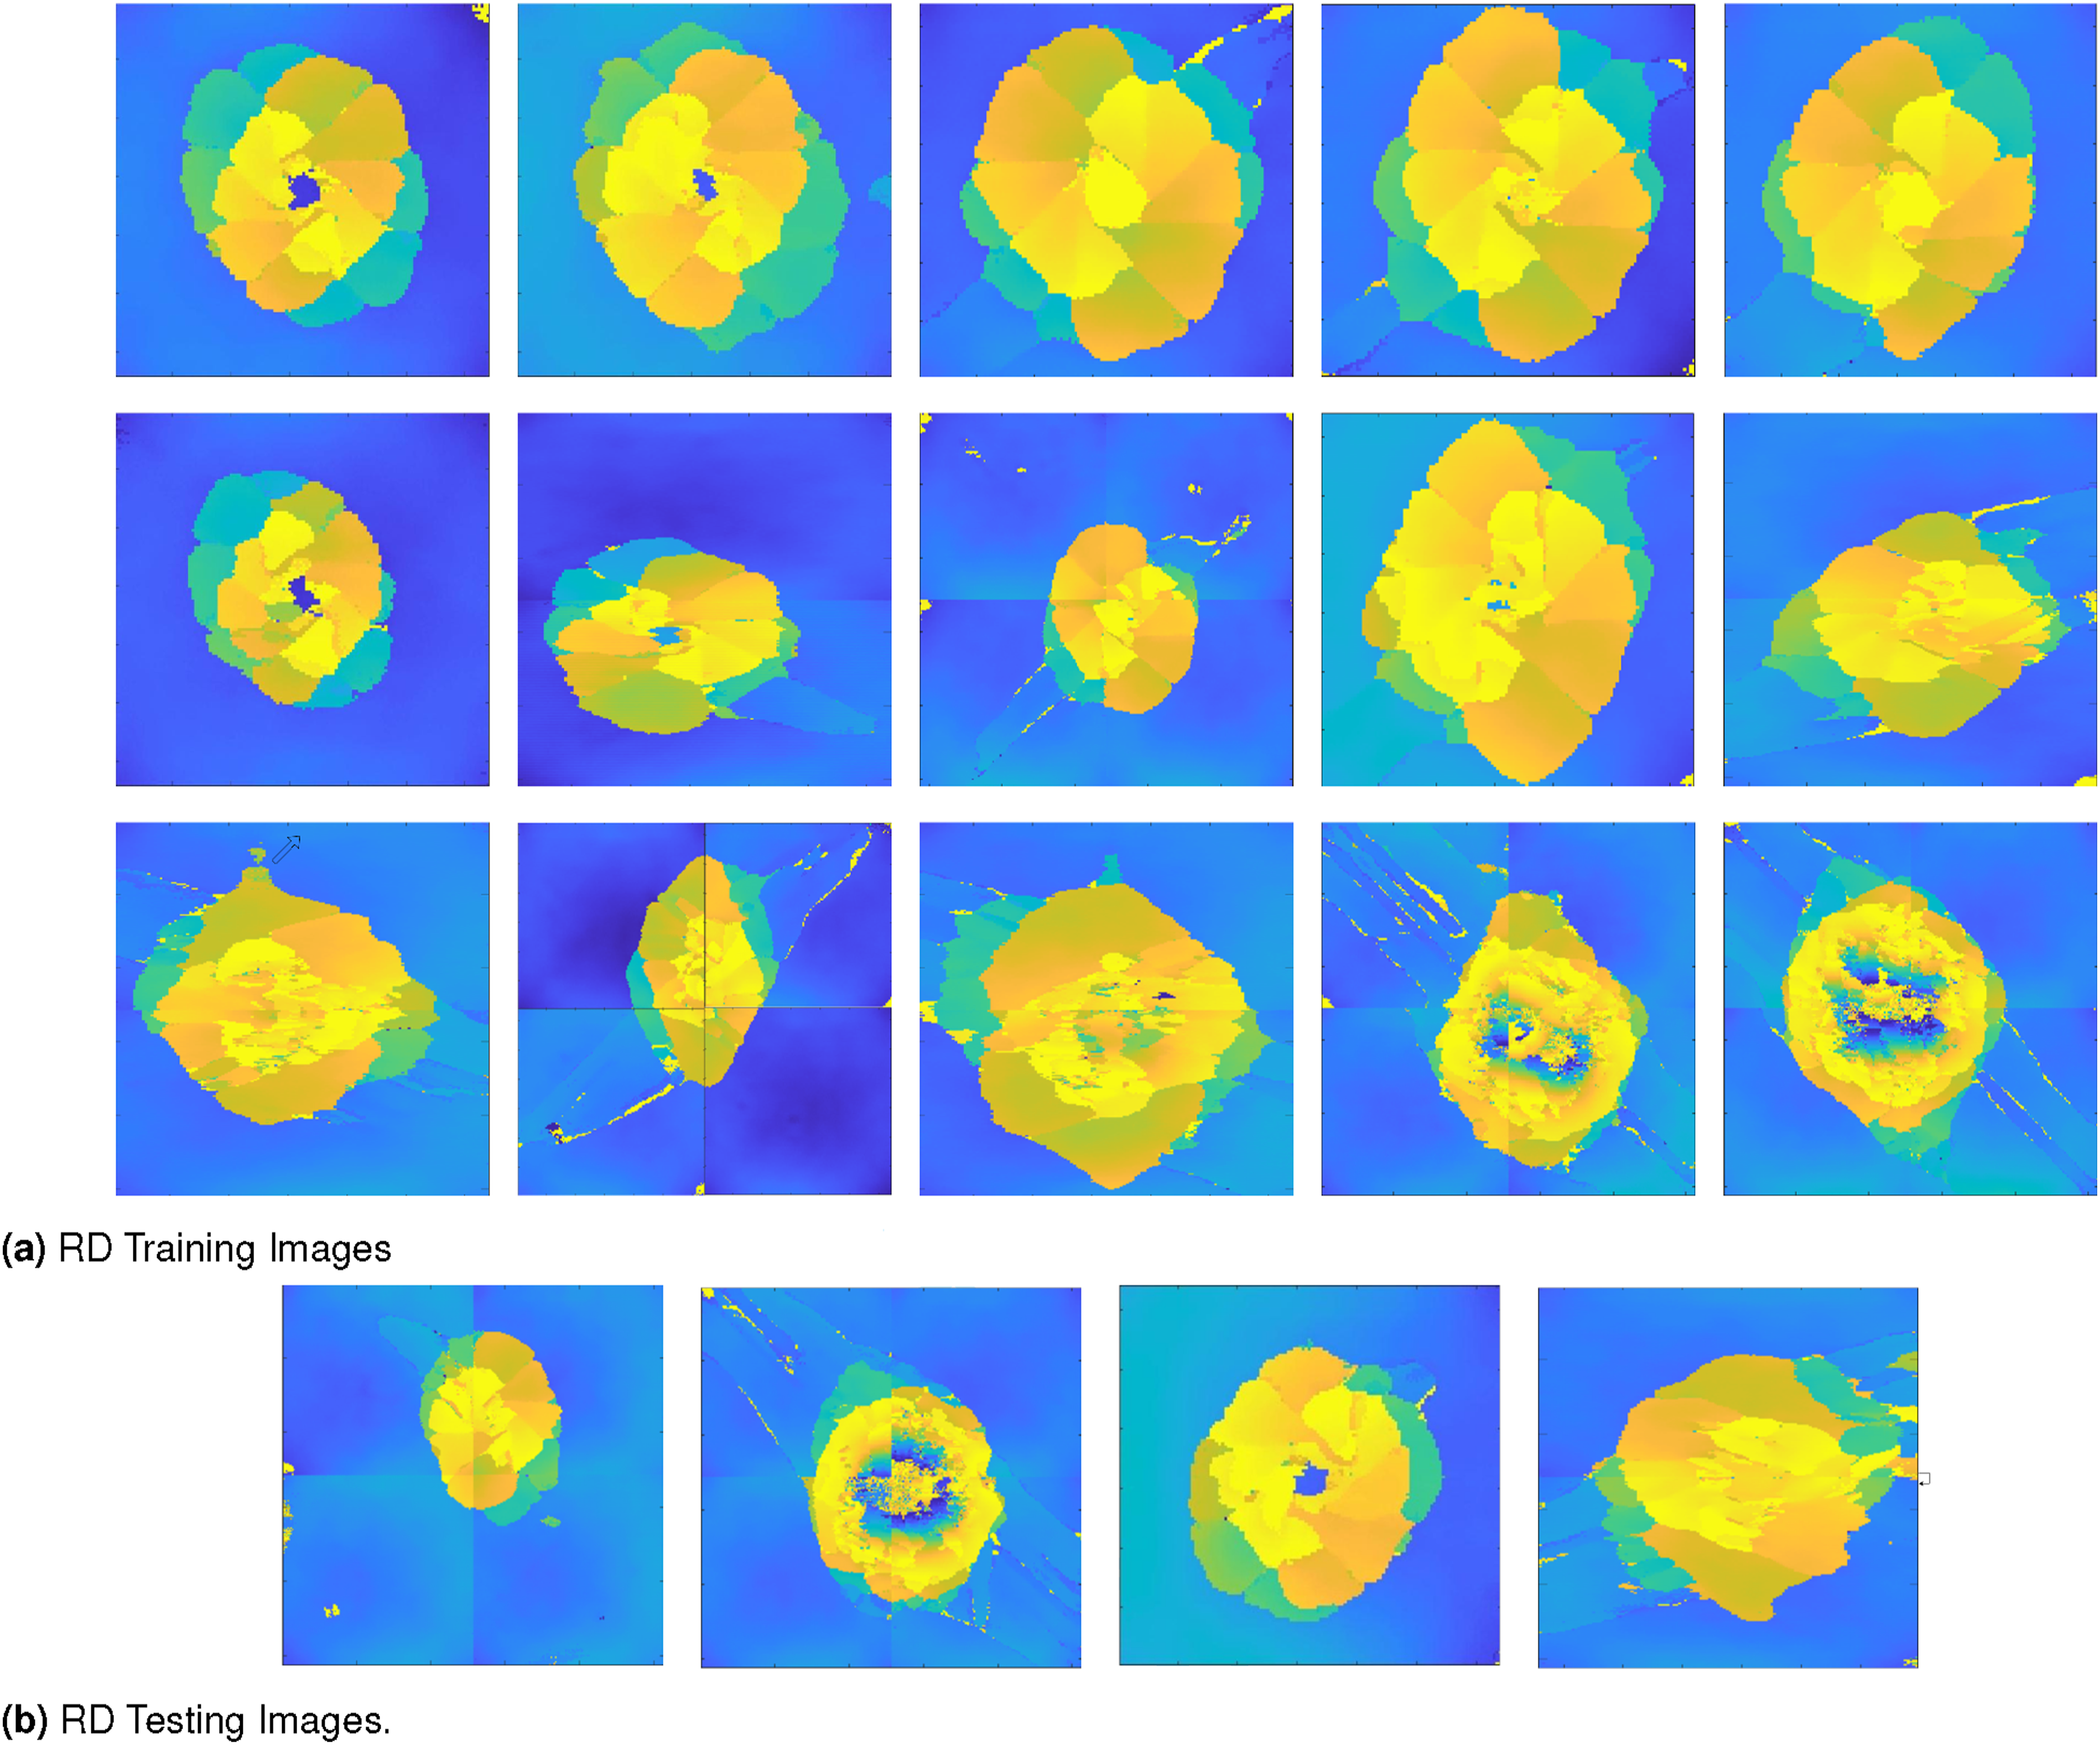
According to the observations in Figure 1, in addition to the complicated delamination pattern, each image in the UT scan has a gradient in color, resulting from uneven contact of the transducer with the surface of the laminate. Since these scans were obtained using a handheld device, such gradients could be expected in the actual use cases. Additionally, stitching of images may produce artifacts, especially at the stitch lines. These are the primary causes for ineffective delamination pattern segmentation using typical segmentation techniques like edge detection and thresholding.
Augmented data set
One approach to increase the available dataset would be to use RD and add augmented or transformed RD images to it. Augmentation can be achieved using various transformation methods like isotropic or anisotropic scaling, rotation, elastic deformation, and any combination of said methods. For this study, rotation, mirroring, and elastic deformation were applied to generate data using Augmentor library.
36
Figure 3 illustrates the type of images generated. When a square image is rotated, the corners of a new image are unfilled. The empty areas are filled by mirroring the original image along the un-transformed image, as shown in Figure 3. By mirroring the features contained within the filled region, it still adheres to the original image. With such transformation, the general features of the image, like petal-shaped delamination, gradients in measurements, and relative positioning of delaminations, are similar to real data. However, if the image is significantly distorted, it can lead to a loss of context, creating difficulties in learning rates and even accuracy. Sample of Augmented Data (AD) dataset generated for this study.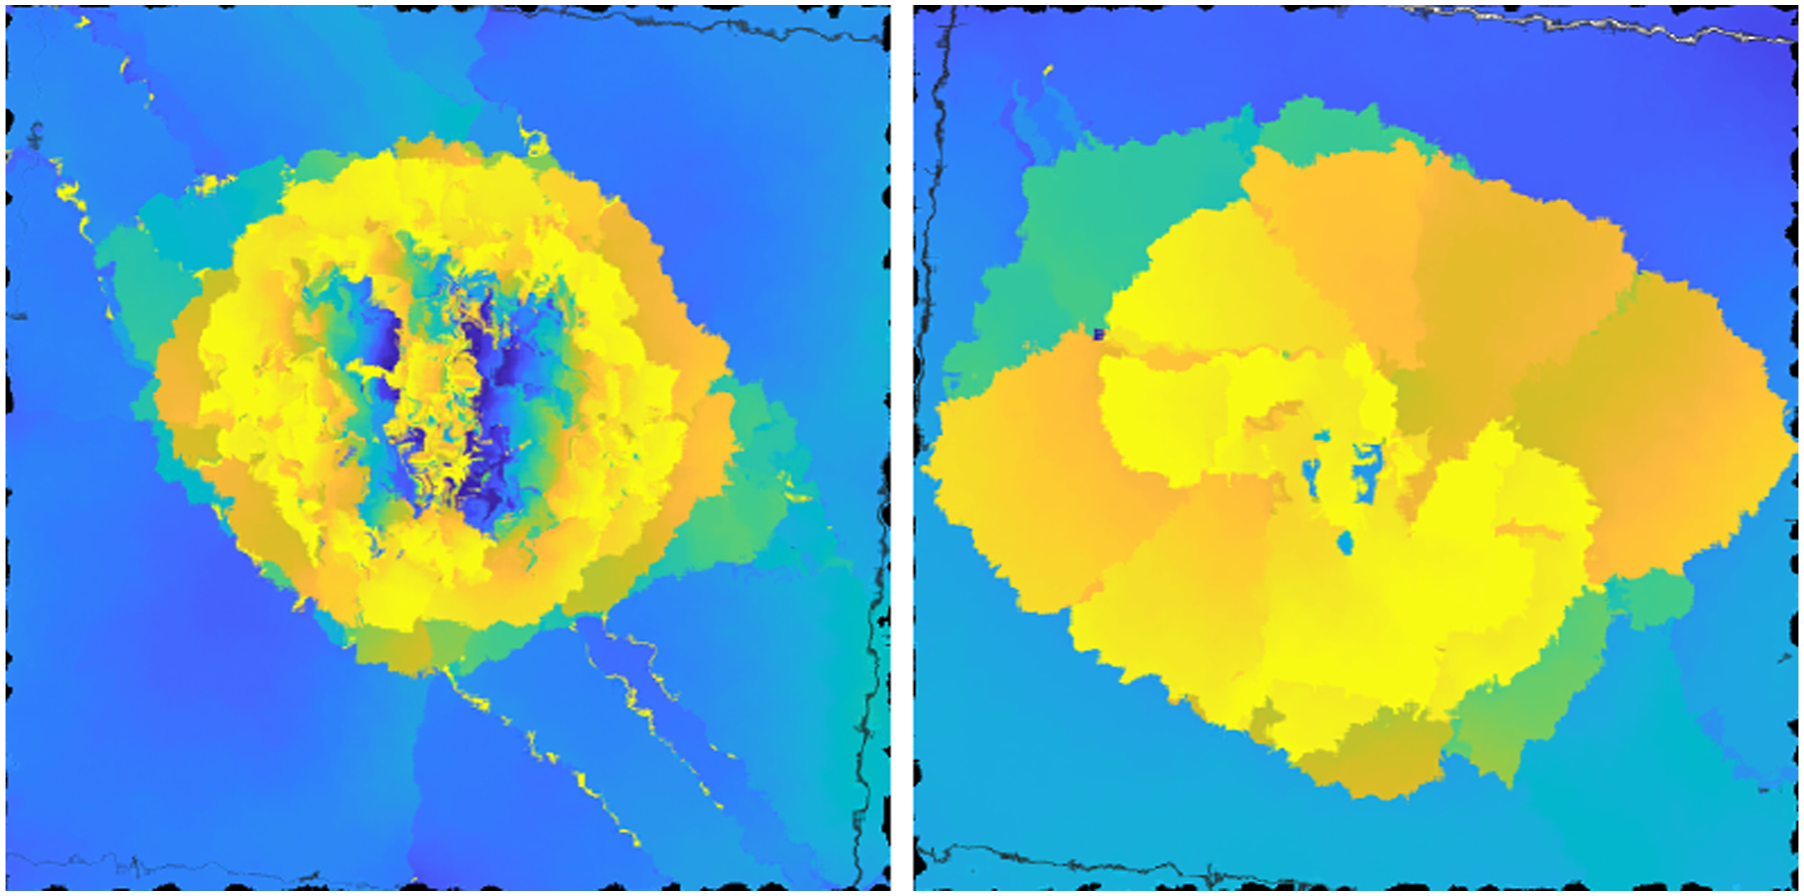
Synthetic data set
Another approach to increasing data is to generate synthetic or pseudo-representative data that mimics the RD set. The SD set should be based on realistic patterns seen in the UT scans. From the UT scans, a few observations can be made; first, the delamination ”petal” pattern is symmetric and constrained between two nearly straight edges aligned with the fiber angle corresponding to the interface top and bottom plies. Second, the pattern increases in size and rotates about a center with increasing depth. With these two observations, it is possible to create a simplified representation of the delamination pattern on each ply, as shown in Figure 4. Parameterized delamination at each interface, used for generation of synthetic delamination patterns. R
c
is the radius of circular area under the impactor that does not undergo delamination. L
e
is the length of edge of delamination petal on interface 3. R
a
is the arc radius of petal on interface 3. r
e
and r
a
are the scaling ratio used for the edge and arch respectivly, used to generate delamination petals on other interfaces, and are listed in Table 1. θ
n
and θn+1 are the lamination fiber direction angles on the bottom and top of the interface.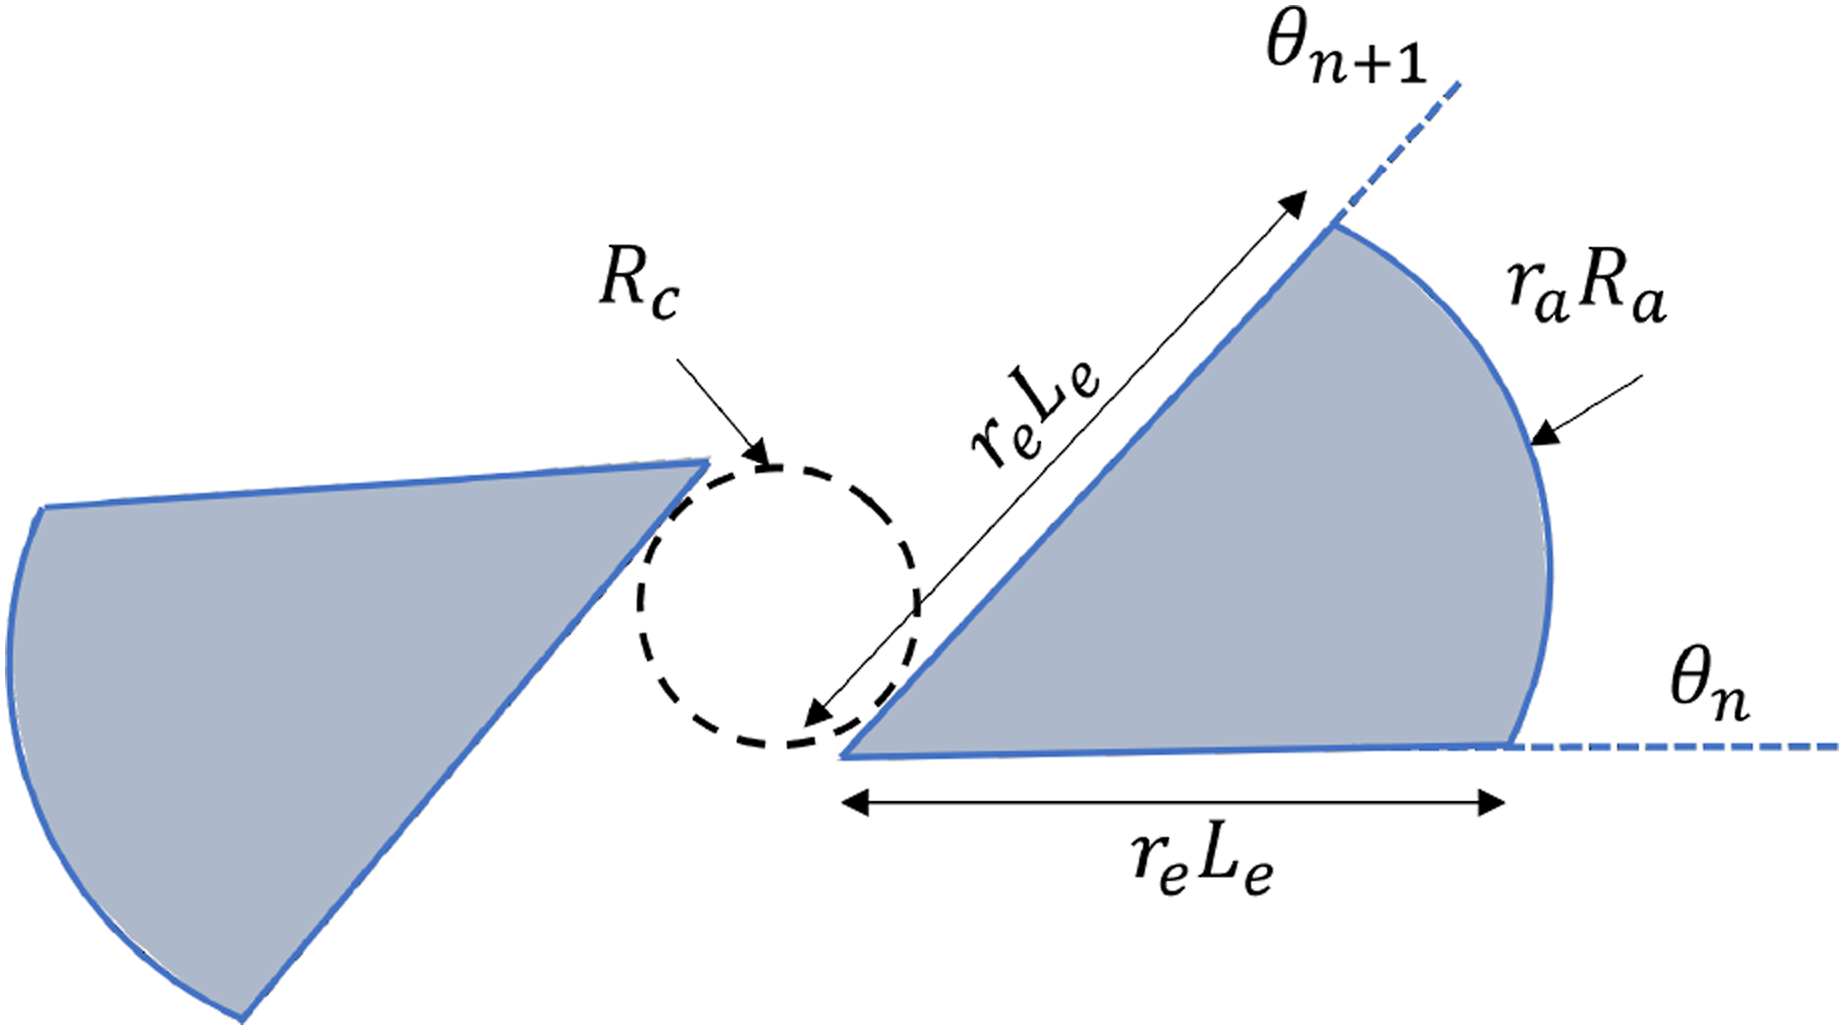
Statistical data for petal edge and arc scaling for synthetic data generation.
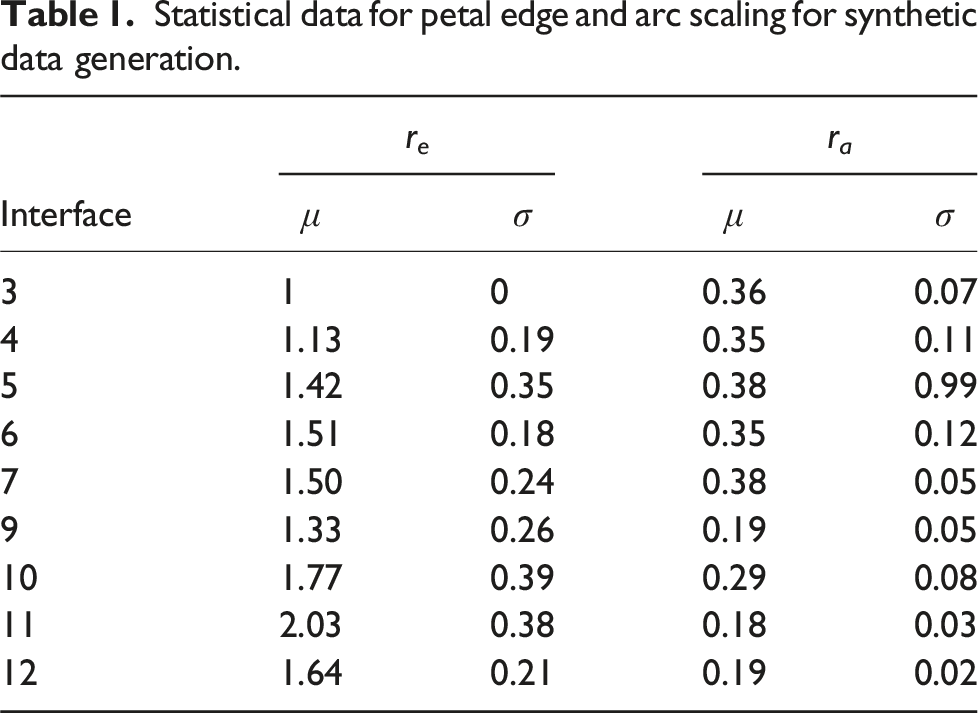
The measurements from the delamination patterns in the RD were used to generate synthetic data. The RD shows that the only visible delaminations are from the top and center interfaces, primarily in interfaces 3,4,5,6,7,9,10,11, and 12. Thus, the SD was created with delaminations in the interfaces for which delaminations were observed in the RD. Petal edge and arc radius scaling ratios were sampled from normal distributions and used as parameters in a Python program to create the input and output synthetic data. The synthetic geometry was created using the Tkinter library. 37 The script creates the general center of impact and places the petals on the edges of the impact area going outwards. The petal delaminations corresponding to the lower interfaces (a higher depth) were drawn first, and subsequent lower dept delaminations were overlayed, thereby creating synthetic UT scan data.
Additionally, to capture the variation in depth seen in RD, a gradient was introduced within each petal. Using a Python code, a mask is applied to the individual instance of particular colored petals to vary the color from the center outwards. For example, a gradient applied to the delamination petal on interface 4 will have a color variation corresponding to the depth of interface 4 to interface 3, as depicted in Figure 5. Example of synthetic data generated with gradient on each delamination petal.
Ground truth set
For training and testing, “Labeled Truth” images data set were generated. In each of the 19 RD images, each delamination layer was labeled manually, based on the interface location, using the LableMe tool.
38
Figure 6 shows a sample of real and labeled image data, with each label color representing delamination at different layers and one label for the background. Since AD was generated using transformations, the same transformations were applied to generate corresponding ground truth data for the model. For SD, simply removing the gradient provides the truth model. Left: Sample of real data. Right: Truth model with labeled delamination patterns based on delamination depth.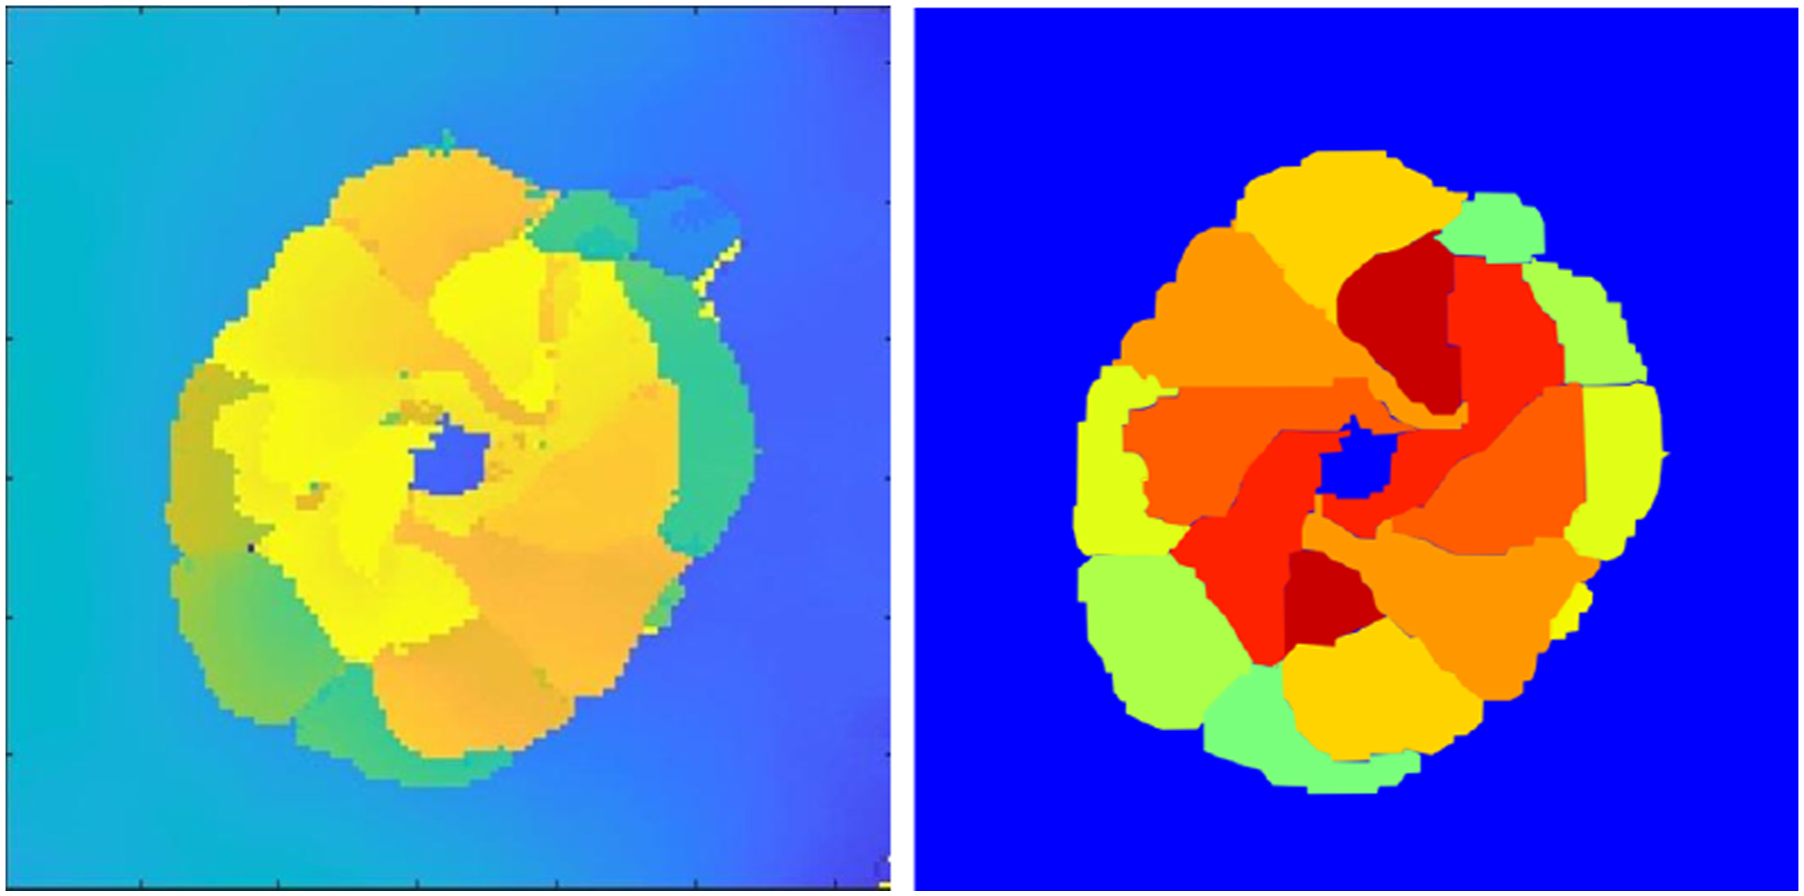
Machine learning model
The machine learning model used for segmentation was developed in-house using TensorFlow library
39
following the Ronnenberger et al.
30
U-Net model architecture and is depicted in Figure 7. The input to the model is the 512px × 512px colored PNG image of UT scan, and the outputs are the N + 1 feature maps, where N is the number of interfaces. The model is based on a convolutional neural network (CNN) consisting of an encoder (contracting path) and a decoder (expansive path). Each 3 × 3 convolution in the encoder is followed by a rectifier linear unit (ReLU). The output of each layer is down-sampled in the successive layers, using a max-pooling of stride 2. Downsampling in the encoder provides abstracted information on delamination layers. The information has to be rebuilt to capture the spatial context, which requires a decoder or expansive path. The decoder employs up-sampling of each layer using 2 × 2 up-convolutions with halved feature channels compared to previous layers. Two 3× 3 convolutions are used in each layer, followed by a ReLU. Intermediate concatenation operations are performed to combine feature maps from encoder layers to decoder layers. Dimensions of feature maps are converted to a number of classes using a 1 × 1 convolution. The number of feature maps is set a priori to N + 1, where N is the number of interfaces to which the background layer is added as a class. U-Net architecture used for this study developed based on Ronnenberger et al.
30
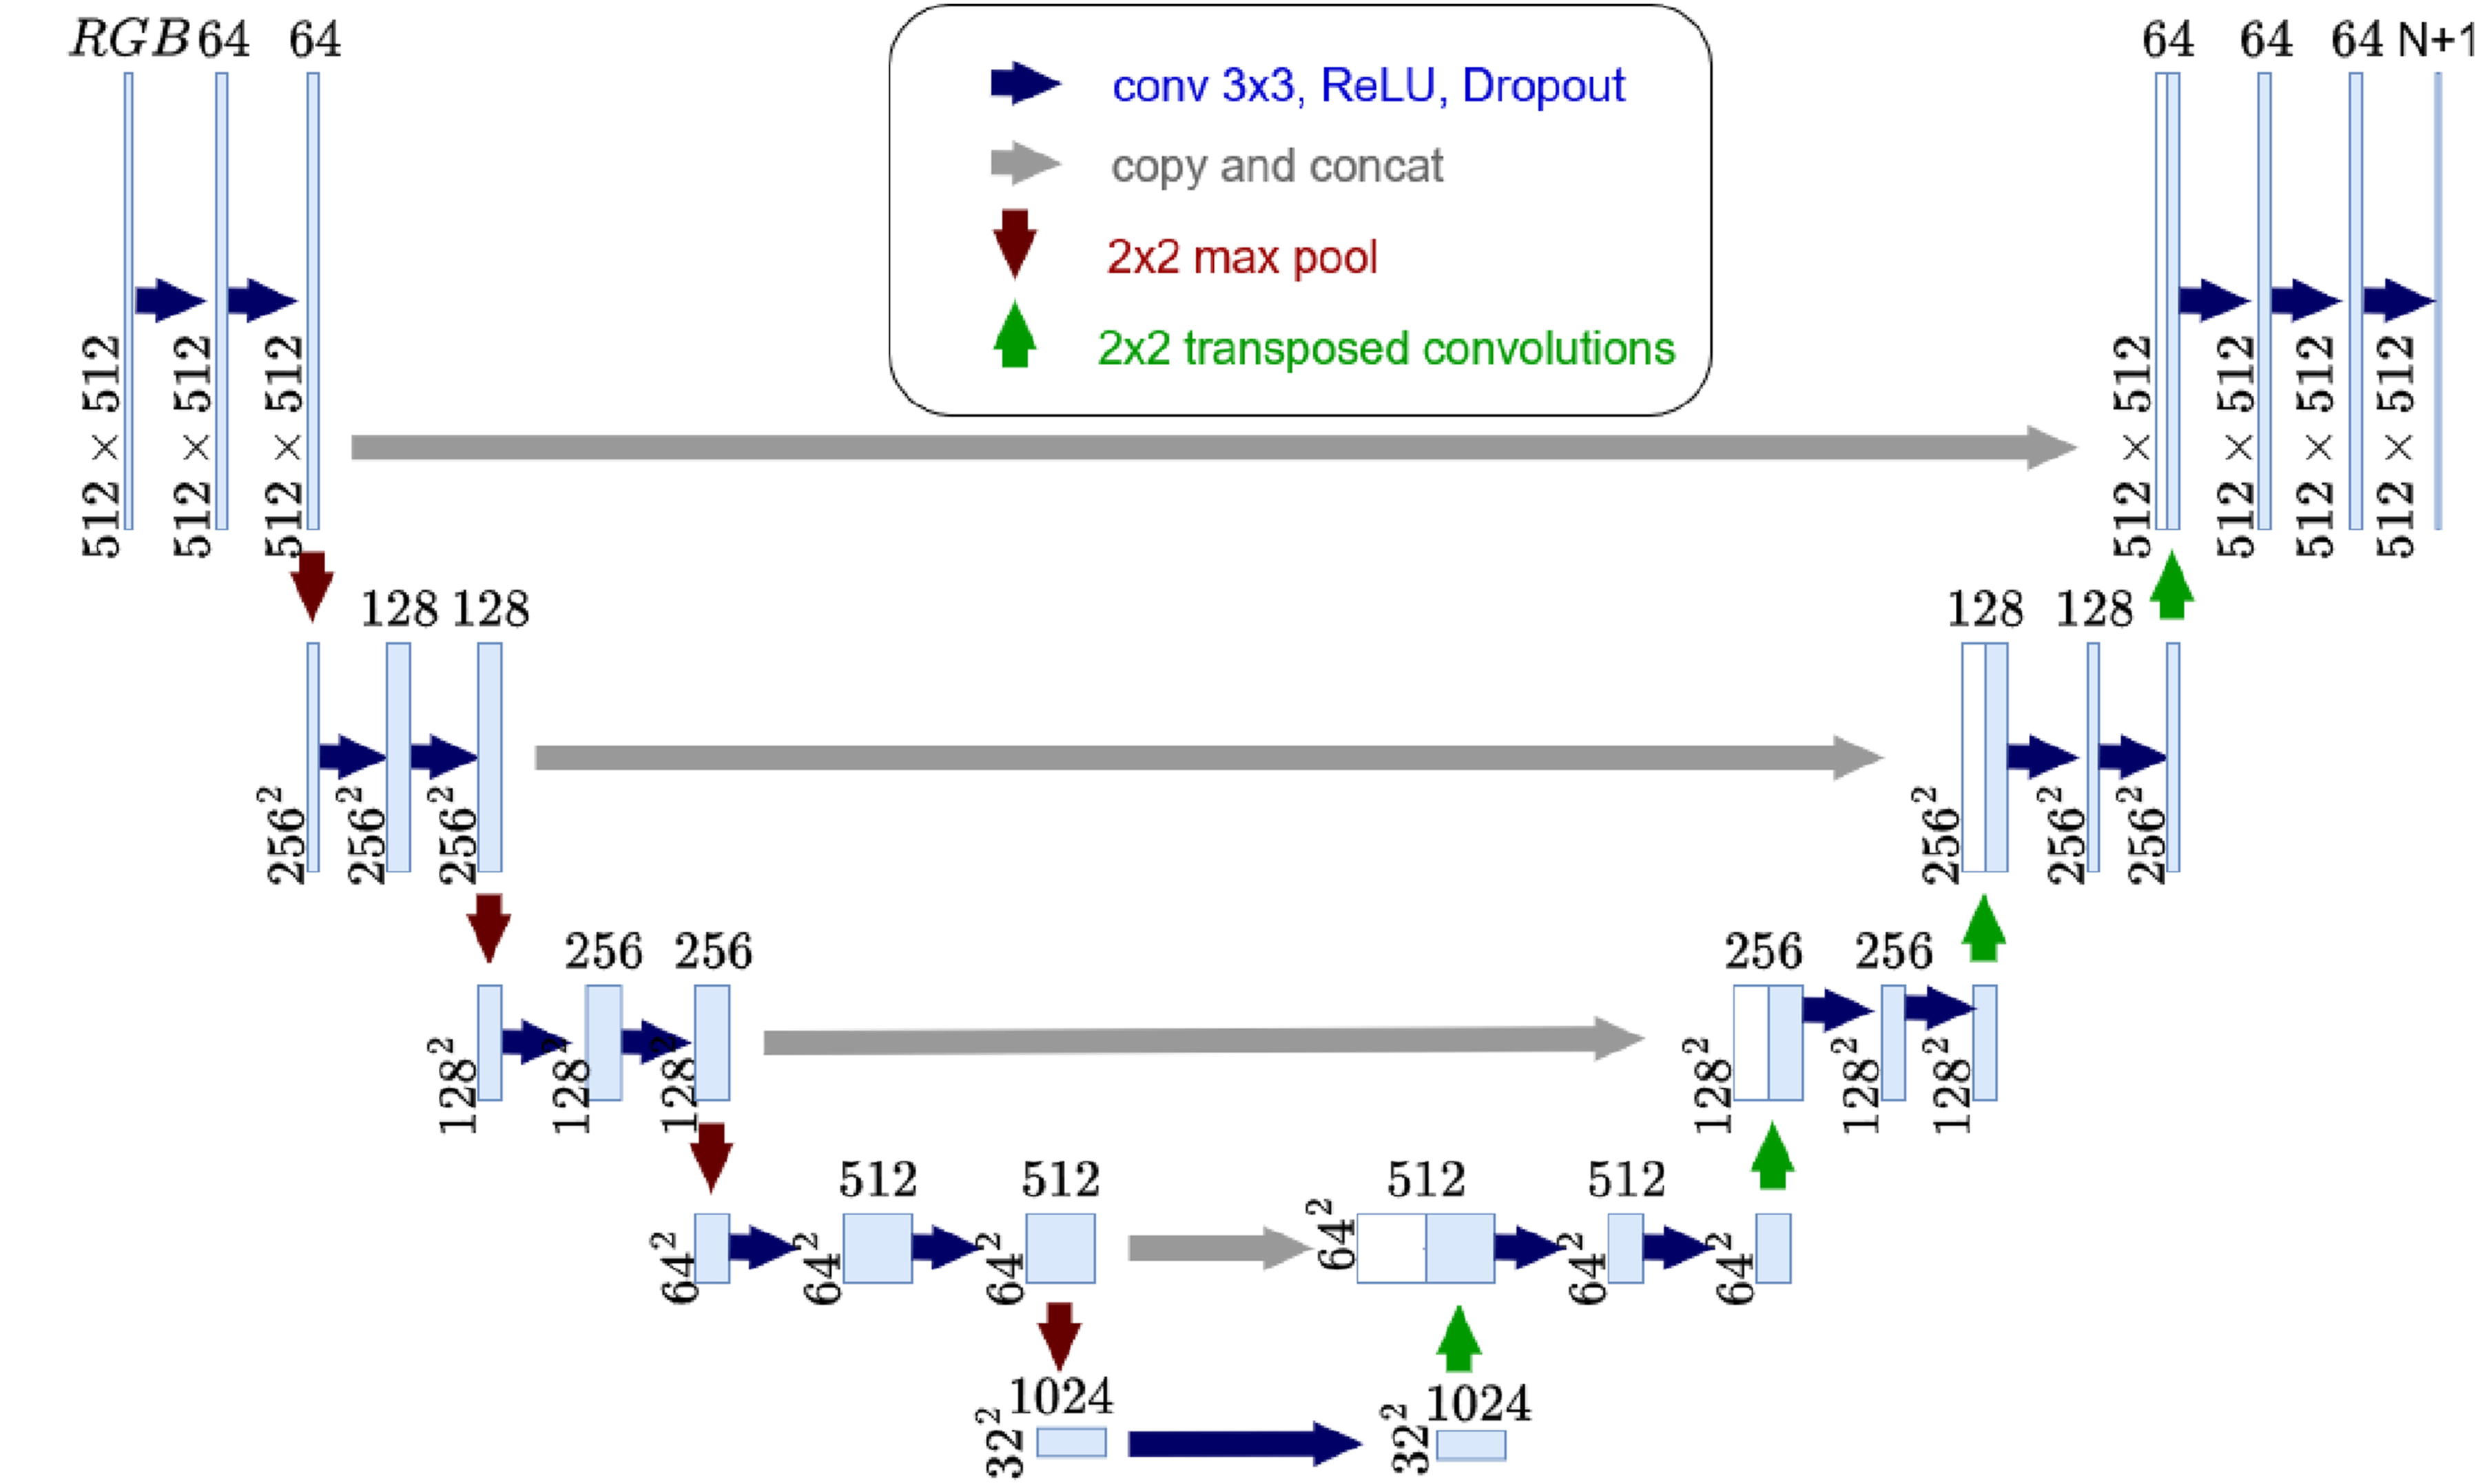
Training and validation data were split per the common 80:20 ratio for all studies conducted. A unique challenge in multi-category segmentation for BVID impact UT scan data is that not all composite layer interfaces have delamination in the RD set, as evident from data in Table 1. The absence of delamination in certain interfaces in one data set is not guaranteed to hold true for all other lamination stack-ups. However, in order to train ML models, categorized images are required for layers not seen in RD. A ”calibration image” was added to all training data to overcome this challenge. As shown in Figure 8, the calibration image and its ground truth image are synthetically generated images, with delamination in all the layers. The image ensures that the ML model can be trained to identify all 15 delaminations and one background layer in a UT scan data. Left: Calibration image. Right: Truth model of calibration image.
Training studies
Three studies were conducted to understand how sparse RD can be expanded using augmentation methods and how much improvement in segmentation can be achieved.
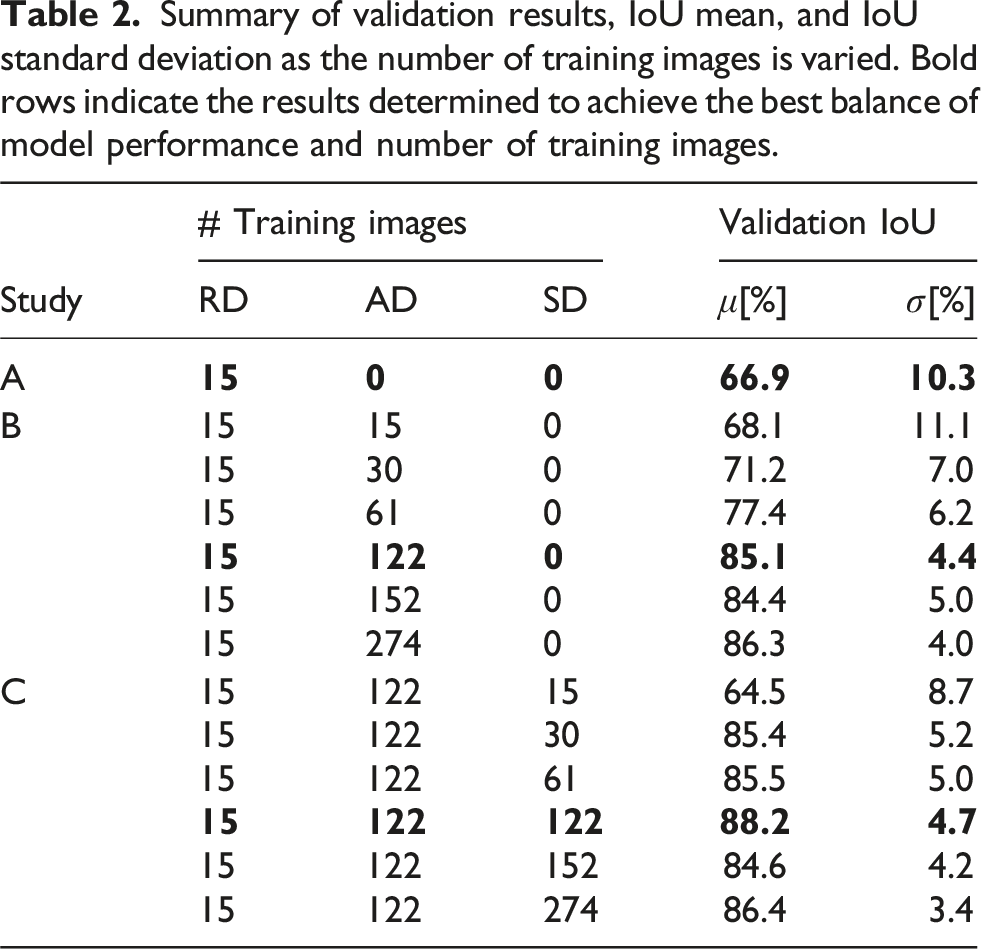
Summary of validation results, IoU mean, and IoU standard deviation as the number of training images is varied. Bold rows indicate the results determined to achieve the best balance of model performance and number of training images.
Results
Training was conducted for 100 epochs in each study to limit the training time. A comparison of loss history for the three studies is shown in Figure 9. Even though only 15 images were used for training the U-Net model in Study A, the model loss showed rapid convergence. As expected, using augmented and synthetic data increased the learning rate significantly, with the converged solution obtained for Study C at 40 epochs. The secondary spike in the loss for Study C is due to the use of Stochastic Gradient Descent (SGD) for parameter optimization,40,41 and does not affect the finalized weights at the end of training as the trained model was the one with lowest loss. Comparison of model loss history for the best trained U-Net model (see Table 2) from Study A, B and C.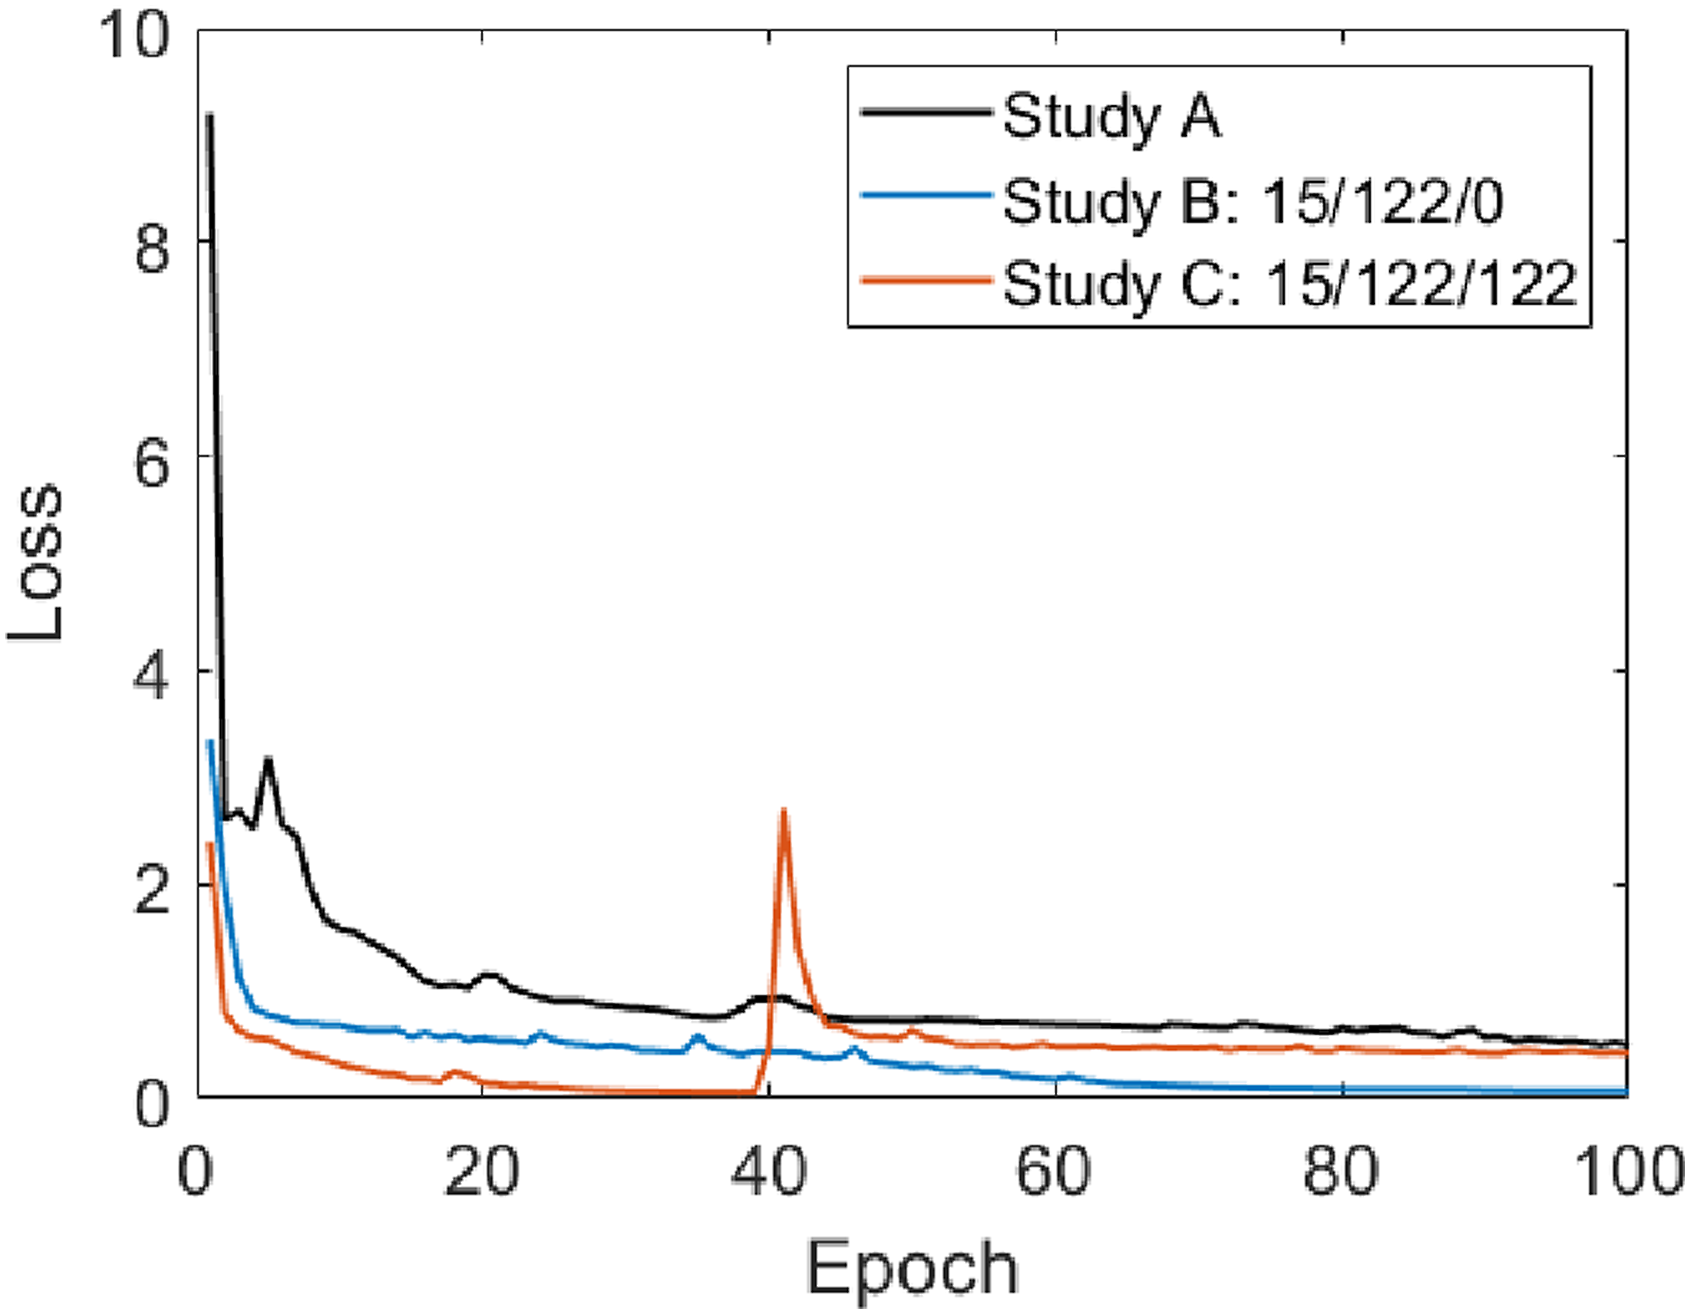
Intersection-over-Union (IoU) was calculated by comparing each validation labeled output from the trained ML model with the ground truth labeled imaged for the same input image. IoU was calculate using the standard formulation; for two images A and B, IoU = (A ∩ B)/(A ∪ B).
The area of union is the number of corresponding pixels between the true output and the model output that have the same RGB value. The area of overlap, the number of pixels the true output and model output have in common, is the total number of pixels in a single image. Note that due to the nature of the images used, all being the same size, compared pixel by pixel, alternative methods of calculations, such as direct pixel accuracy or mask IoU, 42 will provide the same results. Following this, IoU mean, and standard deviation for each study were calculated and summarized in Table 2, where the best-trained U-Net model is highlighted in bold for each study. In each of the studies, the ratio of validation to training was kept at 80:20.
A consolidated and tabulated sample image set is shown in Figure 10 to qualitatively compare segmentation quality. To compare the results, one would look at images on each column of Figure 10, where the first row is the UT scan and the second row is the corresponding labeled truth model. The third, fourth, and fifth rows are the predicted labeled images of the best-trained U-Net in studies A, B, and C, respectively. Sample results for studies conducted. Row (a) provides samples of input image used for validation. Row (b) Shows the corresponding labeled ground truth image. Row (c), (d) and (e) are the predicted labeled images output from max IoU U-net trained in studies A,B and C respectively (see Table 2).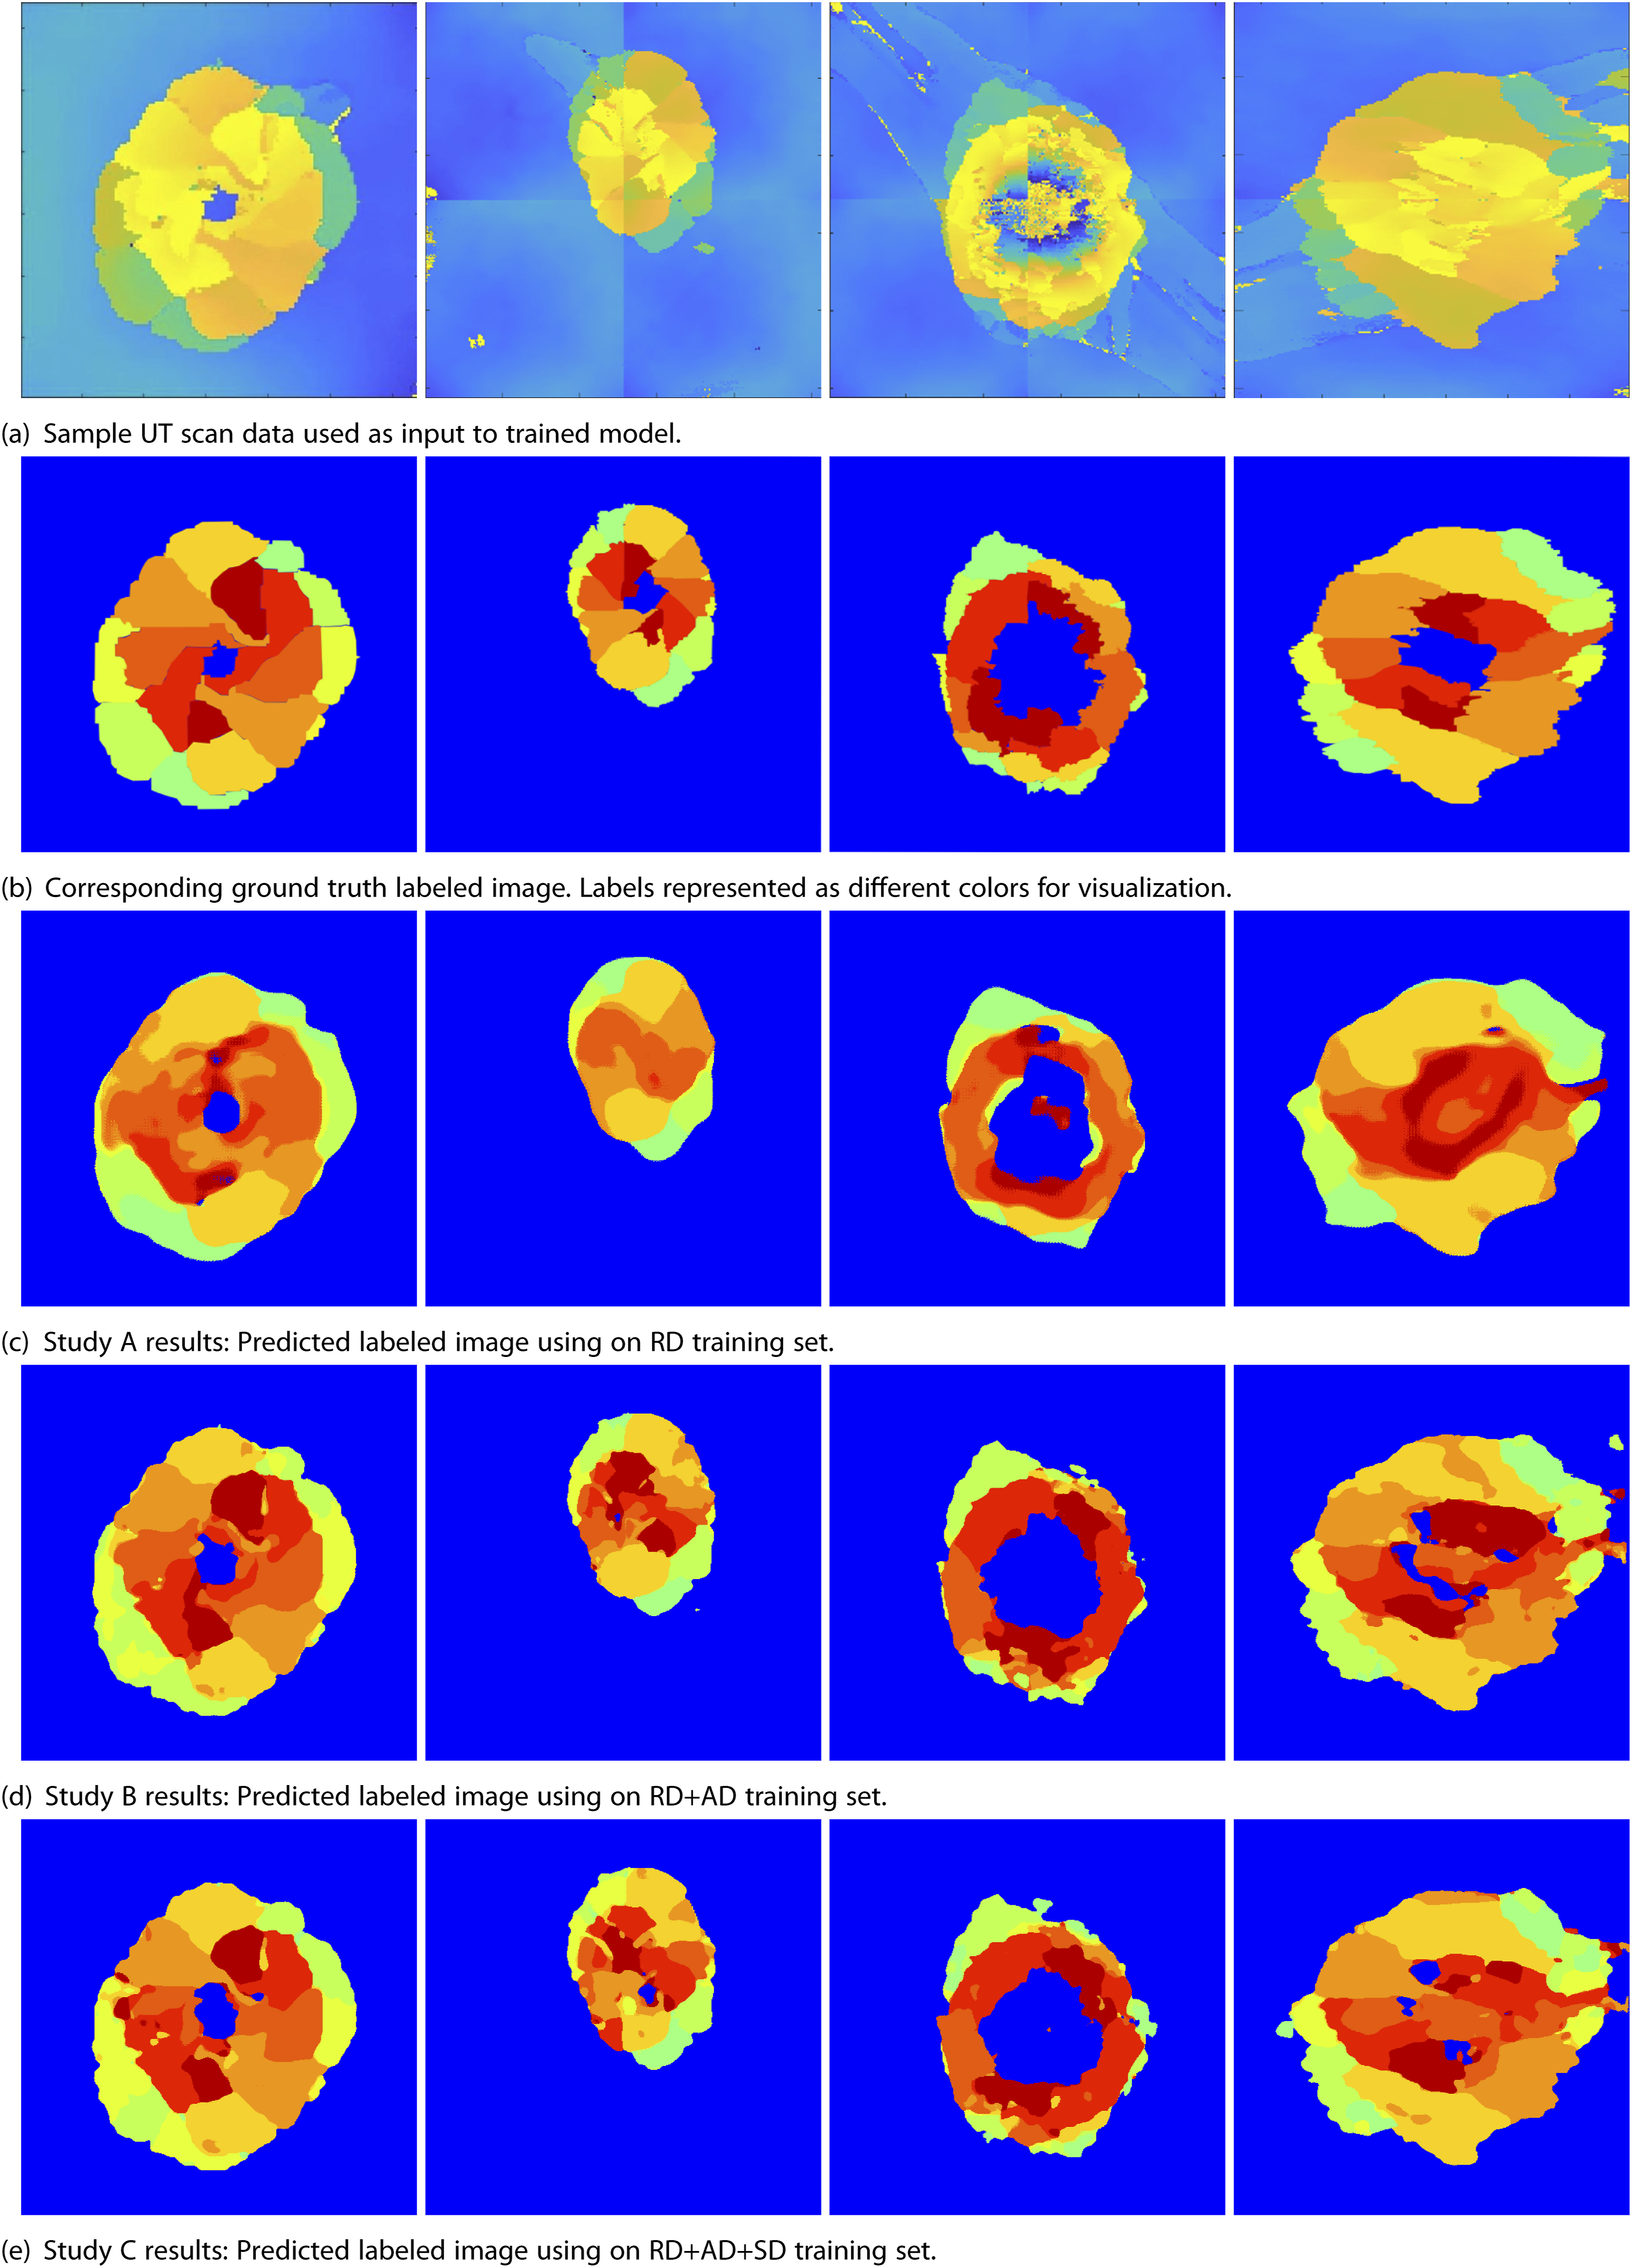
For Study A, with a validation set of only 4 images, an IoU of 66.9% with a standard deviation of 10.3% was achieved. As can be seen in Figure 10(c), the low IoU is due to the predicted images exhibiting diffused boundaries for each petal. Furthermore, the number of segmentation classes obtained is low, leading to overall poor delamination identification. However, in general, the U-Net model trained on only 15 images is able to identify major delamination areas on the periphery of the impact zone and distinguish the delamination zone from the background quite well.
For Study B, the sequential addition of AD images to the 15 RD images did lead to an increase in IoU, as shown in Table 2. The mean IoU converged to a value of about 85% with an addition of 122 or more images. This means 8× more images are required than the original 19 images to obtain reasonable accuracy in segmentation. Compared to study A’s results, the edges of petals are now much more defined, individual petals can be identified, and they are closer to ground truth in terms of shape and numbers (Figure 10(d)). However, the edges of delamination are still not as straight as that seen in ground truth. This could be due to the type of augmentation used, where elastic distortion is leading to crooked edges.
In Study C, since the edges of synthetic data are always straight, the question was if this could improve the edge identification for each petal. To investigate, SD images were added sequentially to 122 AD images and 15 RD images, and IoU was tracked. As can be seen in the results for Study C in Table 2, the initial addition of synthetic data reduces the IoU. The drop is expected as the U-Net has to now account for images with perfect petal shapes. However, with increasing SD images, the IoU converges rapidly to around 87% with the best result of 88.2%. Even though the improvement is marginal, the influence of the addition of SD is seen in the marked improvement in delamination edges when compared to truth data, as seen in (Figure 10(e)).
Conclusion
In this study, a sparse UT scan data set of BVID delamination was increased through image augmentation and synthetic UT scan generation. An augmented data set was generated using rotation and elastic deformation of real data. Synthetic data was generated using statistical measures of real data geometry to form idealized delamination patterns. A systematic study on the influence of augmented and synthetic data was conducted. The study shows that augmentation can increase the segmentation IoU measure by 18.2%. A further 3% increase in accuracy and better edge definition can be achieved by adding synthetic data to about 88% IoU. The study demonstrates that using a well-defined augmentation and/or synthetic data generation method to augment sparse experimental data can lead to improvement in the identification of delamination patterns using data-intensive machine learning methods.
Future studies could provide improvements and additional insights to the presented approach. For example, investigations related to class balance in the training data could be conducted. Artifacts due to image augmentation and scaling could be explored. However, this study illustrates the use of machine learning to automate the extraction of ply-by-ply delamination information for better risk assessment downstream.
Footnotes
Acknowledgments
The authors sincerely thank the reviewers for their valuable insight and suggestion on improving the manuscript. The US Government is authorized to reproduce and distribute reprints for Governmental purposes notwithstanding any copyright notation thereon. The views and conclusions contained herein are those of the authors and should not be interpreted as necessarily representing the official policies or endorsements, either expressed or implied, of the U.S. Air Force or the U.S. Government. Cleared for public release: Case Number AFRL-2024-0474.
Declaration of conflicting interests
The author(s) declared no potential conflicts of interest with respect to the research, authorship, and/or publication of this article.
Funding
The author(s) disclosed receipt of the following financial support for the research, authorship, and/or publication of this article: The advancement of research presented in this paper is based on research sponsored by the US Air Force under agreement number FA8650-22-2-2207.
Data availability statement
Data sharing not applicable to this article as no datasets were generated or analyzed during the current study. Data not available due to restrictions.