
Abstract
This study considered adhesion between thermoplastic and thermoset laminates through interdiffusion at the interface. The influence of the degree of cure of the thermoset at the start of the process was investigated through mechanical testing and microscopy. Increasing the initial degree of cure decreased both interlaminar fracture toughness and interphase thickness. Fracture toughness decreased disproportionately to interphase thickness, attributed to changes in interphase morphology and decreasing surface contact at the interface. A simplified model was developed using gel layer thickness measurement data to predict the level of interdiffusion with increasing initial degree of cure. Compared to thermoset-thermoset co-curing, there was superior bond strength at low initial degrees of cure and a predicted increased sensitivity to the initial degree of cure, suggesting a greater influence of process variability. Hence, for specific property critical applications, the trade-off between the potential manufacturing efficiency gains from semi-curing and the reduced performance would be an important consideration.
Introduction
Hybrid structures that can leverage the advantageous properties of thermoset and thermoplastic polymers promise highly desirable and tailorable characteristics. The combination of the toughness and weld enabling melt processability1–3 of thermoplastics with the stiffness of thermosets has numerous potential applications. One such application would be to attach thermoplastic composite along the leading edges of thermoset composite wind turbine blades to improve damage and erosion resistance compared with current thermoset solutions. 4 The issue in enabling such hybrid structures is processing without compromising performance.
The issue stems from the incompatibility of the materials, both in terms of the processing conditions and chemical properties. The traditional approach to joining such materials is through mechanical fasteners and adhesive bonding. 5 In addition to the time-consuming nature of these methods, 2 they yield interfacial properties that compromise the structural performance. Mechanical fasteners introduce stress concentrations, 5 fibre damage, 6 additional weight 7 and inefficient load transfer. 8 A number of these issues are addressed by adhesive joints 5 ; however, the lack of suitable failure criteria means supplementary fasteners are often required adding to a weight penalty. 5
A potential solution comes from adapting the traditional thermoset-based processing method of co-curing. In co-curing, thermoset materials at low degrees of cure (e.g. 20-30%) are bonded through chemical cross-linking that develops during cure with an uncured interface. 9 The formation of bonds has also been demonstrated when replacing thermoset adherends with thermoplastic. 10 Although no curing of the thermoplastic occurs in this process, the term co-curing has been used in the literature to cover bond development through interdiffusion across the interface. 8
The interdiffusion process is initiated by thermoset monomers diffusing into and swelling the glassy thermoplastic. 11 When sufficiently swollen, a glass-to-rubber transition occurs, followed by localised dissolution. 11 The dissolved thermoplastic diffuses into the liquid thermoset. When the thermoset degree of cure advances to the point the two polymers become immiscible, assumed to be gelation, phase separation occurs. 11 The compatibility of a thermoset thermoplastic combination for co-curing is based on their solubility parameters, such as Hansen solubility. 12 For a (partially) miscible combination of materials, such as epoxy and PEI, their interdiffusion process during co-curing is like those in thermoplastic toughened epoxy systems.
The diffusion of thermoset monomers into glassy polymers during interdiffusion has been classified as Case II diffusion. 13 Such a diffusion case is characterised by a sharp, constant velocity penetration front resulting from greater thermoset diffusivity in the swollen polymer behind the front compared to the unswollen polymer ahead. 14 On the contrary, in situ Raman spectroscopy measurements by Zweifel et al 15 showed thermoplastic diffusion in the thermoset to be Fickian. The majority of the total interdiffusion length (known as the interphase) is due to thermoplastic diffusion into the thermoset.11,15 Interphase thickness has been used as an indicator of the amount of interdiffusion. 16
Epoxies are the dominant thermoset used in high-performance applications, such as aerospace, automotive, or energy sectors. Some thermoplastics with proven compatibilities are typically used as tougheners in epoxy system. 6 These thermoplastics are amorphous with glass transition temperatures that exceed the 180°C curing temperature common among aerospace-grade epoxies. 17 Polyethersulfone (PES), polysulfone (PSU) and polyetherimide (PEI) are common examples. 18 PEI is a common choice for co-curing unlike PES which is a popular choice as a toughener for epoxies. 6 Among amorphous thermoplastics, PEI also appears well suited for advanced hybrid structures due to excellent mechanical properties combined with good resistance to solvents and environmental exposure. 19 PEI in particular has been found in semi-structural parts requiring flame retardancy such as aircraft interiors. 20
The mechanisms during interdiffusion of thermoset-thermoplastic are like those observed in thermoplastic toughened epoxies. A morphology that depends on local thermoplastic concentration forms during phase separation. In toughened epoxy systems, the gradient in thermoplastic concentrations are localised around the phase separations withing the blend. Whereas, in co-curing, the thermoplastic concentration varies over the interphase thickness, between pure thermoplastic on one side of the interphase and pure thermoset on the other. Due to the dependence of morphology on thermoplastic concentration, an interphase with a morphological gradient is created,
11
including some commonly observed in toughened systems.
11
Figure 1 shows an example of an interphase produced by the interdiffusion process of epoxy and PEI.
11
The region of epoxy swollen PEI, Figure 1(a)–(b), is known as the gel layer and is characterised by phase inverted (Figure 1(a)) and co-continuous (Figure 1(b)) morphologies. A phase-inverted morphology consists of epoxy particles in a PEI matrix. In a co-continuous morphology, the epoxy and PEI are entangled with no clear continuous or discrete phases. Both morphologies are effective at increasing toughness21,22 and are common among thermoplastic toughened epoxy systems. Further away from the co-continuous interphase (Figure 1(c)), one observes the liquid layer. The region of epoxy with diffused PEI (Figure 1(d)) is the liquid layer, characterised by a sea-island morphology.
11
The sea-island morphology consists of PEI particles in an epoxy matrix, thus has low toughness.
23
The morphologies of an interphase formed by interdiffusion between an epoxy amine (light grey) and PEI (dark grey). Reprinted (adapted) with permission from Lestriez, B., J.-P. Chapel, and J.-F. Gérard, Gradient interphase between reactive epoxy and glassy thermoplastic from dissolution process, reaction kinetics, and phase separation thermodynamics. Macromolecules, 2001. 34(5): p. 1204-1213. Copyright 2001 American Chemical Society.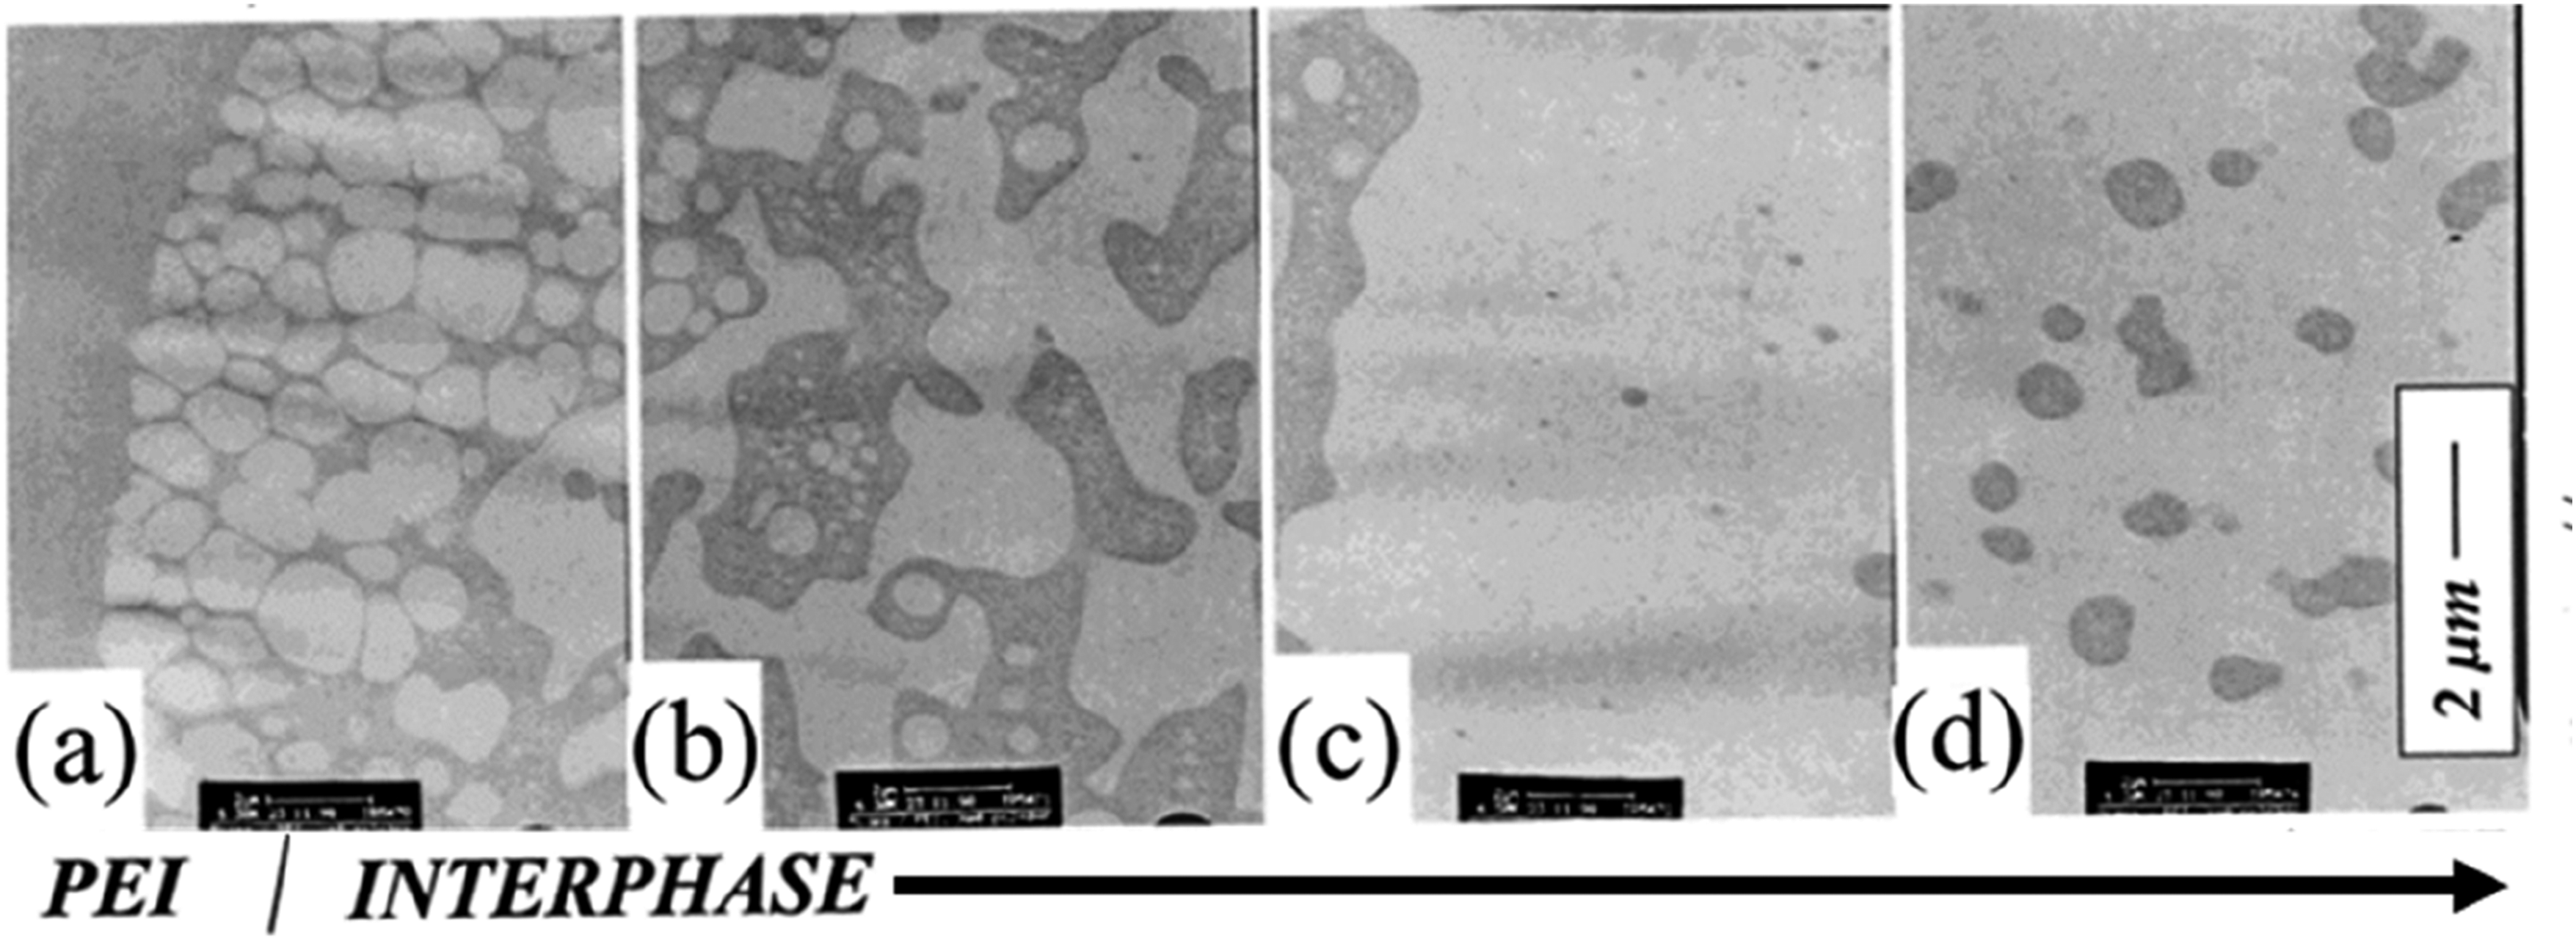
The toughening morphology of the gel layer formed through interdiffusion makes it desirable for crack resilient co-cured joints. At a given temperature, the growth of the gel layer is believed to stop at the onset of phase separation, 24 but can be resumed at a higher temperature. 25 This is believed to be due to fractionation effects, where the greater diffusivity of low molecular weight epoxy chains in the thermoplastic enables greater diffusion depths. 11 The slower rate of reaction of epoxy in areas of high thermoplastic concentration results in diffusion beyond the onset of gelation predicted for the bulk.11,25
The feasibility of adapting the co-curing process to include thermoplastics has been most extensively explored through the adhesion of thermoplastic films to epoxy laminates.8,17 Epoxy composite adherends with co-cured thermoplastic films have been joined via fusion bonding of the films. Mechanical testing of these specimens routinely exhibited cohesive failure in one of the composite adherends. 16 The failure occurred in the lap shear test adherends at values comparable to conventionally co-cured adherends 16 and high-performance adhesives,8,16 indicating the merit of the co-cured thermoplastic-epoxy bond. This demonstrates a potential application for this joining method, via fusion bonding, which could give great efficiency in assembling thermoset composite structures over the current approaches discussed.
Most research has considered co-curing between an initially uncured epoxy pre-polymer and a PEI film. Findings show the nature of the interdiffusion process changes with increasing initial degree of cure. 11 As the initial degree of cure increases, the size of the gel layer, the source of toughness increasing morphologies, diminishes. 11 This is caused by a reduction in the amount of epoxy monomers, which are required for swelling. 11 The mechanical performance of the bond will likely reduce, as the remaining section of the interphase, the liquid layer, offers poor resistance to crack propagation. 26
Increasing the initial degree of cure relates to another recent development in composite manufacturing technologies, semi-curing. In semi-curing, the degree of cure of the thermoset is advanced to where the semi-cured material is rigid and handleable, i.e., the glass transition temperature exceeds ambient temperature. The nature of the semi-cured part brings benefits to manufacturing, for example, reduced tooling complexity. 27 In thermoset-thermoset co-curing, when one of the adherends is semi-cured, semi-curing has been shown to have minimal effect on bond strength until gelation.27,28
In the way the combination of semi-curing and co-curing has been considered, 27 the low stiffness uncured thermoset adherend is a source of assembling inefficiency as it is more difficult to handle. Replacing the uncured adherend with a thermoplastic composite could be highly beneficial for assembling efficiency, but this is currently unexplored.
To combine semi-curing with thermoset-thermoplastic co-curing, it is necessary to understand the effect of increasing the initial degree of cure on the interdiffusion process. It must be shown whether the adhesion will sharply decrease the thermoplastic and semi-cured thermoset become immiscible, as with thermoset-thermoset adherends at gelation, 28 or if there will be a more gradual reduction as the number of thermoset monomers to dissolve the thermoplastic decreases. This decrease in monomers is likely to have consequences for mechanical properties since the dissolution process is required for the phase separation necessary for toughening interphase morphologies.
The state-of-the-art has demonstrated that epoxy and PEI polymers will adhere through interdiffusion. This study aims to investigate the effect of the initial degree of cure on this process by co-curing thermoplastic laminates with thermoset laminates at key degrees of semi-curing. These are, significantly below the gel point, just below the gel point and just above the gel point. Testing these specimens gives details of the effect on interphase formation and adhesion. To our knowledge, semi-curing in this context has not been extended beyond neat resins 11 and little has been done to explore the thermoplastic-thermoset co-curing at the laminate level. 17
For a more complete assessment of the effect of semi-curing, diffusion data from a model epoxy pre-polymer system co-cured with PEI is used to create a model of the diffusion process. The results from the model provide a simplified approach to capturing the effect of the initial degree of cure on diffusion, based on gel layer thickness. The model is then adapted to a commercial epoxy system in the laminates and the predictions are compared to measurements made from optical micrographs of the co-cured laminates. The overall results highlight the potential routes to join thermoplastic and thermoset laminates without the use of fasteners or adhesives.
Methodology
Experimental method on composite laminates
In this section, the experimental methods to estimate the gel layer thickness and fracture toughness of co-cured thermoplastic-thermoset laminates are presented. The initial degree of cure of the thermoset laminate was varied to investigate the limitation of the gel layer formation. Three 150 mm × 150 mm thermoplastic-thermoset panels were manufactured with each thermoset panel having a different initial degree of cure at integration.
Materials
An off-the-shelf 2.5 mm thick thermoplastic laminate TC1000 (Toray-Cetex) was used for this study. The laminate comprised of PEI (Ultem 1000) reinforced with 5-harness satin woven carbon fabric (FT300 B) with 280 gm−2 fibre areal weight. 29 The thermoset laminate was manufactured using infusion and comprised of a single-part epoxy resin (EP2410, Solvay) reinforced with 8 plies of 5-harness satin woven carbon fabric to match the thickness of the thermoplastic laminate.
Thermoset semi-curing
Two thermoset panels were manufactured using the vacuum-assisted hot resin infusion and bagging scheme shown in Figure 2(a). The resin was heated to 90°C and degassed for 45 min. While the resin was degassing, the bagged preform was heated to 120°C at a rate of 2 °Cmin−1 and held for 30 min. Once the resin degassing was complete the preform was infused at 120°C. The temperature profile from this point onwards was designed to enable targeted degrees of cure of 0.7 and 0.85. The cure cycle design was enabled by the chemo-rheological characterisation of the EP2410 previously conducted in our earlier works.
30
The profile consisted of a temperature ramp of 2°C·min−1 from 120°C to 160°C. The dwell time was varied for the two panels to achieve a distinct DOC. A dwell time of 59 min and 75 min for DOC of 0.7 and 0.85, respectively, was applied. These dwells were followed by an imposed cool-down rate of 2°C·min−1 to 30°C. The DOC of 0.7 and 0.85 was chosen as it is just below and above the gel points of EP2410 which is between 0.73 and 0.76.
28
The temperature profile across the various stages is shown in Figure 2(b). (a) Vacuum-assisted hot resin infusion and bagging scheme (b) Temperature profile across the various processing stages.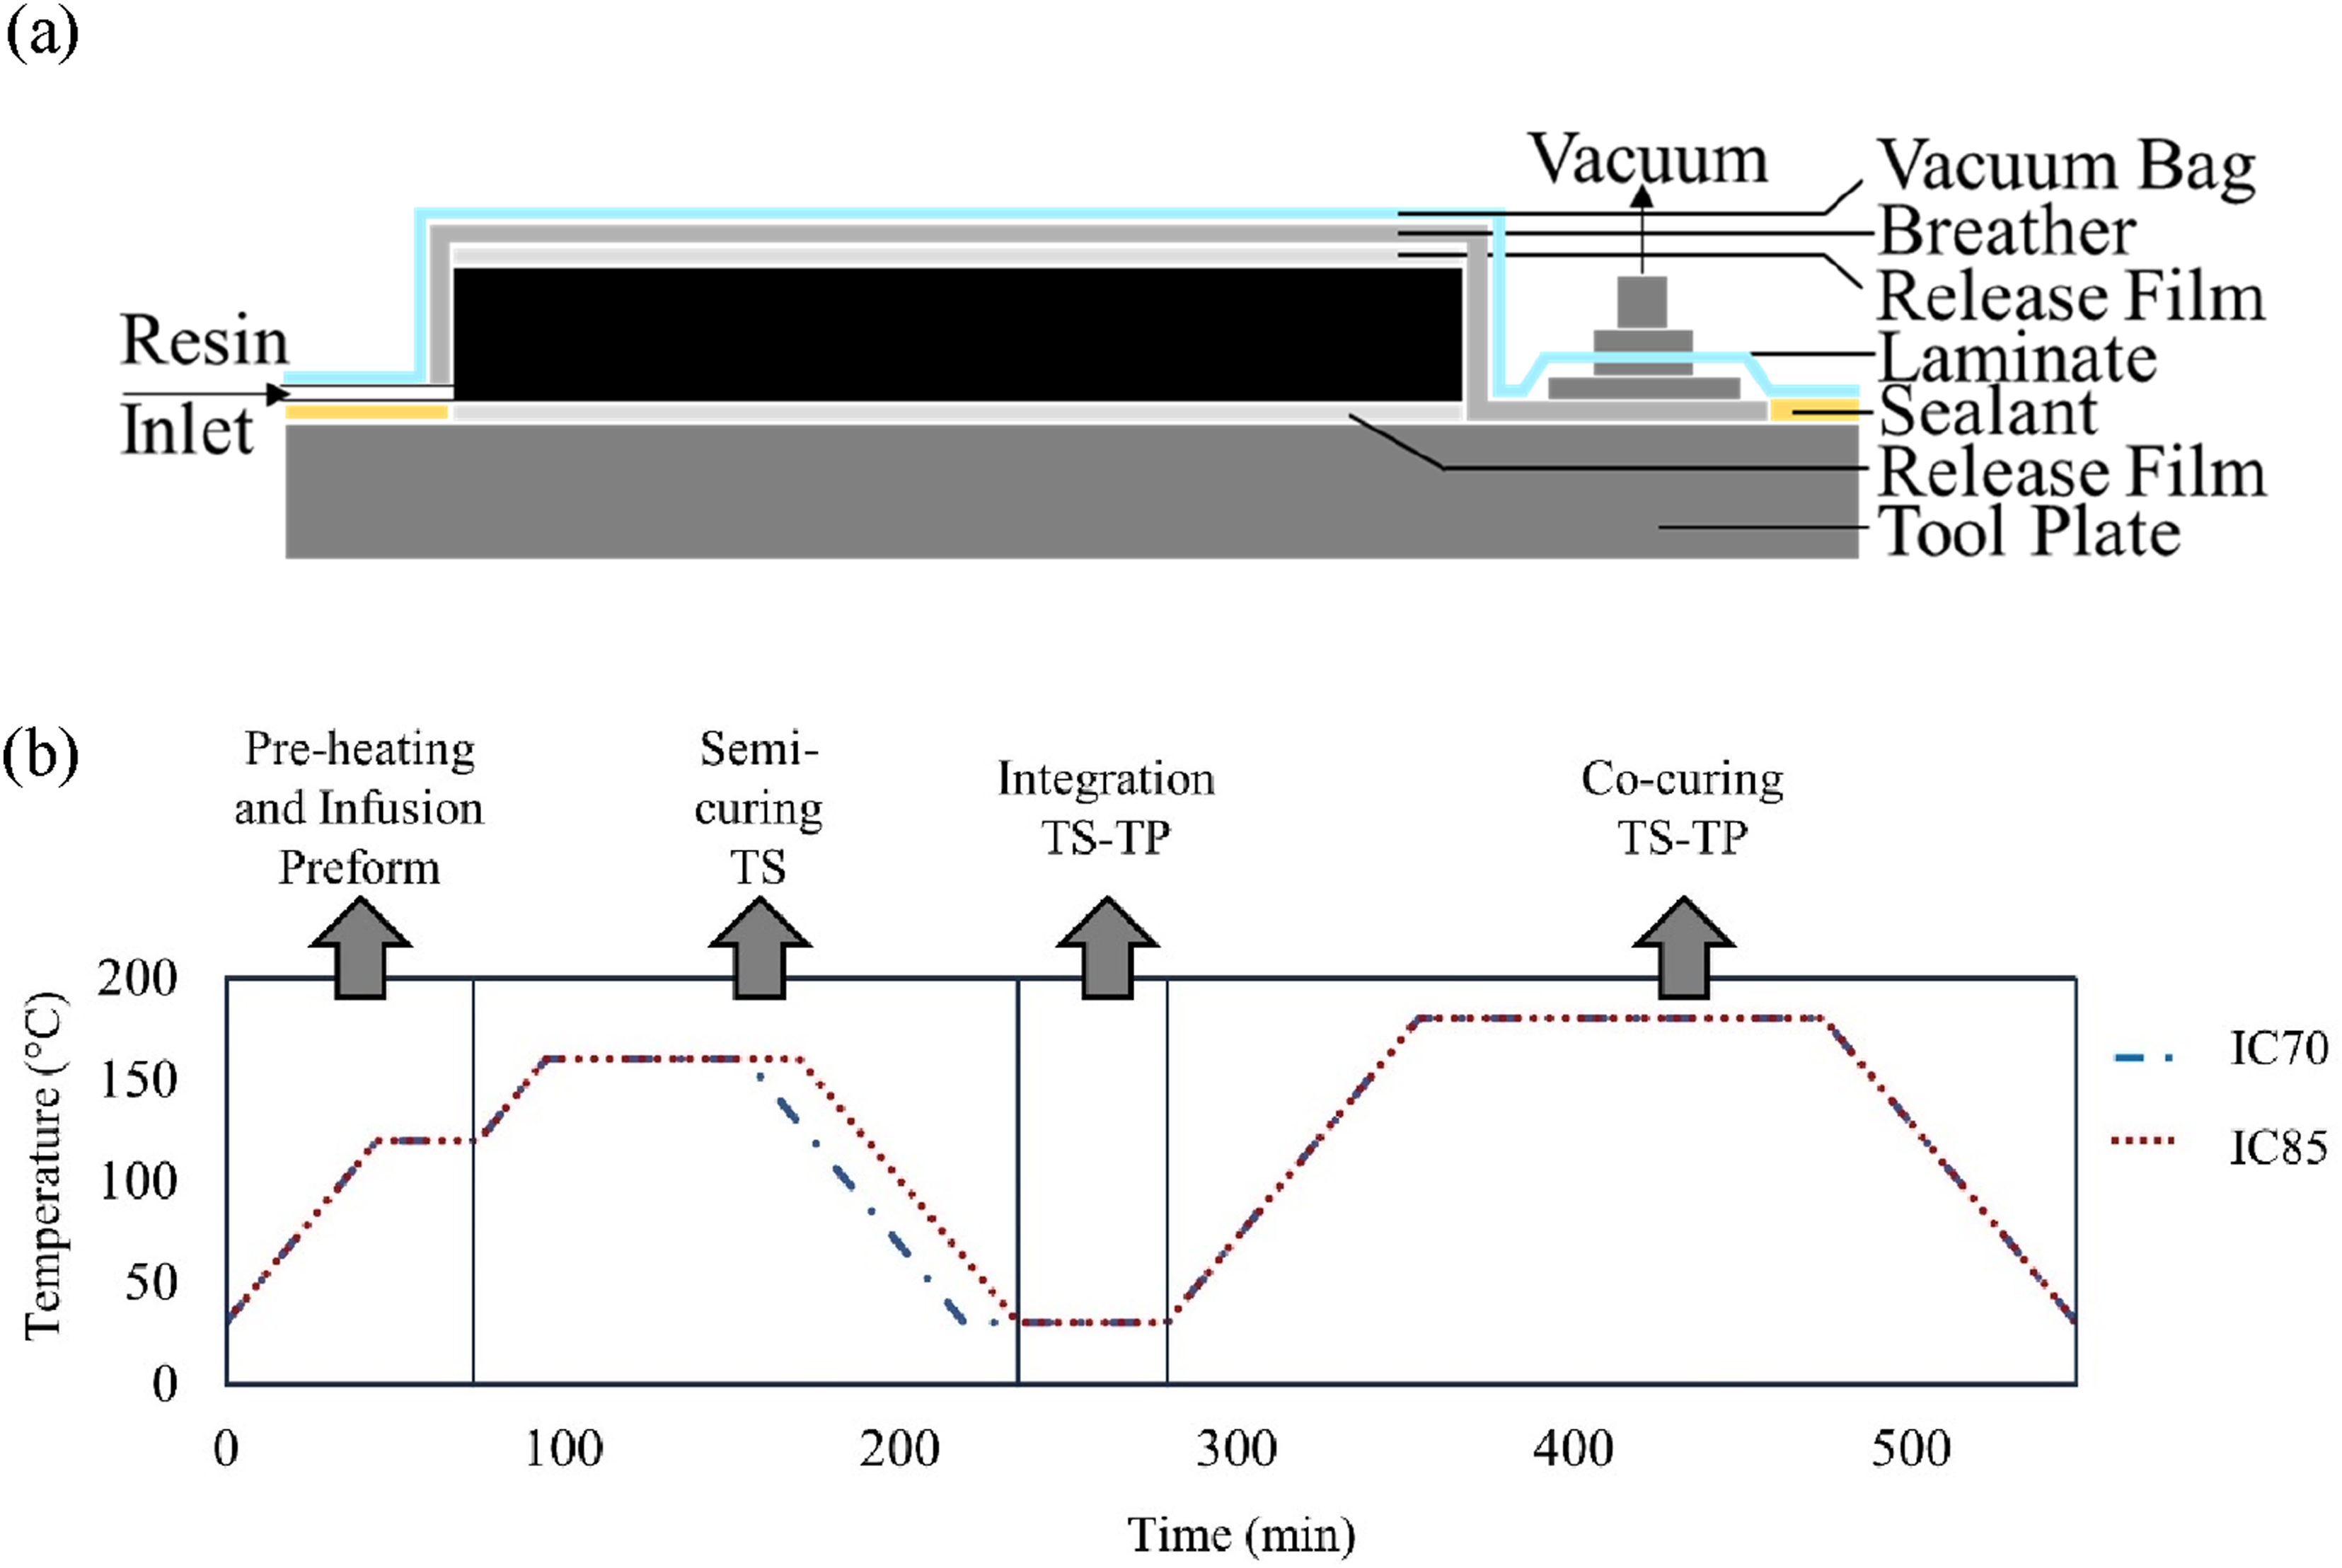
Thermoplastic-thermoset Co-curing
The two partially cured panels were placed on tool plates, followed by a PEI plate on top and then vacuum bagged. A 12 μm thick TEFLON release film was placed at one edge of the panel to provide a pre-crack at the interface. The layups were cured in the oven, the cycle included a 2°C·min−1 ramp to 180°C followed by a 2-h dwell. A vacuum pump was connected to the vacuum bag to ensure a vacuum was maintained throughout the process. The initial cures (IC) of 0.7 and 0.85 DOC shall now be abbreviated to IC70 and IC85 respectively.
The third panel was infused with the resin and directly co-cured with a PEI plate on top. The infusion took place at 120°C and the cure cycle consisted of a 2°C·min−1 ramp to 180°C followed by a 3-h dwell. The aim was to minimise the initial degree of cure at the start of co-curing. Again, a 12 μm thick TEFLON release film was placed at one edge of the panel. The prolonged storage of the resin system resulted in the initial degree of cure progressing to 0.2 and third panel as such is abbreviated to IC20.
To verify the initial degree of cure of the resin and semi-cure of the two partially cured panels, samples of the resin were taken from the surface of the release films used as part of the layups during the infusions and analysed using a Differential Scanning Calorimeter (DSC). The DSC analysis involved a 5 °Cmin−1 modulated temperature ramp from −50°C to 290°C. Oscillations with a period of 40 s and an amplitude of 1.5°C were used as the modulation parameters. Please see Appendix A in the Supplementary information for the results of this analysis.
Double cantilever beam specimen preparation and testing
Five Double Cantilever Beam (DCB) specimens were to be cut from each of the three co-cured panels using a water-cooled diamond saw, and tested following the principles of the ASTM standard test method.
31
The differences were based around specimen dimensions and materials. Firstly, the dimensions were 125 mm × 20 mm, which is 15 mm shorter than the 140 mm specified in the standard. Also, the thicknesses of the IC20 specimens were between 5.7 mm and 6 mm, above the suggested 3 mm – 5 mm range, while the IC70 and IC85 samples were 5 mm thick. Secondly, woven fabric was used. The standard warns of fibre bridging and crack branching away from the interface with non-unidirectional layups. However, no fibre bridging was observed with the 5-harness satin weaved used and crack branching away from the interface was mitigated by using adherends with identical layup and very similar thickness. Thirdly, the matrix materials were different on either side of the mid-plane, given the nature of the study. However, the reported modulus of Ultem PEI 1000 is 3.5 GPa and EP2410 is 2.5 GPa in the respective manufacturer datasheets. These values are quite similar and two orders of magnitude smaller than the modulus of carbon fibre. Deformation of representative DCB sample arms is shown in Figure 3, and given that the opening of the DCB arms is symmetric and characteristic of Mode 1 opening, the test method was considered suitable for this study. DCB test specimen for (a) IC20 and (b) IC70 just before reaching the ultimate failure load.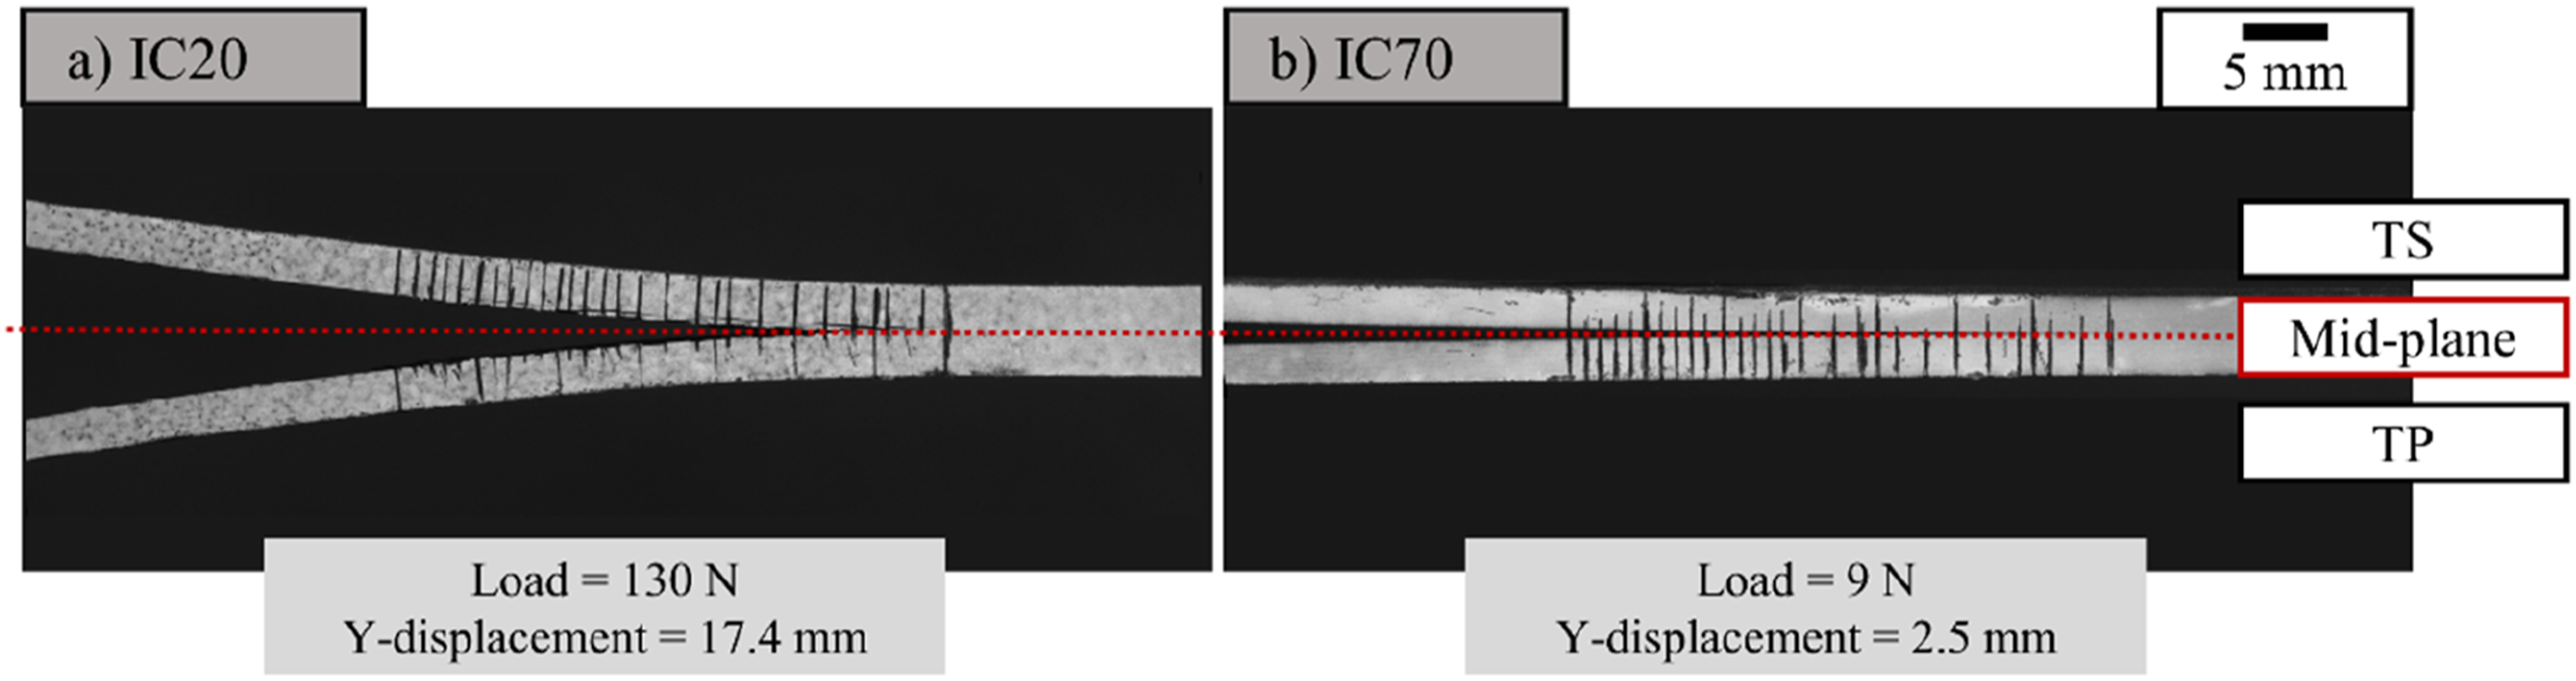
When attempting to cut the IC85 plates, the two adherends separated cleanly at the interface, indicating adhesive fracture at minimal load. As a result, mechanical testing was only conducted on the remaining two panels (IC20 and IC70).
The DCB specimens were sprayed on one side with a thin layer of matte white paint and marked with a ruler to visualise and measure the crack growth during testing, as shown in Figure 3. All tests were carried out on a Shimadzu testing machine with a 1 kN load cell. The load was applied with a head rate of 2 mm.min-1. Five repeats were planned for both sets of specimens. A video gauge was used to record the test and observe the crack growth. The video was subsequently used to manually identify the displacement using the ruler marked on the specimens.
Microscopy specimen preparation
Four 30 mm long samples were cut from the IC20 and IC70 plates. The samples were potted in a degassed mixture of Prime 37 resin and Ampreg 3X hardener, prepared in a 3:1 ratio, and left to cure at room temperature overnight. The potted samples were ground and polished to a 0.05 μm fineness using an EcoMet Grinder-Polisher.
To aid visualisation, the interphases were etched to make the materials at the interphase more distinct. The solvent N-Methyl-2-pyrrolidone (NMP) was used to dissolve the PEI. Droplets of the solvent were applied directly to the surface with a pipette, allowed to stand for 30 s and removed by wiping followed by washing with ethanol then distilled water, the surface was dried using compressed air. 25 This process gave the PEI a cracked appearance while the epoxy remained smooth.
Gel layer thickness measurements
For each initial degree of cure, the gel layer of the prepared cross-sections of the specimens were measured at 3 mm increments, for a total of 40 measurements. To enable this, optical micrographs were taken across the width of each sample, the measurements were made using ImageJ.
In the case of the IC20 samples, fibres occasionally migrated across the interface. At the 13 locations where this occurred, no measurements were taken, it was not clear whether the fibres prevented an interphase from forming or simply obscured it from view.
Fractographic analysis
To investigate the differences in the interphases and failure mechanisms between the three initial degrees of cure the failed interface surfaces were studied. A Zeiss Axio Zoom.V16 microscope was used to capture high-resolution images of the surfaces. Failed IC20 and IC70 DCB specimens were analysed. For IC85, the failed surfaces of the thermoplastic and thermoset plates that came apart before cutting were also analysed.
Neat resin diffusion model
Diffusion measurements
To gain more understanding of the diffusion rates at different temperatures and get experimental data to predict the gel layer thickness with a diffusion rate model, hot-stage microscopy was used to capture co-curing between a model epoxy system and an Ultem 1000 PEI film following the procedure outlined by Teuwen et al. 24 A 60 μm thick PEI film with a central slit of 2-3 mm was used during the experiments. This was sandwiched between two glass cover glasses. This set-up was then put at the specific isothermal cure temperature aimed for in the experiment through a Linkam Scientific temperature-controlled microscope stage THMS600. The epoxy system consisted of triglycidyl m-aminophenol (TGMAP) and diglycidyl ether of bisphenol F (DGEBF) epoxies (67%) with a diaminodiphenyl sulfone (DDS) curing agent (33%). After mixing, the epoxy system was injected into the central slit region of the PEI film. A Keyence VHX-2000 microscope was used to observe the region of the PEI and epoxy interface. Using a model epoxy system avoided the potential influence of additives, to produce an accurate representation of the underlying interdiffusion process.
Interphase thickness measurements were taken from micrographs obtained at isothermal cure temperatures of 150°C, 160°C, 170°C and 180°C. The measurements were taken at 15-s intervals at all cure temperatures until the onset of phase separation. Five repeats were performed at each cure temperature, each data point was the mean of these repeats. The diffusion rate increased with cure temperature, thus, the number of measurements taken decreased with cure temperature. The time of the first measurement is taken as the first time step when epoxy is observed in the experiment area. The time of the last measurement in each case corresponded with the onset of phase separation.
To reduce the influence of noise on the characterisation process, the data was first cleaned. Classical diffusion models suggest interphase growth must be monotonic, however, the data contained instances of negative growth. These instances were removed for most of the process. However, the noise in the measurements combined with the slow rate of diffusion towards the end of the process produced a high proportion of negative values. To ensure the late phase of the process was represented, negative growth was not removed beyond a degree of cure of 0.2.
Diffusion model
The diffusion of PEI into epoxy has been shown to be the dominant contributor to the interphase thickness.11,15,16 The diffusion of PEI into epoxy exhibits Fickian behaviour. This result motivated a Fickian approach to modelling interphase formation.
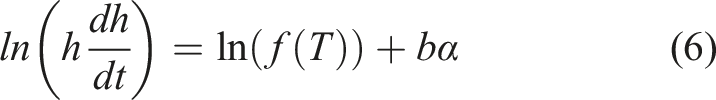
Fickian diffusion in a semi-infinite medium classically results in a penetration depth,

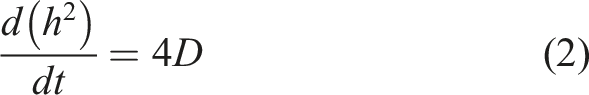
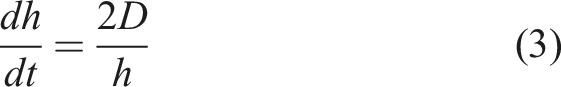
This instantaneous form is used to account for processes with evolving values of D. This is the case for reactive processes such as the one considered here.
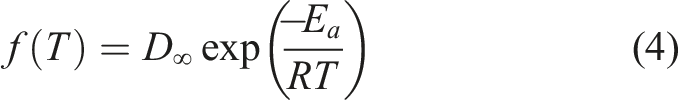
Following the Stokes-Einstein relation, diffusivity is dependent on viscosity. The viscosity of the system is influenced by the temperature and the degree of cure. For simplicity, we considered a separate form
The experimental diffusion data showed that the rate of gel layer growth decreased sharply at the beginning of the process before quickly plateauing, attributed to the dependency of diffusivity on the degree of cure. The variability in Figure 4 is mostly attributed to the numerical differentiation. Figure 4 shows the experimental values of the function g. There is a clear correlation between (a) Rate of gel layer growth and degree of cure versus time. (b) Rate of gel layer growth versus degree of cure. Data at 150°C.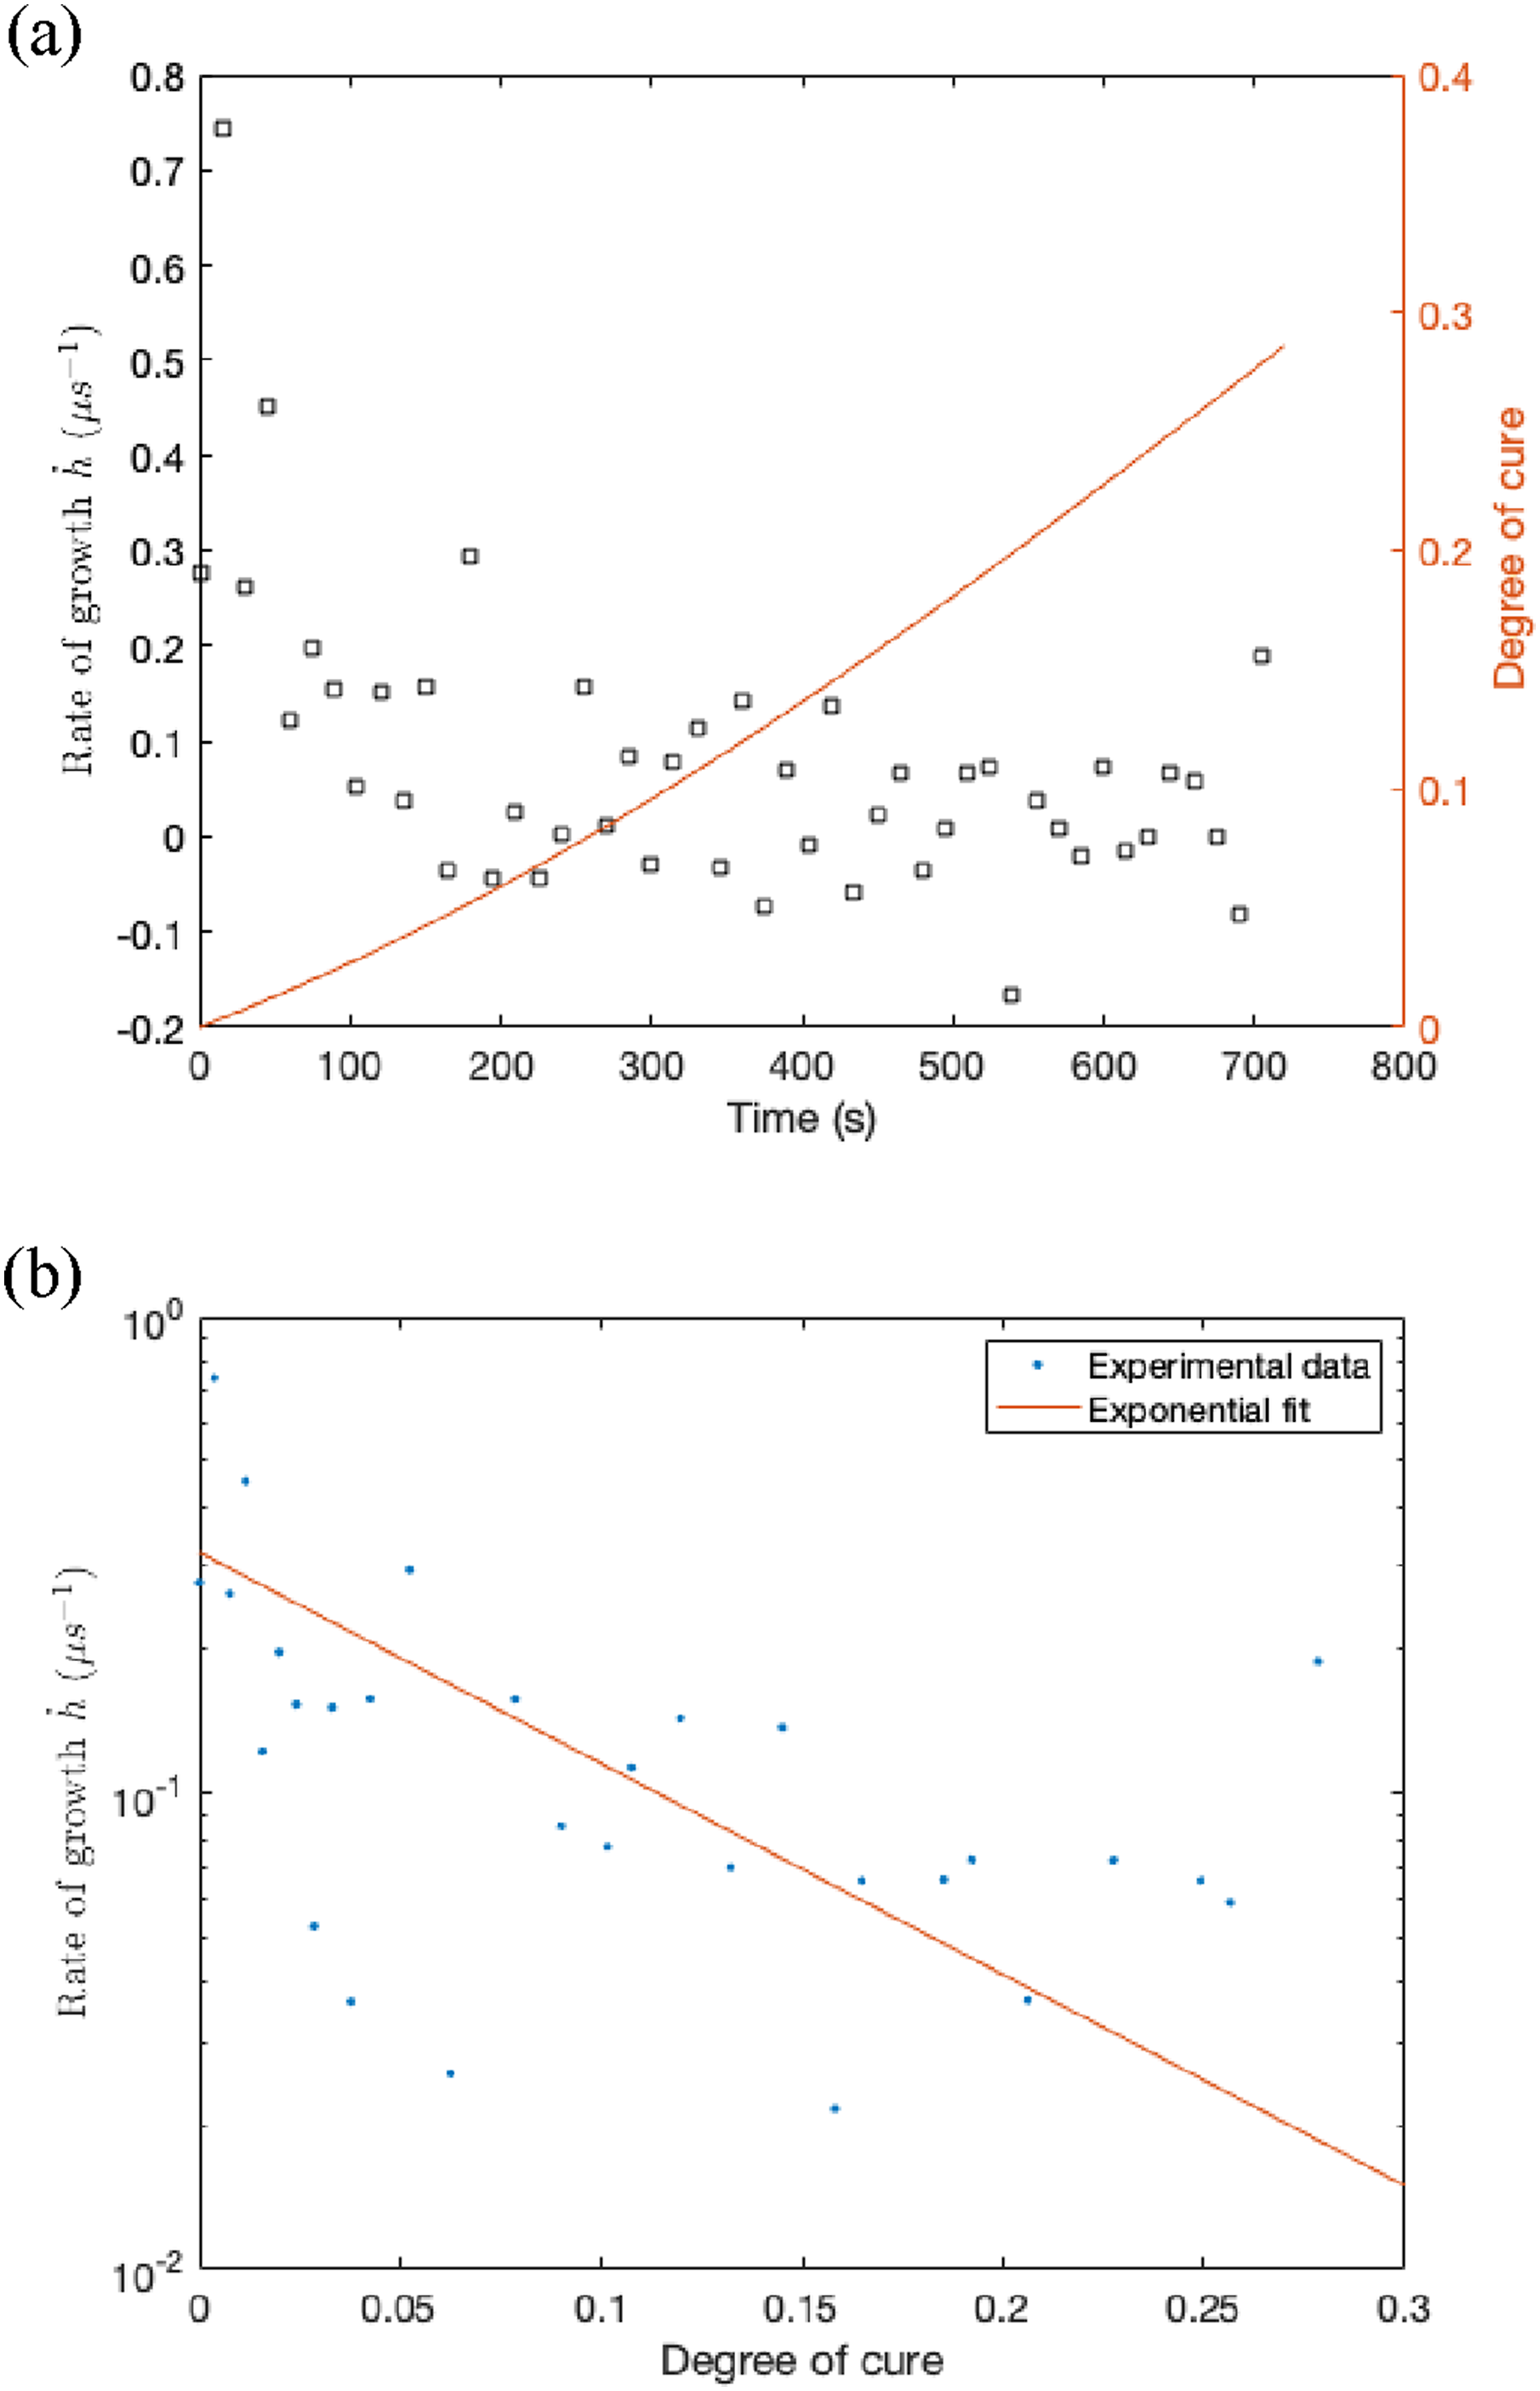
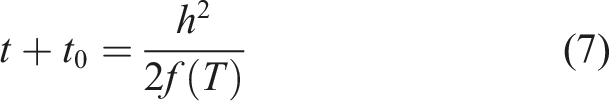
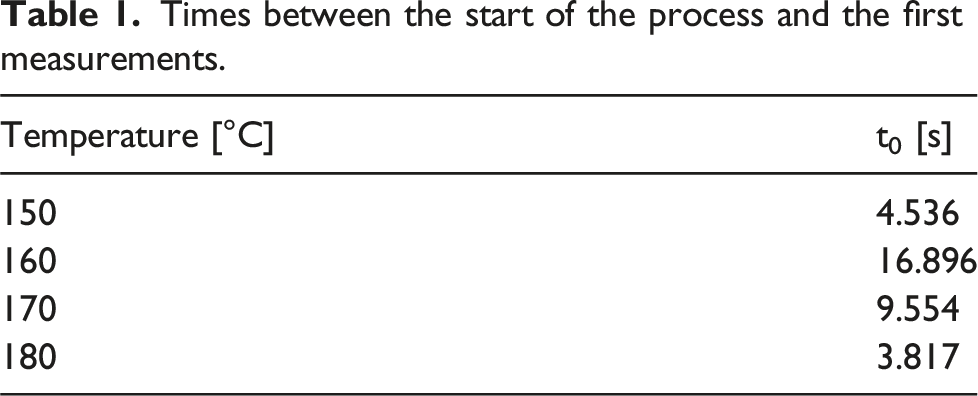
The degree of cure of the bulk during diffusion was calculated using a cure kinetics model developed for the model epoxy system by Teuwen et al. 24 Solving it using the Euler explicit time integration scheme, convergence analyses showed that results were consistent when time steps were below 0.1 s. An initial degree of cure of 0 was used, small variations in the initial degree of cure did not significantly alter the result, for example, an increase to 0.01 decreased the gel time by 10 s to 317 s. The data analysis also showed that there was a time offset due to the experimental acquisition method. The shift correction t0 was the time difference between the start of the process and the first measurement.
Initial data characterisation
The interdiffusion thickness measurements were taken at 15-s intervals,
24
resulting in an offset between the times of the first measurement and the start of the process. Before numerical methods were implemented, the values of the offsets (t
0
) were estimated to correct the measurement timings. Equation (5) was rearranged, Natural logarithm of the product of diffusion depth and diffusion rate against the degree of cure at 150°C (a), 160°C (b), 170°C (c) and 180°C (d) for the model epoxy system.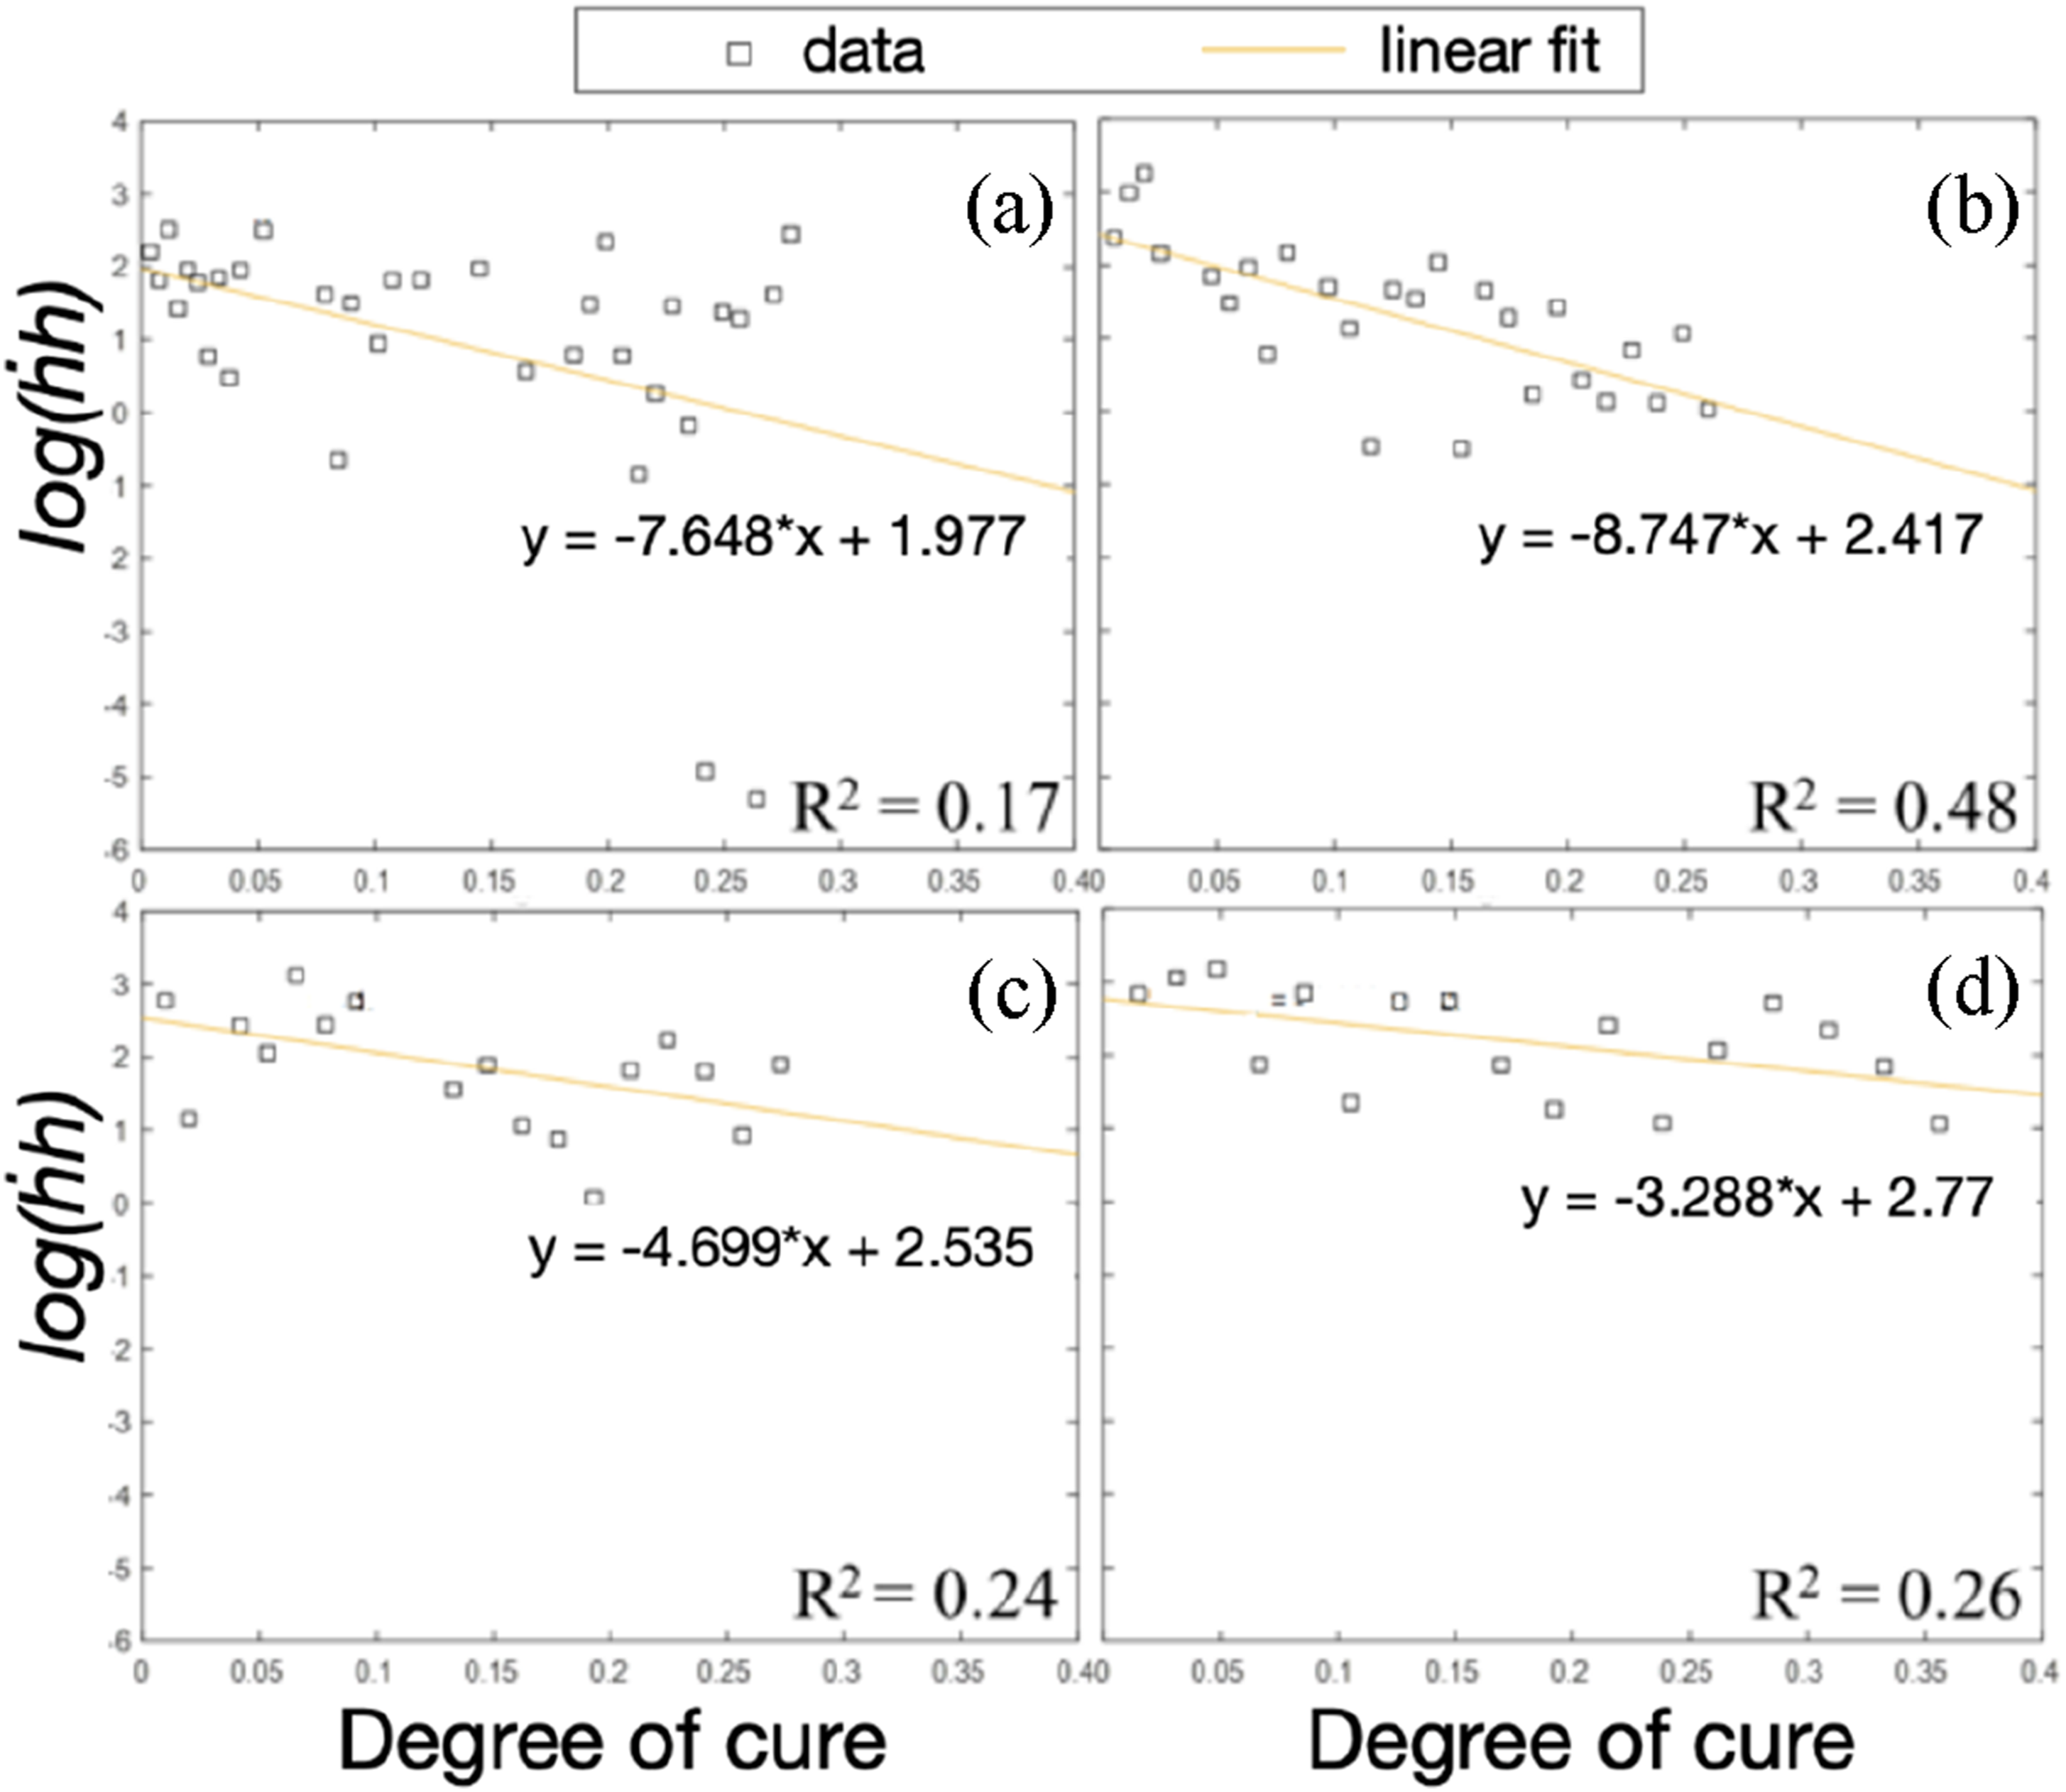
To find t0, equation (6) was integrated and rearranged in terms of time,
Times between the start of the process and the first measurements.
Numerical solution
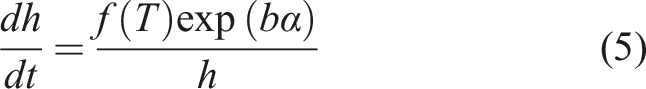
To avoid overpredicting the thickness for a given initial degree of cure, diffusion needed to stop at an appropriate degree of cure. Indeed, the exponential decay of the growth rate assumed by the model did not capture the stop in gel layer growth at the onset of phase separation suggested for isothermal conditions. 24
A step function was added to the model such that at a given temperature, diffusion stopped at the degree of cure (of the bulk material) predicted for the onset of phase separation using the cure kinetics model. The model with the step function applied took the form,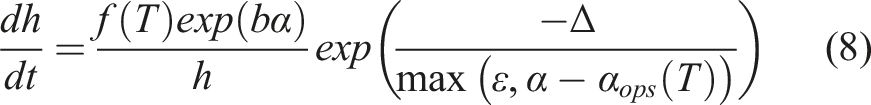
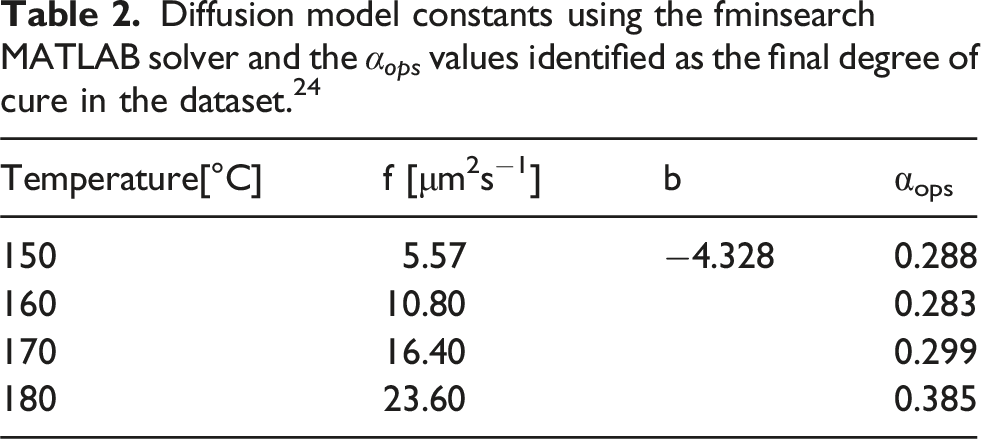
The optimal value for b and values of f(T) were found using the fminsearch solver in MATLAB. The t 0 shifted data was the input. The f(T) values obtained when finding t0 were used as the initial values. The initial b value was obtained by combining the plots in Figure 5 and forcing a fitting line through the origin, giving a value of −5.446.
Diffusion model constants using the fminsearch MATLAB solver and the α ops values identified as the final degree of cure in the dataset. 24
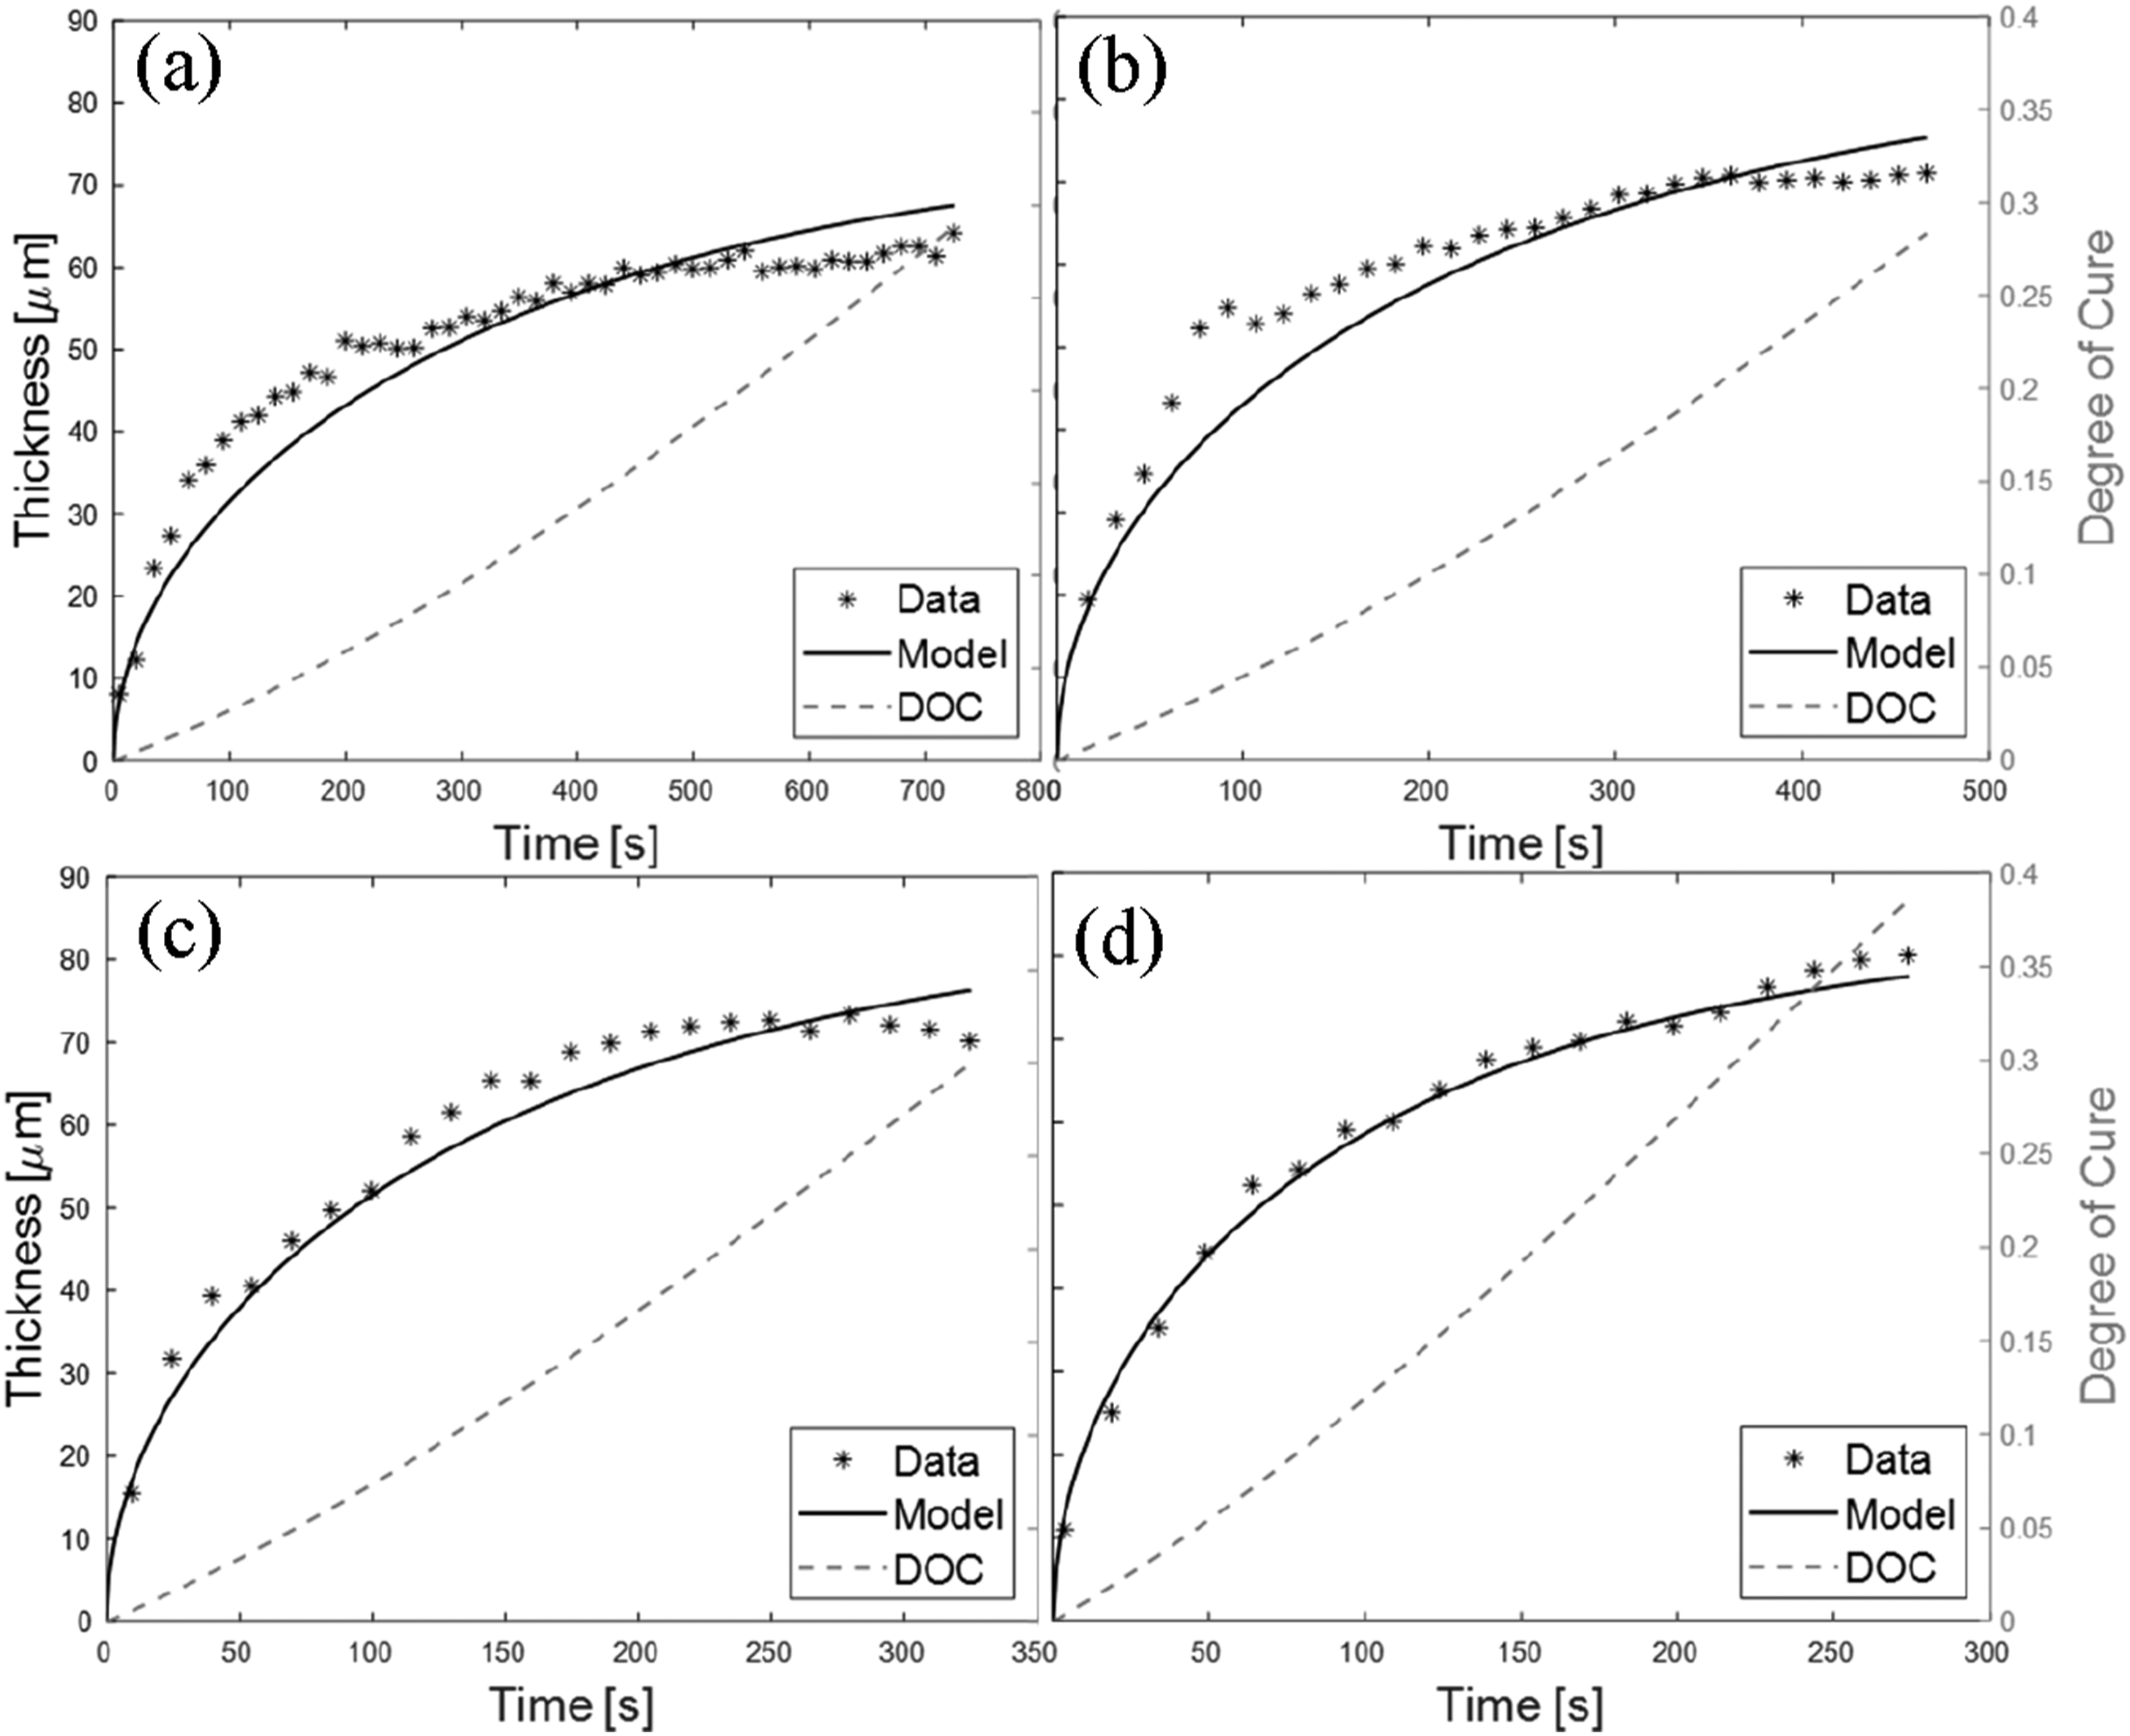
Experimental and modelled gel layer thickness data at 150°C (a), 160°C (b), 170°C (c) and 180°C (d) for the model epoxy system.
Using the assumed Arrhenius temperature dependence, the diffusivity could be decomposed, to give D
∞
and E
a
. The natural logarithm of the f values in Table 2 were plotted against the reciprocal of absolute temperature, Figure 7 shows the result. The fit gave a D
∞
of 1.066 × 1010 μm2s−1 and an E
a
of 75100 Jmol−1. Arrhenius temperature fit of diffusivity.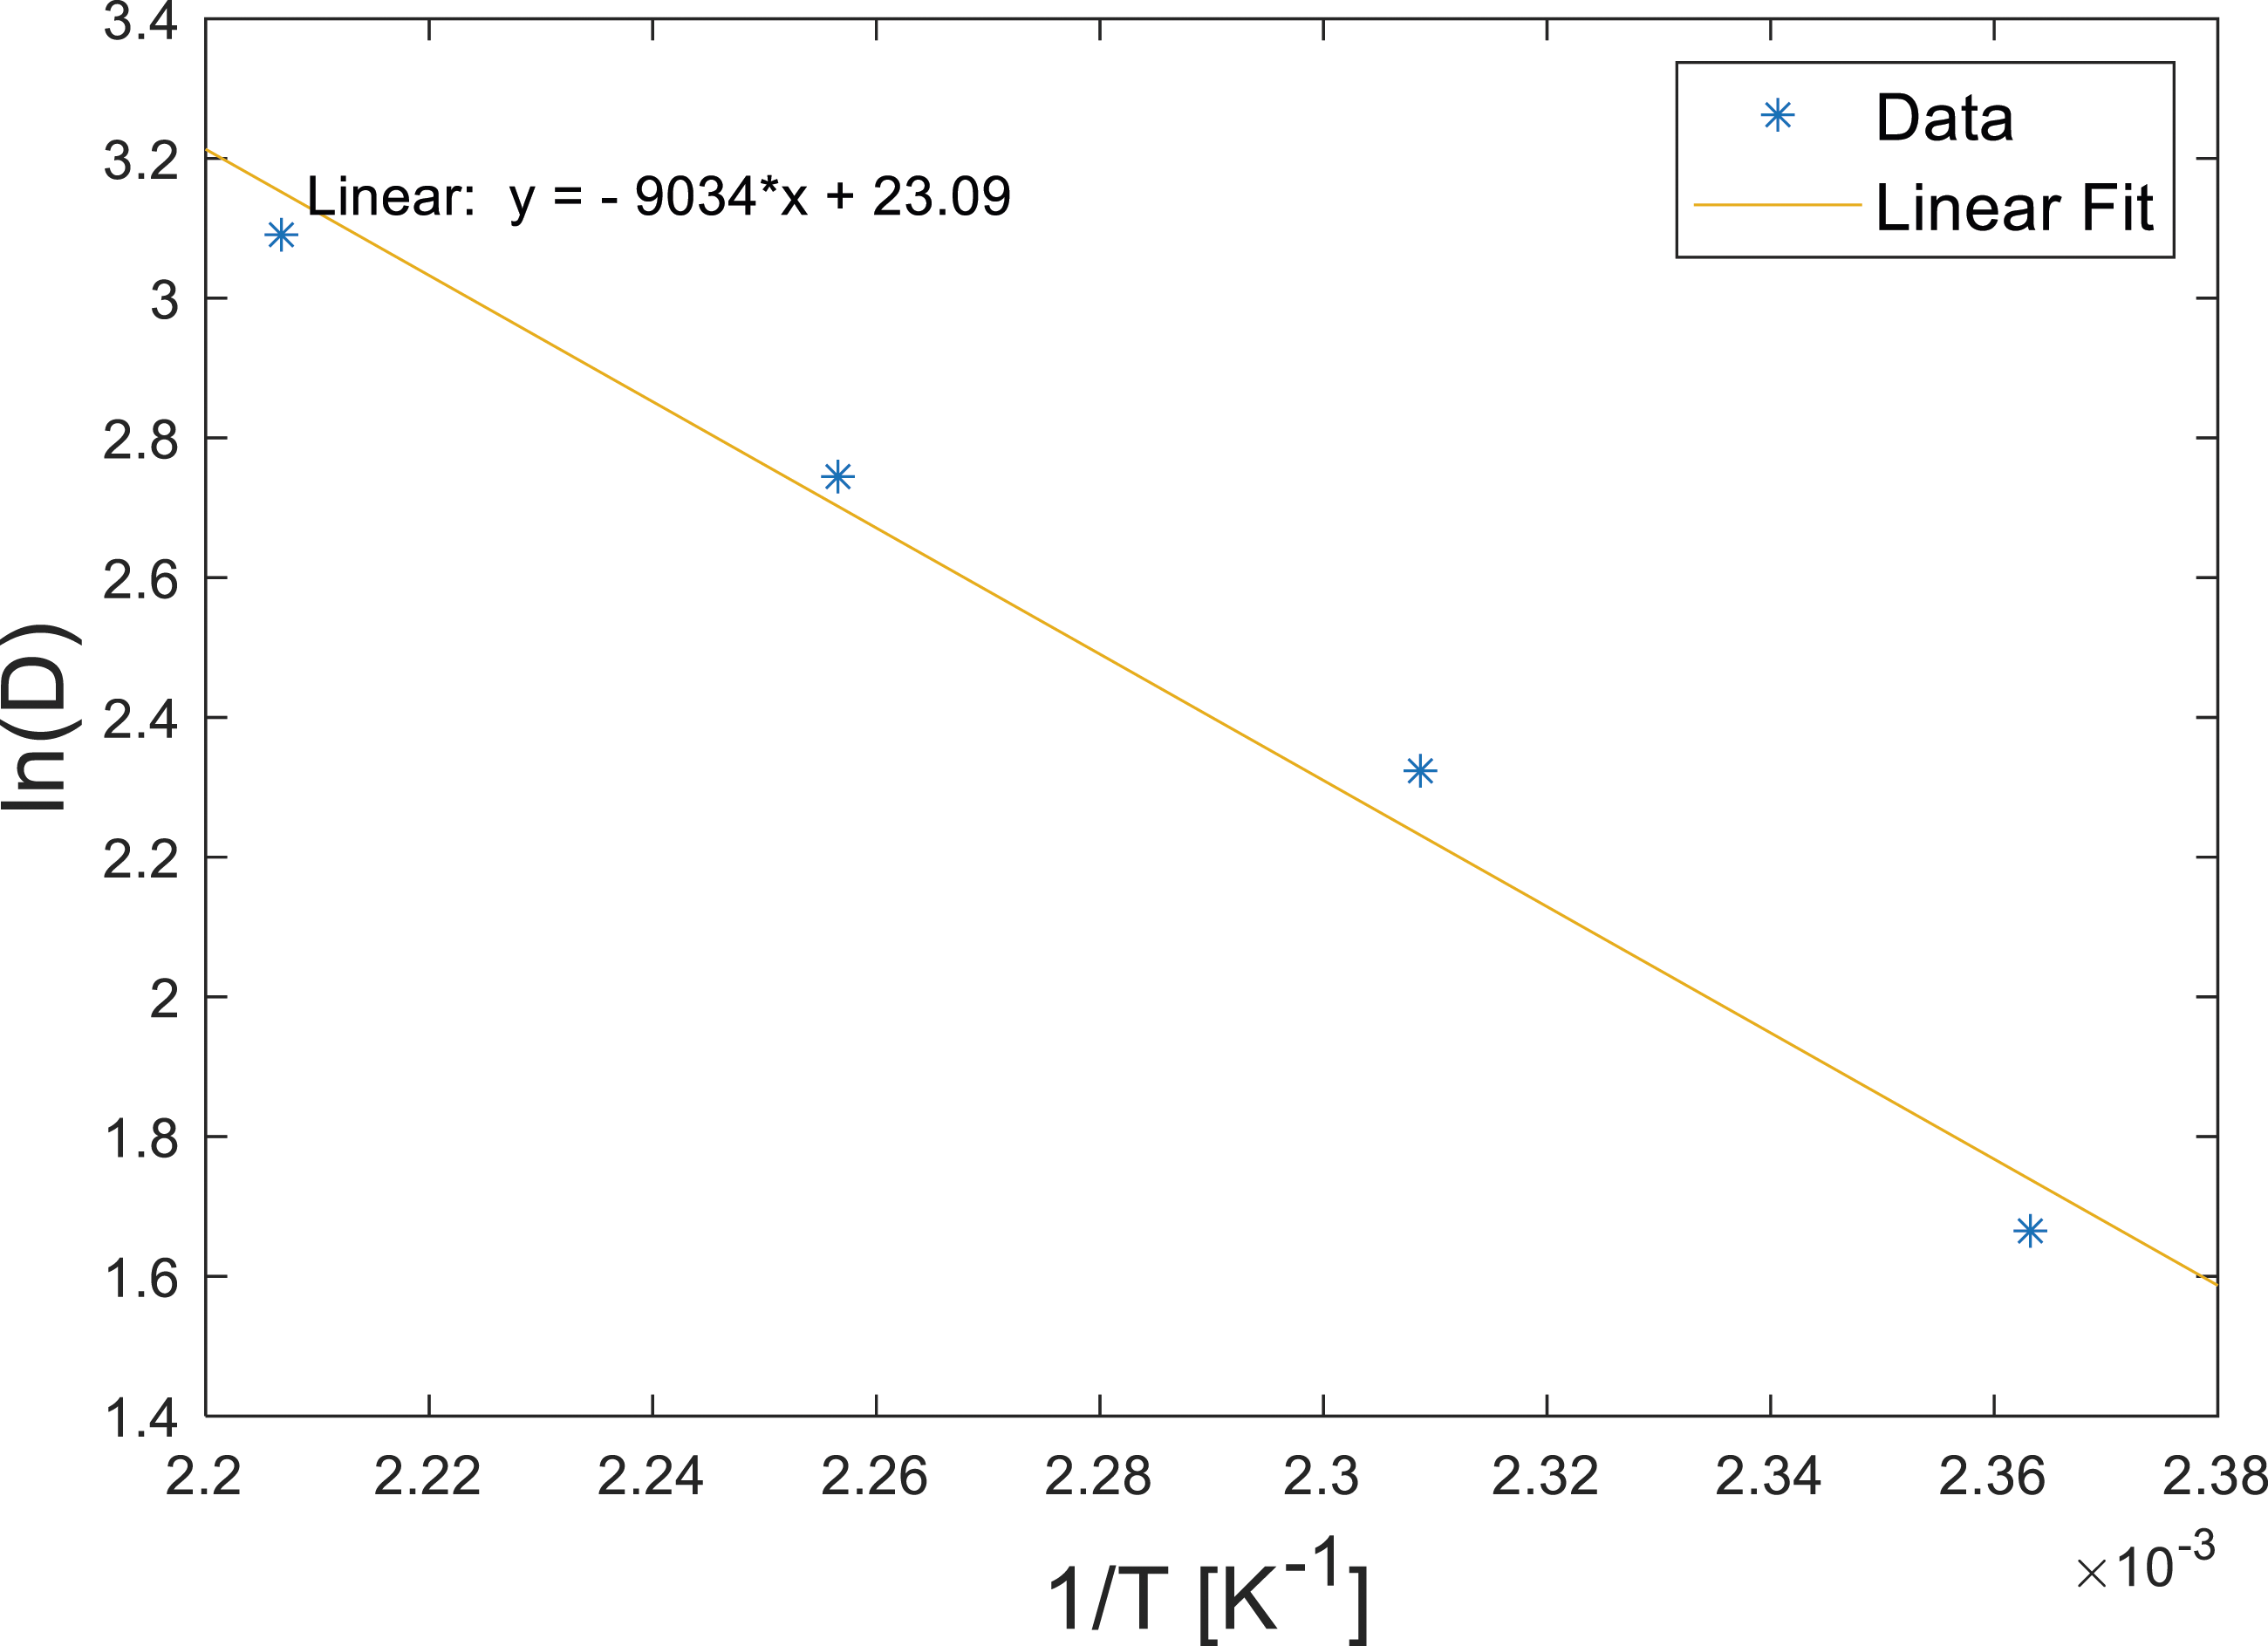
Adapting the model for EP2410
Unlike the model resin system used for diffusion measurements, 24 EP2410 is a development resin system that contains undisclosed additives, which may affect PEI diffusivity. 16 To apply the model to diffusion with EP2410, given it is typically assumed a similar mechanism underlies the interdiffusion process regardless of the epoxy system, the epoxy systems were assumed to have the same thermal dependency and thus activation energy E a . f was only shifted assuming a different D ∞ . The onset of phase separation was set to occur at a degree of cure of 0.76, the gel point of EP2410 at 180°C. 28 The αops values in Table 2 suggest phase separation occurred before gelation, however, at 180°C αops was close to the gel point of 0.43. Hence, in the absence of in-situ data, the gel point provided a reasonable estimate for αops.
Results and discussion
Microscopy
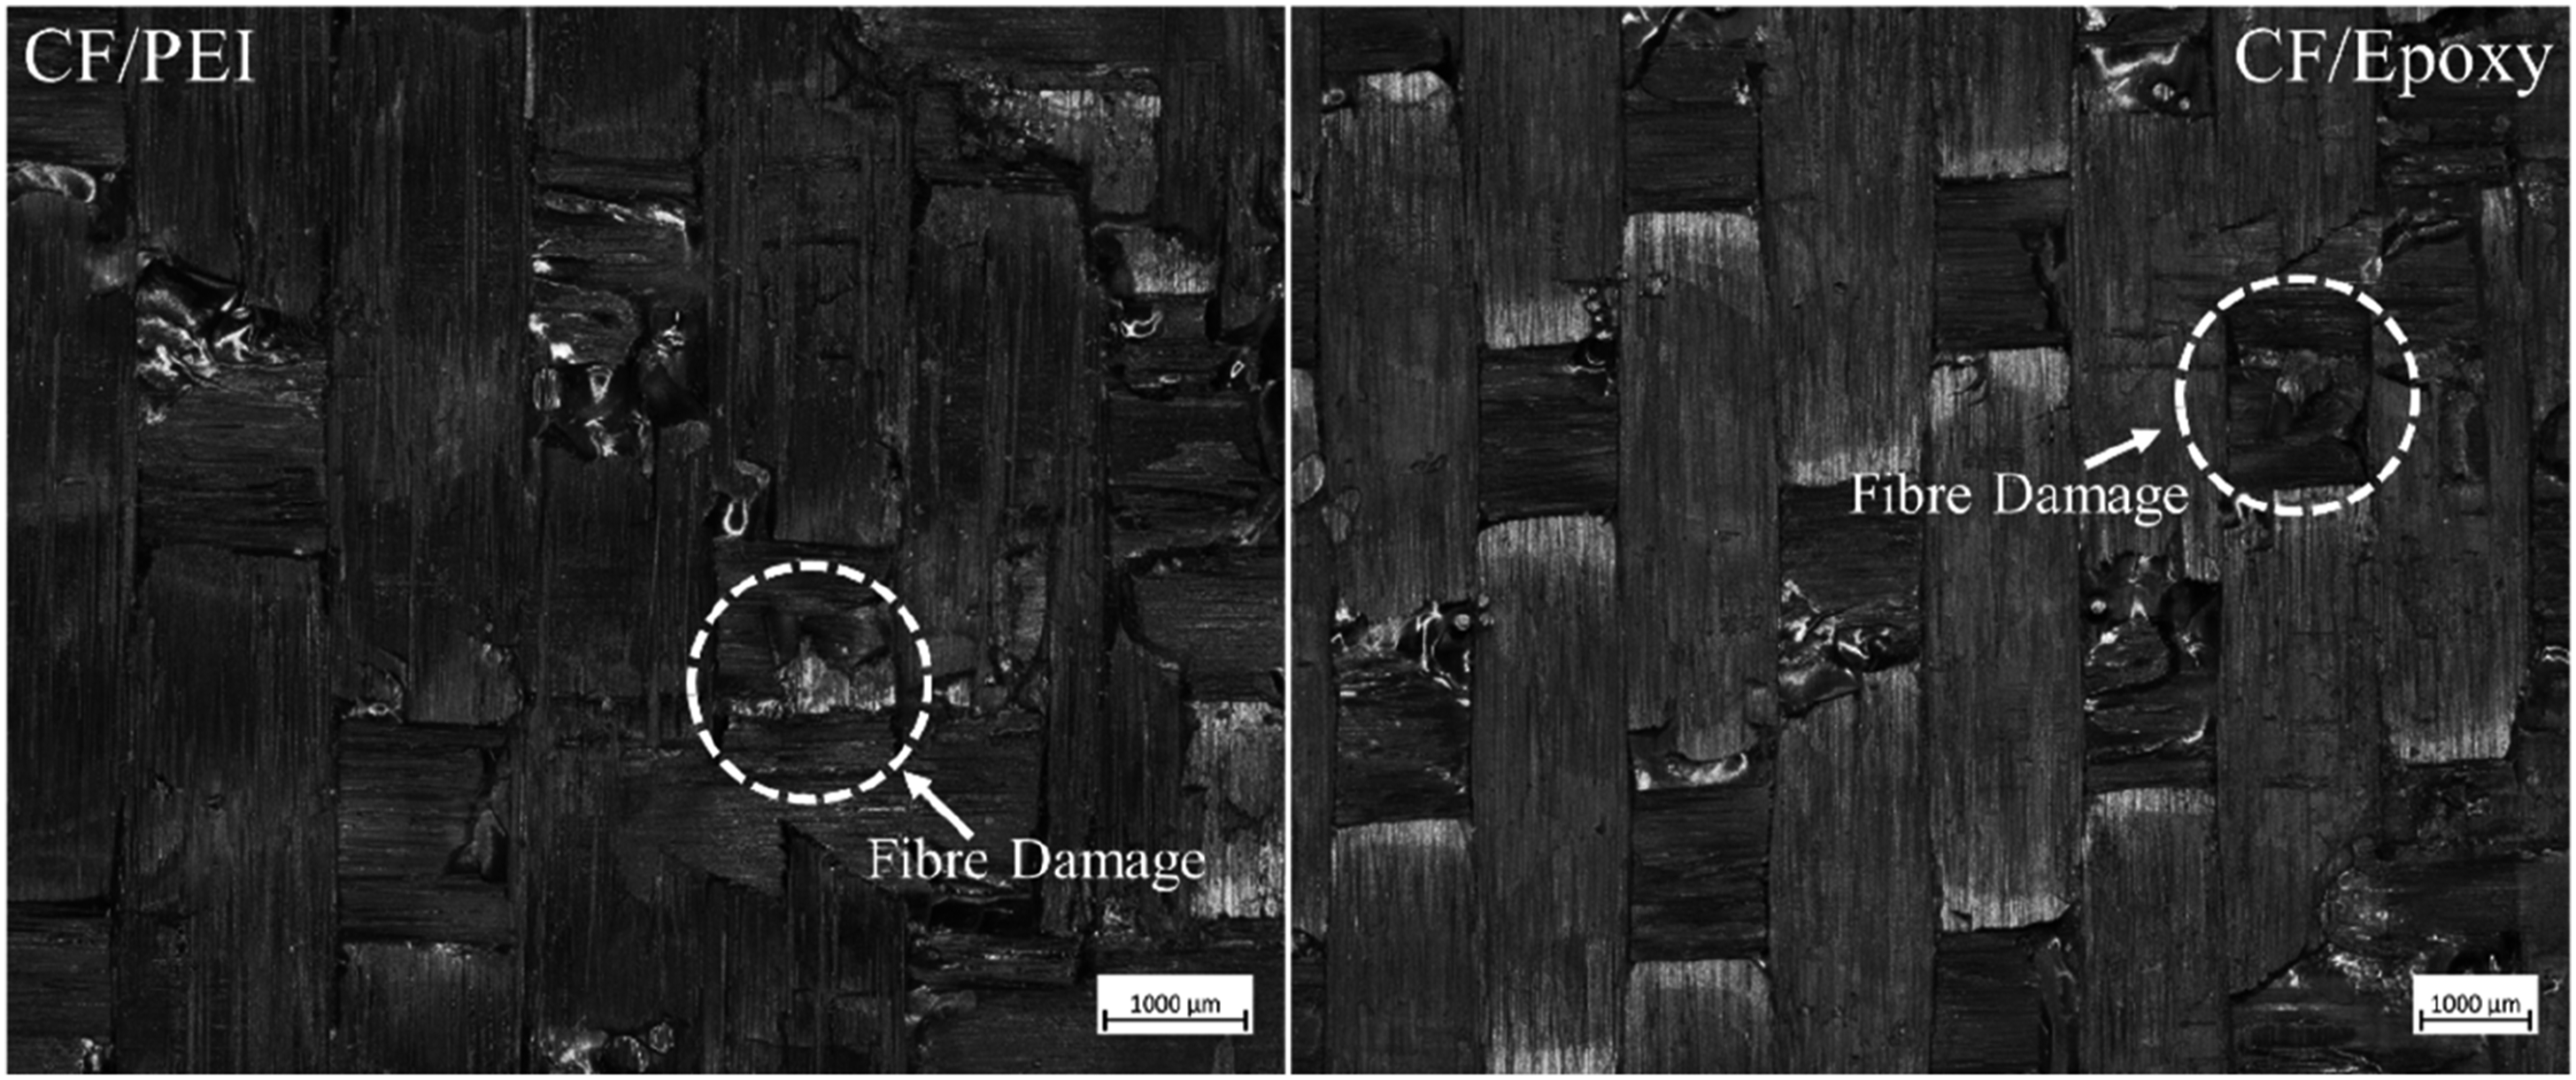
Micrographs of the failed interfaces shown in Figure 8 indicated a decline in the level of interaction between the two adherends as the initial degree of cure increased. Figure 9 shows that with IC20 specimens, fibre damage and what appeared to be polymer deposition from the opposing adherend were present on both sides. With IC70 specimens no fibre damage was visible, evidence of adhesion was limited to damage to the surface layer of polymer on each surface. Optical micrographs of fractured surfaces between adherends of IC20 (a) IC70 (b) and IC85 (c). Close-up of the fracture surface on an IC20 specimen with visible fibre damage (not aligned).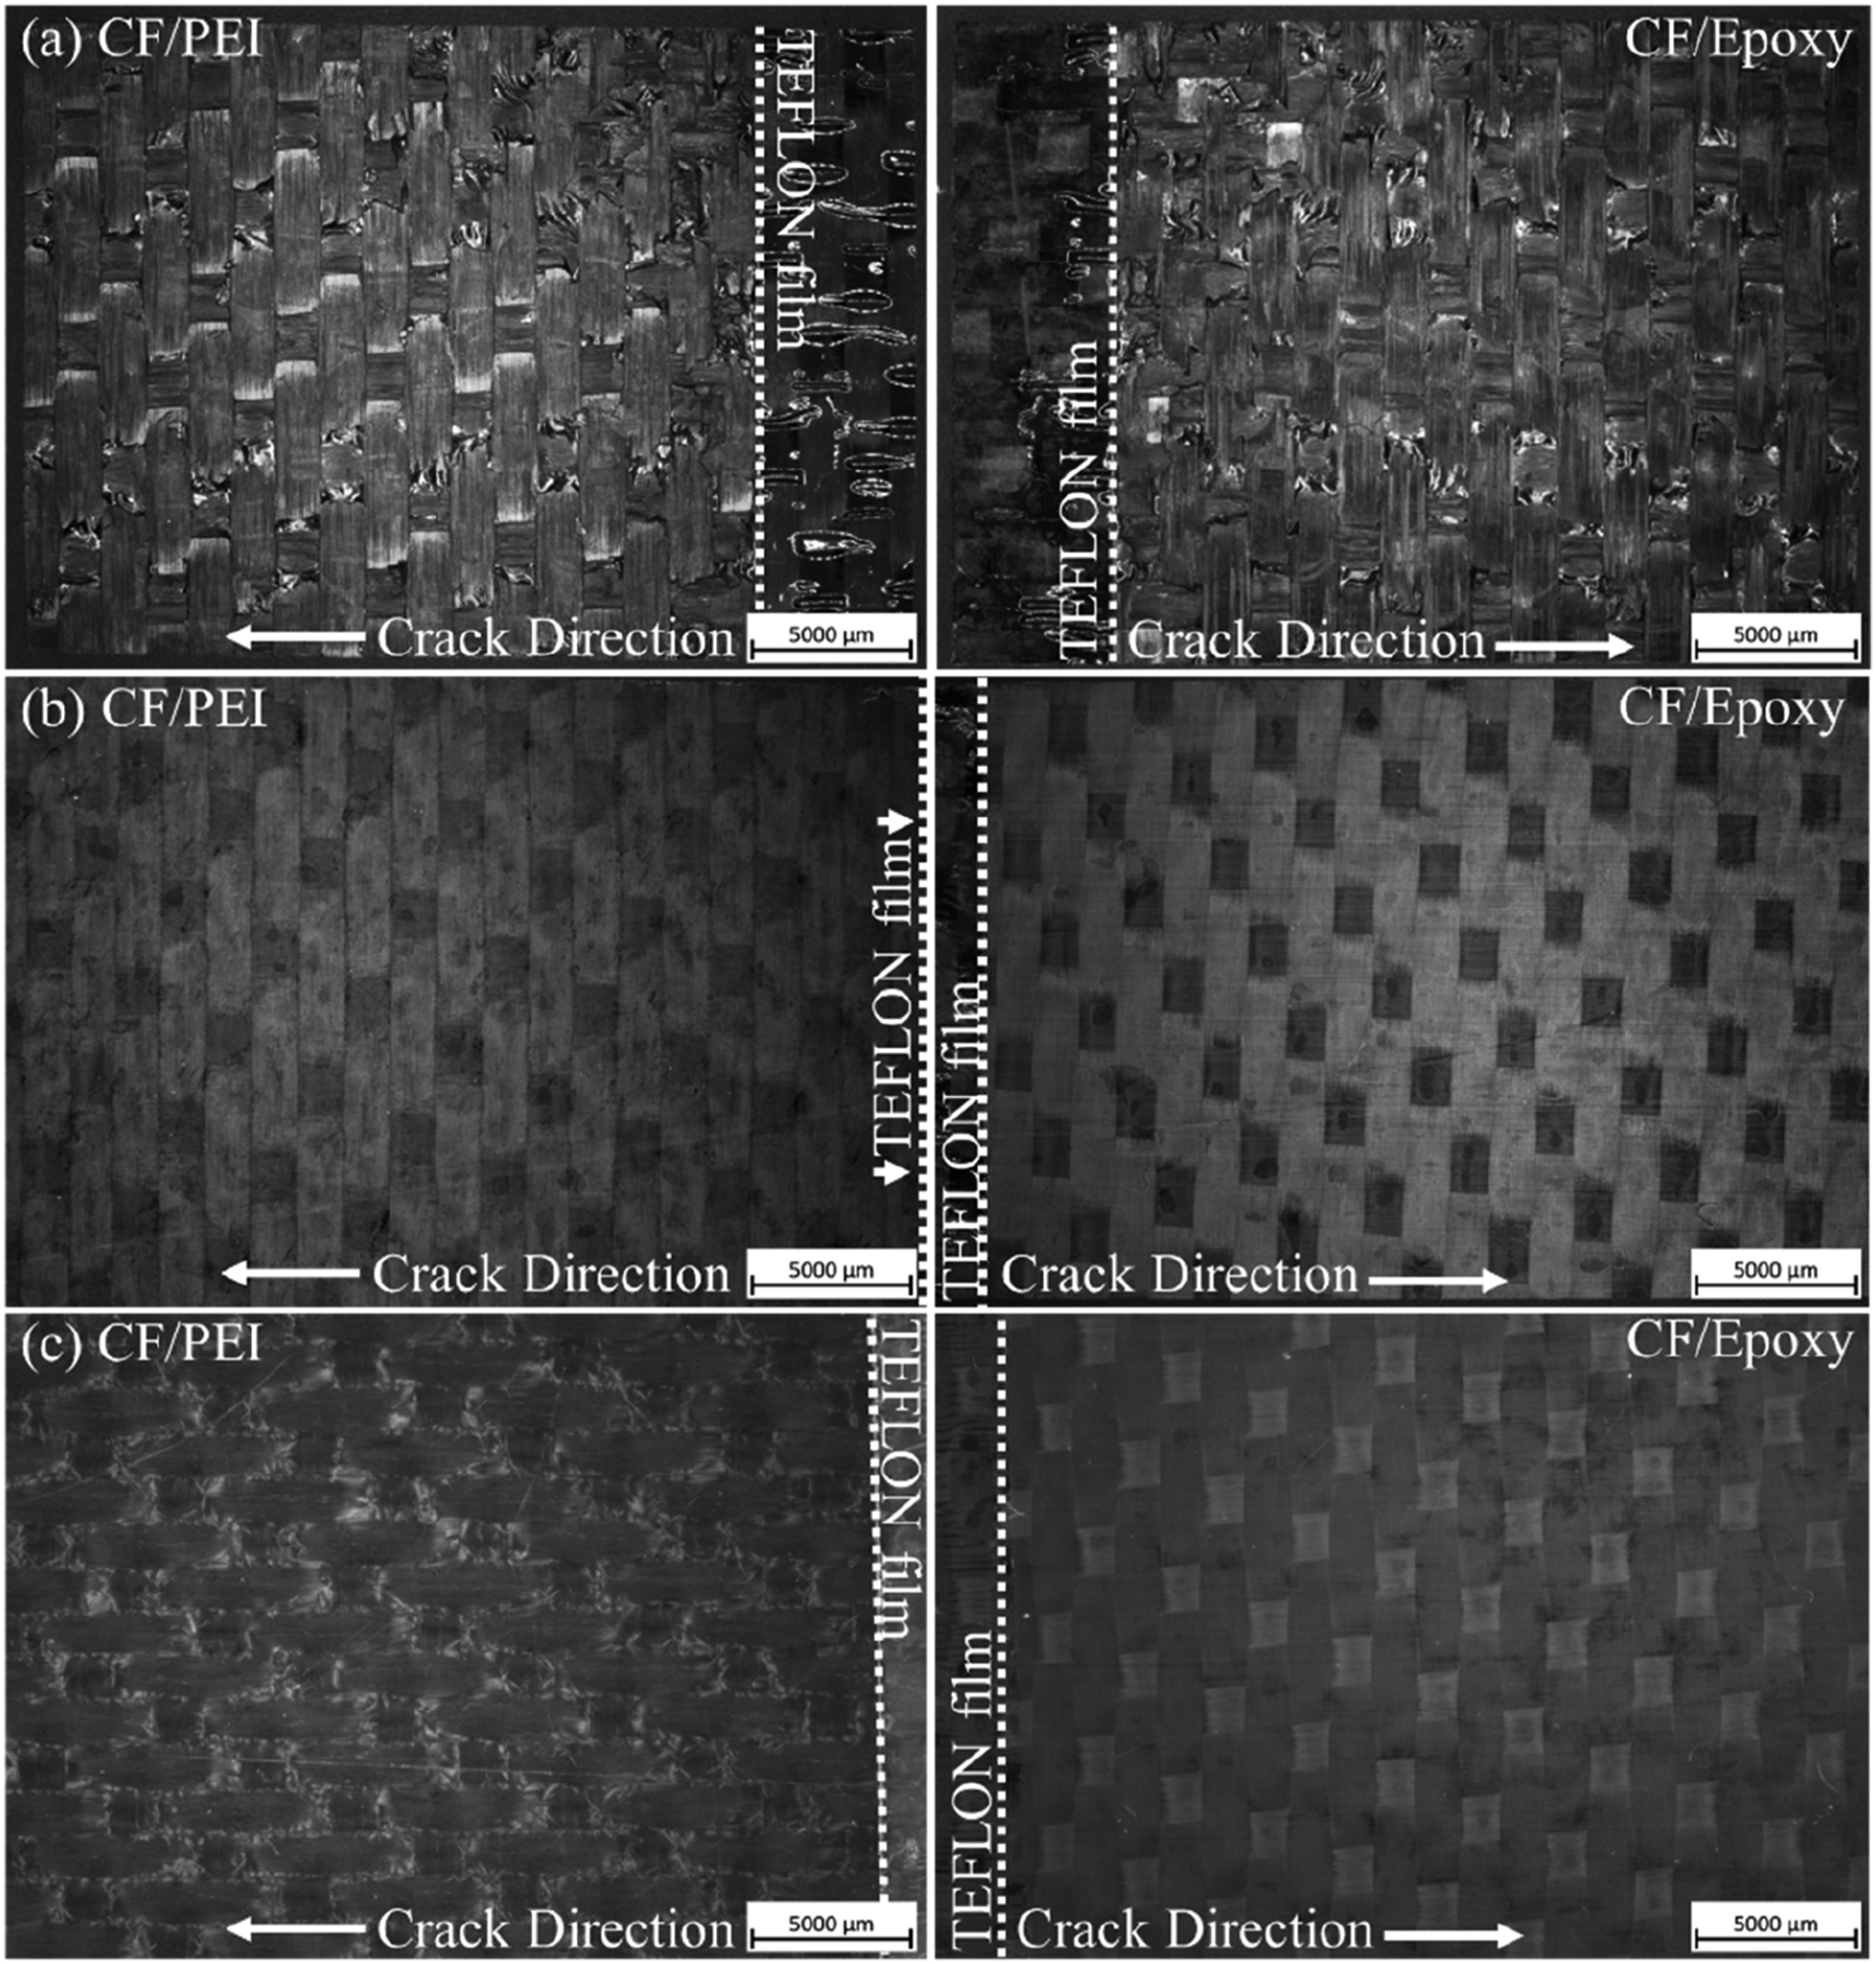
With the IC85 plates, the surfaces appeared smooth, with little evidence of interaction with the opposing plate. It is noted from Figure 8 that the orientation of the thermoplastic laminate in the IC85 sample had a different orientation from the other two samples. Although fibre layup can influence GIC, given no surface fracture was apparent, it is assumed this discrepancy had a negligible influence on the result. The lack of evidence of surface interaction on the IC85 plates agreed with previous work showing interdiffusion does not occur post-gelation 11 and is consistent with the plates coming apart when trying to cut them into DCB specimens. As a result, the remaining analysis could only be performed with the IC20 and IC70 specimens.
The gel layer thickness measurements were aggregated for each initial degree of cure and displayed in Figure 10, the bars represent the mean, and the error bars represent the standard deviation. The mean gel layer thickness for IC20 was almost double that of IC70. The variability was also greater. The negligible resistance to failure of the IC85 plates and the smooth failure surface suggested no gel layer was formed. Gel layer thicknesses of IC20, IC70 and IC85 samples.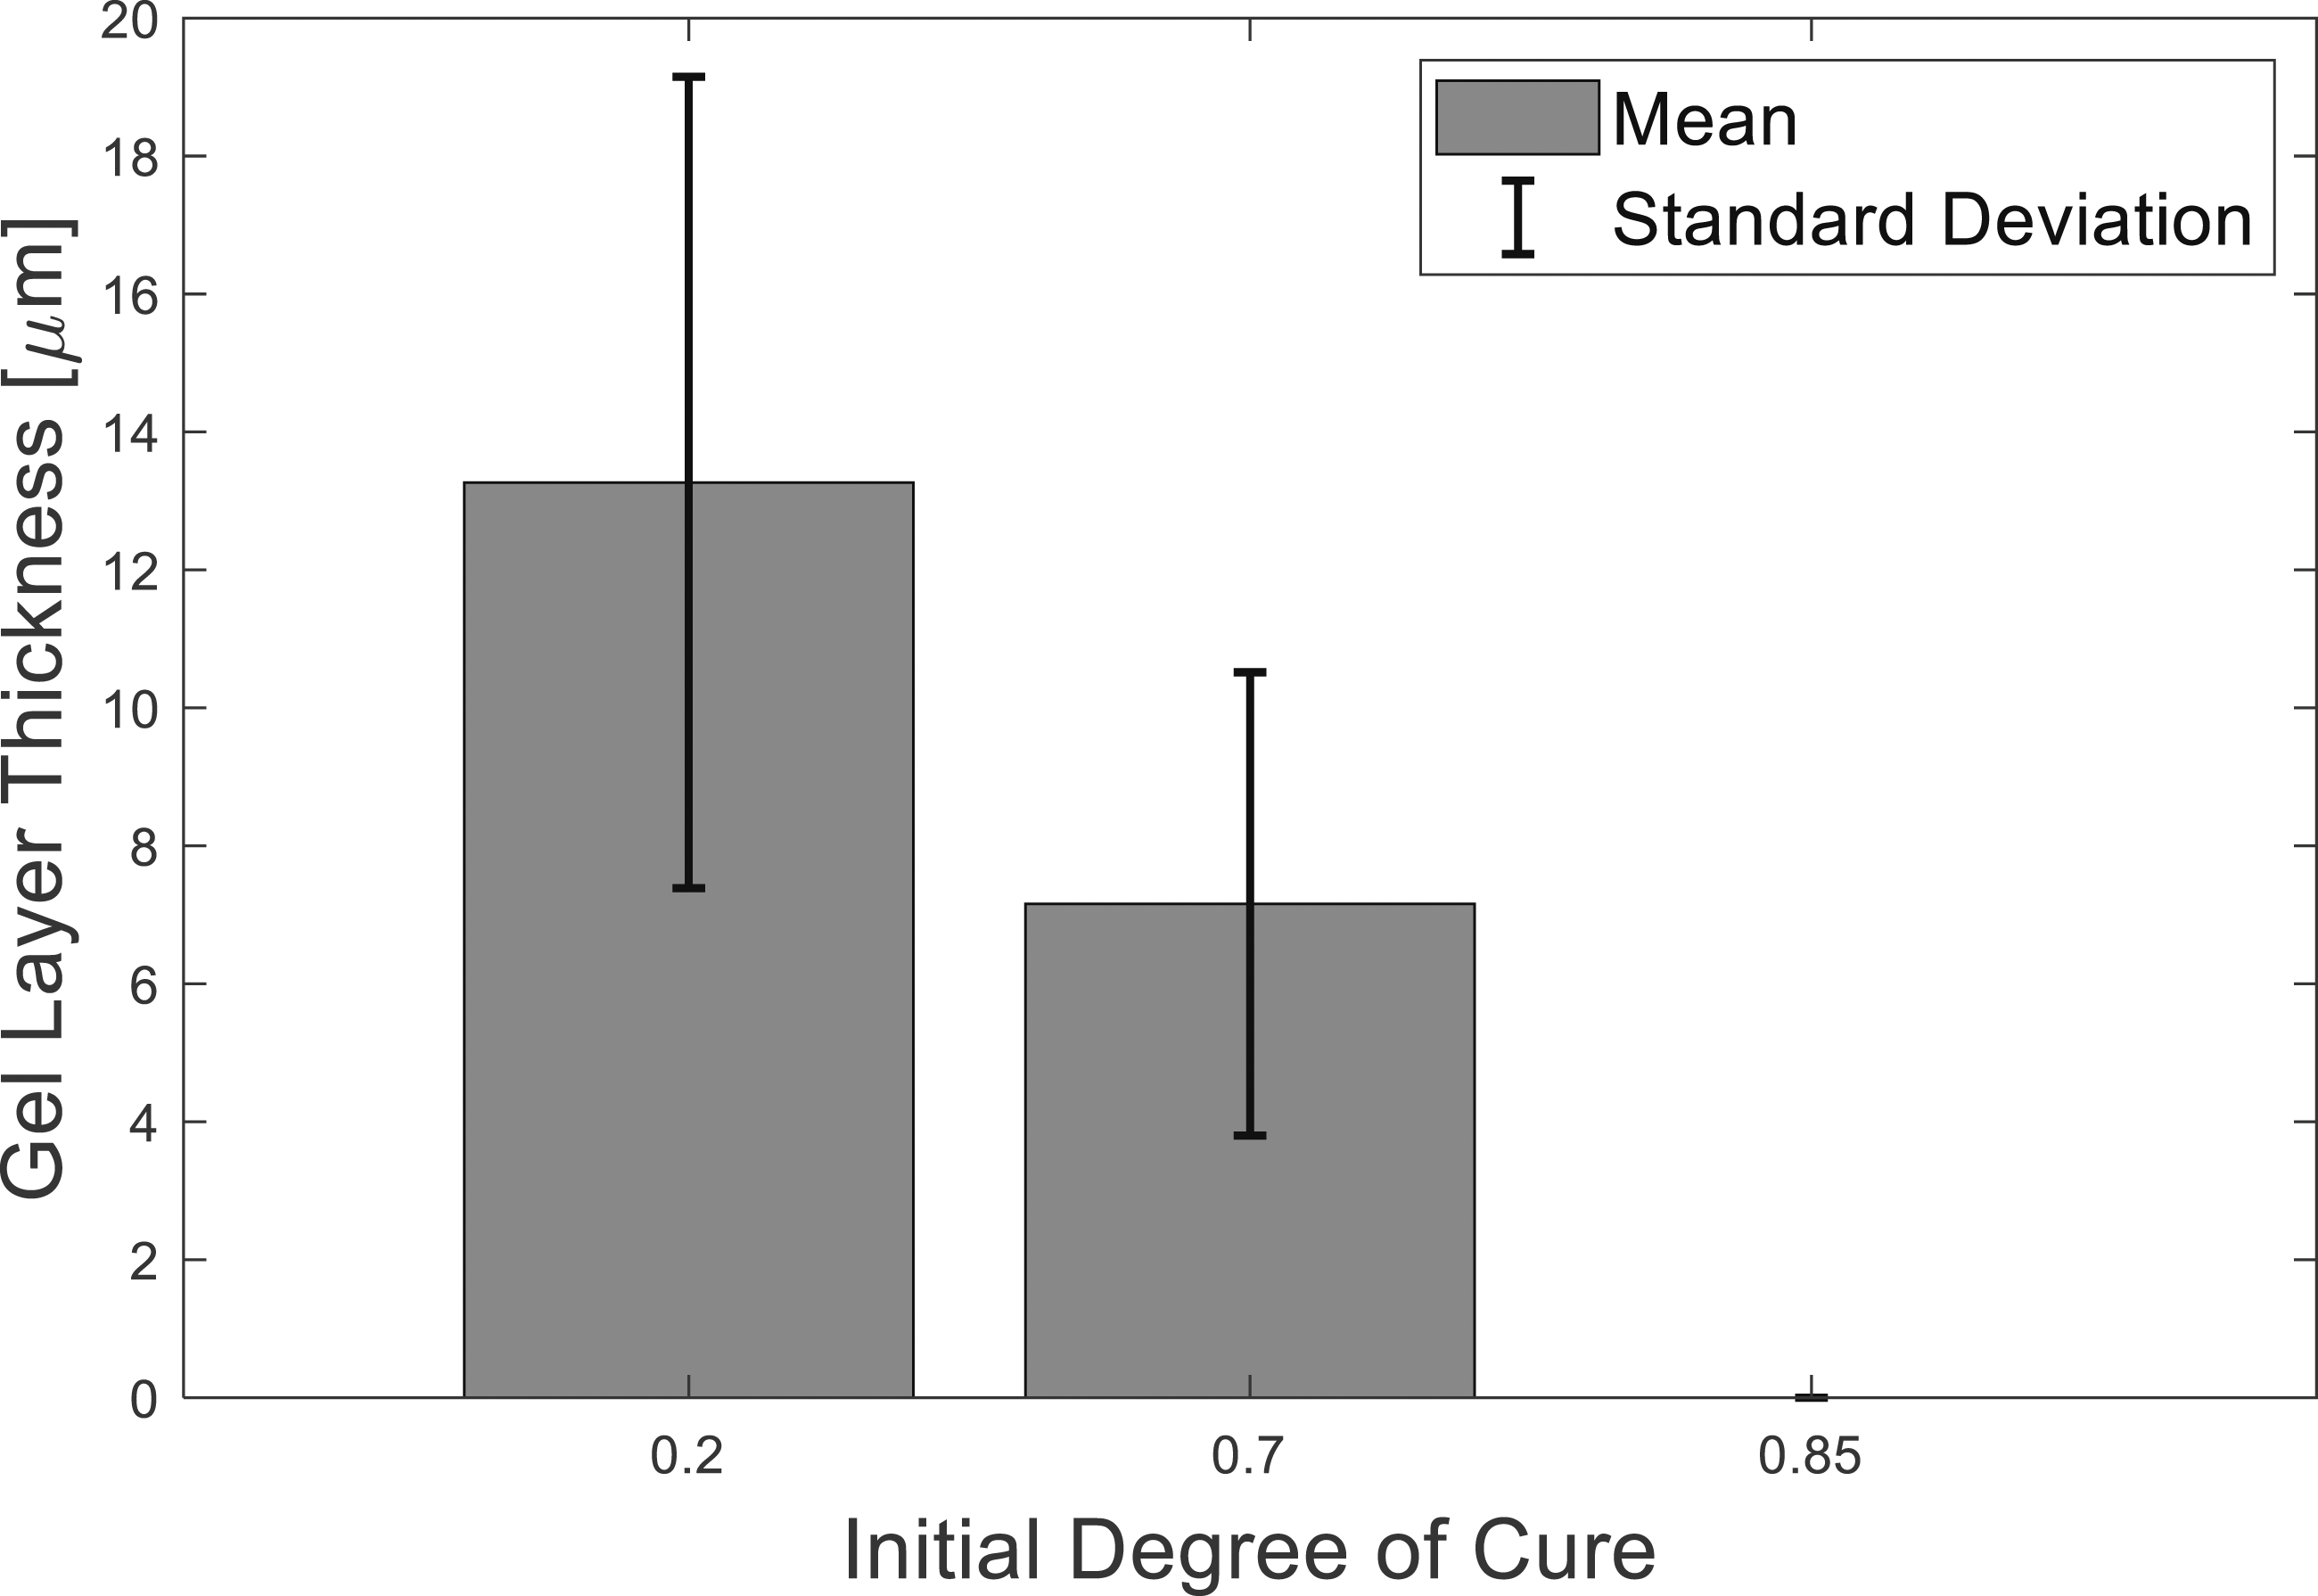
Micrographs of polished IC20 and IC70 cross-sections shown in Figure 11 highlight differences between the gel layers. There was a difference in the way fibres interacted with the gel layer. With the IC20 specimens, it was common to see fibre bundles from the thermoplastic laminate migrate into the thermoset laminate, crossing the interface as in Figure 11(c). The gel layer formation appeared to be disrupted in these locations. In contrast, in the IC70 specimens, the fibres appeared unable to migrate across the interface, preventing this disruption, this is illustrated in the lower magnification micrograph of an IC20 interface in Figure 12. Optical micrographs of commercial epoxy-PEI laminate interphases, showing clean gel layers for IC20 (a) and IC70 (b) specimens, and gel layer-fibre interaction in the IC20 specimen (c). Optical micrograph of commercial epoxy-PEI laminate interphase in the IC70 specimen.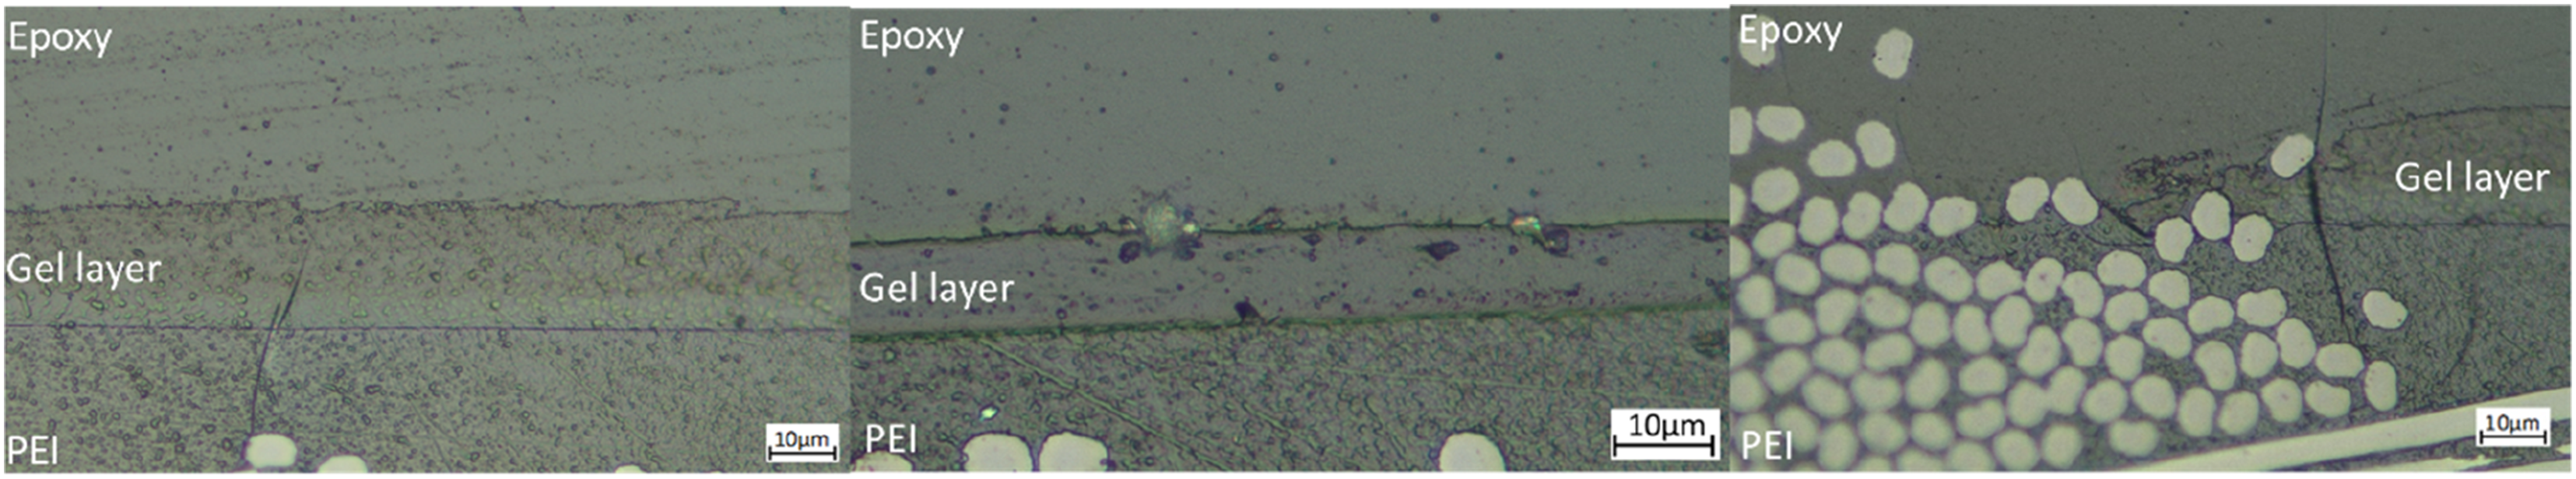
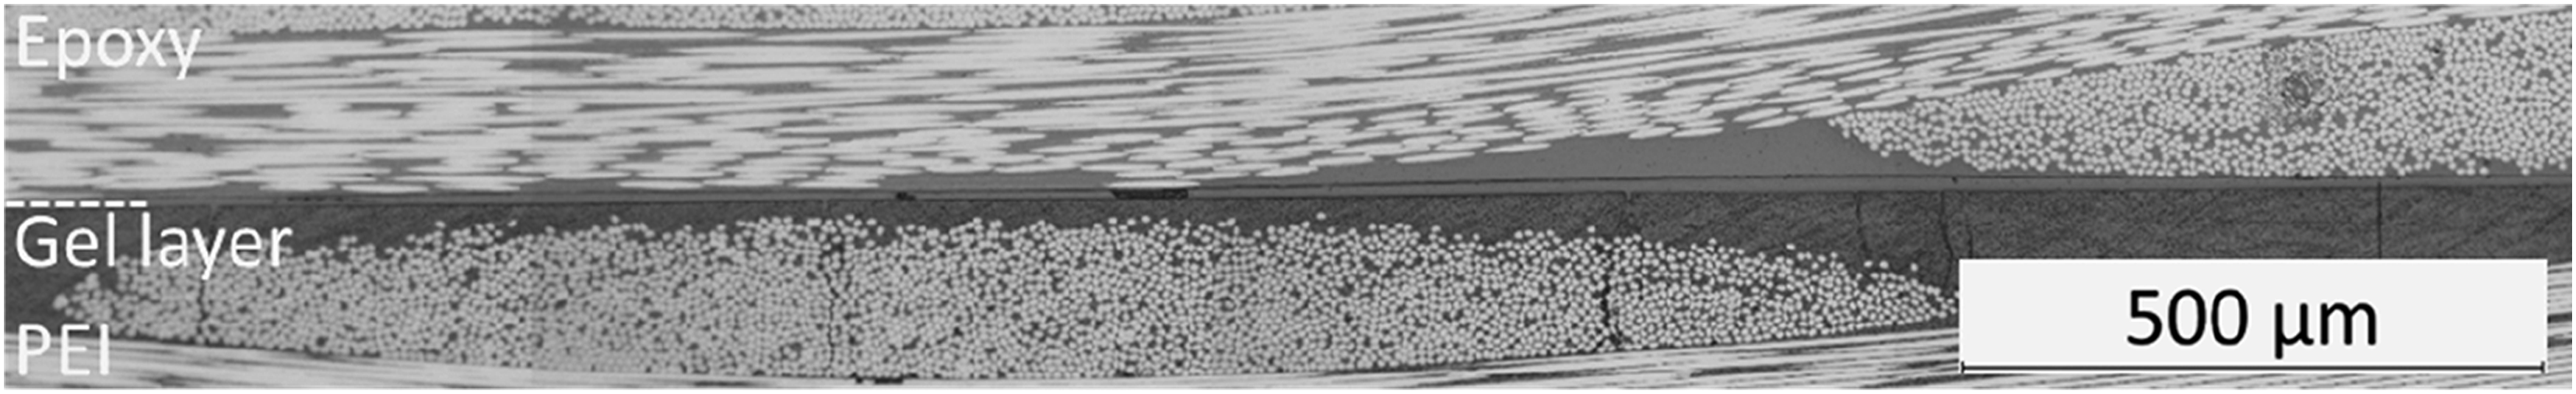
Figures 11(a) and (b) evidenced a difference in the appearance of the two interphases. In both cases the gel layer was delimited by sharp boundaries, indicative of phase separation. However, in the IC20 sample, there was a gradient in colour between the two fronts. The darker region in the gel layer towards the epoxy side has been attributed to spinodal decomposition,15,24,25 as the dissolved PEI phase separates. Spinodal decomposition is associated with the toughening morphologies, phase-inverted and co-continuous. 32 This region was less apparent in IC70, which was consistent with the level of swelling decreasing with a greater initial degree of cure. 11
Double cantilever beam test results
The mean and standard deviation of the GIC values for the two initial degrees of cure are shown in Figure 13, note a log scale was used on the y-axis to aid visualisation. According to a standard definition of outliers, values further than 1.5 times the interquartile range outside the upper and lower quartiles, a measurement was removed from each set of measurements. In both sets, this was the greatest value, a value of 1793 Jm−2 from the IC20 measurements and a value of 11 Jm−2 from the IC70 measurements. Mode 1 interlaminar fracture toughness (GIC) of IC20, IC70 and IC85 specimens. The GIC between uncured EP2410 laminates (TS-TS)
28
is also included.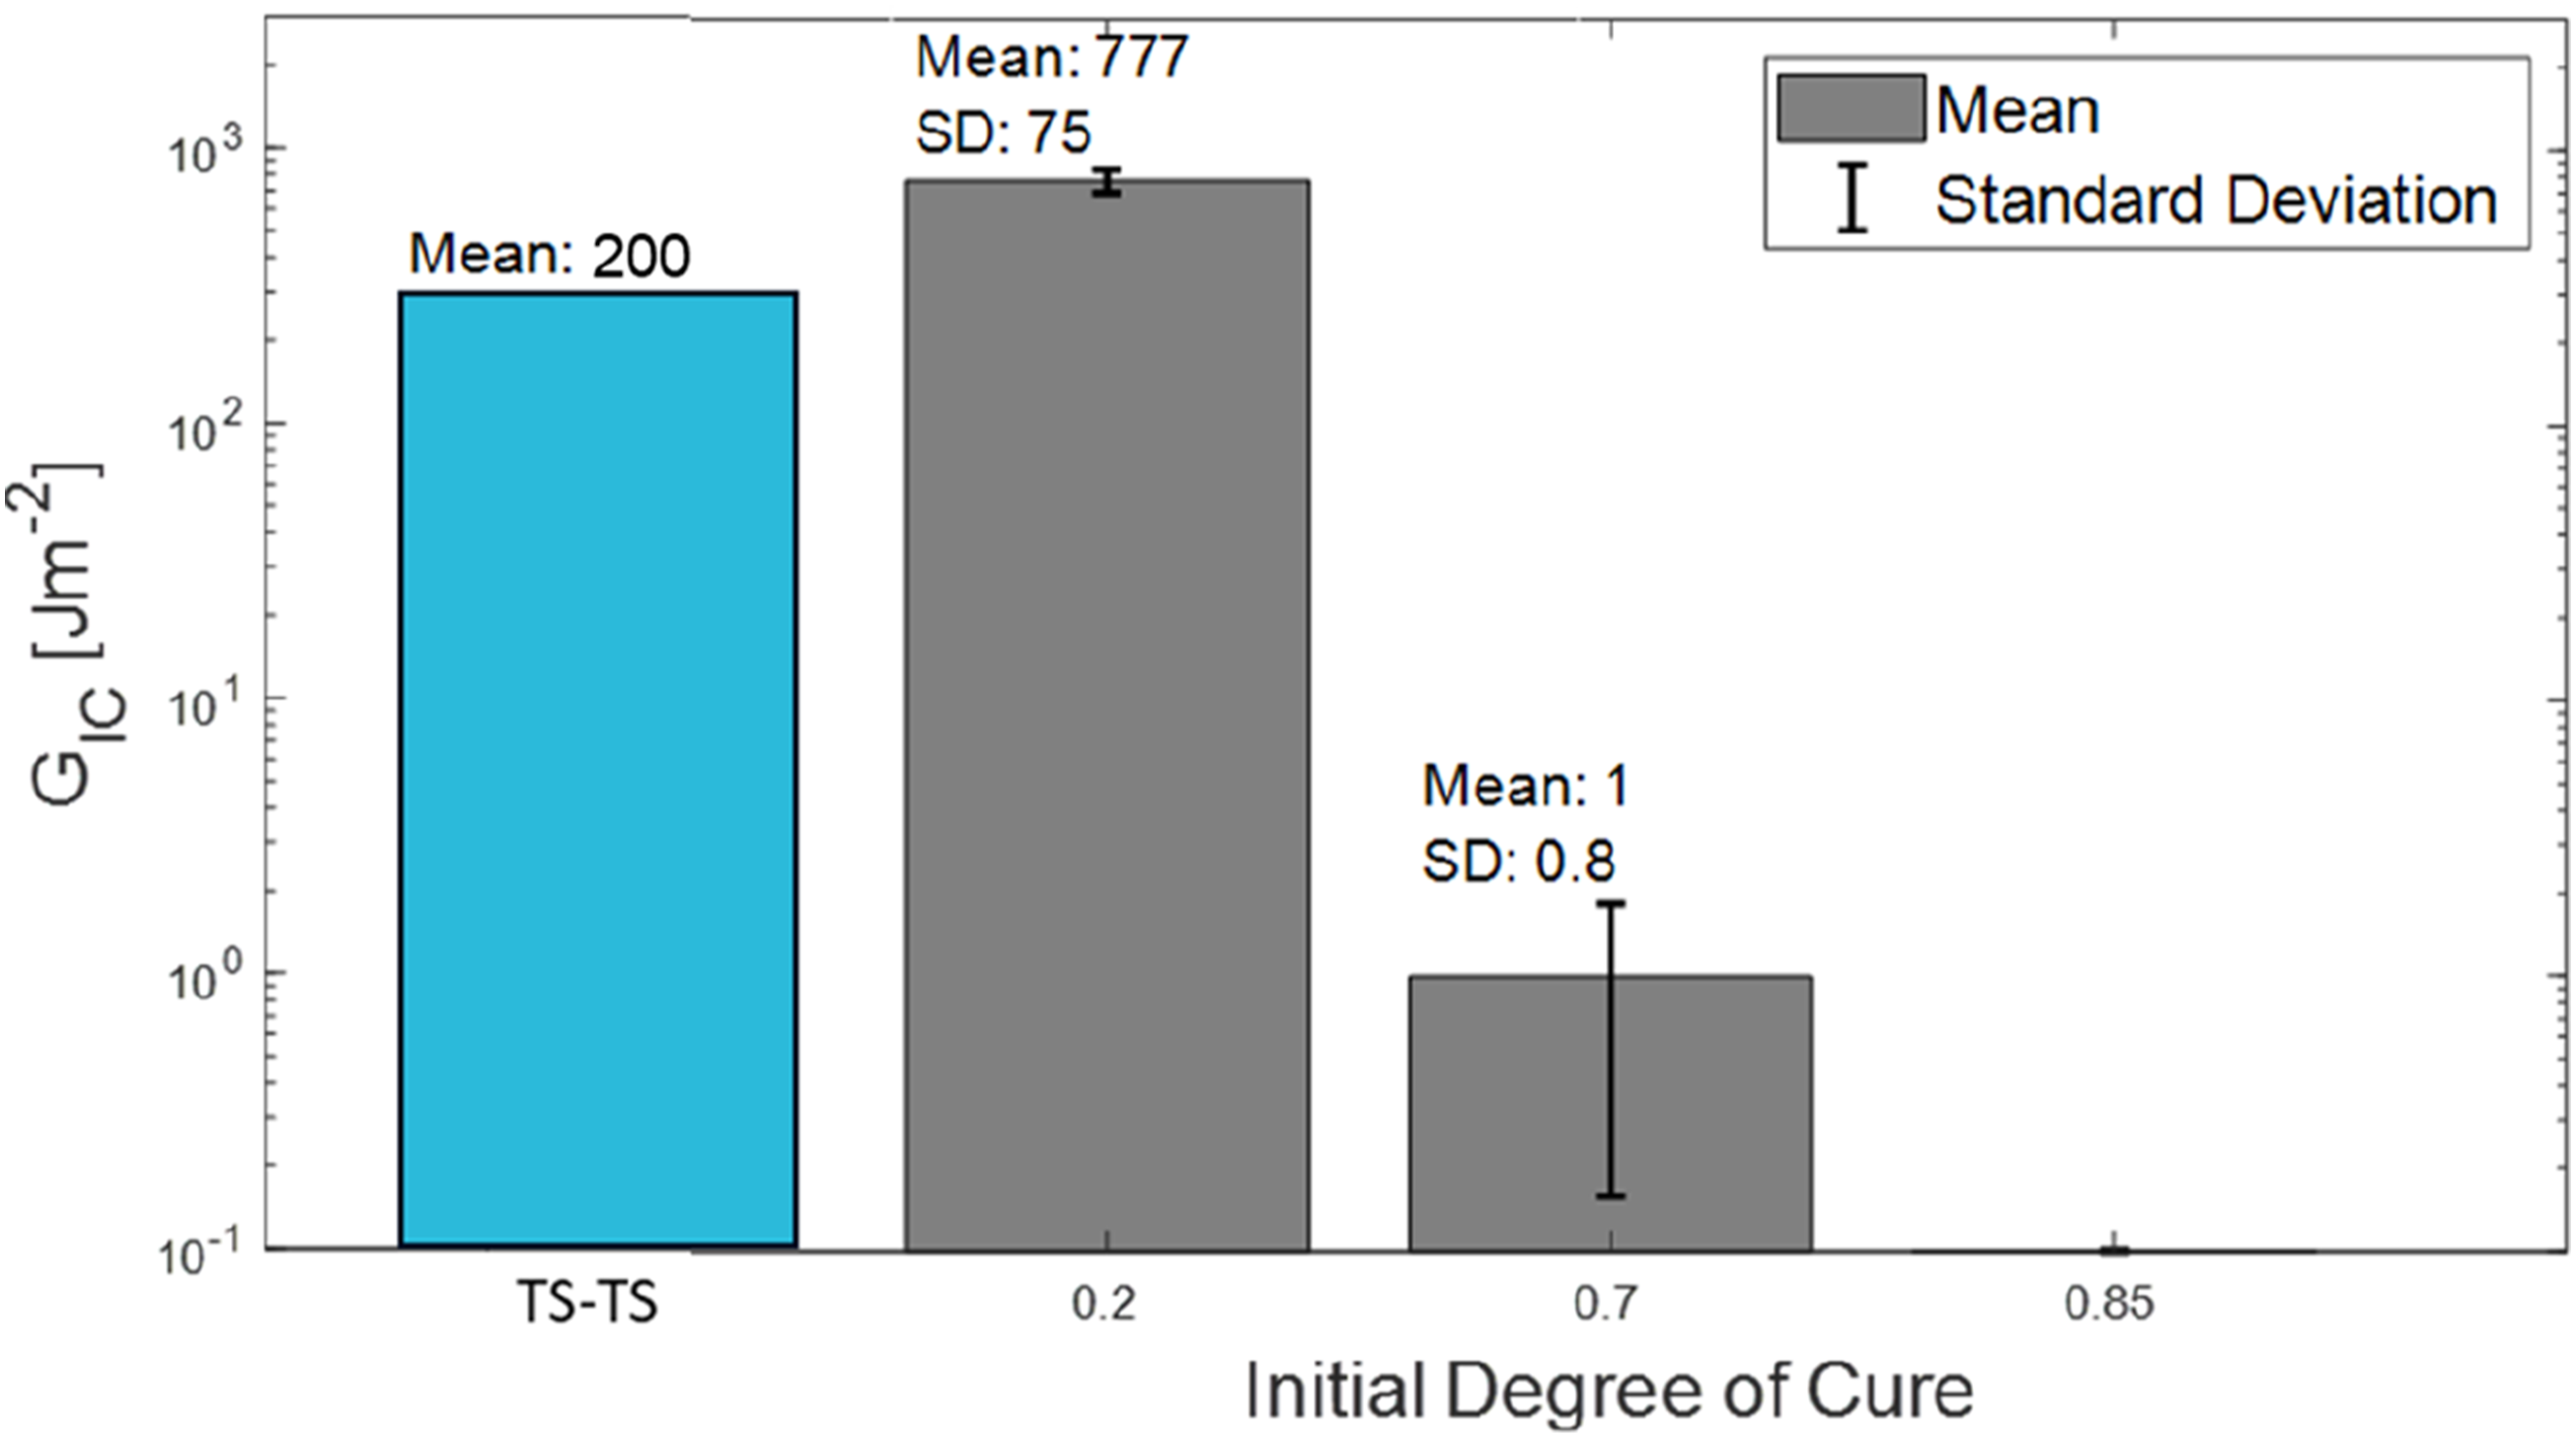
Thermoset-thermoset co-curing using the same epoxy system as in this study produced GIC values of around 200 Jm−2 (Figure 13), 28 considerably lower than demonstrated by the IC20 specimens. This result indicated the benefit of the gel layer morphology formed with the IC20 specimens compared to a pure thermoset interface.
The difference in the mean GIC values was approaching three orders of magnitude between IC20 and IC70, compared to a factor of two between the mean gel layer thicknesses. This result suggested that the level of adhesion is not solely dependent on gel layer thickness. The difference in the level of surface contact was influential. Additional factors such morphology changes as observed in the literature 11 and fibre bridging across the interphase could also have had an effect. 22
The significant drop in GIC between the two initial degrees of cure was consistent with a diminishing gel layer with an increasing initial degree of cure. 11 Whereas the gel layer produces toughness-enhancing morphologies, the liquid layer that remains offers limited resistance to crack propagation. 11 The differences in the interphase micrographs supported this theory. The adhesion in the IC85 sample was sufficient to hold the two plates together, so the level of adhesion was minimal but non-zero, signified by the bar in Figure 13.
Figure 14 shows the mean values of the load-displacement results for the two initial degrees of cure tested. The error bars represent one standard deviation. To reflect that repeats failed after different displacements, the plots are divided, with means and standard deviation at a given displacement only applicable to the repeats that reached that displacement. The plots illustrate the difference in the nature of the interfacial failure. While IC20 specimens withstood peak loads exceeding 130 N, IC70 specimens had peak loads just above 9 N. The error bars clearly show the greater variability of the results for the IC70 specimens, indicating the reduced reliability of the bond as the initial degree of cure was increased. Mean load-displacement results and standard deviations from double cantilever beams test of IC20 (a) and IC70 (b) specimens.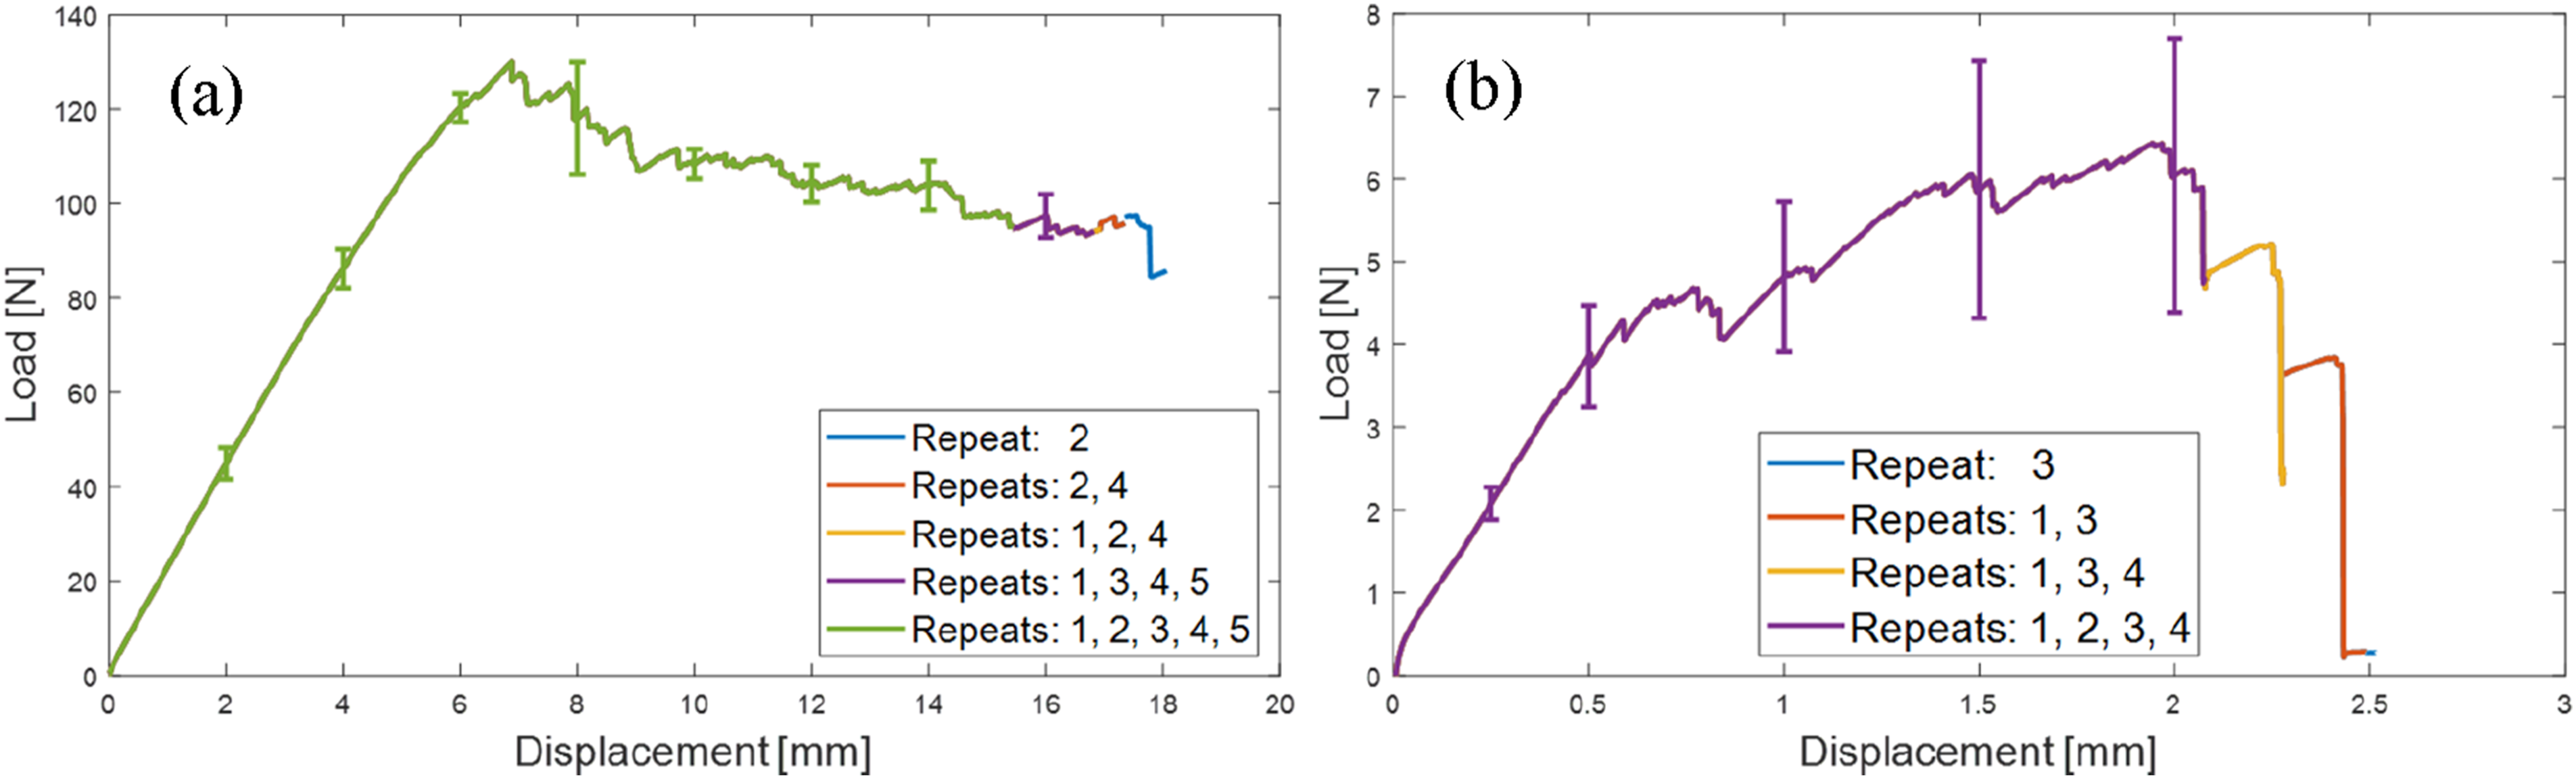
In the case of IC70 specimens, an apparent inability to form an interphase near the crack initiator, evidenced by the gradual climb to peak load, resulting in no more than 2.5 mm of crack propagation before catastrophic failure. This contrasted with IC20 specimens where the peak load occurred at the onset of crack propagation and at least 15 mm of stable propagation was possible in each case. Although not subjected to DCB testing, the ability of the IC85 sample to hold together meant the adhesion was at least equal to the weight of one plate, roughly 0.8 N.
A factor that could have had a serious effect on GIC in the precured samples was the apparent intermittency of the interphase. This took two forms. There were regions of no surface contact (Figure 15(a)) and there were regions where despite surface contact, no interphase was observed (Figure 15(b)). As shown in Figure 15(a), the pre-cured interphase contained a significant amount of what appeared to be voids, measured as being 20% of the combined interphase lengths. IC70 interface with a void (a) and no visible interphase formation (b).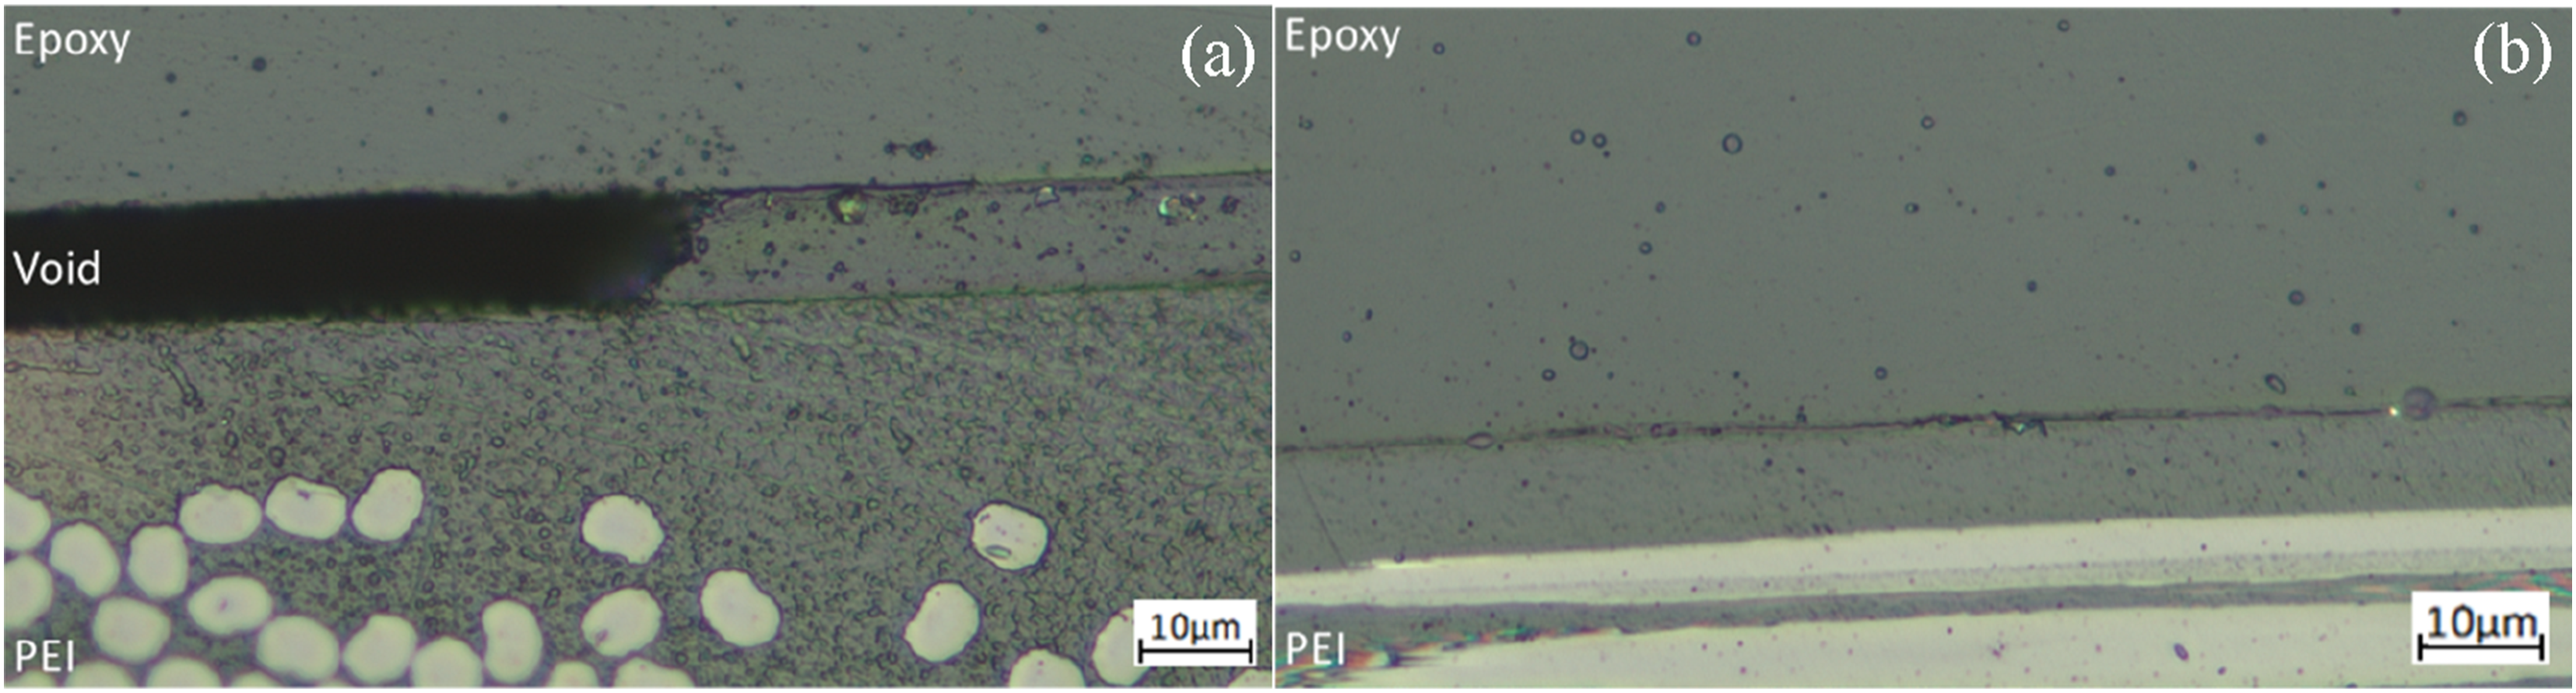
The significant absence of intimate contact was only present in IC70 specimens, making it a probable cause for the low resistance to crack propagation and short propagation distances measured during the DCB tests. This intermittency of the interphase was likely a consequence of the different manufacturing processes, the greater viscosity of the near gel epoxy resin being unable to produce the intimate contact possible during the direct infusion.
Optical micrographs of cross-sections from failed IC20 DCB specimens (such as Figure 16) indicated that crack propagation tended to divert into the epoxy laminate. This characteristic was attributed to the lower resistance of the epoxy system to crack propagation due to inferior toughness compared to PEI. Despite this, the mechanical performance advantage of the PEI-EP2410 bond over EP2410-EP2410 bonds was made clear by the significant improvement in GIC,
28
regardless of the increased initial degree of cure of the IC20 specimens. An optical micrograph of cracking in a failed IC20 Double Cantilever Beam specimen.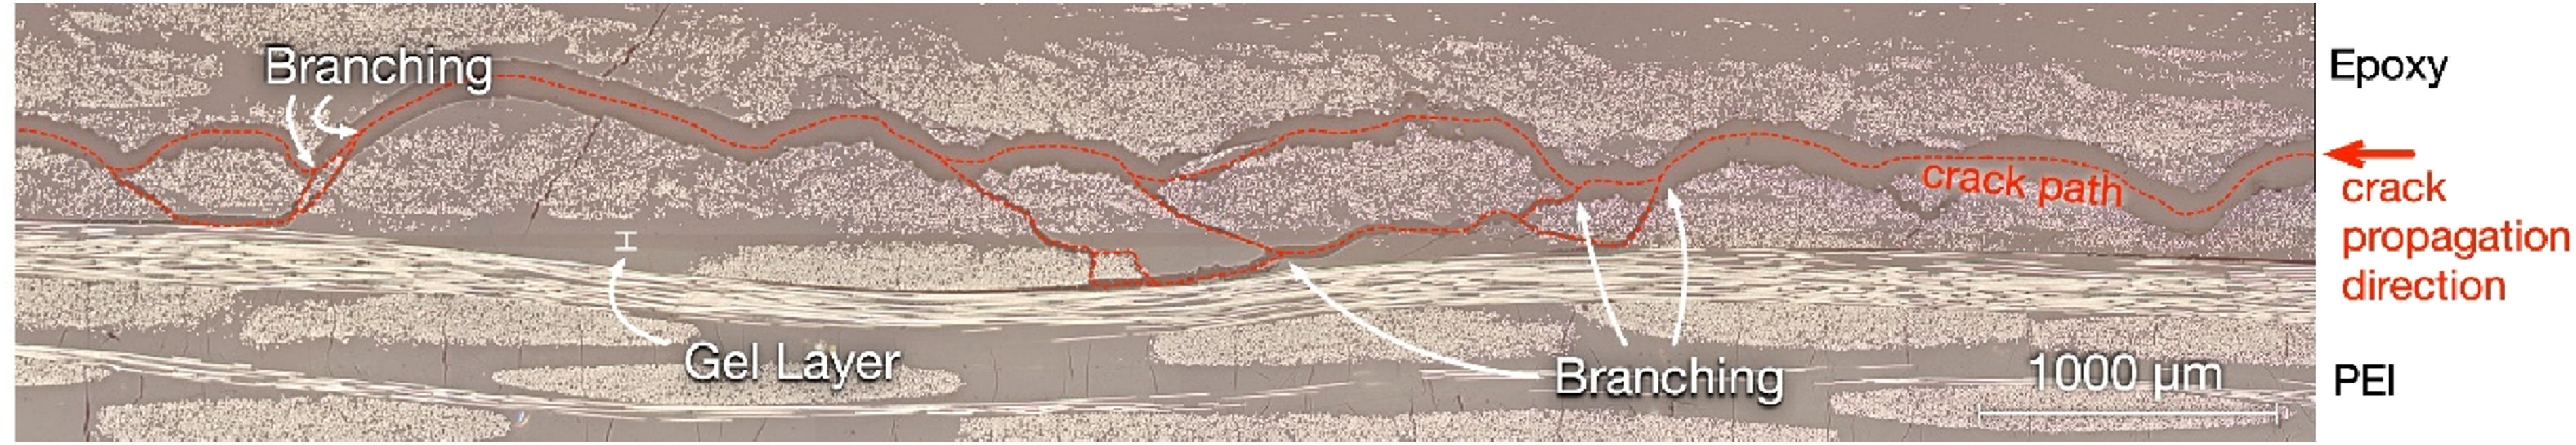
Model predictions
Using the measurements from Microscopy, the diffusion model was adapted for EP2410. To approximate D ∞ for EP2410 a value was selected such that the predicted gel layer thickness at 180°C, starting from a degree of cure of 0.2, matched the mean of the IC20 experimental measurements. This value was 8 × 108 μm2s−1. Using this D∞, the model was used to predict the change in gel layer thickness as the initial degree of cure increased.
At a given temperature, phase separation is driven by the reduction in miscibility as the degree of cure advances.22,33 The quantity used to quantify miscibility, Gibbs free energy of mixing, is a function of temperature. Therefore, providing the two materials were initially miscible, the onset of phase separation should be independent of the cure history. Hence, it was assumed that the onset of phase separation was unaffected by the initial degree of cure. Figure 17 shows the results alongside the measured thickness and GIC values. Gel layer thickness versus initial degree of cure at 180°C, predicted (assuming diffusion terminates at 0.76 DOC) and measured, and corresponding measured Mode 1 fracture toughness.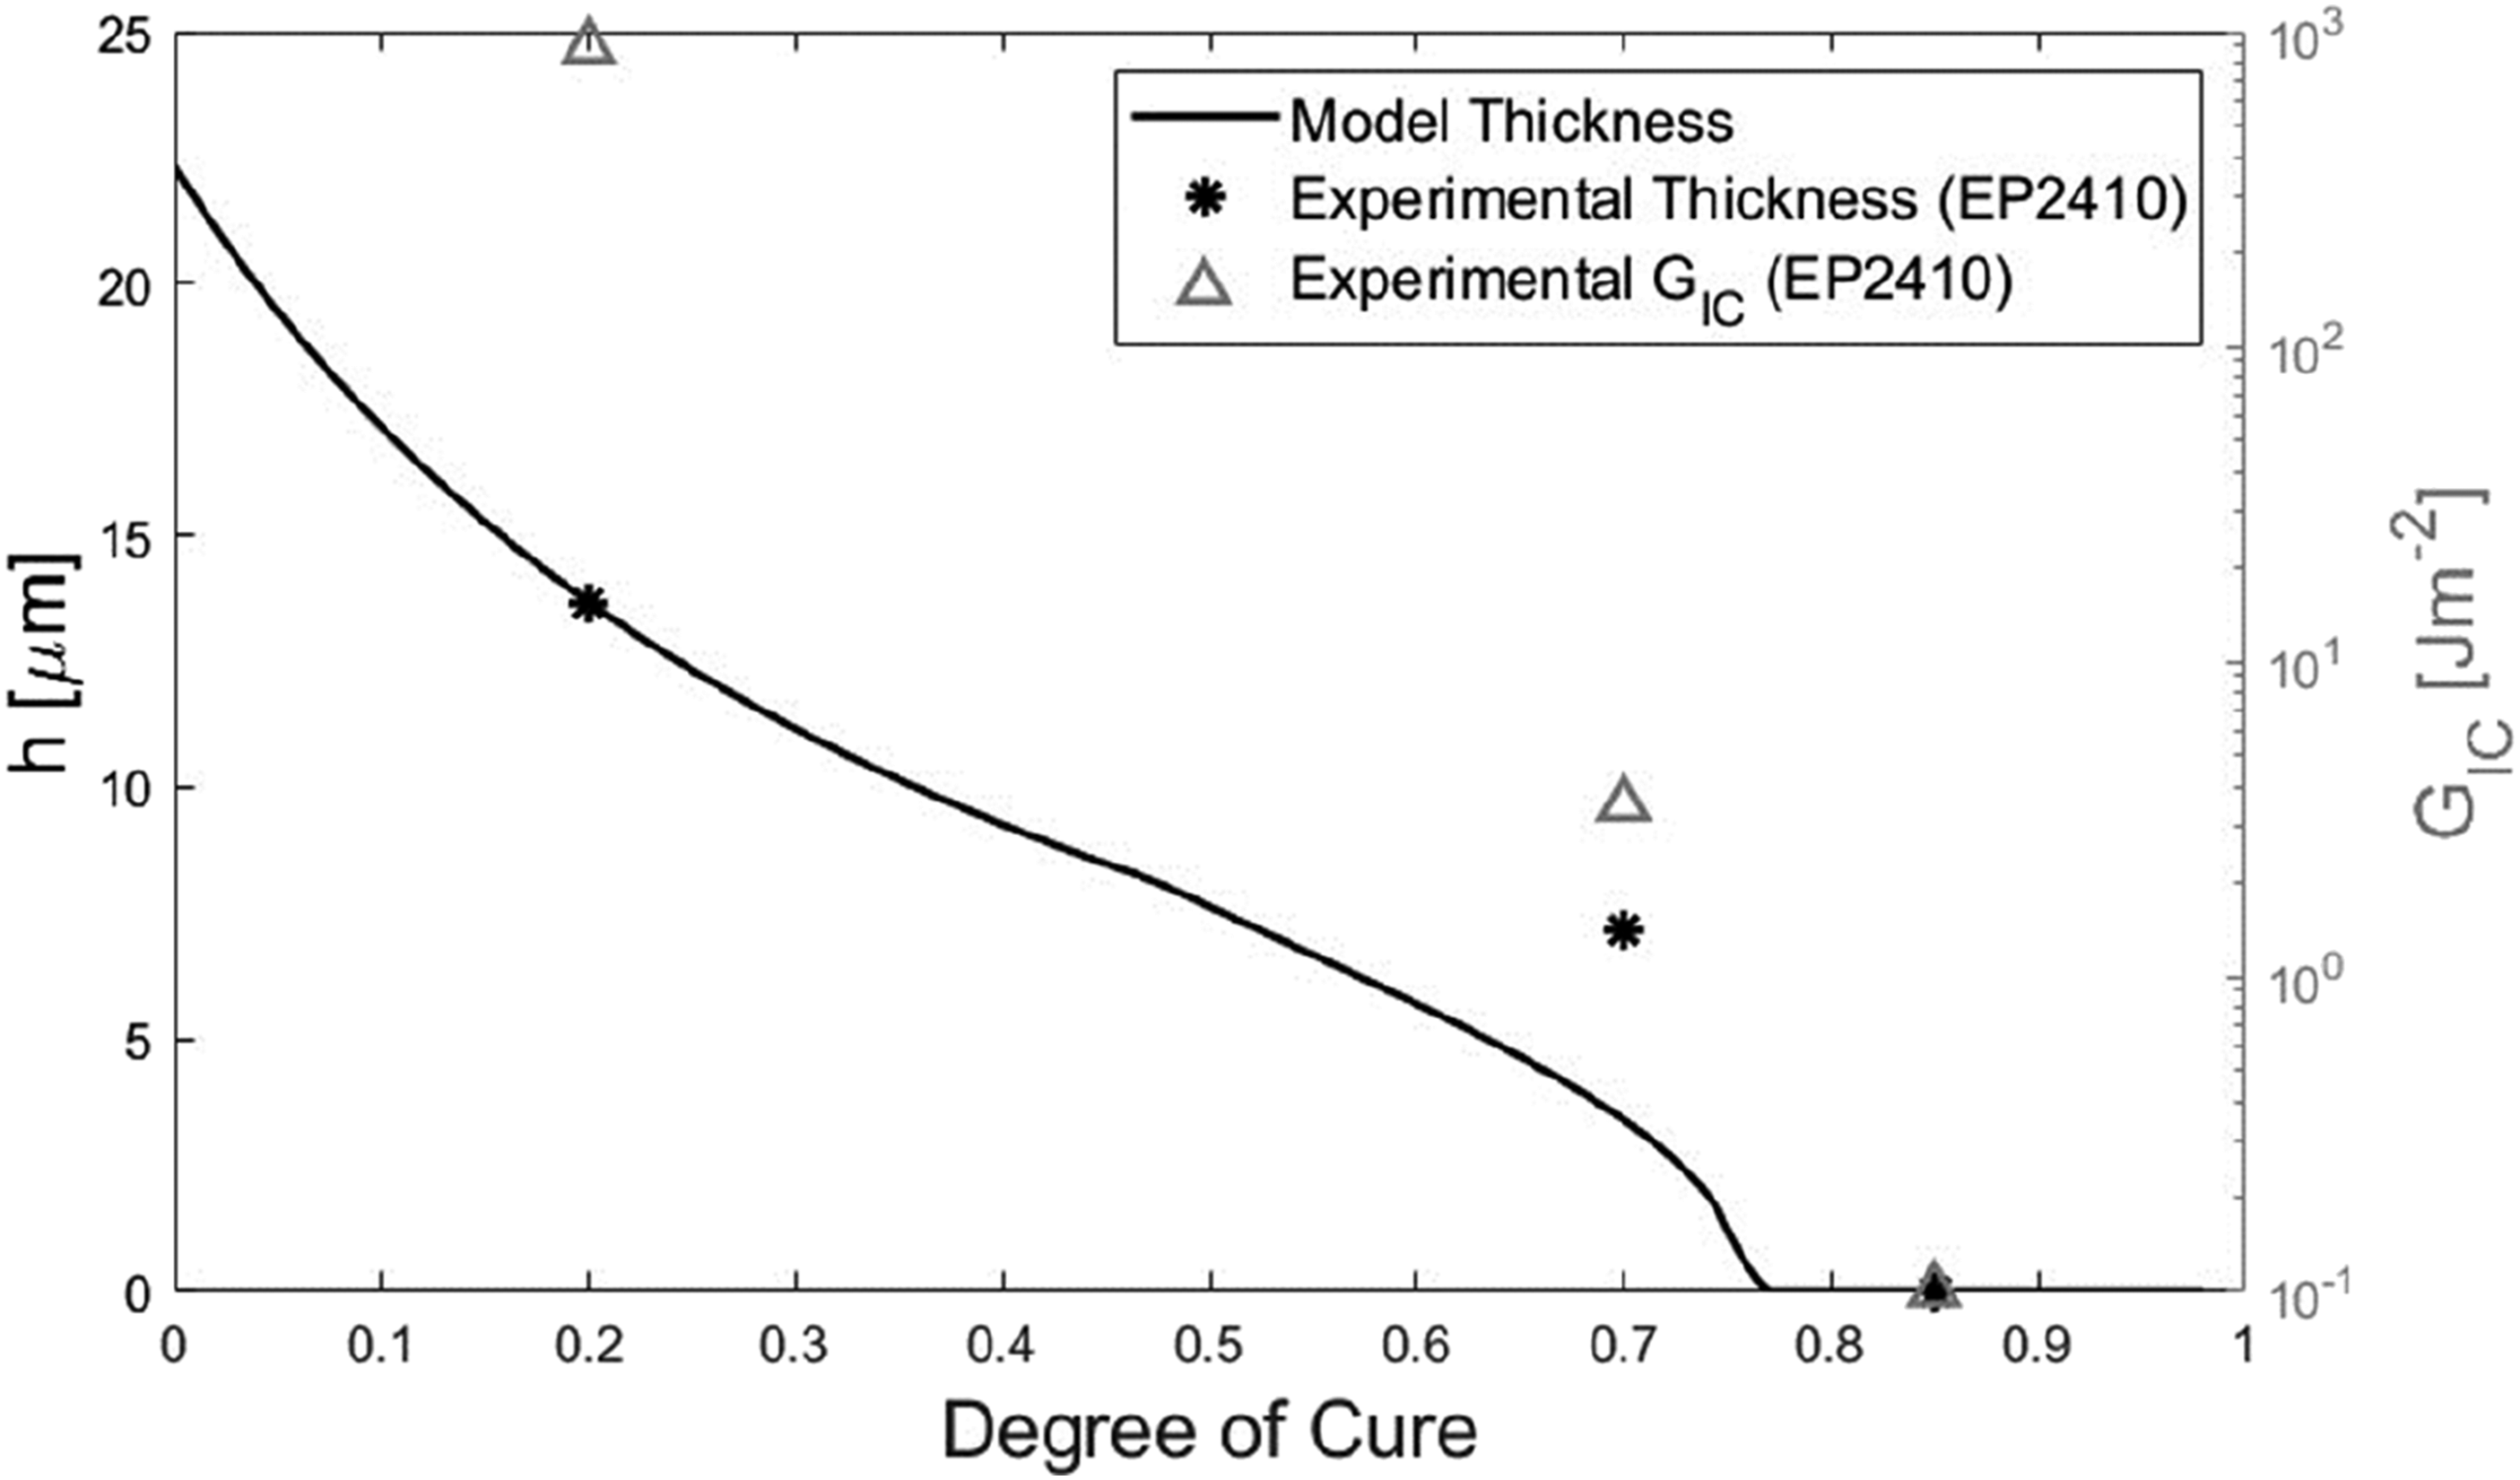
Until initial degrees of cure approaching gelation, the model predicted a near-linear decline in gel layer thickness, reaching zero at the predicted onset of gelation. Under the assumption interphase formation stopped at gelation, the model underpredicted the gel layer thickness for IC70 specimens. The model predicted a thickness of 3.39 μm, compared to the mean measurement of 7.16 μm.
The underprediction by the model appeared to be partially due to the influence of the step function before the specified terminating degree of cure. From Figure 17, the step function started to influence the results at around 0.45 degrees of cure. This is attributed to the assumption in the model that diffusion rate is inversely proportional to h, hence as the initial degree of cure increases the step functions terminate diffusion at higher rates of diffusion. Up to this point, the trajectory of the model appeared set to give a good prediction of the 0.7 initial degrees of cure thickness measurement. This point is illustrated in Figure 18 where the terminating degree of cure was increased to 0.85. The result was the model prediction for the 0.7 initial degree of cure increased to 5.49 μm, closer to the mean measurement of 7.16 μm. Gel layer thickness versus initial degree of cure at 180°C, predicted (assuming diffusion terminates at 0.85 DOC) and measured, and corresponding measured Mode 1 fracture toughness.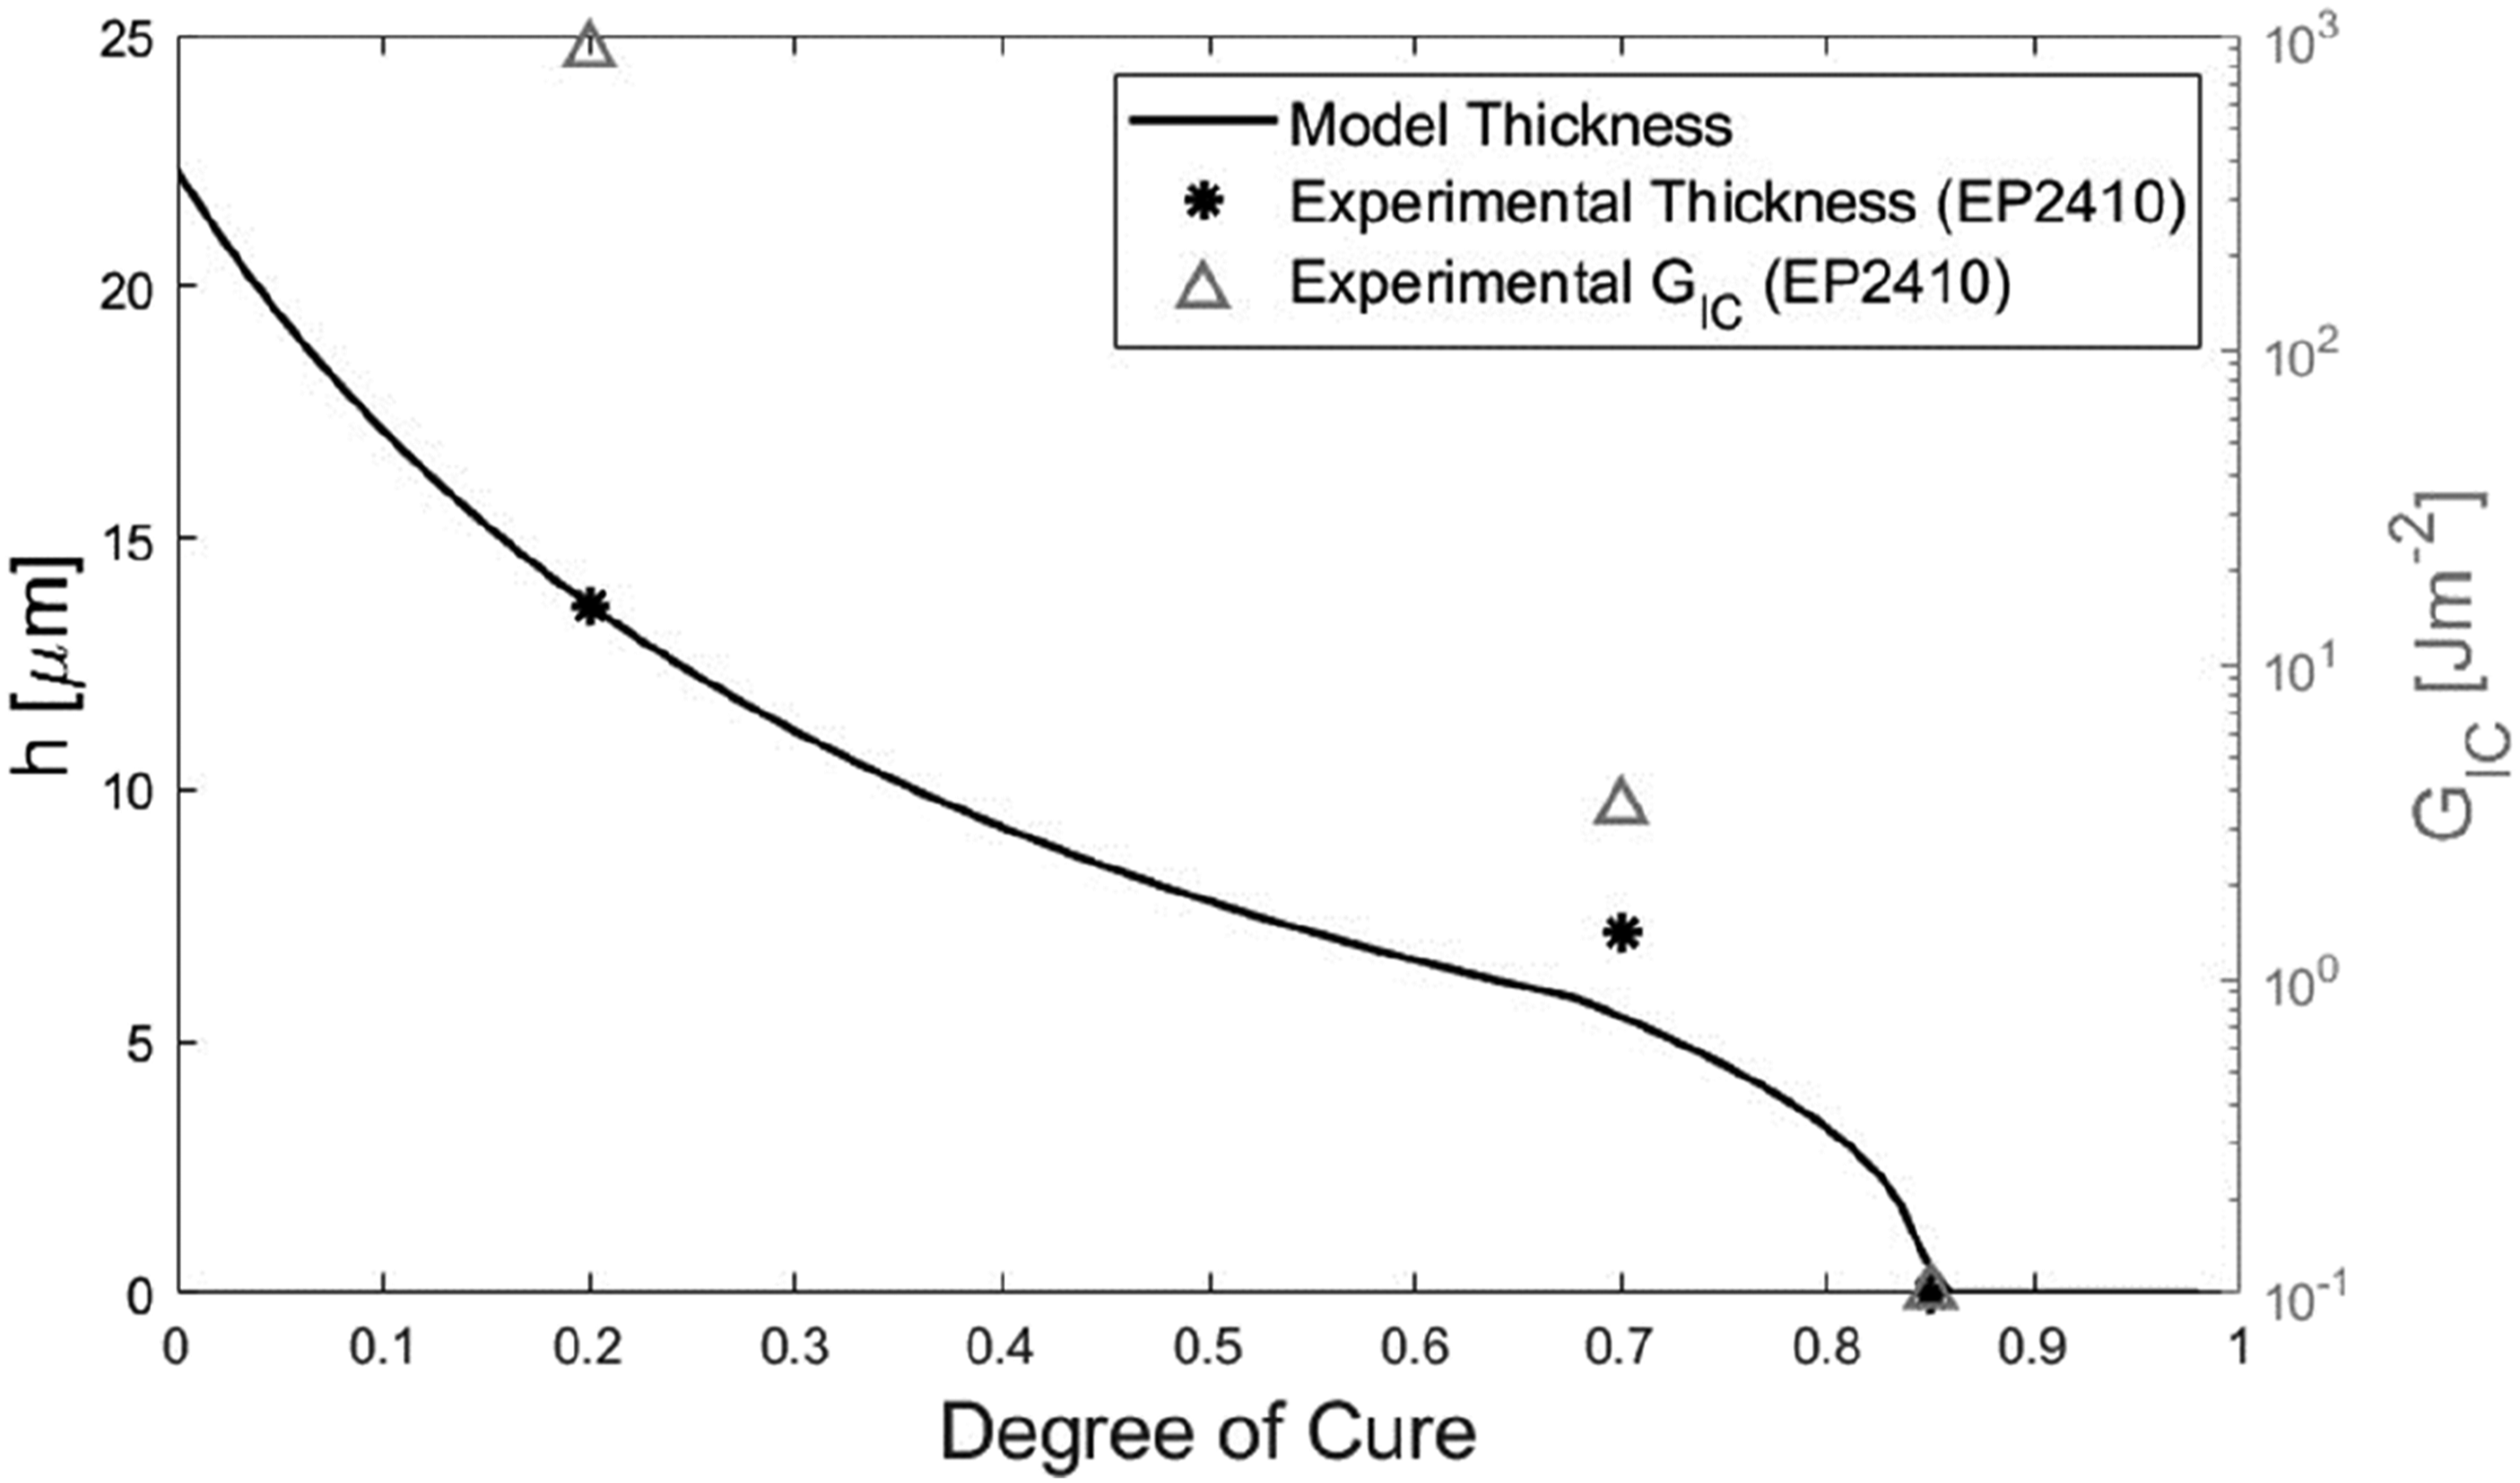
The underpredictions of the model could be explained by the literature. The assumption of the model is consistent with the observation from Lestriez et al 11 that no interdiffusion occurred between thermoplastics and thermosets joined beyond the onset of phase separation. However, Farooq et al observed interdiffusion beyond phase separation when the process was started from an uncured state, due to fractionation effects. 25 This suggests that although interdiffusion will not occur when initiated at degrees of cure beyond phase separation when started from a lower degree of cure, interdiffusion will proceed beyond the onset of phase separation predicted for the bulk resin. 25 Consequently, the hard cutoff imposed by the step function led to an underprediction of diffusion depth. It is noted that Farooq et al 25 did not test for this effect under isothermal conditions.
This interpretation of the data suggests that like with classical co-curing, there is a threshold initial degree of cure, believed to be the gel point, beyond which no interaction occurs between the adherends. However, in contrast, the level of interaction below this threshold appears to be sensitive to the initial degree of cure, as shown in Figure 17. These findings suggest that with thermoplastic-thermosets, the benefits of semi-curing are less clear than in the classical case of thermoset-thermoset bonding explored by Motsch-Eichmann et al. 27 The DCB results indicated that unlike in the classical case, the level of adhesion diminishes significantly with increasing initial degree of cure before gelation. Furthermore, performing the infusion of the thermoset laminate with the thermoplastic laminate in contact produced better surface contact, likely contributing to greater adhesion. Given most structural applications prioritise specific mechanical performance, any improvement in handleability must be balanced given the changes in this context.
Conclusion
In this work, the co-curing of semi-cured epoxy/CF (TS) to PEI/CF (TP) laminates was investigated to determine the effect of the initial degree of cure on the bond quality. Samples with three key degrees of cure 0.20 (below gel point), 0.70 (close to gel point) and 0.85 (above gel point) were manufactured and joined.
The increase in the initial degree of cure reduces mode I fracture toughness (GIC) by three orders of magnitude when gel layer thickness has only halved. Thus, the DCB tests and micrographs indicate gel layer thickness is not a linear indicator of interphase adhesion quality. The findings here confirm observations in the literature of other factors such as intimate contact and interphase morphology influencing the adhesion quality.
The difference in processing between 0.70 and 0.20 samples indicates that a liquid infusion-based joining (IC20) and curing could be a more favourable route for hybrid structures than pre-infused panels (IC70). The infusion route possibly leads to intimate surface contact and encourages the formation of interphase.
A simplified model for gel layer thickness was derived from diffusion data with a model epoxy system. The interpretation of the results indicates adhesion in TS-TP co-curing is more sensitive to the initial degree of cure than to TS-TS, indicating greater sensitivity of the bond performance to process variability. Based on the results, a higher semi-cure will reduce bond performance, increase variability and decrease performance predictability. However, the results indicate an increased fracture toughness of the TS-TP interface compared to its equivalent TS-TS interface at a lower initial degree of cure. The greater mechanical performance in these states thus makes hybrid structures an attractive option. The model in the current work would benefit from a systematic study of the effect of laminate features such as epoxy functionality, fibres, plasticisers and curing agents. Such an understanding would enable a more informed design process for hybrid structures.
The findings of this study have potential implications for the design of hybrid structures with epoxy and PEI particularly from the mechanical performance at the laminate level. Further, the study also sheds light on the design of these structures through the choice of processing method and prediction of interphase formation.
Supplemental Material
Supplemental Material - Effect of pre-curing on thermoplastic-thermoset interphases
Supplemental Material for Effect of pre-curing on thermoplastic-thermoset interphases by Adam Fisher, Arjun Radhakrishnan, Arthur Levy, Julie Teuwen, James Kratz in Journal of Composite Materials
Footnotes
Acknowledgments
The authors wish to thank Dr Robin Hartley of the University of Bristol for assistance with experimental work and access to data analysis software, Charlie Brewster of the University of Bristol for chemistry expertise and assistance with sample etching, Thibaut Nique for the diffusion experiments with the model system at Delft University of Technology, and Michael O’Leary at the University of Bristol for insight and use of data regarding Solvay EP2410.
Declaration of conflicting interests
The author(s) declared no potential conflicts of interest with respect to the research, authorship, and/or publication of this article.
Funding
The author(s) disclosed receipt of the following financial support for the research, authorship, and/or publication of this article: This work was supported by the EPSRC Future Composites Manufacturing Research Hub under Grant EP/P006701/1.
Data availability statement
All data supporting the conclusions are presented in the results section.
Supplemental Material
Supplemental material for this article is available online.
References
Supplementary Material
Please find the following supplemental material available below.
For Open Access articles published under a Creative Commons License, all supplemental material carries the same license as the article it is associated with.
For non-Open Access articles published, all supplemental material carries a non-exclusive license, and permission requests for re-use of supplemental material or any part of supplemental material shall be sent directly to the copyright owner as specified in the copyright notice associated with the article.