
Abstract
Strain energy release rate calculations for various cases of delaminations emanating from matrix cracks are developed and used to predict the onset of delaminations and their growth size as a function of applied tension and shear loads in composite laminates. The method determines the matrix crack spacing, the delamination onset load, the delamination size at onset and, through the use of a newly proposed delamination resistance curve, the size of delaminations as they grow under load. The method can be applied to any symmetric laminate. Comparisons to test results in the literature for a variety of layups and materials shows very good agreement with the exception of cases where significant edge delaminations appear before delaminations caused by matrix cracks.
Introduction
In broad terms, there are three major types of damage in composites: Broken fibers, matrix cracks and delaminations. The discussion in this work focuses on the interaction of delaminations with matrix cracks. It is well-known1–3 that, often, delaminations start at the tips of matrix cracks parallel to the fibers. In a ply with matrix cracks, the load is transferred to adjacent plies around these cracks and interlaminar stresses develop. These may cause delaminations at the interface between the cracked ply and its neighbours. The presence of matrix cracks and delaminations reduces the stiffness properties of the laminate and may contribute to pre-mature failure.4,5
Various methods to analytically predict the creation of matrix cracks have been proposed over the years: Continuum mechanics methods, [for example Ref. 6,7], shear lag analyses, [for example Ref. 8,9], and variational approaches.10,11 Talreja 6 derived constitutive relations describing the behaviour of a laminate with different damage modes present, which can be used to describe damage evolution under static or fatigue loads. Varna et al 7 focused on laminates containing 90° plies and proposed an approach to predict matrix cracks and their effect on stiffness of such laminates. Kashtalyan and Soutis, 8 combined matrix cracks in angle-ply laminates with delaminations. Nairn, 9 examined the use of shear lag methods for analysing unidirectional laminates. Hashin,10,11 was among the first to use a variational approach to determine stresses in cracked laminates and their effect on stiffness of cross-ply laminates. In addition to the above, Socci and Kassapoglou 5 solved the governing equations to determine matrix crack creation and multiplication for laminates under tension and shear loads.
Delaminations in laminates under in-plane loads, typically form at free edges because of mismatch in stiffness properties of the plies12,13 or at tips of matrix cracks. Of particular interest here are the latter where the interlaminar stresses that develop at the tips of matrix cracks may exceed the strength of the material in the resin layer between plies and lead to delaminations. Nairn and Hu 14 used a variational approach to obtain expressions for the strain energy release rate expressions to predict the critical crack spacing for delamination onset for a class of laminates containing 90° plies. A similar approach was proposed by Lem and Lui 15 where they compared the energy released when cracks or delaminations form. A three-dimensional finite element analysis was used by Salpekar and O’Brien 16 to study the formation of triangular delaminations at matrix crack tips. Takeda and Ogihara, 3 obtained expressions for the onset and growth of delaminations at matrix crack tips and compared to test results. Finally, Carraro et al, 2 developed expressions for the stresses around the matrix crack tips using generalized stress intensity factors and proposed a fracture criterion using a critical value of the mode I Generalized Stress Intensity Factor.
The complexity of the stress field at matrix crack tips and around delaminations emanating from these crack tips makes the development of analytical methods difficult and, often, limited to a class of laminates and/or applied loading situations. Also, localized defects such as voids or matrix rich regions accelerate or delay the creation of cracks and delamination. Furthermore, measuring the crack density exactly poses problems because of the difficulty of pin-pointing the exact applied load at which new cracks form. Finally, as has been observed by several researchers,17,18 the symmetry of delamination creation assumed in many models breaks down sometimes as some delaminations forming in one ply interface stop growing and/or jump to other ply interfaces.
The present communication builds on previous work and proposes a fracture mechanics-based approach to analytically predict the onset and growth of delaminations emanating from matrix crack tips for symmetric composite laminates under tension or shear loads.
Approach
Matrix crack formation
The starting point is a laminate in some of the plies of which matrix cracks developed under some type of loading, see Figure 1. The layup can be arbitrary as long as it is symmetric, and the loading can be any combination of in-plane tension and shear. Subsequent loading may either increase the density of these cracks or/and lead to the creation of delaminations. In order to model the delamination onset at tips of matrix cracks, it is critical that the crack density in the cracked plies be correctly predicted. Otherwise, the stiffness changes caused by the presence of these cracks is not correctly accounted for. Here, the approach developed by Socci and Kassapoglou
5
is used. For convenience, the important equations from that work are briefly repeated here. Symmetric laminate with ply with matrix cracks under in-plane loading.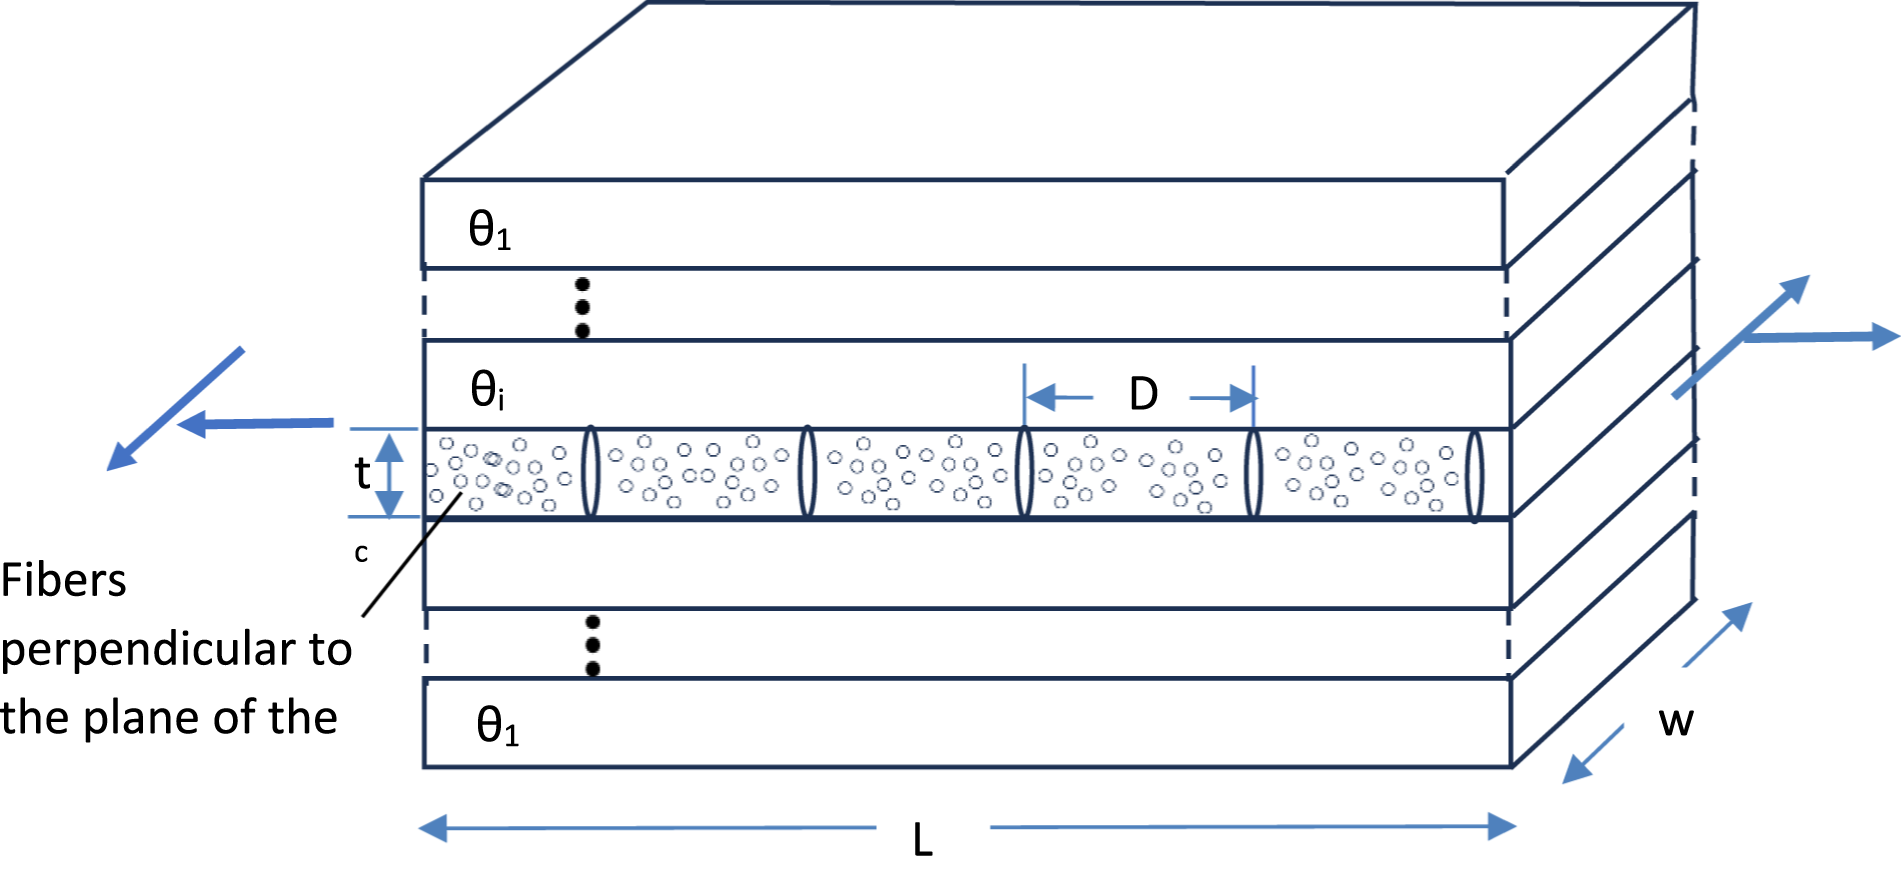
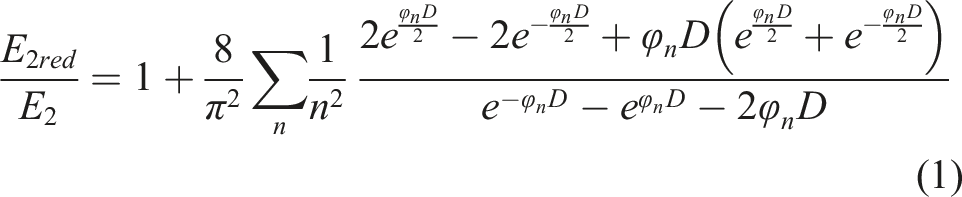
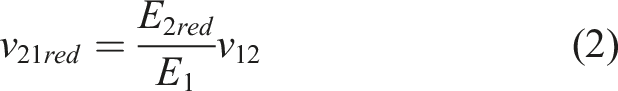
Given a ply with matrix cracks with spacing D as shown in Figure 1, the reduced transverse Young’s modulus (perpendicular to the fibers) in the cracked ply is given by:
5
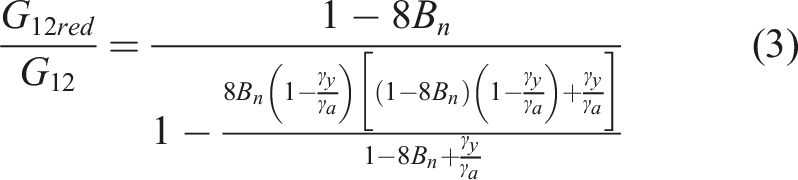
If the ply is, locally, under shear and, accounting for non-linearity of the shear stress-strain curve of the material, the shear modulus of a cracked ply is given by:
5
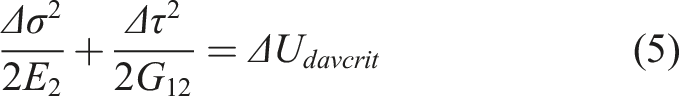
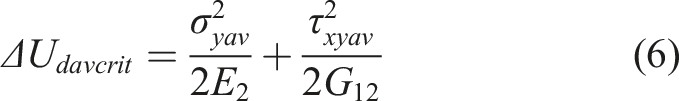
The load at which matrix cracks will multiply is found using a criterion based on the average energy density between cracks.
5
For an arbitrary combination of transverse and shear strains applied locally to the ply, a new crack will appear half-way between existing cracks when:
As the above equations will form the starting point for the determination of delamination onset and growth it is important to establish confidence in them. This is done by comparing to published experimental results. The size of the crack spacing in 90° plies as a function of applied laminate stress for [0n/90m]s and [±25/90n]s laminates for different values of n and m and for different materials is compared to test results from2,19–22 in Figure 2. Comparison of predicted crack spacing to tests for various layups and materials. (a) UT-E500/Epikote RIMR235 fiberglass with tests from Ref. 2. (b) AS/3501-6 Carbon/Epoxy with tests from Refs.20,21. (c) AS4/3501-6 Carbon/Epoxy with tests from Refs.22,23. (d) IM6/Avimid K Carbon/Epoxy with tests from Refs.22,23.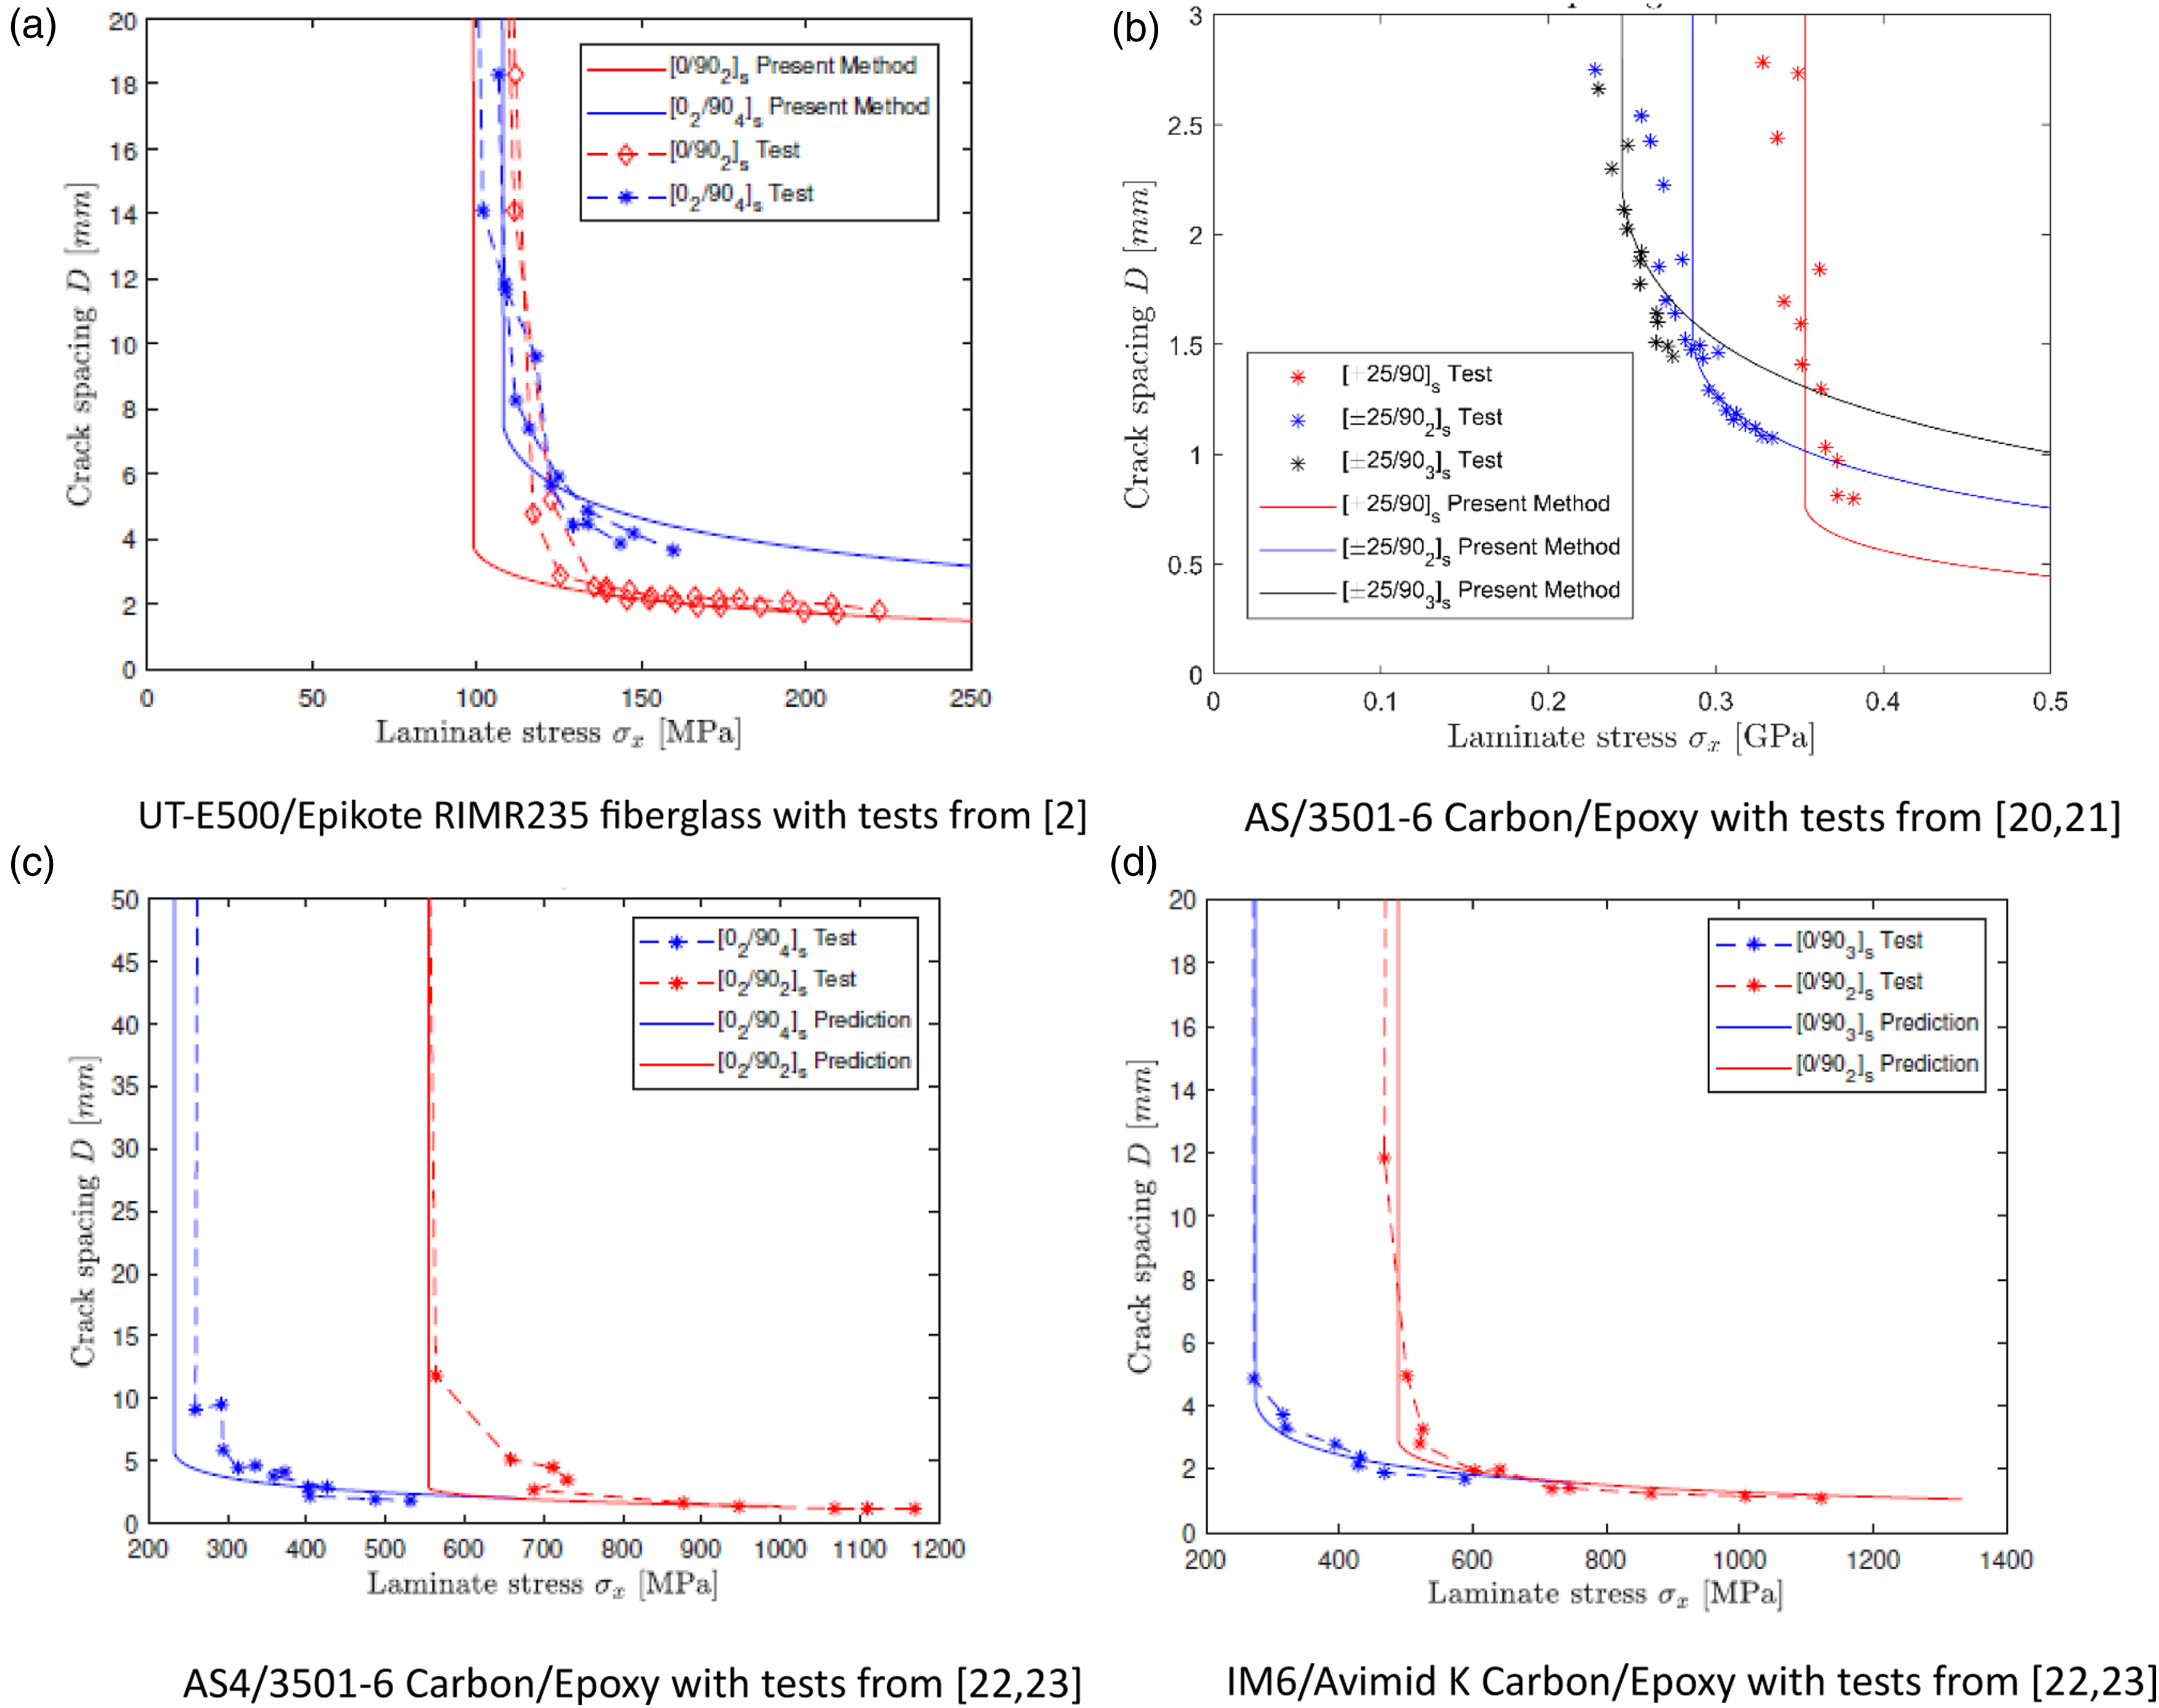
As is seen from Figure 2, the predictions are in good to excellent agreement with the test results. One interesting observation is that for the [0/902]s laminate in Figure 4(a) and for the four laminates in Figure 4(c) and (d), the curves and test data seem to asymptote to an horizontal line. This corresponds to crack saturation where further load increase does not cause the creation of any more matrix cracks. This would correspond to the point where delaminations may start at the tips of these cracks. The precise crack spacing at which this happens will be determined in the next section.
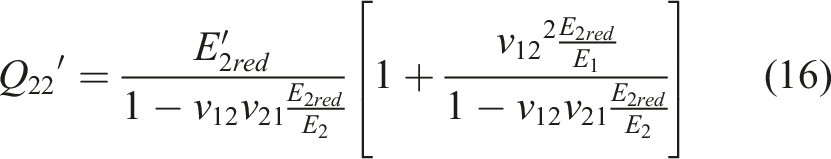
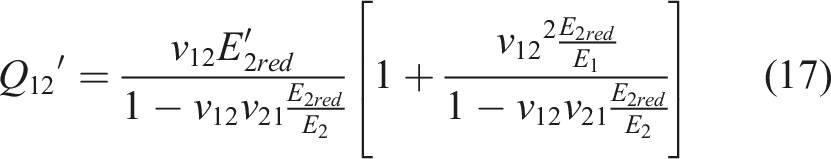
Delamination onset – delaminations emanating from matrix cracks
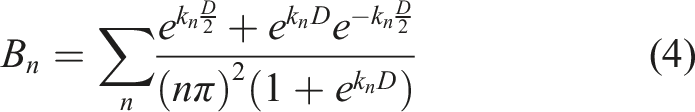
The results presented in the previous section establish enough confidence in the accuracy of the method in predicting matrix crack spacing as a function of applied load. This forms the starting point for determining when delaminations will start at the matrix crack tips. First, the strain energy release rate corresponding to a given distribution of matrix cracks is determined. The strain energy of the laminate under tension and shear shown in Figure 1 can be written as:
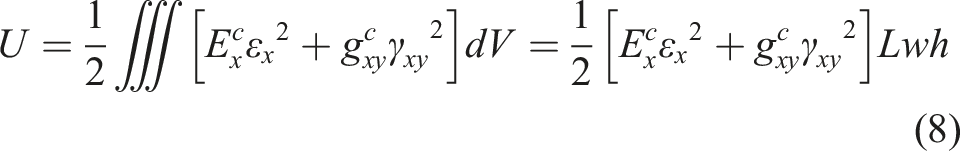
Then, the strain energy release rate for matrix cracking is given by:
In order to proceed, the dependence of E
x
c
and g
xy
c
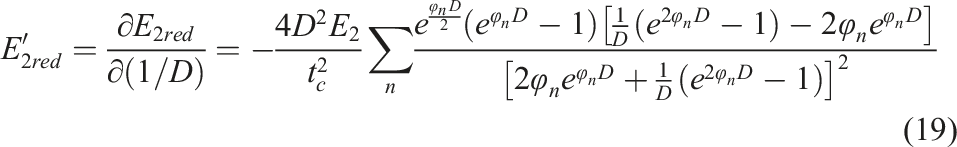
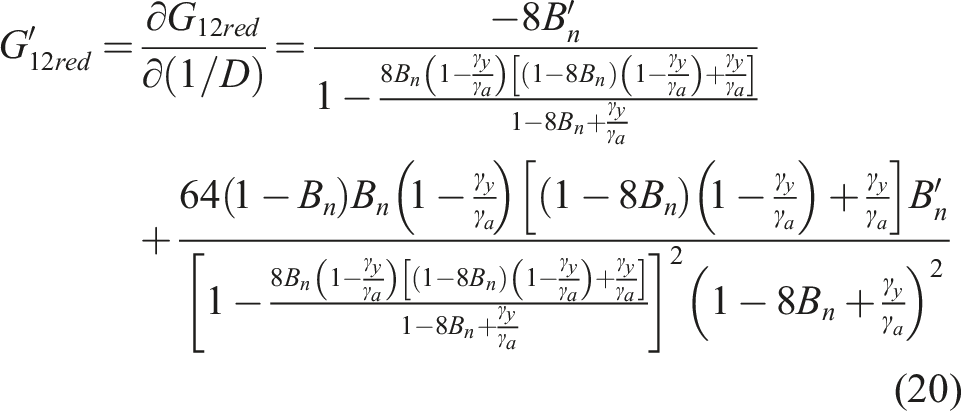
on 1/D (matrix crack density) must be determined. This follows the standard approach for determining the engineering constants of a symmetric laminate using the classical laminated-plate theory. In local coordinates, parallel and perpendicular to the fibers, the stiffness values for a cracked ply with matrix cracks are given by


In addition,
For a symmetric laminate, E
x
c
and g
xy
c
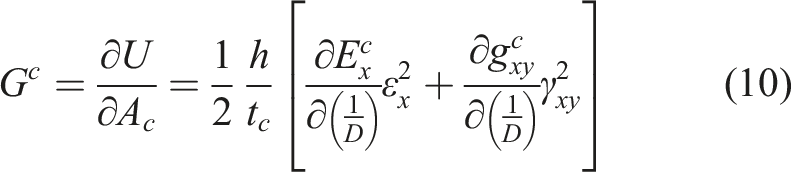
can be calculated using the A matrix. The results can then be differentiated with respect to 1/D with the use of equations (19) and (20) to get the strain energy release rate Gc for the laminate with cracked plies. An example of how the value of G
c
changes with crack spacing for different thickness of cracked plies in various laminates under tension is shown in Figure 3. Energy release rate dependence on matrix crack spacing for various layups. Applied strain = 0.05.
As the applied load increases from zero, the (average) crack spacing, which is large and non-uniform at the beginning, will decrease which means one moves from right to left in Figure 3. For low applied load and, hence, large values of D, the creation of an additional crack is not affected by existing cracks. There is no interaction and all cracks have the same size. The change in strain energy for a given constant crack size will be the same every time a new crack forms. As a result, the strain energy release rate will be essentially constant for large values of D. As the applied load increases and the crack spacing D decreases, a point is reached where crack spacing is uniform and a new crack would form at the mid-point between cracks. 5 This was shown in reference 5 to correspond to D = 2.966 t c . The amount of energy released when a crack forms increases and the energy release rate goes through a maximum. It should be noted that, other than the case θ = 90 o for the [0/θ2]s layups in Figure 3, all laminates have both tension and shear strains present in the ply with θ orientation. As the value of θ decreases from 90o the magnitude of the shear stress in the θ ply increases and that of the transverse tension stress decreases until θ = 45o. As was found in Ref. 5, a higher shear strain magnitude is needed to initiate a new crack than a tension strain. Consequently, as can be seen from Figure 3, laminates with shear stress dominant in the θ ply, are less prone to matrix crack creation and thus the strain energy release rate is lower. For θ < 45°, both the magnitudes of shear and transverse stress in the θ ply decrease leading to further reduction in the value of G c .
Using equation (10), the effect of various parameters on the strain energy release rate was found. The basic trends are as follows: (a) G
c
increases significantly when t
c
, the thickness of the cracked ply, increases, (b) Increasing t
c
shifts the G
c
versus D graph to the right, towards larger crack spacings, (c) Increasing E
1
/E
2
increases G
c
, (d) Gc increases by a small amount when t
1
, the thickness of the ply without cracks increases. (d) The point at which G
c
departs significantly from being constant depends only on t
c
. At this point, the onset of delamination from existing matrix cracks can be examined. A variety of possibilities, depending on the resulting pattern is examined and is shown in Figure 4. In all cases, the delaminations shown in blue color extend across the laminate width (perpendicular to the page in Figure 4). It is understood that in a real specimen, combinations of the above may appear as a result of local defects such as waviness, porosity and non-uniform matrix content. The cases selected here serve as an indicator of what to expect in reality and will provide a range of results. The approach is analogous to that used by O’Brien
13
for edge delaminations and makes use of equations (8) and (10) but now the effect of the delaminations on the laminate stiffness must be calculated. Focusing on Case 1 of Figure 4, the laminate can be divided in repeating units as shown in Figure 5. Possible configurations of delaminations emanating from matrix cracks. Repeating unit to obtain longitudinal stiffness of a laminate with cracks and delaminations (case I).
For simplicity in showing the equations and understanding how different variables contribute, the case of a cross-ply laminate will be assumed here but the results will be generalized to any symmetric laminate under tension and shear. Referring to Figure 5:
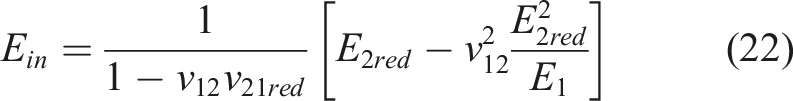
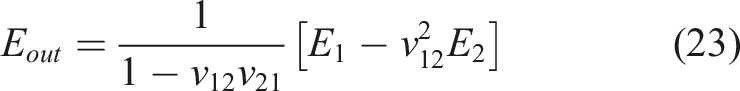
Strain compatibility of the three sub-laminates with the delaminations present leads to:
The stiffness of the three sub-laminates on the right of Figure 5 is that of a laminate with matrix cracks only, E
x
c
which was calculated before. Recognizing that the entire laminate consists of the pattern of Figure 5 repeating along the length of the laminate and that each repeating unit has the same applied axial force per unit width N
x
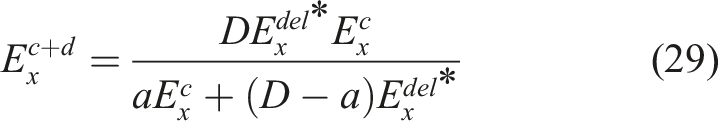
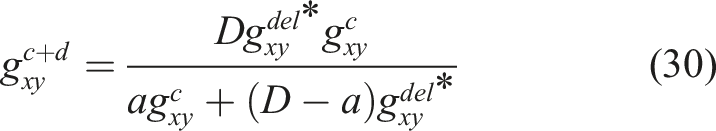
, the overall axial stiffness of the laminate is obtained treating the repeating units as springs in series:
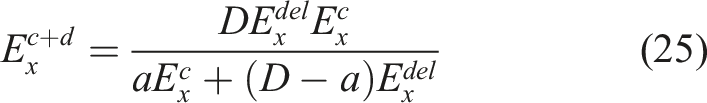
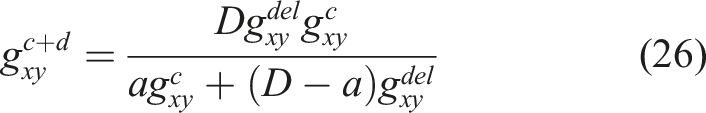
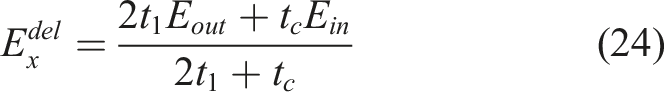
Case II can be shown to give exactly the same expressions for Exc+d and gxyc+d. For case III, the pattern to be analysed is shown in Figure 6. An analogous approach leads to the expressions: Repeating unit to obtain longitudinal stiffness of a laminate with cracks and delaminations (case III).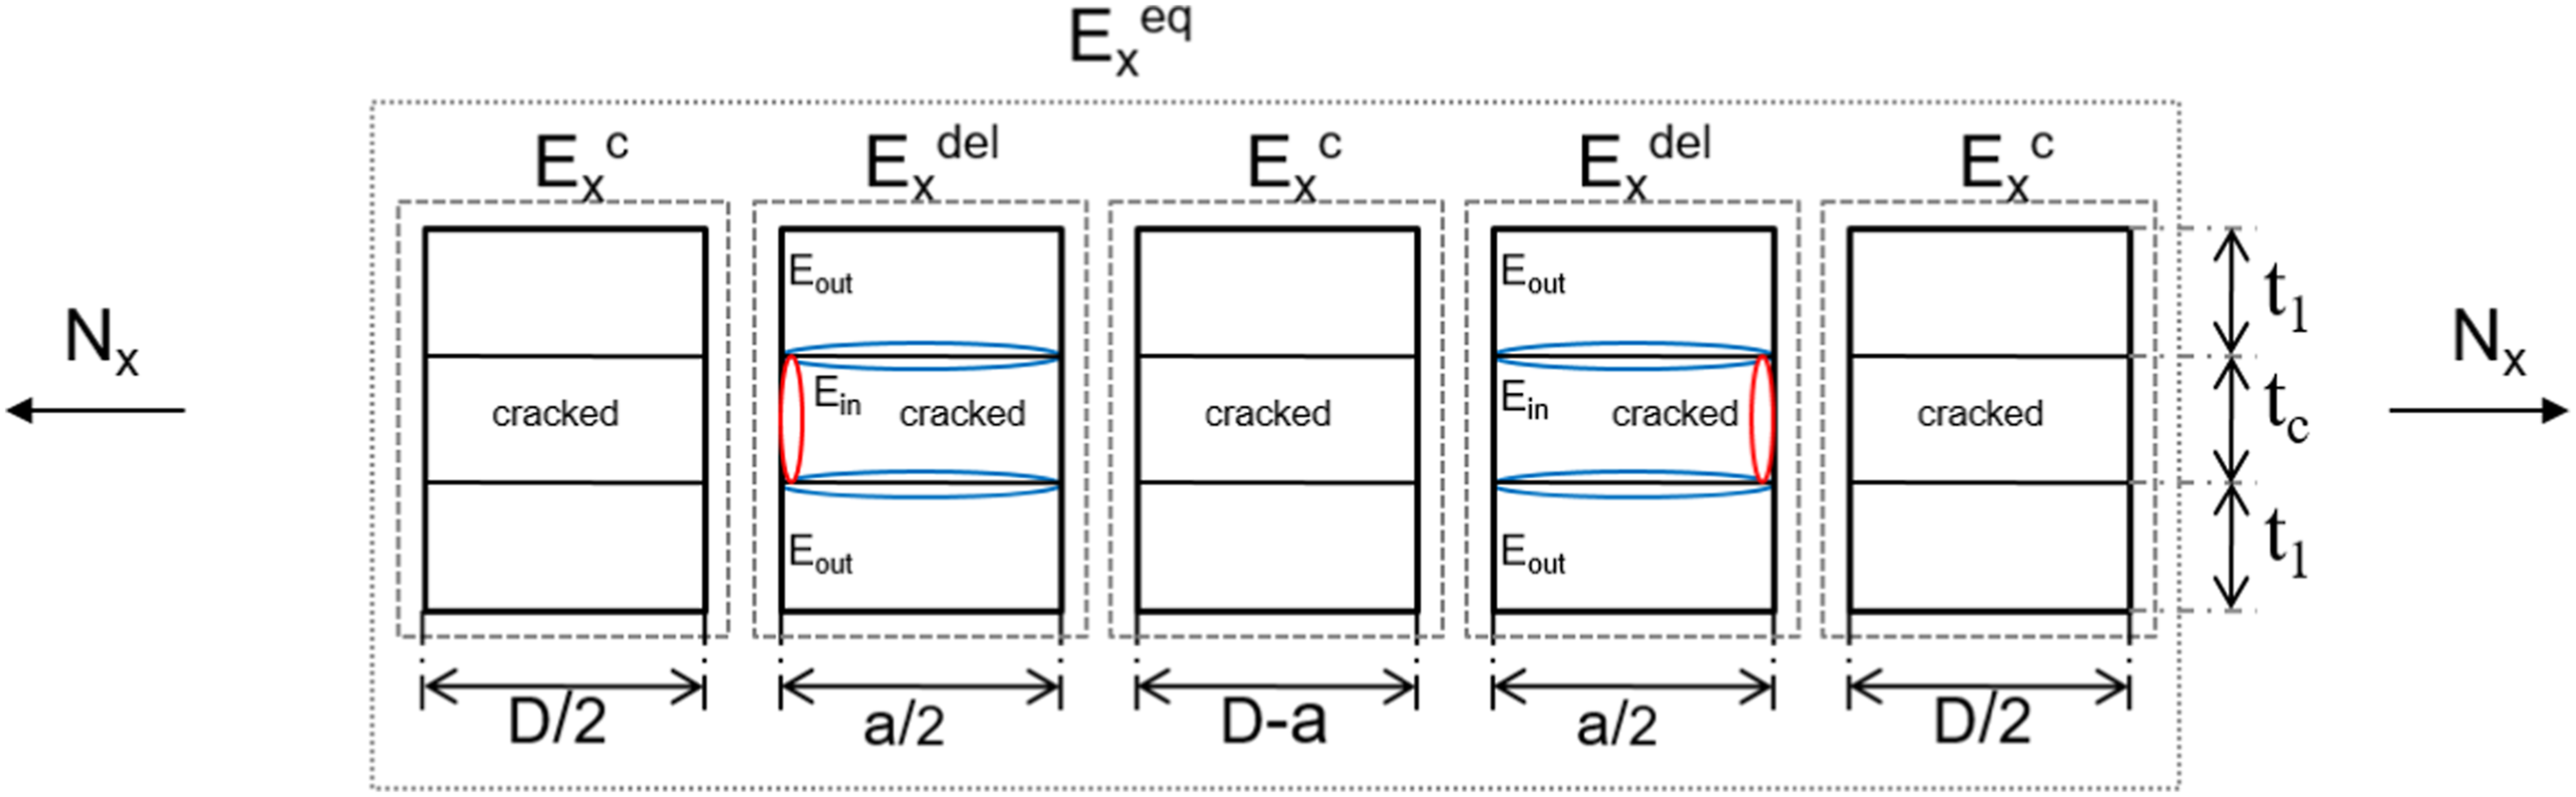
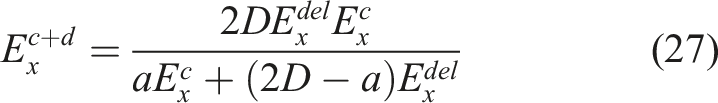
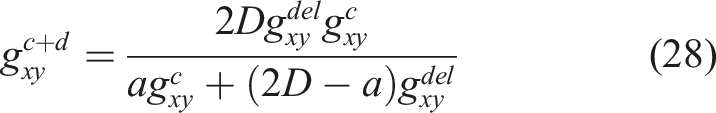
Finally, for case IV, the repeating unit is shown in Figure 7 and the resulting stiffness expressions are: Repeating unit to obtain longitudinal stiffness of a laminate with cracks and delaminations (case IV).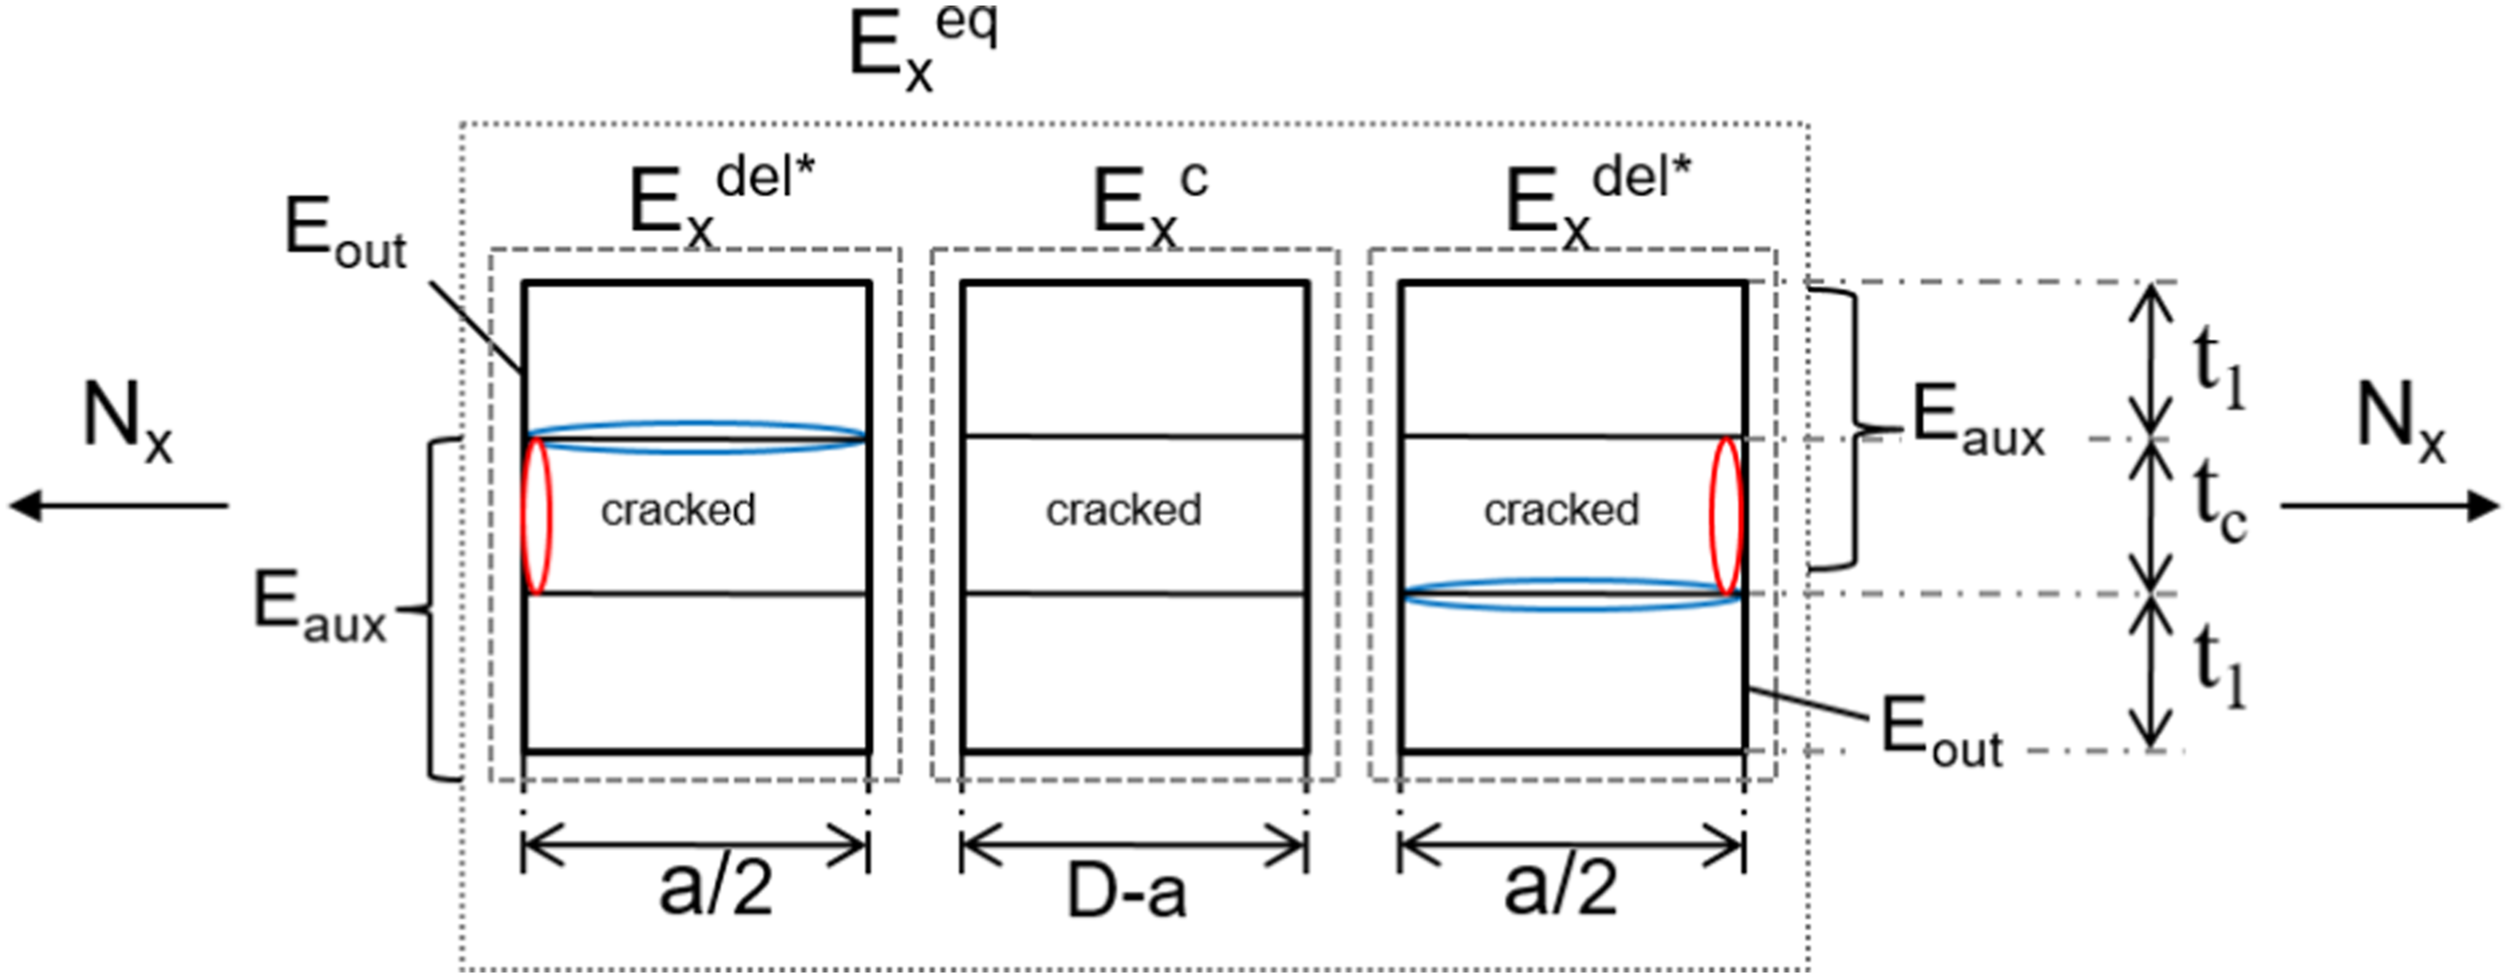
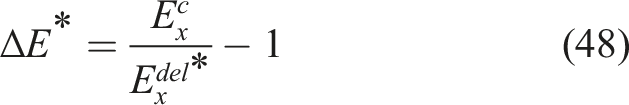
Note that the quantities with superscript “del*” refer to the right most laminate in Figure 7.
The basic stiffness values in equations (25)–(30) need only be calculated once for each stacking sequence as they will not change across cases. The approach just presented assumed only one cracked ply or block of contiguous plies. If failure analysis suggests that more than one plies will develop cracks, the same approach can be used provided that the repeating units and associated derivation include all cracked plies and resulting delaminations.
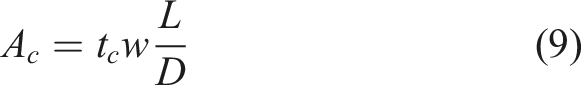
The strain energy release rate can now be calculated using an equation analogous to equation (10) with appropriate substitution for the stiffness values depending on the case. This energy release rate will describe energy released when the delaminations grow. It is assumed that, once the delaminations appear, further load increase will lead to delamination growth and not the creation of matrix cracks whose density has reached saturation. As a result, the crack area created is the area of the delaminations. This means that equation (9) now changes according to the case to:
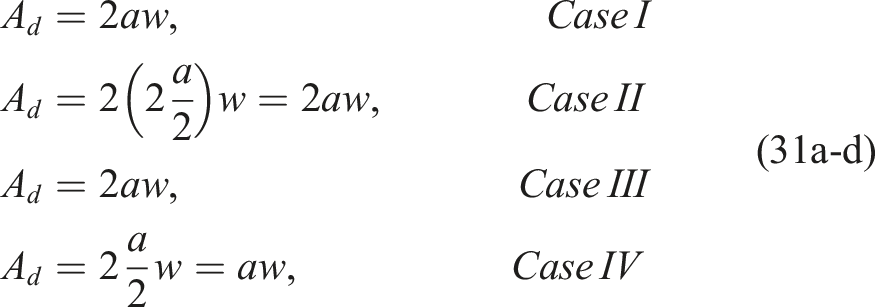
Differentiating the strain energy with respect to Ad leads to the following expressions for the strain energy release rate for each of the four cases:
It can be seen from equations (31a-d) that cases I and II give identical results. Case III has a bigger denominator in the brackets indicating that, for the same values of a and D, the strain energy release rate will be smaller. Case IV is hard to anticipate its magnitude by inspection because of the quantities E
x
del*
and g
xy
del*
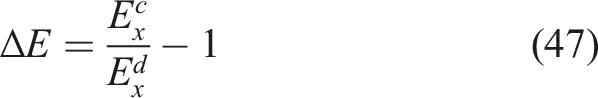
whose effect is hard to evaluate without explicit calculations. An approximation to the onset of delamination can be obtained by taking the limit of equations (32a-d) as the delamination size a tends to zero. The resulting expressions are:
A plot of equations (33a-d) as a function of crack spacing for a [0/902]s UT-E500/Epikote RIMR235 is shown in Figure 8. In addition to the four curves from equations (33a-d), the onset of edge delamination predicted by O’Brien’s method,
13
and given by equation (34) below, is also shown as a horizontal line since it is derived for nominally pristine laminate without matrix cracks. In equation (34), E
LAM
is the axial stiffness of the pristine laminate and E
*
is the sum of the stiffnesses of the three sub-laminates created by edge delaminations at the 0/90 interfaces. E
*
is analogous to E
x
d
for the case of delaminations emanating from matrix cracks in the limit the crack spacing D goes to infinity. Energy release rates for various cases as a function of crack spacing.
As can be seen from Figure 8, cases I and II give higher energy release rate values and would therefore be more likely to occur if there were no defects in the laminate promoting other cases. Case III gives significantly lower release rate values. Case IV is close to Cases I and II and could be favoured if there were inconsistencies in the laminate such as local waviness, porosity etc. It is also seen from Figure 8 that, for relatively small crack spacings, lower than 0.5 mm in Figure 8, Cases I through IV have G values higher than G for edge delamination in equation (34).
This means that for low values of D, the tendency would be for delaminations to start at the tips of matrix cracks. For higher D values, where there are relatively long portions of the laminate without any matrix cracks, the tendency would be to start edge delaminations in those regions.
At this point, the strain energy release rates for a laminate with matrix cracks only and a laminate with matrix cracks and delaminations can be combined to predict delamination onset. This is shown in Figure 9 for a cross-ply laminate. Starting from a laminate under load with matrix cracks, if the load is further increased, energy can be dissipated by forming a new crack or forming a delamination. The point of intersection of the two energy release rate curves in Figure 9 defines two regions of interest: To the left of the point of intersection, the energy release rate for creating a delamination is higher. This means for crack spacings lower than the D
onset
value corresponding to the intersection, (D
onset
∼ 0.8 mm in Figure 9), delaminations are the preferred way of energy dissipation. To the right of D
onset
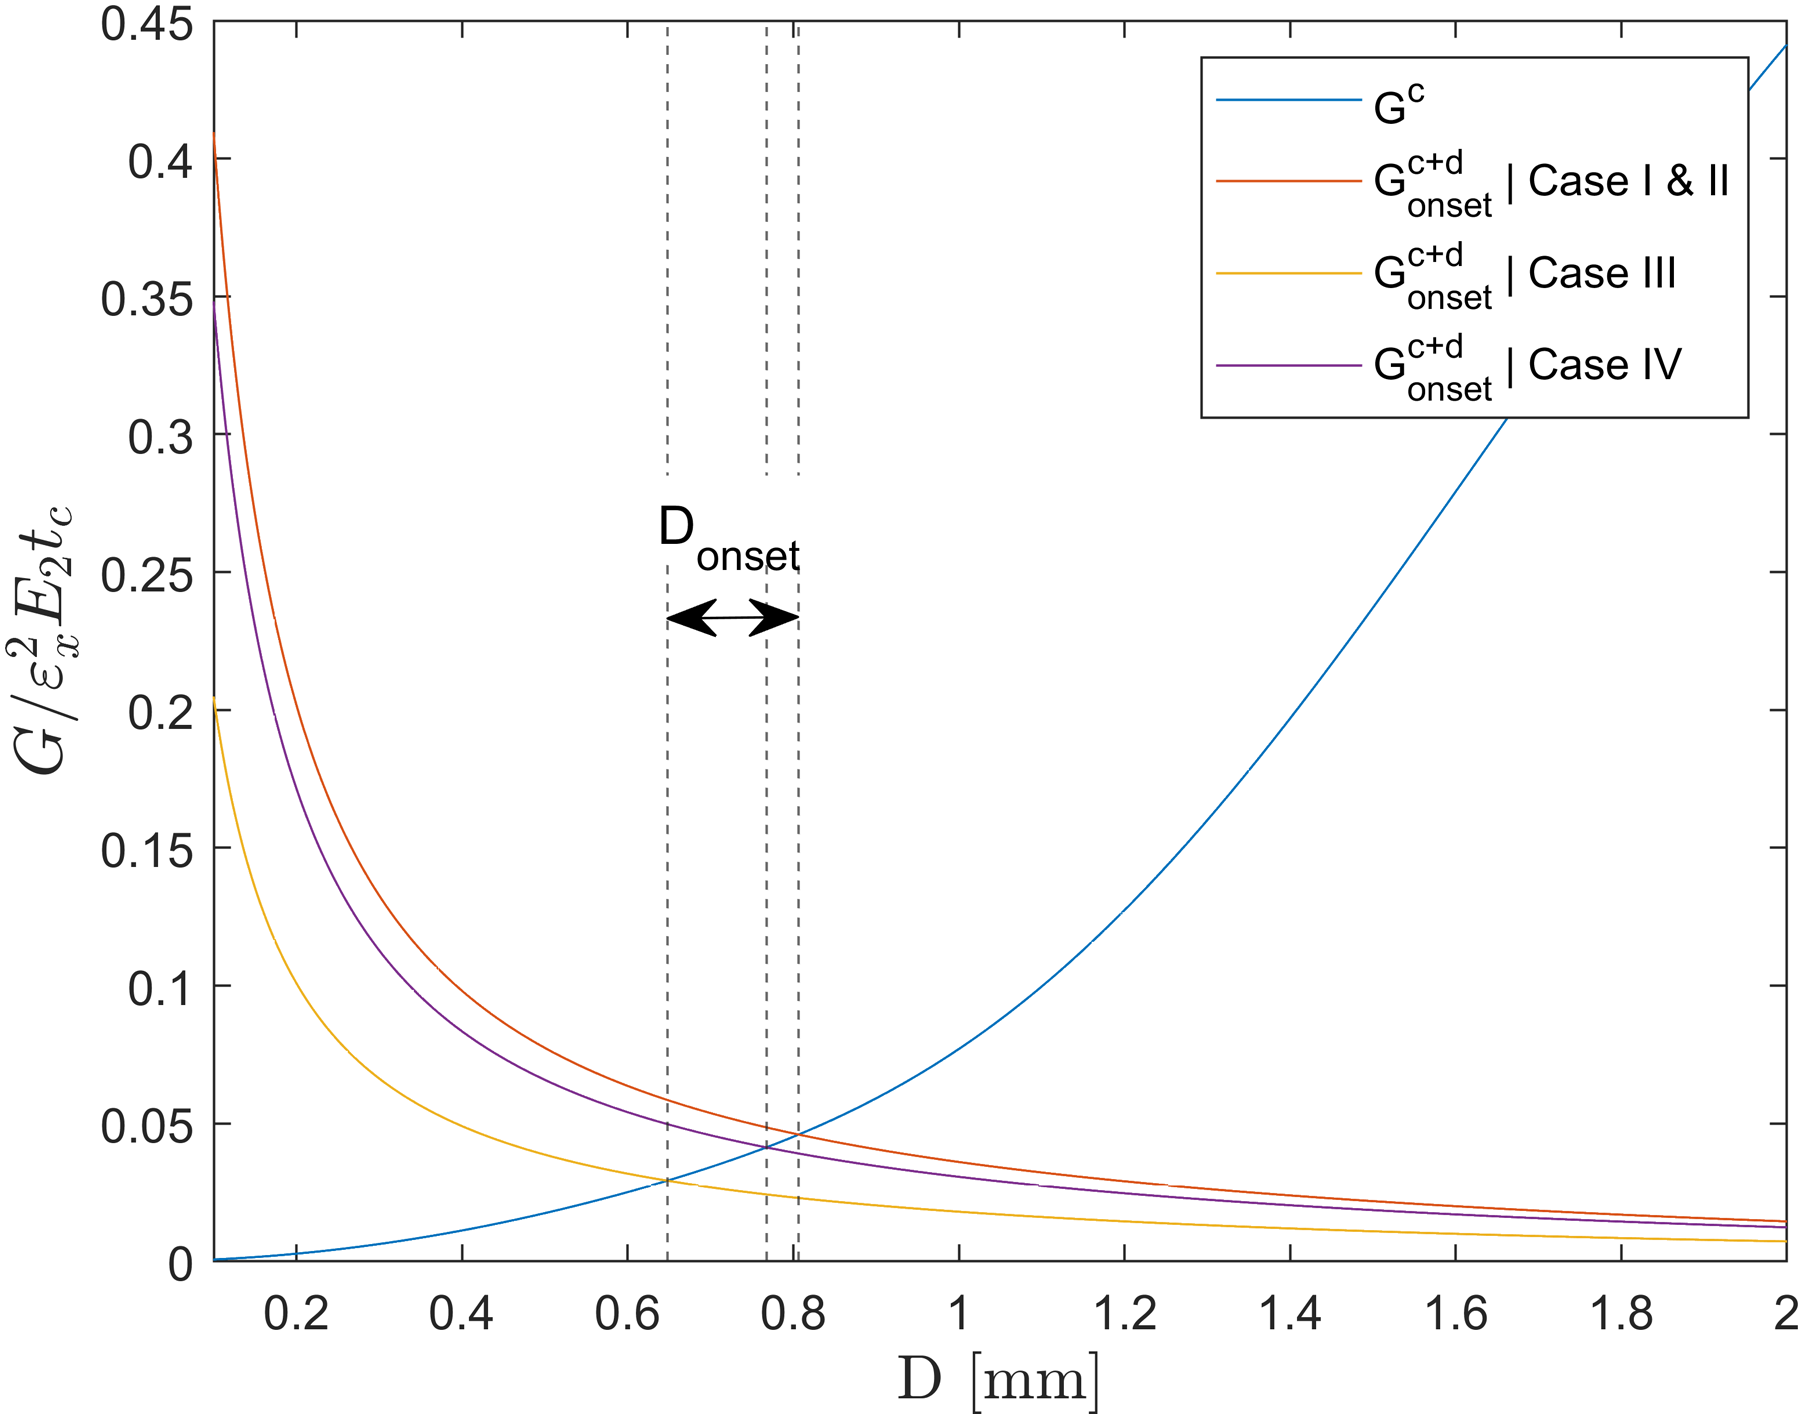
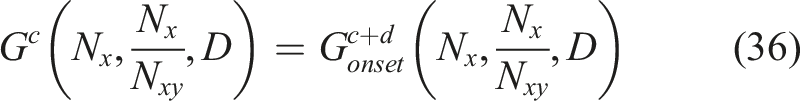
, i.e. for larger crack spacings, it is more energy-efficient for the laminate to dissipate energy by increasing the area of matrix cracks. Equating the two strain energy release rates G
c
and G
c+d
gives the value of D
onset
. It can be shown that, for a cross-ply laminate, the applied strain which would cause delaminations to start is given by: Determination of matrix crack spacing to cause delamination onset. Determination of crack spacing at delamination onset.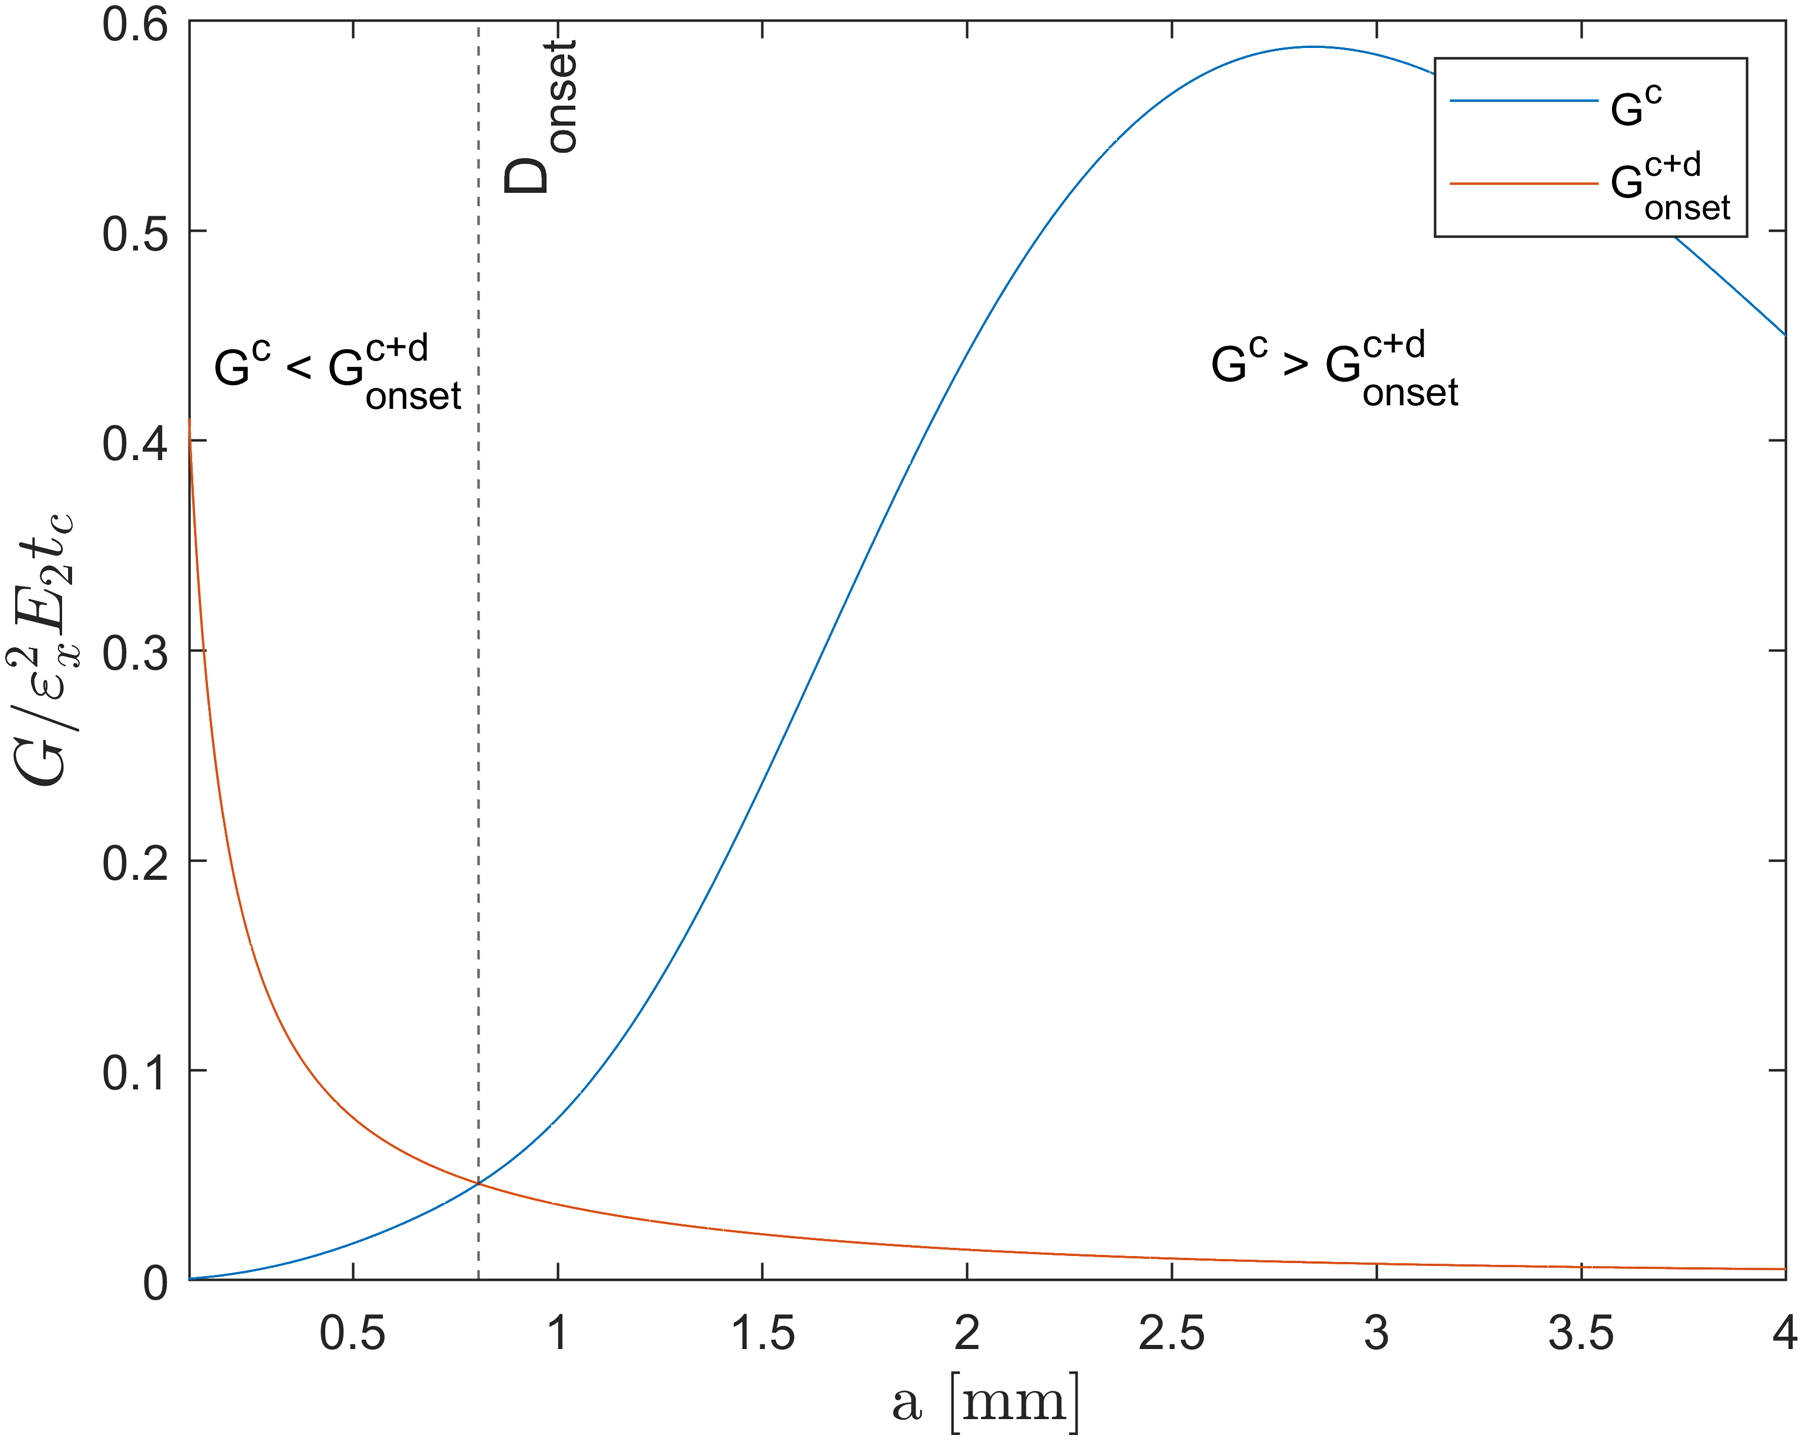
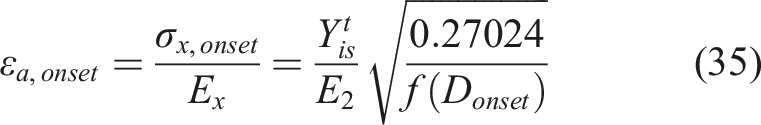
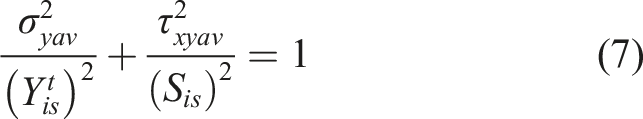
As there are no openly available data for general laminates, the accuracy of the resulting predictions is assessed by using data on cross-ply laminates. This is shown in Figures 11–13. It should be emphasized here that the predictions have no need of a critical energy release rate value as they are based on critical energy density determined from equation (5) through (7) and (33a-d) making use of Y
t
is
. In Figures 11 and 13, the value of Ytis was obtained from Ref. 19: Onset of delamination load in cracked cross-ply laminates compared to tests from Refs.
2
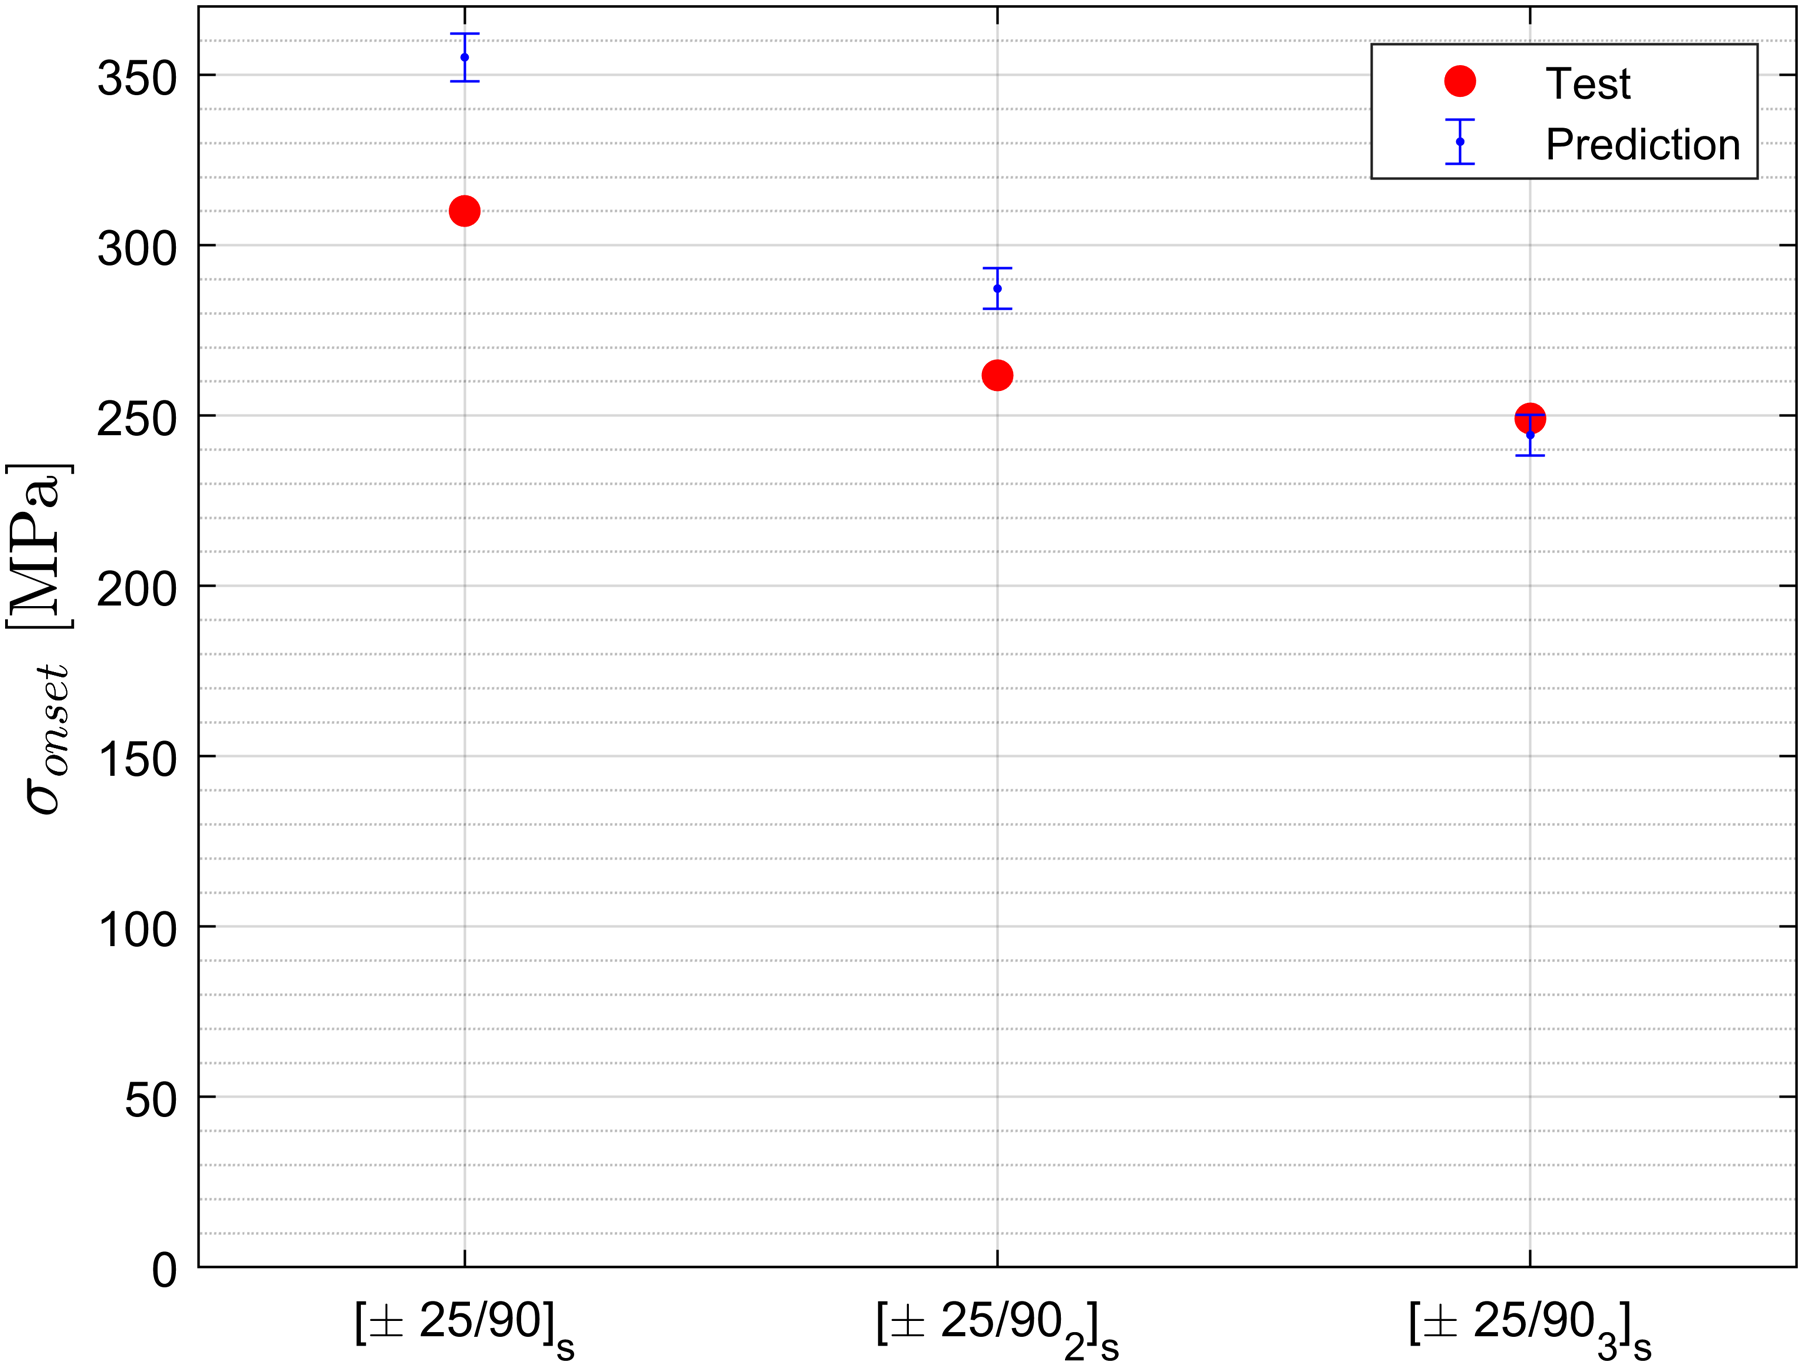
. Onset of delamination load in cracked [±25/90n]s laminates compared to tests from Refs.
20
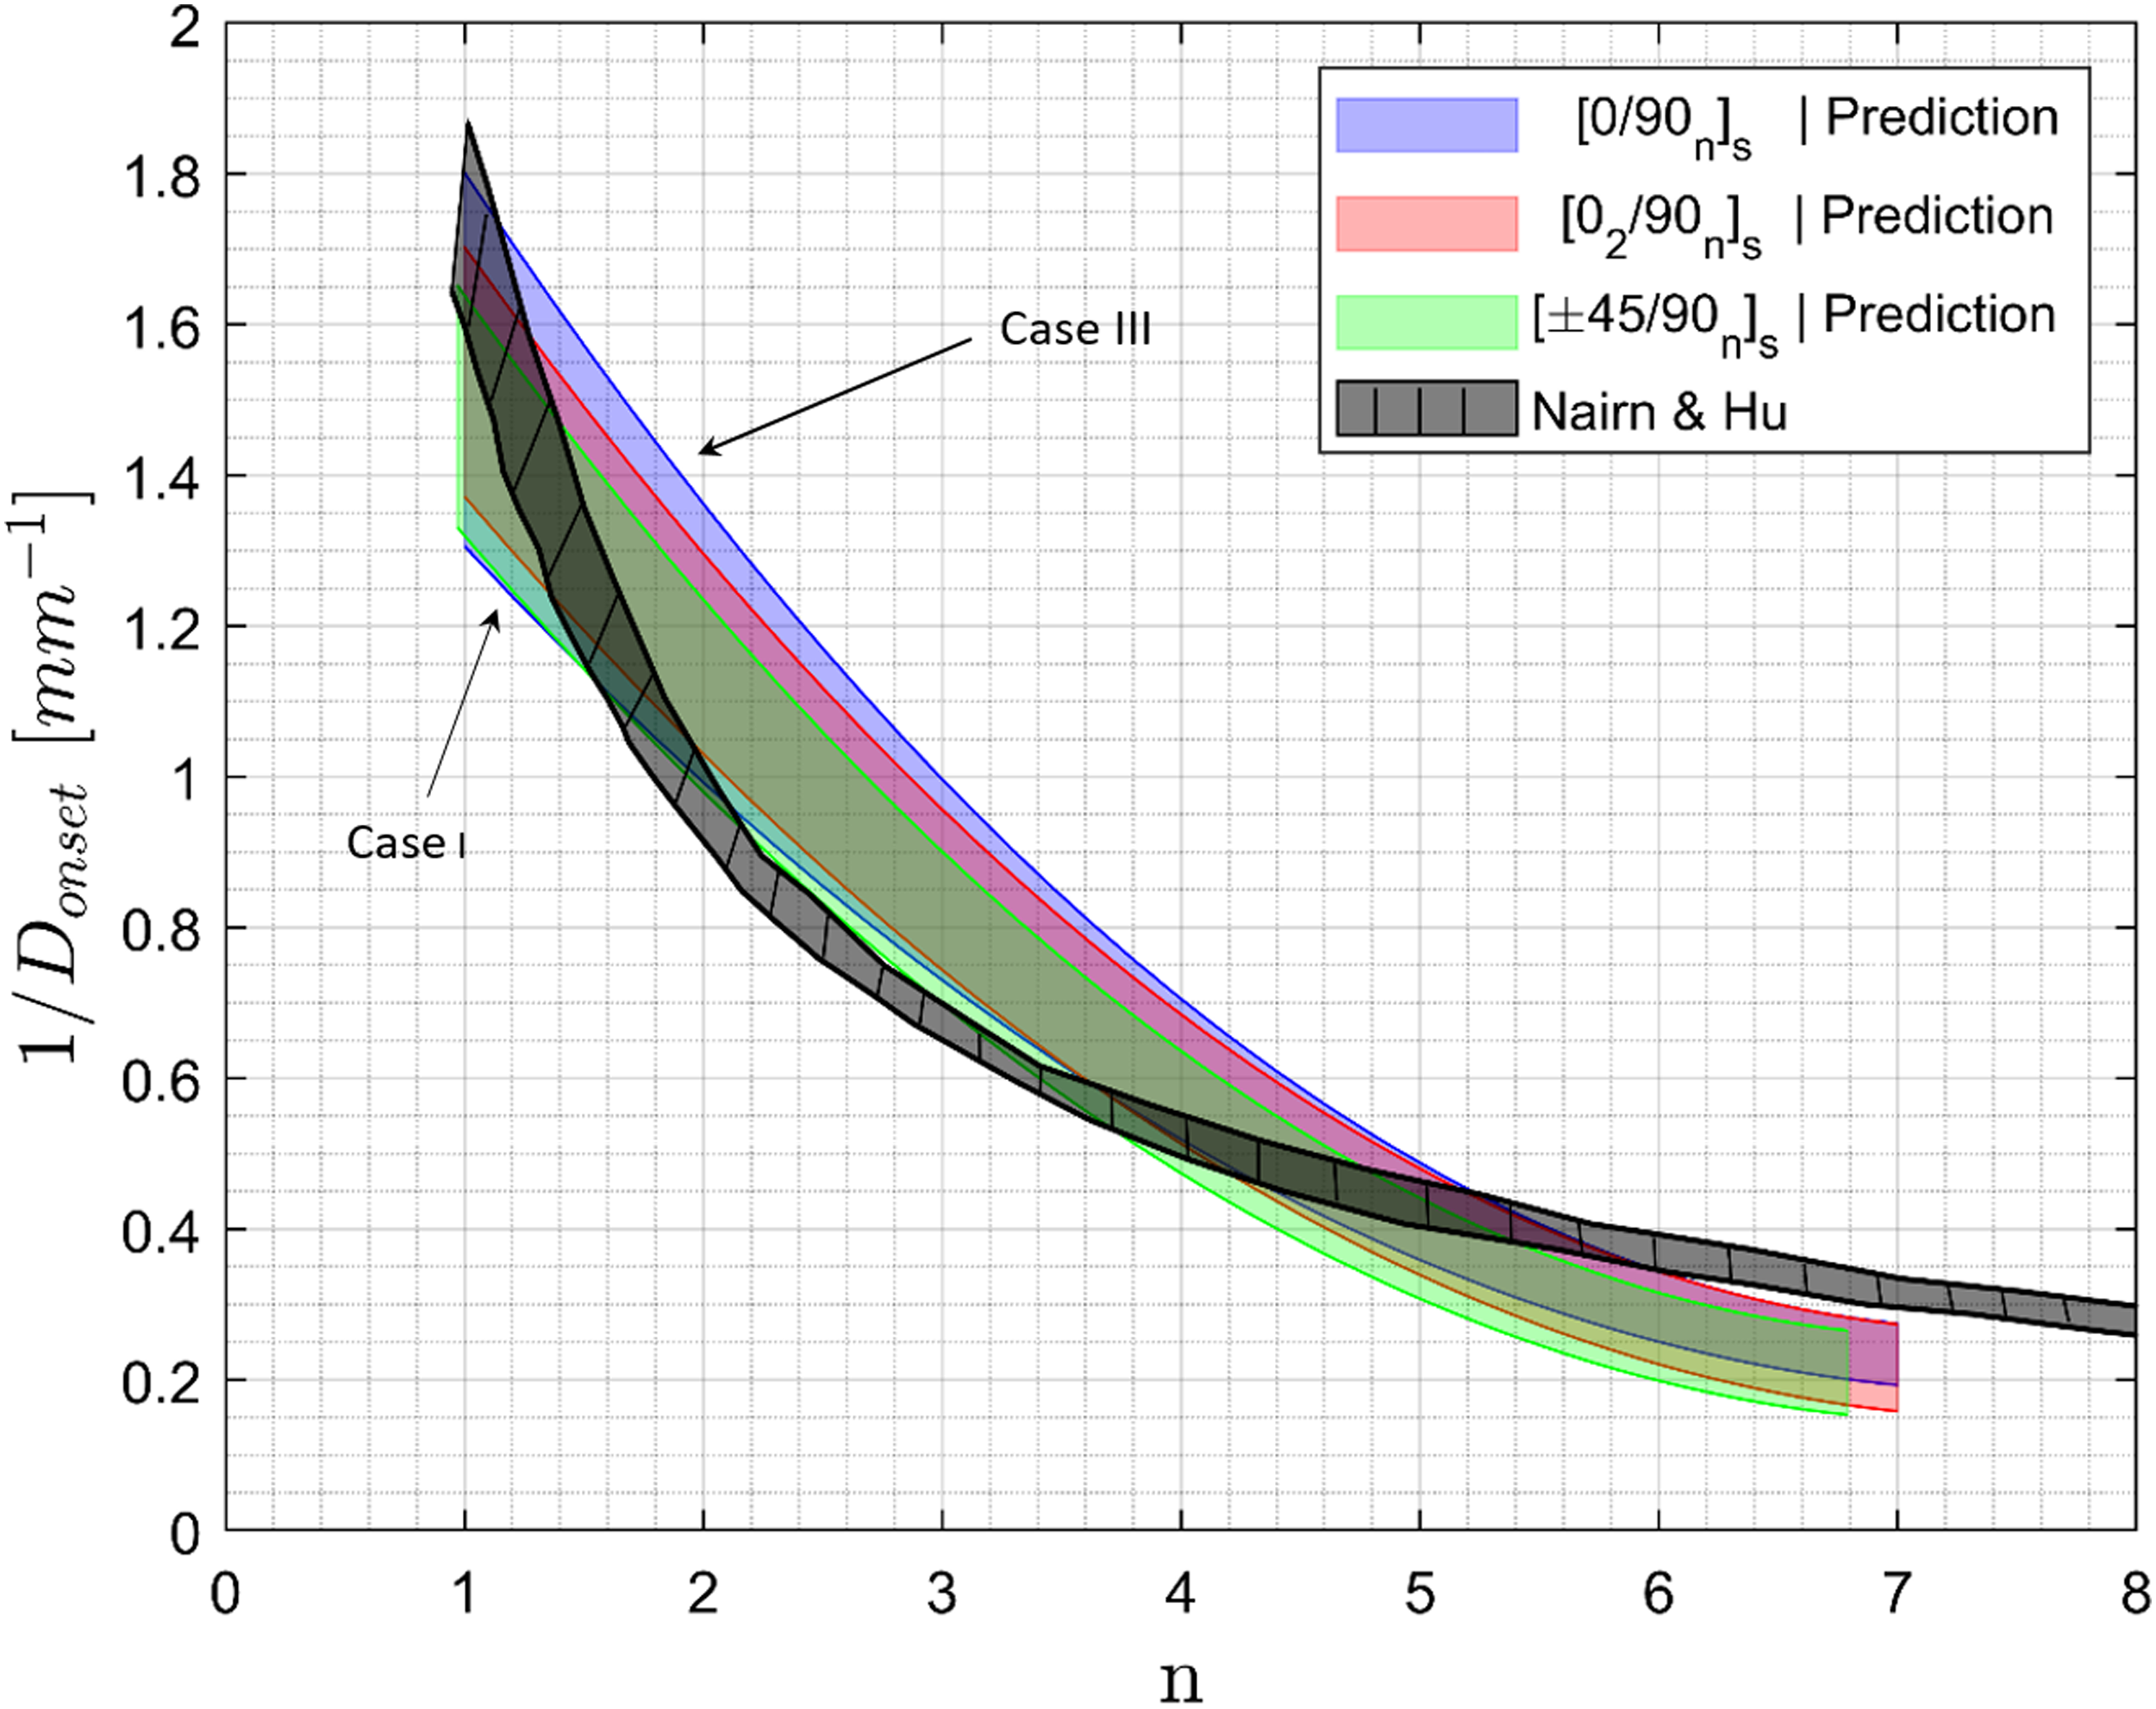
. Predicted crack density at delamination onset for various laminates compared to predictions in Refs.
14
.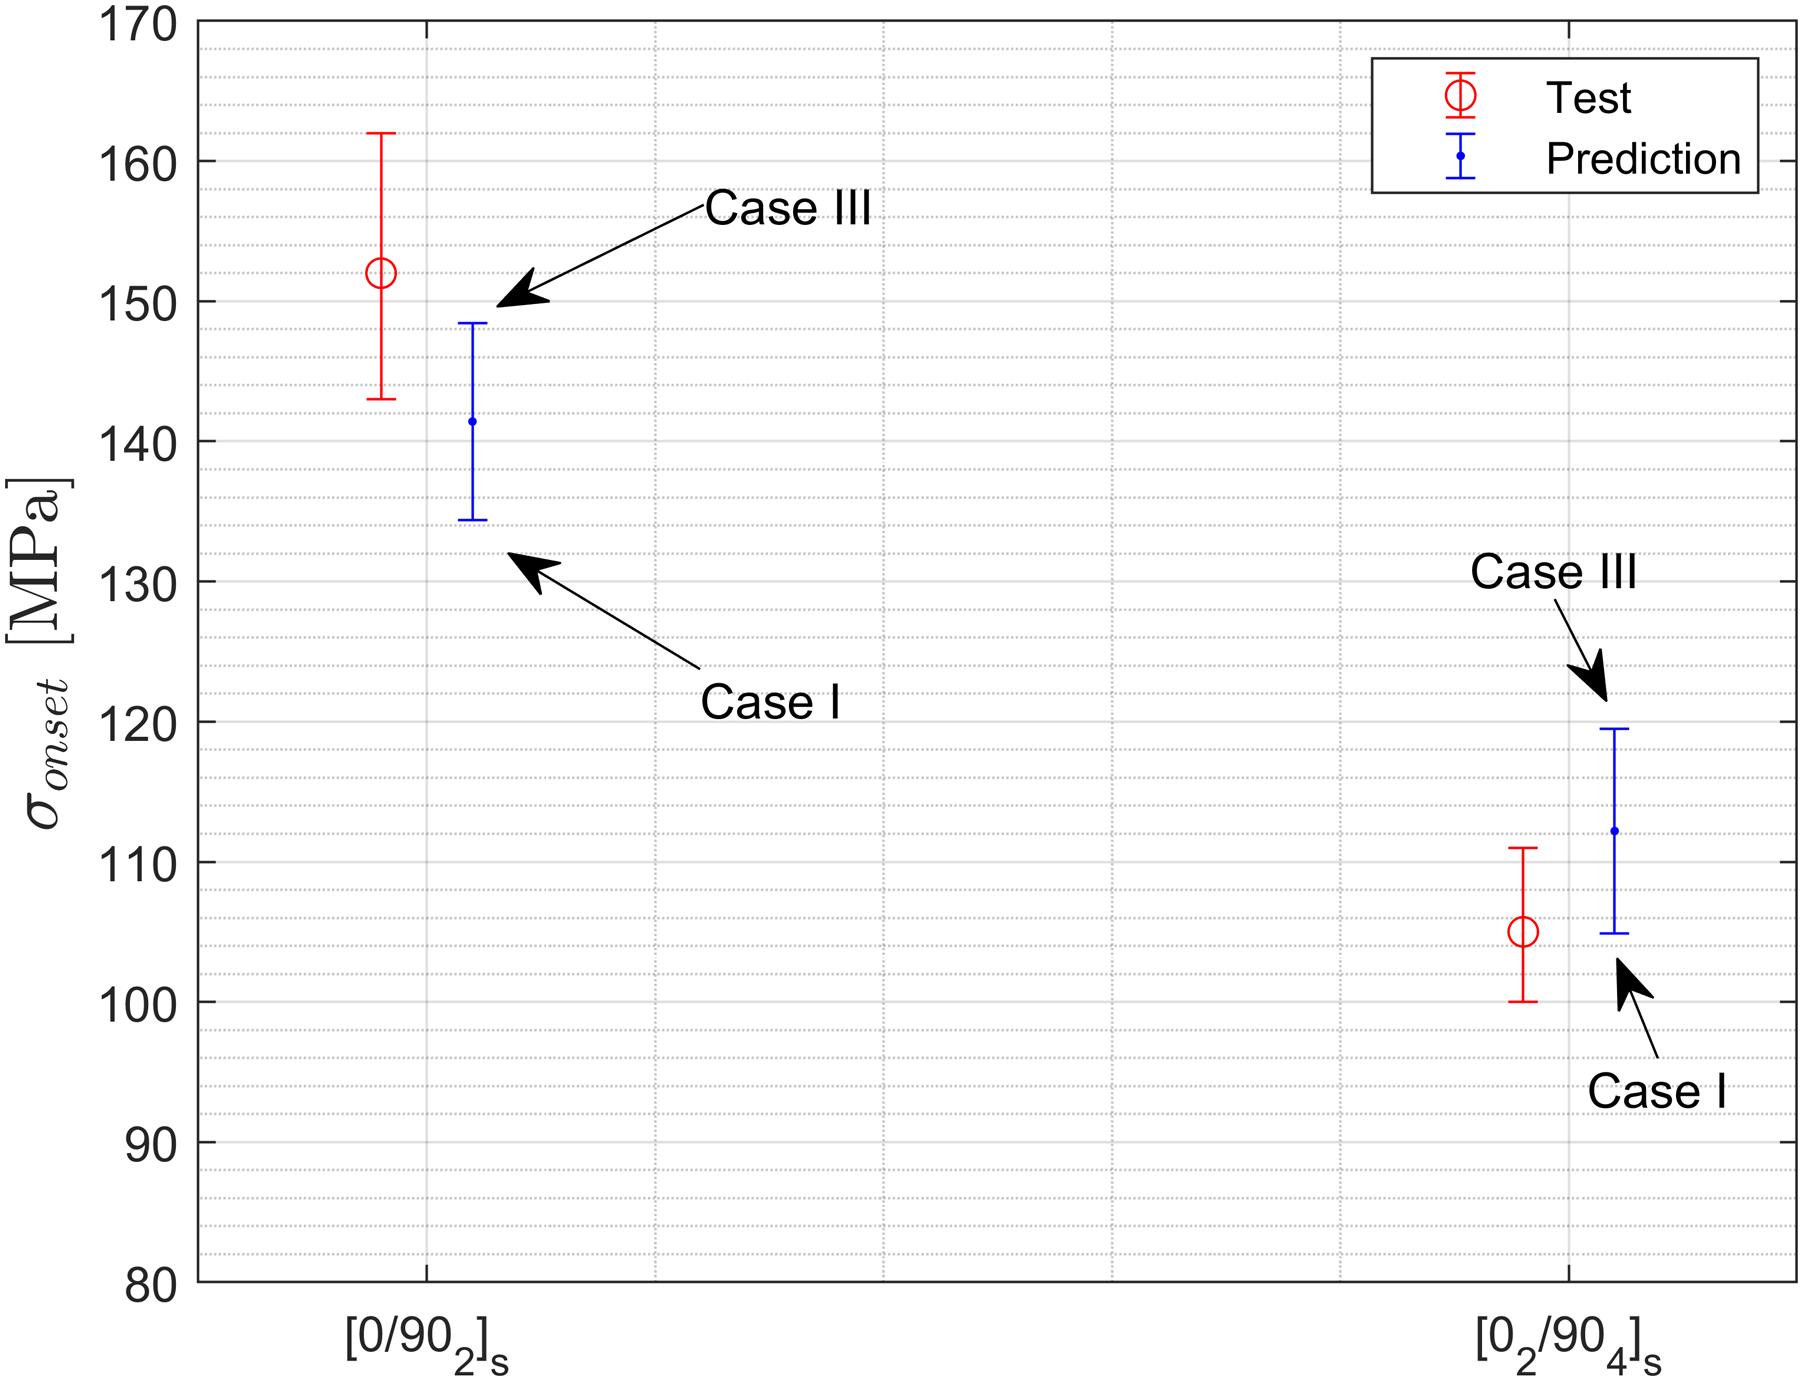

The delamination onset stress for [0/902]s and [0/904]s laminates is shown in Figure 11. The predictions from the present method are shown next to the test results with a range corresponding to the three Cases examined also shown. The predictions overlap most of the tests showing good agreement. The differences from the test results in Figure 11 are attributed to (a) the equation (37) used for Ytis for both laminates as insufficient data were available to capture the dependence of the transverse in situ strength for the lower stack thickness of the 90o plies, and (b) the delamination pattern reported in Ref. 2 was a mixture of the individual Cases examined here.
Similar good agreement in capturing the trend is observed for [±25/90n]s laminates when compared to test results from Ref. 20. The comparison is shown in Figure 12. No data scatter were reported in Ref. 20 so no direct comparison of the ranges of the tests to the predictions can be made. As in the previous Figure, Case III corresponds to the highest predicted delamination onset load and Case I to the lowest.
A final comparison is made in Figure 13. The onset of delamination crack density D onset as predicted by our present method is compared to the predictions by Nairn and Hu 14 for different values of n in [0m/90n]s and [±45/90n]s laminates as the values of n and m change. Good agreement between the methods is observed.
The efficiency of the presented method allows trade studies to examine the effect of different parameters. One example is shown in Figure 14 where the layup of a laminate under tension is varied. For [0/θ2]s laminates, values of θ closer to 0o tend to have higher energy release rate values at delamination onset than values closer to 90o. This trend however is not monotonic. There is significant stretching/shearing coupling in some of the laminates and the interaction between transverse tension and shear stresses in the cracked θ plies is too complex to lead to a continuously monotonic behaviour. Dependence of strain energy release rate at onset of delamination on matrix crack spacing D for different layups.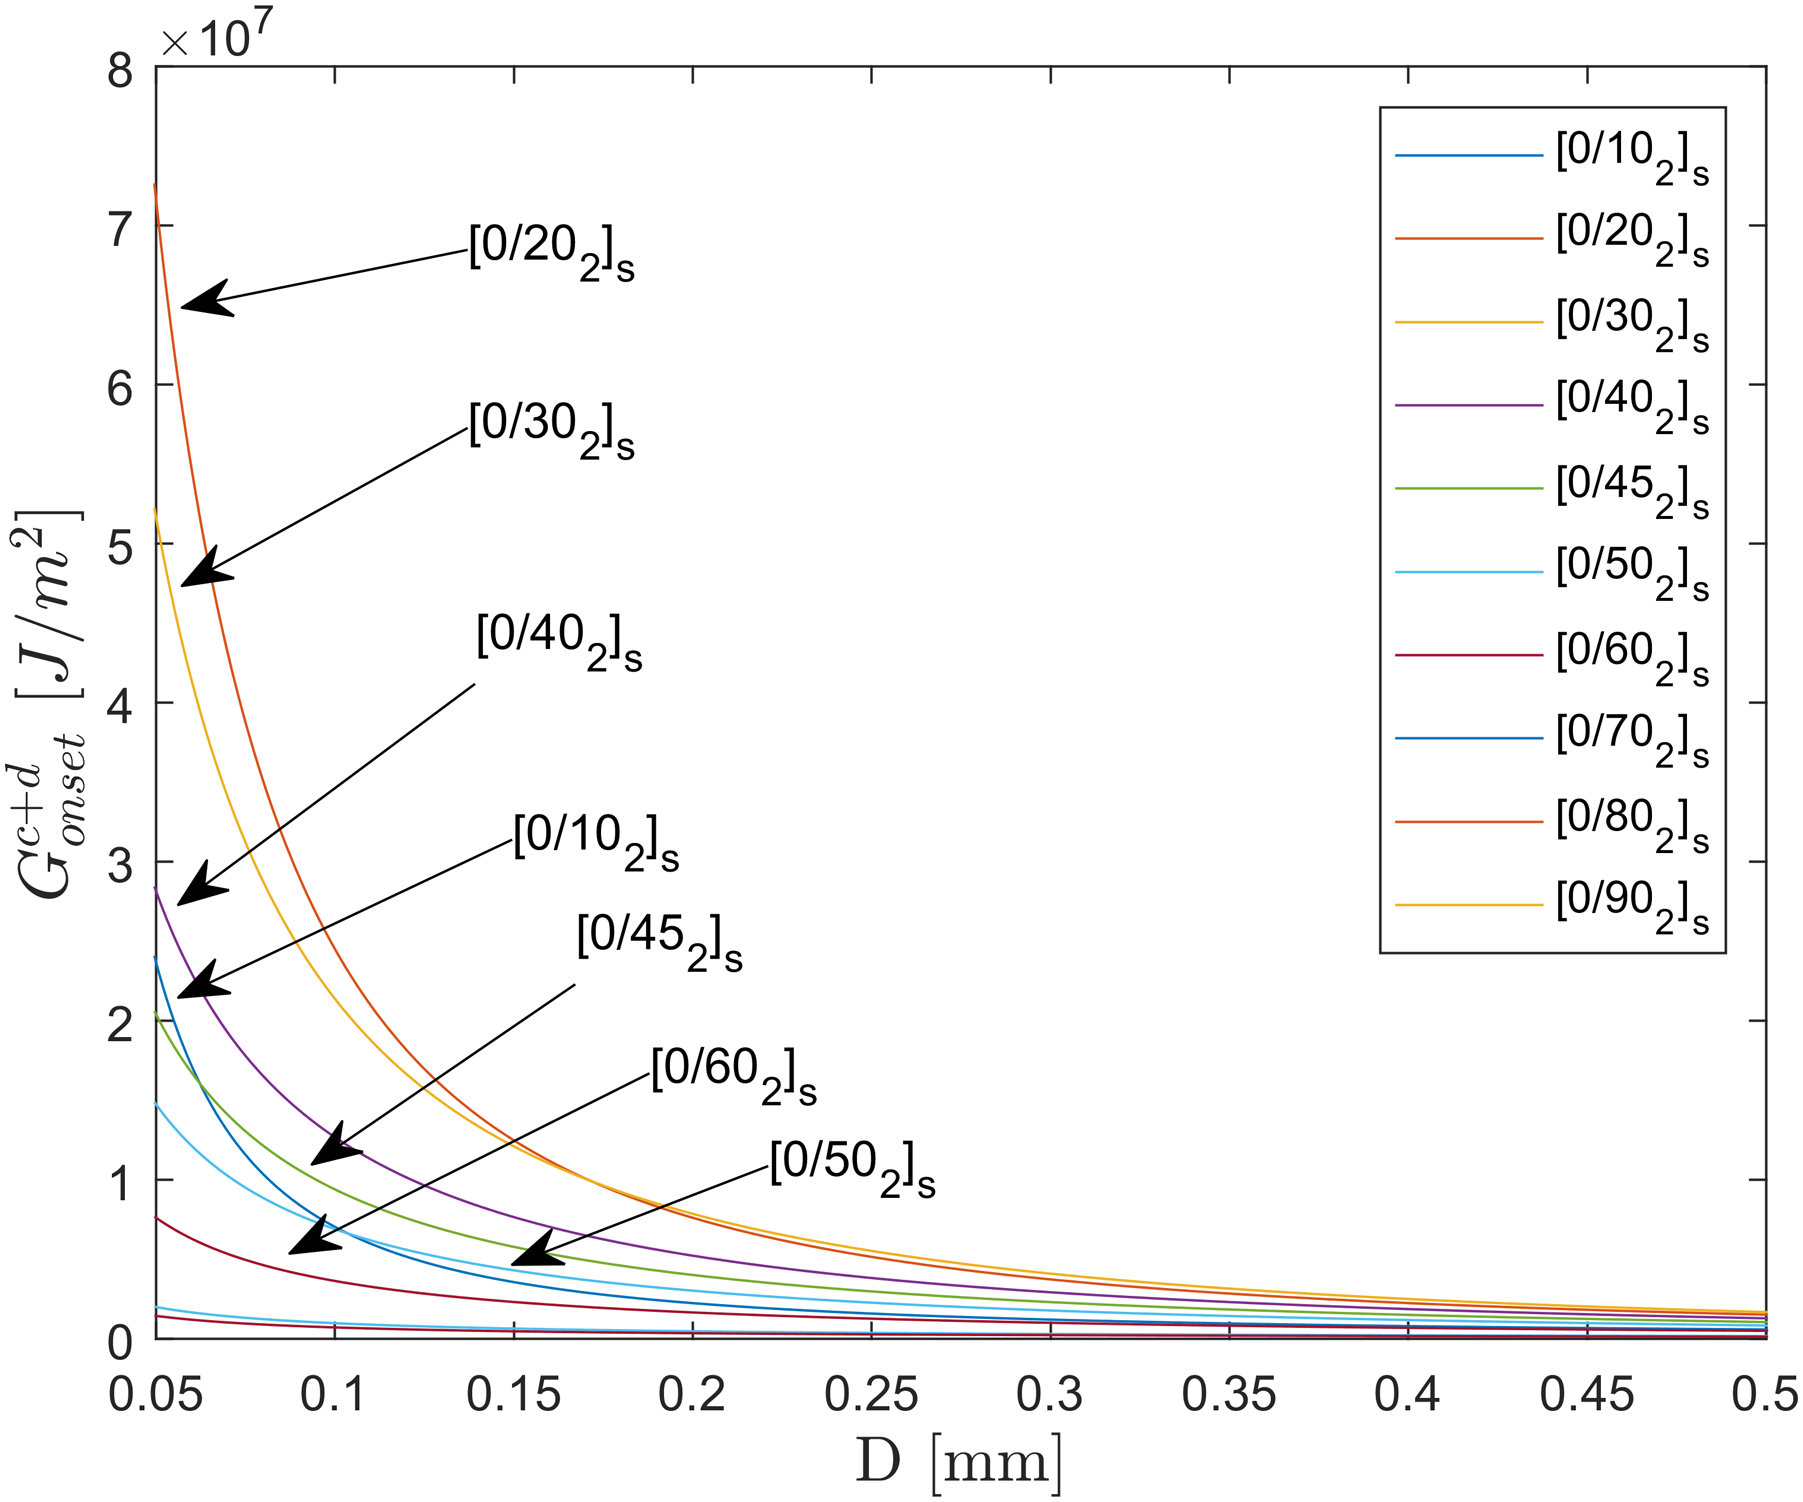
Other trends that were observed were that the onset of delamination energy release rate in a cracked ply increases with the thickness of the cracked ply or with the thickness of the surrounding uncracked ply and decreases with an increase in the ratio E1/E2 of the material.
Delamination growth
If the applied load is increased beyond the point at which delaminations appeared at the tips of matrix cracks, these delaminations will grow. An approach to determine the delamination size as a function of applied load is proposed here. First, it is assumed that the matrix crack spacing does not change when the load increases further. Essentially, it is more efficient for the laminate to dissipate energy in delamination formation rather than creation of additional matrix cracks. This corresponds to crack saturation where, as the loads increases, the spacing remains constant and uniform.14,23–25
To proceed, a relationship between strain energy release rate for growth and the delamination size is needed. As such a resistance curve, a relatively simple semi-empirical expression proposed by Orange
26
is used:
The delamination size a
o
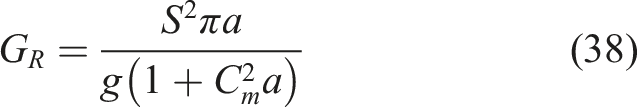
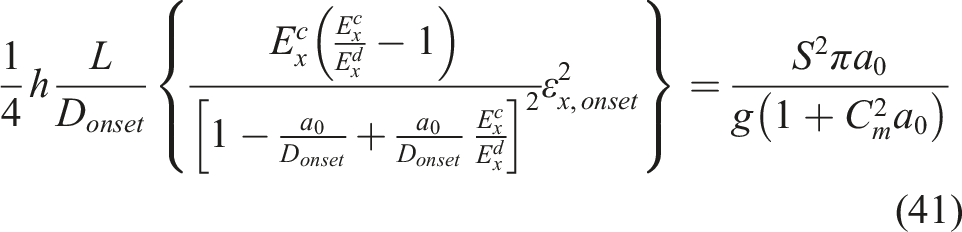
at delamination onset is determined by equating the strain energy release rate for a laminate with cracks and delaminations, equations (33a-d) to that for a laminate with delaminations only, equation (38):

Substituting:
An accurate approximation for a
o
can be obtained by expanding the right hand side in a Taylor series and keeping terms up to second order in a
o
. This leads to:
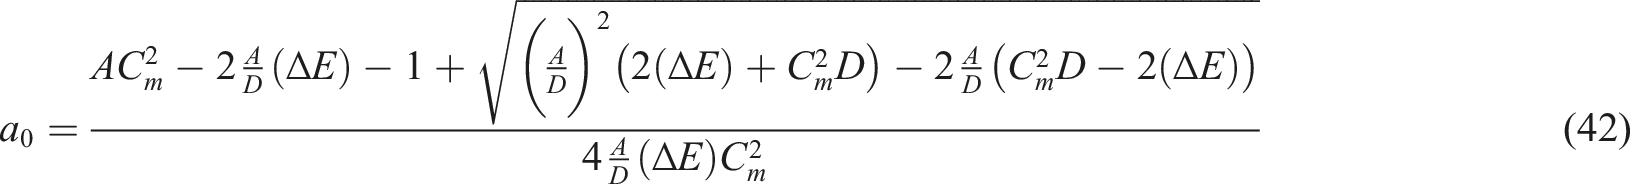
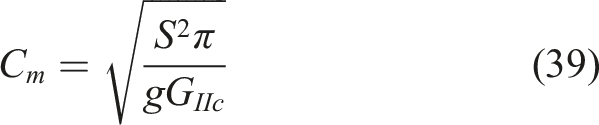
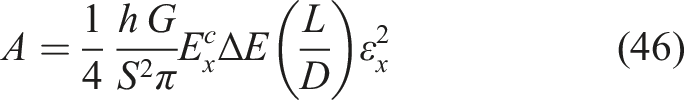
with Cm given by equation (39) and
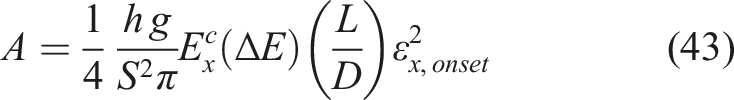
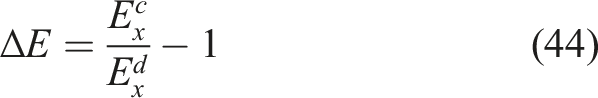
For delamination growth, equation (40) is solved again but now N
x
> N
x,onset
replaces N
x,onset
and a replaces a
o
. As before, there are four cases corresponding to the four cases shown in Figure 4:
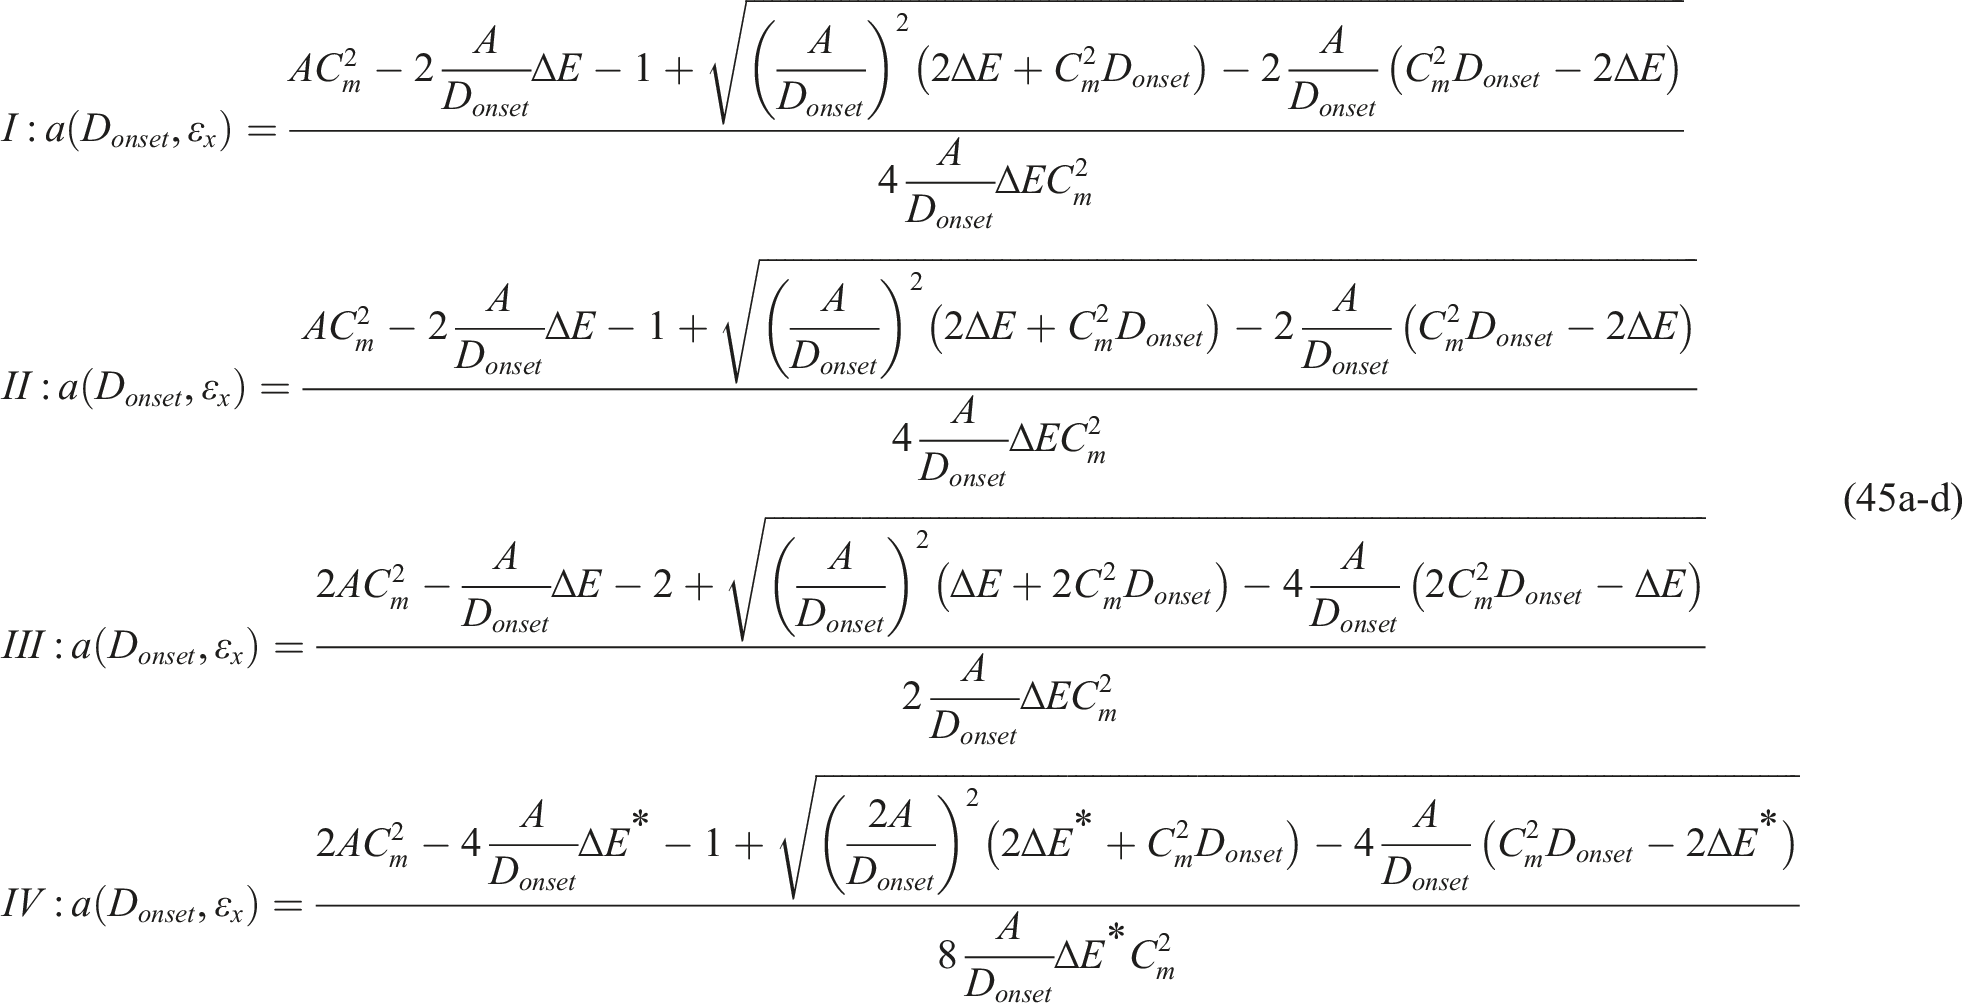
with:
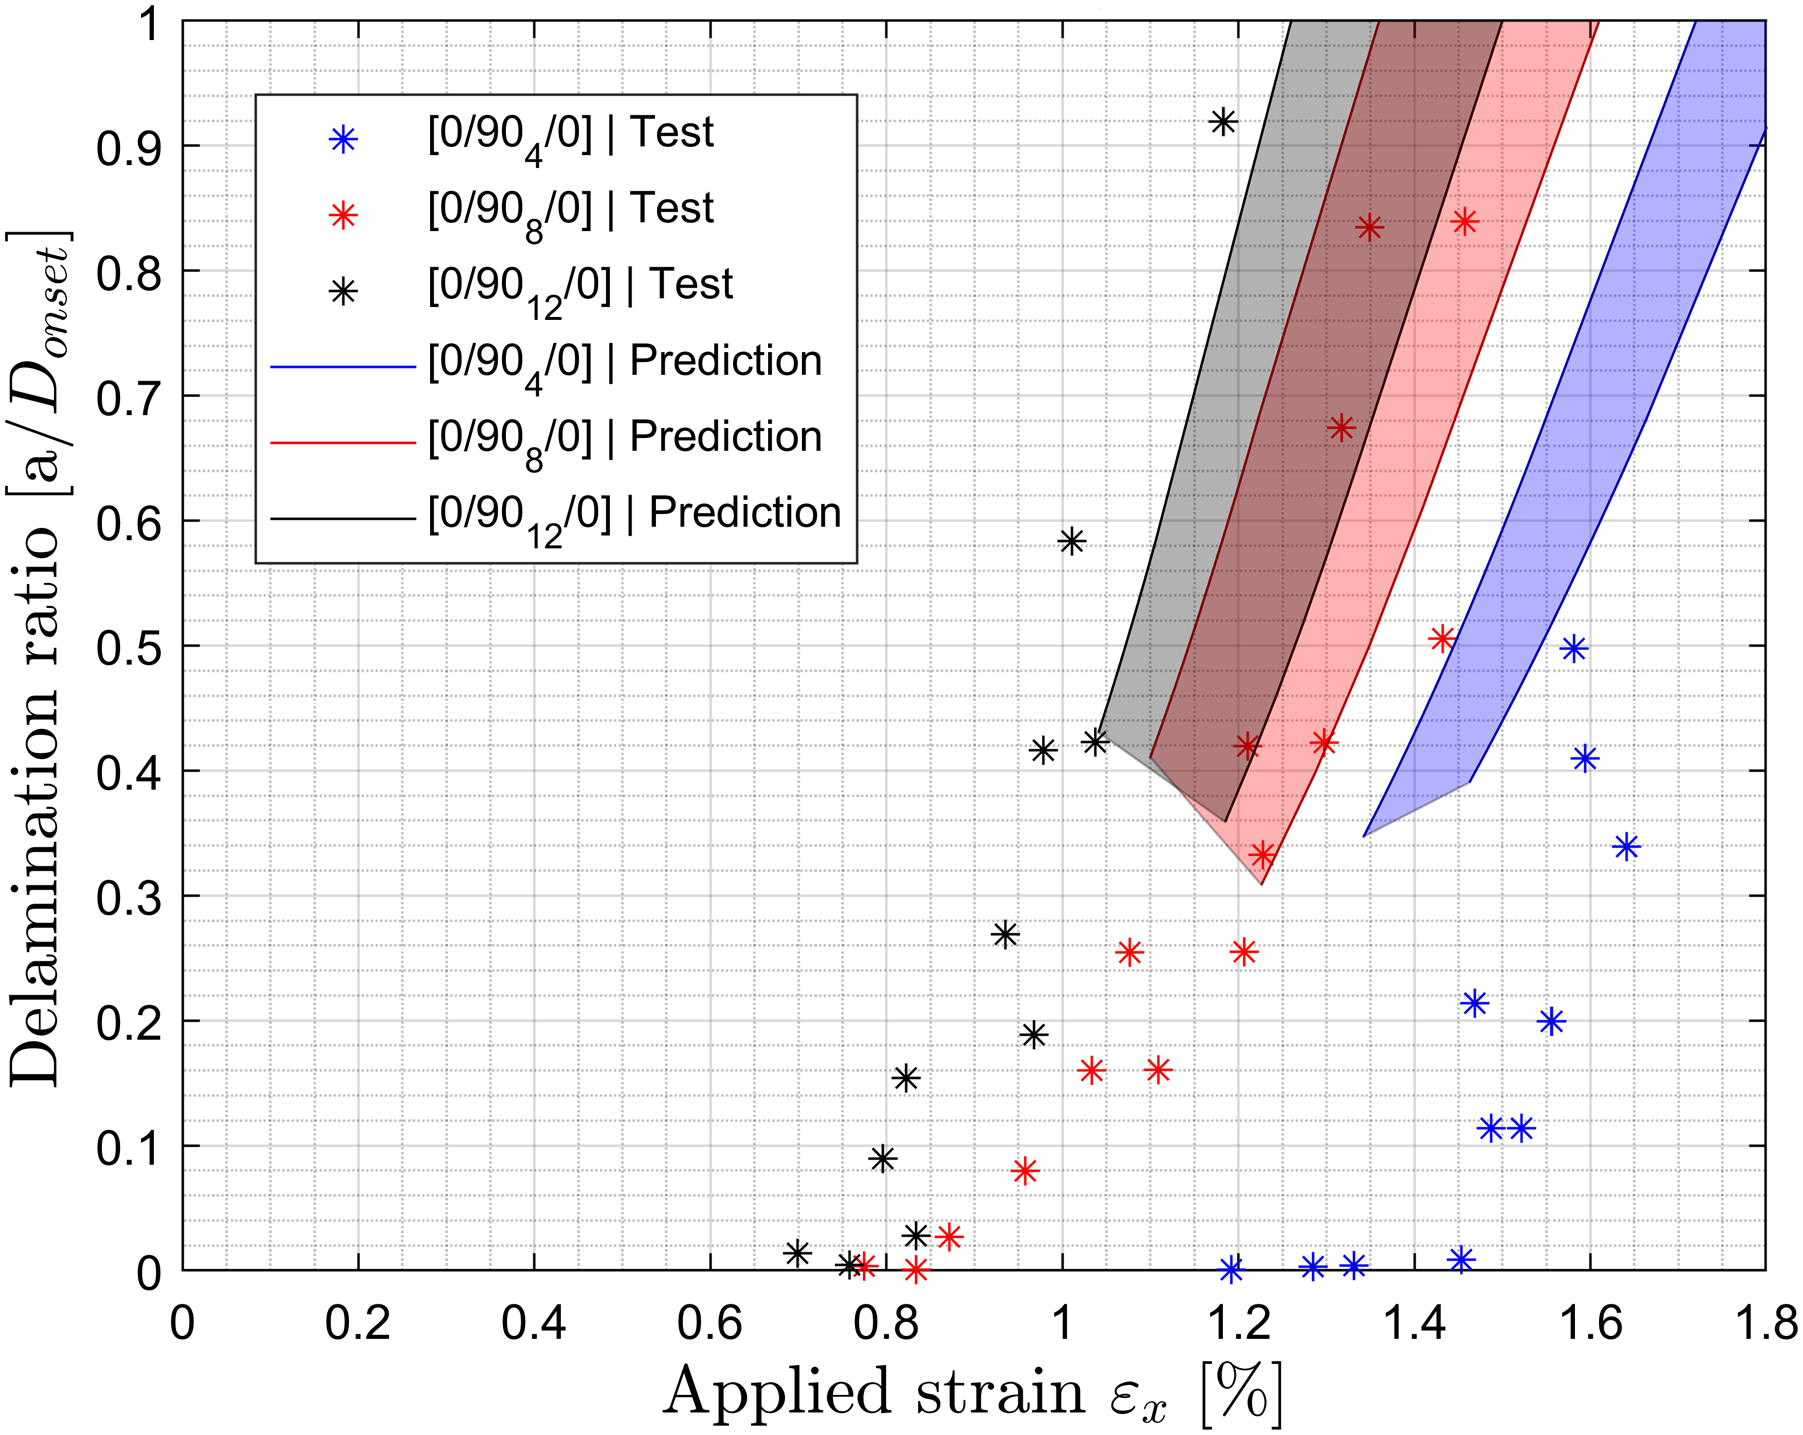
Published data with delamination size as a function of applied load are relatively limited. Here, the accuracy of equations (45a-d) is evaluated against test results found in Ref. 3. For the material in Ref. 3, the following values were used: S = 50 MPa, g = 2.85 GPa, and GIIc = 820 J/m2. The comparison of predictions to test results for three cross-ply laminates is shown in Figure 15. As before, a range of predictions is given in Figure 15, corresponding to the four cases of Figure 4. For all three laminates, the tests show there is a region with measured delamination sizes without predictions from the present method. This is because the predictions do not include edge delaminations which would start irrespective of the presence and spacing of matrix cracks. Beyond a certain applied strain, the analysis presented here predicts delamination sizes which are in good agreement with the measured values for the [0/904]s and [0/906]s laminates and slightly shifted to the left for the [0/902]s laminate suggesting that the transverse in situ strength value used in the analysis needs refinement. Size of delaminations emanating from matrix cracks compared to tests from Refs.
3
.
Complete history of matrix cracks and delaminations
One of the advantages of the present method is that, being essentially in closed form, it allows very rapid construction of the complete history of cracks and delaminations in a laminate. An example is shown in Figure 16 for the three laminates of Figure 15 under uniaxial tension. In this Figure, crack spacing is measured on the left y axis and delamination length on the right y axis. Matrix crack evolution and delamination growth in cross-ply laminates.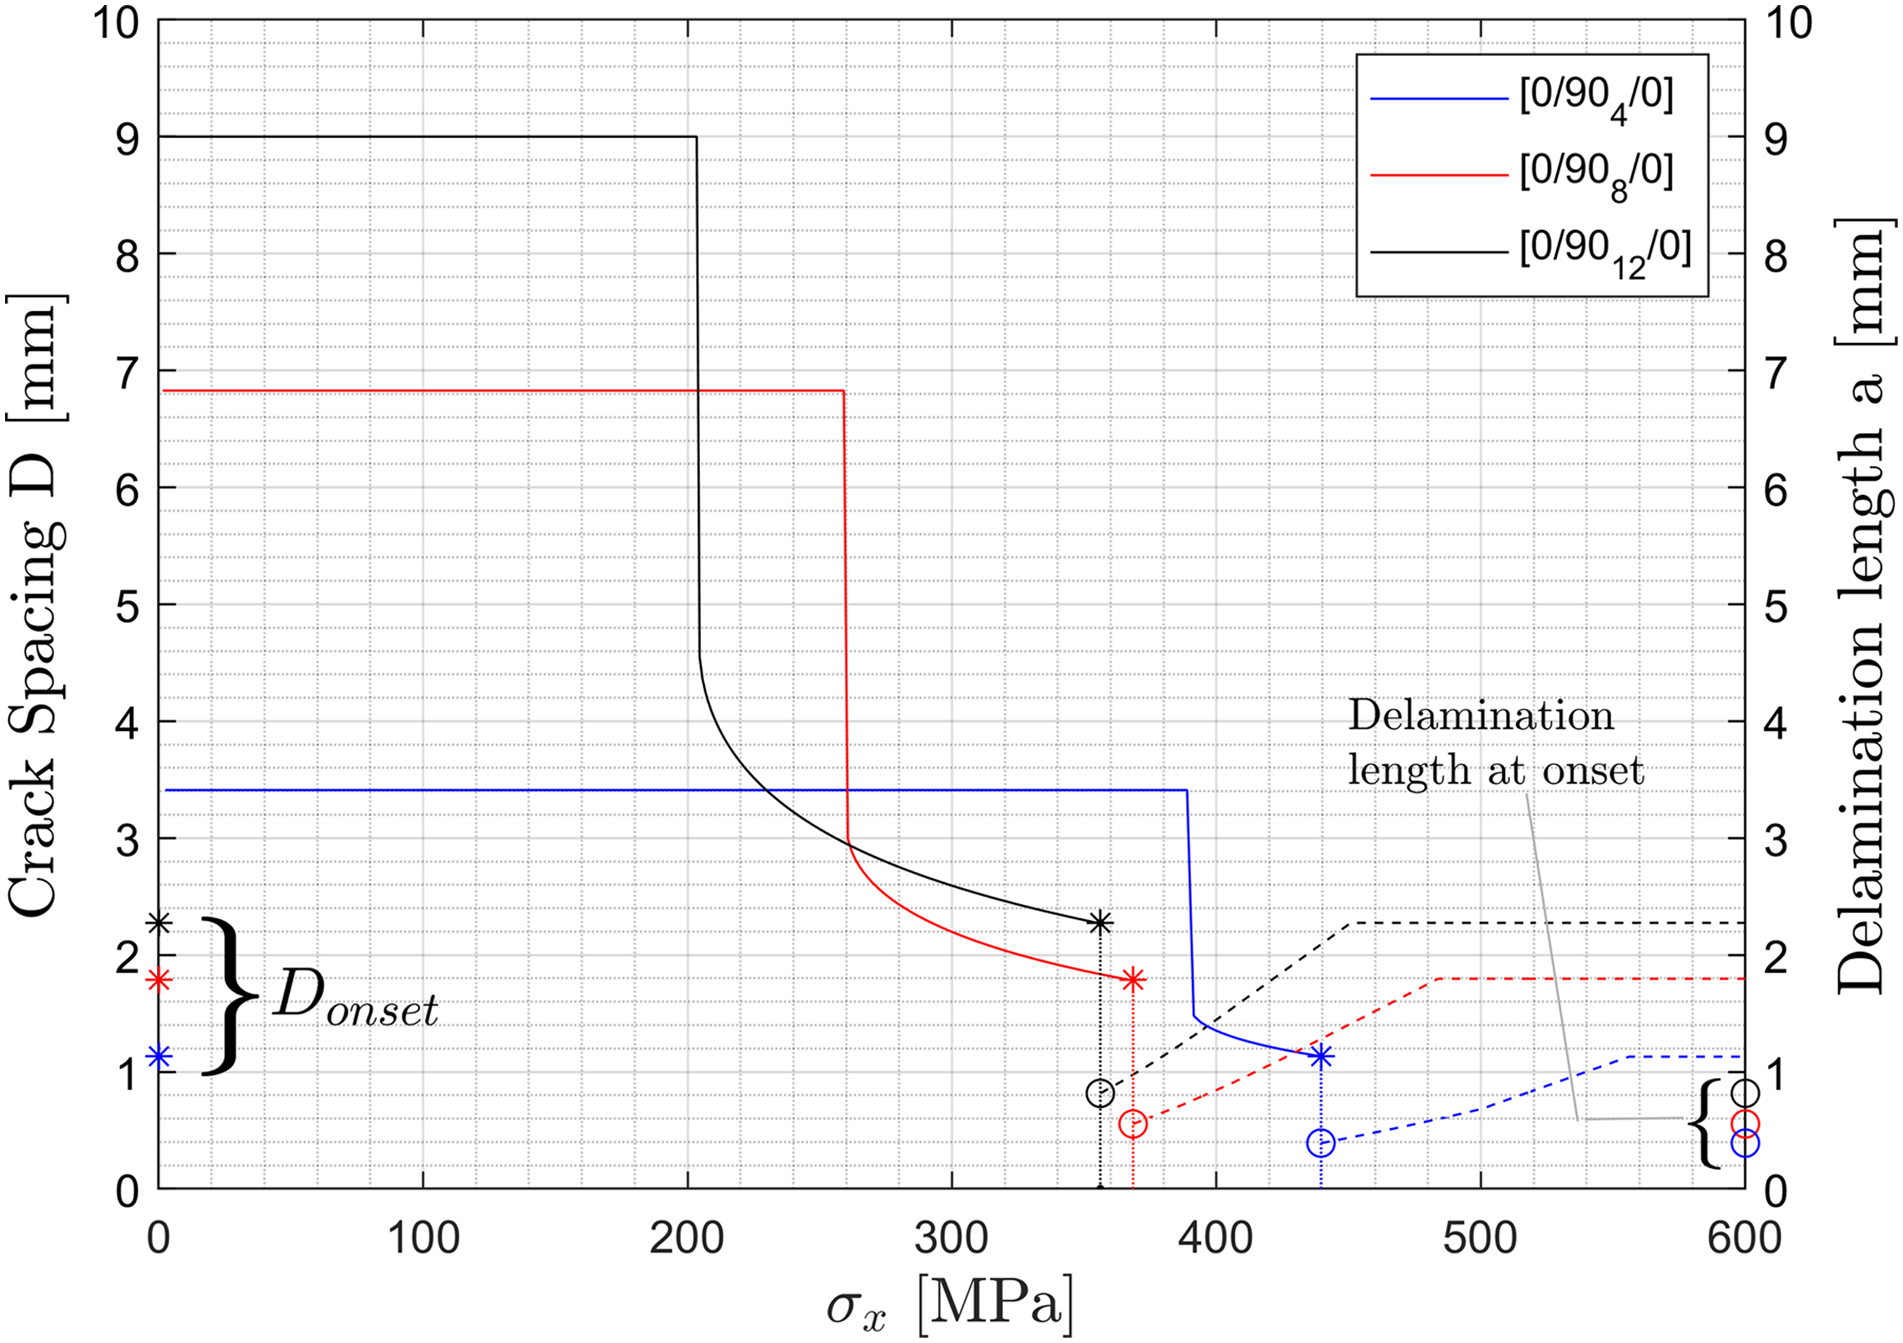
For low applied stress, there are no matrix cracks. This is the region with the horizontal lines in the Figure. As the applied stress increases cracks appear and their spacing rapidly decreases. This is shown by the (near) vertical lines in the Figure. Upon further increase of the applied stress, the crack spacing has become uniform and increases more slowly as shown by the curved portion of the three continuous curves in Figure 16. Then, a stress is reached where the cracks saturate and delaminations appear. Their size at onset is smaller than the current crack spacing. The evolution of these delaminations as the stress increases further is delineated by the three dashed curves with the delamination sizes read off the right y axis. At some point, the delaminations grow to the next matrix crack and there is no growth of delaminations beyond that point. This is indicated by the horizontal dashed portions of the three lines.
Discussion
There were several simplifications introduced in the approach presented above which should not be overlooked and which are the subject of future expansions of the work: (a) Thermal (and swelling) stresses were neglected. This was done as a simpler first step to examine the accuracy of the approach without them. Conceptually, the extension to include these stresses is relatively simple by adding the corresponding thermal and swelling strains. It should be noted that, while such an extension is necessary, previous work, 27 has shown that at least for certain laminates and materials, their effect is small. (b) There is a three dimensional stress field at the tips of the matrix cracks and around delaminations whose effects were neglected. Moreover, the fact that, under load the delaminations open the tips of the matrix cracks affecting the local stiffness significantly, was also neglected. These effects can be taken into account with detailed finite element models and are addressed in detail in the work by Kahla. 28 The approach presented here aims at demonstrating that the crack density and the delamination length can be used to predict laminate stiffness in presence of damage or, conversely, that laminate stiffness can be used to determine energy release rate and, through that, delamination onset and growth. The favourable comparison with tests suggests that the method is promising but further improvements are necessary. (c) The three-dimensional stress fields created near the crack tips and delaminations will cause local bending which would be more pronounced if the delamination pattern is unsymmetric as in Case IV. These are neglected in the present work.
Summary and conclusions
The strain energy release rate for symmetric laminates under tension or shear containing matrix cracks or matrix cracks and delaminations was determined. Four different cases were distinguished for the delamination pattern leading to a range of predictions for the crack spacing at which delaminations will start and the corresponding size of delamination onset. A delamination resistance curve was proposed which was used to determine the delamination size for higher applied loads. Good agreement with published test results was observed. It was found that, as the thickness of the cracked ply (or plies) increases, the tendency for matrix crack creation increases and delaminations at the tips of these cracks will start earlier. Also, as the orthotropy ratio of the pristine material increases, the tendency to crack the matrix increases and the load at which delaminations will appear increases. Finally, for a ply under combined shear and transverse tension, the relative magnitudes of these stresses will dictate when cracks and delaminations will appear. The approach presented allows determination of the complete history of matrix cracks and crack tip delaminations for symmetric laminates.
Footnotes
Declaration of conflicting interests
The author(s) declared no potential conflicts of interest with respect to the research, authorship, and/or publication of this article.
Funding
The author(s) received no financial support for the research, authorship, and/or publication of this article.
Appendix
The quantity f(D) in equation (35) is given by: