
Abstract
The composite structure composed of carbon fiber reinforced composite and titanium alloy is widely used in aviation and aerospace fields. Due to the different physical properties of these two materials, in the process of lamination, it is easy to appear the pore in the direction of thickness is inconsistent, which is called double-step pore defects (DSPD). The existence of DSPD will undoubtedly have an impact on the connection performance of components, but there is no clear conclusion on the extent of its impact on the connection performance, which restricts the improvement of the pore quality evaluation system, and may cause a waste of resources or leave a safety hazard for aircraft. To solve this problem, the finite element model was established to analyze the initial damage phenomenon of the component with DSPD during bolt tightening. The influence of DSPD on the static strength and fatigue properties of the component was studied by designing experiments, and the failure mechanism was revealed from the perspectives of failure form and damage evolution. The purpose of this study is to provide guidance for the improvement of the evaluation standard and the high quality and stability of the lamination component.
Keywords
Introduction
Carbon Fibre Reinforced Plastics (CFRP) is commonly laminated with titanium alloy and high-strength structural steel in aircraft structural components, forming a layered structure that exhibits excellent mechanical properties due to the well-matched characteristics of CFRP and titanium alloy, along with good electrochemical compatibility.1,2 Bolt connections are mainly used to connect CFRP/Ti laminated components. 3 Compared with other connection methods, bolt connections have higher stability and connection strength, and with the advent of functional new bolts such as high-lock bolts and liner bolts, the controllability of their connection state has entered a new stage.4–6
With the large-scale application of heterogeneous laminated structures such as CFRP/Ti, people have begun to discover that this type of component is prone to inconsistent pore sizes in the thickness direction during the pore-making process, that is, the double-step pore defects (DSPD). 7 Compared with homogeneous laminated structures such as CFRP/CFRP and Ti/Ti, the occurrence frequency and forms of this pore-making defect are significantly higher in heterogeneous laminated structures. The main cause of DSPD is the pore-enlargement effect caused by the sharp titanium alloy chips during the pore-making process, which scratch the walls of the CFRP pore, or the shrinking of the CFRP pore after experiencing high-temperature drilling, resulting in inconsistent pore diameters between the upper and lower layers of the material. 8
Many researchers have studied the formation mechanism and variation law of the DSPD in CFRP/Ti laminated pore-making. Shyha 9 analyzed the pore integrity of Ti/CFRP/Al laminated drilling under water spray and cutting fluid environments, and found that there were significant differences in the pore sizes of the three materials, mainly due to the influence of the material’s own elastic modulus. Qi 10 studied the influence mechanism of tool vibration, cutting heat, cutting chips, and tool wear on the horizontal double-step pore of CFRP/Ti laminated drilling, and the experimental results showed that when the CFRP plate was placed on the top, the diameter of the CFRP pore was generally larger than that of the titanium alloy plate. Meanwhile, it was found that the main reason for the increase in the diameter of CFRP pores is the tool vibration and thermal chips of titanium alloy at the interface of laminated materials. Dahnel 11 conducted laminated drilling experiments on CFRP/Ti and found that compared with drilling only CFRP, the delamination and pull-out defects of CFRP increased by 22%–62% and 170%–530%, respectively, when drilling laminated materials. Researchers have effectively addressed the two main inquiries regarding the formation of DSPD and how to improve processing quality. However, in terms of how the DSPD affect the connection performance, researchers have not yet given a systematic answer.
Currently, the industry standards for pore size accuracy in the aviation industry rely heavily on empirical evidence and lack theoretical and experimental basis. It is difficult to adapt to new materials and new working conditions, and its scientific validity needs to be verified. 12 If the standard is too strict, it can easily lead to a lot of material waste and increase manufacturing costs. If the standard is too loose, it will leave safety hazards for the service of aircraft.13,14
Therefore, it is necessary to conduct experimental research on the influence of the DSPD on connection performance, establish a mapping relationship between various types of deviations and connection performance, explore the damage mechanism and evolution law, and ultimately supplement and improve the existing pore-making, in order to provide guidance for the high-quality and long-lasting pore-making process of the new generation of aircraft.
Definition of double-step pore defects
During the drilling process of CFRP/Ti laminates, due to the difference in drilling characteristics between the two materials, there may be a situation where the actual pore size of the upper and lower layers is inconsistent, which is called a DSPD, referring to the phenomenon of pore diameter deviation in the thickness direction. The type and magnitude of the DSPD are influenced by many factors such as spindle speed, feed rate, stacking sequence, and plate thickness. Based on previous exploratory experiments and the research of scholars, two main types of DSPD can be identified in CFRP/Ti laminate drilling, namely, the pore-enlarging type and the pore-shrinking type. The pore-enlarging type defects refer to the situation where the diameter of the CFRP layer pore (D0) is larger than that of the Ti layer pore (D1), as shown in Figure 1(a). The pore-shrinking type defects refer to the situation where the diameter of the CFRP layer pore (D0) is smaller than that of the Ti layer pore (D1), as shown in Figure 1(b). In both types of defects, the Ti layer pore diameter has relatively small variation and is close to the standard pore diameter, and the main difference lies in the CFRP layer pore diameter, which varies between 5.95 mm and 6.16 mm. Schematic diagram of DSPD. (a) The pore-enlarging type. (b) The pore-shrinking type.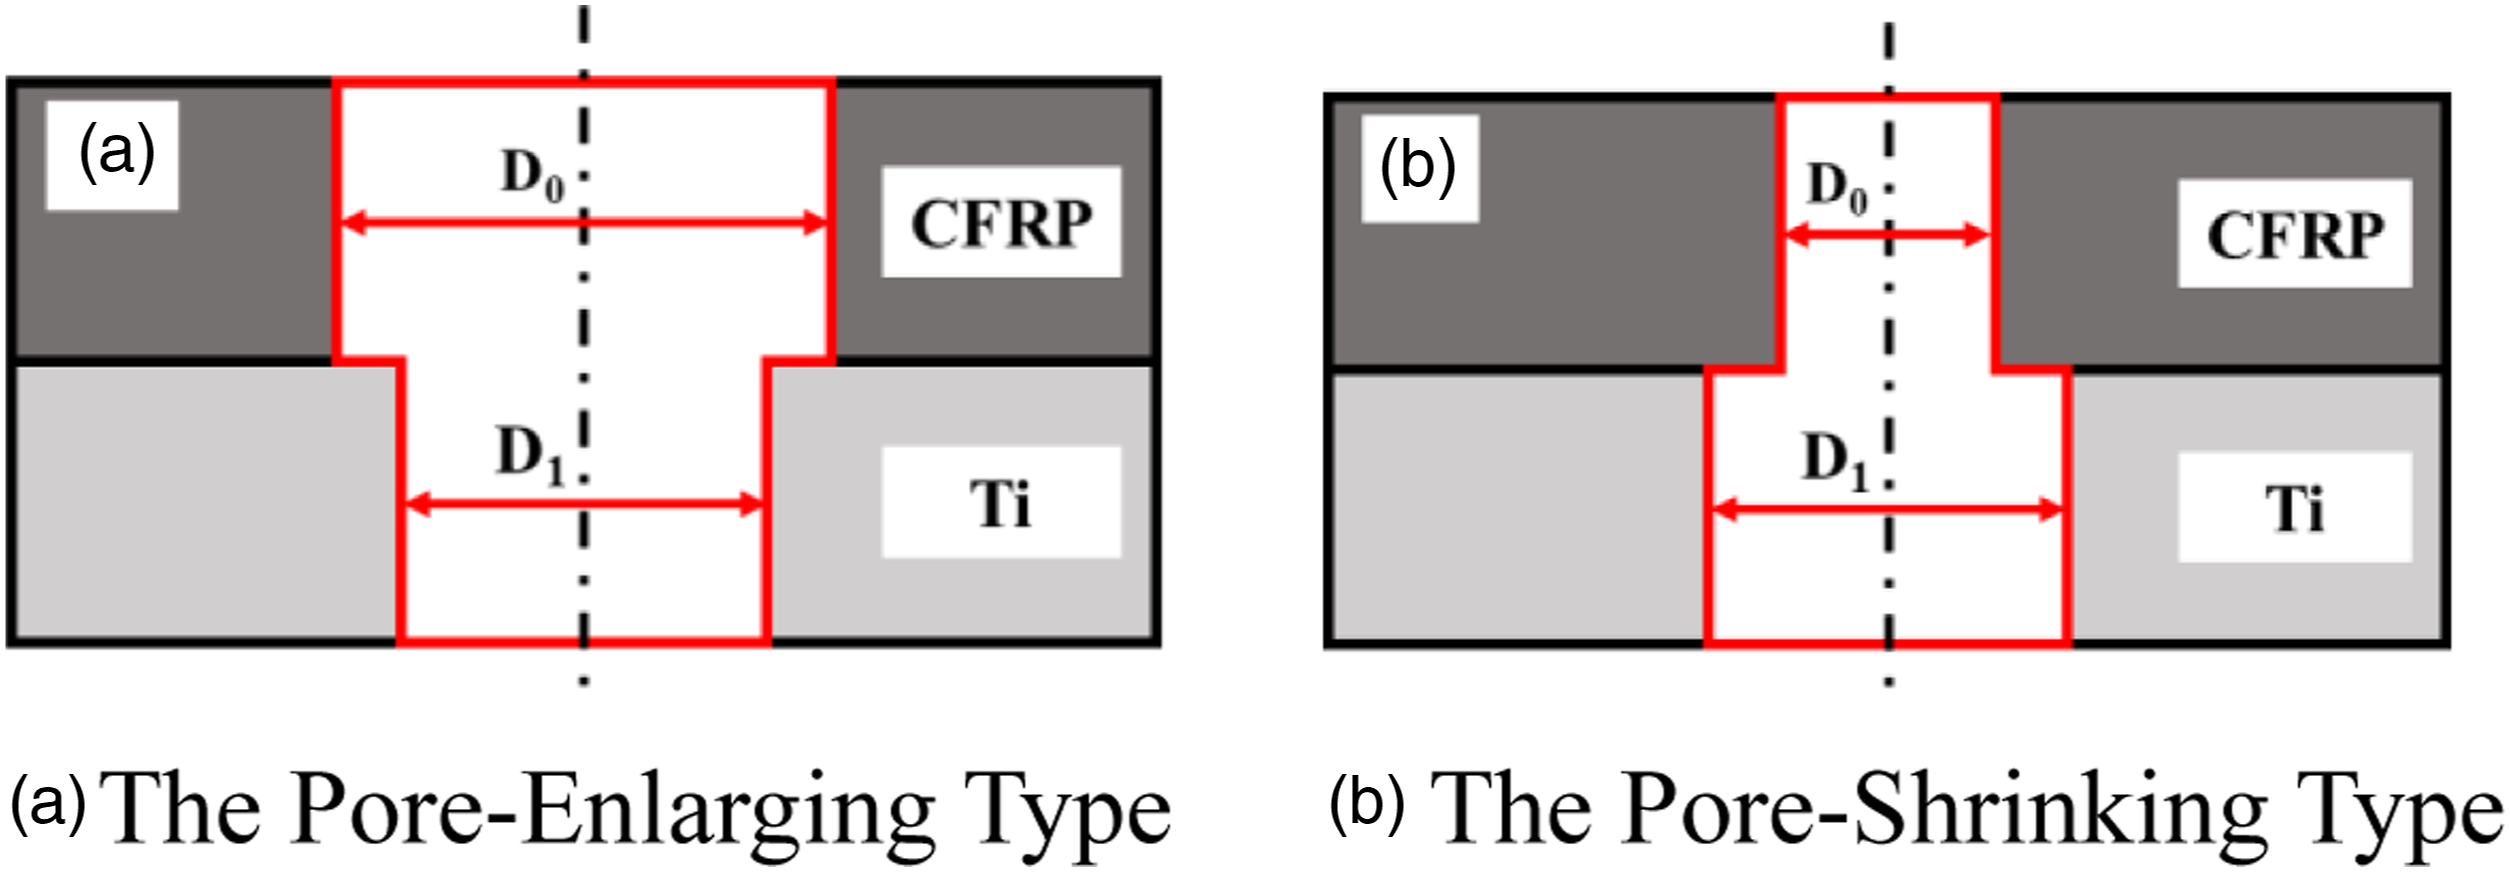
Initial damage of laminated components associated with double-step pore defects
Simulation modeling and related settings
Initial damage refers to the damage contained in the specimen before it is subjected to cyclic loading. For CFRP/Ti layered components, the main source of damage is the tightening of bolts. The presence of DSPD changes the stress distribution under the preload, resulting in stress concentration areas. Investigating the process of initial damage in specimens containing DSPD under the action of bolt tightening is of great significance for understanding the impact mechanism of DSPD on connectivity performance and revealing the evolution law of damage. Based on this, the ABAQUS finite element software was used to simulate and analyze the bolt tightening behavior of specimens without defects and specimens containing DSPD, and the stress distribution and initial damage situation around the pores were studied. The relevant settings of the finite element model are as follows.
Three-dimensional model of layered components
Based on the actual size of the component, appropriate simplification processing was performed to establish the three-dimensional model of each component and assemble it into a complete assembly. In this process, in addition to establishing a model of components containing standard pores (as shown in Figure 2), a model of components containing DSPD was also established (as shown in Figure 3). The selected model included common types and levels of defects. In the DSPD model, the pore diameter of the Ti layer was 6.00 mm and that of the CFRP layer was 6.15 mm. Standard pore model. The DSPD model.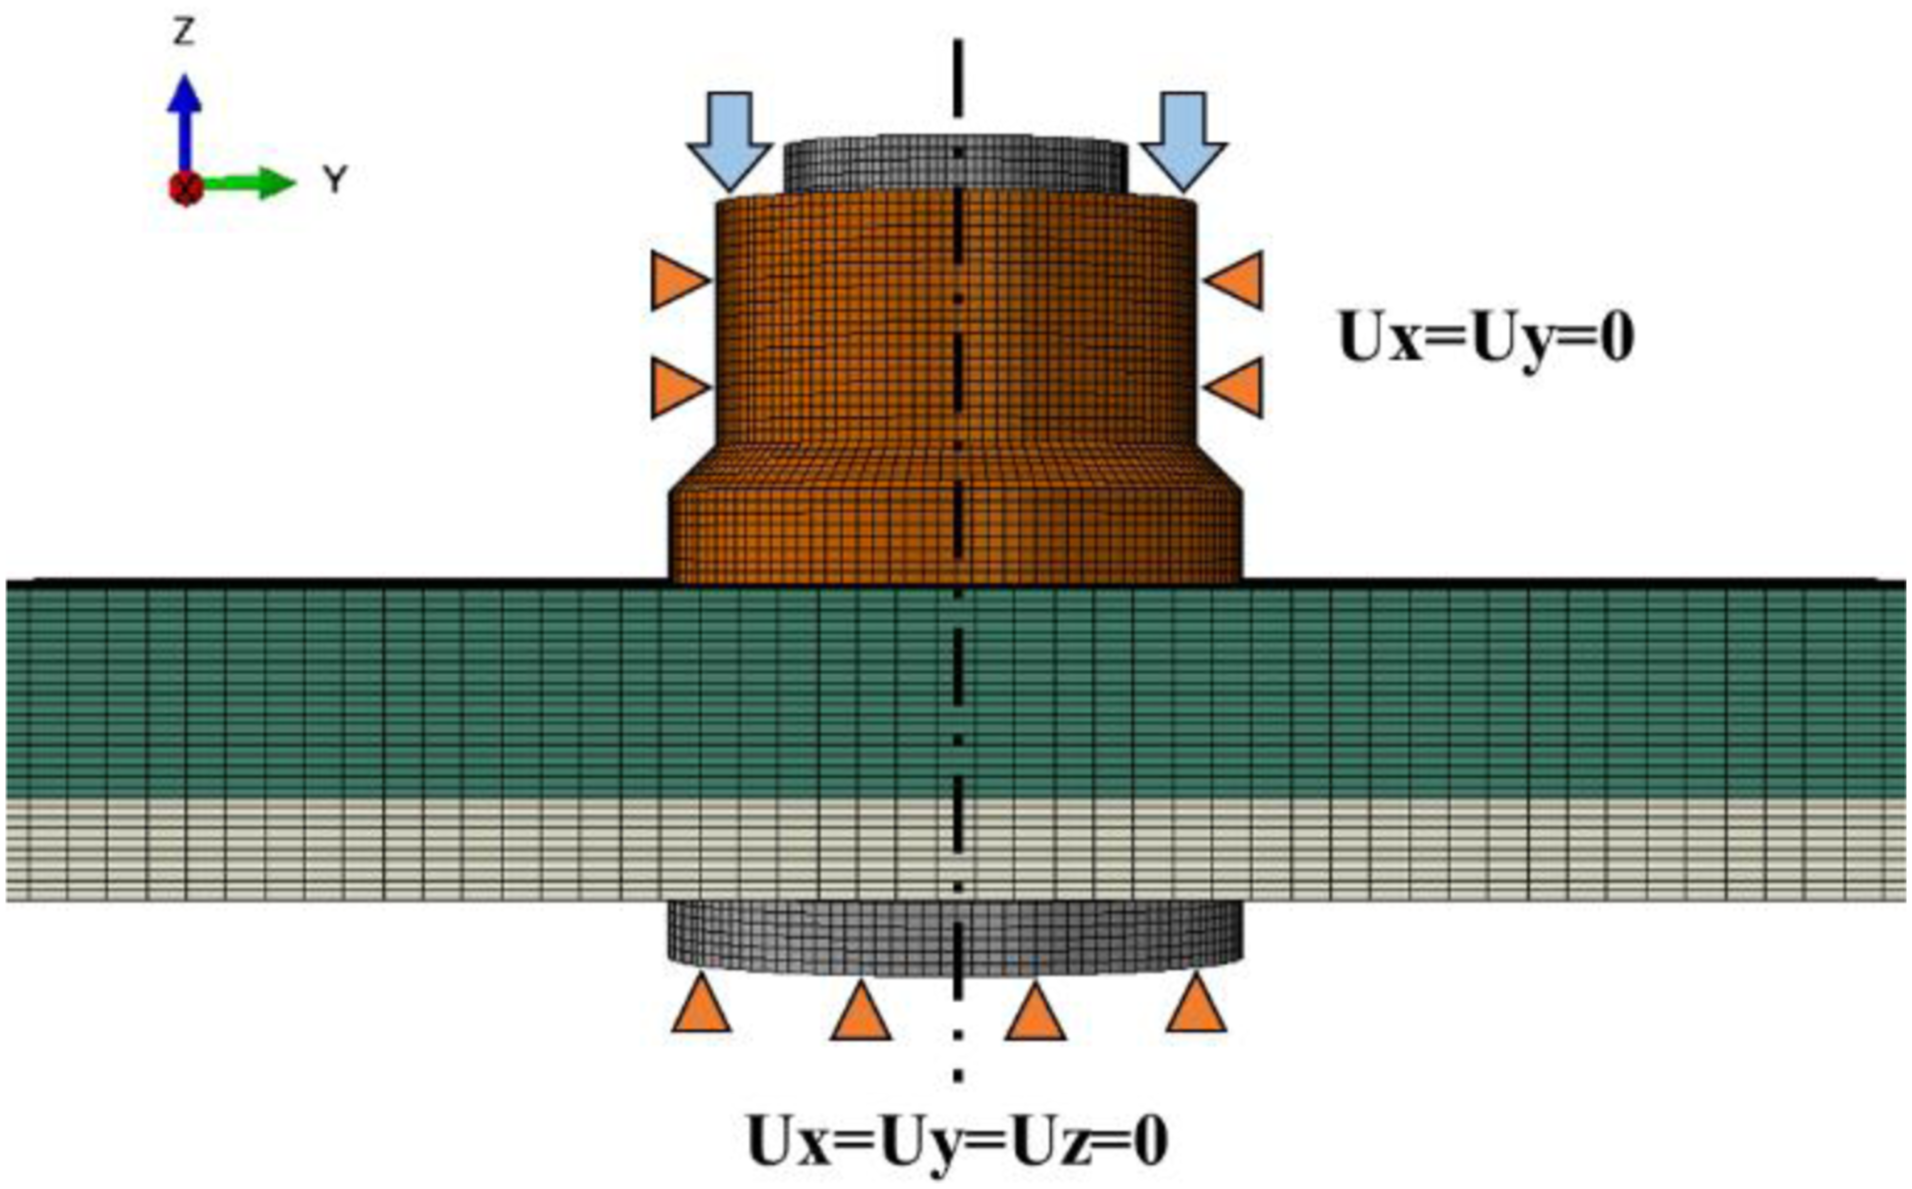
Material properties of each component
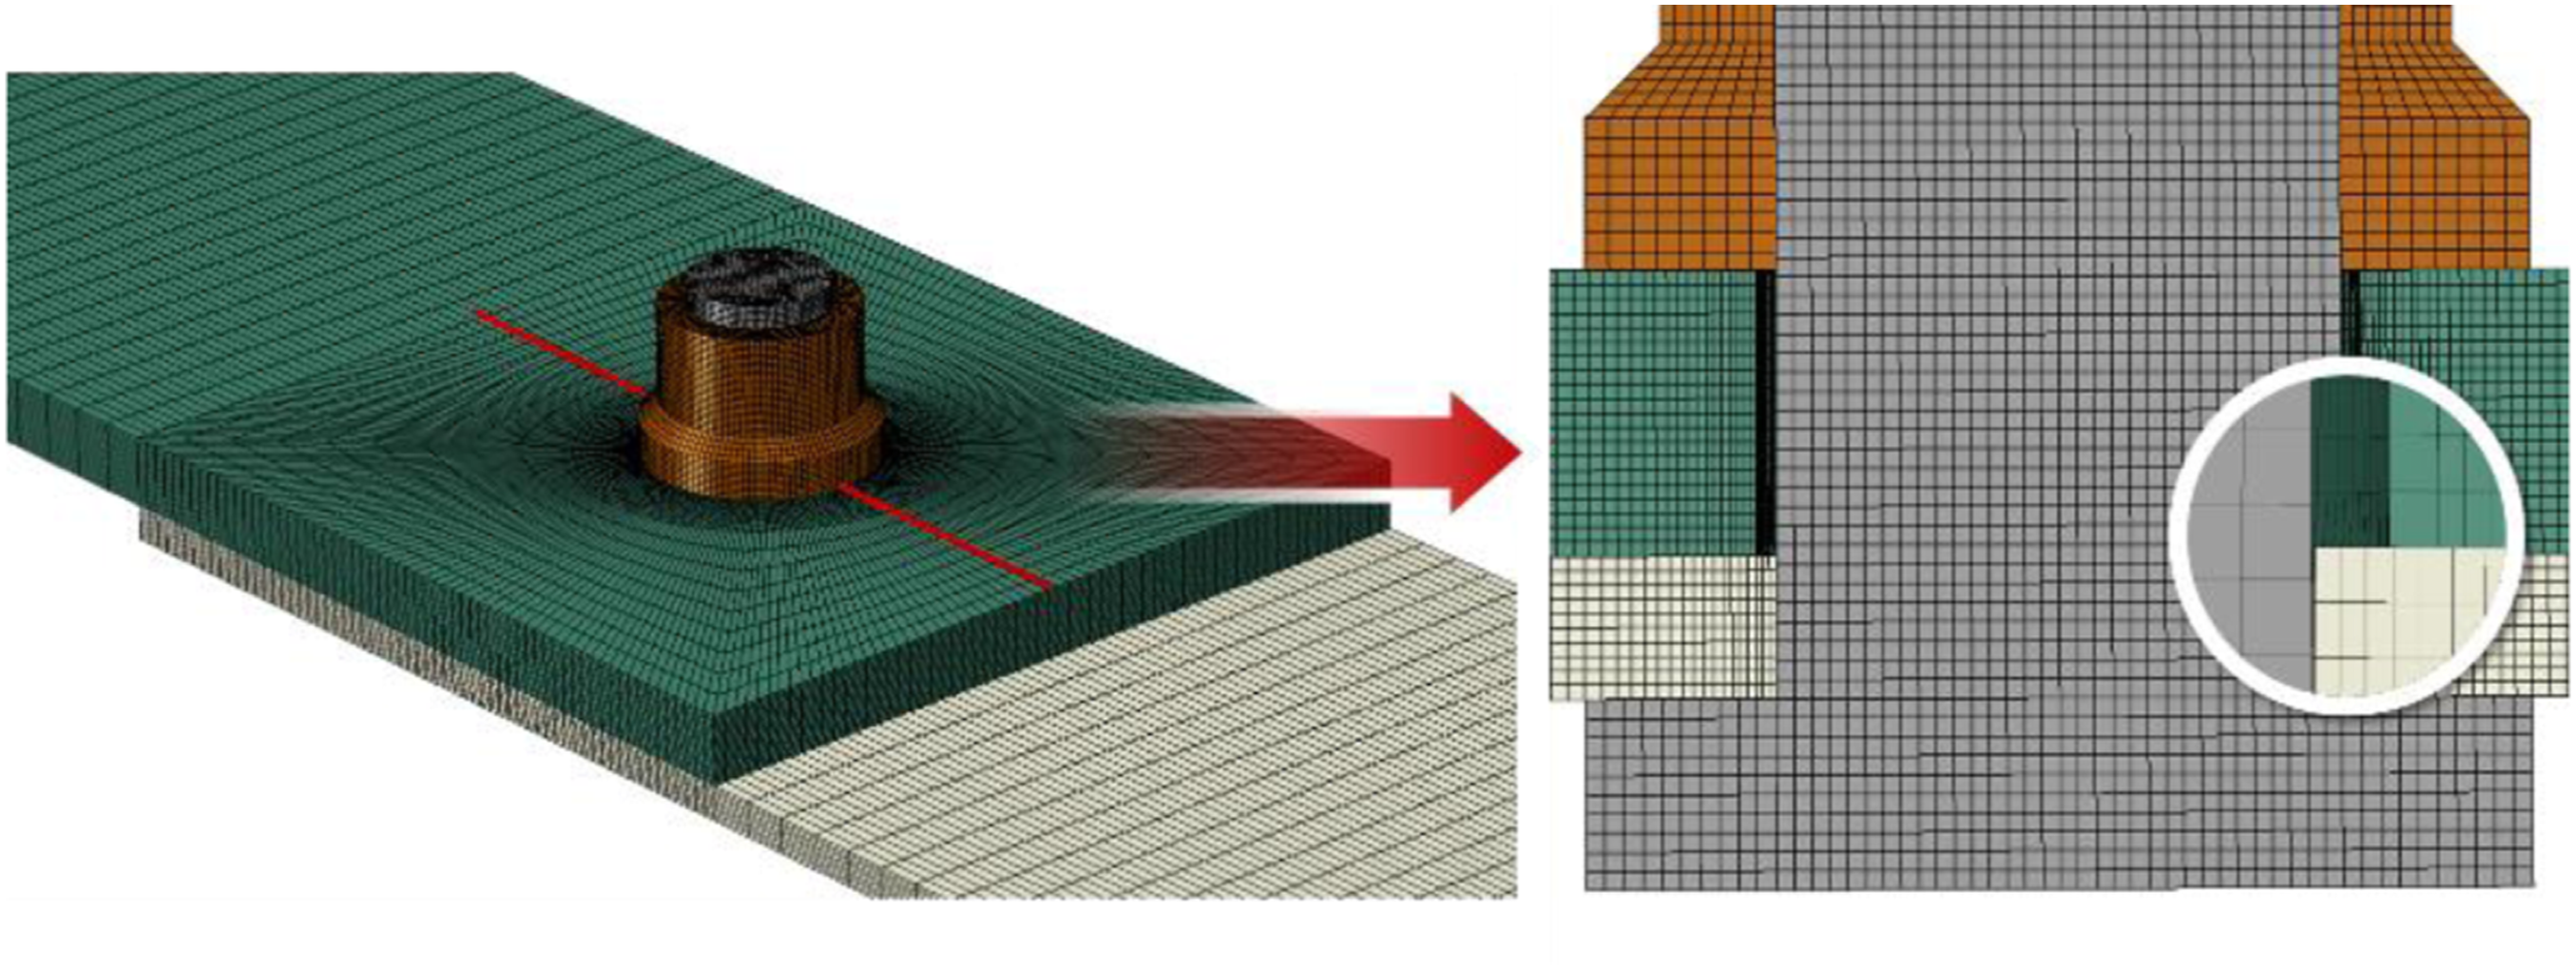
The connecting materials are set as T800 composite material and TC1 titanium alloy. The layer sequence and thickness of the composite material are the same as those used in the actual experiment. Since the deformation of the bolt and nut during tightening is very small, they are considered as rigid materials and the material is set as TC1 titanium alloy with a bolt diameter of 5.98 mm. The mesh division is performed for each component, and the element type for all components is set as C3D8R, using hexahedral mesh. In meshing, global seeding is performed first, and then local seeding is performed on specific edges near the pore to achieve mesh refinement around the pore, as shown in Figure 4. Finite element model mesh division.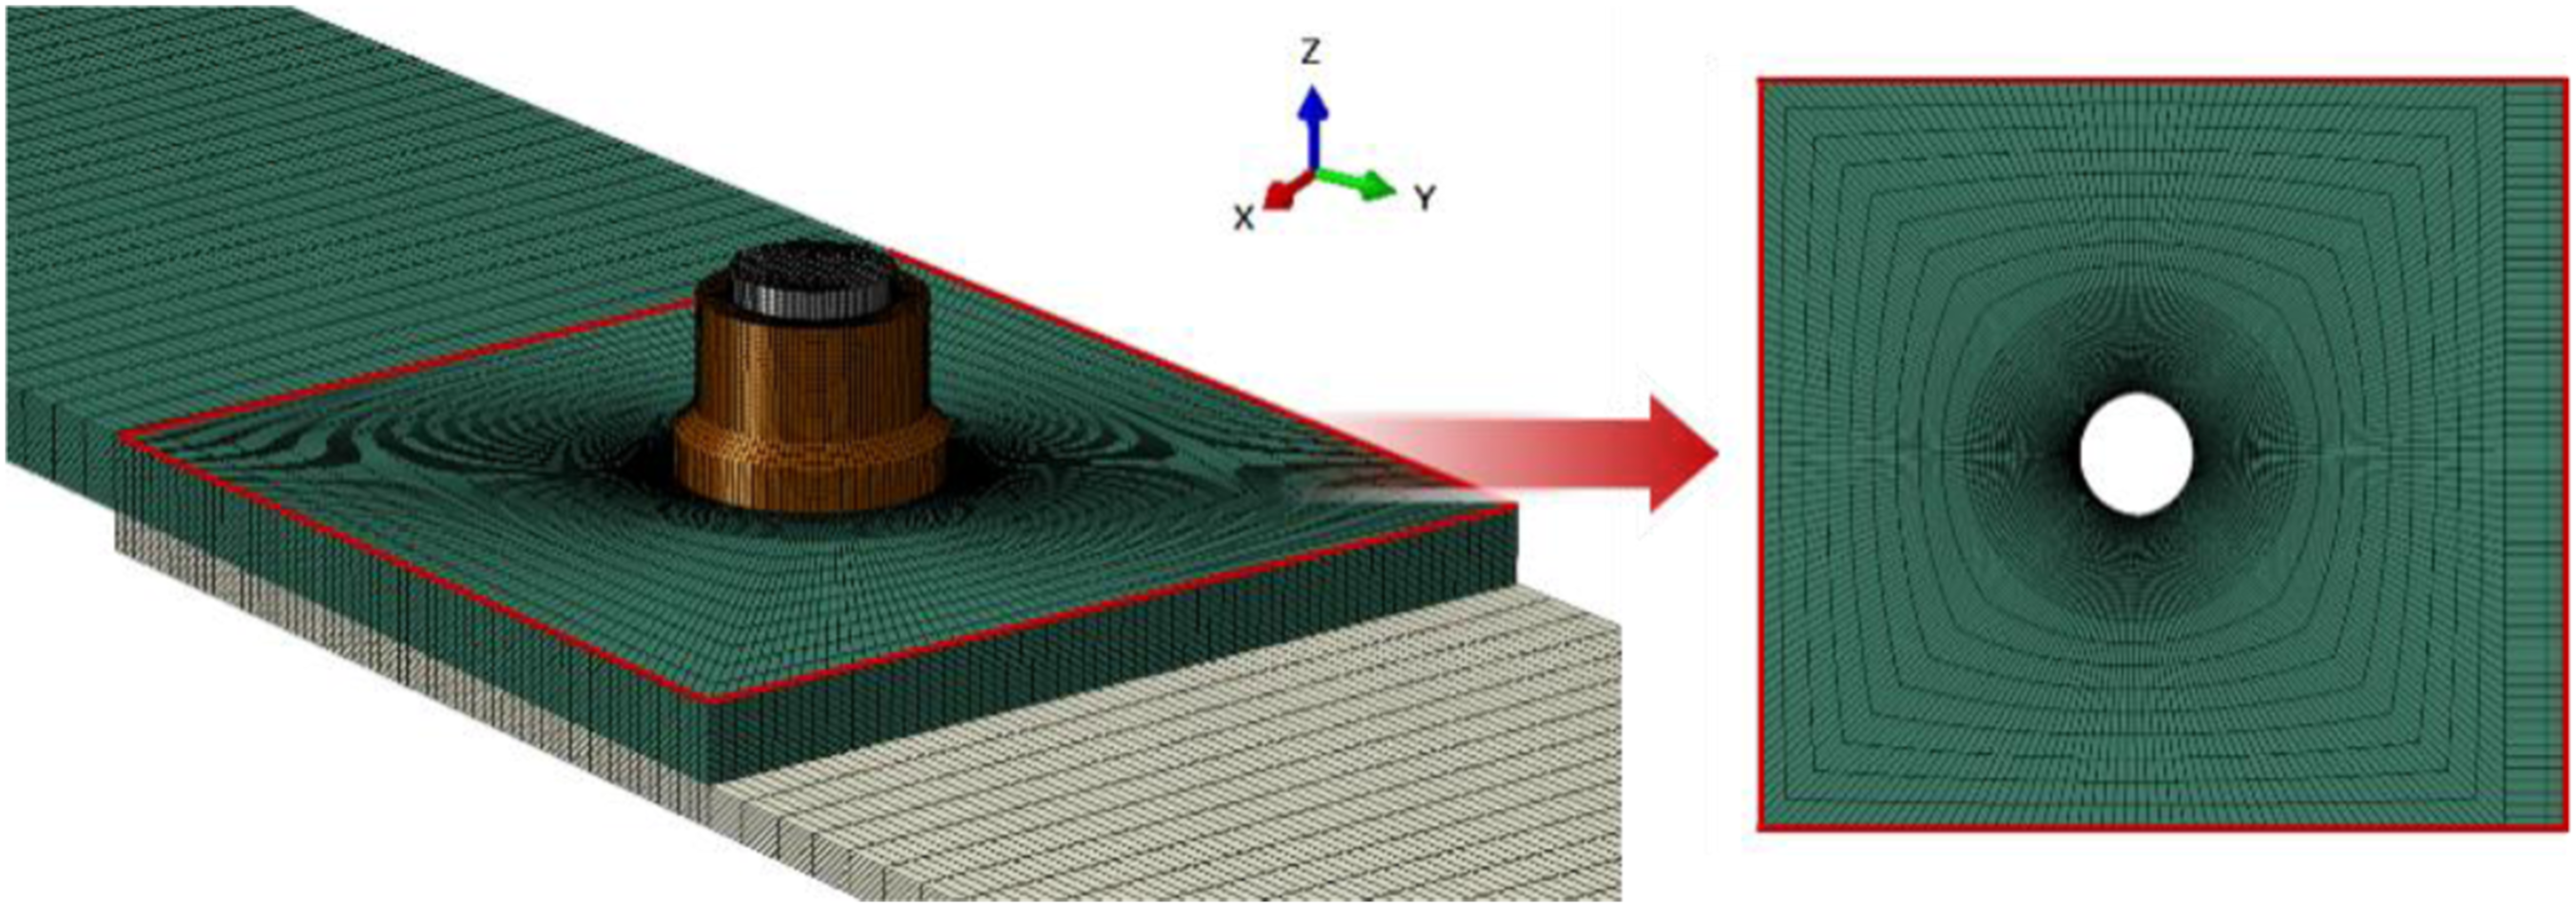
Interaction properties
Contact properties provided by ABAQUS were used, and a penalty friction model was adopted for tangential behavior with a friction coefficient of 0.35, while “hard” contact was used for normal behavior. The model contains a total of four contact relationships as shown in Figure 5, namely: contact one between the nut and the upper surface of the upper plate, contact two between the lower surface of the upper plate and the upper surface of the lower plate, contact three between the bolt head and the lower surface of the lower plate, and contact four between the bolt and the pore wall. Contact relationship in finite element model.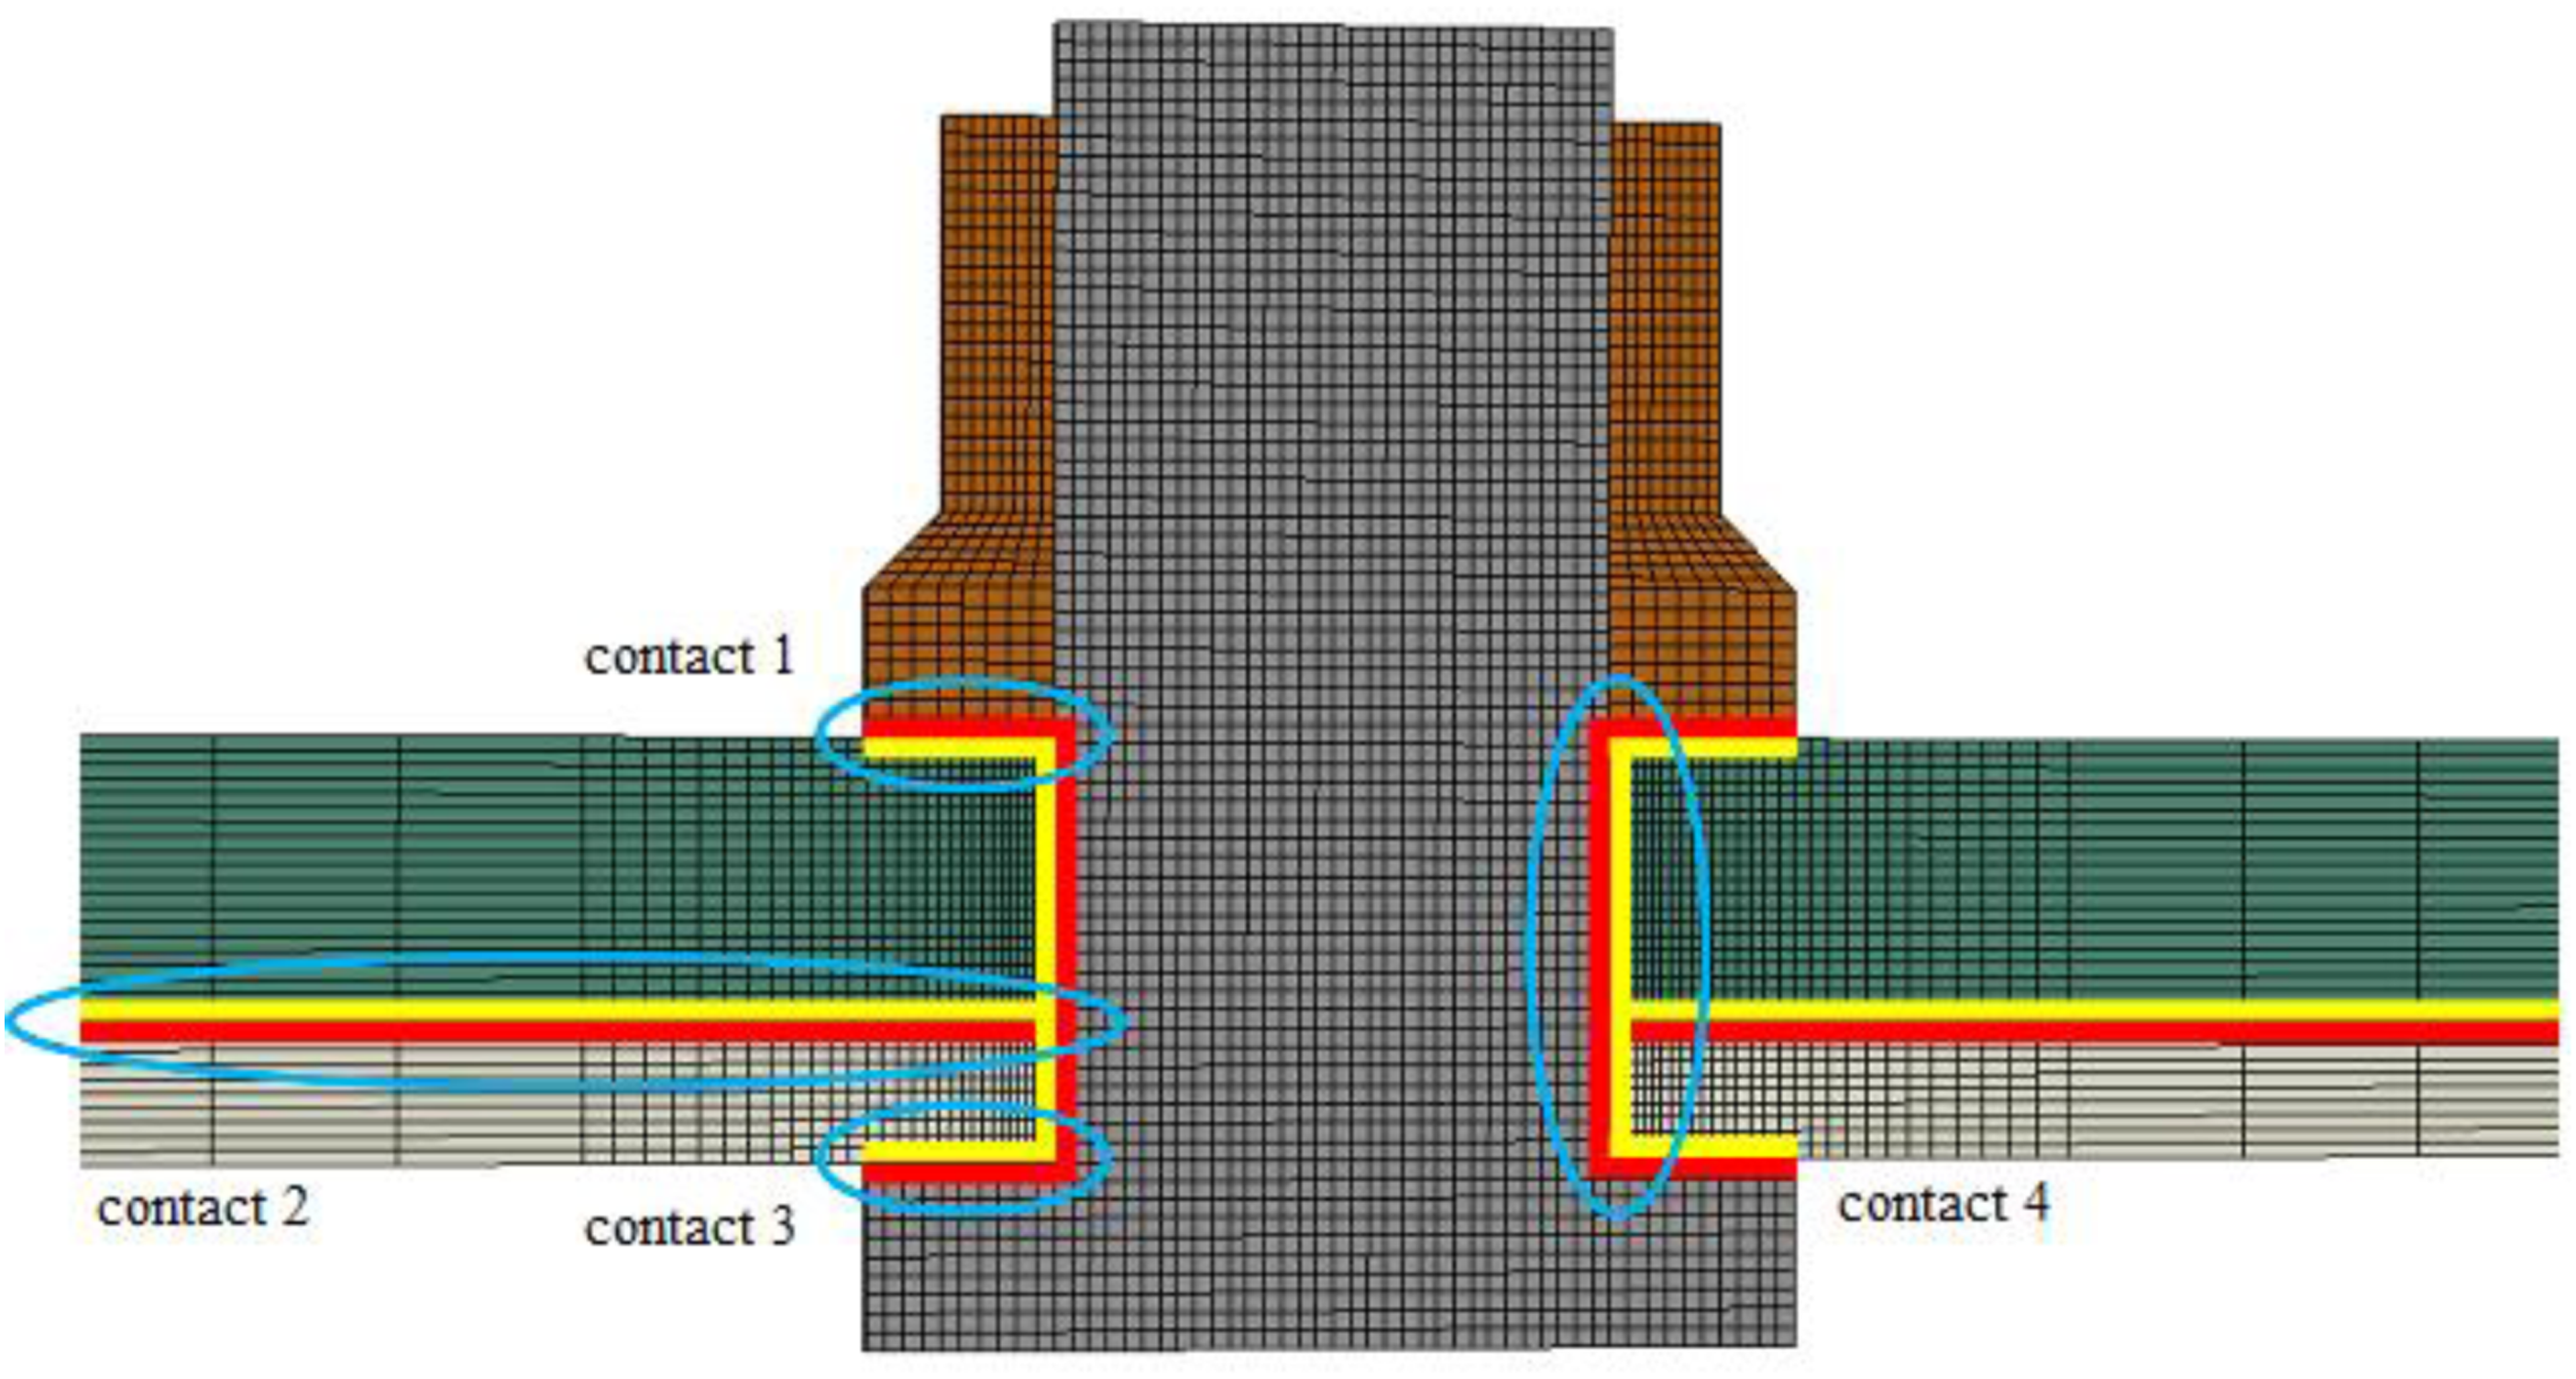
Analysis step setting
The simulation was set up with a dynamic explicit algorithm analysis step, and the total time was set to one second. In the analysis step, the bolt was fully fixed, and the displacement of the nut in the x and y directions was restricted, and a load was applied to the nut along the z direction.
The constitutive relationship and failure criterion of the composite material were implemented through the UMAT subroutine. The material used the three-dimensional Hashin failure criterion, which considers four types of failure modes: fiber tension failure, fiber compression failure, matrix tension failure, and matrix compression failure. After satisfying the initial failure criterion, the composite material undergoes damage, and the evolution of damage is predicted using a stress-strain-based bilinear softening relationship.
Initial damage analysis of components with double-step pore defects
DSPD mainly affect the fit clearance between bolt pores, causing differences in the fitting method in the thickness direction and thus affecting the connection performance.Figures 6 and 7 respectively show stress distribution maps of standard pore models and DSPD model. It can be seen from the figures that the stress distribution pattern of the DSPD model is roughly similar to that of the standard pore model, both having good uniformity and no obvious stress concentration phenomenon. However, there are also some differences, mainly reflected in Ti layer, specifically in the stepped area where it contacts with CFRP layer and in areas where it contacts with bolt heads. The distribution of stress nephogram for standard pore model. The distribution of stress nephogram for DSPD model.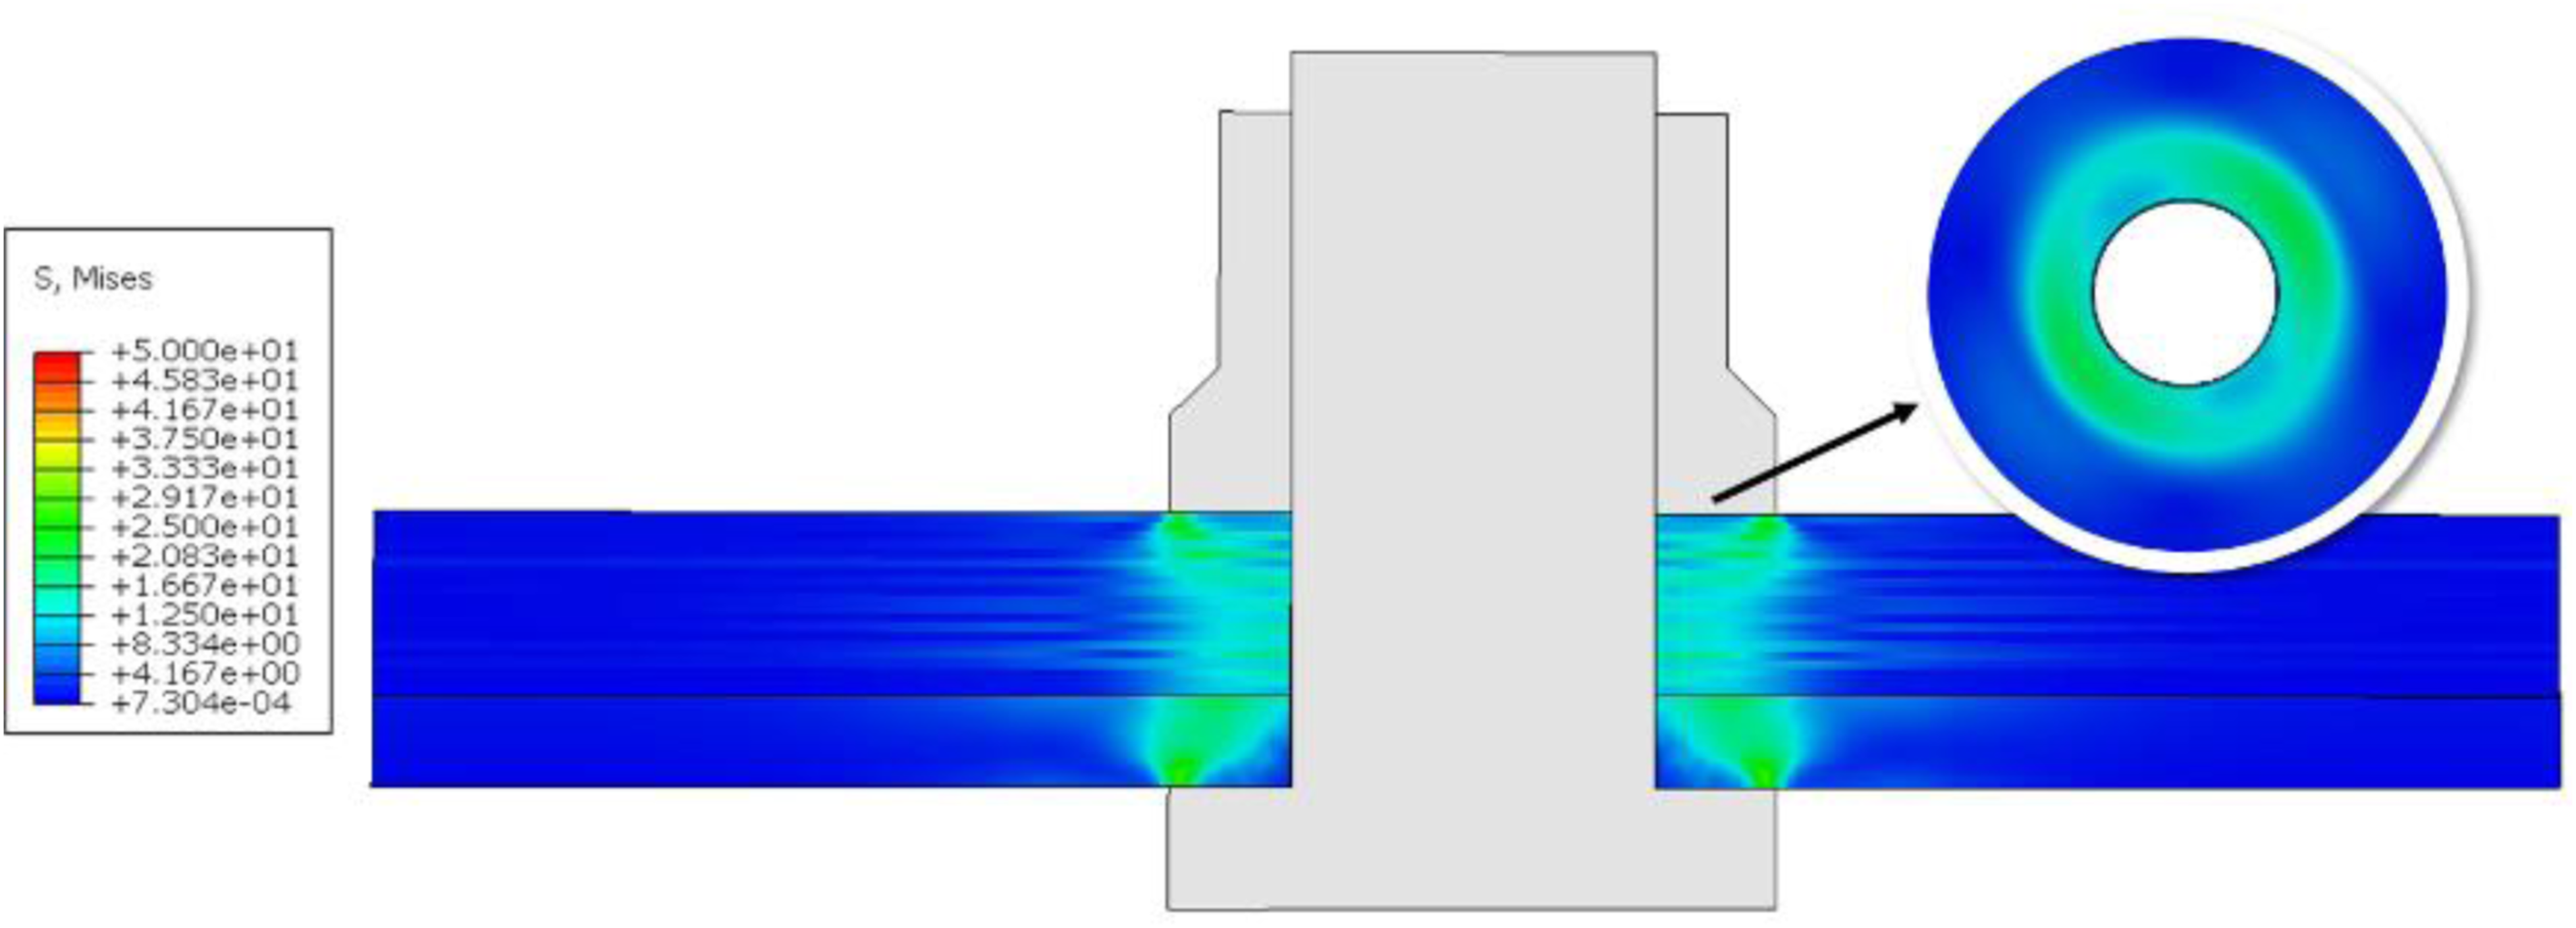
In the stepped area where two layers of boards meet, some unit cells near the pore wall did not receive pressure from the CFRP layer due to the smaller pore size of the Ti layer. This resulted in a decrease in stress levels for these unit cells along the Ti layer’s pore wall. Such a decrease may affect component stiffness during initial loading.
This point is confirmed by Figure 8. In the standard pore model, the average Mises stress near the bolt rod unit on its upper surface is 20.62. However, in the model with DSPD at the same position, the average stress level is significantly reduced to around 7.45 - only 36.13% of that in the standard pore model. Although there is a low-stress ring caused by the step region, stress levels at other positions in both models are similar. The distribution of stress nephogram on the surface of Ti layer in contact with CFRP layer.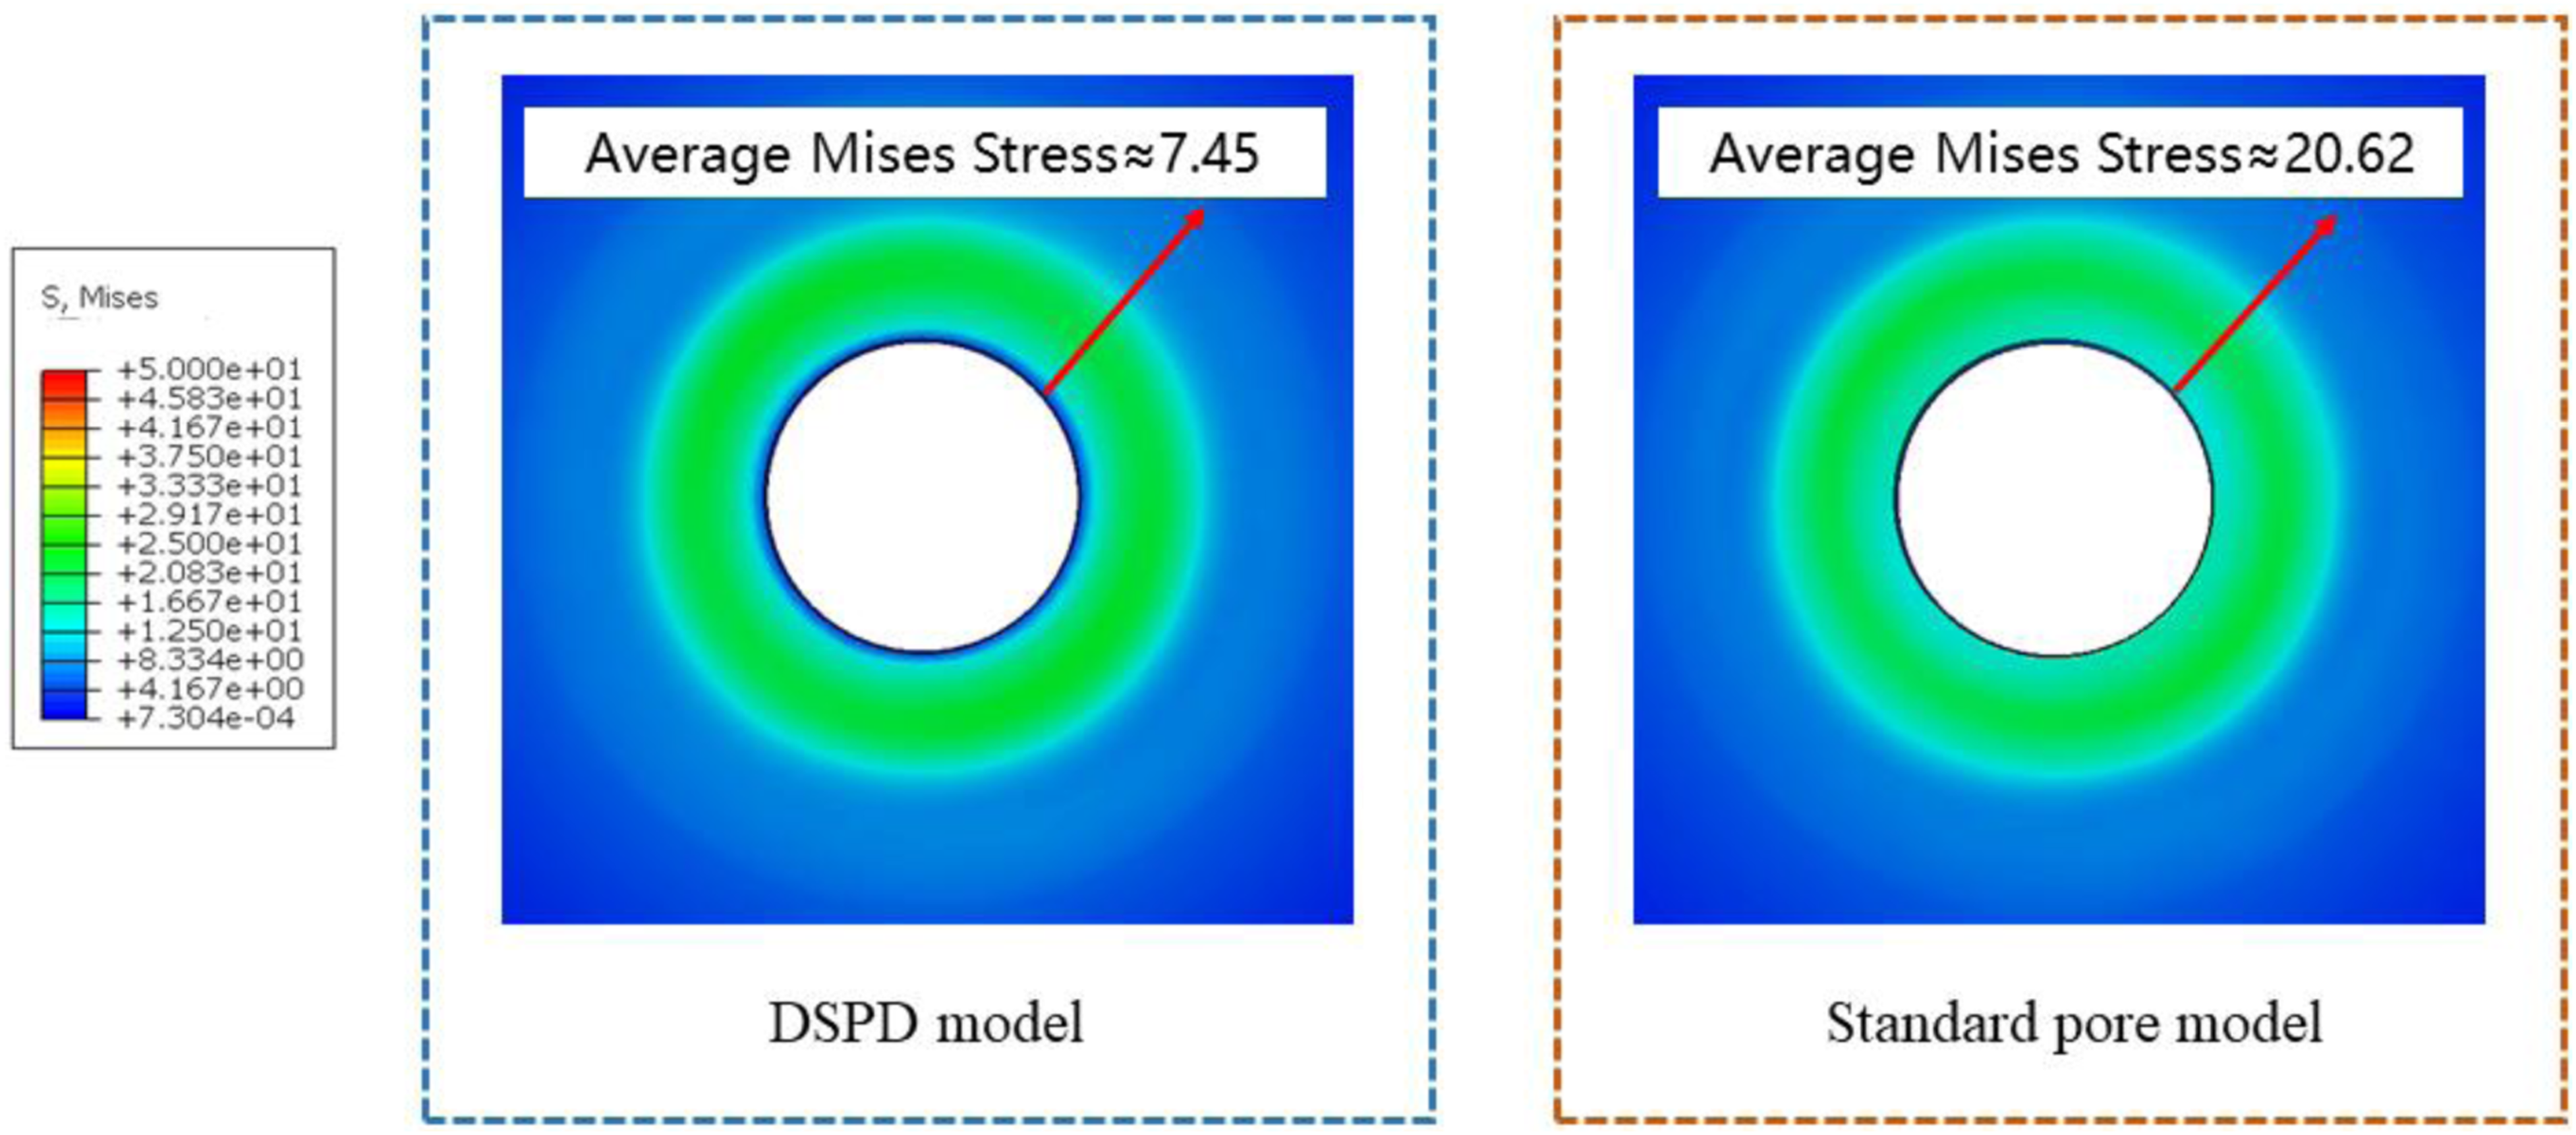
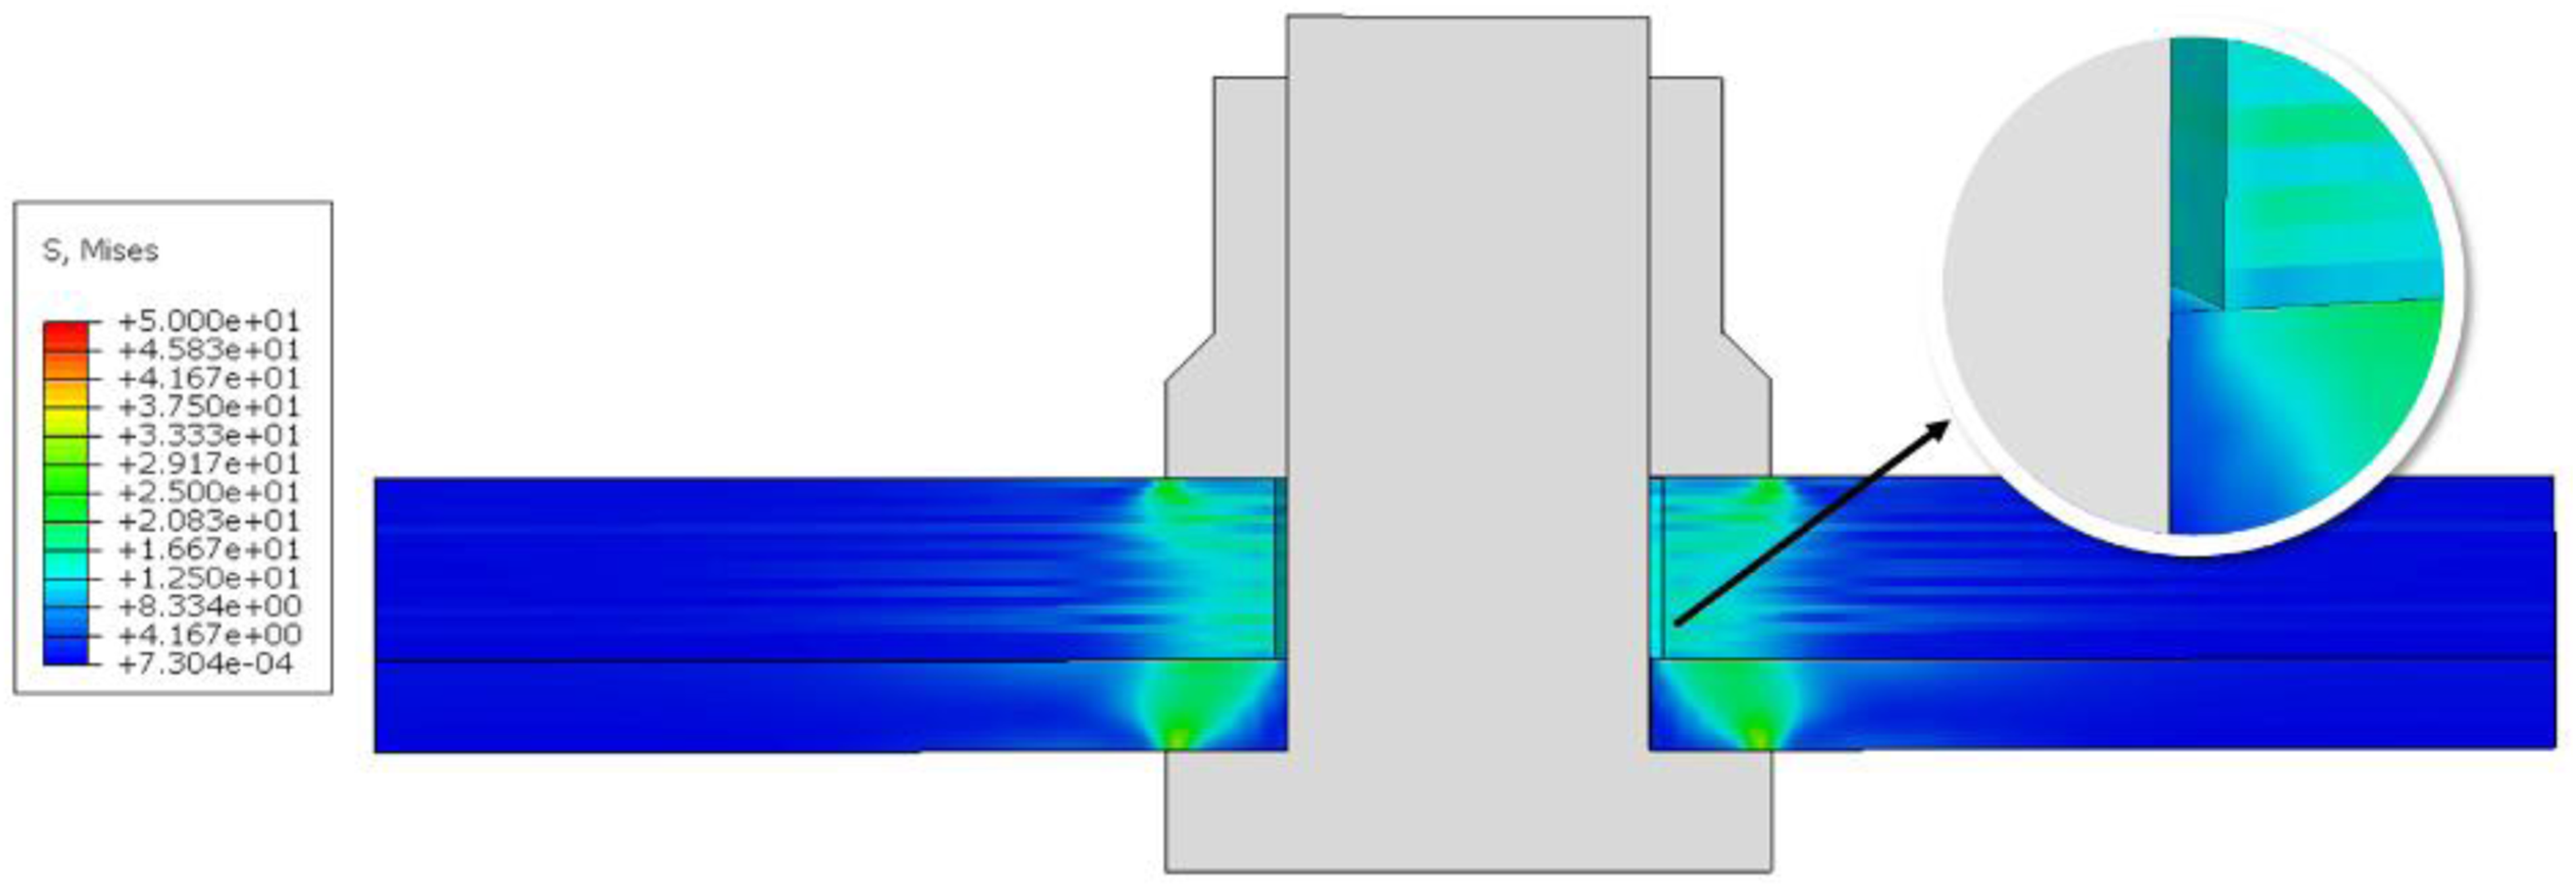
There are differences in stress distribution on the surface of the Ti layer that comes into contact with the bolt head. Figure 9 displays stress distribution cloud maps of two models in this area. The figure shows a high-stress band appearing in the edge region where it contacts with the bolt head. In comparison, the highest Mises stress for standard pore model is 35.2, while that of DSPD model reaches 44.8, which is an increase by 27.3%. This indicates that DSPD raise overall stress levels for high-stress band elements and reduce stress levels for elements closer to pores simultaneously. Since fatigue failure occurs under cyclic loading precisely in this area, changes in stresses caused by defects will impact component's fatigue performance significantly. The distribution of stress nephogram on the surface layer of Ti in contact with a bolt head.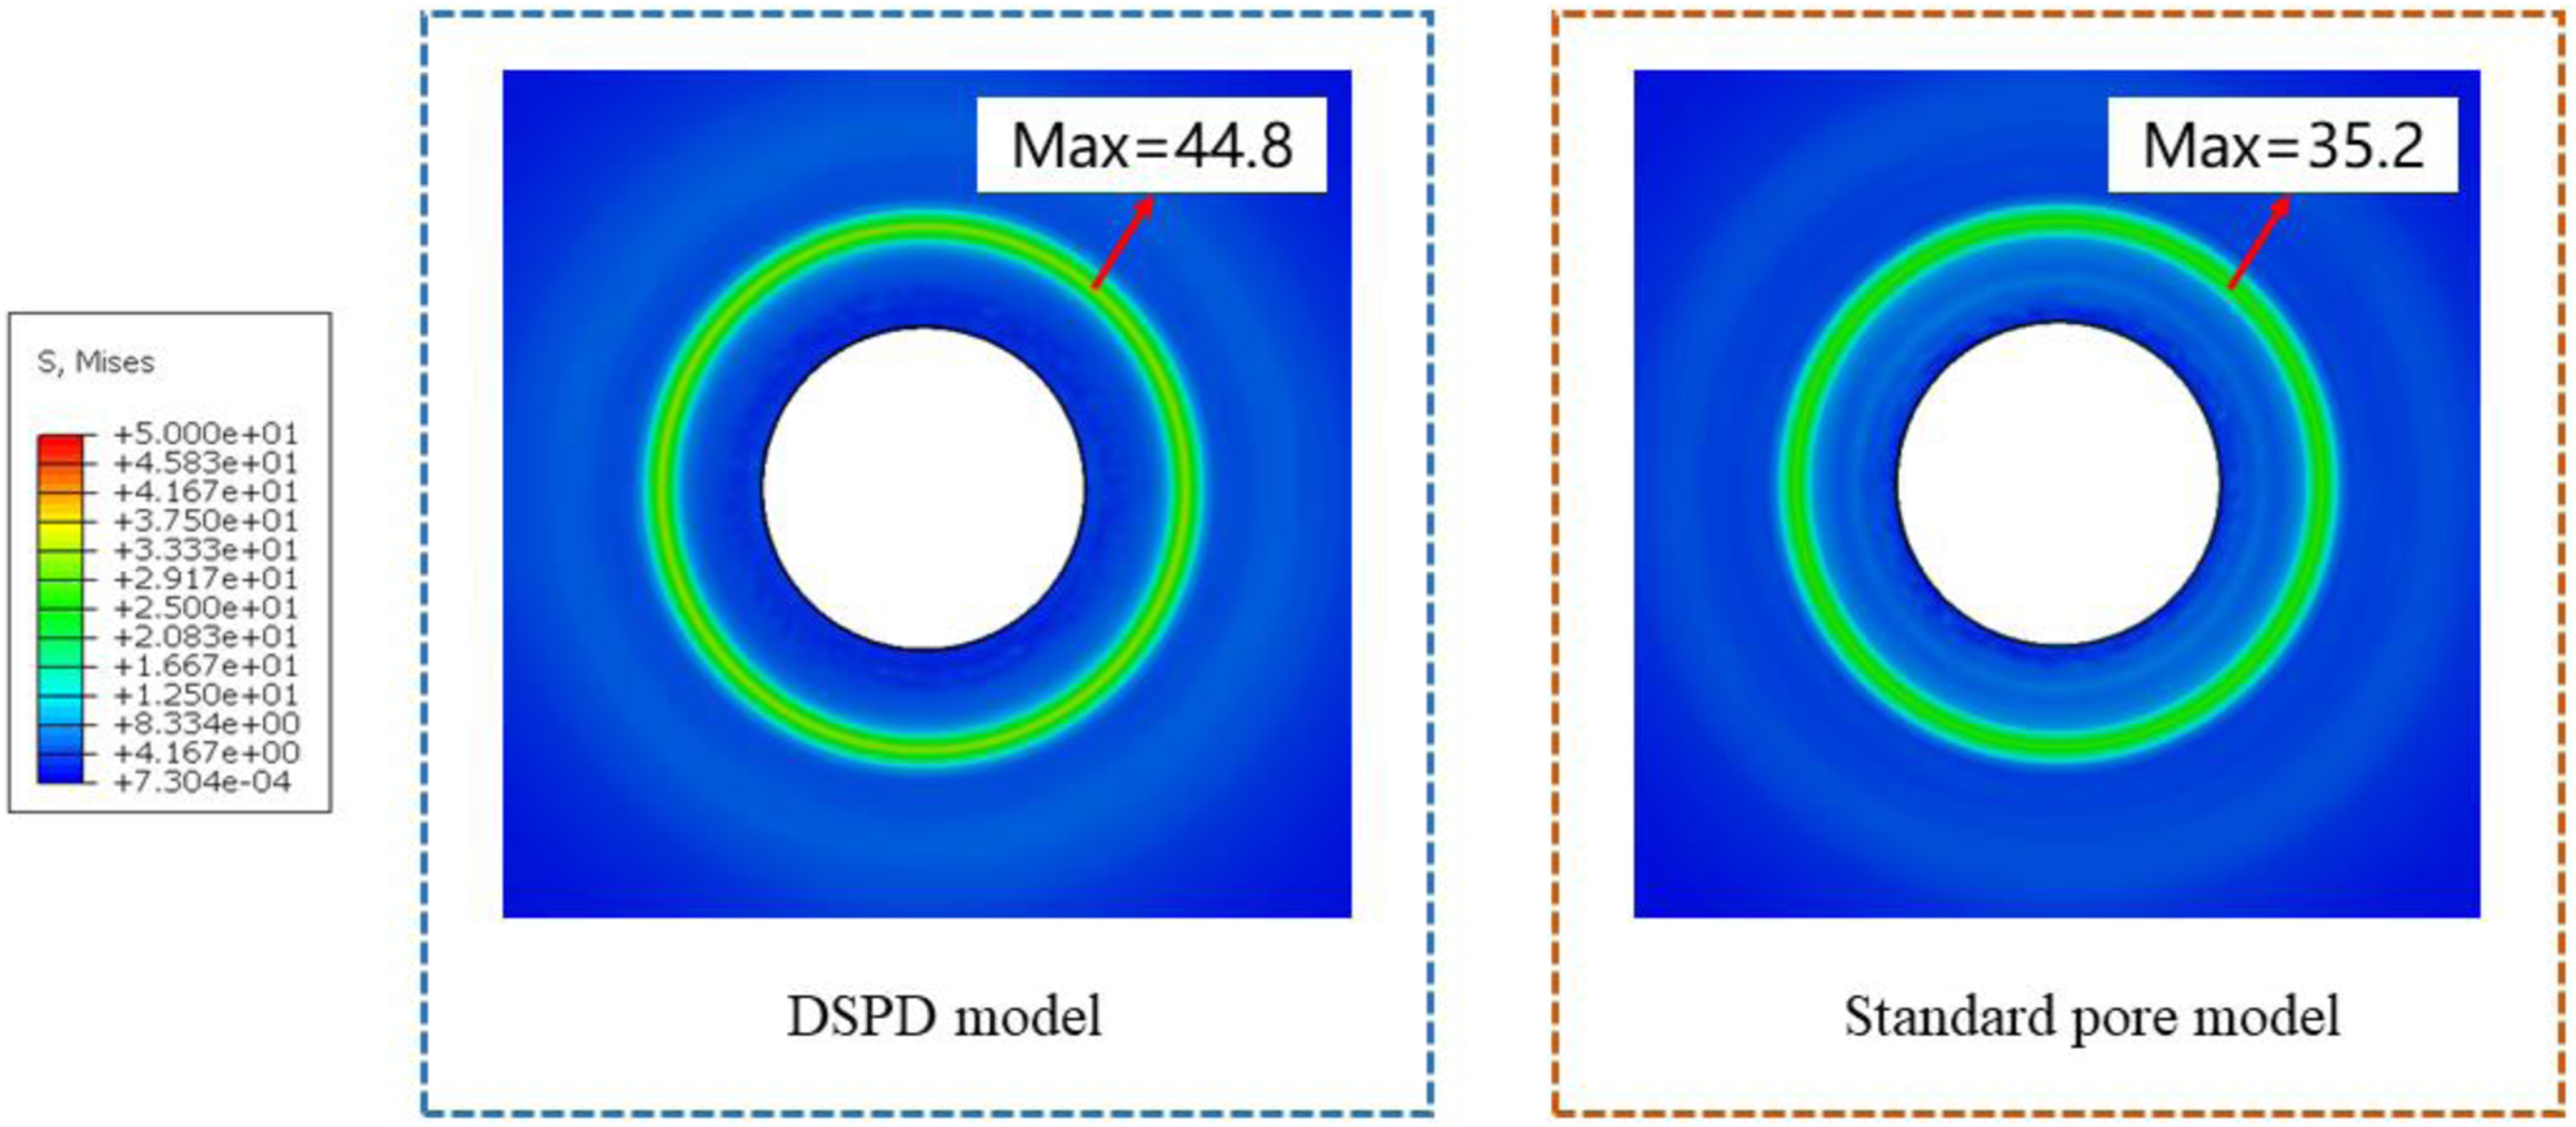
The impact of DSPD on stress distribution under external loads cannot be disregarded. As a result, this paper includes an additional analysis step to the standard pore model and the model that incorporates DSPD. During this analysis step, a tensile load was applied to the component and Figure 10 displays the simulation results. The distribution of stress nephogram in a model subjected to tensile load.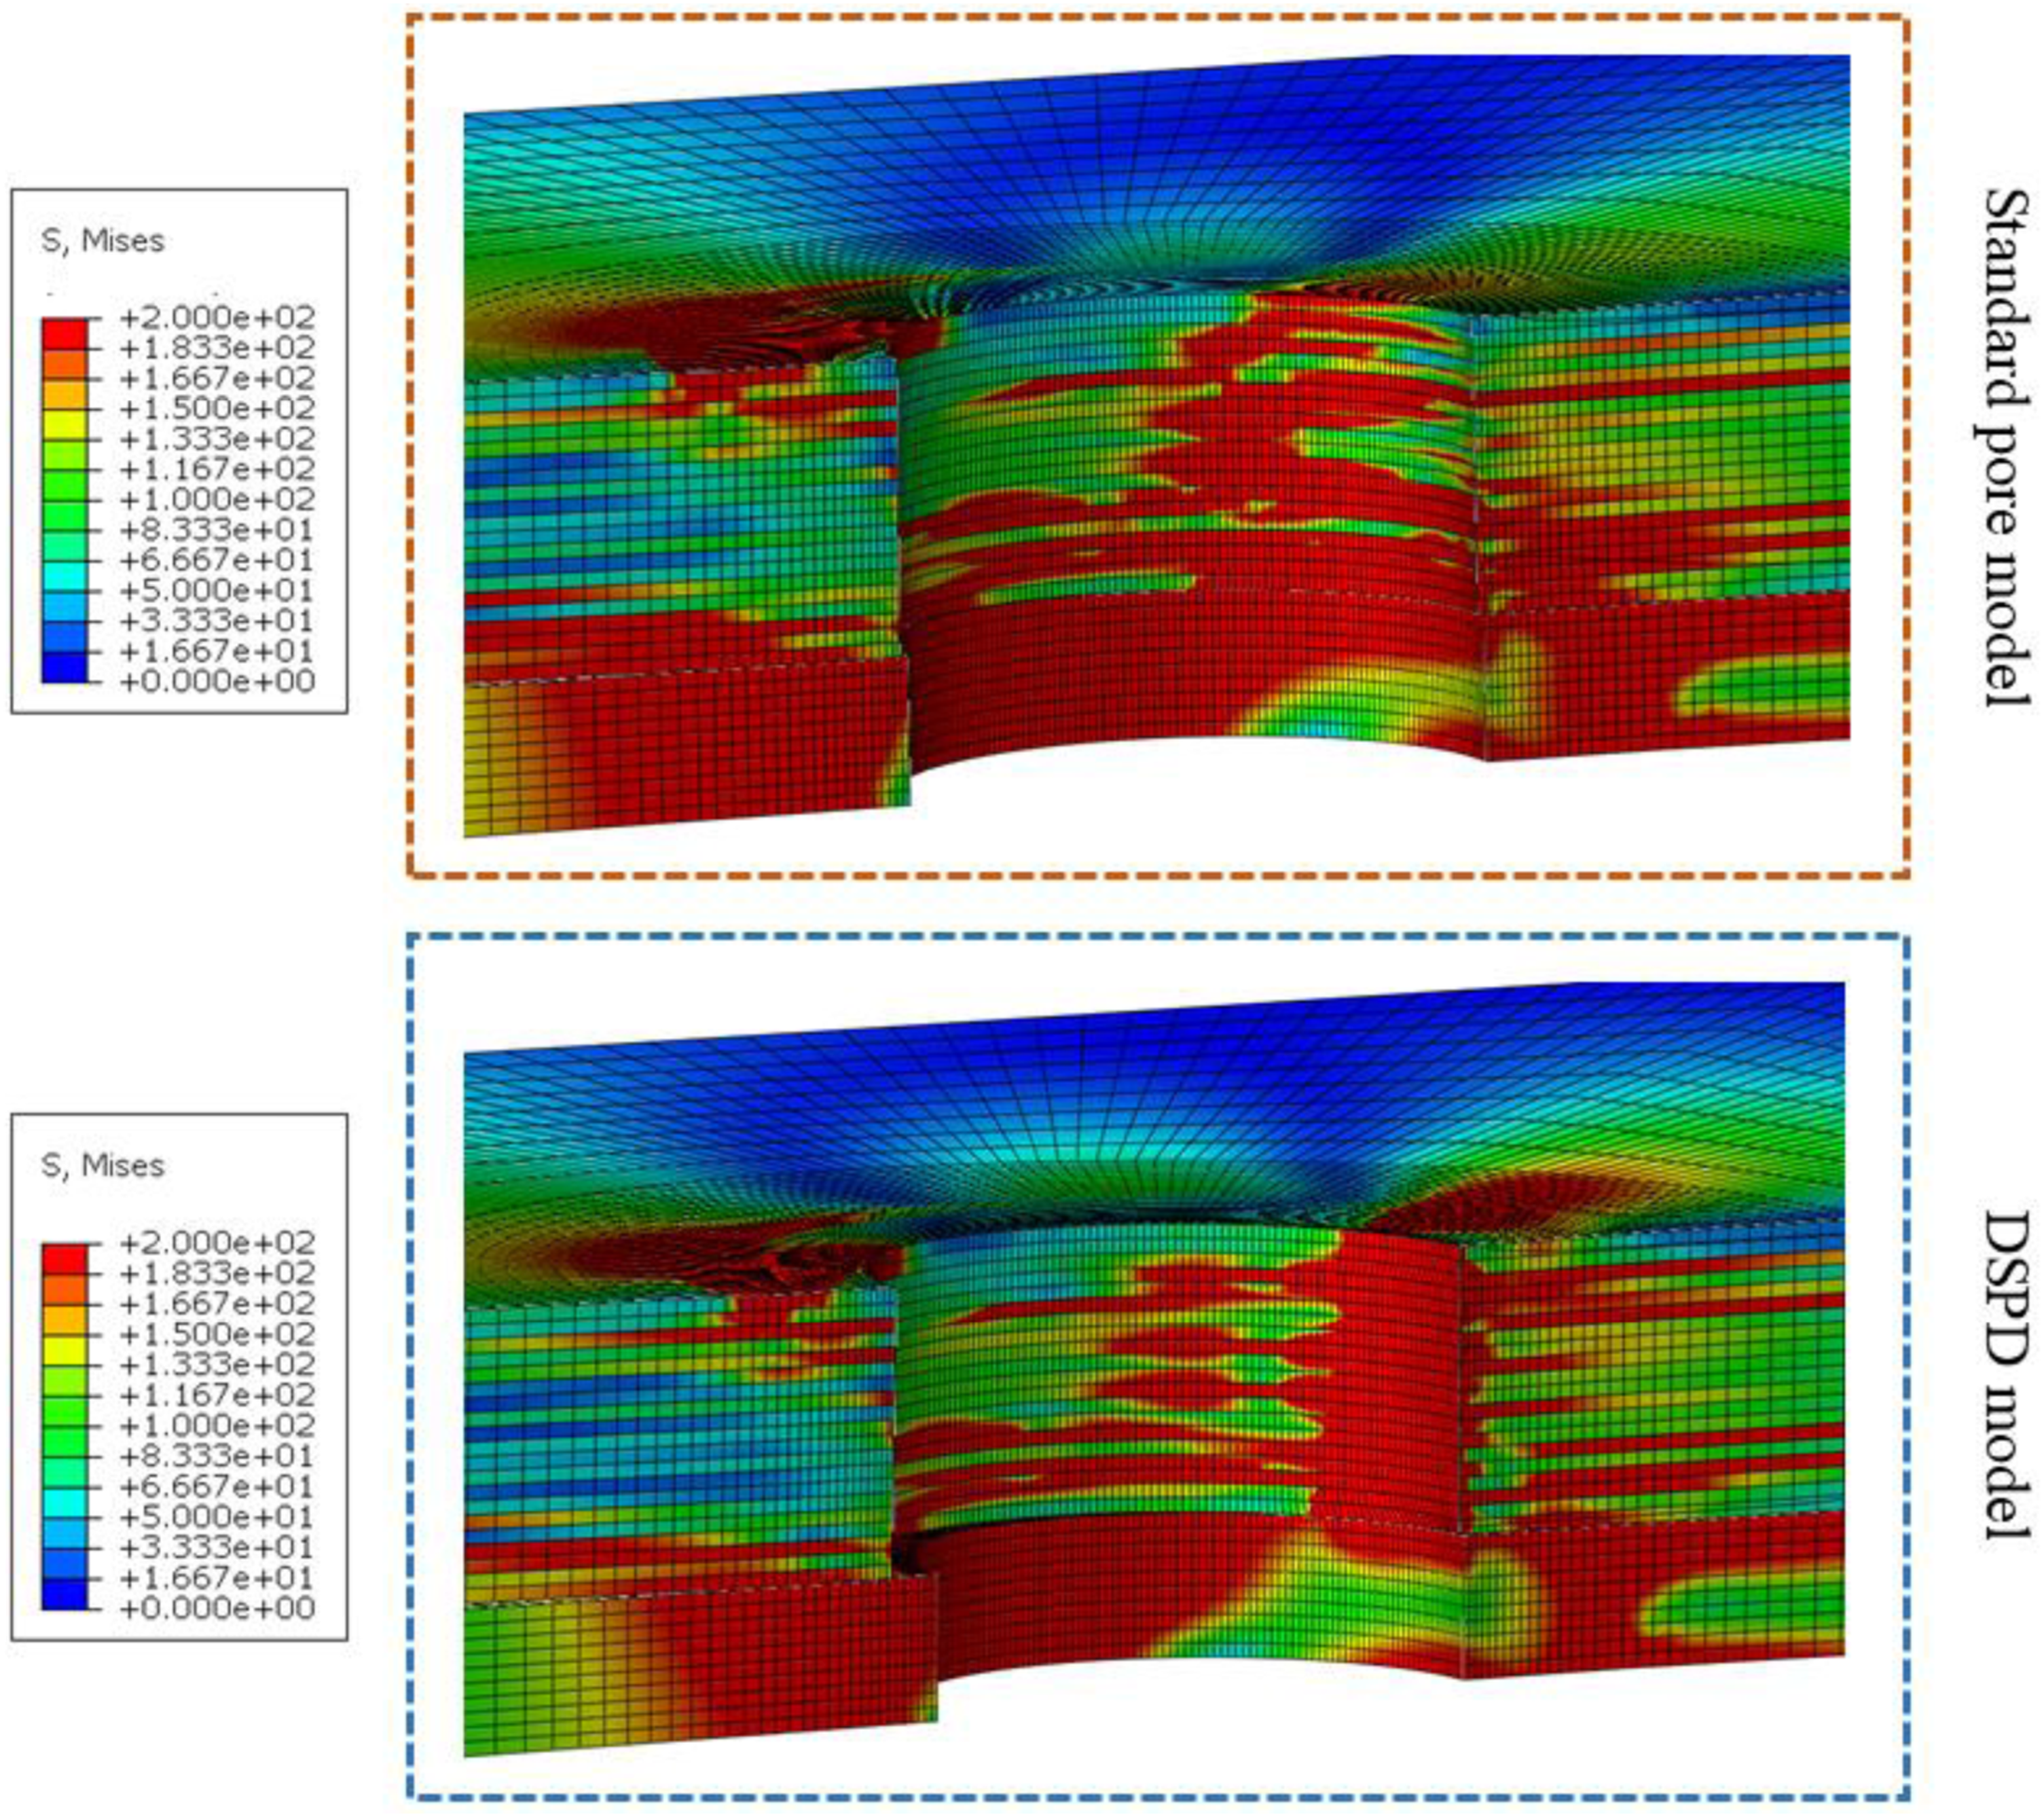
Based on the simulation results presented in Figure 10, it is evident that the DSPD impose a greater load on the pore wall, particularly on the CFRP layer. Conversely, the standard pore model has a larger bearing area which helps to distribute external loads and reduce local stress levels. The presence of DSPD increases the likelihood of bolt tilting under load and reinforces the compressive effect of bolt rods on pore walls. Additionally, this type of defects leave excessive clearance in the CFRP layer. As a result, when subjected to external loads, bolts oscillate and collide with CFRP layer pore walls leading to accelerated accumulation of plastic deformation and premature component failure.
Effect of double-step pore defects on tensile performance of laminated components
Preparation of test specimens
The study used CFRP/Ti laminated single nail shear components as test specimens, prepared according to the ASTM D 5961M-13 standard. The composite material layer was made of a high-toughness woven epoxy resin-based composite material with AC531 epoxy resin as the matrix and CCF800H carbon fiber as the reinforcement. The fibers in each layer were unidirectional and arranged in [+45/+45/0/−45/0/+90/+45/0/−45/0] s sequence. The titanium alloy layer was made from TC1 grade material.
The dimensions of the test specimen were 135*36 mm for both length and width, with a thickness of 3 mm for the composite material layer and 1.5 mm for the titanium alloy layer respectively. Each connection pore had a standard diameter of 6 mm and was located at a distance of 18 mm from the edge of the plate.
To ensure stability under load conditions and avoid biased loading caused by non-manufactured defects, specific size spacers made from epoxy resin were fixed to both clamping ends on each specimen before testing commenced. The spacer dimensions were set at 75*36 mm for both length and width, with thicknesses fixed at 1.5 mm and 3 mm respectively. Based on this, the total thickness of the laminated component is fixed at 4.5 mm (Figure 11). Test piece dimensions.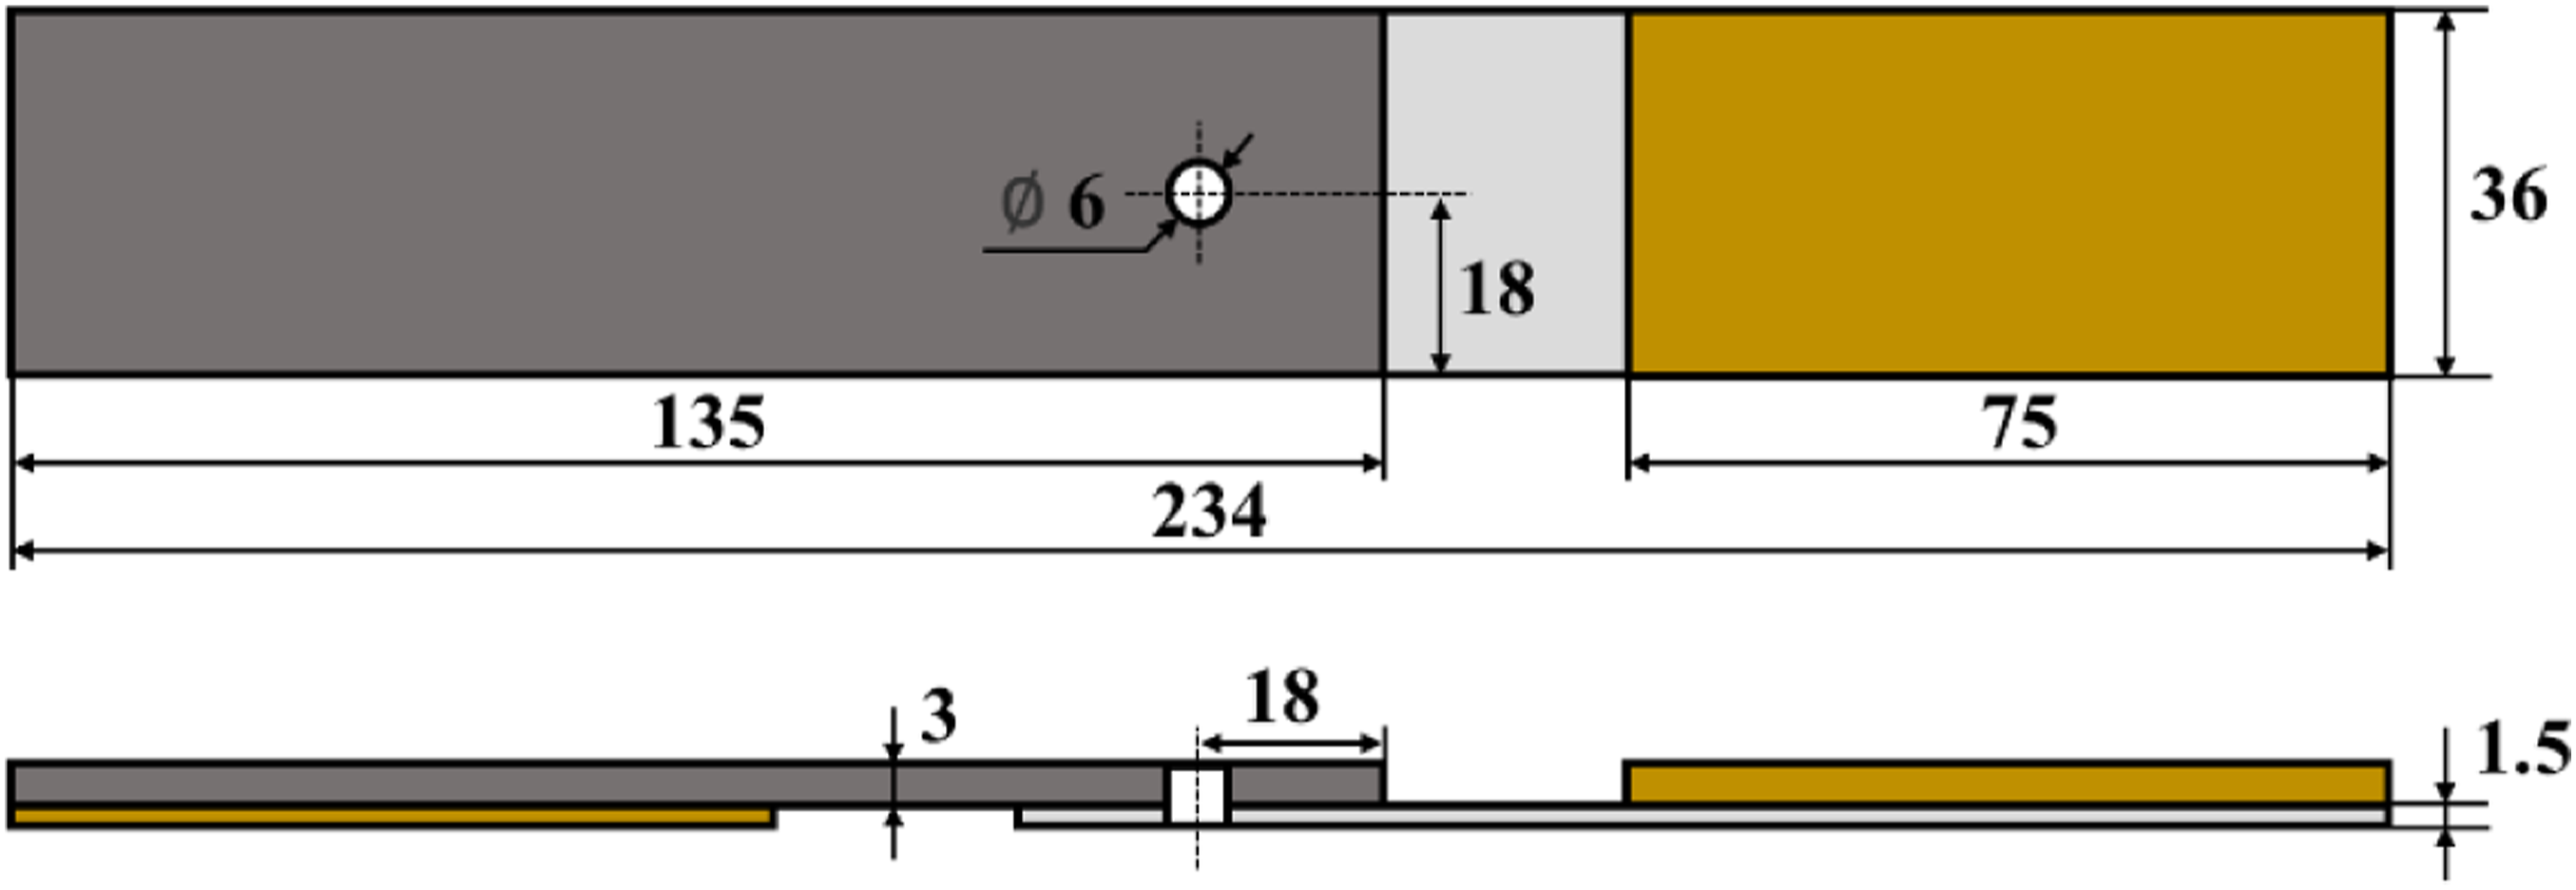
The DMU 60 mono BLOCK high-precision five-axis machining center was used to process the connection pores. The pore-making process involved two steps: first, a hard alloy drill bit (dagger drill) with a diameter of 5.5 mm was used to create an initial pore; secondly, a hard alloy step reamer was utilized to ream the pore and achieve the required pore size. Shanghai Fengqi Machinery Technology Co., Ltd provided the drilling tools for this operation. The pore size of each layer of connection pores was controlled by adjusting the size of the step reamer during drilling. To minimize burrs at exit, a special fixture held down the sheet metal while a layer of epoxy resin board was placed underneath it during drilling.
To ensure machining accuracy meets test requirements, special instruments must be used to test pore characteristics after completion of the pore-making process. In addition to strict control of processing conditions, any pores that do not meet quality standards must be scrapped and re-prepared. The SBM-8CX internal micrometer is used to measure pore diameter, while the Mitutoyo SJ-210 contact roughness tester measures roughness of the pore wall. Finally, CRYSTA-Apex V9106 coordinate measuring machine (CMM) is utilized to measure perpendicularity of the pore.
After perforating the test piece, connect it using anti-shear type countersunk high-lock bolts and matching nuts. They are made of titanium alloy with a material grade of Ti-6Al-4V, have a diameter of 5.98 mm, and a shank length of 6 mm. To avoid installation deviation caused by tightening force, use the fixture shown in Figure 12(a) to secure the plate during installation. Tightening tools. (a) Clamps for fixing sheet materials. (b) Torque wrench.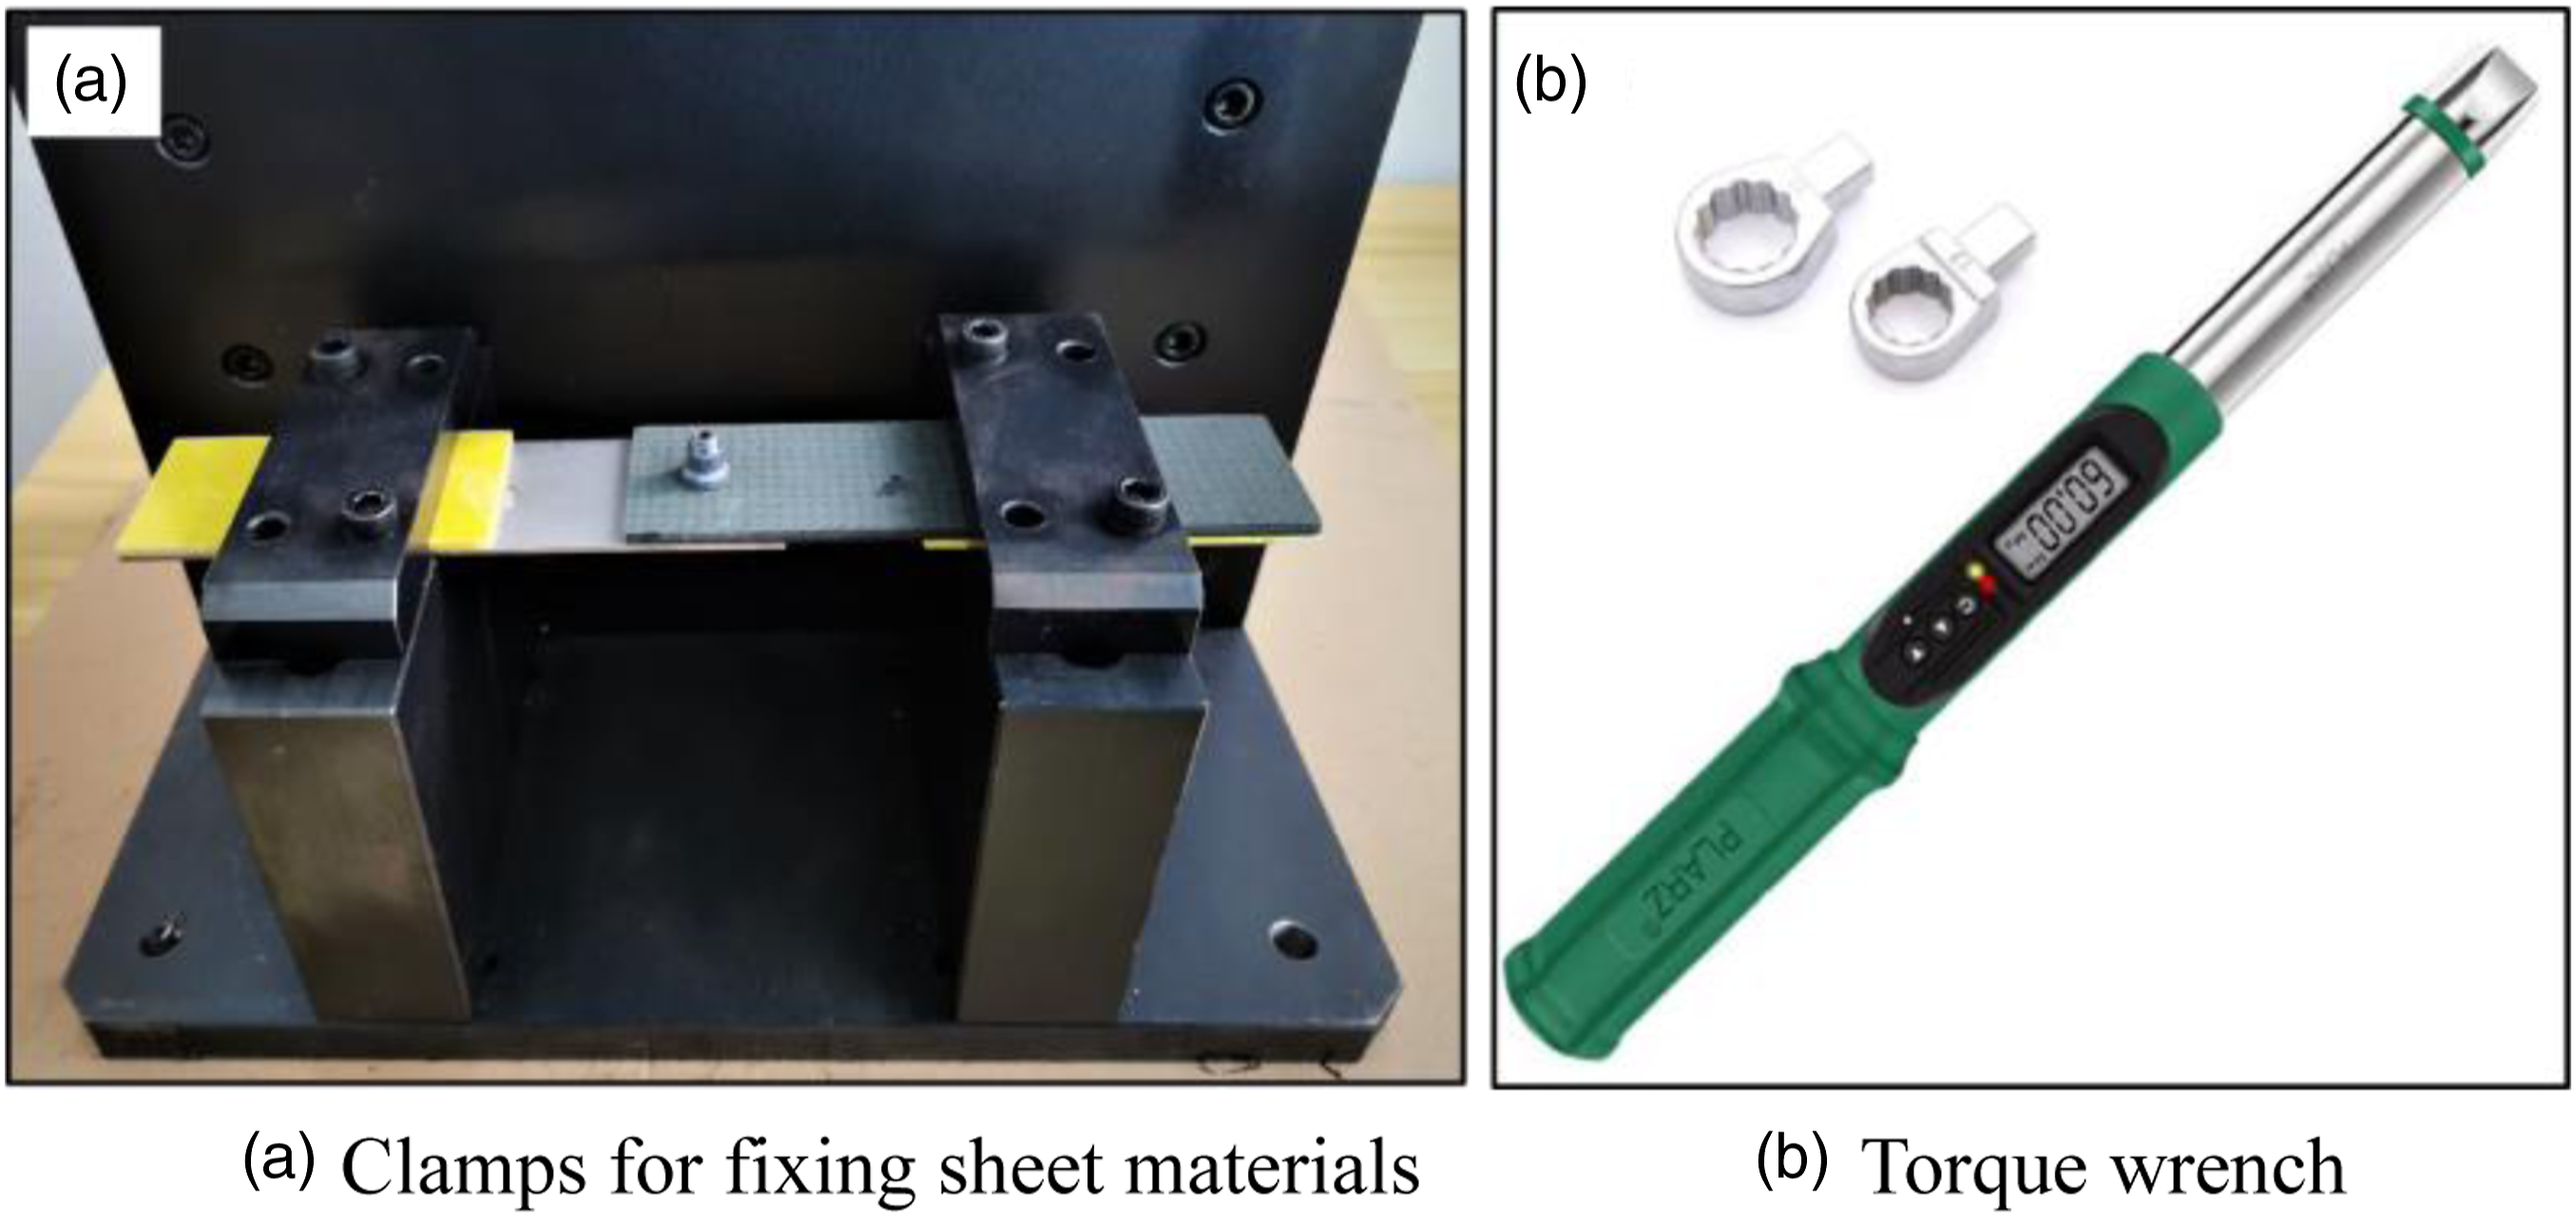
To assemble the parts, first insert the bolt through the opening in the titanium alloy layer. Then, secure the nut on one side of the composite material layer and tighten it to a torque of 10 Nm using a PLARZ digital torque wrench combined with an Allen wrench. As shown in Figure 13(a), once tightened, the cap will fall off from its groove. The use of this torque wrench ensures real-time measurement and consistency of each joint's tightening torque. Refer to Figure 12(b) for its shape. Tightening process. (a) Schematic diagram of high-lock nut. (b) Test piece has been tightened.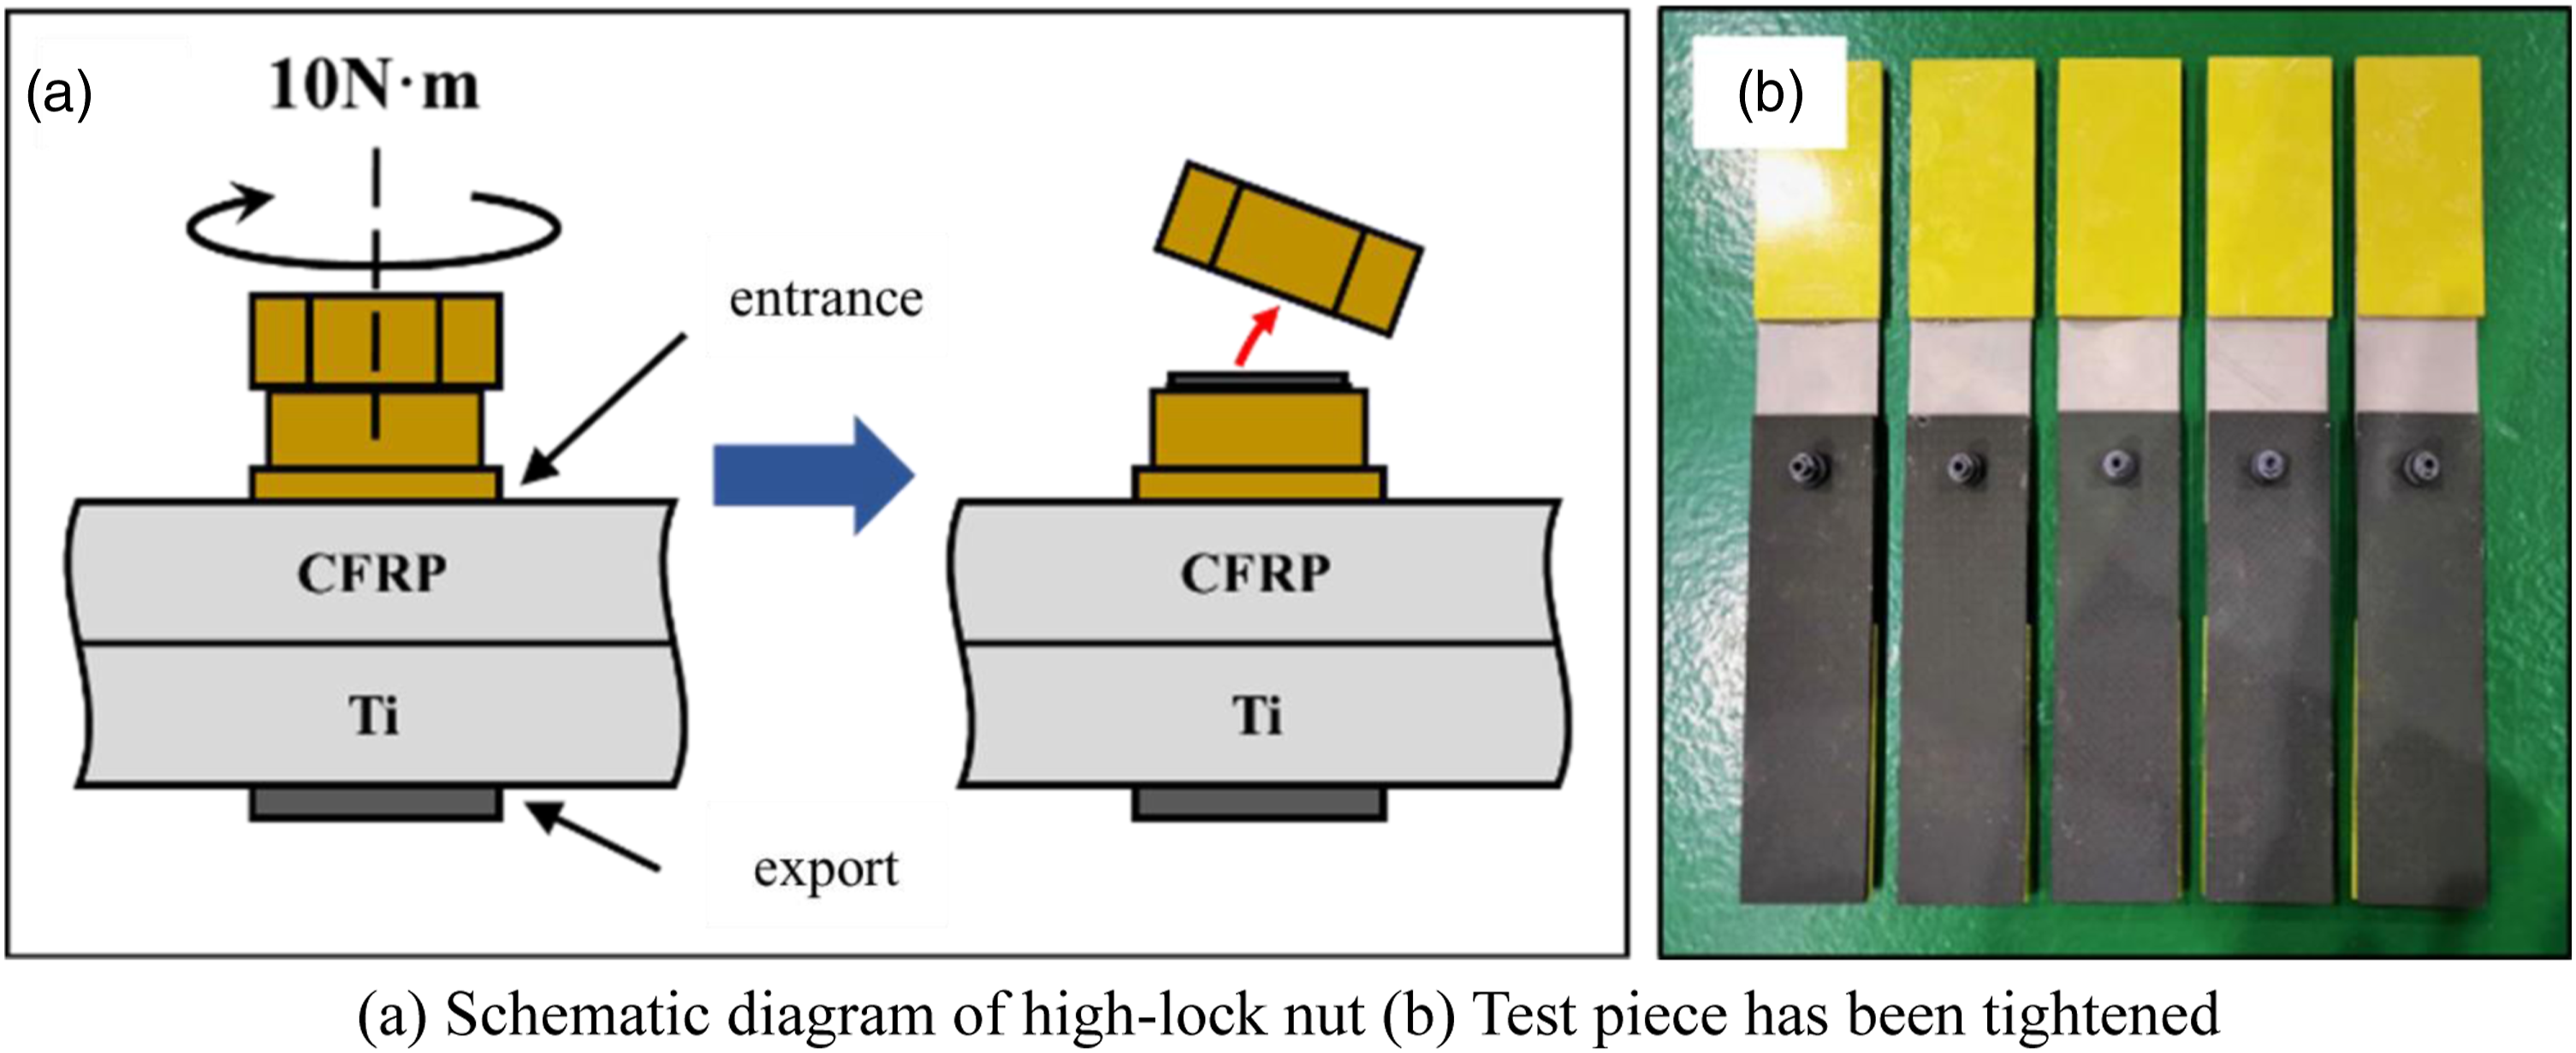
Plan for static tensile testing
To conduct a static tensile test, we will use a temperature-controlled universal testing machine of PT-1167GDW type, as shown in Figure 14(a), and follow the requirements of ASTM D 5961M-13 standard. The test will be displacement controlled, with the lower grip fixed and the upper grip stretching the specimen at a speed of 2 mm/min until it fails completely. To accurately measure deformation of connection pores, an extensometer will be installed on the specimen during testing. Once completed, we will export force-displacement curve data from the static tensile process and record failure mode(s) of specimens. Plan for static tensile testing. (a) Universal testing machine. (b) Test specimen clamping diagram. (c) Controller interface. (d) Extensometer schematic.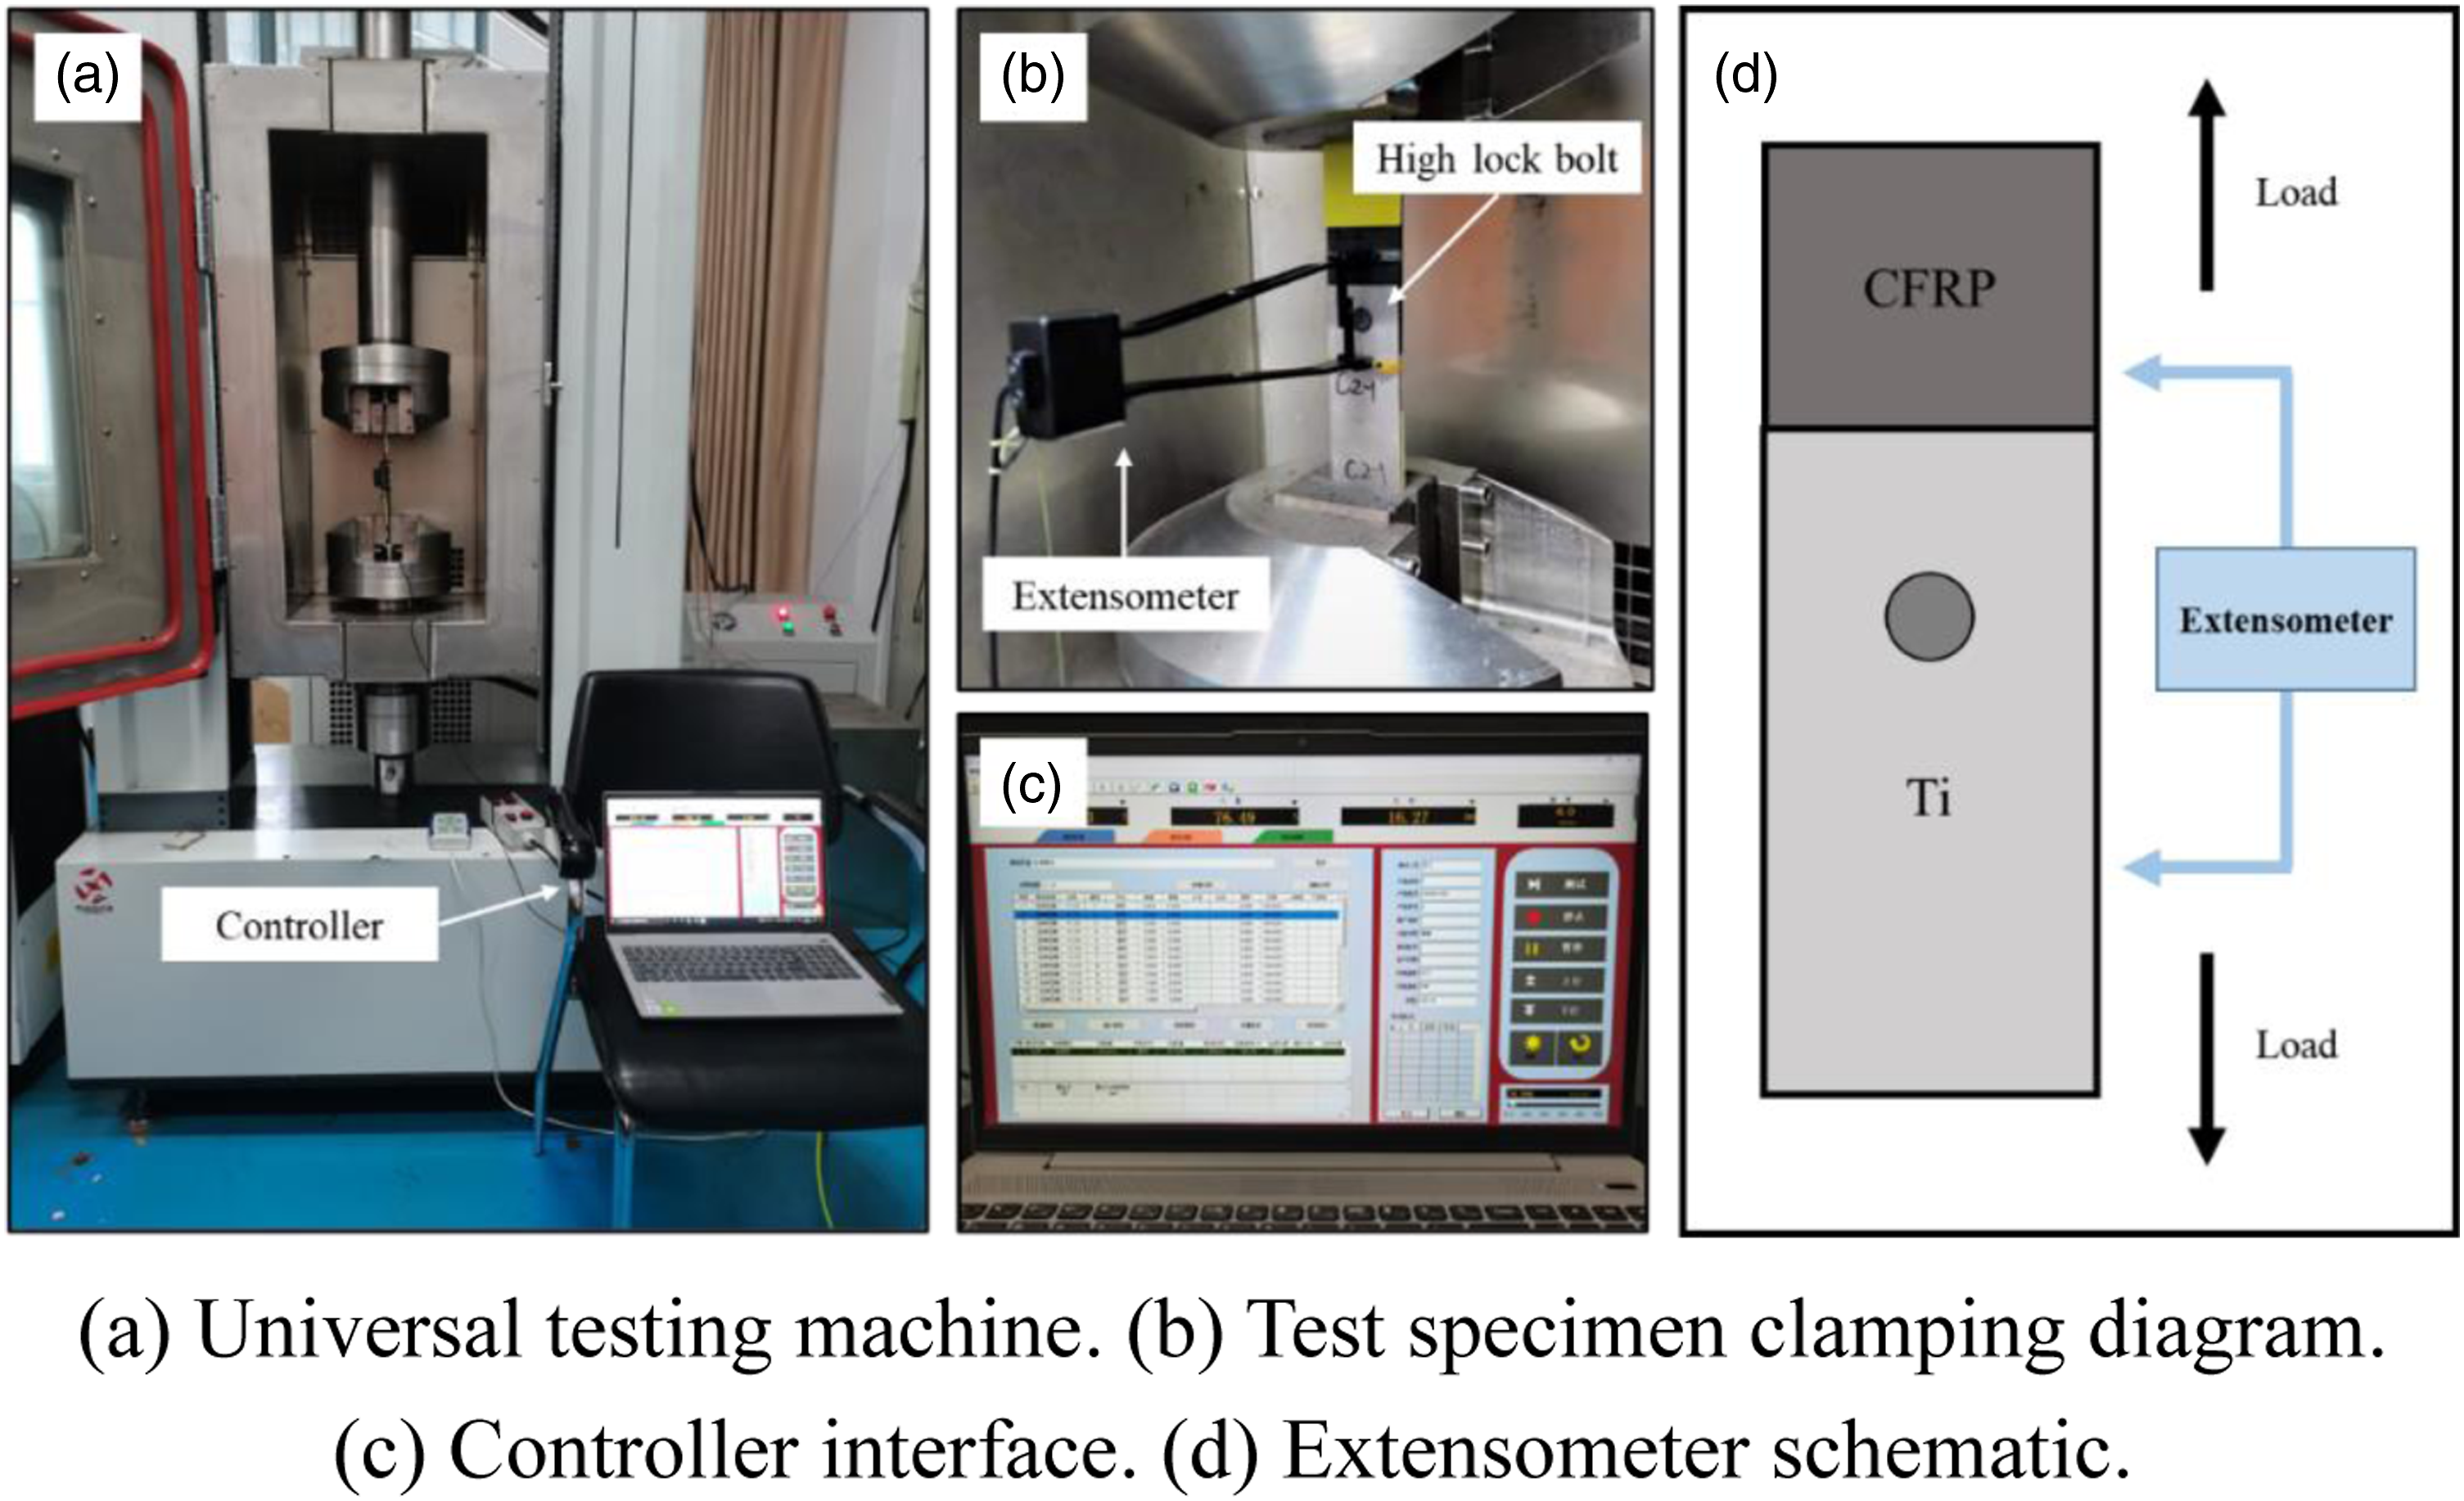
Test plan.
Failure mode of the test piece under tensile load
Failure mode analysis
The test piece underwent a constant speed tension until it failed at a certain displacement. The morphology of the test piece after failure is depicted in Figure 15(a). It can be observed from the figure that the pull-out damage was the primary cause of failure, which mainly occurred in the composite material layer. Specifically, bolts passing through this layer were pulled out, resulting in separation of two layers of plates. Static tensile failure diagram. (a) Bolt pulled out. (b) Titanium alloy layer. (c) Composite material layer.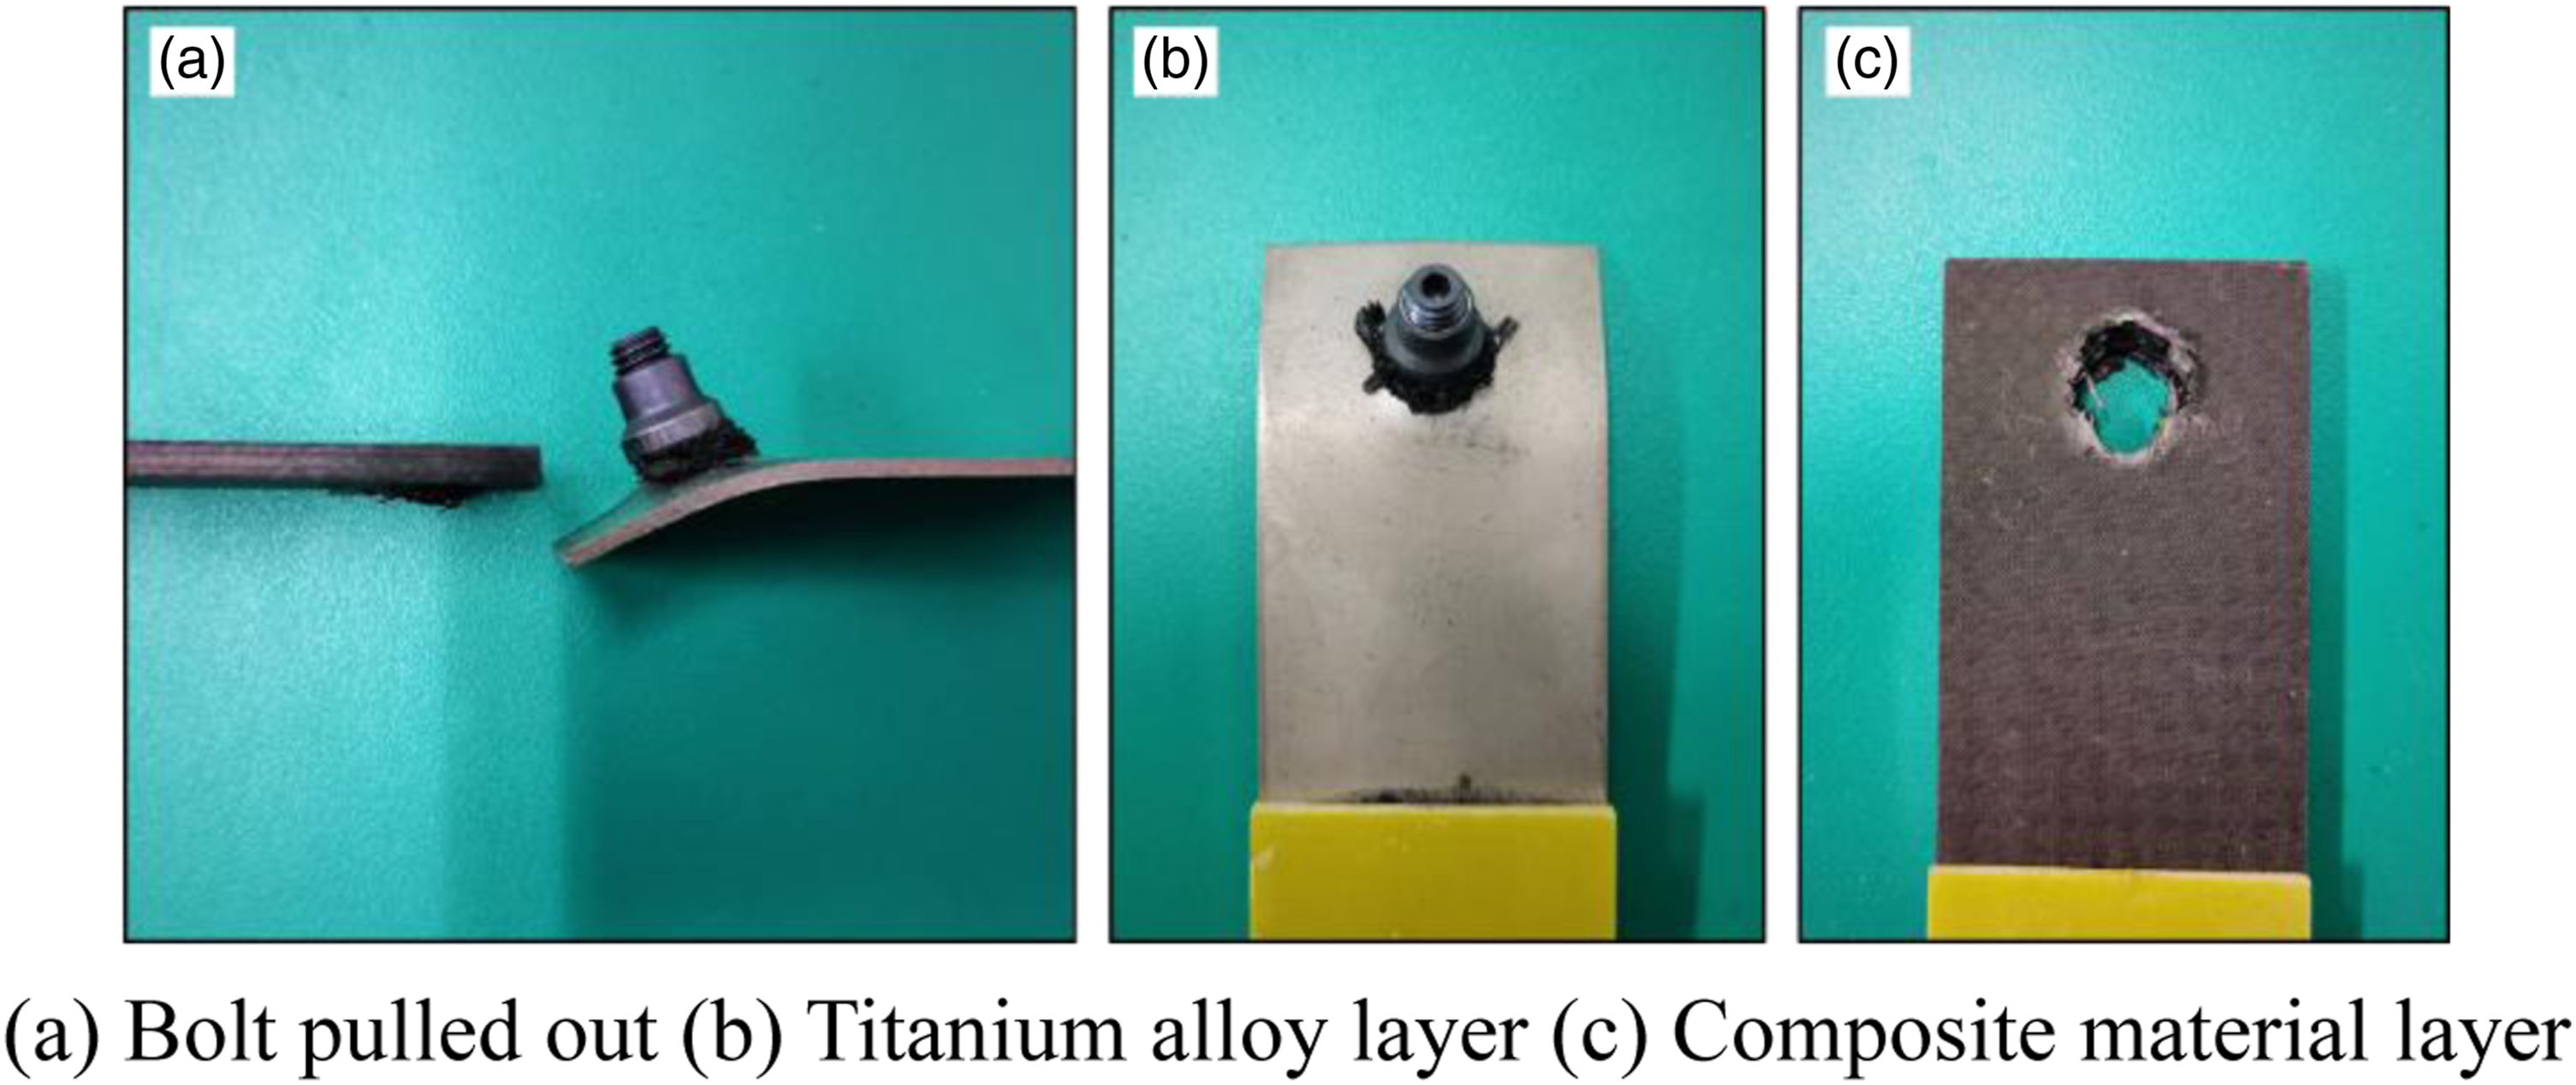
Figure 15(b) and (c) show respectively the titanium alloy layer and composite material layer after failure. In case of composite material layers, external pressure generated by loading caused numerous fibers to fracture with serious compression on pore walls around which some materials were brought out by bolts leaving irregularly shaped pores behind. For titanium alloy layers, external loading caused bending moments leading to permanent bending near bolt plate areas with slight deformation occurring around pores.
This helped bolts detach better from composite layers while well-preserved bolts and nuts remained at pore positions with some carbon fiber sandwiched between nuts and titanium alloy plates. All test pieces exhibited identical static tensile failure modes without any influence from various types of DSPD.
The effect of stacking sequence on the failure mode of laminated components
During static tensile testing, we observed that the stacking sequence of laminated components can impact the form of static tensile failure. Specifically, when a high-lock nut was located on one side of a composite material layer (CFRP/Ti), the specimen failed due to pull-out failure, which is consistent with previous findings. However, when a high-lock nut was located on one side of a titanium alloy layer (Ti/CFRP), the failure mode changed to fastener fracture as shown in Figure 16. Macroscopic morphology of fastener fracture. (a) Overall appearance. (b) Composite material layer. (c) Titanium alloy layer.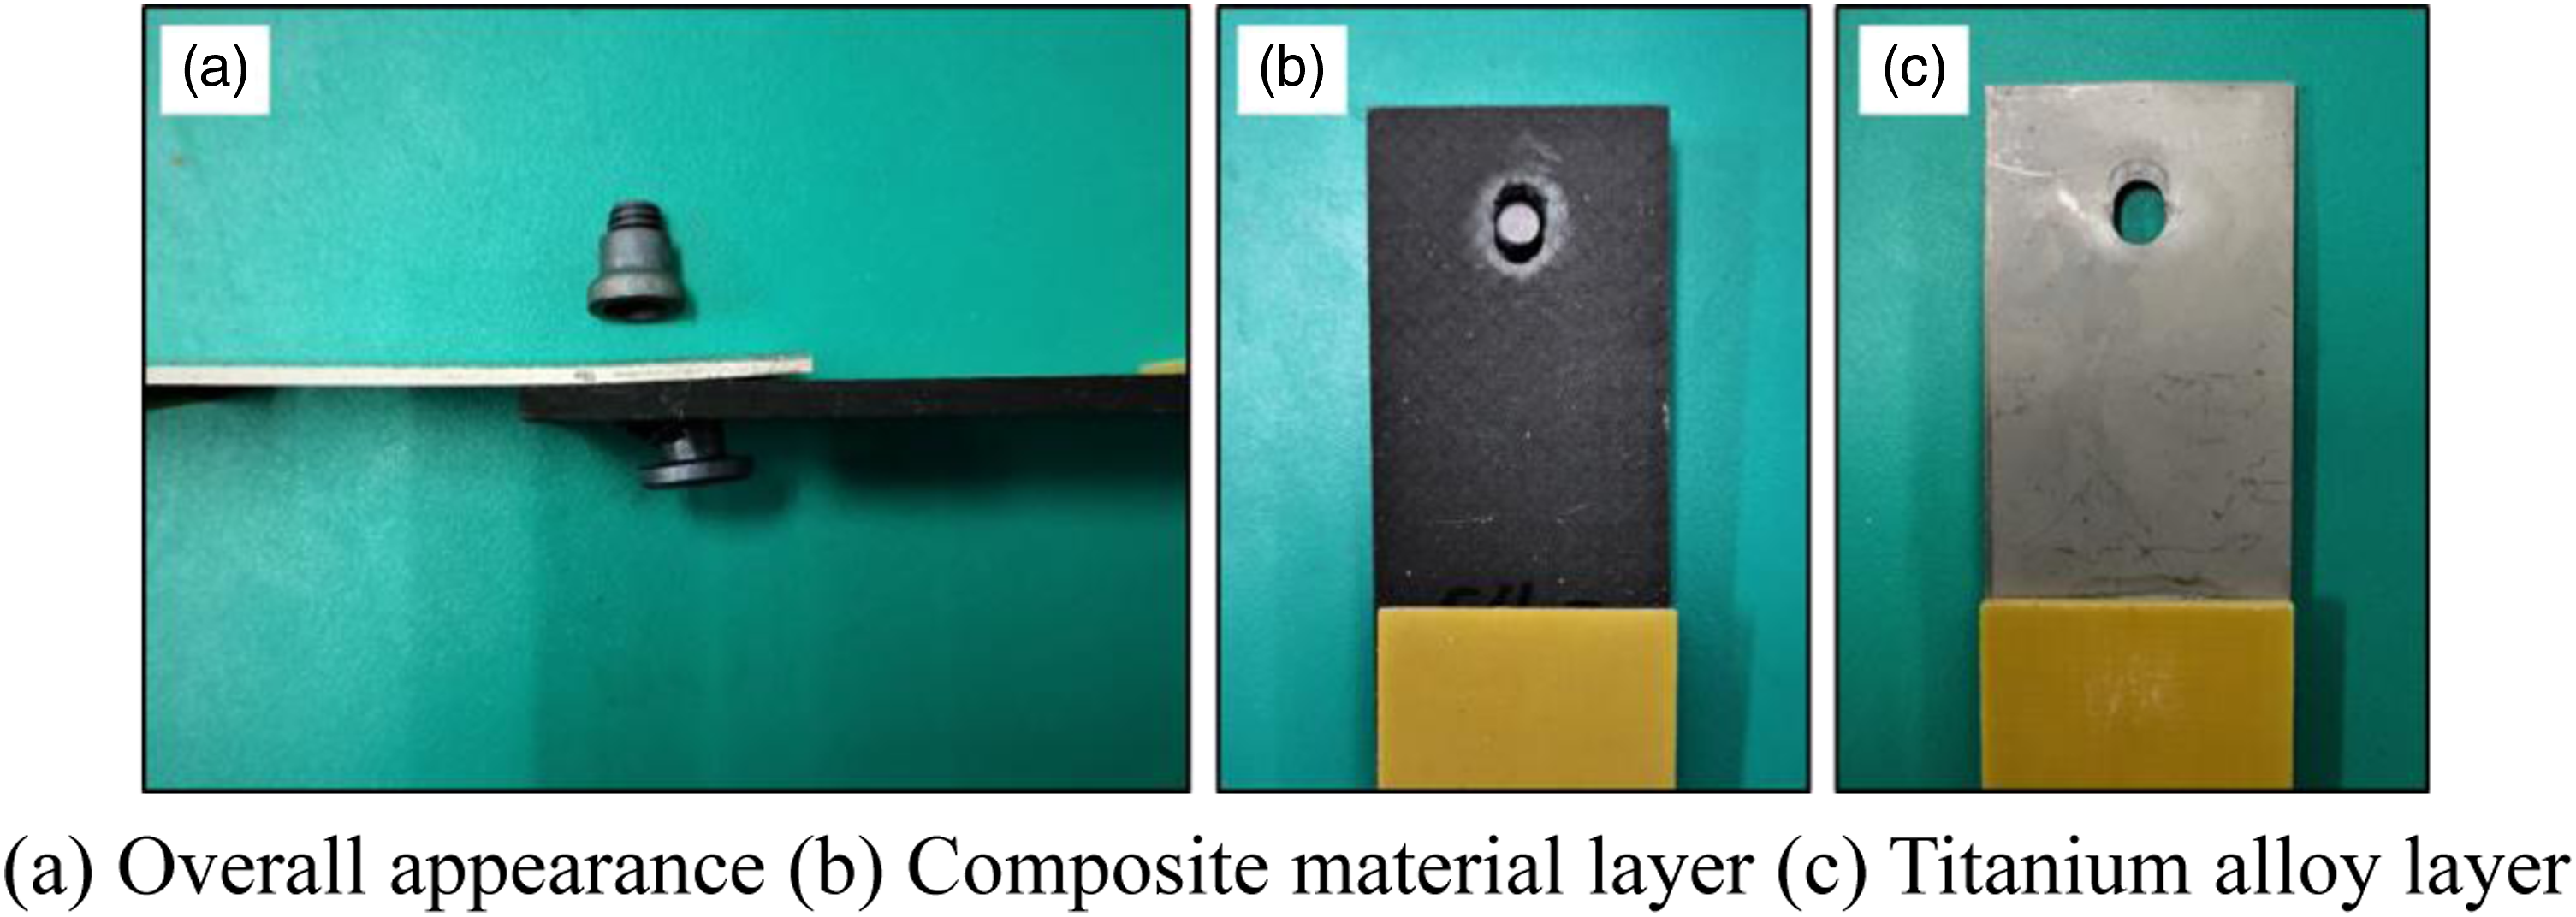
In cases where fastener fracture occurred, compression damage took place in the pore wall of the composite material layer and bolt deflection angle was small. After failing, part matched with nut (nut side) fell off while remaining part (bolt side) got stuck in composite material pore and titanium alloy pore deformed slightly into an elliptical shape.
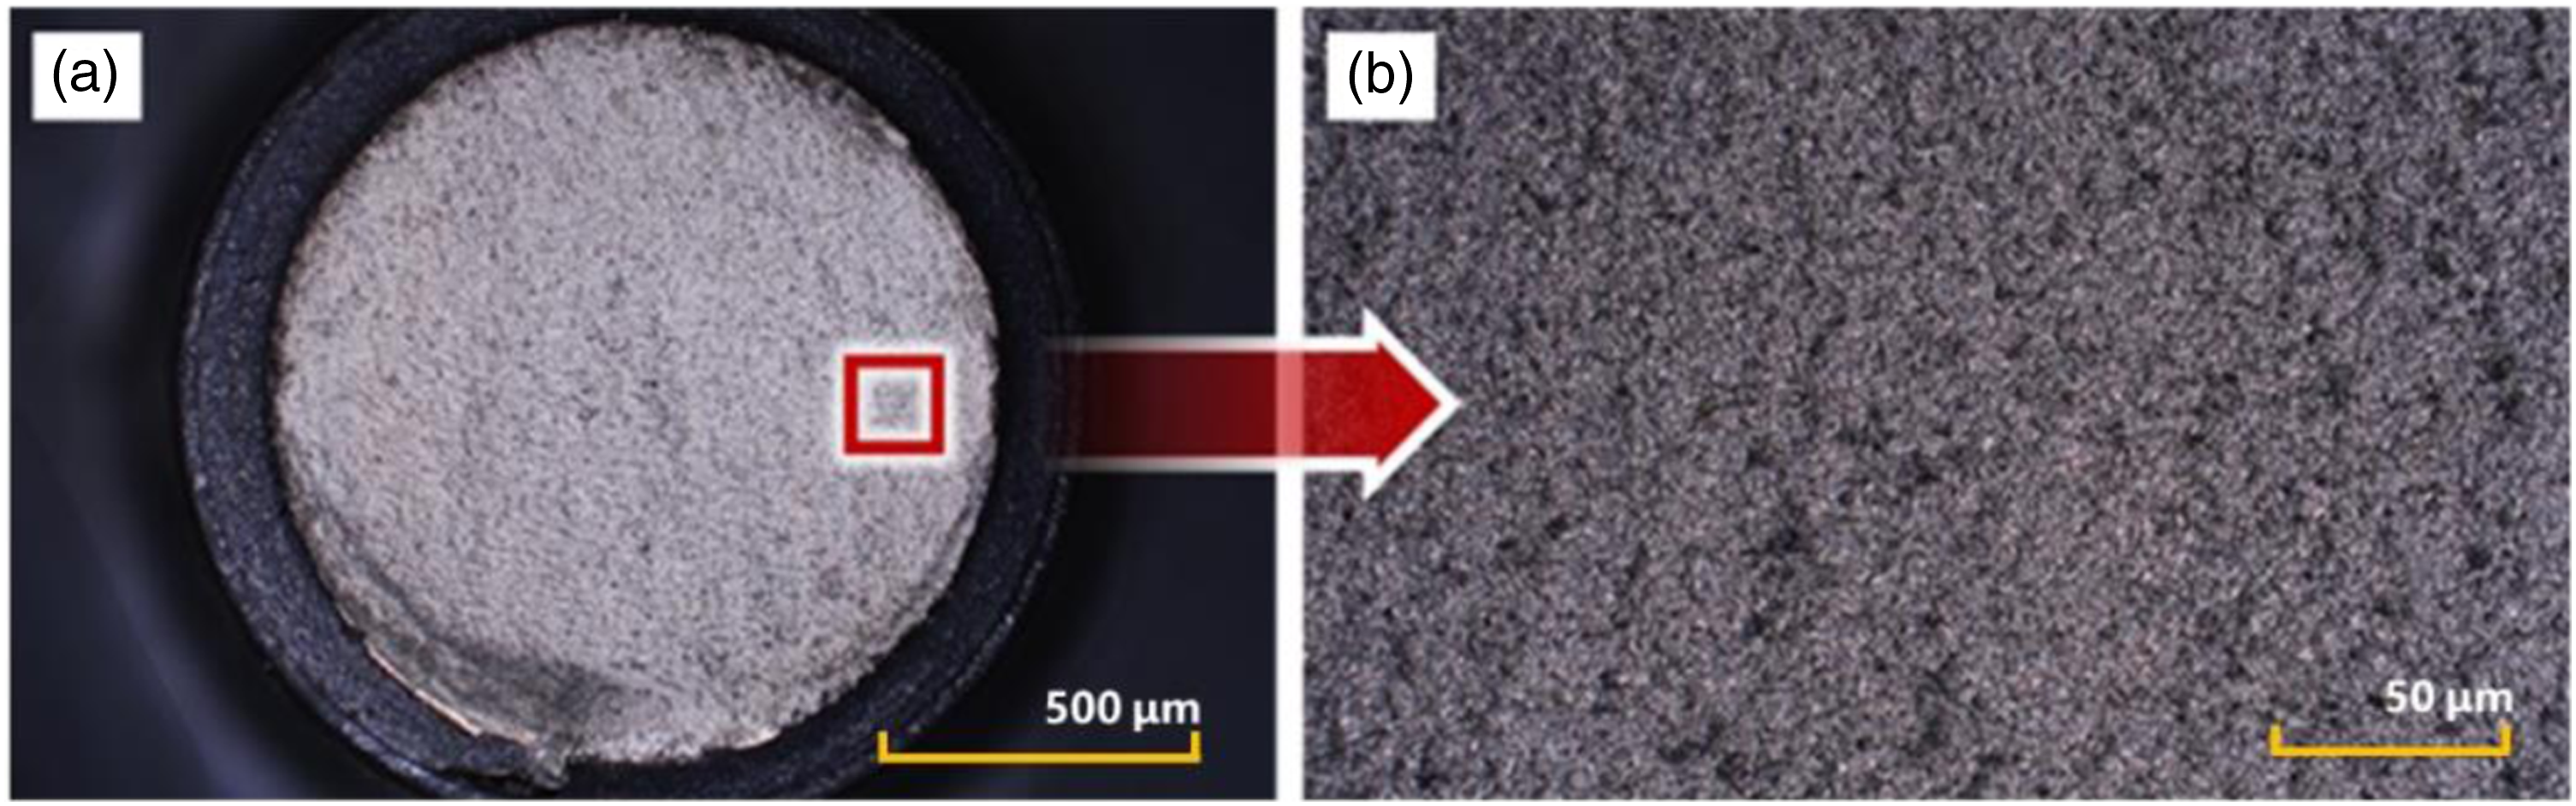
After the fastener was broken, both parts were examined separately under a high-powered microscope with super depth of field. The resulting images are displayed in Figures 17 and 18. These figures reveal that the fracture surface of the fastener is not aligned parallel to the direction of shear load, but instead appears at the location where bolt thread engagement ends - specifically at the tail end. The fracture surface itself is flat and smooth without any noticeable undulations, but has an overall rough appearance with a plush-like texture and gray-white coloration which indicates significant plastic deformation in this area. Fracture surface of fastener nut. Fracture surface of fastener bolt.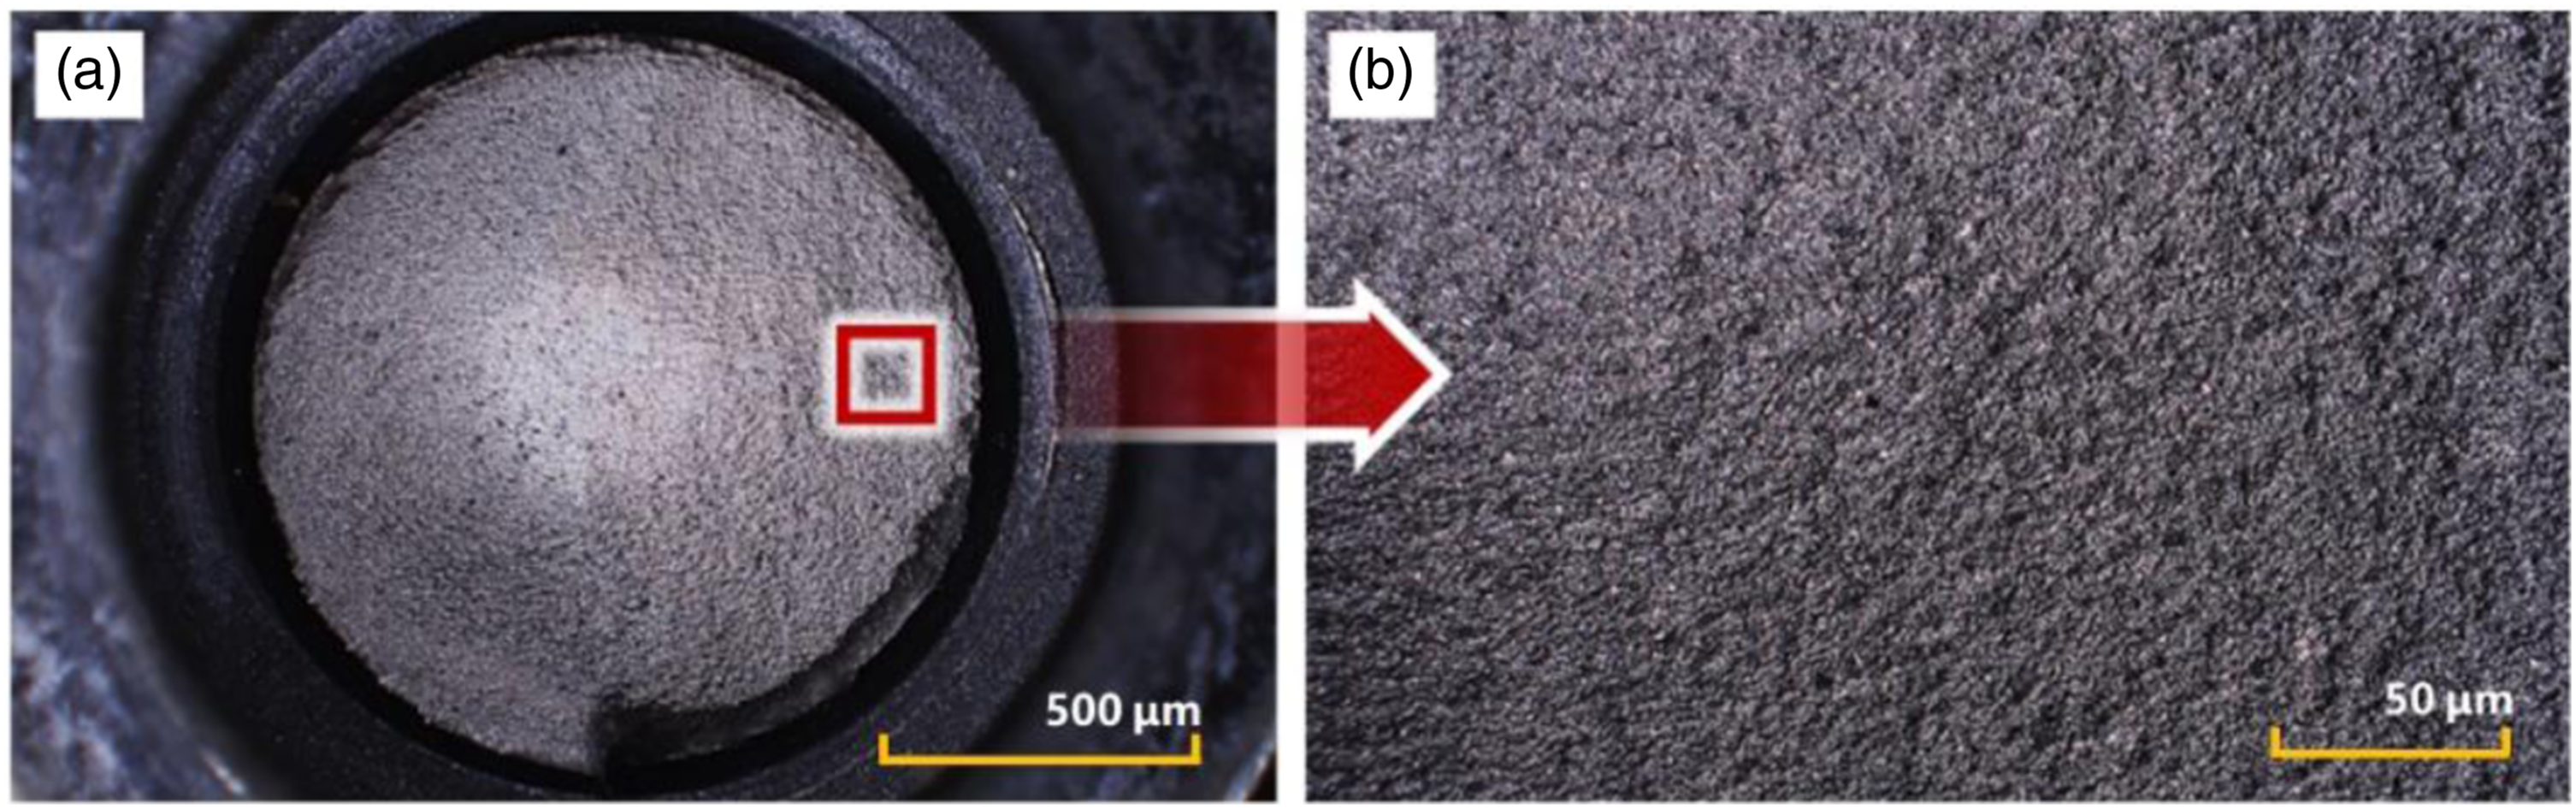
The following explanation will discuss the failure of fasteners from a force analysis perspective. Figure 19 illustrates that the bolt-nut integrated structure endures four types of external forces: shear forces FS1 and FS2, which result from external loads transmitted through the plate; axial tensile forces FT1 and FT2, which are caused by non-parallel shear forces forming a moment that tilts the bolt and compresses the surface of the plate. This compression generates a reaction force acting on both nut and bolt head, resulting in these two axial tensile forces. The values of these four external forces satisfy equation (1). Force analysis diagram of a specimen subjected to normal external load.
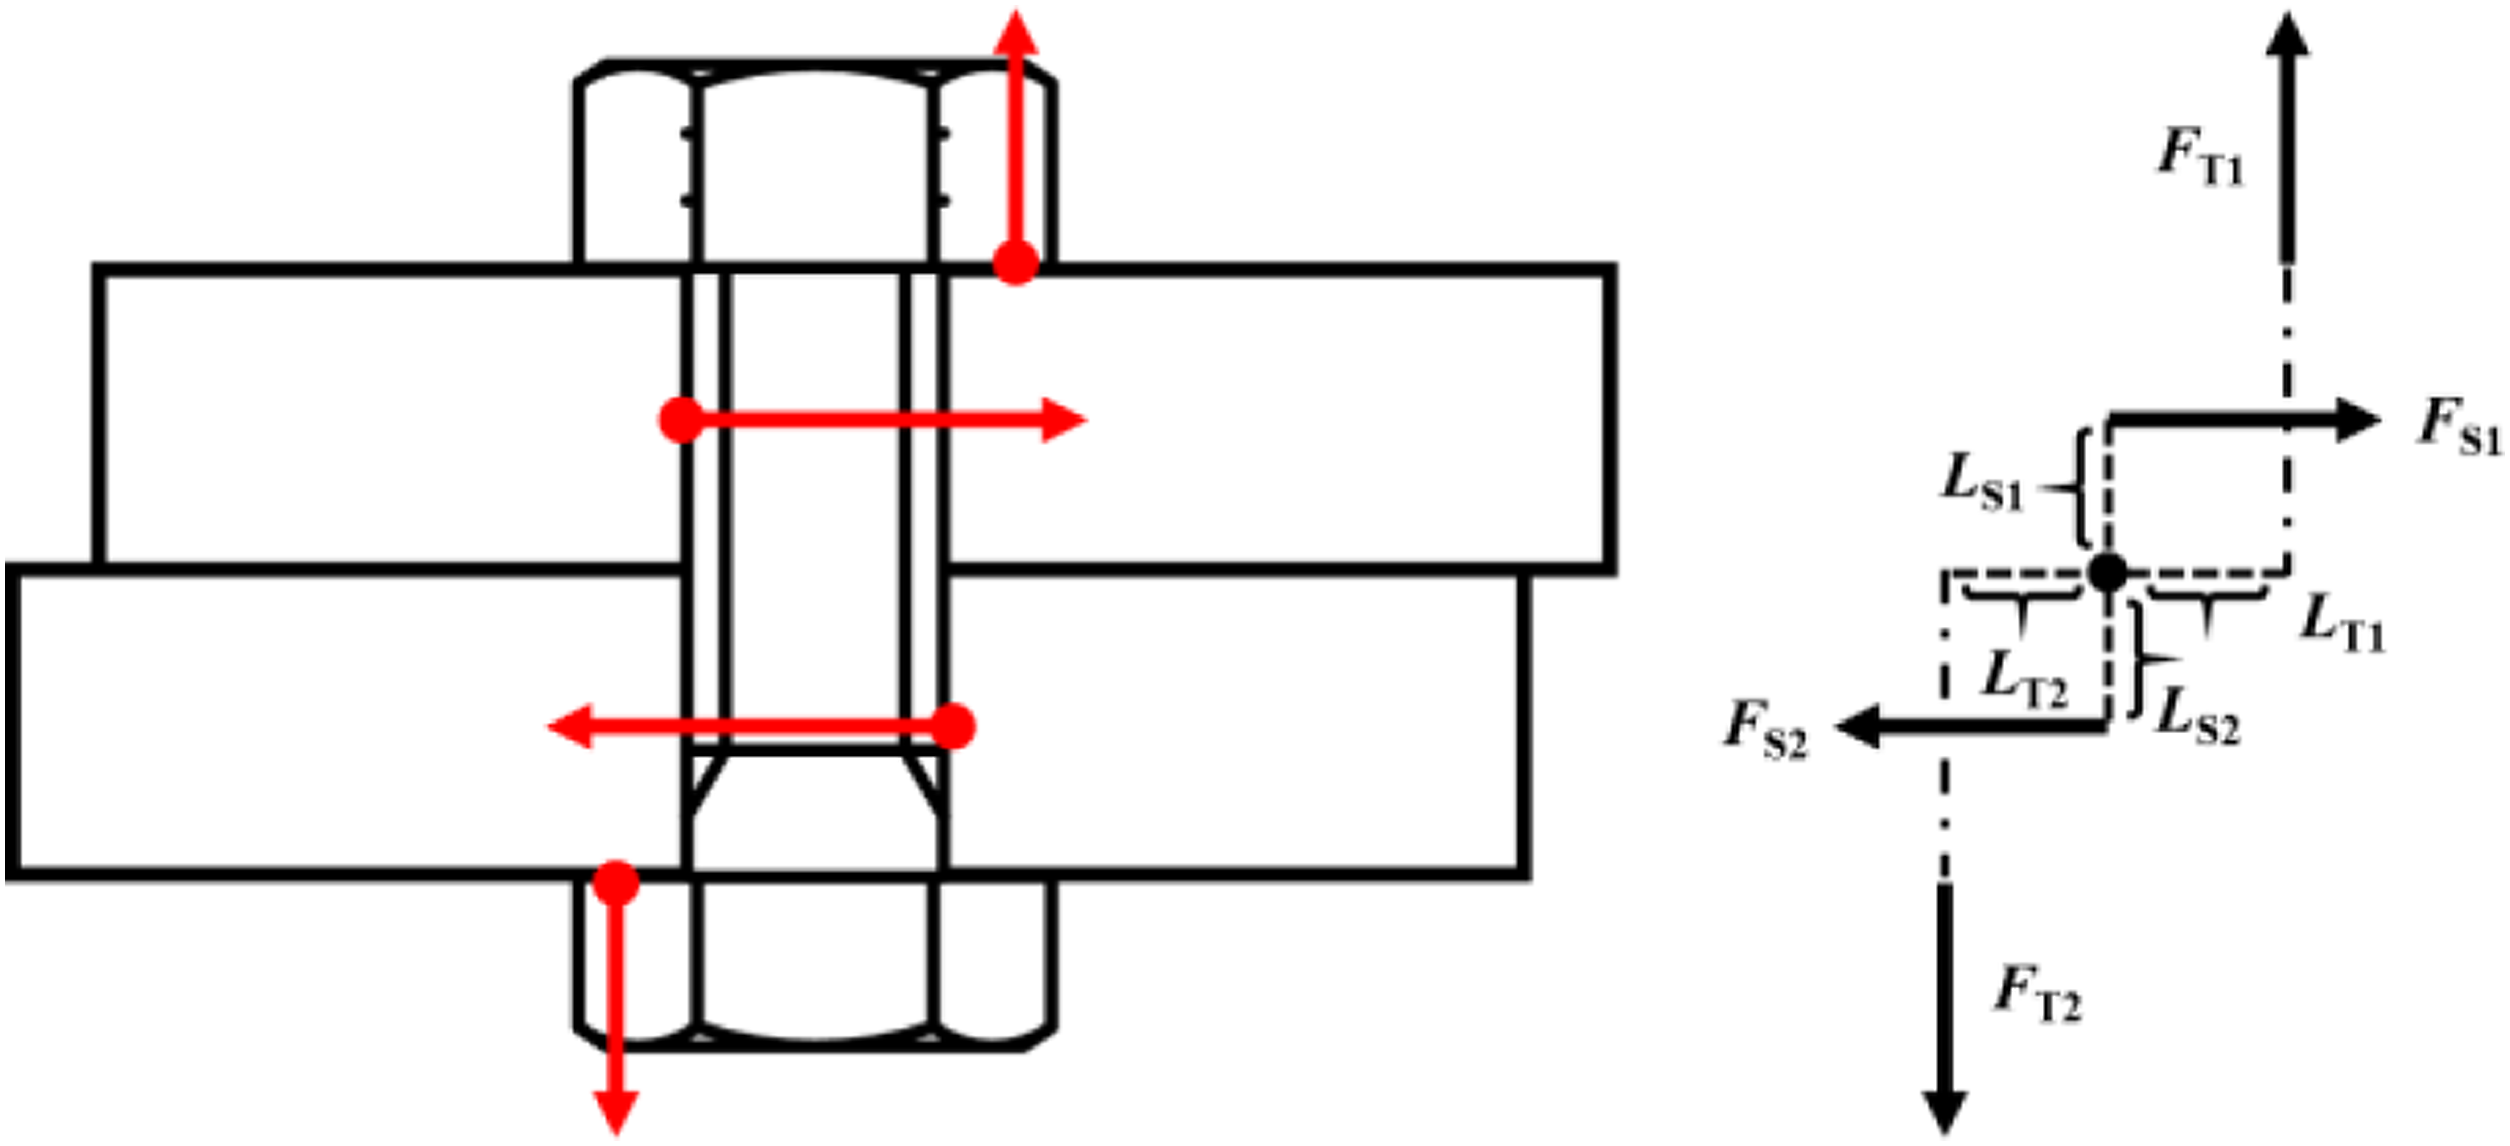
The fracture did not occur parallel to the shear force, but rather at the thread. This indicates that it was caused by axial tensile forces (FT1 and FT2) instead of shear force. The threaded joint's small contact area makes it a vulnerable spot under external forces and is prone to cracking. In particular, if axial tensile forces act on only one side of the nut, cracks can form easily and weaken its tensile strength. This could result in disengagement of the mating structure and ultimately lead to fastener failure.
The previous analysis has provided an explanation for the failure of fasteners. However, in order to understand the reasons behind changes in failure modes, it is necessary to discuss the fundamental differences between two types of stacking methods. Upon examining the structure of fasteners, we have identified significant variations in contact surfaces between bolt heads and nuts with plates that may be responsible for differences in failure modes.
As illustrated in Figure 20, bolt heads have a contact area with plates that includes all areas except those occupied by nail rods, resulting in a total area of 66.76 mm2. Conversely, due to the presence of a step after threads on nuts, their contact area with plates is limited to an annular region as depicted in the figure with an area of 44.33 mm2. A smaller contact surface can generate greater pressure under identical force conditions; therefore, nuts exert more pressure on plates. Schematic diagram of plate contact surface for bolts and nuts.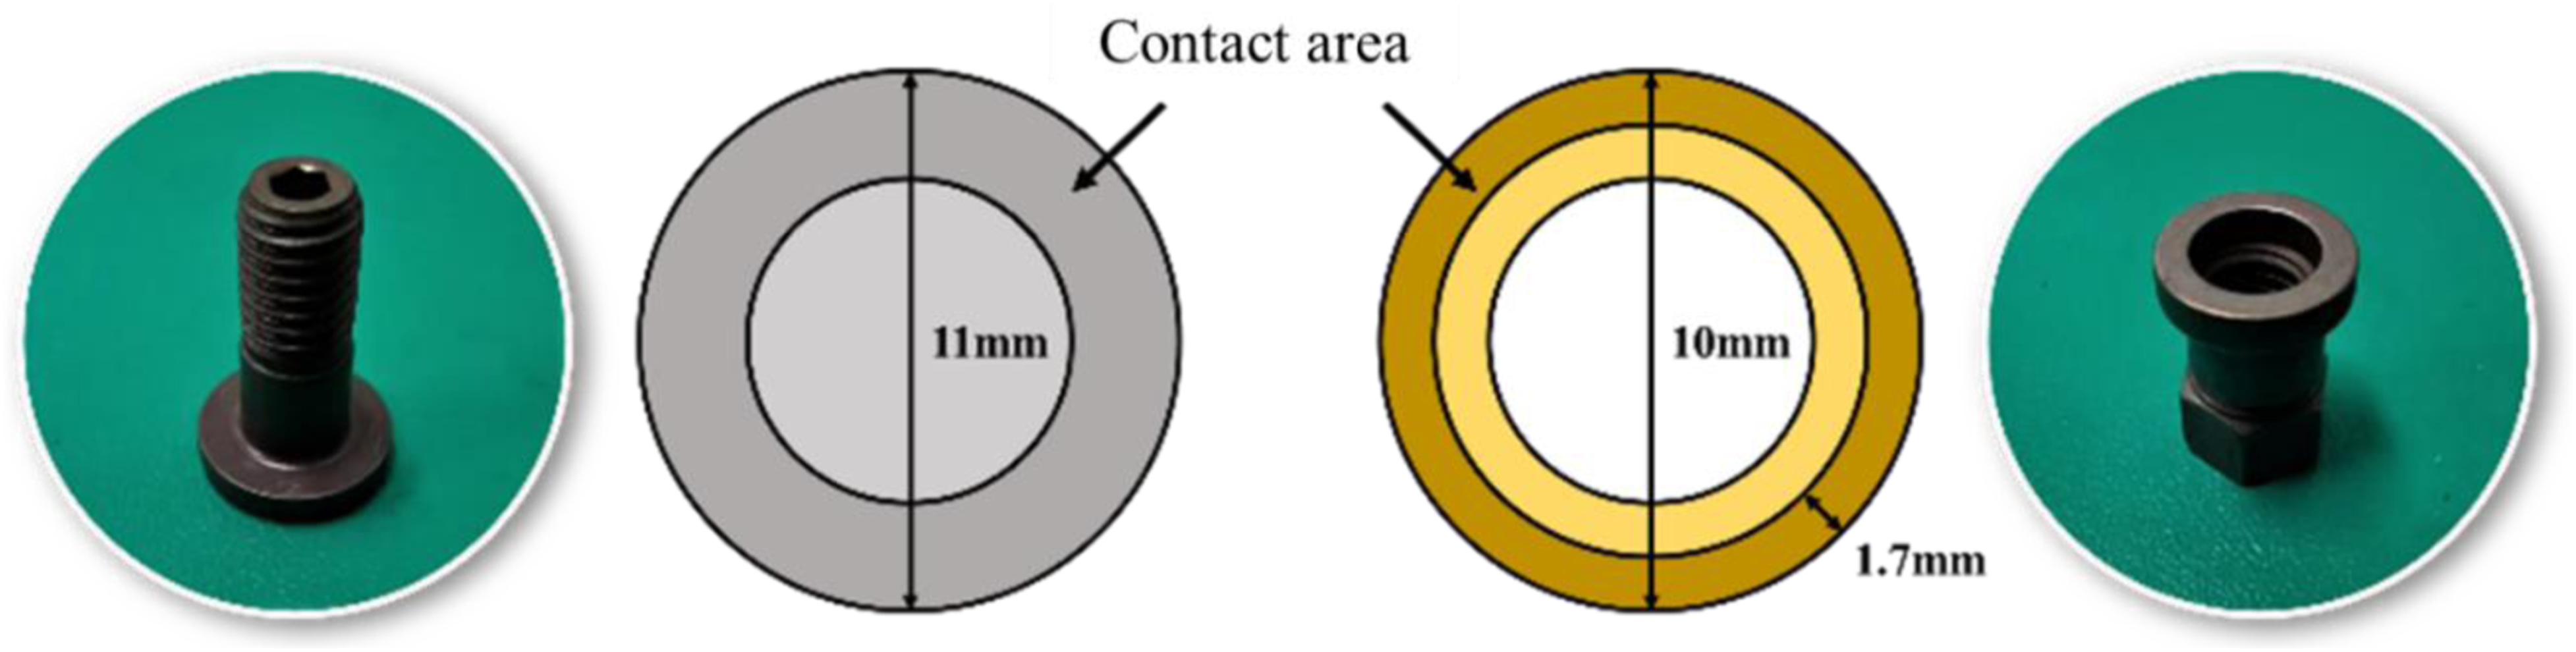
To cause pull-out damage similar to that shown in Figure 15 generally requires nuts to pass through plate layers and separate them into two layers.
Due to the superior strength of titanium alloy materials compared to carbon fiber composite materials, it is challenging for nuts to crush through the titanium alloy layer. In contrast, crushing the composite material layer is much easier. When using a stacking sequence of Ti/CFRP, there will be minimal tilting or plate crushing during tension processes. The bolts will remain almost perpendicular to the plate surface until failure occurs, maintaining a stress state as shown in Figure 19 throughout. As shear force increases, axial tensile force also increases accordingly until fasteners fracture due to exceeding thread pairing's bearing capacity.
However, when using CFRP/Ti as a stacking sequence instead and increasing shear force further, pressure on contact surfaces between nut and plate rises sharply due to compression failure on composite material layers' surface and bending deformation on titanium alloy layers' side. Loading mode changes accordingly during nut passing through composite material layers from unidirectional load-bearing before into multi-directional load-bearing after; load distribution becomes relatively uniform; stress concentration weakens; coupled with change in moment arm length caused by deformation pattern alteration - under same level of applied shear forces - bearing capacity of thread pairings improves somewhat so that nuts can successfully penetrate through composite material layers forming pull-out failure at last.
The effect of double-step pore defects on the tensile strength of laminated components

Tensile test results for specimens with DSPD.
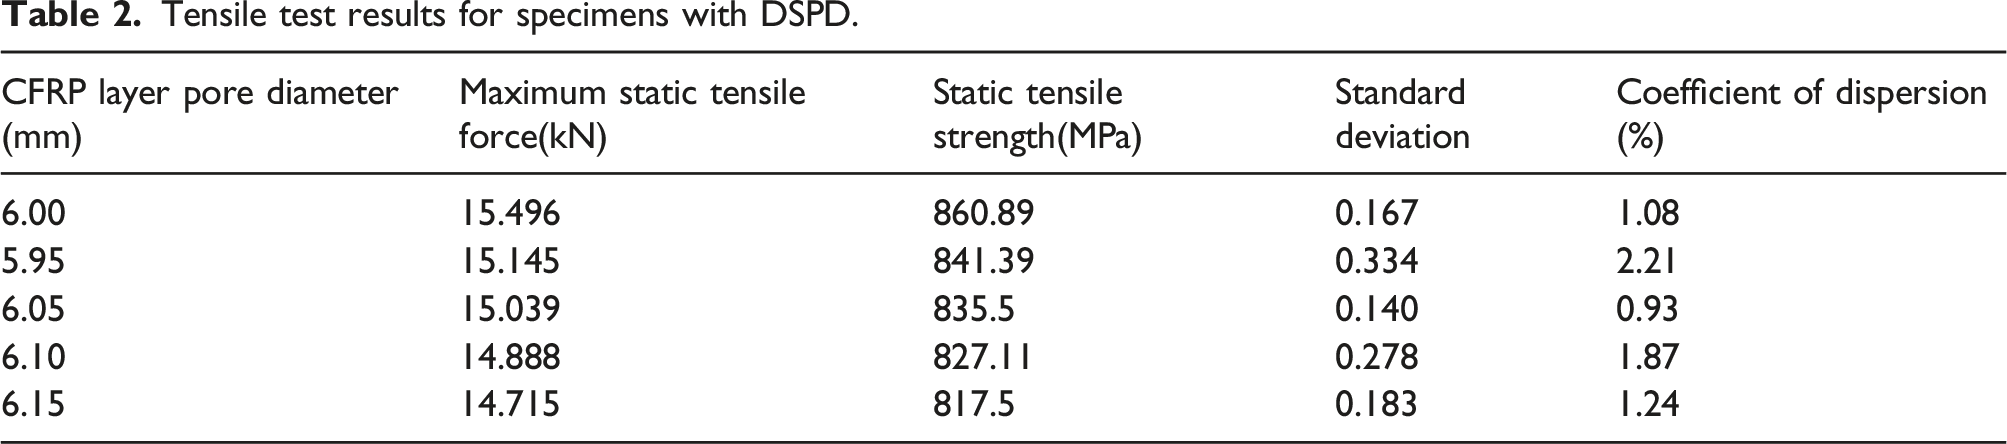
The formula includes the following variables: σmax, which represents the tensile strength; Fmax, which represents the maximum static tensile force that a specimen can withstand before failing; and D, which is the diameter of fasteners (high-strength bolts used for connection). As failure typically occurs in composite layers, it is necessary to calculate the tensile strength based on these layers. Thus, h denotes the thickness of said composite layers.
The results indicate that specimens without defects have the highest tensile strength, reaching 860.89 MPa. However, both DSPD of shrinkage and expansion cause a reduction in tensile strength. Shrinkage-type defects have a relatively minor impact. A defect measuring −0.05 mm results in a reduction of tensile strength by 19.5 MPa (2.27%). This may be due to interference causing fibers near the pore circumference to break more easily under compression, resulting in a loss of load-bearing capacity for connecting components due to premature fiber fracture.
Expansion-type defects have a significant effect on the tensile strength of materials. The static strength is negatively correlated with the level of defect. For instance, DSPD measuring 0.05 mm, 0.10 mm and 0.15 mm can reduce static tensile strength by 25.39 MPa (2.95%), 33.78 MPa (3.92%) and 43.39 MPa (5.04%), respectively.
The main reason for reducing component static tensile strength is that larger pore obviously reduces the plate area supporting nuts in pore areas so that nuts can more easily crush fibers around pores under external loads and penetrate composite layers through them; meanwhile, bolts are more likely to tilt between nail pores under bending moments since they do not contact tightly enough between them which produces larger stress concentration zones over wider ranges. As defect levels increase, these factors become more severe leading to greater reductions in static strengths.
During specimen's tension test process shown in Figure 21 force-displacement curves can be identified into four stages: elastic deformation stage occurs at loading initial period when tension force increases rapidly along displacement increase trend similar to linear one while specimen deformation is completely elastic; then plastic deformation stage begins after certain displacement amount has been reached where strain (displacement) continues increasing but stress (tension force) growth rate slows down or even remains basically unchanged producing mainly plastic deformation with sound of fiber fracture heard. During this stage, fibers near pores are torn apart while pores continue to expand; then local failure stage occurs after tension force passes peak point where it begins to decrease gradually and eventually penetrates composite plates causing detachment between two layers; finally, failure stage happens when tension force drops suddenly and falls to zero after a sound of nail plate separation, indicating complete specimen failure. Tensile force-displacement curve of a specimen with DSPD.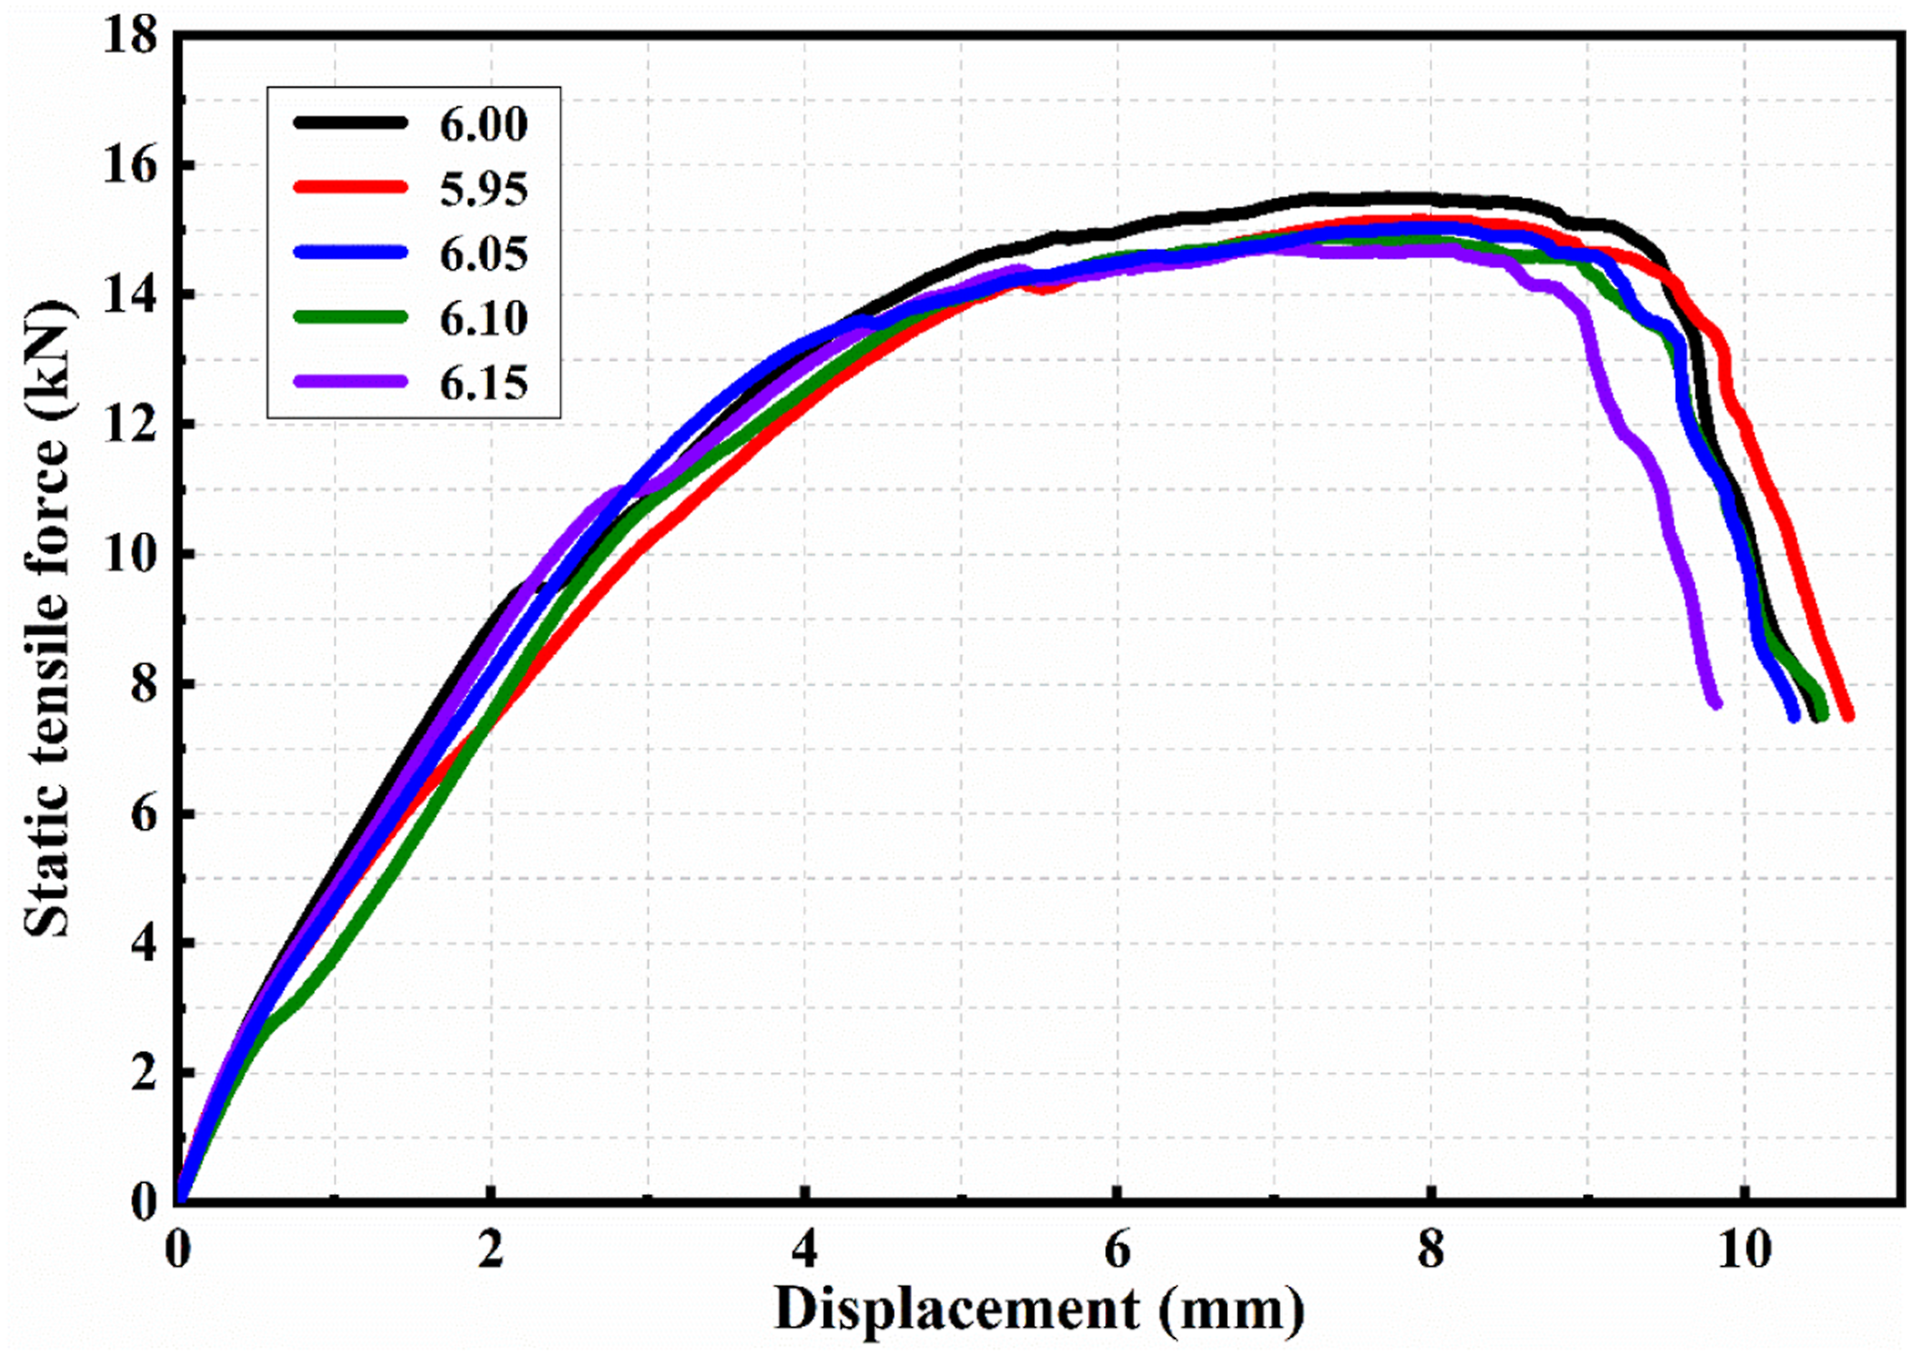
The force-displacement curves during tensile tests for each group of specimens are roughly similar. The ultimate static tensile strength appears at around 8 mm position, and all specimens fail before being stretched by 11 mm. From the test results, it can be seen that the displacement at which each group of specimens reaches its ultimate static tensile strength is different but shows certain regularity: the average displacements when groups 5.95, 6.00, 6.05, 6.10 and 6.15 reach their ultimate static tensile strengths are respectively7.91 mm, 7.71 mm, 7.34 mm, 7.19 mm and 7.01 mm, indicating that as pore diameter increases, the average displacement at which they reach their limit becomes smaller.
The influence of double-step pore defects on the static tensile strength of fastener fracture specimens
Study on the layering sequence of test pieces and results of tensile tests.
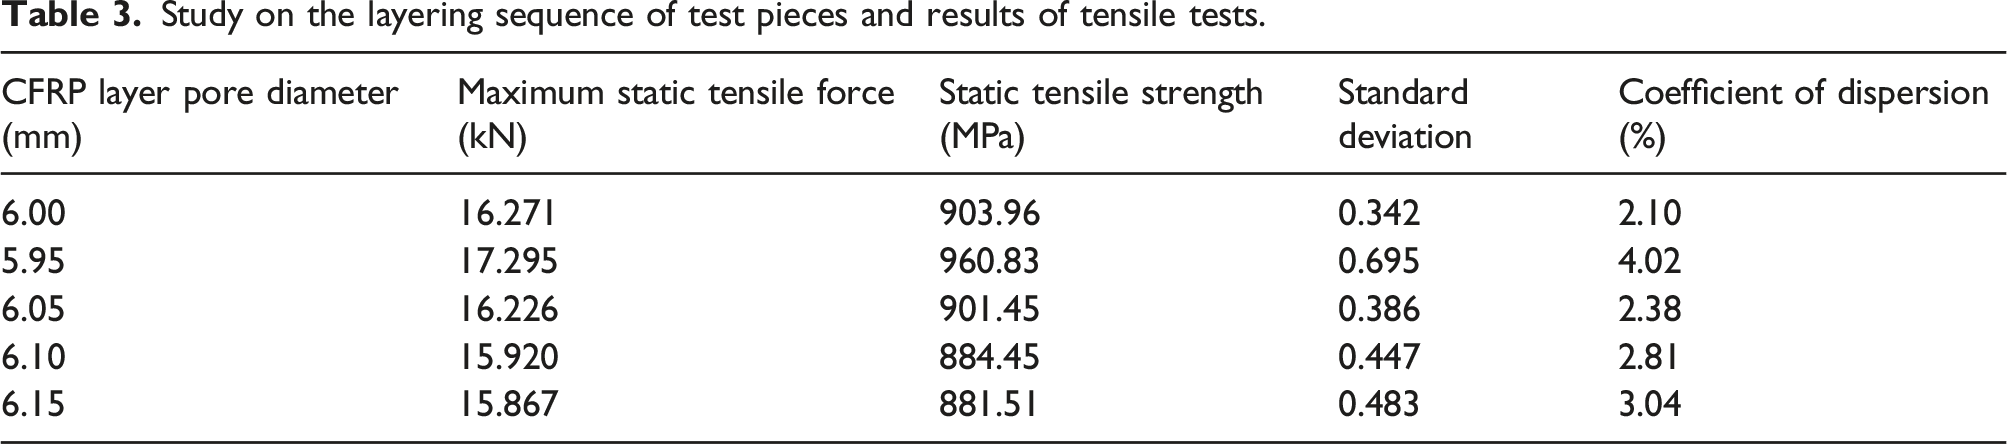
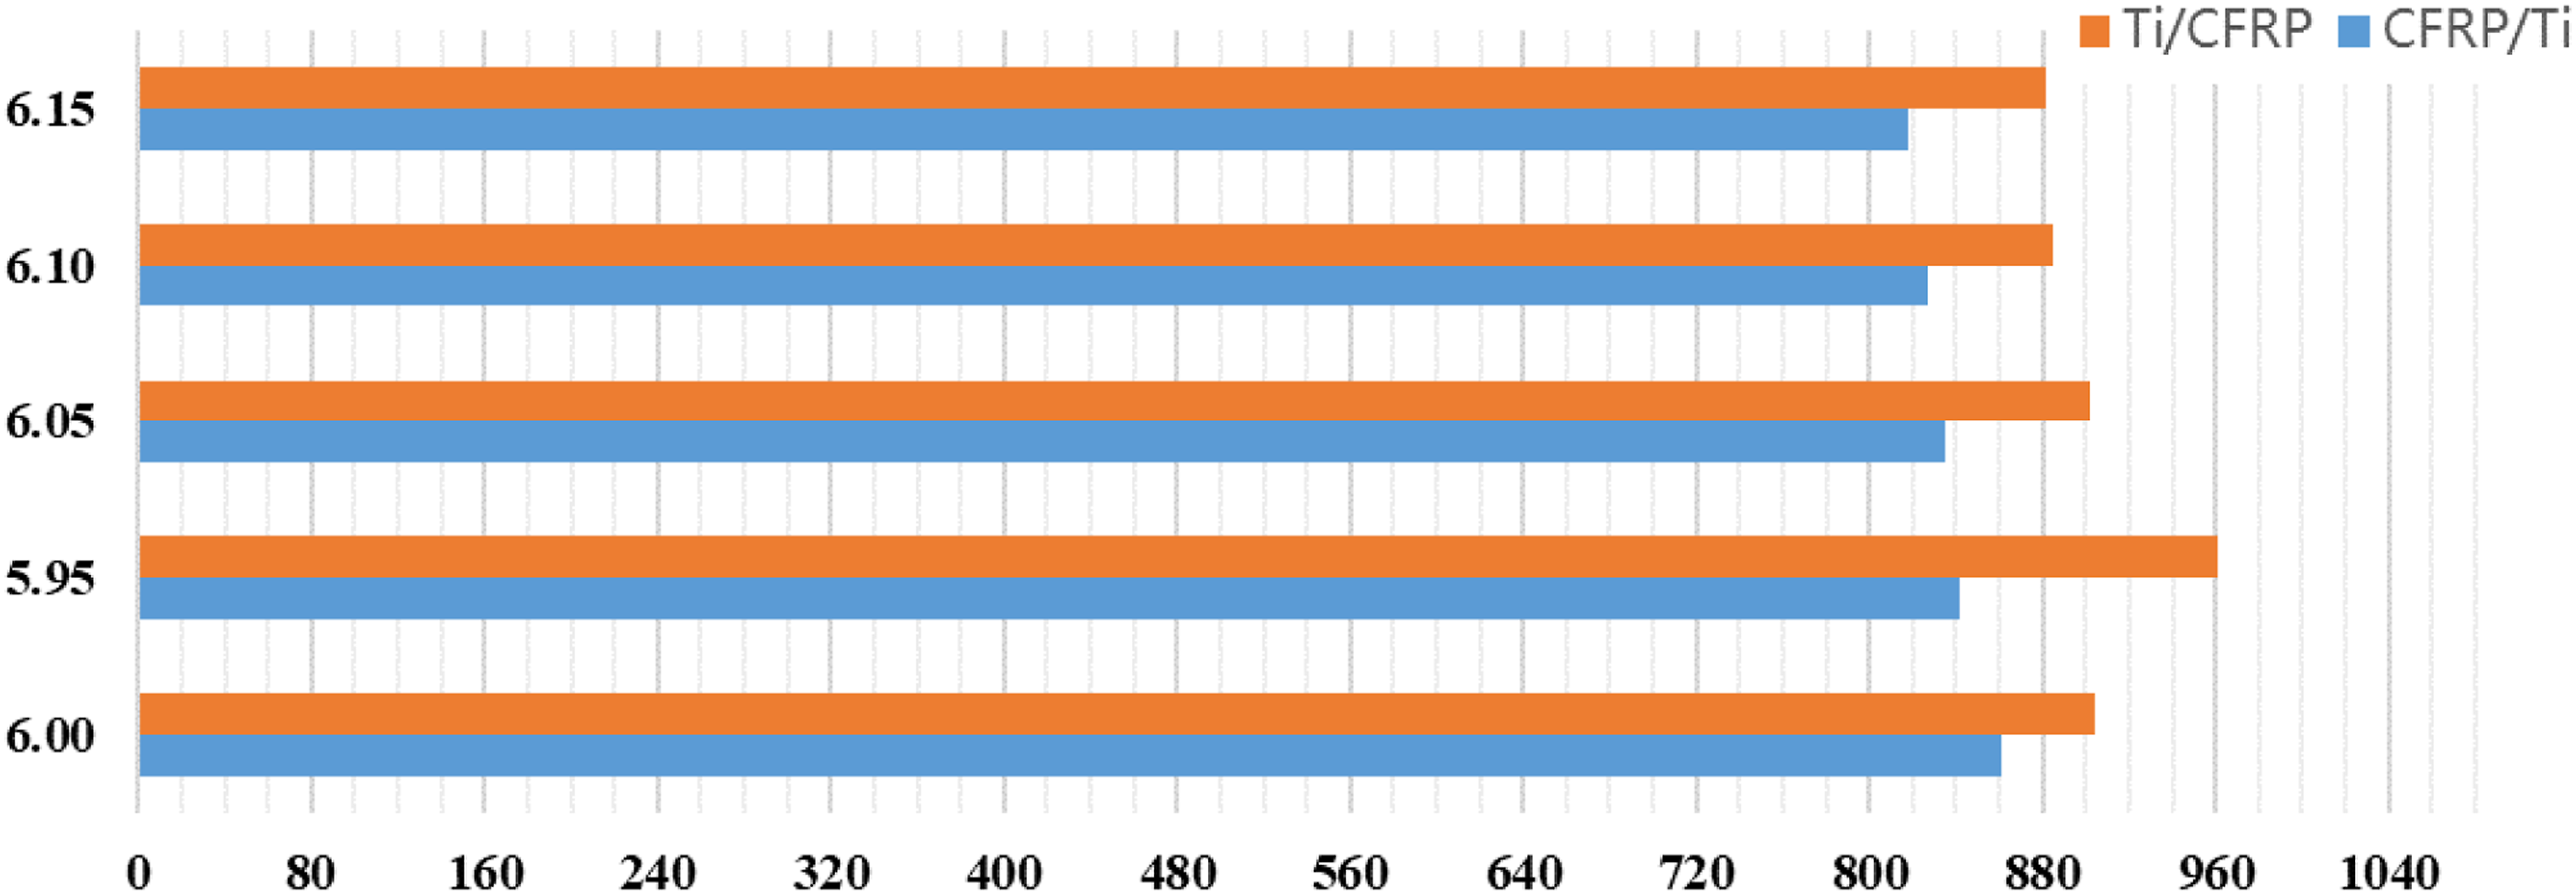
Comparison of static strength between two lamination methods.
The force-displacement curve of Ti/CFRP laminated specimens during static tensile testing is presented in Figure 23. The graph illustrates that the static tensile process of the specimen under this lamination method can be divided into three stages: elastic deformation stage, plastic deformation stage, and failure stage. In contrast to CFRP/Ti lamination, there is no local deformation stage observed. During the plastic deformation stage, the static tensile force increases until it reaches a certain level and then suddenly drops to zero. The ultimate static tensile force of the specimen refers to the maximum force value achieved before reaching the failure stage. Static tensile force-displacement curves of different types of specimens.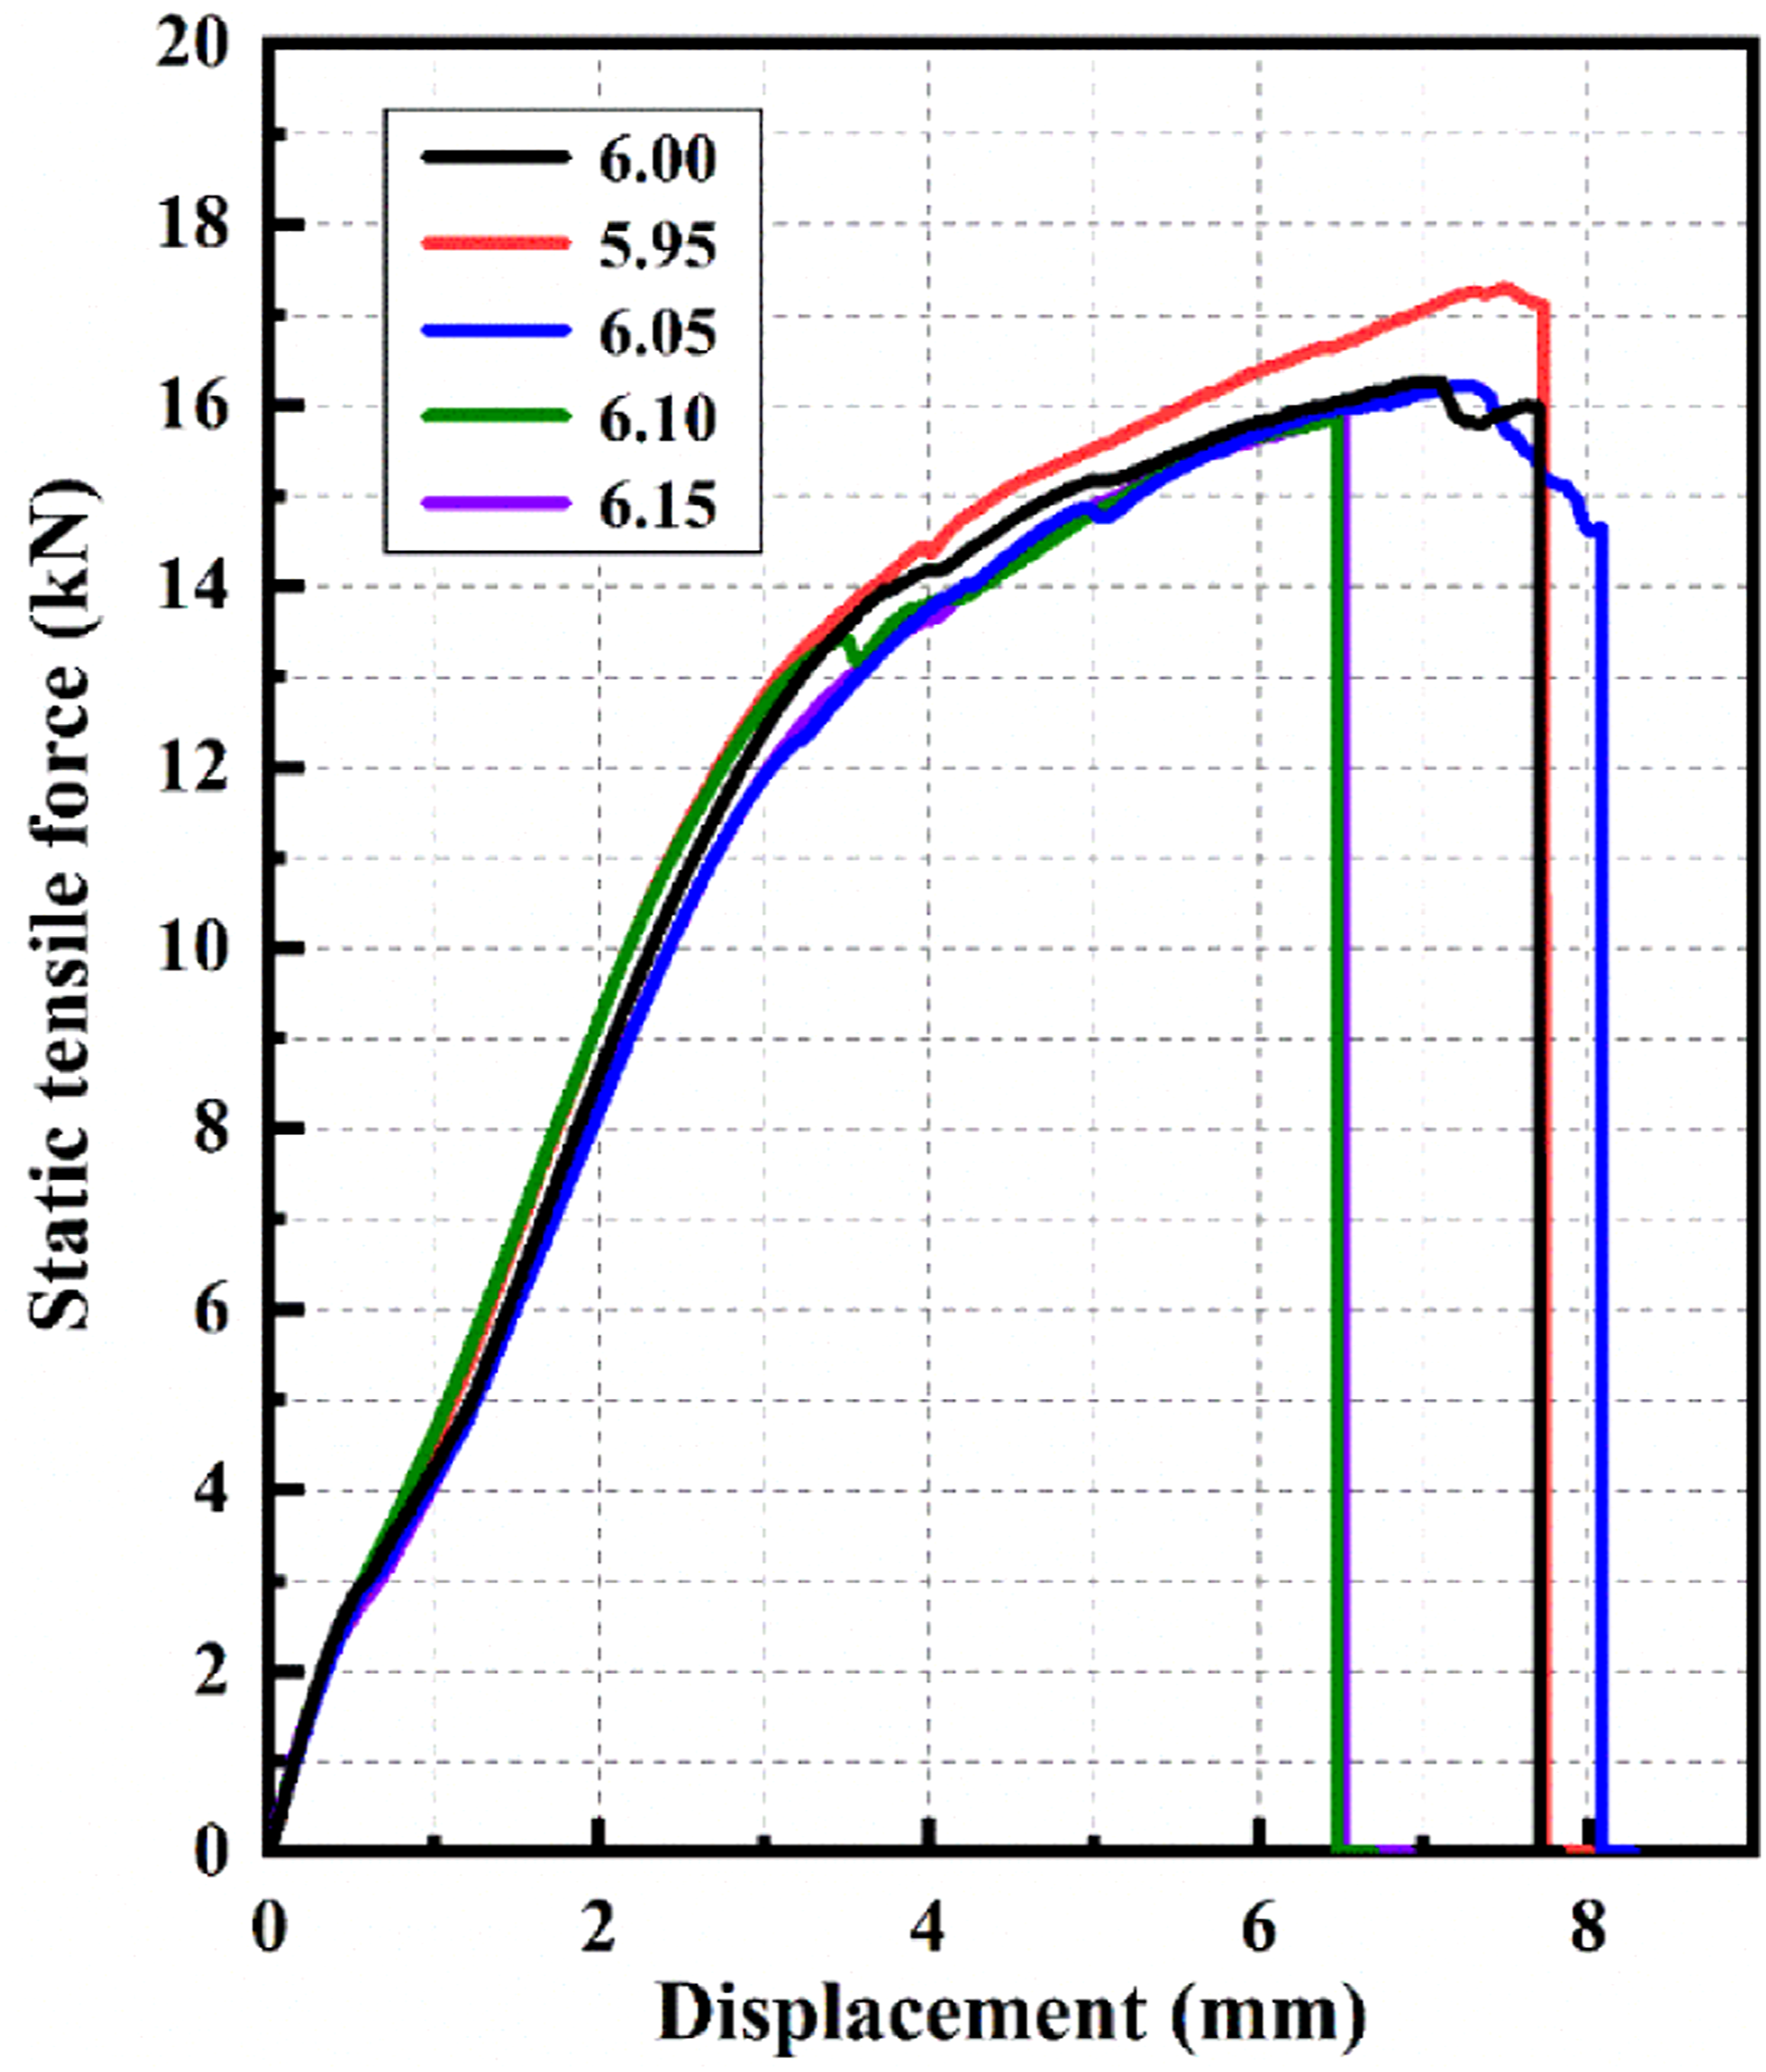
The failure depicted in the curve is characterized by high randomness and suddenness. The specimen fails completely when the tensile displacement reaches approximately 8 mm, although the CFRP/Ti laminated specimen can still withstand a certain static load when stretched above 10 mm. It is important to note that fastener fracture failure is violent, resulting in an almost abrupt drop in force with a huge change in amplitude upon failure. During aircraft service, sudden failure of a single fastener can cause other fasteners to bear impact loads, which poses significant danger to the overall structure and may trigger a series of connector failures. Additionally, microcracks in fasteners are difficult to detect during maintenance inspections and their sudden failures leave little time for emergency response measures.
On the other hand, pull-out failure occurs relatively slowly with smaller changes in force amplitude and requires significant tensile displacement at failure. Bolt inclination is also obvious and easy to detect making it a better preventable mode of failure.
In summary, while Ti/CFRP laminated components have relatively high static tensile strength; considering stability during aircraft service; connecting using CFRP/Ti lamination method would be recommended.
The effect of double-step pore defects on the fatigue performance of laminated components
Plan for fatigue testing
The ASTM D6873 standard was followed for the fatigue test, which was performed using the LFV 100 kN electro-hydraulic servo fatigue testing machine manufactured by W + B of Switzerland (as depicted in Figure 24). The upper clamp of the testing machine remained fixed while the lower clamp applied cyclic loads to the specimen through reciprocating motion at a fixed frequency. Fatigue test. (a) Electro-hydraulic servo fatigue testing machine. (b) Schematic diagram of the testing machine.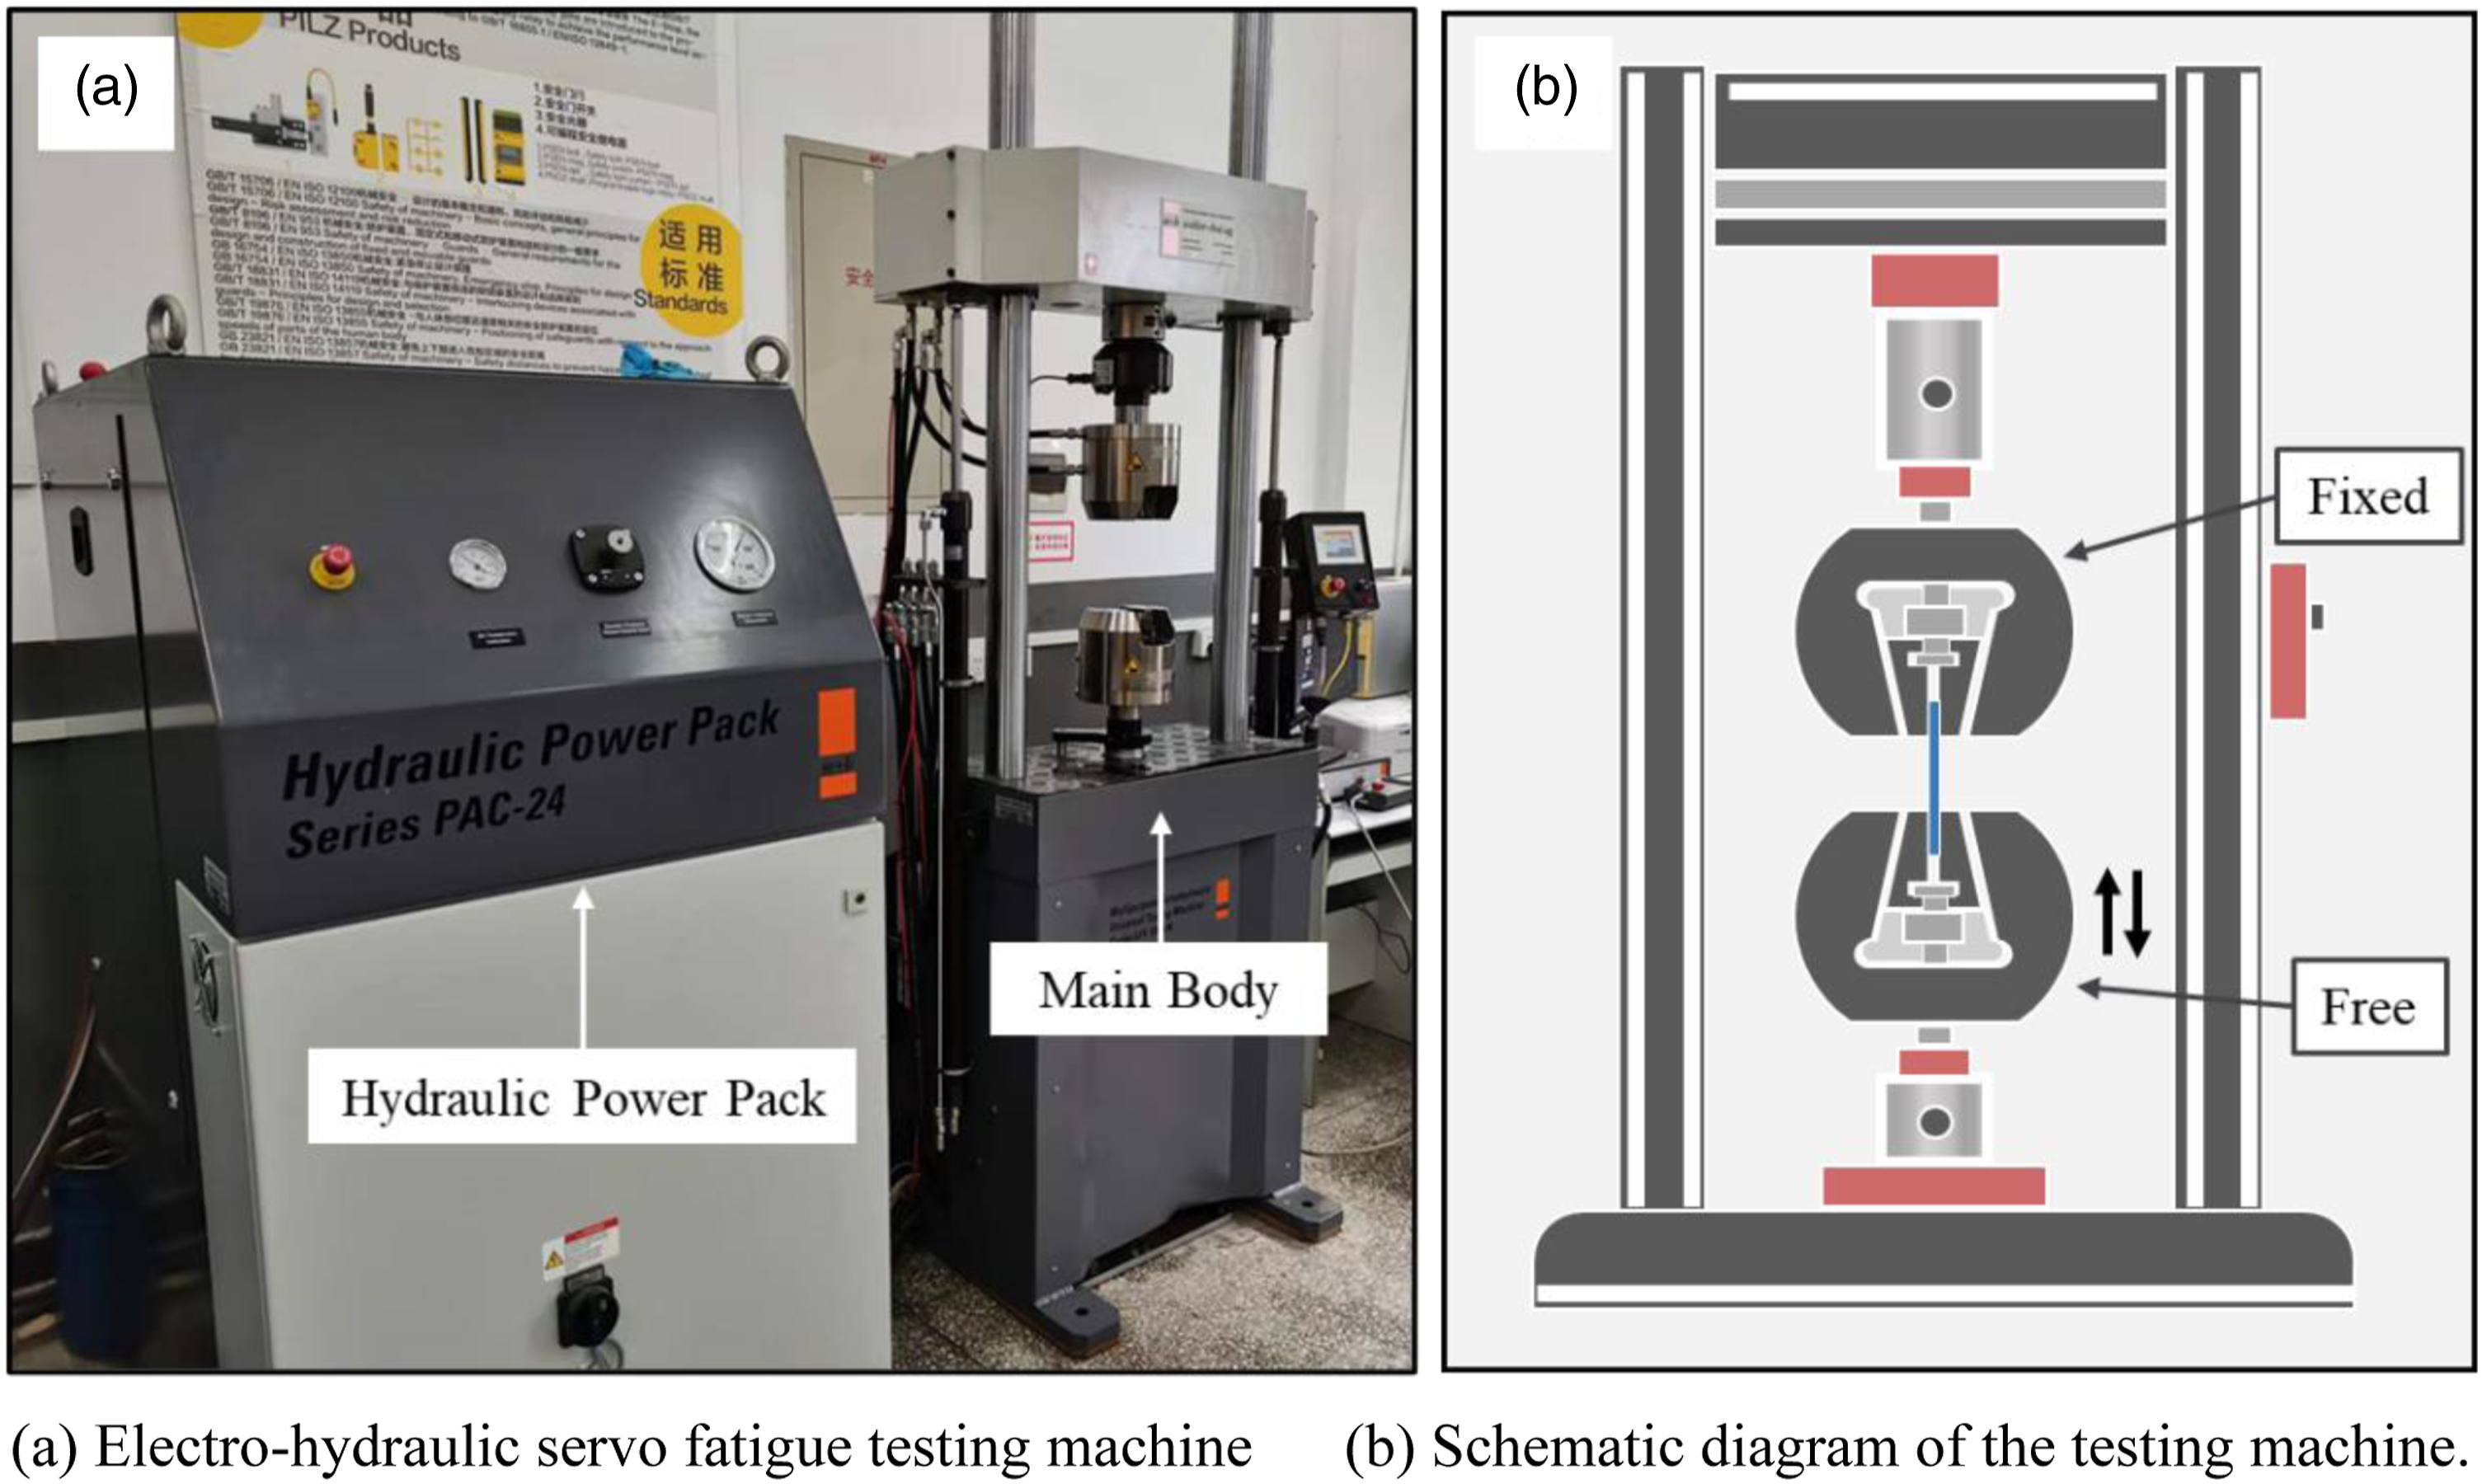
The loading process follows a sinusoidal pattern. Initially, the load increases linearly at a rate of 0.25 kN/s until it reaches the average load level (55% of peak load). After that, cyclic loading begins in a sinusoidal waveform. To prevent high-temperature effects caused by vibration on test results, a high-power electric fan is used to cool the specimen during testing. Additionally, an infrared thermal imager is utilized to measure surface temperature and ensure it remains below 35°C (as shown in Figure 25). Deformation data is collected using extensometers installed on specimens, similar to tensile tests. Infrared thermal imaging temperature measurement. (a) Infrared thermal imager. (b) Diagram of the principle. (c) Measurement results.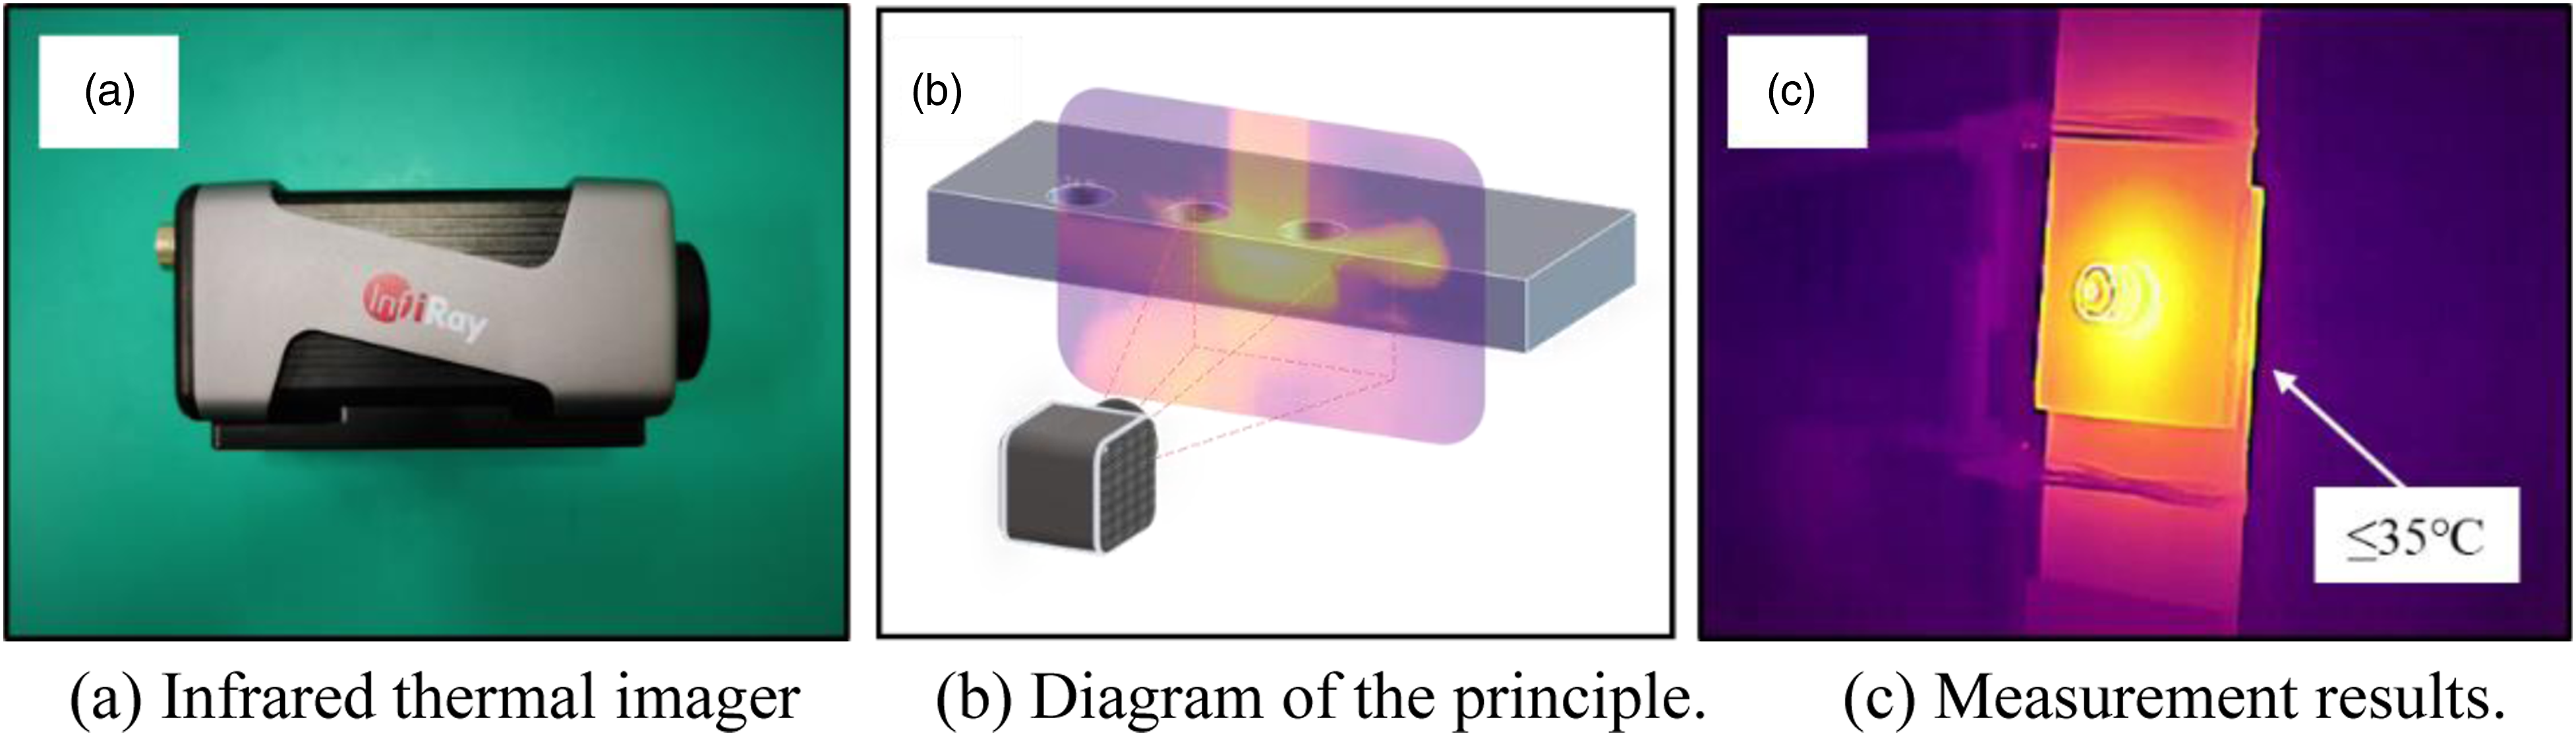
In cyclic loading, the maximum load (Pmax) is known as the fatigue load. The fatigue load ratio (q) represents the proportion of fatigue load to ultimate tensile strength. To conduct tests, four different ratios were chosen: 0.4, 0.5, 0.6 and 0.65 using a tension fatigue test with a stress ratio of 0.1 and a loading frequency of 10 Hz in force control mode.
If there is noticeable damage during cyclic loading, stop testing and record the number of cycles at that point as the specimen's fatigue life while exporting displacement versus cycle curve data during testing.
Experiment specimen fatigue failure mode
After undergoing several loading cycles, the test piece experienced fatigue failure. Figure 26 displays the macroscopic morphology of the failed specimen, revealing that fatigue failure primarily occurred in the titanium alloy layer with transverse and V-shaped rupture shapes. Fatigue cracks originated at the pore's edge, while micro-movement wear marks were visible at both contact surfaces between two layers of plates and at the junction between plate and bolt. Comparing these results to static tensile failure outcomes shows that composite material layers are more sensitive to static tensile loads, whereas titanium alloys' fatigue failures require attention under cyclic loads. Fatigue failure morphology diagram. (a–e) Macroscopic appearance diagram of failure. (f) Failure morphology magnified view. (g) Schematic diagram of bolt inclination after failure.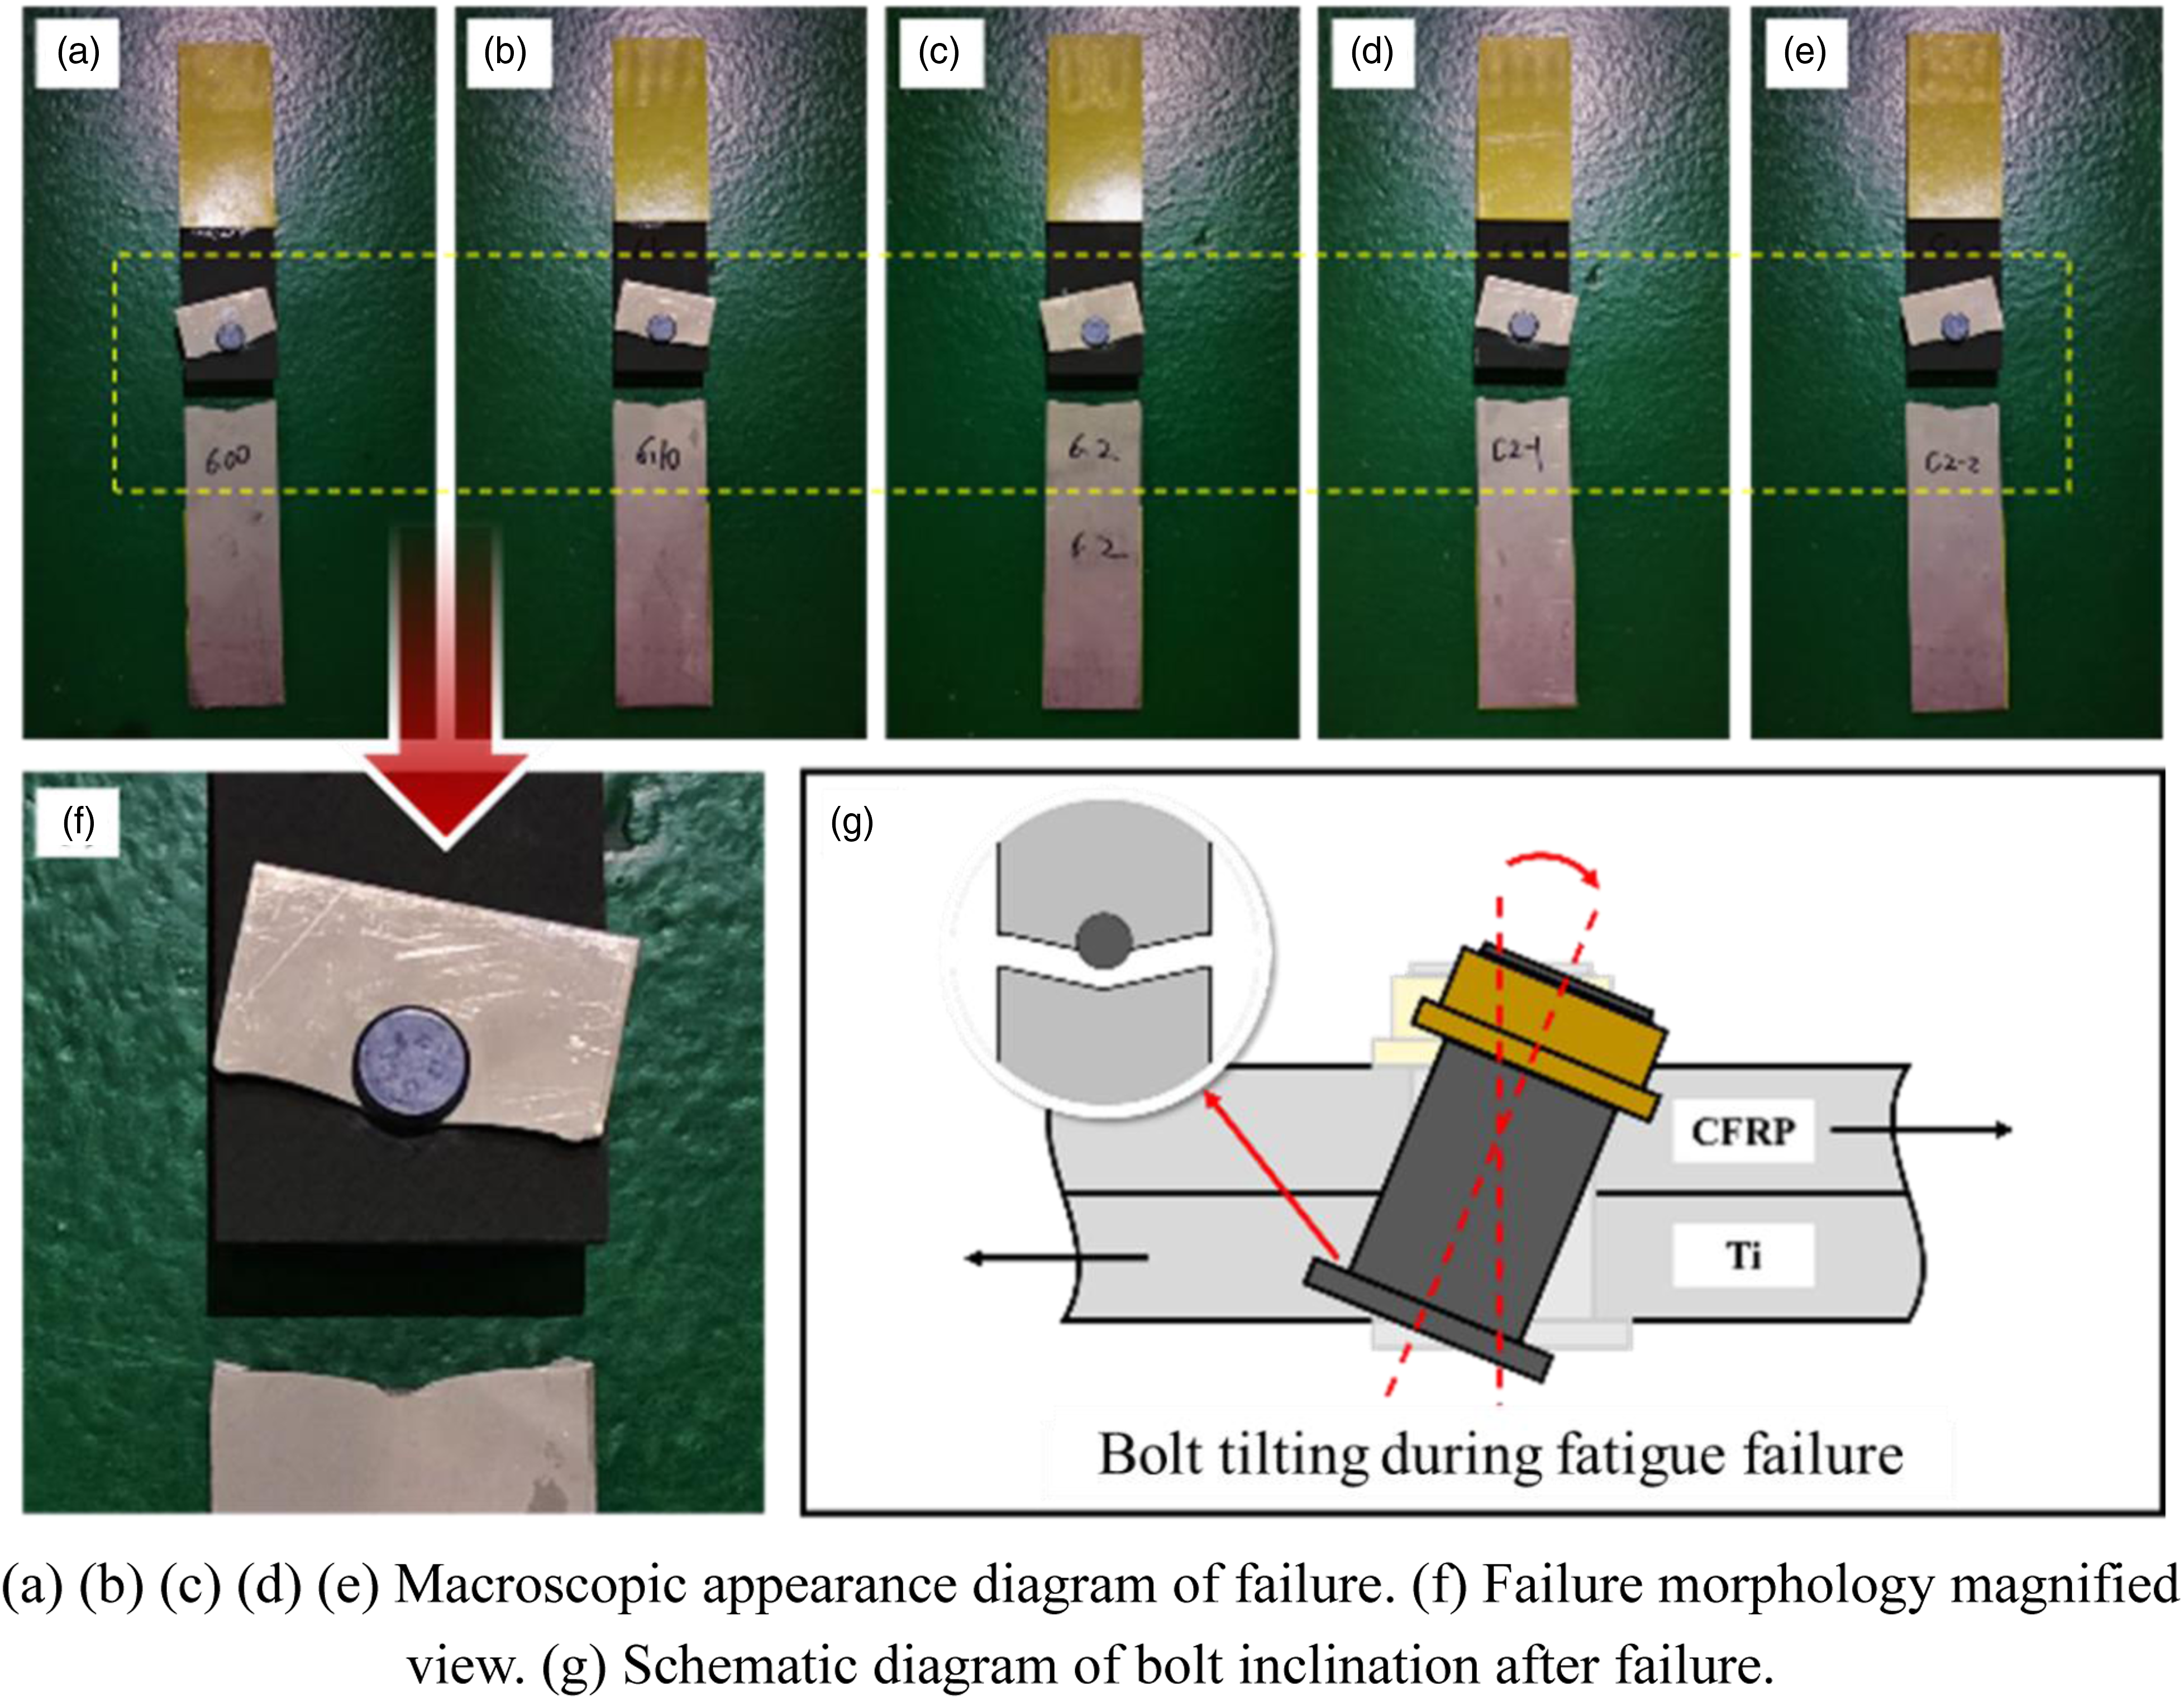
All test pieces exhibited identical failure modes, indicating that DSPD do not alter a test piece's fatigue failure mode. Additionally, an increase in loading times resulted in permanent deformation on loaded-side pore walls of composite material layers due to continuous compression by bolts; this caused bolts to tilt slightly.
The influence of double-step pore defects on the fatigue life of laminated components
Fatigue test results of specimens with DSPD.
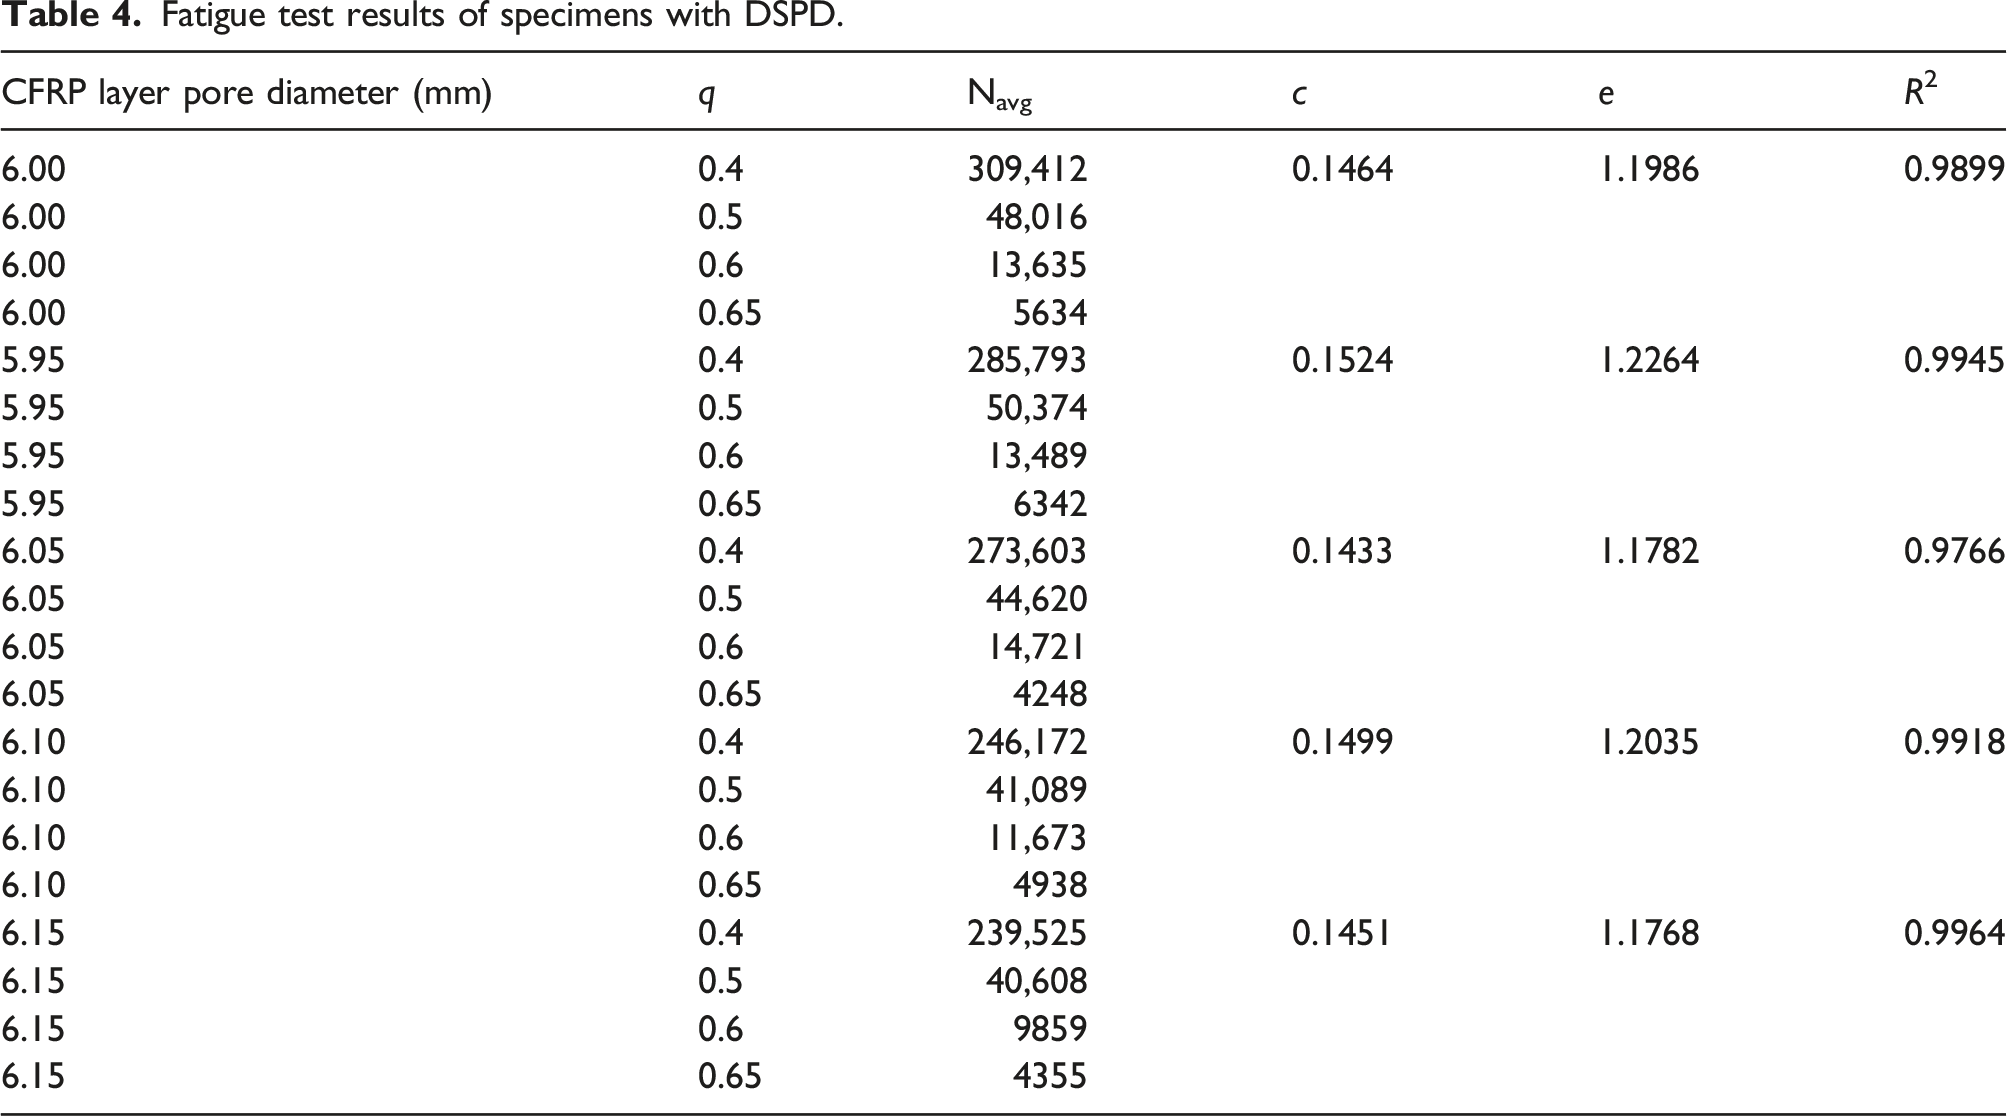
In general, test specimens without DSPD have the highest fatigue life. The presence of DSPD has a negative impact on fatigue life. When delamination occurs in composite layers (groups 6.05, 6.10, and 6.15), the specimen's fatigue life is significantly reduced, and the degree of reduction is positively correlated with pore size. Delamination has a major impact on high-cycle fatigue. When compared to specimens without defects, the presence of DSPD with pore sizes of 0.5 mm, 0.10 mm, and 0.15 mm results in a reduction of fatigue life by 11.57%, 20.44%, and 22.59% respectively.
Shrinkage pores can have an unpredictable impact on the fatigue life of specimens. In tests with load ratios of 0.5 and 0.65, there were instances where defective specimens had higher fatigue lives than defect-free ones due to two reasons: Firstly, interference caused by shrinkage pores delays plastic deformation during cyclic loading processes which provides resistance against bolt tilt accumulation damage that has a positive effect on fatigue performance. Secondly, for specimens containing −0.05 mm DSPD, interference pins are required during the connection process which can cause cracks in pore walls due to compression from bolt rods onto plate materials especially when initial damages such as layering or fiber fracture occur more frequently in composite layers resulting in negative effects on their fatigue properties.
The influences of these factors are relatively consistent in low-cycle fatigue, where their effects counterbalance each other. Meanwhile, shrinkage phenomena also exhibit randomness in their impact on fatigue life. However, in high-cycle fatigue, wall crackings resulting from initial damages tend to dominate, leading to reduced longevity. Considering that aircraft failures during service often arise from high-cycle fatigue failure, the stochastic nature of the impact of shrinkage-type DSPD on fatigue life should be a significant concern in long-life design and should be minimized whenever possible.
Based on the relationship between fatigue load ratio and fatigue life, formula (3) was used to fit the test data, resulting in the SN curve shown in Figure 27. SN curve.
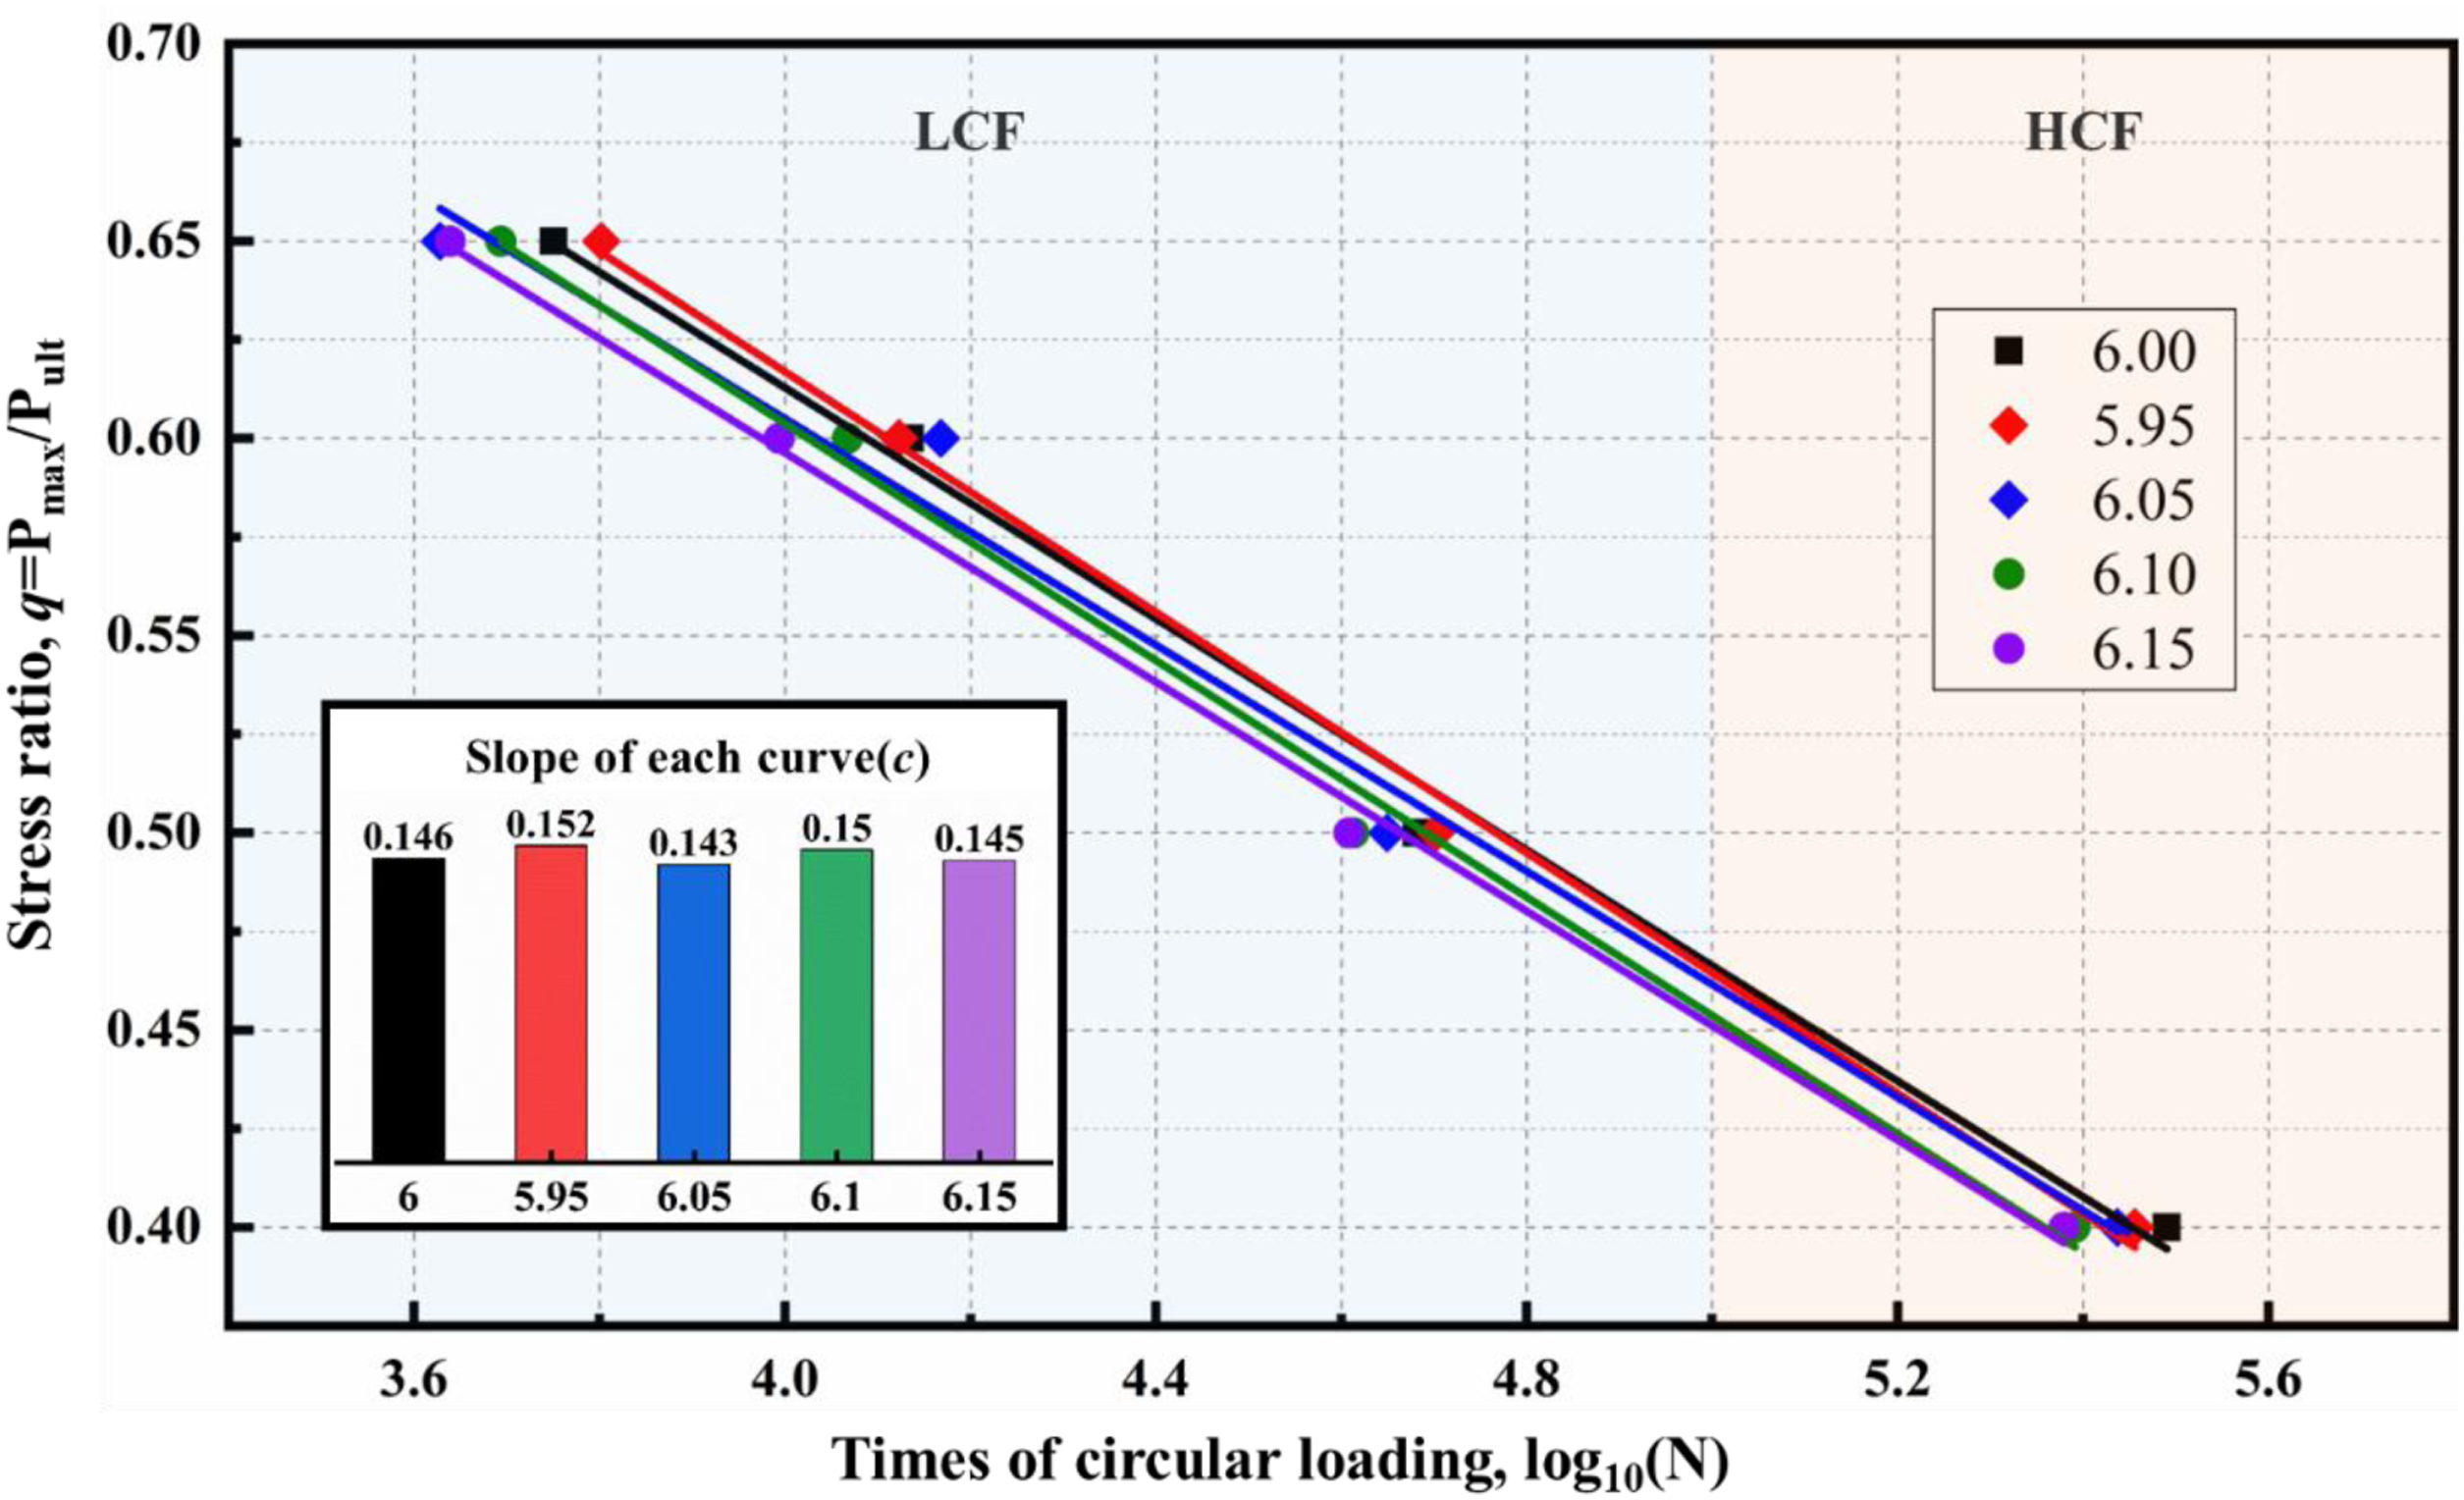
The formula includes q, which stands for the fatigue load ratio, N representing the fatigue life. Additionally, c and e are fitting parameters. The coefficient of determination is denoted by R2.
Figure 27 shows that the SN curves of each specimen group have a similar shape, with Coefficient of Determination above 0.95 indicating good curve fitting. The defect-free specimens and those with shrinkage-type defects exhibit better fatigue performance under equivalent load conditions, as they are located at the top (with the largest e value) of the curves. As the defect level increases, there is a gradual decrease in e values. At a defect level of 0.15 mm, the minimum e value is 1.177.
The c value of the curve reflects how sensitive fatigue life is to load levels. In this test group, specimens containing −0.05 mm DSPD had the highest c value at 0.152, indicating that under this defect level, fatigue life was most affected by load ratio. The c value for defect-free specimens was 0.146 and remained relatively constant as defect levels increased.
Law of fatigue damage evolution under the influence of initial damage
The permanent displacement of the specimen is caused by accumulated damage, and its progression can indicate the evolution process of fatigue damage.
Figure 28 shows that the permanent displacement evolution curve of specimens with DSPD, using the q = 0.5 test group as an example. The figure indicates that DSPD have a significant impact on the evolution process, primarily reflected in the starting value of permanent displacement. For specimens with shrinkage defects, their starting value of permanent displacement is slightly lower than that of defect-free specimens. In group 5.95, for instance, the starting value is reduced by 0.028 mm compared to group 6.00 without any flaws due to interference caused by nail-pore matching hindering pore deformation and bolt deflection. However, damage to pore walls during interference insertion may accelerate fatigue damage accumulation and increase the speed of permanent displacement under its comprehensive effect resulting in a similar appearance time for stage three (failure stage) evolution as defect-free specimens at different load levels but with varying heights. Evolution of permanent displacement in specimens with DSPD.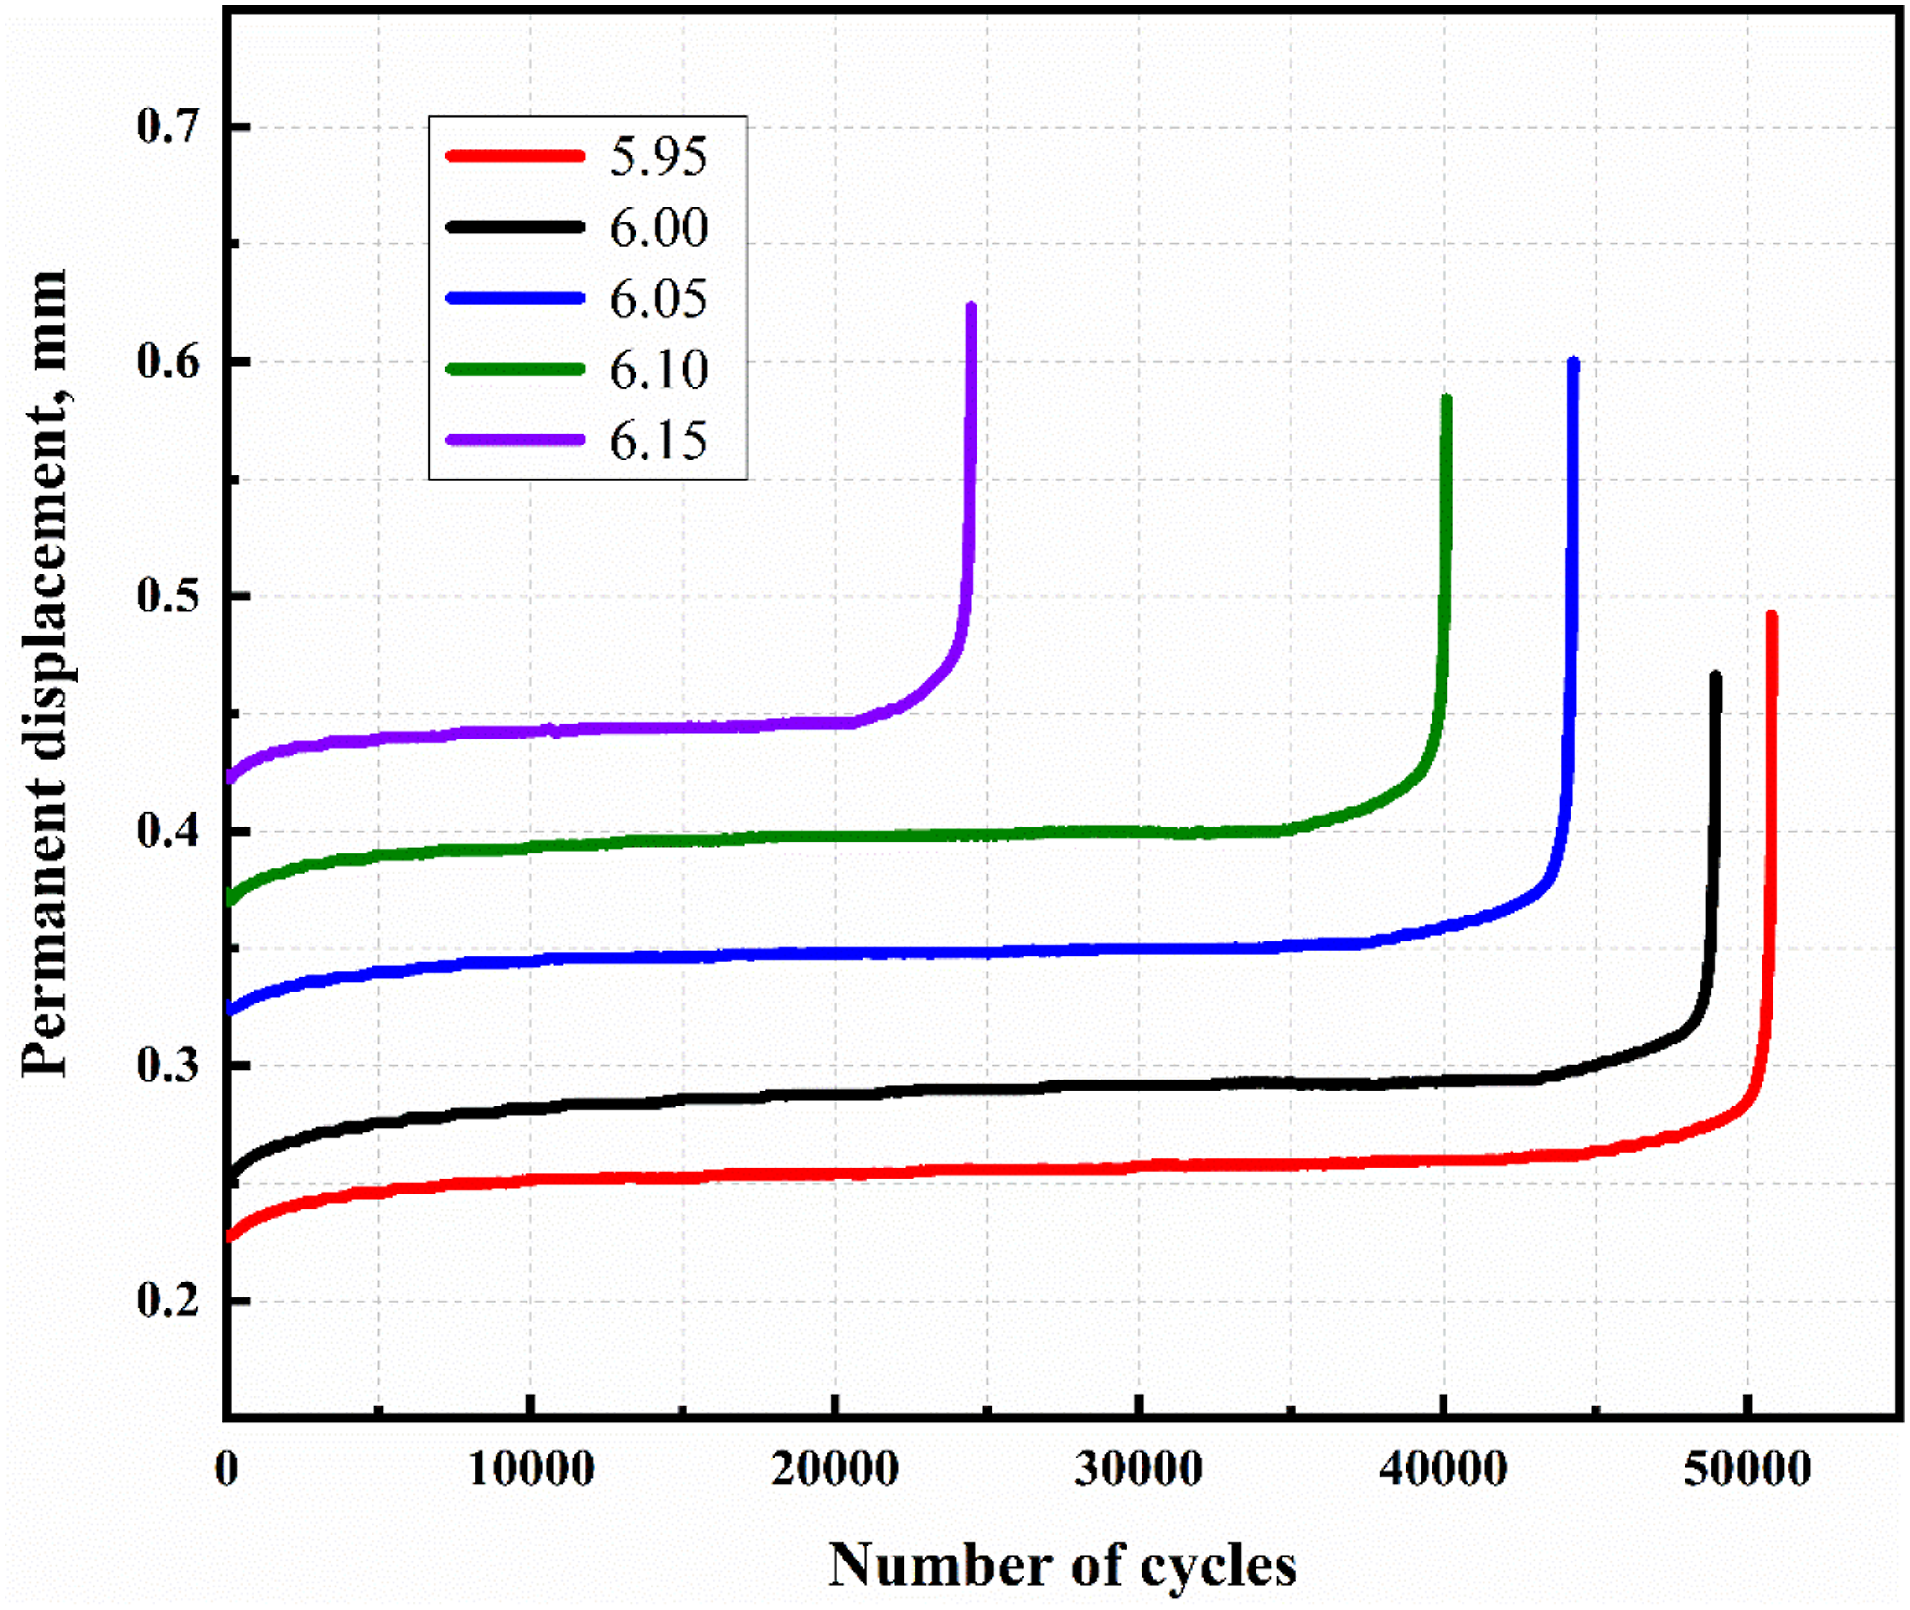
On the other hand, for specimens with expansion defects, their starting value of permanent displacement is higher than that of defect-free ones; thus more severe expansion pores lead to even higher values. For groups 6.05, 6.10 and 6.15 respectively, these values are significantly higher than those for group six without any flaws leading to faster fatigue failure due to increased initial values. The main reason behind this phenomenon lies in larger composite layer pore size caused by expansion effects leaving bigger gaps between nail pores which weaken composite layers' resistance against tilting nails while imposing greater burden on titanium alloy layers causing microcracks initiation and extension speeds acceleration ultimately leading to premature fatigue failure. This curve confirms that both shrinkage and expansion defects are detrimental to fatigue performance; hence controlling DSPD at a low level in engineering is crucial for ensuring sufficient service life of aircrafts
Conclusion
After studying the connection performance of CFRP/Ti laminated components with DSPD, the following conclusions have been drawn: (1) Components with DSPD exhibit initial damage, and their difference from standard pore components is mainly reflected in the Ti layer. The stress level of units in the stepped area adjacent to the CFRP layer decreases while that of units in contact with nuts increases. When external loads are applied, DSPD cause more concentrated deformation near the wall position of pores in loaded areas and accelerate plastic deformation accumulation. (2) DSPD at different levels reduce static strength of specimens; this reduction increases as defect level rises. Lamination order affects failure mode: when nuts are fixed on composite material side, specimens experience pull-out failure; when nuts are fixed on titanium alloy side, fastener failure becomes dominant. (3) Specimens without manufacturing defect have highest fatigue life. Shrinkage-type DSPD impact fatigue life in high-cycle fatigue, where the predominance of initial damages such as pore wall cracks leads to a reduction in fatigue life; expansion-type DSPD negatively impact fatigue life which increases as deviation level rises.
Footnotes
Declaration of conflicting interests
The author(s) declared no potential conflicts of interest with respect to the research, authorship, and/or publication of this article.
Funding
The author(s) disclosed receipt of the following financial support for the research, authorship, and/or publication of this article: This work was supported by the National Natural Science Foundation of China (52275434).