
Abstract
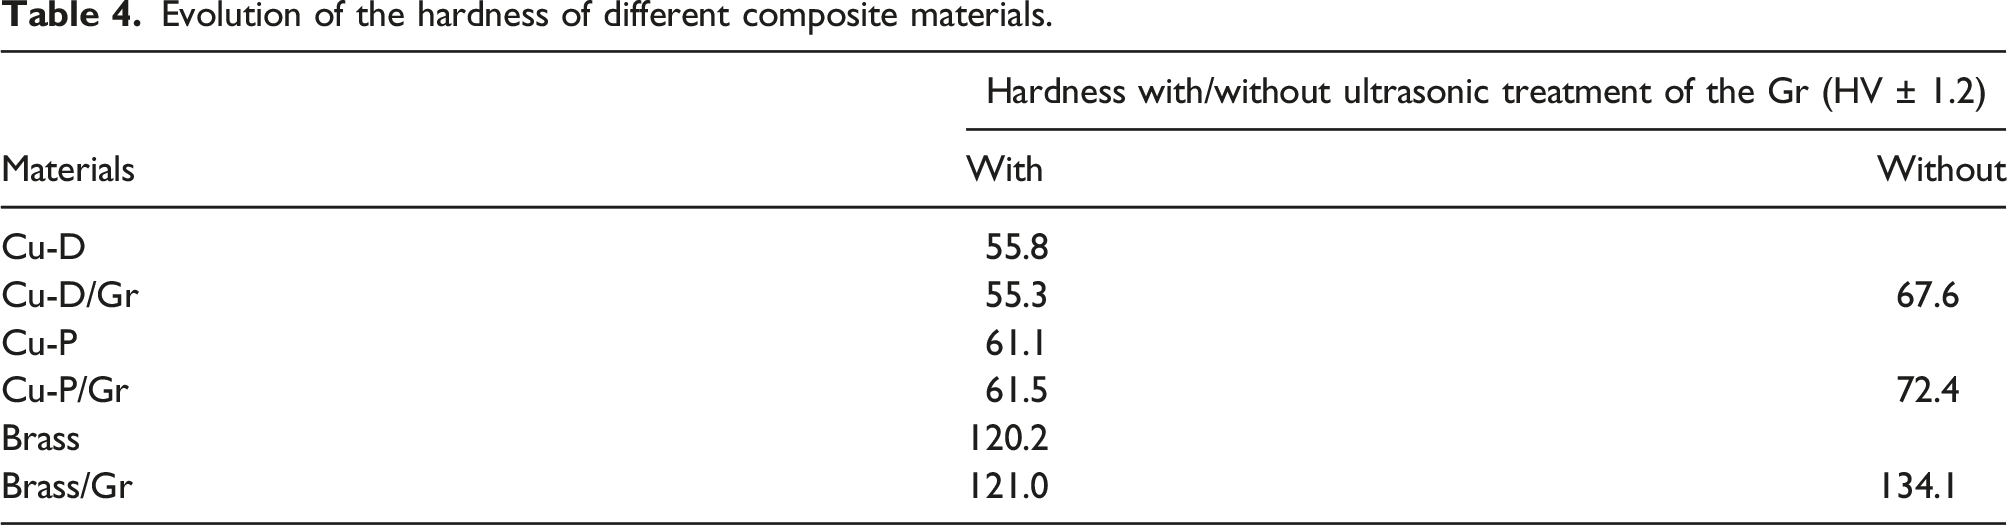
The consistent rise in current density within electrical wires leads to progressively more substantial heat losses attributed to the Joule effect. Consequently, mitigating the electrical resistivity of copper wires becomes imperative. To attain this objective, the development of a composite material that incorporates a more conductive reinforcement, like graphene, holds great promise. The conception of a copper/graphene composite using a powder metallurgy-based approach is presented. An optimum graphene quantity of 0.06 vol.% was obtained by calculation in order to limit the phenomenon of overlapping layers. This synthesis technique enables the dispersion of graphene and the meticulous control of the interface through the growth of CuO(Cu) nanoparticles that are tightly bonded to the reinforcement. The increase in the hardness of the various materials with separation of the graphene sheets by ultrasonic treatment (55.3 to 67.6 HV) was obtained. It is an indicator of the correct distribution of the reinforcement. The influence on the electrical properties of dendritic copper (ρe = 2.30 µΩ.cm) remains limited, resulting in a modest reduction in electrical resistance of around 1.4%. Nevertheless, for flake copper (2.71 µΩ.cm) and brass (7.66 µΩ.cm), we achieved a more substantial reduction of 2.7% and 10%, respectively. With the improvement of graphene quality, there exists a greater potential for further enhancing the electrical properties.
Introduction
Currently, copper (Cu) is the most widely used metal for electrical systems. This is mainly due to its mechanical properties, particularly its ductility which allows for easy shaping; as well as its electrical resistivity, which is among the lowest among metals (1.78 µΩ.cm at 20 °C 1 ). When a significant current density is applied to an electrical system, a non-negligible portion of energy is lost as heat. This phenomenon is known as Joule heating, and can result in energy losses (close to 10% according to l’IEA 2 ) and potentially damage to the system if not properly managed. The use of a material with a lower electrical resistivity appears to be a viable solution to address this issue.
Only silver (Ag) can meet this criterion but the expensive costs exclude itself from industrial applications (8.8 €/kg for Cu against 750 €/kg for Ag 3 ). An alternative is to develop a composite material using a reinforcement that is less resistive than Cu. From our knowledge, only graphene (Gr) can fulfil this requirement for an application involving 2D materials. Known since the 1960s, it was only in 2004 that K. Novoselov and A. Geim 4 were able, for the first time, to isolate graphene sheets using mechanical exfoliation, commonly called the “scotch trick”. The great attraction of scientists to this 2D material comes from the sp2 hybridization of carbon atoms. In this case, two of the valence orbitals Px and Py will form σ bonds in the plane of the graphene (which is the origin of the hexagonal structure). This allows a delocalization of the Pz orbital directed perpendicularly to the graphite plane. The overlapping of these Pz orbitals allows the formation of π-π* bonds between carbon atoms, which are responsible for amazing electronic properties.5,6 As a result, Gr has a unique band structure with a semiconductor-like behaviour with a zero bandgap. This allows electrons to flow through the structure without collision, thus adopt a ballistic behaviour. These characteristics of Gr lead to exceptional electrical properties (200,000 cm2/vs, again 33 cm2/vs for Cu 7 ), thermal properties (5600 W/mK, 8 compare to 400 W/mK for Cu), and mechanical properties (Young’s modulus of 1 TPa and tensile strength of 130 GPa 9 ). Due to these properties, the Gr has been used as a reinforcement in various types of composite materials such as polymers, metals, or ceramics. However, the different methods to fabricate these composites have their own advantages and disadvantages that affect the final properties. Nevertheless, based on powder metallurgy (used in this study), three main points are important to master in order to obtain a high-performance composite material.
The first two factors to be considered are the distribution 10 and orientation of the Gr reinforcement within the matrix. 11 An agglomeration of several graphene layers or a significant overall misorientation of the reinforcement will result in the degradation of the macroscopic properties of the composite materials. The reinforcement-matrix (R-M) interface is also critical for ensuring proper transfer of properties between both materials. However, Cu and carbon have no chemical affinities leading to a poor interfacial property transfer. Two methods exist to create interfacial chemical bonding: the first involves using a carbide element which will react with carbon to form carbide interphase. 12 However, the formation of this carbide interphase is associated with the reaction of carbon and therefore of the degradation and/or the total of consumption of Gr, making this method inappropriate for nanometric carbon-based reinforcement. The second method involves the growth of metallic nanoparticle, chemically linked with the carbon atom surface of Gr, on the surface of the reinforcement. 13 These particles can be made from various materials (Cu, Ag, Cr, Ni14,15). Cu will be chosen to match the matrix. Nevertheless, there are very few articles reporting a decrease in electrical resistivity of such a composite compared to pure Cu. Keerti S. et al. 16 show a 2.7% increase in electrical conductivity of pure Cu with the incorporation of 15 ppm (0.006 vol.%) of graphene, while Mu Cao’s team 17 obtained over 15% increases in electrical conductivity compared to pure Cu. However, the fabrication method employed by the latter is too sophisticated to be viable for industrial applications. However, these two studies remain exceptions because in most cases (i.e.,18,19) increases in electrical resistivity are obtained following the preparation of graphene reinforcement composites.
In this work, Cu/Gr and brass/Gr composite materials were fabricated using conventional powder metallurgy processes. A first surface treatment of the Gr involves an acid treatment to remove surface contamination and graft oxygen functional groups. Then, a second treatment enables the growth of Cu nanoparticles (on the functionalized groups) that will be chemically bonded to the Gr. Subsequently, an innovative method for mixing copper powder and graphene will be used to obtain a homogeneous powder without degradation. Finally, the powders will be densified using a hot uniaxial pressing method. Hardness and electrical conductivity were measured on each sample and compared to non-reinforced materials. The main goal was the increasement of the electrical conductivity of the composite (positive composite effect), which is a novel and rarely represented work in the literature.
Materials and methods
Raw materials
Dendritic Cu (Cu-D) powder with an average length size of 50 µm and a diameter of 10 µm, and flake Cu (Cu-P) powder with an average width of 20 µm and a thickness of 350 nm were purchased from ECKART (Figure 1(a) and (b)). Flake brass (Bra-P) (80% Cu, 20% Zn) powder, purchased from Werth-Metal, has an average length size of 40 µm and a diameter of 10 µm (Figure 1(c)). These powders were used as received without further treatment. Multilayer Gr powder (KNG-5) with a lateral size of 5–10 µm and an average thickness of 2–3 nm (3–9 atomic layers) were bought from KNANO Company. This MLG was made by a chemical exfoliation method of graphite. SEM analysis of dendritic and flake Cu (a) and (b) and flake brass (c).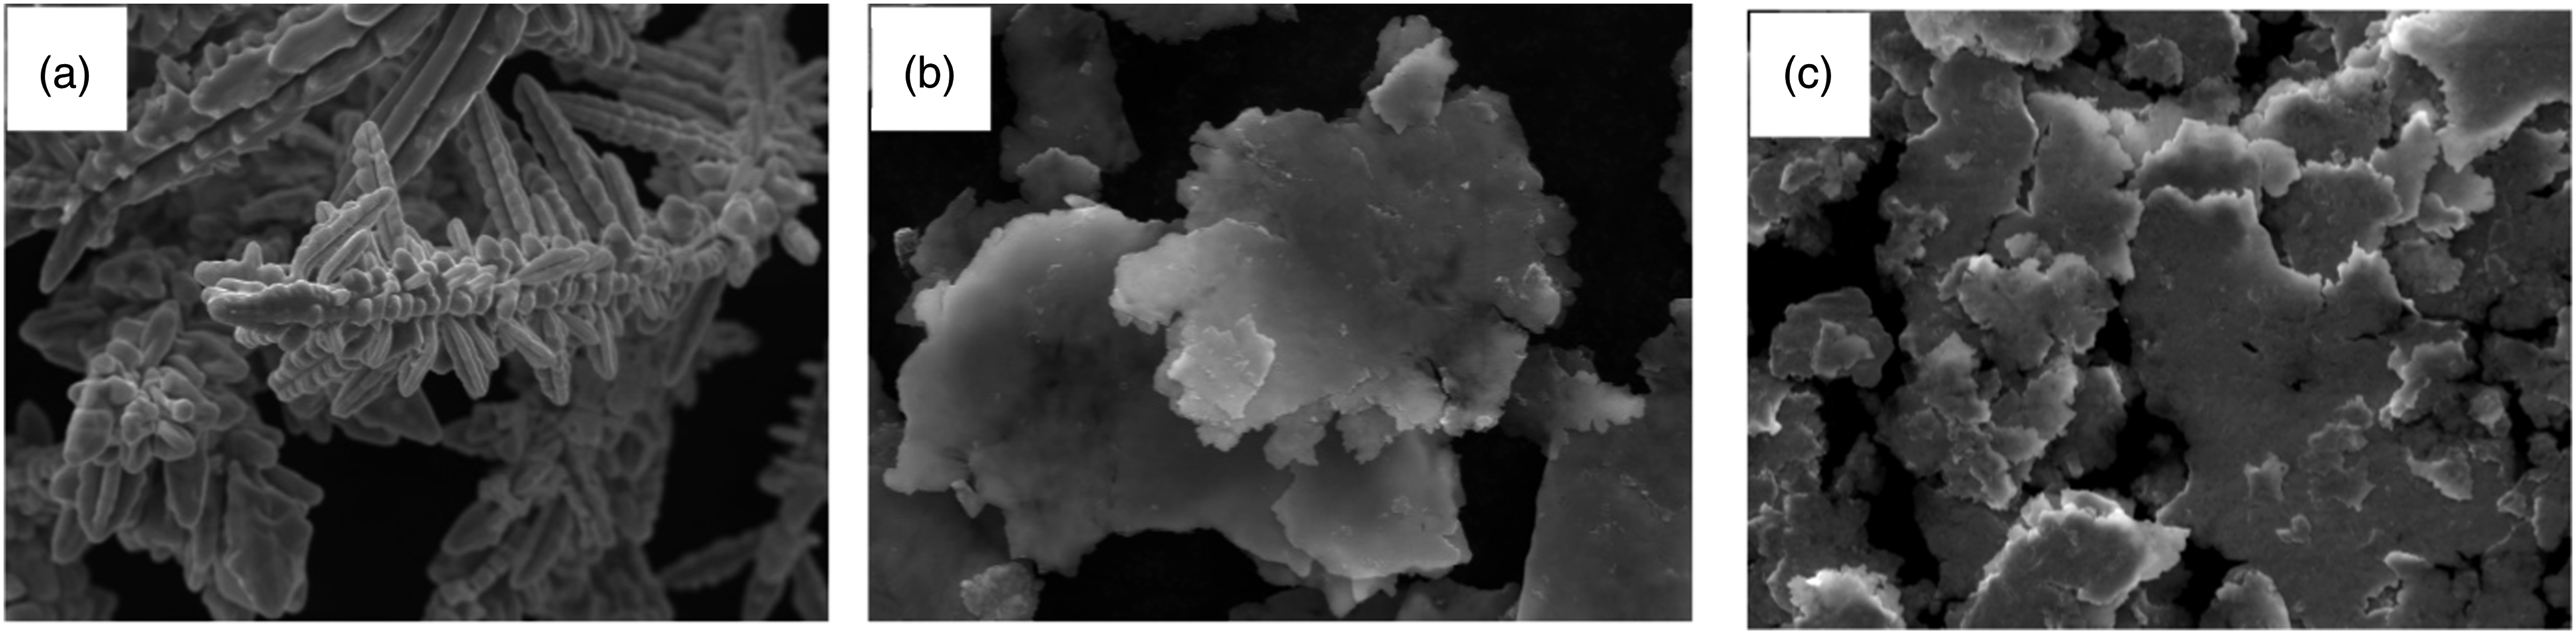
Fabrication of the composite materials
First, homogenization of the Gr reinforcement in an ethanol solution of 0.1 g/L concentration was carried out using an acoustic mixer, with an acceleration of 80 g for 6 min. An acoustic type mixer (LABRAM II Resodyn) was then used in order to reach an optimal “matrix + reinforcement”. In this process, the “ethanol + Gr solution” was spread on the surface of the Cu powders which were in levitation induced by the acoustic wave of the mixer. In order to reduce the surface oxidation of the Cu powder as well as the CuO nanoparticles, the composite powder “Cu + Gr” obtained was dried and reduced in a furnace at 400 °C for 60 min under a flow of Ar/5%. H2. The densification of the composite materials was carried out using a Thermolab press equipped with an inductive heating system. The densification parameters are a temperature of 650 °C applied for 45 min under a pressure of 60 MPa in an inert atmosphere. Relative densities, equal or greater than 99% whatever the materials, were measured using the Archimedes' displacement method.
Characterization method
Hardness of different materials was measured using the Micro-Vickers hardness method equipped with a square-based diamond pyramid tip. The measurements are performed in the plane perpendicular to the densification direction, using a force of 20 kgf to obtain the largest possible indentation. Each sample is indented ten times on both sides to ensure the lowest possible uncertainty. The electrical resistivity of the composites was measured by typical a four-point contact probe. Both outer tips are connected to the generator for current injection with an ammeter for current measurement. Both inner tips are connected to a nano-voltmeter for voltage measurement. This system was placed in a temperature-controlled oven to perform measurements at various temperatures. A thermocouple was also placed under the sample to obtain an accurate temperature value. A copper a1 sample (ρe 20°C = 1.724 µΩ.cm, and a purity of 99.9 wt.% in copper) was purchased to ensure that the measurements of our 4-point system are correct.
Cu nanometric particles were characterized by transmission electron microscopy (TEM) using a JEOL-2100 microscope. Analysis of the Gr surface was carried out using a ThermoFischer Scientific K-Alpha® X-ray photoelectron spectrometer system with a monochromatized Al Kα source (hν = 1486.6 eV) and a spot size of 200 μm. Full and high-resolution spectra obtained were fitted using the AVANTAGE software provided by ThermoFischer Scientific®. Scofield sensitivity factors were used for quantification. The measurements were conducted with a precision of 0.1 cm−1 using a high-resolution Jobin Yvon Horiba LabRam HR micro-Raman spectrometer equipped with a charge coupled device (CCD) detector. Raman spectra were obtained in scattering micro-configuration. The incident laser light as well as the backscattered light are focused by a 10× objective.
Results and discussion
Determination of the optimal amount of Gr reinforcement
To determine the percolation threshold value for an “ideal” material, where half of the metallic powders are covered by one Gr sheet, the calculation of the required Gr content is proposed. The aim is to avoid the contact between two Gr particles during the assembly of the Cu powder, which would result in the presence of nano-porosity I between 2 Gr sheets which is assumed to be harmful for the electrical properties.
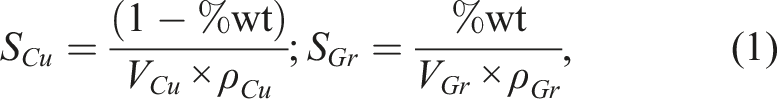
The geometry of the KNG-5 Gr and Cu-P powder are taken into account in these calculations. First, the equation (1) allows to calculate the surface areas of Cu and Gr particles.
To determine the coverage percentage of Cu by Gr particles, we need to calculate the ratio of the surface areas of the Gr particles to those of the Cu particles. This can be done using the following equation (2), with its representation in Figure 2. Evolution of the S
Gr
/S
Cu
ratio as a function of the percentage of Gr inside the composite materials.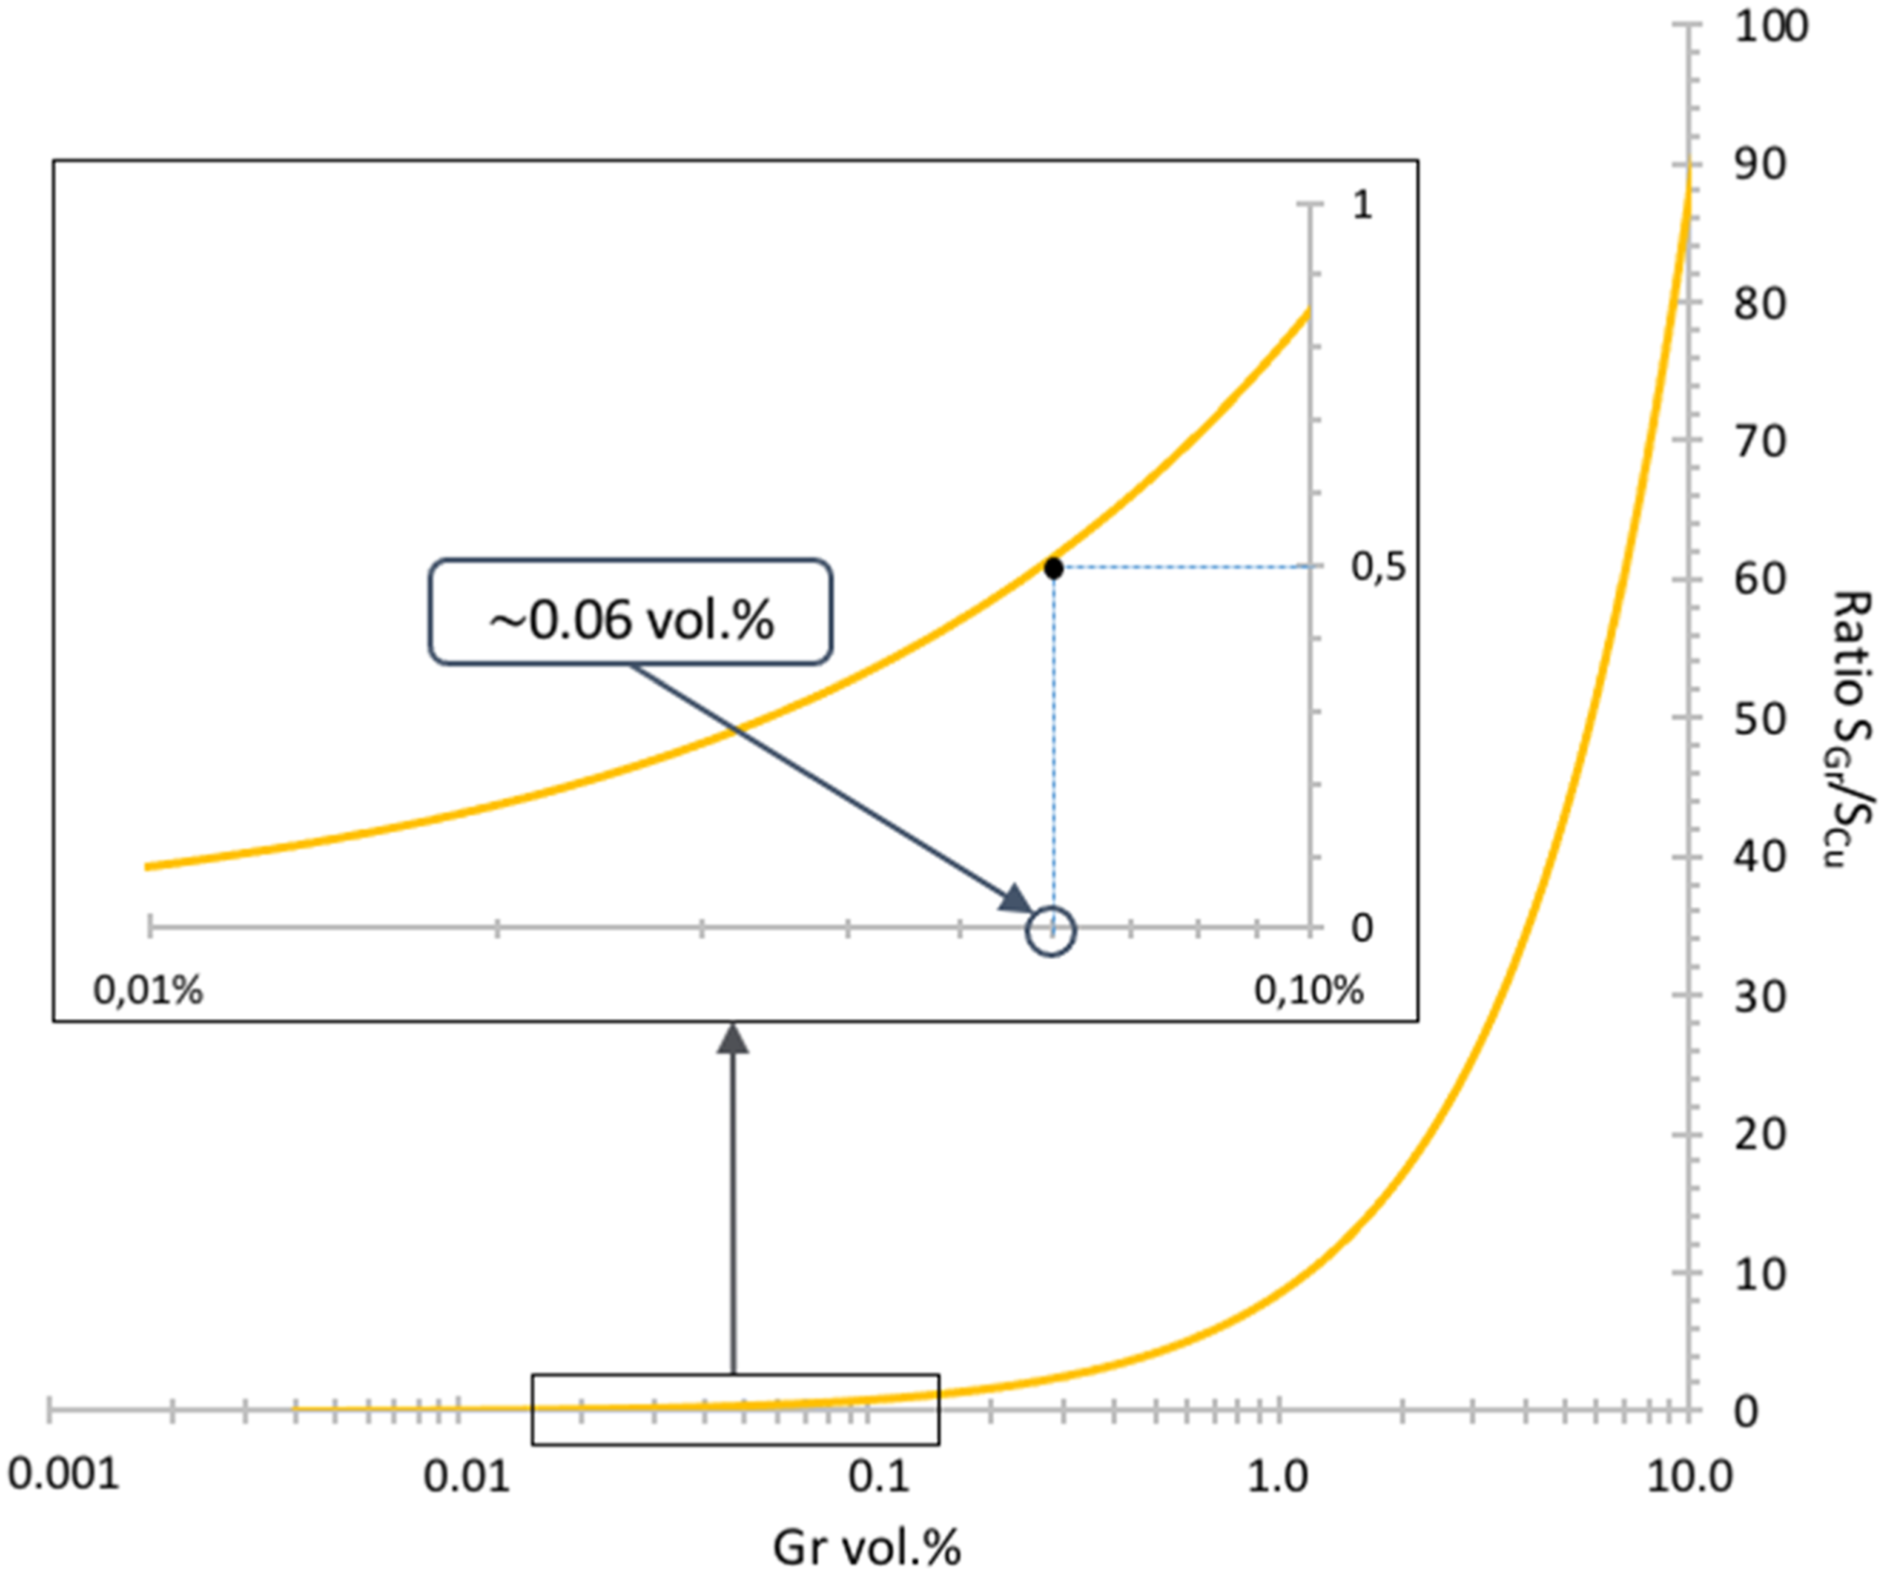
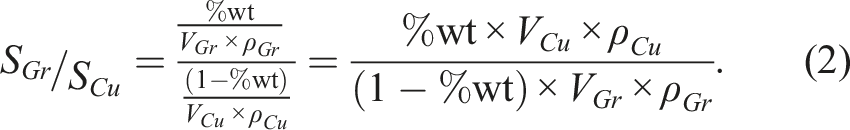
According to this graph, a quantity of 0.06 vol.% of graphene seems sufficient to cover half of the surface areas of the Cu-P powders. In the case of our materials, a quantity of graphene corresponding to an initial content of 0.1 vol.% were used to compensate for losses induced by the various steps. The same Gr amount were used for both dendritic Cu and brass flakes. Obviously, this is a numerical calculation in an ideal case, and it is impossible to achieve such a model. Nevertheless, it allows us to obtain an approximate value for the quantity of Gr required to reach the percolation threshold without inducing overlapping.
The calculated Gr content may seem low compared to the majority of the recent works in the literature, 20 where graphene contents higher than 1 vol.% were used. However, as seen in various works, 21 percolation thresholds around 0.1 vol.% are often obtained.
Studying the impact of the graphene quantity (beyond the percolation threshold) on the electrical properties of the composite material would be interesting. However, this aspect will be addressed in a separate publication.
As mentioned previously, Cu and Gr are two materials chemically inert. Therefore, a preparation step of the Gr reinforcement, including chemical treatment of Gr and germination-growth of nanometric Cu particles onto Gr surface, is necessary.
Surface treatment and functionalization of the graphene materials
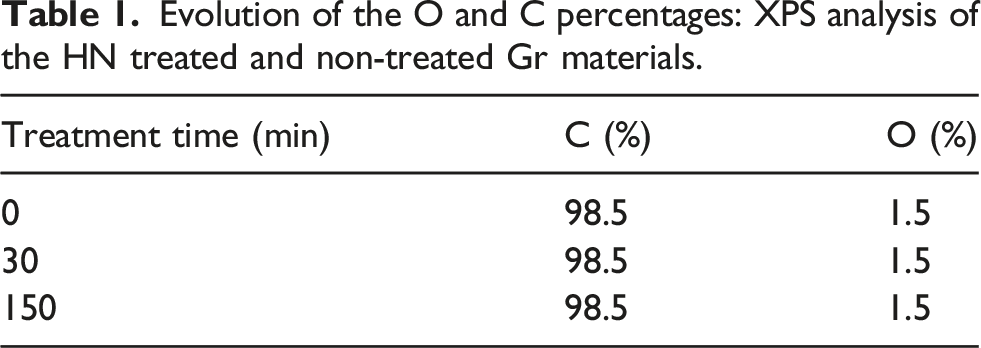
Evolution of the O and C percentages: XPS analysis of the HN treated and non-treated Gr materials.
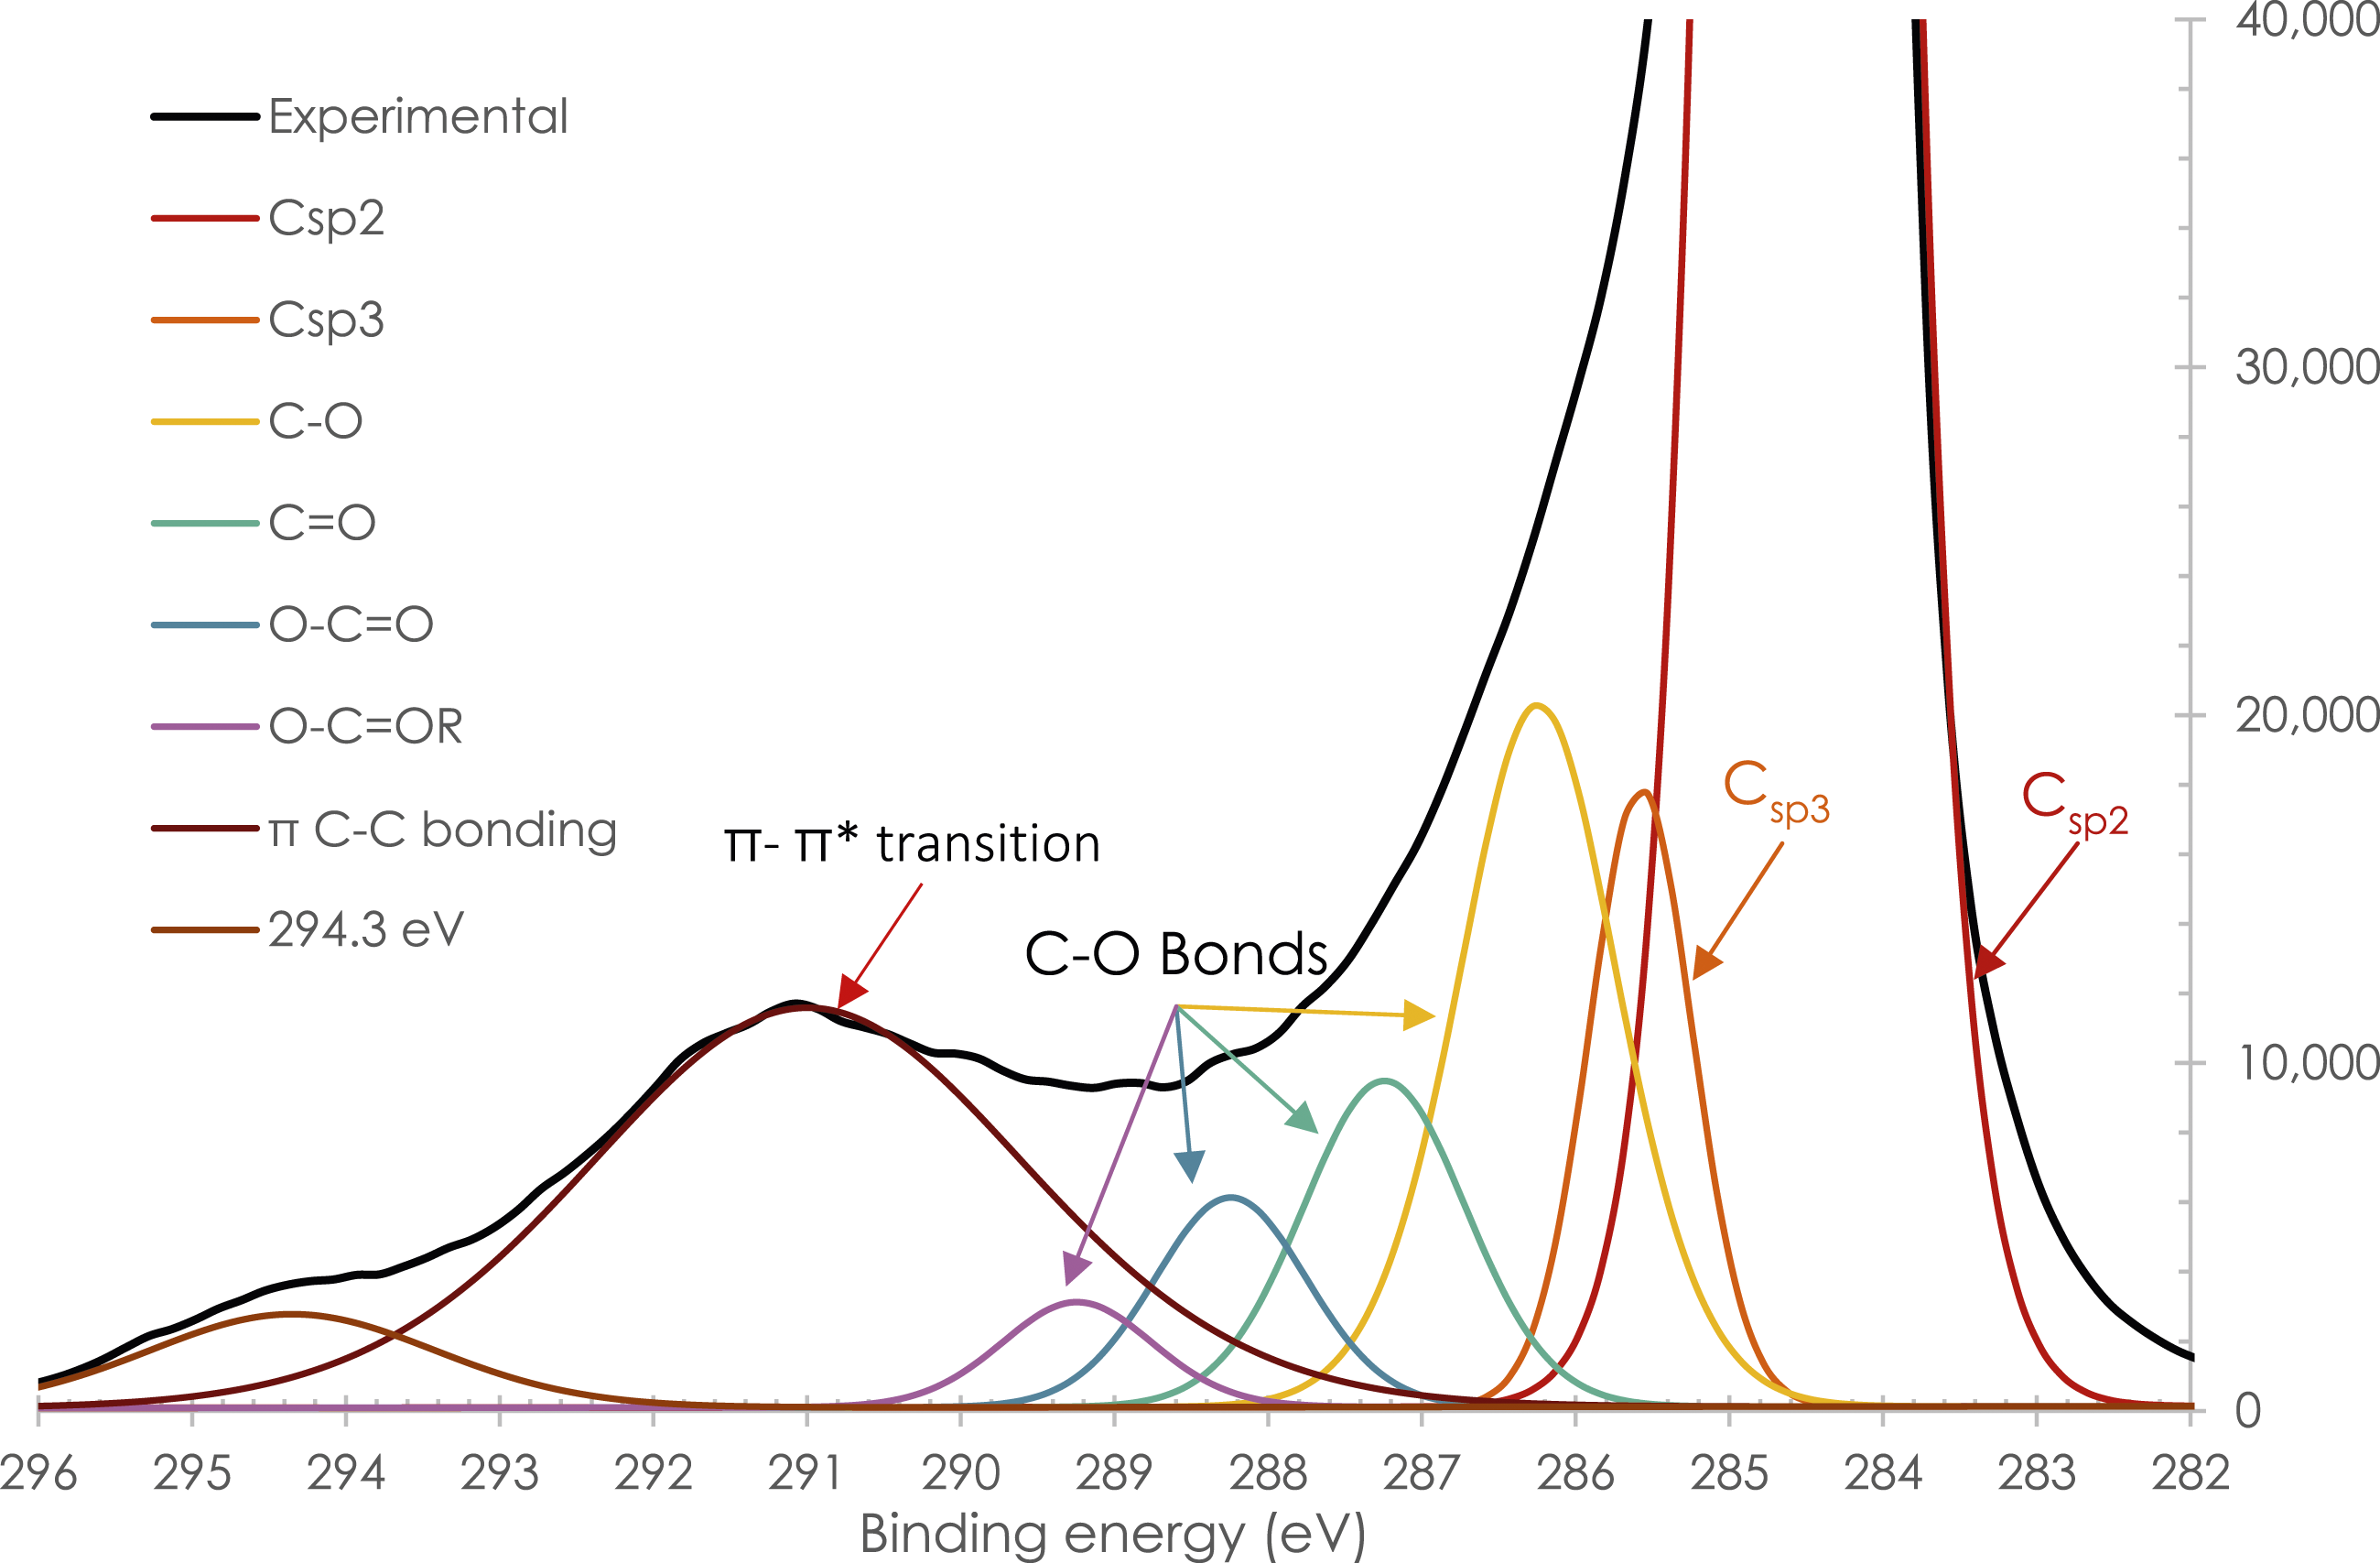
Deconvolution of a high-resolution C1s peak of MLG.
Evolution of the C1s contributions with different HN treatment time.
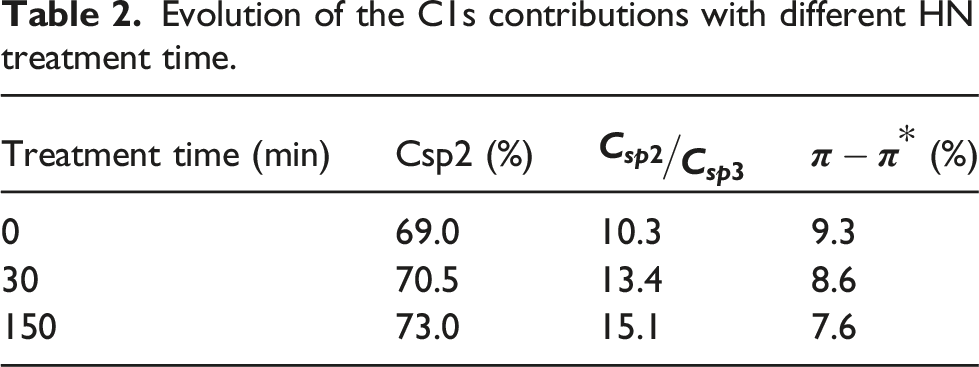
However, with regard to the evolution of the percentage of the π-π* bonds, the material seems to undergo a slight degradation (cf. Table 2). Therefore, a short treatment time is preferable to limit deterioration and eliminate some of the contamination. A time of 30 min was therefore selected.
To enable the germination growth of copper nanoparticles on the entire surface of the reinforcement, a dispersion step of the graphene in the solution (ethanol) is necessary. To achieve this, ultrasonic agitation for a time ranging from 10 s to 90 min was performed. To monitor the evolution of the separation of the graphene layers, an analysis by UV-Visible spectroscopy was performed (cf. Figure 4). In our case, since the graphene serves as a density filter, an increase in the absorbance of the solution would indicate an increase in the amount of layers present, i.e., exfoliation of the graphene layers. Evolution of the absorbance of different Gr solutions after various ultrasonic treatment times.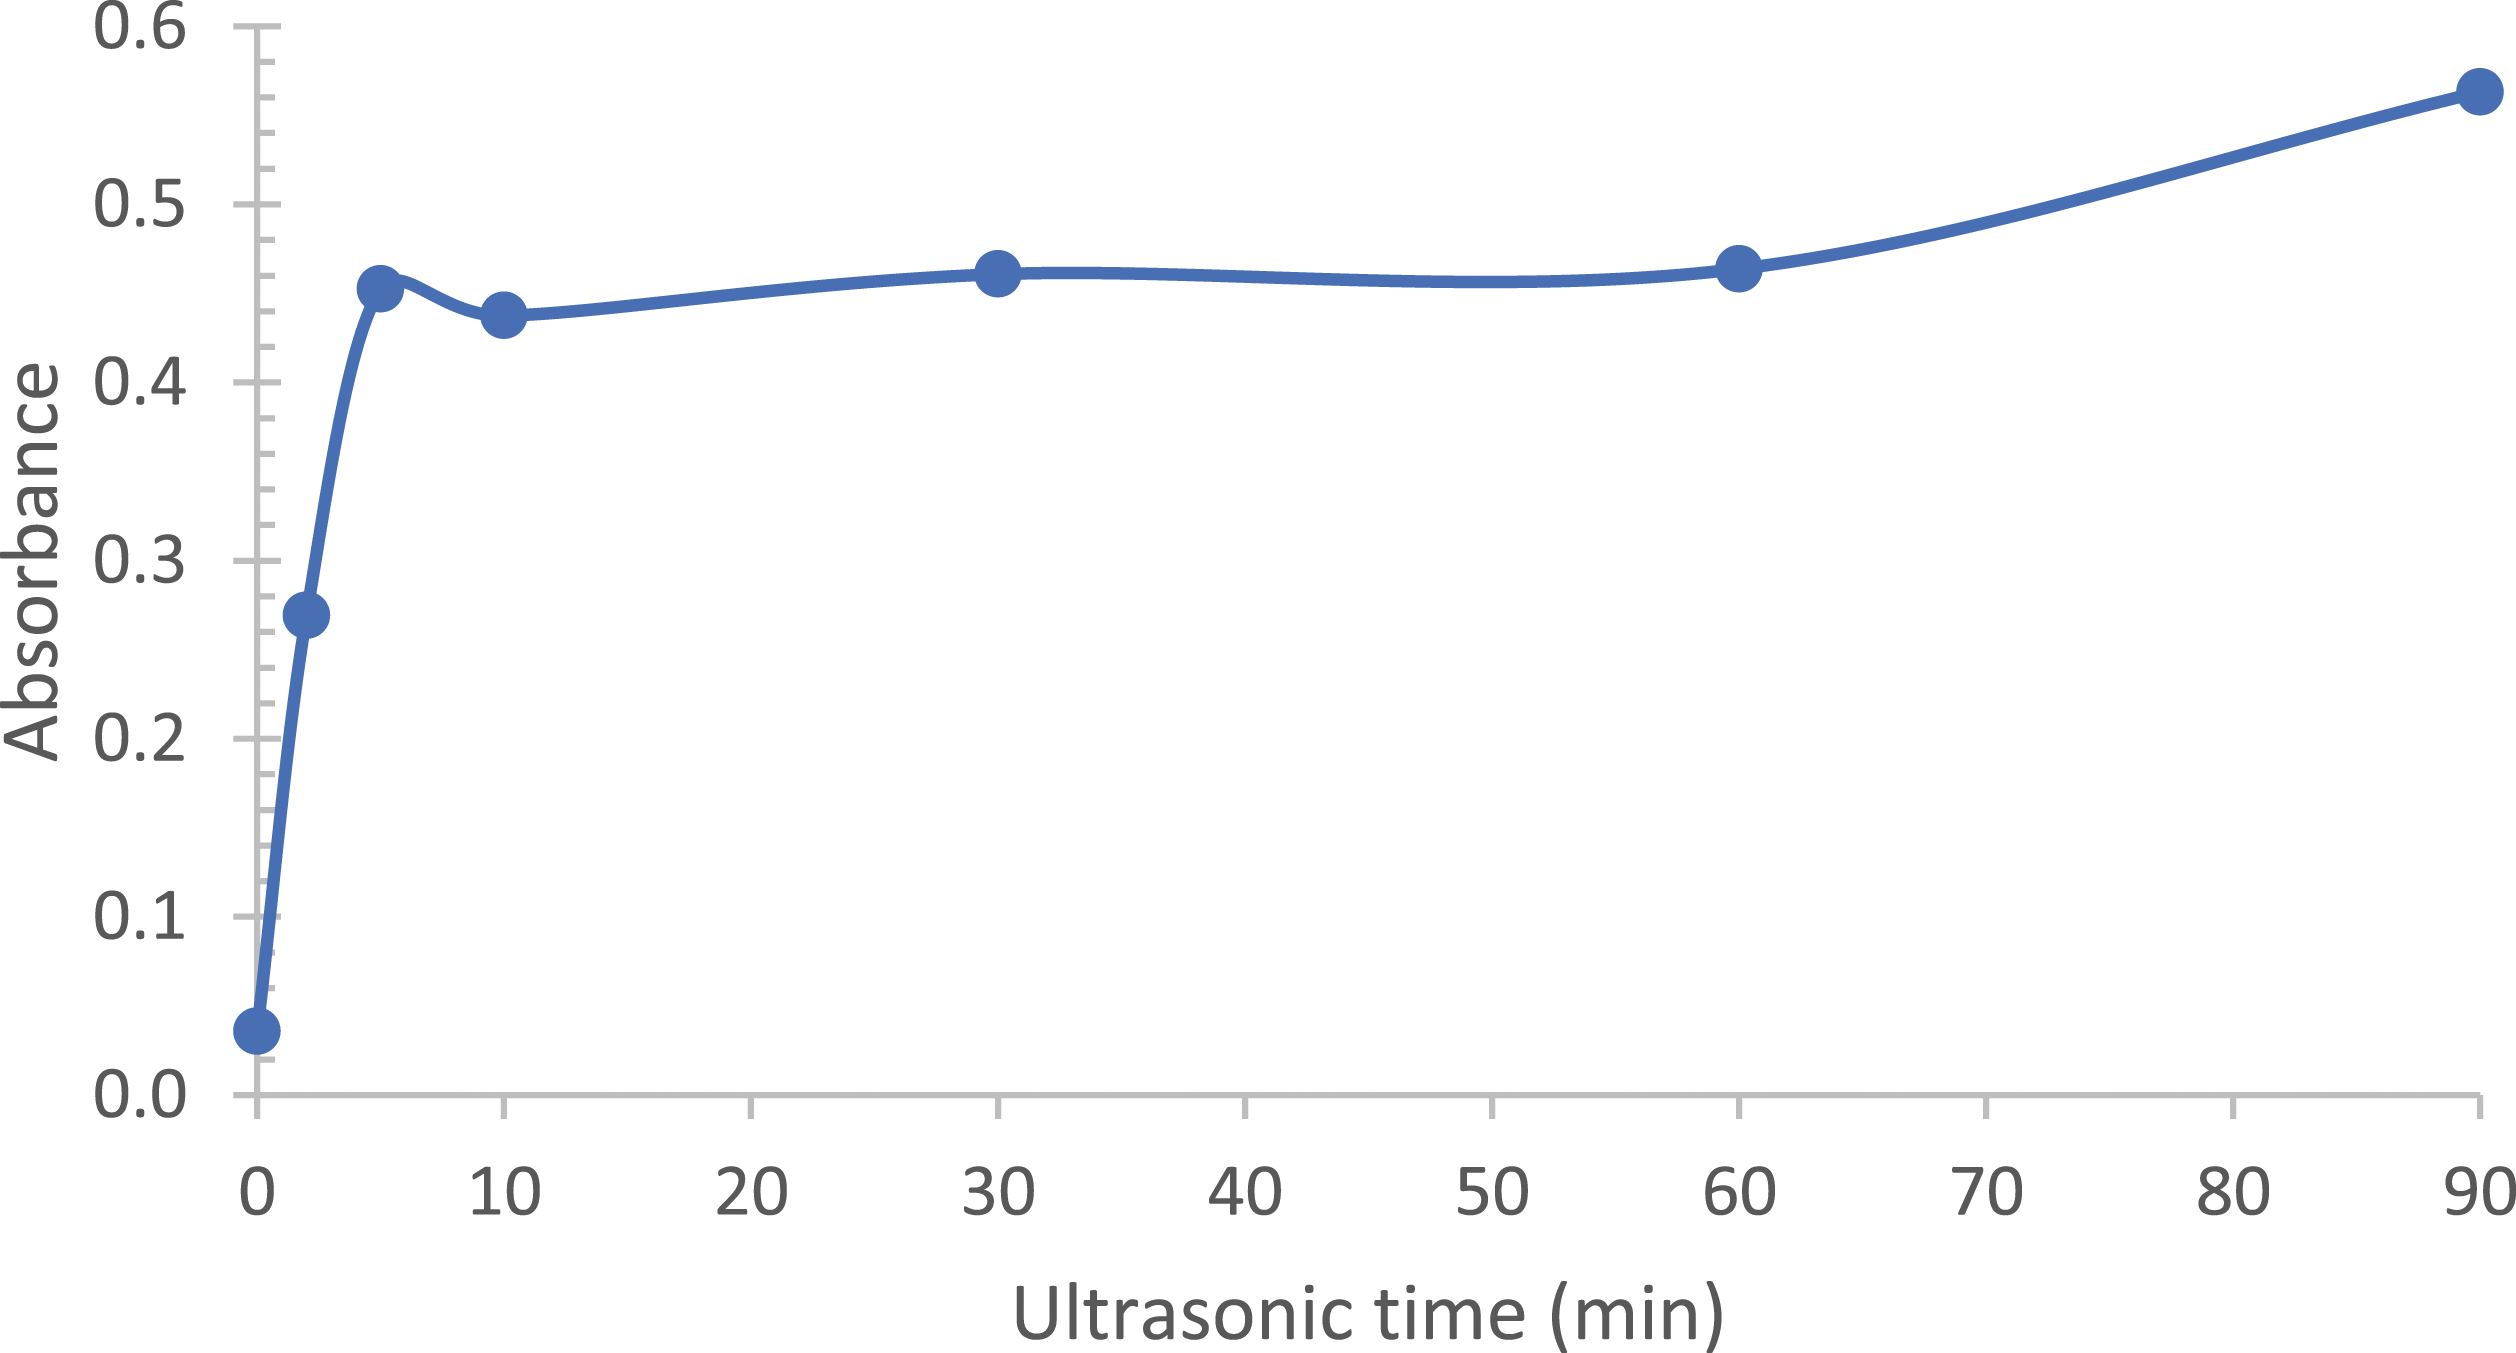
Evolution of Raman ratio after several ultrasonic time.
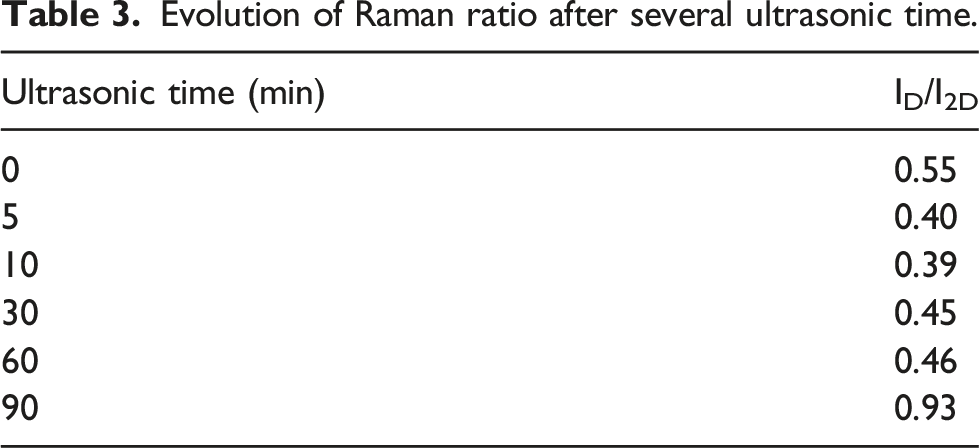
It was also observed that the absorbance increases again after 60 min, indicating an increase in the number of graphene layers. However, considering the evolution of the ID/I2D ratio, obtained by Raman spectroscopy (cf. Table 3), this new increase in the absorbance is accompanied by an increase in the ID/I2D ratio, indicating that we no longer have a simple separation of the layers, but rather a rupture of the C-C bonds. A treatment time of 5 min appears to be optimal.
After this optimized HN treatment, CuO (Cu after Ar/5%H2 treatment) nanoparticles were grown of the surface of the Gr materials treated
22
. For that, two solutions are prepared initially: • Solution 1: 0.5 g of sodium hydroxide (NaOH) in 25 mL of water. • Solution 2: 1 g of hydrated Cu nitrate (Cu(NO3)2, 3H2O) in 100 mL of ethanol.
Solution 1 and 2 are added dropwise under magnetic stirring, and then placed in a reflux setup at 90 °C. These initial steps aim to promote the nucleation of Cu hydroxide in a basic medium, followed by the formation of Cu (II) oxide.
Associated reactions:


The CuO particles are then thermally reduced at 400 °C for 1 h under a reducing atmosphere (Ar/5%H2).
Transmission electron microscopy (TEM) analysis shows that for the optimized growth and reduction heat treatment in a Ar/5% H2 atmosphere, Cu particles with a mean diameter of TEM micrograph and micro diffraction pattern of the Cu nanoparticles (black dots on the Gr surfaces) grown on the surface of treated HN Gr surfaces.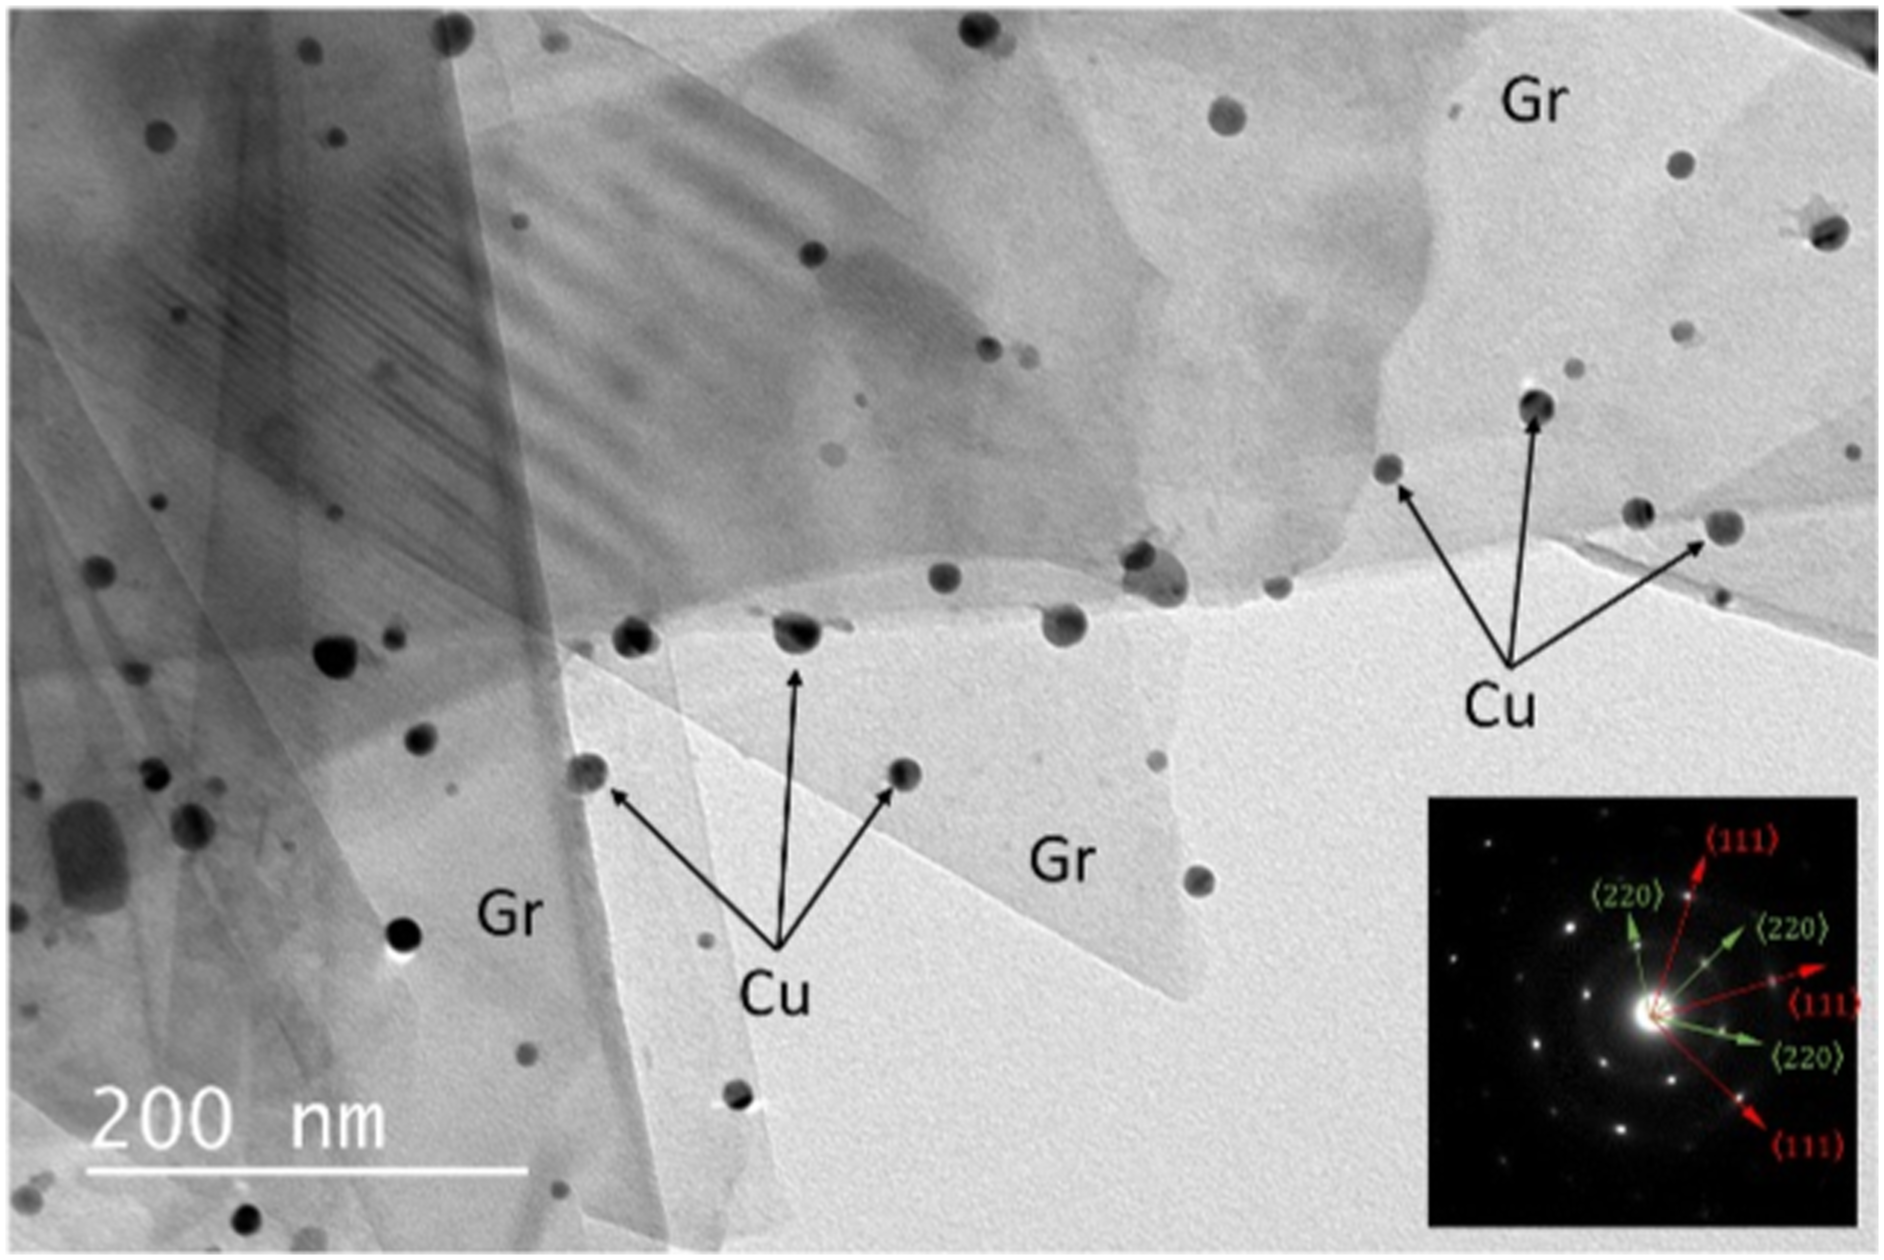
To verify the presence of a strong chemical bond between the Cu nanoparticles and the surface of the reinforcement, an adhesion test was performed. The graphene solution was placed under an ultrasonic probe for 10 s. As shown in Figure 6(c), the Cu nanoparticles (white dots on the Gr surfaces) are still present on the surface of the reinforcement, although the particle density is slightly lower than the initial one (cf. Figure 6(a)). Another reinforcement was tested without a surface contamination removal pre-treatment (cf. Figure 6(b)). The Cu nanoparticles were removed by the ultrasonic treatment due to the formation of bonds with the contamination present on the surface of the graphene, weakly bound to the reinforcement. Therefore, it is essential to eliminate this surface contamination. SEM micrograph of an (a.) graphene sheet with Cu(O) nanoparticles without HN pre-treatment, (b.) graphene sheet with Cu(O) nanoparticles without HN pre-treatment and after 10 s of ultrasonic treatment, (c.) graphene sheet with Cu(O) nanoparticles with HN pre-treatment and after 10 s of ultrasonic treatment.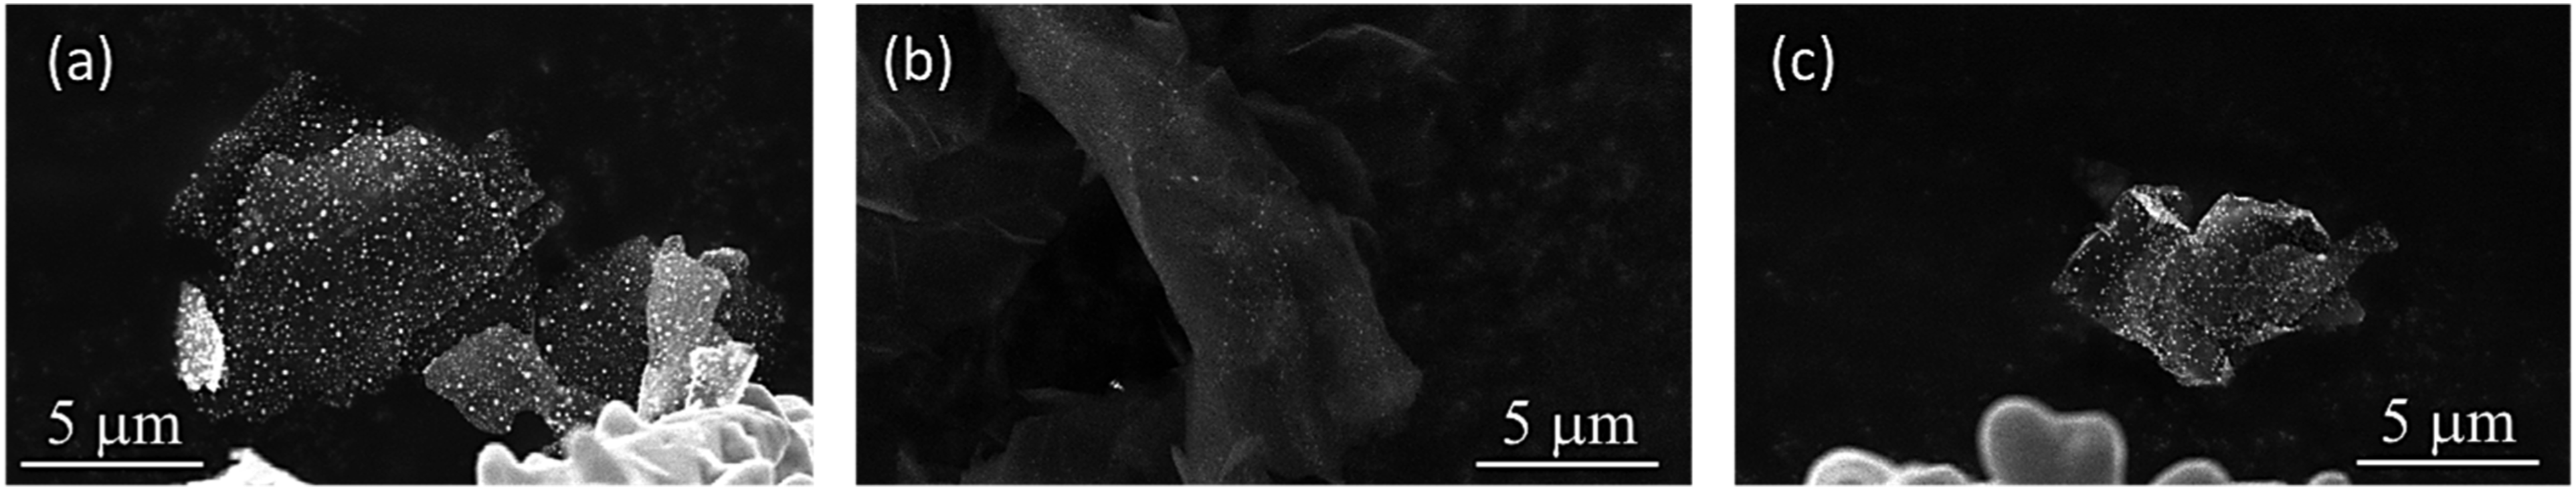
Characterization of dense material
Hardness
Evolution of the hardness of different composite materials.
Electrical resistivity
The electrical resistivity measurements were carried out on our materials. The results are shown in Figure 7. Concerning the Cu-D/Gr composite, it can be observed that the decrease in electrical resistivity is only 1.4% compared to Cu-D without reinforcement. The error range in the measurement has been estimated to be approximately 1%, so this value remains relevant. The introduction of Gr therefore has a relatively small impact on the electrical resistivity, this is due to the very low electrical resistivity of Cu-D. Regarding Cu-P, which has higher electrical resistivity than Cu-D (2.06 against 1.78 µΩ.cm), the decrease in electrical resistivity (for the Cu-P/Gr composite) is more significant, with a gain of 2.7%. The reason for this greater decrease could be due to a more favourable alignment of the Gr layers in a plane perpendicular to the pressing direction. However, measurements carried out by polarized Raman spectroscopy (not presented in this study) disagree with this hypothesis. Consequently, the greatest decrease in electrical conductivity could be induced by the weaker initial electrical properties of the Cu used (Cu-P). Electrical resistivity measurement at 20°C for various single and composite copper matrix materials.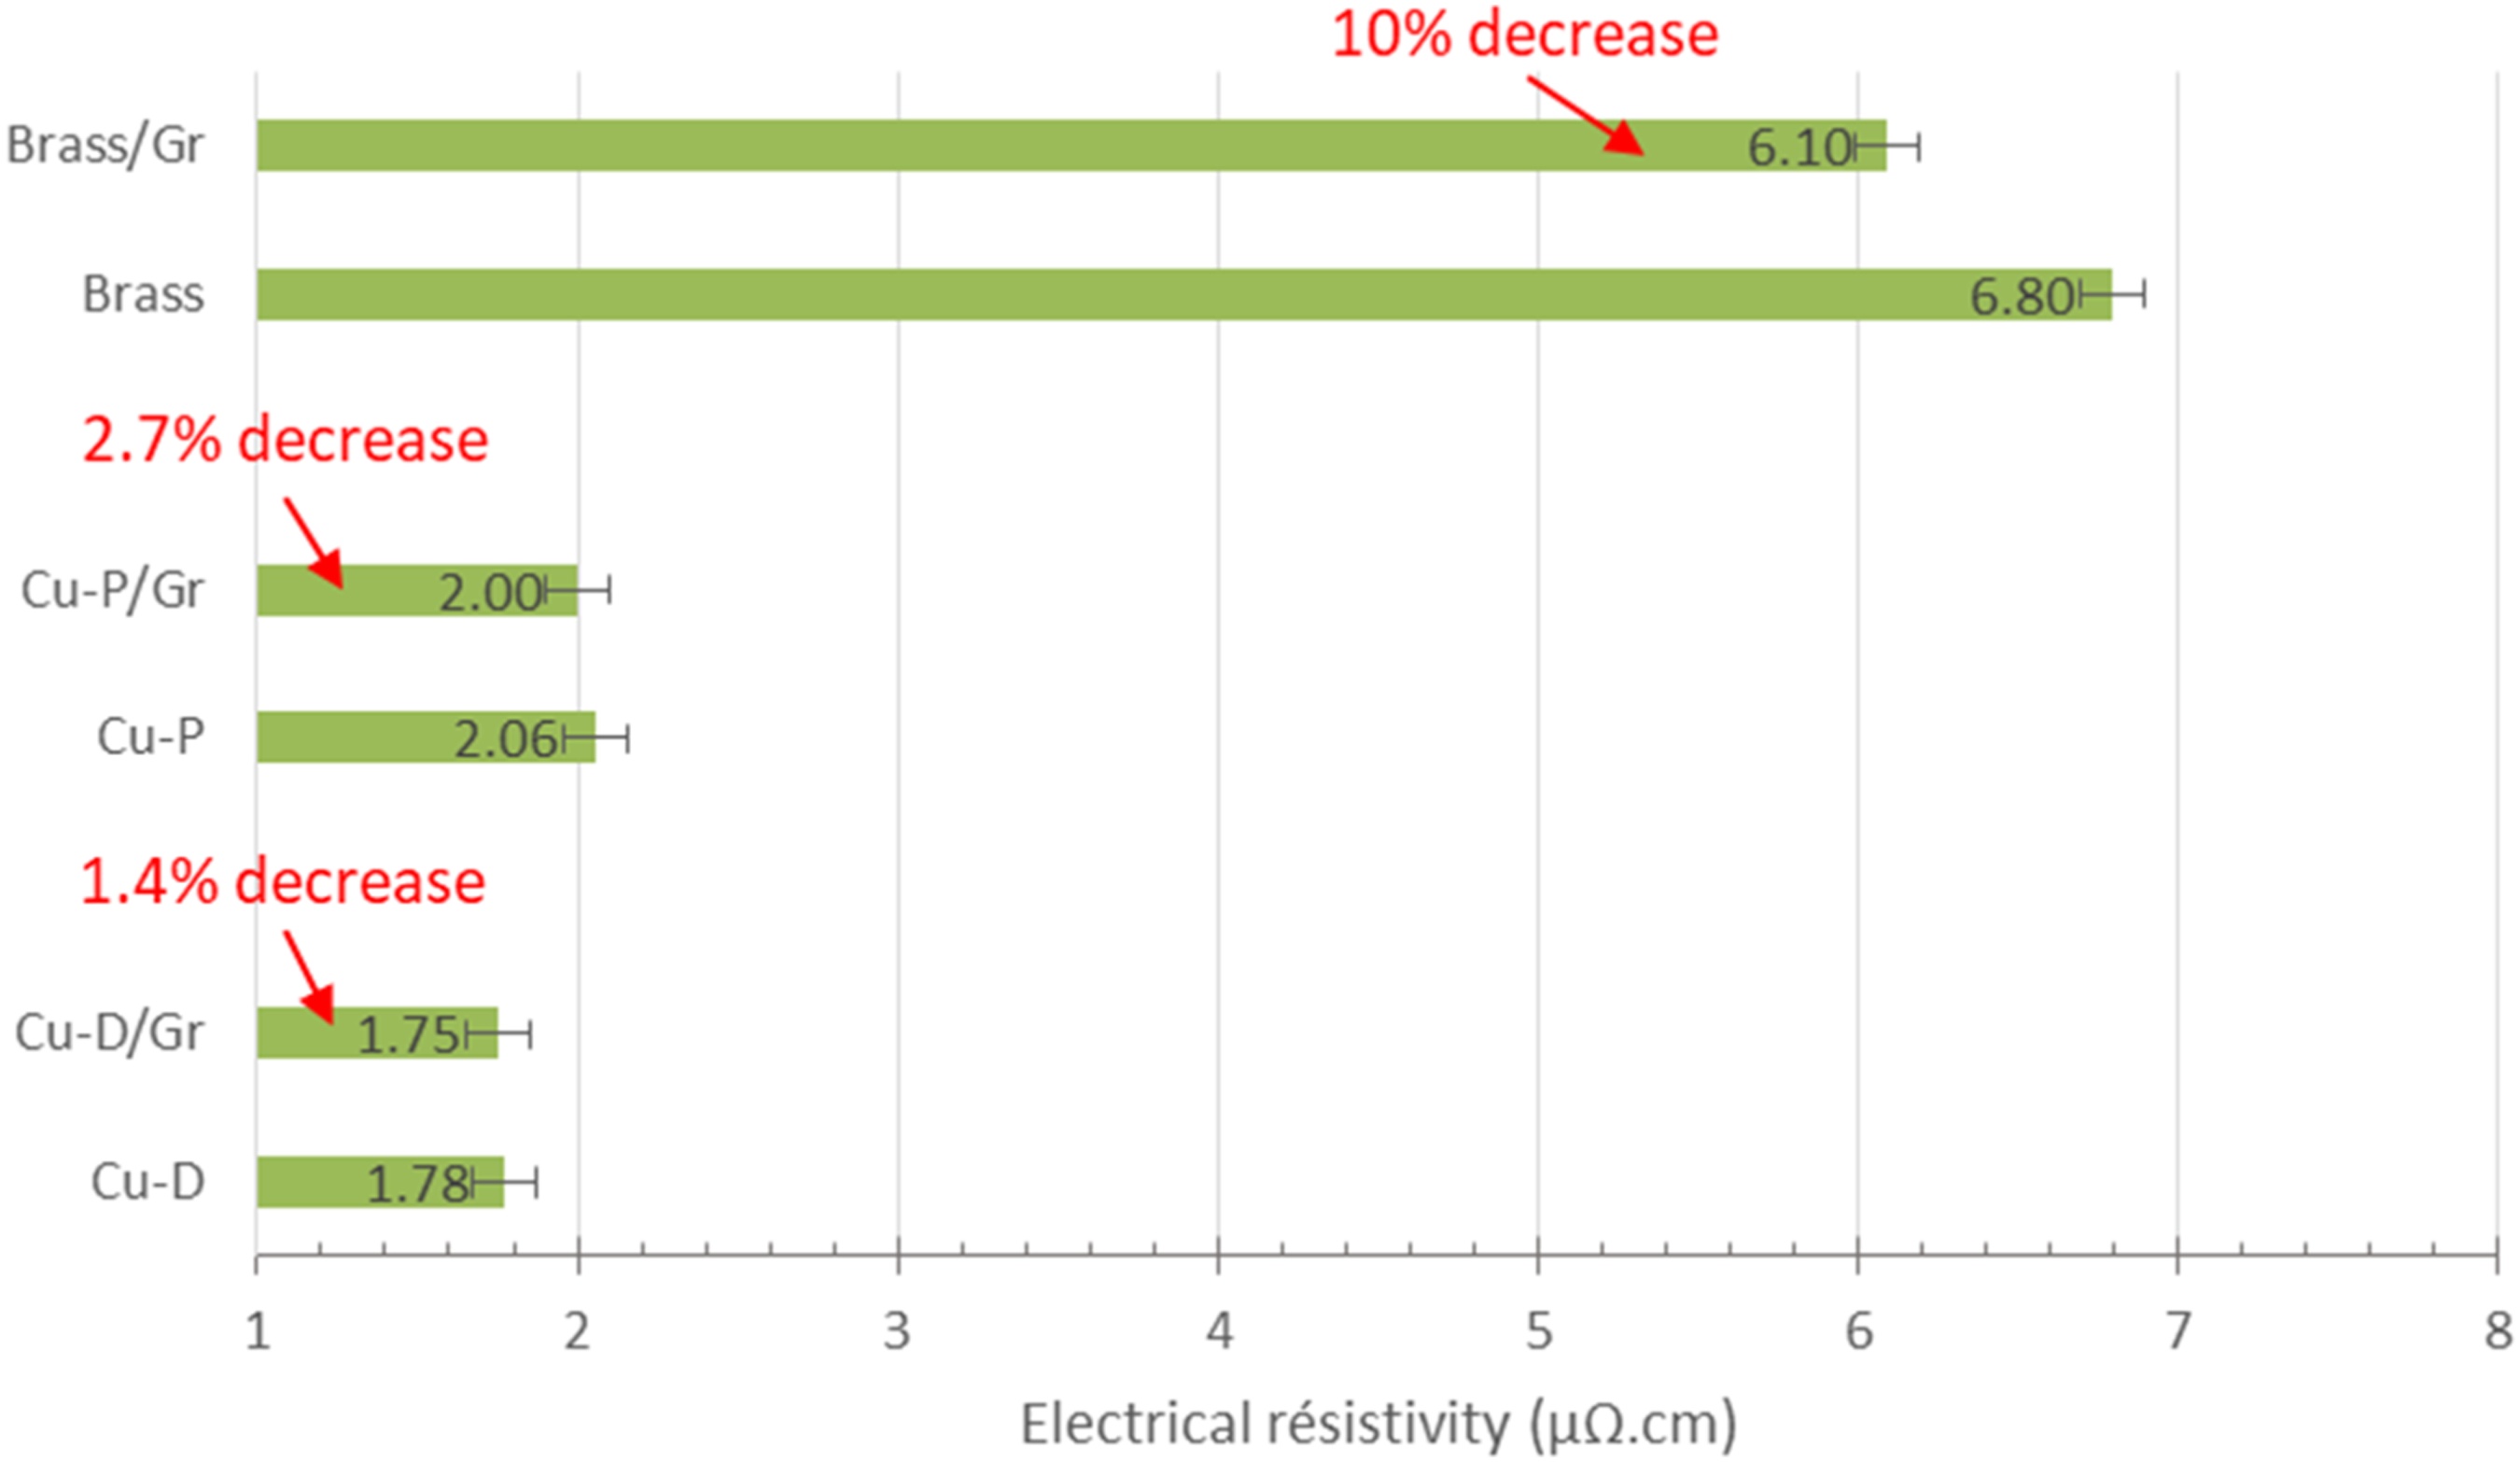
To validate this hypothesis, a final series of materials were produced using brass (Cu alloy with 20 wt.% of zinc) as the matrix; brass has a higher electrical resistivity (6.8 µΩ.cm) than that of copper (1.78 µΩ.cm). The results of the electrical resistivity measurement show that the incorporation of graphene leads to a reduction in electrical resistivity to 6.1 µΩ.cm (around 10%). In the case of this sample, we can see that the composite effect is present. Our hypothesis is therefore valid. The difference in electrical resistivity between the reinforcement and the matrix is not significant enough in the case of Cu-D. However, in the case of brass, the intrinsic resistivity of the matrix being lower, the composite effect is more significant.
Conclusions
In this study, a new method for developing Cu/Gr composites was developed, with significant focus on creating a high-performing interface through the germination growth of the CuO nanoparticles. Hardness measurements showed the importance of separating Gr layers to obtain a homogeneous distribution, resulting in increased material hardness. Results from electrical resistivity measurements indicated that using a matrix with higher resistivity than Cu leads to a greater positive composite effect. This validates our hypothesis and highlights that the intrinsic properties of Gr used are not sufficient for achieving a significant positive composite effect on Cu-D. This finding suggests the possibility of incorporating graphene into lower quality Cu or Cu alloys to increase their electrical conductivity and reduce the amount of Cu used, especially considering the shortage of Cu resources expected to occur within the next 50 years. Indeed, this approach would allow industries to use lower-quality Cu while achieving electrical properties very close to pure Cu through the development of a composite material. Furthermore, incorporating graphene reinforcement into materials with higher electrical resistivity, such as ferrous or Al alloys, may be feasible, although optimizing the R-M interfaces using an appropriate metallic salt will be necessary.
Footnotes
Author contributions
The work was completed through contributions of all authors. All authors have given approval to the final version of the manuscript. The individual contributions are: Supervision and conceptualization: Jean-François SILVAIN, Nathalie CAILLAULT, Florence DELANGE, Antoine BIDENT; Roles/Writing -original draft; and Writing - review & editing: Jean-François SILVAIN, Catherine DEBIEMME-CHOUVY, Yongfeng LU, Antoine BIDENT; Investigation: Antoine BIDENT.
Declaration of conflicting interests
The author(s) declared no potential conflicts of interest with respect to the research, authorship, and/or publication of this article.
Funding
The author(s) disclosed receipt of the following financial support for the research, authorship, and/or publication of this article: This study was supported by Schneider Electric SAS.
Data availability statement
All data needed to support the conclusions in the paper and the datasets generated during the current study are available from the corresponding author on reasonable requests. Although strongly involved in open science (article and data; CNRS recommendations), we decided that the data from our article would be provided upon request.