
Abstract
Residual strength models are widely used to predict the fatigue life of composite laminates under highly variable loads. However, they often require considerable experimental effort to accurately determine model parameters. This paper introduces a new approach for predicting the residual strength of composite materials with less experimental data. The method is based on two common strength-based wearout models, the Sendeckyj model and Schaff and Davidson model. The Sendeckyj model consists of an equation with two model parameters, which describes the shape of the S-N curve by fitting fatigue test data. The Schaff and Davidson model is a single-parameter function which calculates the residual strength based on the number of fatigue cycles. Using a novel mathematical algorithm, the residual strength model parameter in the Schaff and Davidson model is estimated directly from the S–N curve without running any residual strength tests. Five data sets from the literature are used to validate the new methodology. The results show that the residual strength model parameter is dependent on both the stress level and the number of loading cycles experienced at this stress level, both of which are considered in the new strategy. In addition, if the fatigue data are well distributed, the residual strength model parameter estimated by the new strategy is close to the experimental data.
Keywords
Introduction
Due to their high strength, lightweight, durability and fatigue resistance, composite materials offer many possibilities for various engineering applications such as wind turbine blades, aircraft, and automobiles. In practical applications, fatigue is considered one of the main failure mechanisms under cyclic loading due to the long life of composites. 1 However, it is difficult to analyse fatigue failures, and consequently to perform life prediction of composite materials, because the fatigue of composites, unlike metals, is dependent on various factors, including loading direction on unidirectional laminates2,3; type of constituent materials used4,5; and stacking sequence for multidirectional laminates.6,7 In recent years, much research has been conducted on the fatigue life prediction of existing composite products, such as composite pipes 8 or wind turbine blades. 9
For all materials, fatigue life prediction can be roughly divided into three categories: cumulative or progressive damage prediction, phenomenological/empirical methods, and micromechanics or mechanics-based models. 10 In 1934, Palmgren proposed his linear damage accumulation hypothesis to predict fatigue life under variable amplitude loading, which was tested by Miner in 1945 with data from fatigue experiments. 11 This well-known Palmgren–Miner (PM) rule uses a simple linear cumulative rule as a common damage metric. However, it cannot account for the effects of the load sequence observed in practice to accurately predict fatigue lifetime. 12 The solution to this problem can be found by two different approaches, through micromechanics or through phenomenological methods. Micromechanics-based failure theories require considerable detail to analyse the constituent materials and implement relatively complex models that describe different failure modes. This method is not always suitable for practical structural engineering applications, as the parameters required to implement it are often challenging to determine in reality. 13 In phenomenological approaches, a physically measurable parameter, typically strength or stiffness, is tracked during fatigue loading. Early investigations on stiffness-based models were conducted by Schulte 14 and Highsmith and Reifsnider. 15 However, the primary drawback of this approach is the development of a “general” failure criterion (not a “natural” failure criterion) that is successfully applied to different types of laminates or randomly ordered load spectra. 16 Hence, in stiffness degradation theories, failure can be determined in a number of ways, for example when the stiffness has reached a predetermined critical stiffness degradation level, when it is reduced to the minimum stiffness determined by the design process in order to meet operational requirements for deformation, 17 or when the cyclic strain reaches the maximum static strain. 18
In contrast to stiffness-based models, strength-based models have an inherent “natural” failure criterion: failure occurs when the applied stress equals the residual strength. Broutman and Sahu 19 were the first to propose a linear strength degradation model in a lifetime prediction method. They showed that the model could predict the two-block experiments accurately. Strength-based or wearout models generally state that stronger specimens are likely to have longer fatigue lives. This assumption has been experimentally proven by Hahn and Kim, 20 and was later called the Strength-Life-Equal-Rank-Assumption (SLERA) by Chou and Croman21,22 using the existing experimental results from Ryder and Walker. 23 All the mentioned researchers used similar rate type differential equations to predict residual strength at a single stress level. At the same time, Yang and colleagues24–26 published several papers on residual strength prediction at different stress levels after constant and variable amplitude loading. In their first paper, 24 they introduced a fatigue residual strength degradation model, which they validated using graphite/epoxy unnotched laminates subjected to constant amplitude fatigue. In their follow-up paper, 25 the team refined the model to address tension-compression fatigue loading, again validating it with the same material. In the third paper, 26 the researchers explored the influence of loading sequence on the statistical distributions of fatigue life and residual strength under multiple stress levels of cyclic loading. They carried out experimental tests with the consistent use of graphite/epoxy material to support their approach. Ultimately, they presented a model that showed a reasonable correlation with a limited amount of fatigue test results. 27 However, this model’s development did not continue due to the large amount of experimental input necessary to characterize the model for complex loading spectra. Based on the Yang model, Schaff and Davidson proposed a method to reduce the number of tests required to determine the parameters of the residual strength model at different load levels of the loading spectrum. In their approach, the static strength decreases depending on the number of load cycles to the power of the model parameter determined by the residual strength tests. Residual strength tests are performed by measuring the “remaining” strength under monotonic conditions after fatiguing the sample for a given number of cycles at a given stress and stress ratio. 28 Schaff and Davidson’s one-parameter mathematical model correlated well with the experimental data used for validation.29,30 However, even in this reduced form the model requires a minimum of 75 tests for an arbitrary loading spectrum containing tension and compression cycles.
Sendeckyj, based on the SLERA assumption, developed a residual strength model for composite materials subjected to spectrum loading.31,32 In the model, the S-N behaviour of the composite materials can be described by a deterministic equation. Some papers have examined the quality of Sendeckyj model curve fittings concerning essential criteria such as compatibility with different stress ratios and adaptability in all fatigue regions33,34 with good results. However, Sarfaraz showed that the Sendeckyj model is only suitable when data are available in all fatigue regions (from low-cycle fatigue to high-cycle fatigue). When no static strength data is used, the model cannot extrapolate any lifetime predictions in the low-cycle fatigue region. He also noted that this model, in addition to the complexity of the parameter estimation method, is sensitive to the selection of fatigue data and the existence of outlier data points. 35 Thus, to improve the Sendeckyj model’s accuracy in all fatigue regions, Afrooz et al. 36 introduced a novel estimation method. In this method, an exponential model is used to determine the Sendeckyj model parameter for the low cycle fatigue region and a power-law model is used to determine the Sendeckyj model parameter for the high cycle fatigue region.
It should be noted that the Sendeckyj model requires different model parameters for each loading condition. This restricts the Sendeckyj model to describing the shape of the S-N curve at one stress ratio only, and prevents any predictive capability of the model in estimating residual strength when different loading scenarios are applied. 37 Hence, new residual strength approaches were proposed and experimentally tested, such as Andersons et al. 38 and Post et al. 39 However, the major drawback of these models is that extensive experimental data are needed to describe them fully. Real-life structures are subjected to randomly ordered load spectra consisting of many different load levels. Using residual strength models to predict the fatigue life of structures under this type of loading requires knowledge of strength degradation parameters for each load level in the spectrum. Some researchers such as Passipoularidis and Philippidis suggest that the use of simple models that require limited experimental effort should be preferred to complex phenomenological models that require a large set of experimental data to implement, since these complicated phenomenological models do not necessarily work in terms of accurate predictions.40,41 In this regard, this study aims to present a strength-based model for predicting fatigue life by considering the minimum experimental effort to determine the model parameters for each load level.
The new strategy is based on two models, which are described in the Methods section. The Sendeckyj model31,32 describes the S-N curve, and Schaff and Davidson model29,30 calculates the residual strength. The existing Schaff and Davidson model requires considerable experimental efforts to determine the key model parameter for each stress ratio in the load spectrum. The model also suffers from a drawback in that the model parameter is only related to the maximum stress and does not consider the number of cycles. In contrast, the new strategy presented in this work overcomes these limitations by using fatigue tests to model the S-N curve and calculate the residual strength, without the need for additional residual strength tests. The number of tests required in this novel strength-based model is equal to the number of tests in determining S-N curves. In the Results and Discussions section, five published data sets are used to validate the various features of the new strategy. Comparison of the model and test results shows that the estimation of the strength degradation parameter is close to the experimental data if the fatigue data are well distributed.
Methods
In this study, the Schaff and Davidson model29,30 is used to calculate the residual strength. However, to estimate their model parameter, the Sendeckyj model31,32 is used in place of residual strength experimental tests. A brief description of each model is provided in Sendeckyj Model Overview and Schaff and Davidson Model Overview, and the new strategy is described in New Strategy.
Sendeckyj model overview
The form of the wearout model developed by Sendeckyj is based on the following equations:

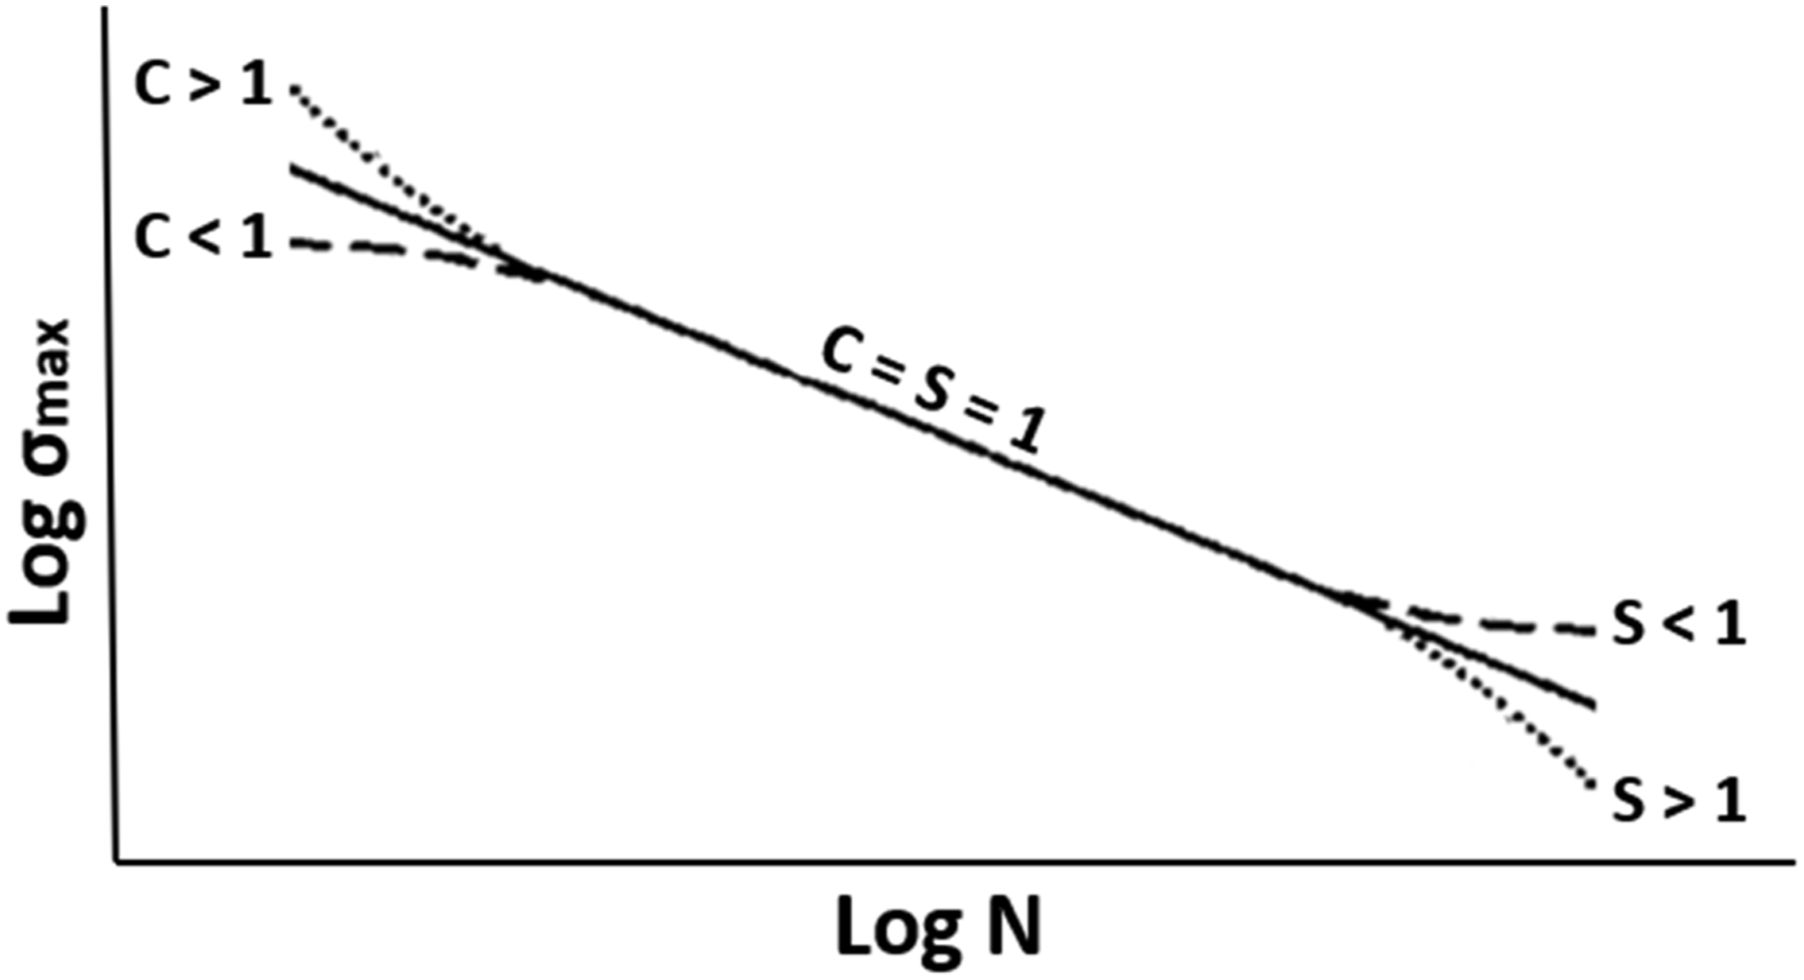
Or The shape of the S-N curve as a function of parameters C and S in the wearout model.
36

For fatigue failure, the residual strength equals the fatigue strength leading to σ
r
= σmax and n = N (number of cycles to failure). Now the equation (1) reduces to equation (3), describing the shape of the S-N curve:

To estimate the model parameters, Afrooz et al.
36
introduced a novel estimation method. In this method, the exponential model presented in equation (4) is used to determine parameter C, associated with the low-cycle fatigue region, and the power-law model shown in equation (5) is used to determine parameter S, linked to the high-cycle fatigue region.


A, B, A′, and B′ are the fatigue model parameters. The exponential and power-law models are matched with fatigue data in low-cycle fatigue and high-cycle fatigue regions, respectively, to find their model parameters (A and B, as well as A′ and B′). Figure 2 displays the novel estimation procedure to estimate C and S model parameters. Novel estimation method to estimate parameter C and S model parameters.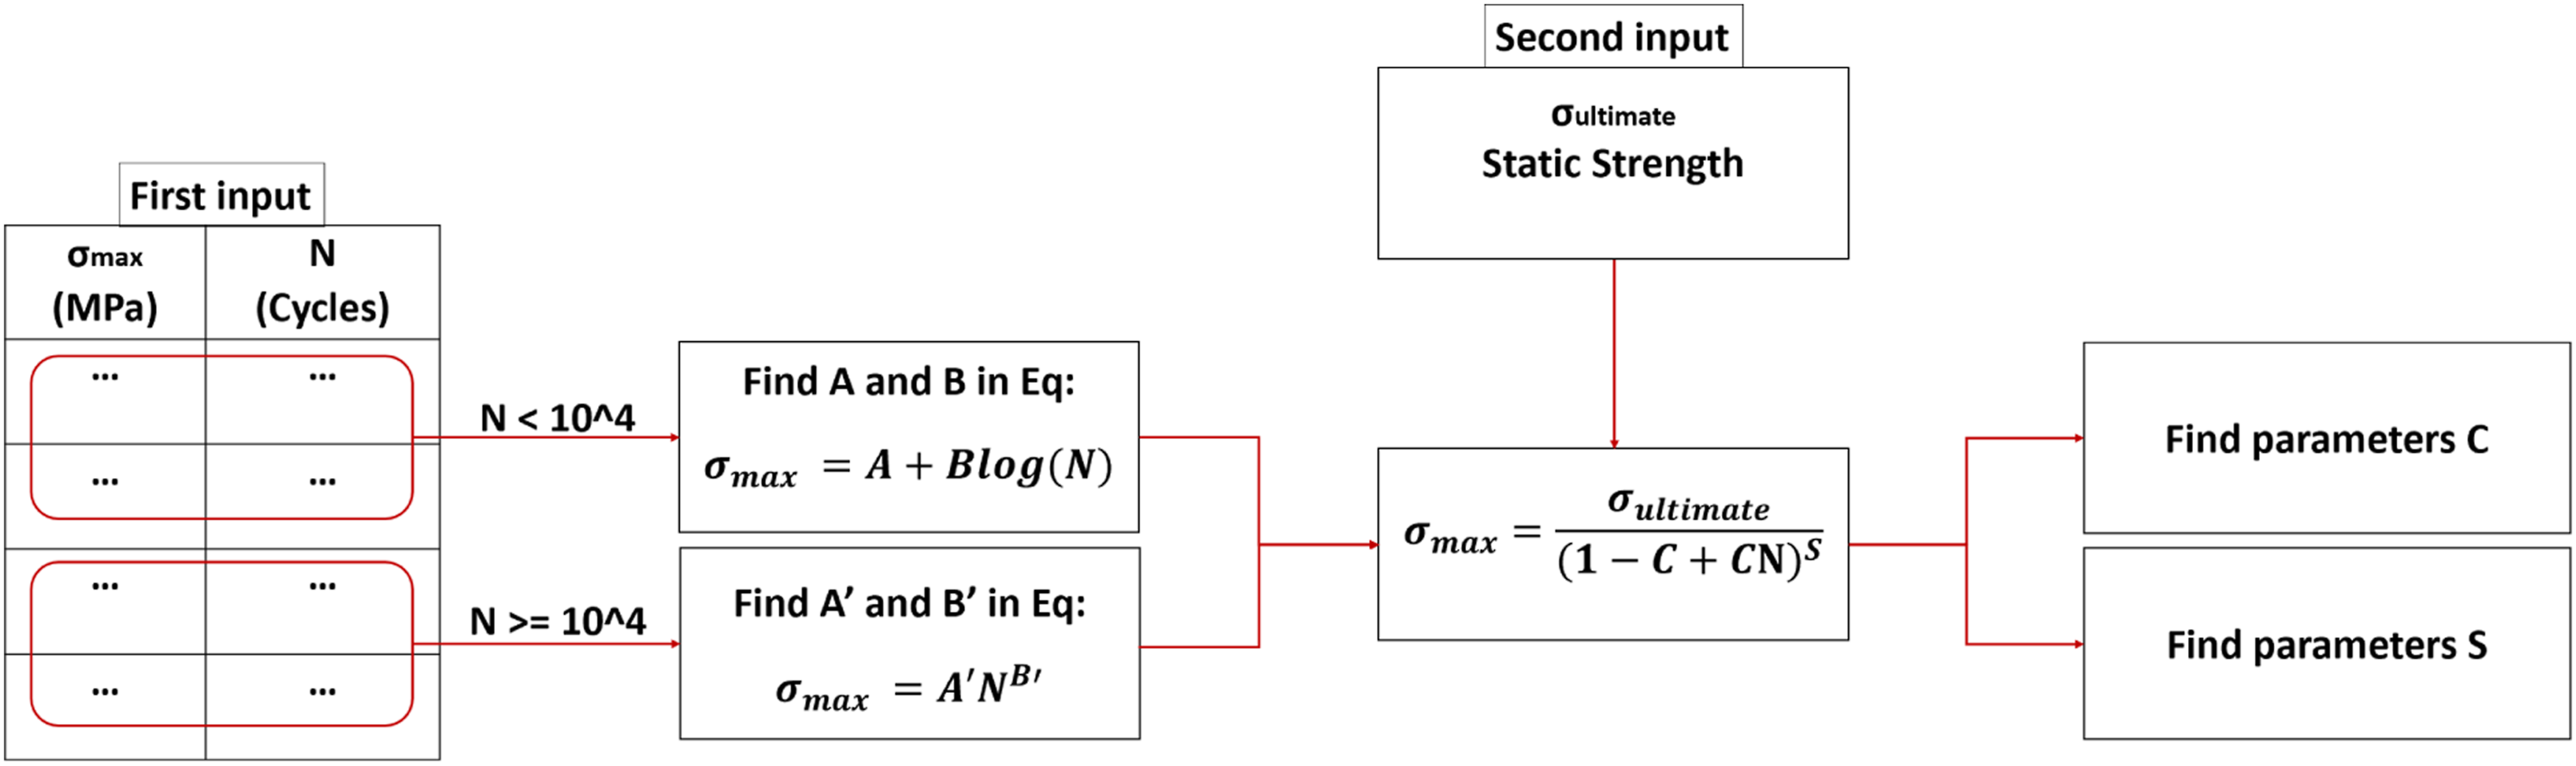
Schaff and Davidson model overview
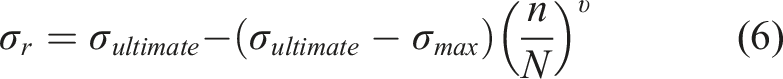
Schaff and Davidson proposed a strength-based wearout model to predict composite structures’ residual strength and life exposed to randomly ordered loading spectra.29,30 In this model, when the structure undergoes loading, the residual strength is first equal to the static strength and then by a monotonically decreasing function related to the number of loading cycles. The form of the model is written as equation (6):
All the variables are the same as the Sendeckyj model variables except υ, the strength degradation parameter. This parameter is determined by fitting the curve to residual strength experimental data. Figure 3 illustrates the possible residual strength curves as a function of the fatigue loading cycles described by equation (6). Each strength curve starts at the static strength and ends at the location determined by the failure criterion (σmax = σ
r
and N = n). The path of each curve between these two locations depends on the value of the strength degradation parameter. Linear strength degradation corresponds to υ = 1; sudden death behaviour21,22 is obtained for υ >>1, and the rapid initial loss in strength is obtained for υ < 1. Possible relationships between residual strength (σ
r
) and number of loading cycles (n).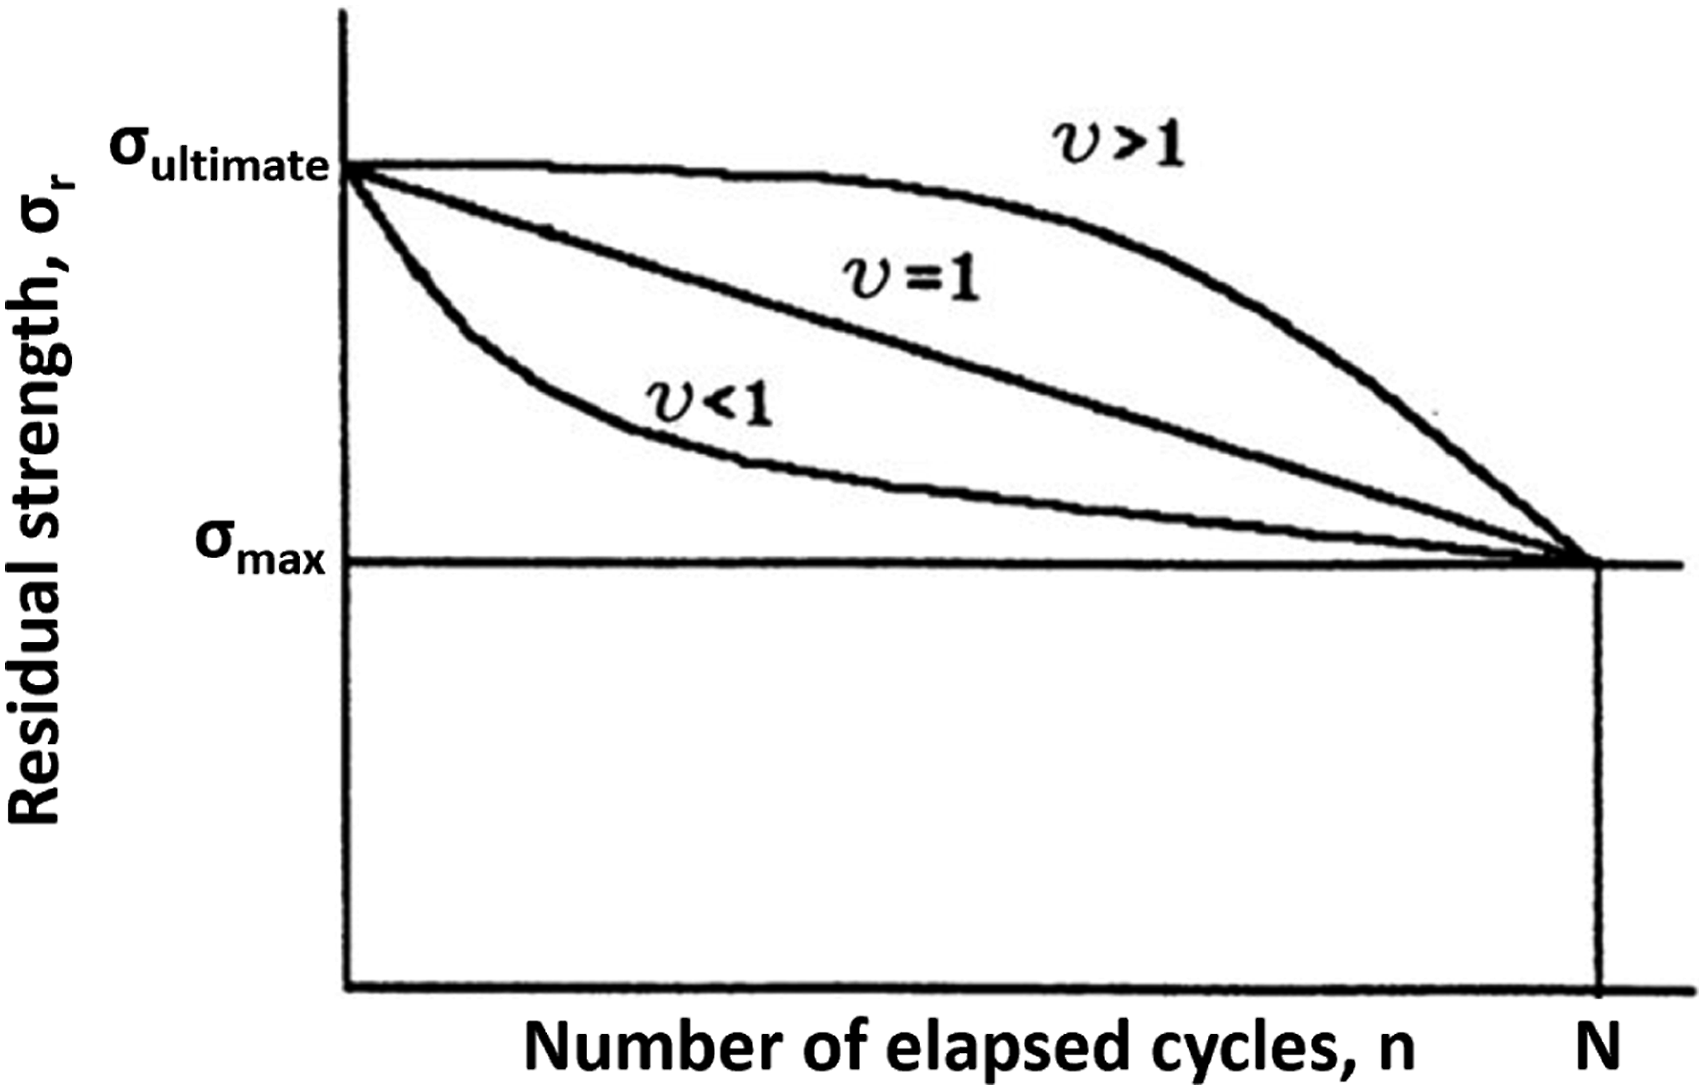
New strategy
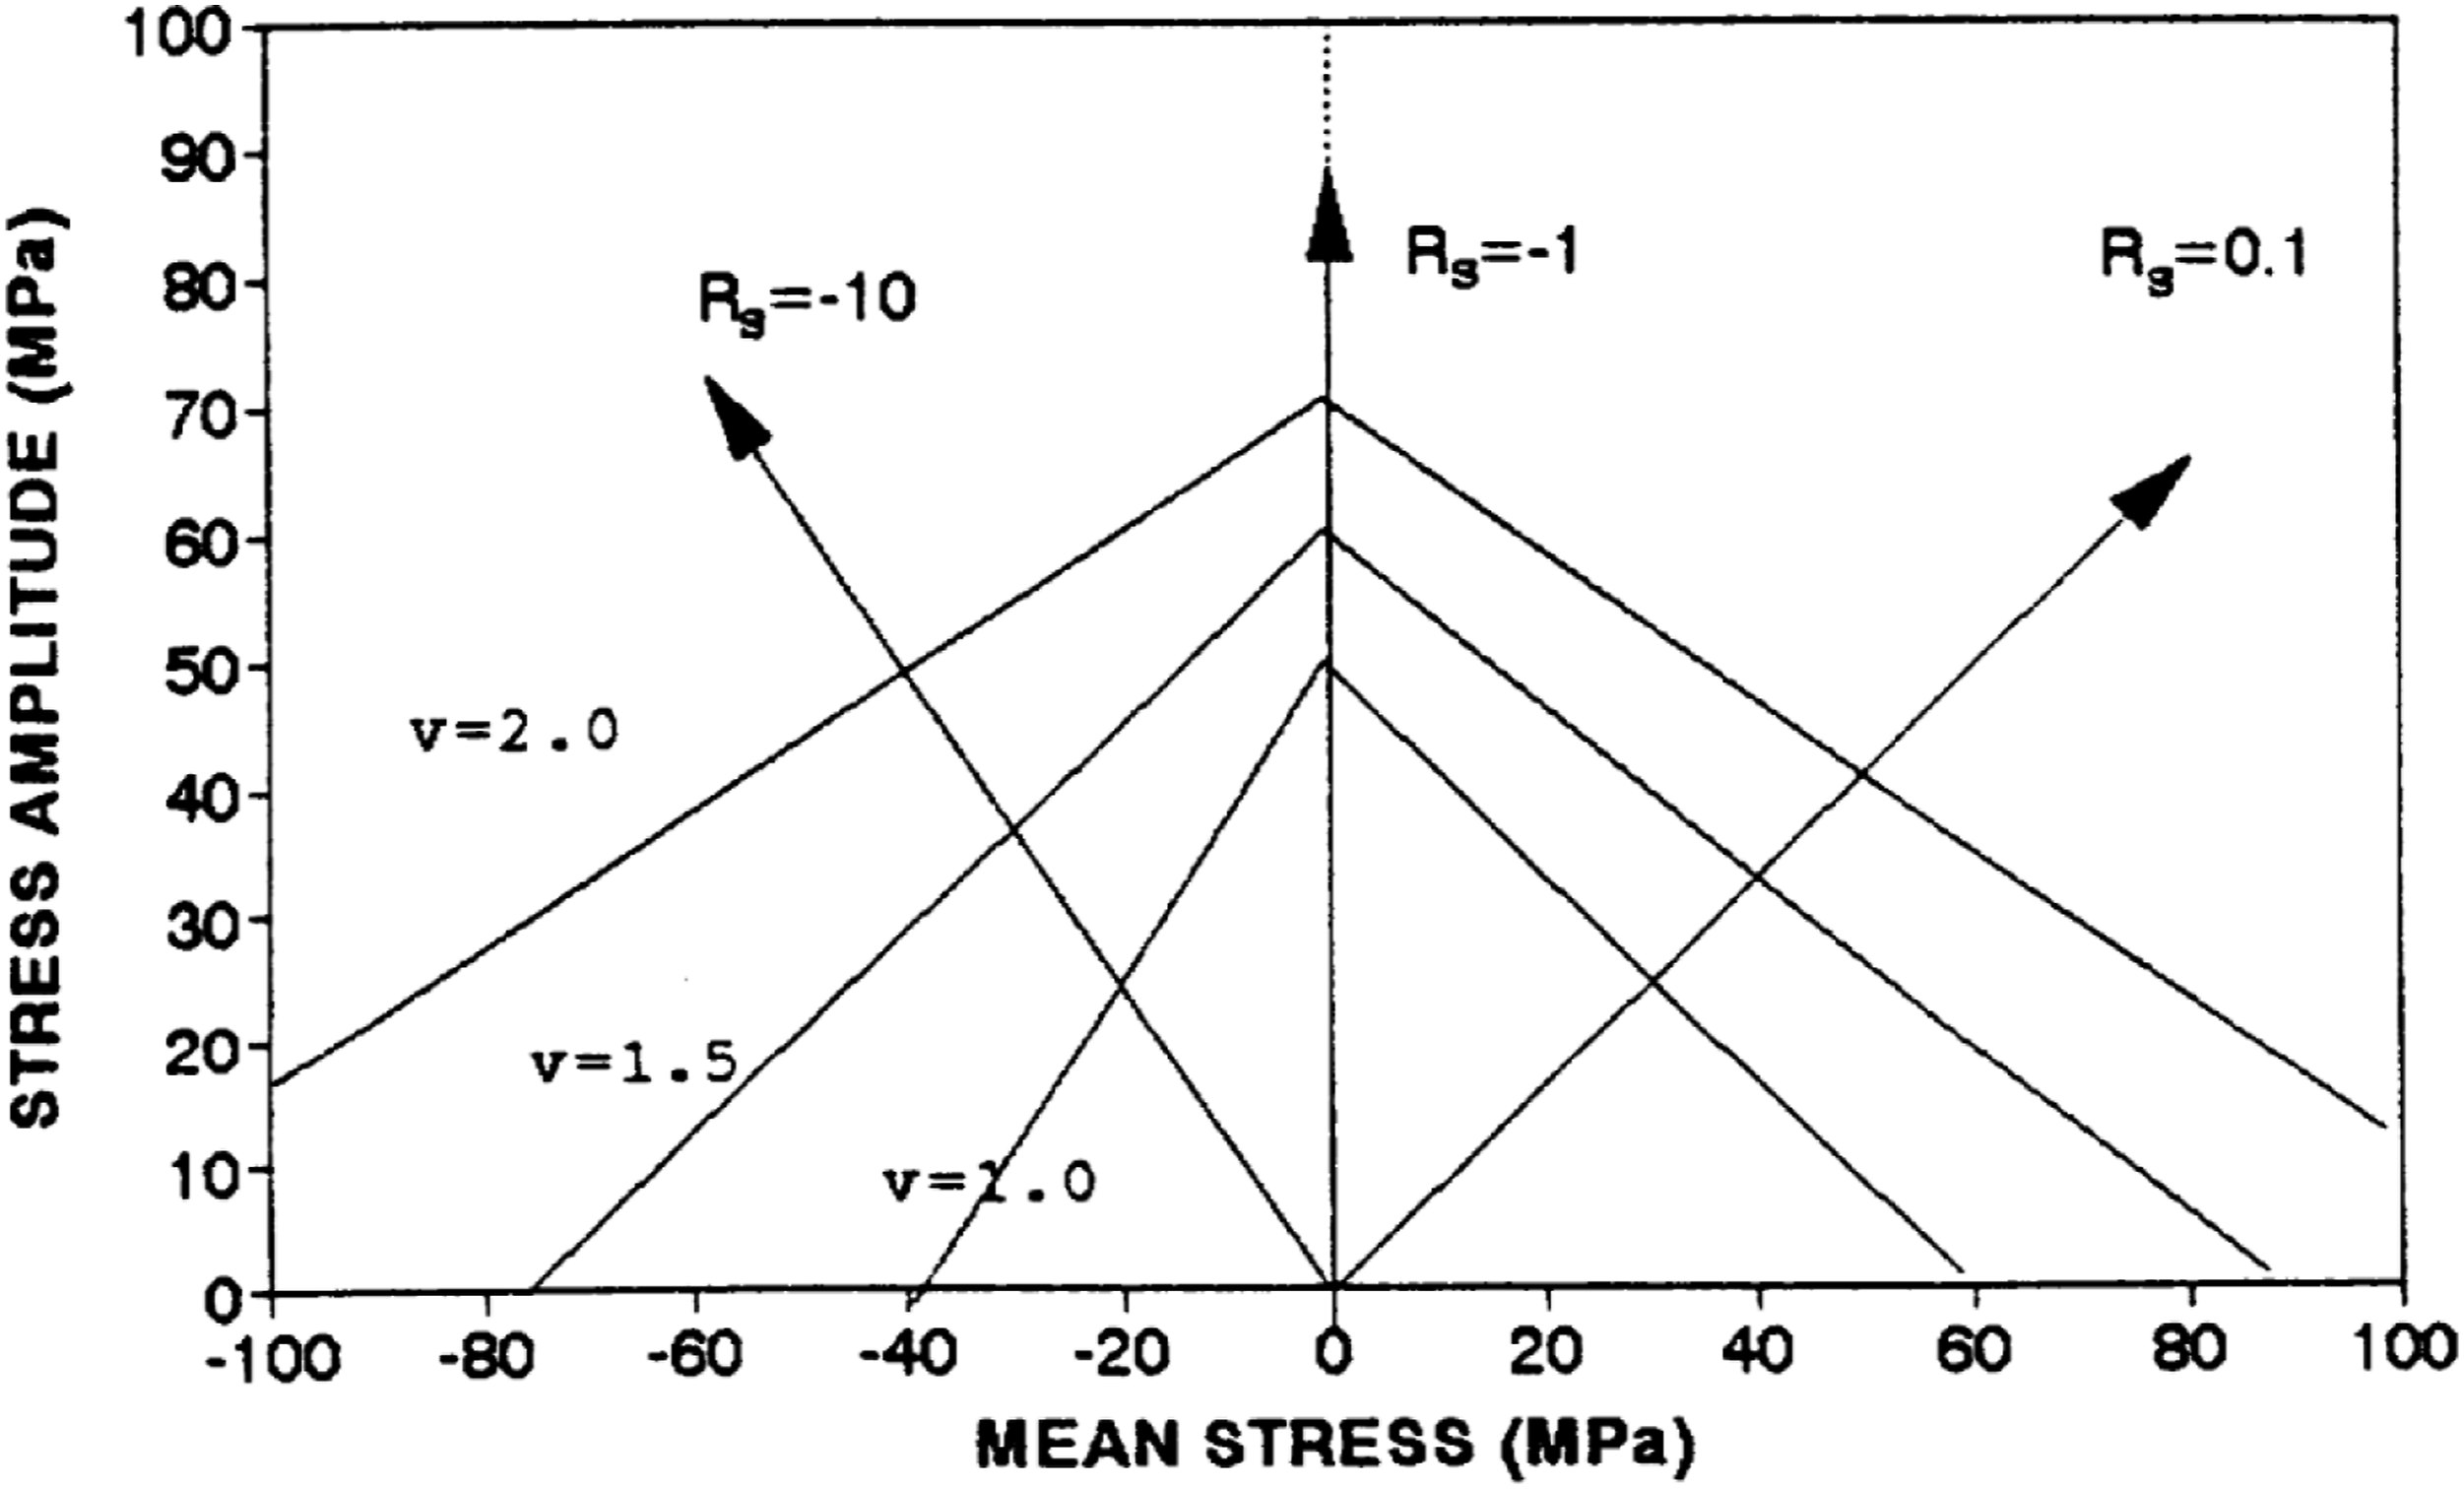
The critical step in using the Schaff and Davidson model is the considerable experimental efforts required to provide the key model parameter, υ, for each stress amplitude and stress ratio that occurs in the load spectrum. To avoid excessive additional experiments, Schaff and Davidson suggested a modified master diagram approach.29,30 A modified master diagram is used to determine the Schaff and Davidson model parameter, υ, with respect to an arbitrary mean stress and stress amplitude. To create this diagram, first using equation (6), the values of υ are determined for each maximum stress and stress ratio in which constant amplitude fatigue tests and residual strength tests are performed. Then, the resulting values of υ are used to develop linear σmax-υ relationship (equation (7)) for each stress ratio. Modified master diagram with constant υ lines using data for stress ratios of R = 0.1, −1 and −10.
30

The main drawback of this approach, except for the use of residual strength tests, is that the model parameter, υ, as shown in equation (7), is only related to the maximum stress and has nothing to do with the number of cycles. However, the new strategy presented in this work has solved both problems. In the new strategy, the strength degradation parameter is calculated using the tests required to model the S-N curve (fatigue tests), and no additional experimental tests (residual strength tests) are needed, even for three stress ratios. In this method, the data of maximum applied cyclic stress (σmax) and the number of cycles to failure (N) are imported as fatigue tests in the desired stress ratio. The fatigue tests at each stress ratio are fitted with the Sendeckyj formula in equation (3). Parameters C and S are estimated using the novel estimation method in Afrooz et al.
36
After modelling the S-N curve for each stress ratio, the Sendeckyj formula in equation (2) calculates the residual strength (σ
r
) for different stresses according to the number of cycles spent in loading (n). Then, substituting the calculated Sendeckyj residual strength (σ
r
) in the Schaff and Davidson formula in equation (6) with the same number of cycles spent in loading (n) and calculated fatigue life (N) determines the strength degradation parameter (υ) for different stresses. Finding the strength degradation parameter in each stress ratio creates a modified master diagram according to the number of cycles passed. Therefore, there is a modified master diagram for each number of cycles spent in loading. Figure 5 shows the process of creating the modified master diagram with respect to the number of elapsed cycles. Creating the modified master diagram to estimate strength degradation parameter.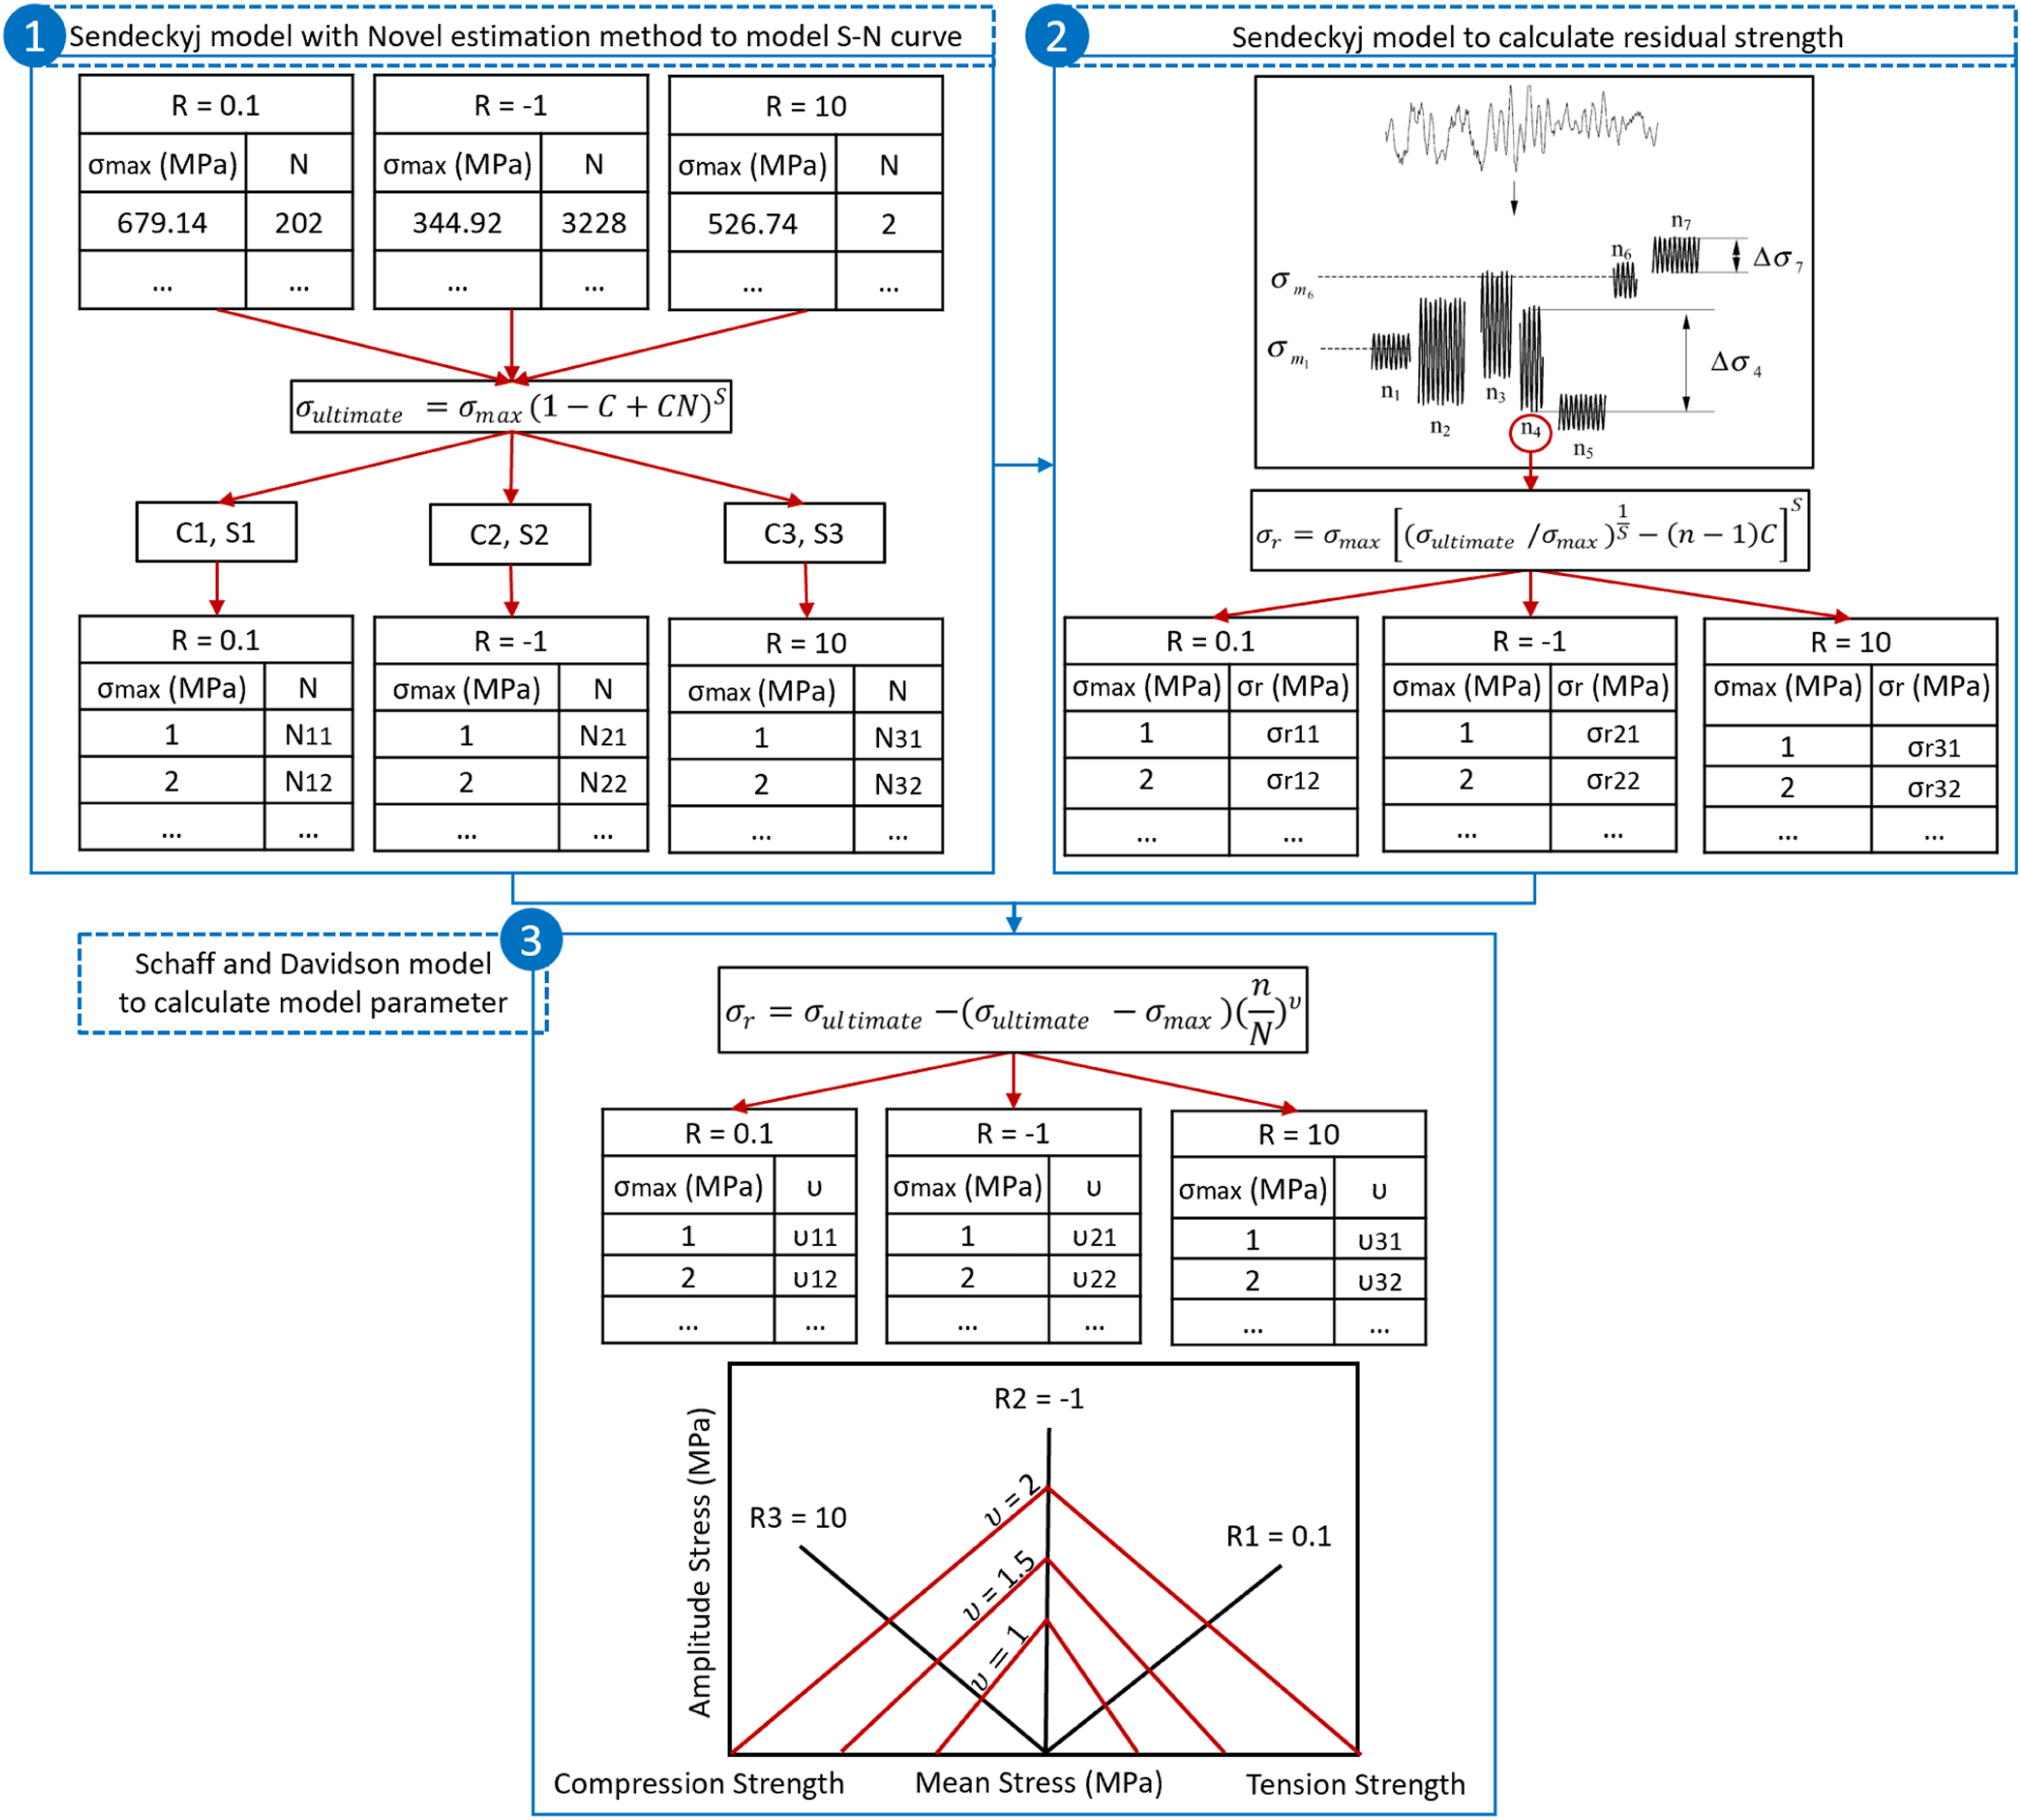
Model validation
Summary of the published data sets.
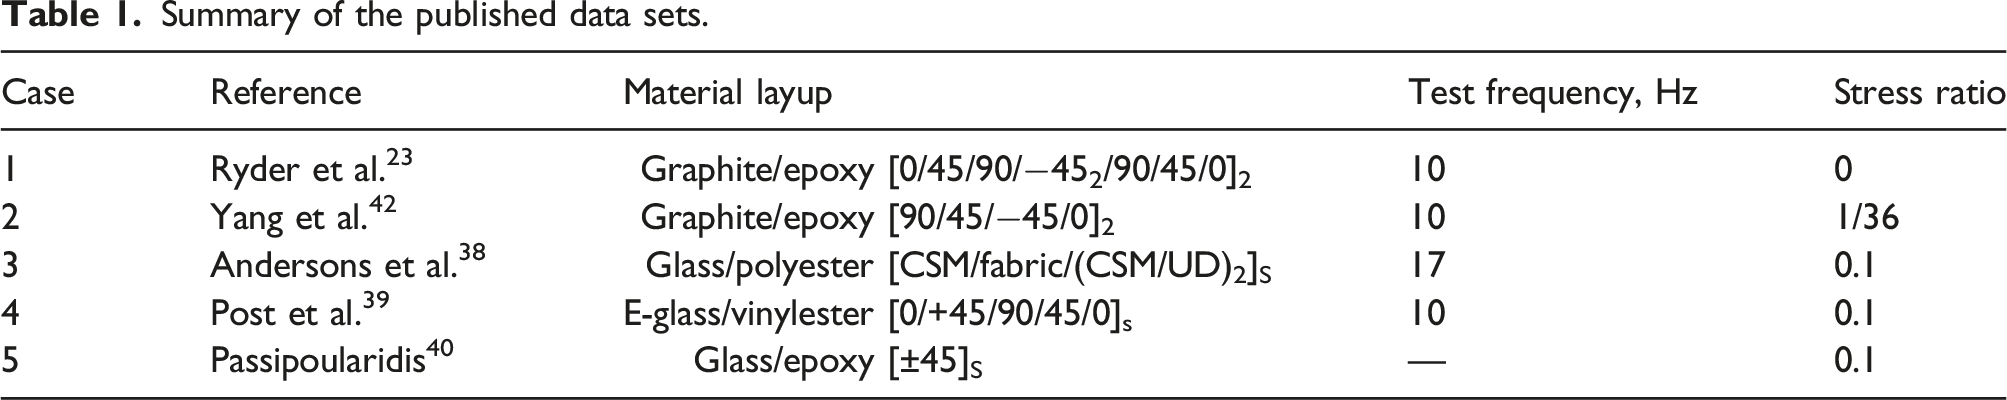
The first dataset includes experiments performed by Ryder et al. 23 on T300/934 graphite/epoxy specimens with [0/45/90/−452/90/45/0]2 layup. The frequency of constant amplitude fatigue tests was 10 Hz. The stress ratio of the cyclic loading was set to zero, i.e. Tensile–Tensile (T–T) fatigue with a minimum load of zero.
The second dataset is from Yang et al. 42 The graphite/epoxy composite material used in this case is the Rigidite 5208-Thornel 300 system, and the layup of the laminate is a [90/45/−45/0]2. As before, testing frequency is kept constant at 10 Hz while the stress ratio is in the T–T domain equal to R = 1/36.
The third dataset comes from the data of Andersons et al. 38 . The material used is a glass/polyester composite of a layup typical of the spar region of wind turbine rotor blades. The material was produced by hand layup and comprised chopped strand mat (CSM), unidirectionally reinforced (UD), and fabric layers in the following sequence: [CSM/fabric/(CSM/UD)2]S. The loading frequency was 17 Hz, and the stress ratio R = 0.1.
The fourth dataset was produced by Post et al. 39 on E-glass/vinylester composite laminate with [0/+45/90/45/0]s layup. The loading frequency of the fatigue test was maintained at 10 Hz. The fatigue test was performed in a T–T domain with a stress ratio of 0.1.
Finally, the last dataset is reported by Passipoularidis. 40 The material tested is a glass/epoxy used to manufacture a wind turbine rotor blade. The laminate used consists of four unidirectional plies at a layup of [±45]S. all tests were performed at R = 0.1.
For all cases in Table 1, essentially, three sets of tests were performed: (1) static tests, (2) fatigue tests, and (3) residual strength tests. Residual strength tests are performed by measuring the “remaining” strength under monotonic conditions after fatiguing the sample for a given number of cycles at a given stress and stress ratio. 28
To evaluate the new strategy in each case, the strength degradation parameter obtained from the experimental test is required. However, experimental tests do not consist of this parameter and only include data on static strength, fatigue life, and residual strength due to maximum stress and the number of cycles. Therefore, replacing residual strength test data in the Schaff and Davidson formula in equation (6) is used to find the experimental strength degradation parameter. Then the experimental strength degradation parameter is compared with the parameter estimated by the new strategy using equation (8). This equation is expressed as a relative error in which the absolute error (numerical value of the difference) is divided by the experimental value.
Results and discussions
This section uses the new strategy with datasets obtained from Table 1 references to verify its performance. Since the number of residual strength test data is large, several well-distributed residual strength test data are considered in each case.
Case 1: Graphite/epoxy composite (Ryder et al.)
Case 1, performed by Ryder et al.
23
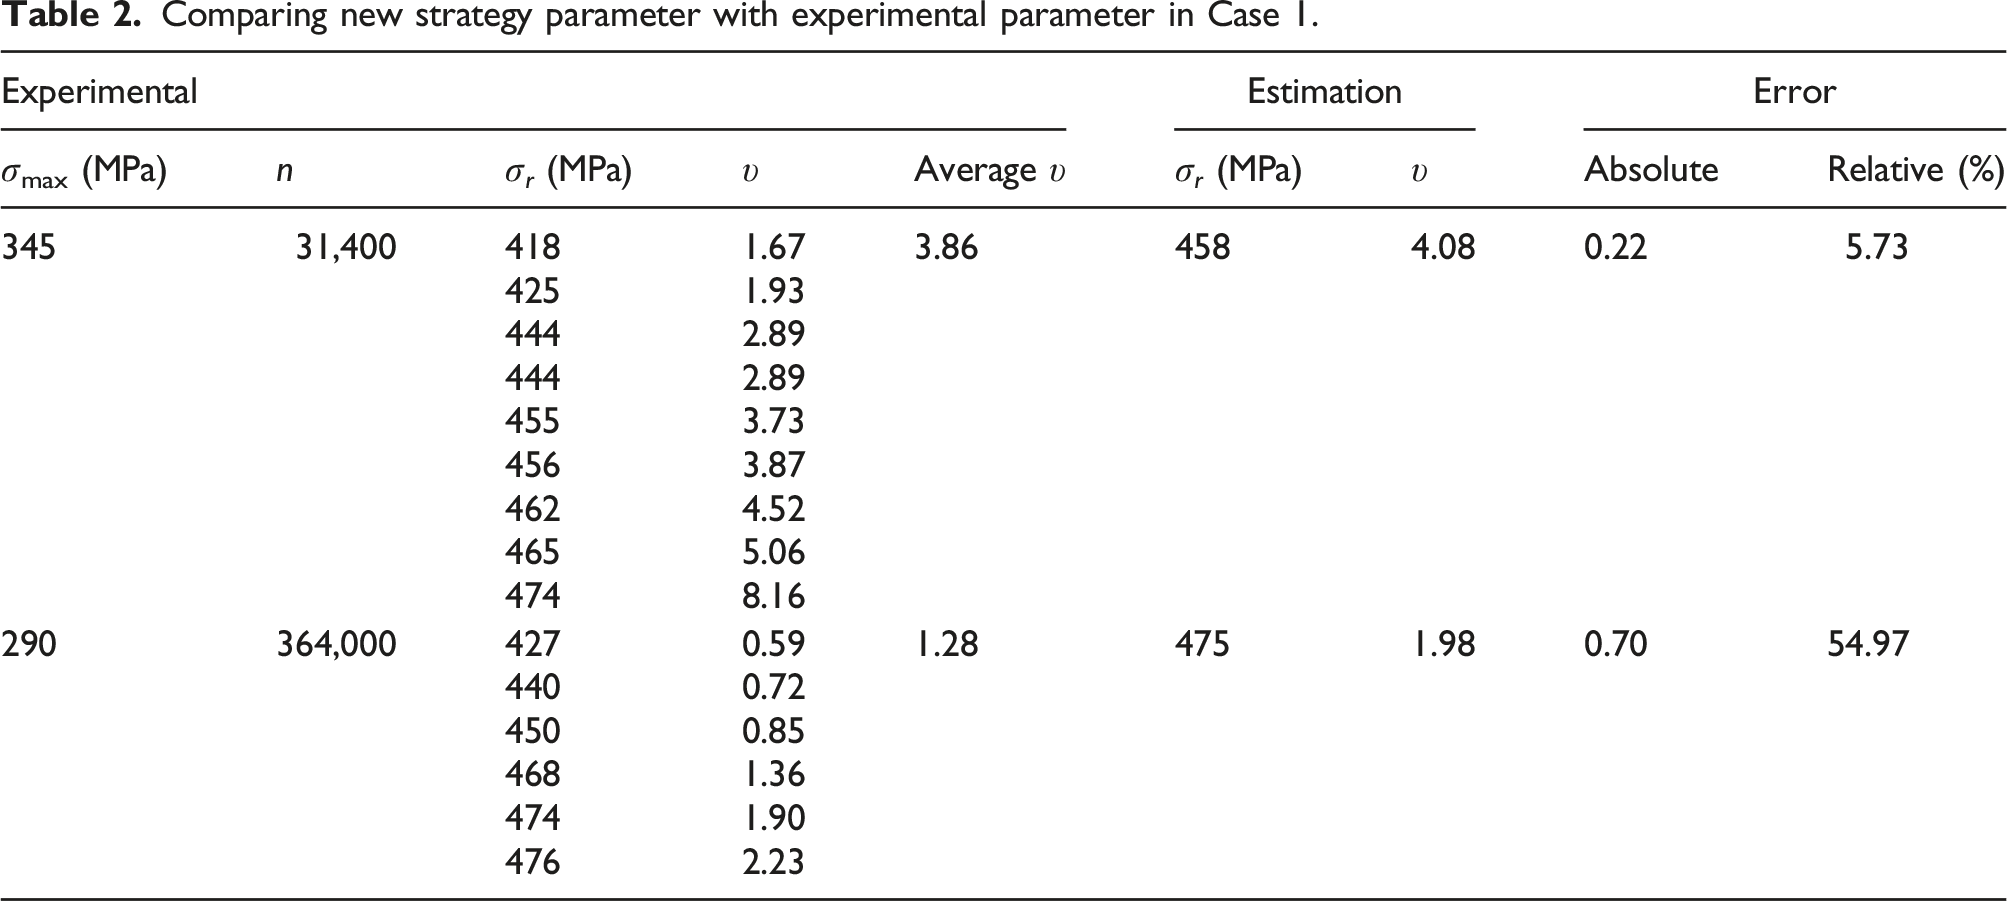
on graphite/epoxy specimens, contains 25 data points of static tensile strength with an average of 477 MPa and standard deviation of 24 MPa. Residual strength tests were conducted for two maximum cyclic stress levels, 345 and 290 MPa. According to the residual strength test, the residual strength at the stress level of 345 MPa after 31,400 cycles is between 376 to 501 MPa with an average value of 449 MPa and standard deviation of 38 MPa, while at the stress level of 290 MPa after 364,000 cycles is 339–499 MPa with an average value of 430 MPa and standard deviation of 42 MPa. Comparing the two residual strength ranges at the stress level of 290 and 345 MPa indicates that the changes at the bottom of the range (10%) are much more than at the top of the range (0.4%). This means that in specimens with higher strength, the reduction changes in the strength are less. In this case, to find fatigue life (N), all fatigue tests are fitted with the Sendeckyj model and parameters C and S are estimated. N is calculated 51,247 and 3,493,454 for the maximum stress levels of 345 and 290 MPa, respectively. Figure 6 shows the S-N curve model for this case. From the residual strength tests tabulated in Table 2, individual experimental υ values and an average value are calculated. Then, the strength degradation parameter estimated by the new strategy is compared with this average. An absolute error of less than one for both stress levels indicates that the estimated υ is close to the experimental parameter. However, the relative errors for the 345 and 290 MPa stress levels are 6% and 55%, respectively. It should be noted that the estimated υ is compared with the average of experimental υ. For the stress level of 290 MPa, the experimental υ varies from 0.59 to 2.23 with an average value of 1.28 and standard deviation of 0.67, in which the estimated value of υ (1.98) is located with almost one times standard deviation of the mean of the measured data. Thus, despite the large relative error, the estimate of υ is within a reasonable range. The relationship between residual strength and υ for the stress level of 345 and 290 MPa after 31,400 and 364,000 cycles is plotted in Figure 7. This figure shows that the experimental υ have a direct relationship with the residual strength. As the value of υ increases, the residual strength increases. However, this relationship is not linear, and as the residual strength approaches the static tensile strength, the experimental υ values become much larger than 1 (υ >>1). This is when the sudden death behaviour occurs. The good fit between the experimental and estimated values (indicated by orange solid circles/triangles and blue unfilled circles/triangles, respectively, in Figure 7) for the relationship between residual strength (σ
r
) and strength degradation parameter (υ) in Case 1 also indicates that υ is well estimated in the experimental range using the new strategy.
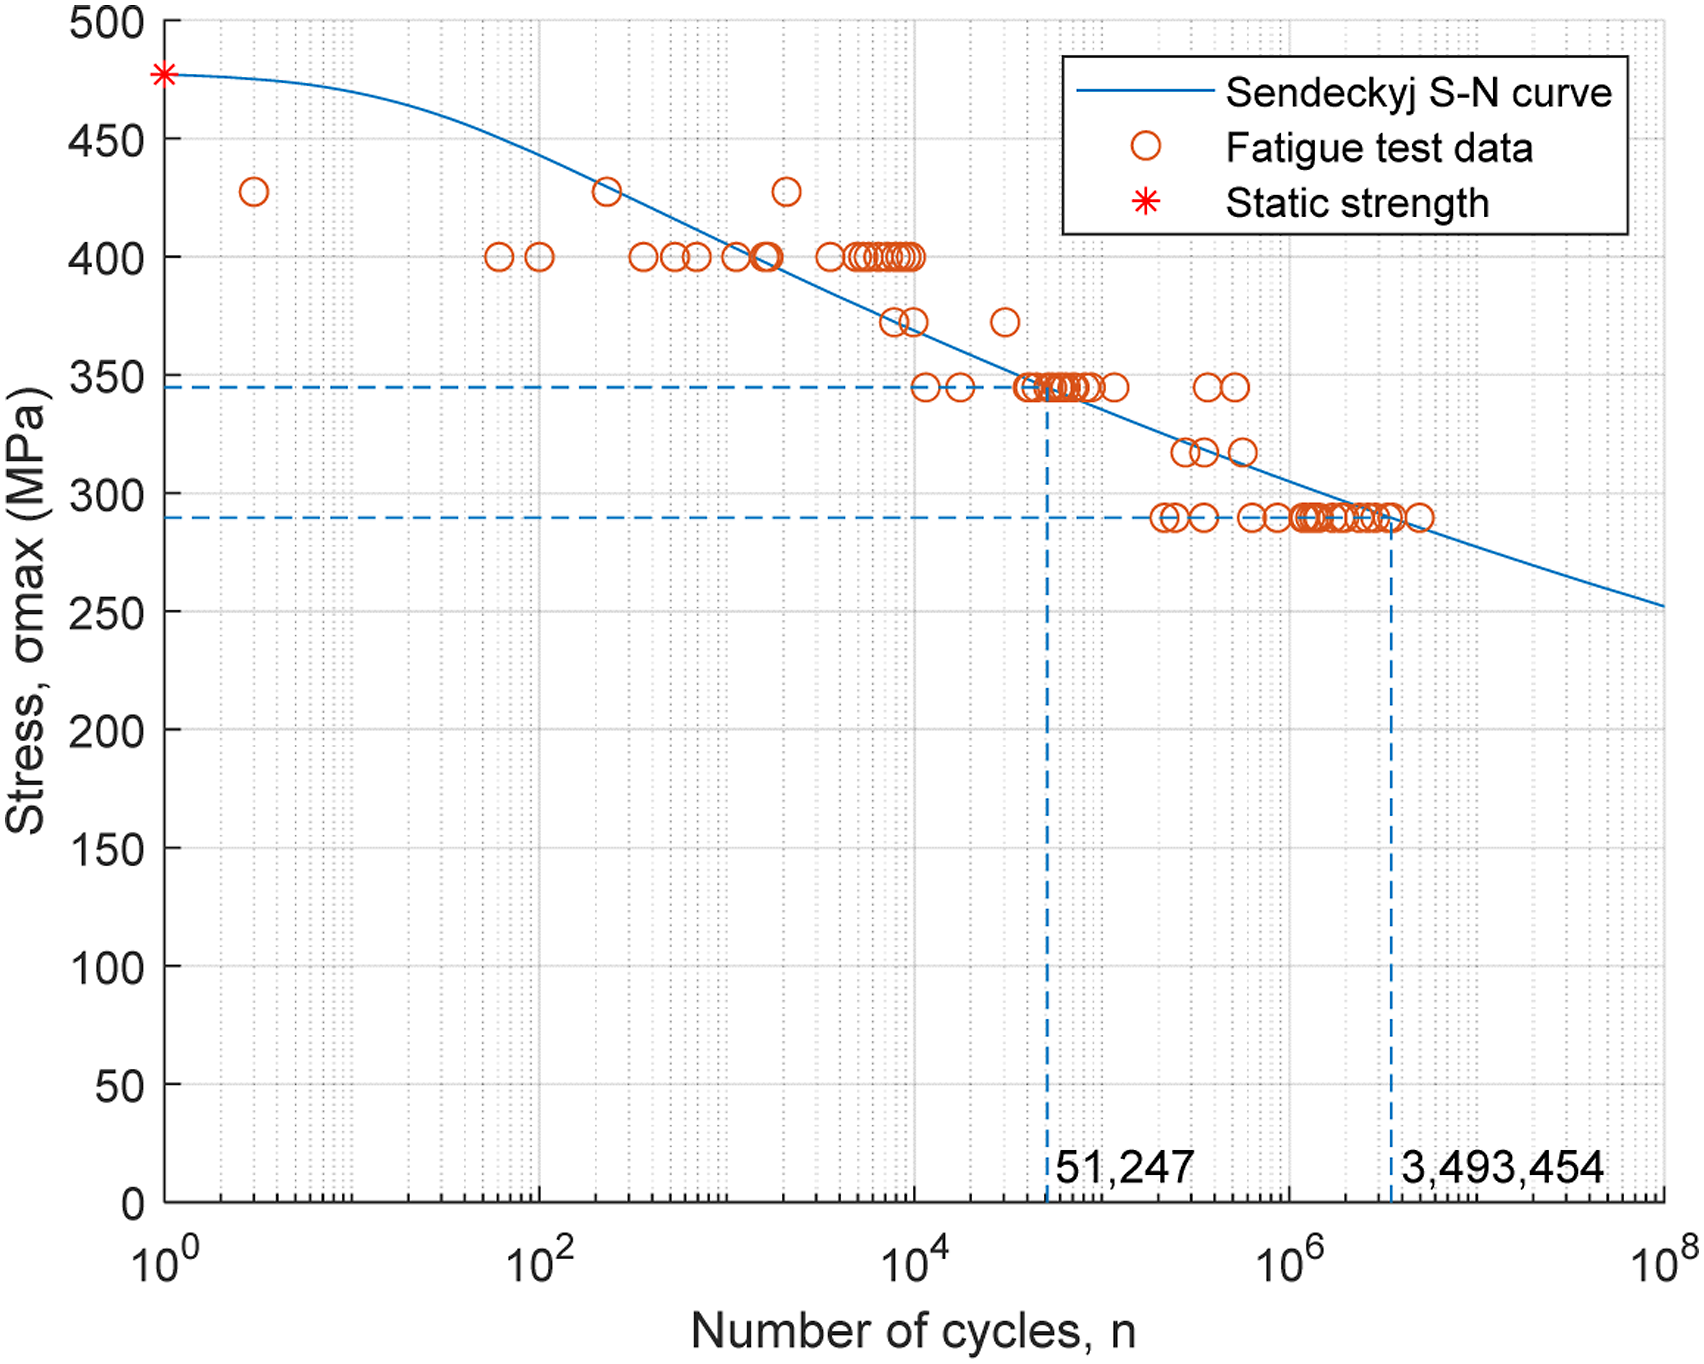
S-N curve for case 1 at R = 0.
Comparing new strategy parameter with experimental parameter in Case 1.
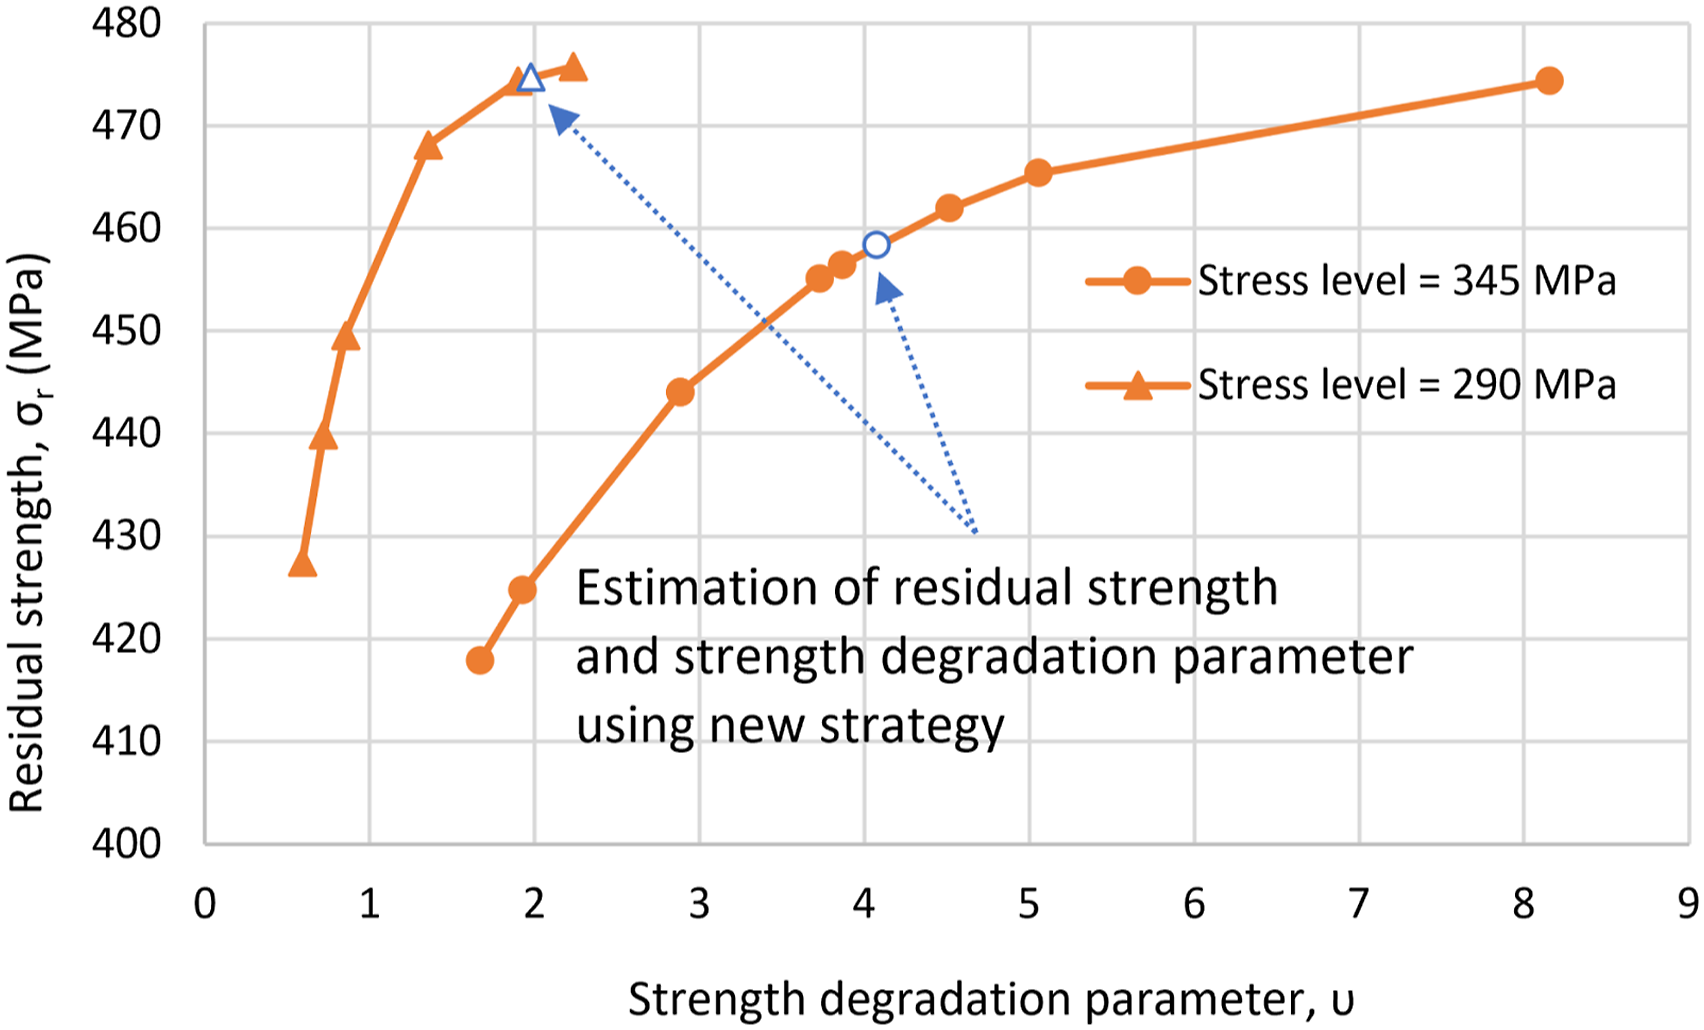
Relationship between residual strength (σ r ) and strength degradation parameter (υ) in case 1.
Case 2: Graphite/epoxy composite (Yang et al.)
In Case 2 from Yang et al.,
42
15 specimens were used to determine the static strength. The average results of the ultimate strength are equal to 599 MPa with a standard deviation of 29 MPa. In addition, a collection of specimens were fatigue tested under various maximum cyclic stress from 348 to 494 MPa. Finally, a set of specimens were subjected to a maximum cyclic stress of 390 MPa for 56,000 cycles, and then the residual strengths were measured. Figure 8 illustrates the Sendeckyj S-N curve for this case. According to this model, the number of cycles to failure for stress level of 390 MPa is predicted 156,199, which is approximately 100,000 cycles more than the number of cycles for which the residual strength tests were performed (56,000). S-N curve for case 2 at R = 1/36.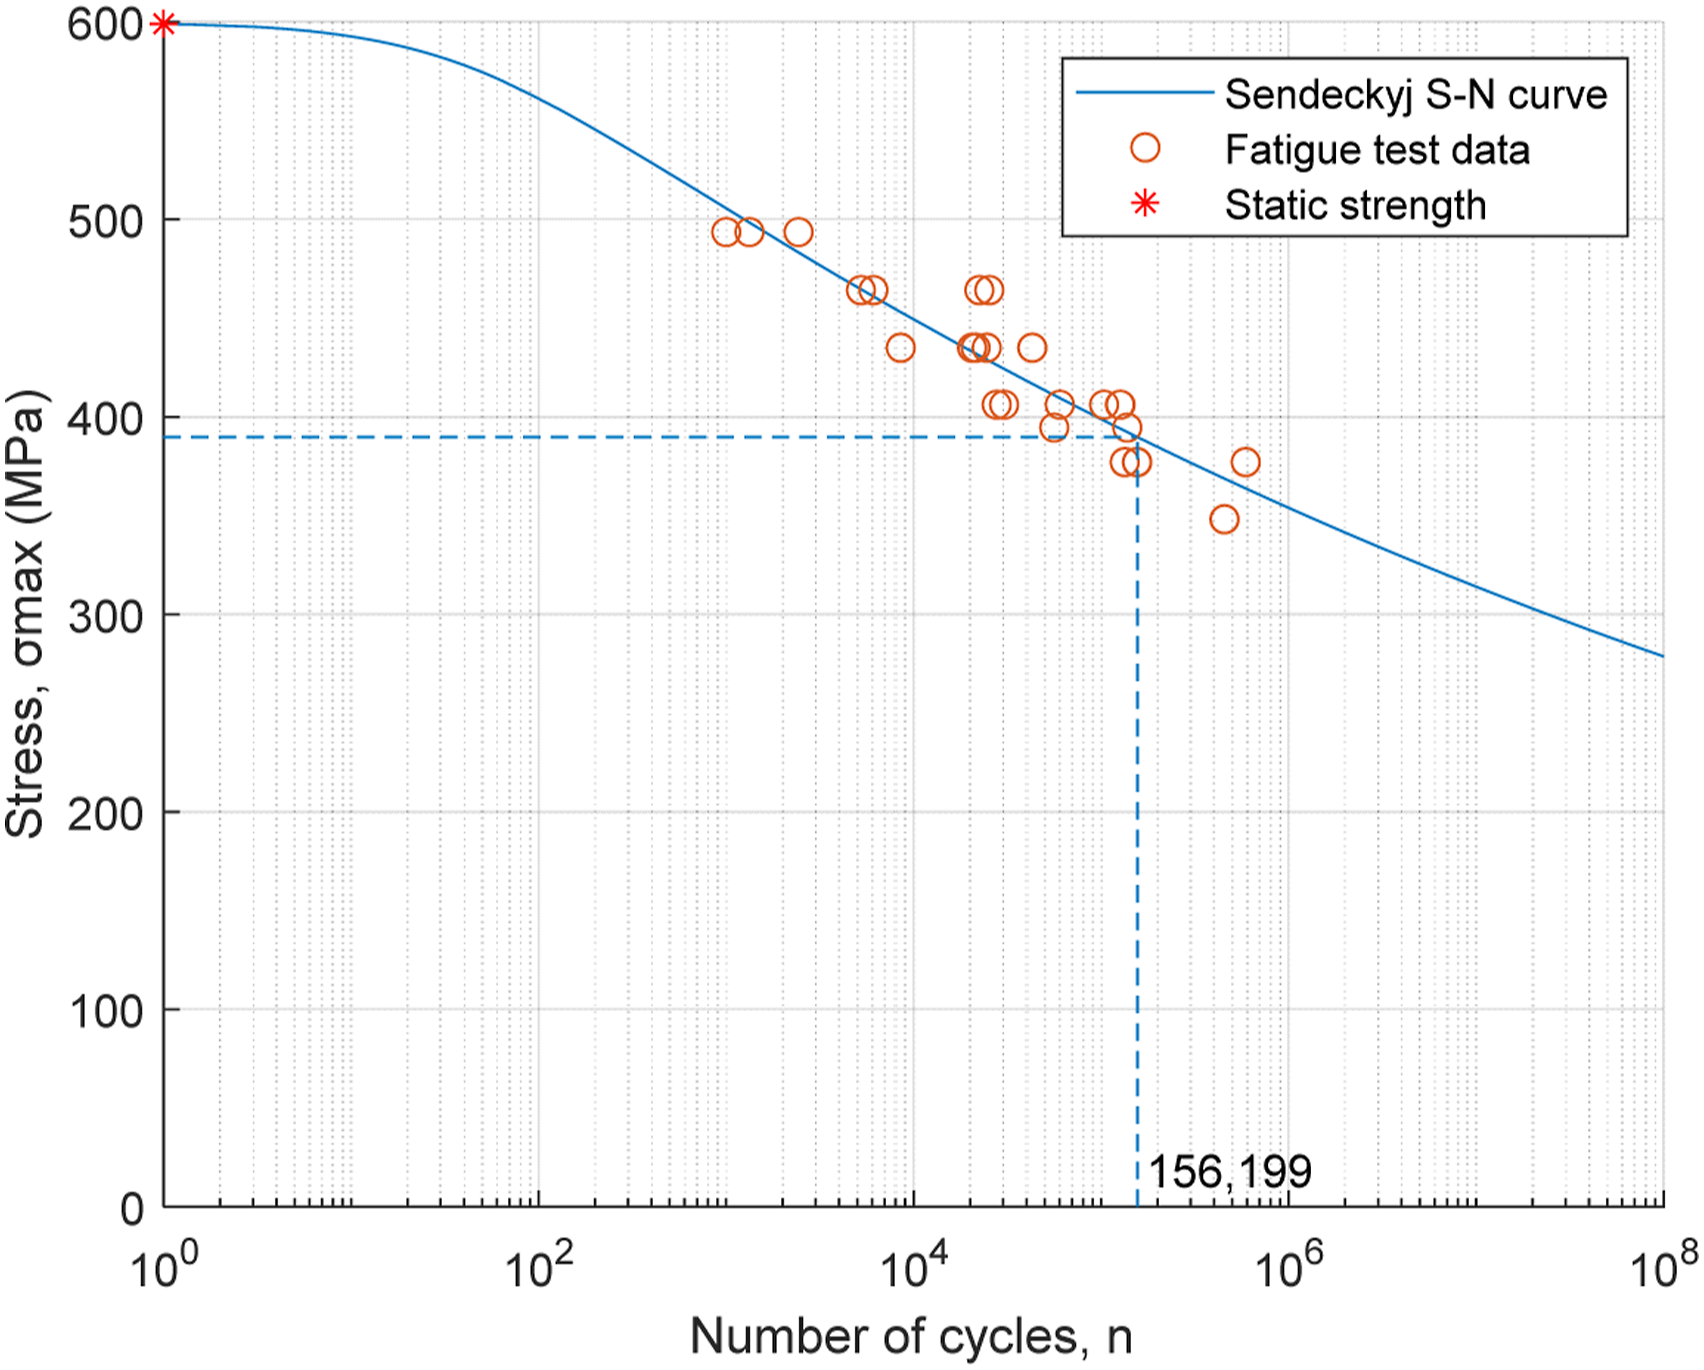
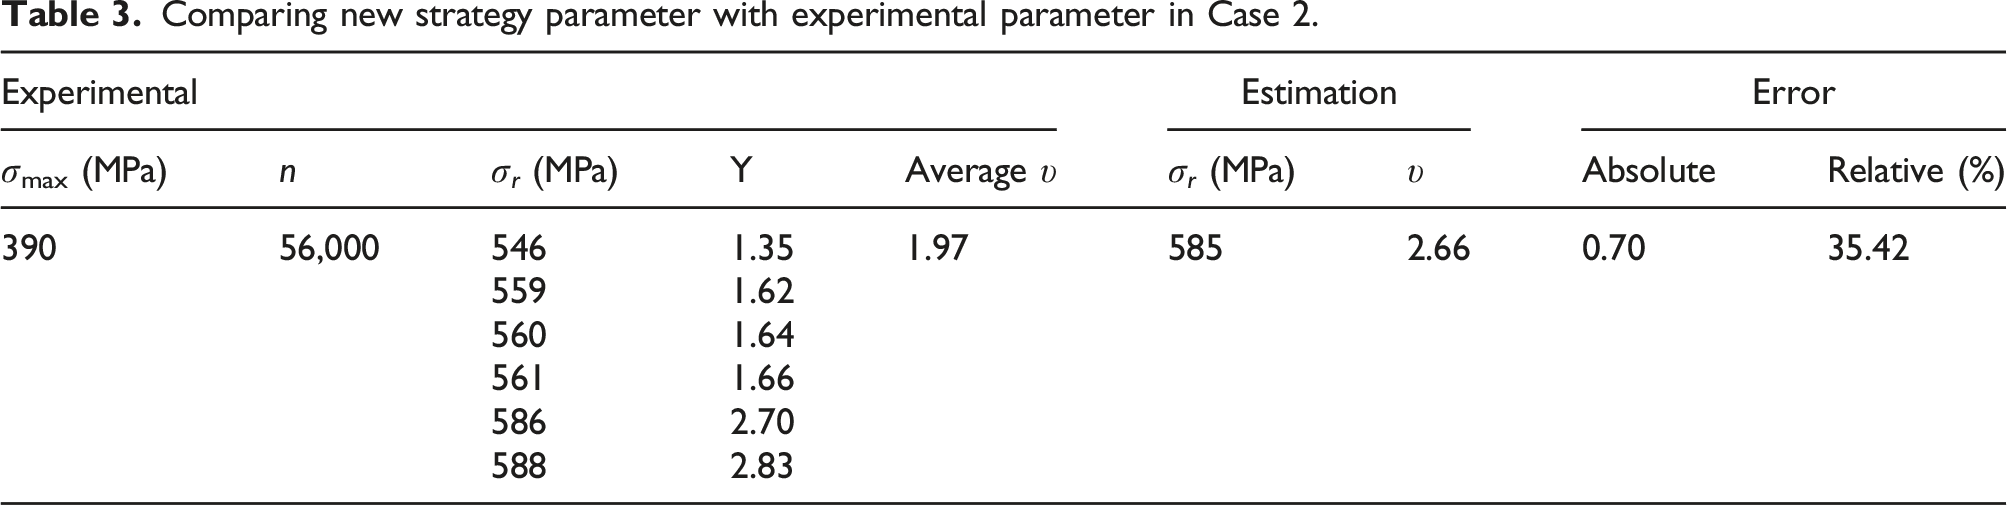
Comparing new strategy parameter with experimental parameter in Case 2.
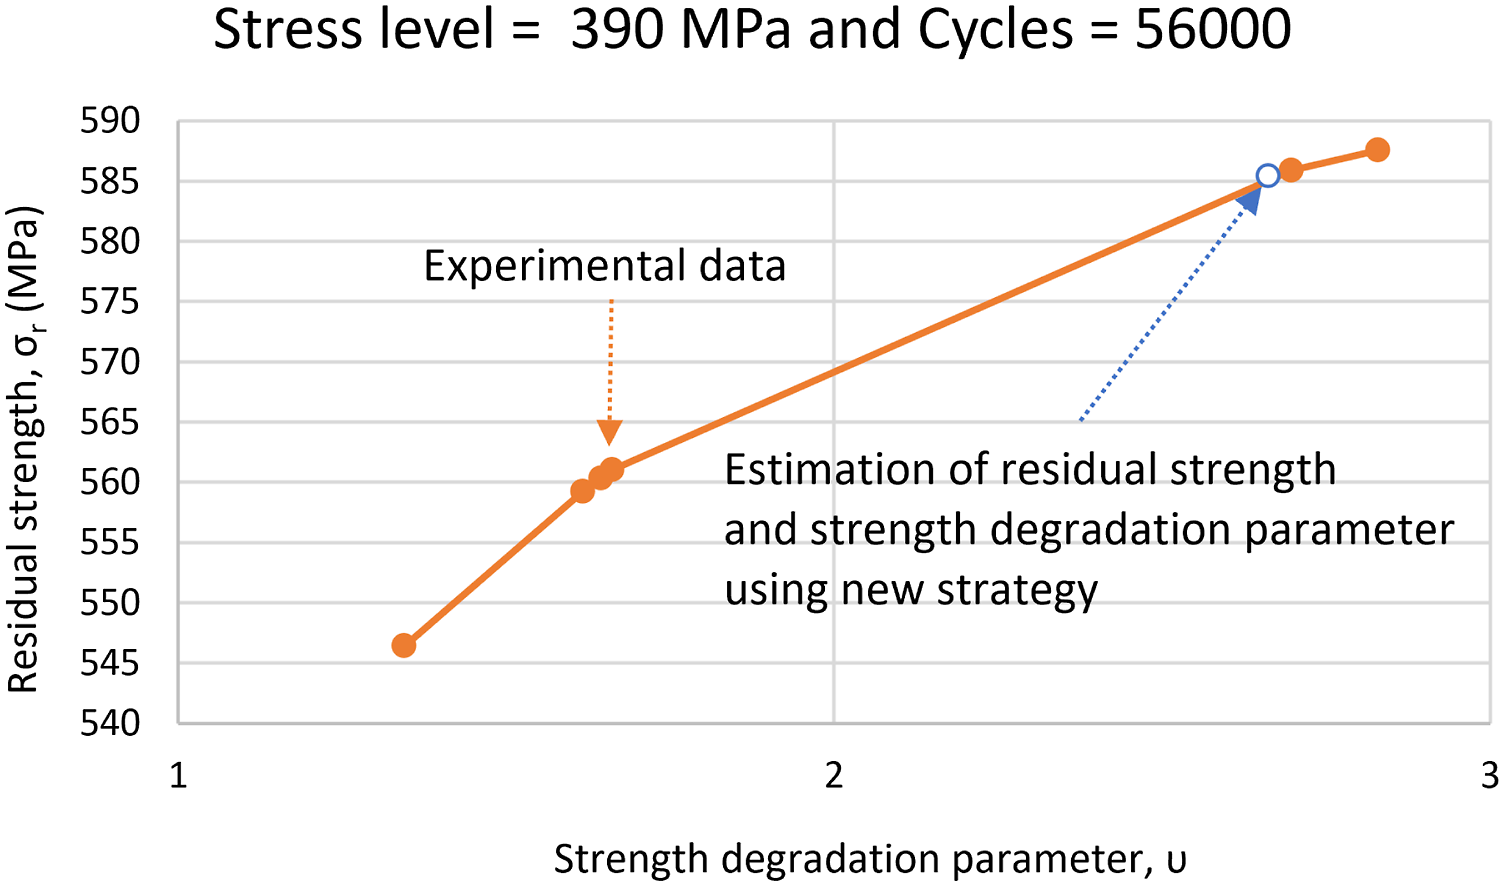
Relationship between residual strength (σ r ) and strength degradation parameter (υ) in case 2.
Case 3: Glass/polyester composite (Andersons et al.)
In Case 3 from the data of Andersons et al.,
38
the average tensile strength between 13 data points is equal to 672 MPa with a standard deviation of 21 MPa. The fatigue tests were run between 235 and 304 MPa, covering only the high cycle fatigue region. In contrast to the fatigue tests, the residual strength tests were performed at several stress levels. It is one of the few existing comprehensive data sets that provide residual strength information for different numbers of cycles at each stress level, namely 284, 235 and 221 MPa. Therefore, the fatigue tests are modelled with the Sendeckyj S-N formulation. Using this model, the number of cycles to failure is calculated for the needed stress levels. Figure 10 demonstrates these values. S-N curve for case 3 at R = 0.1.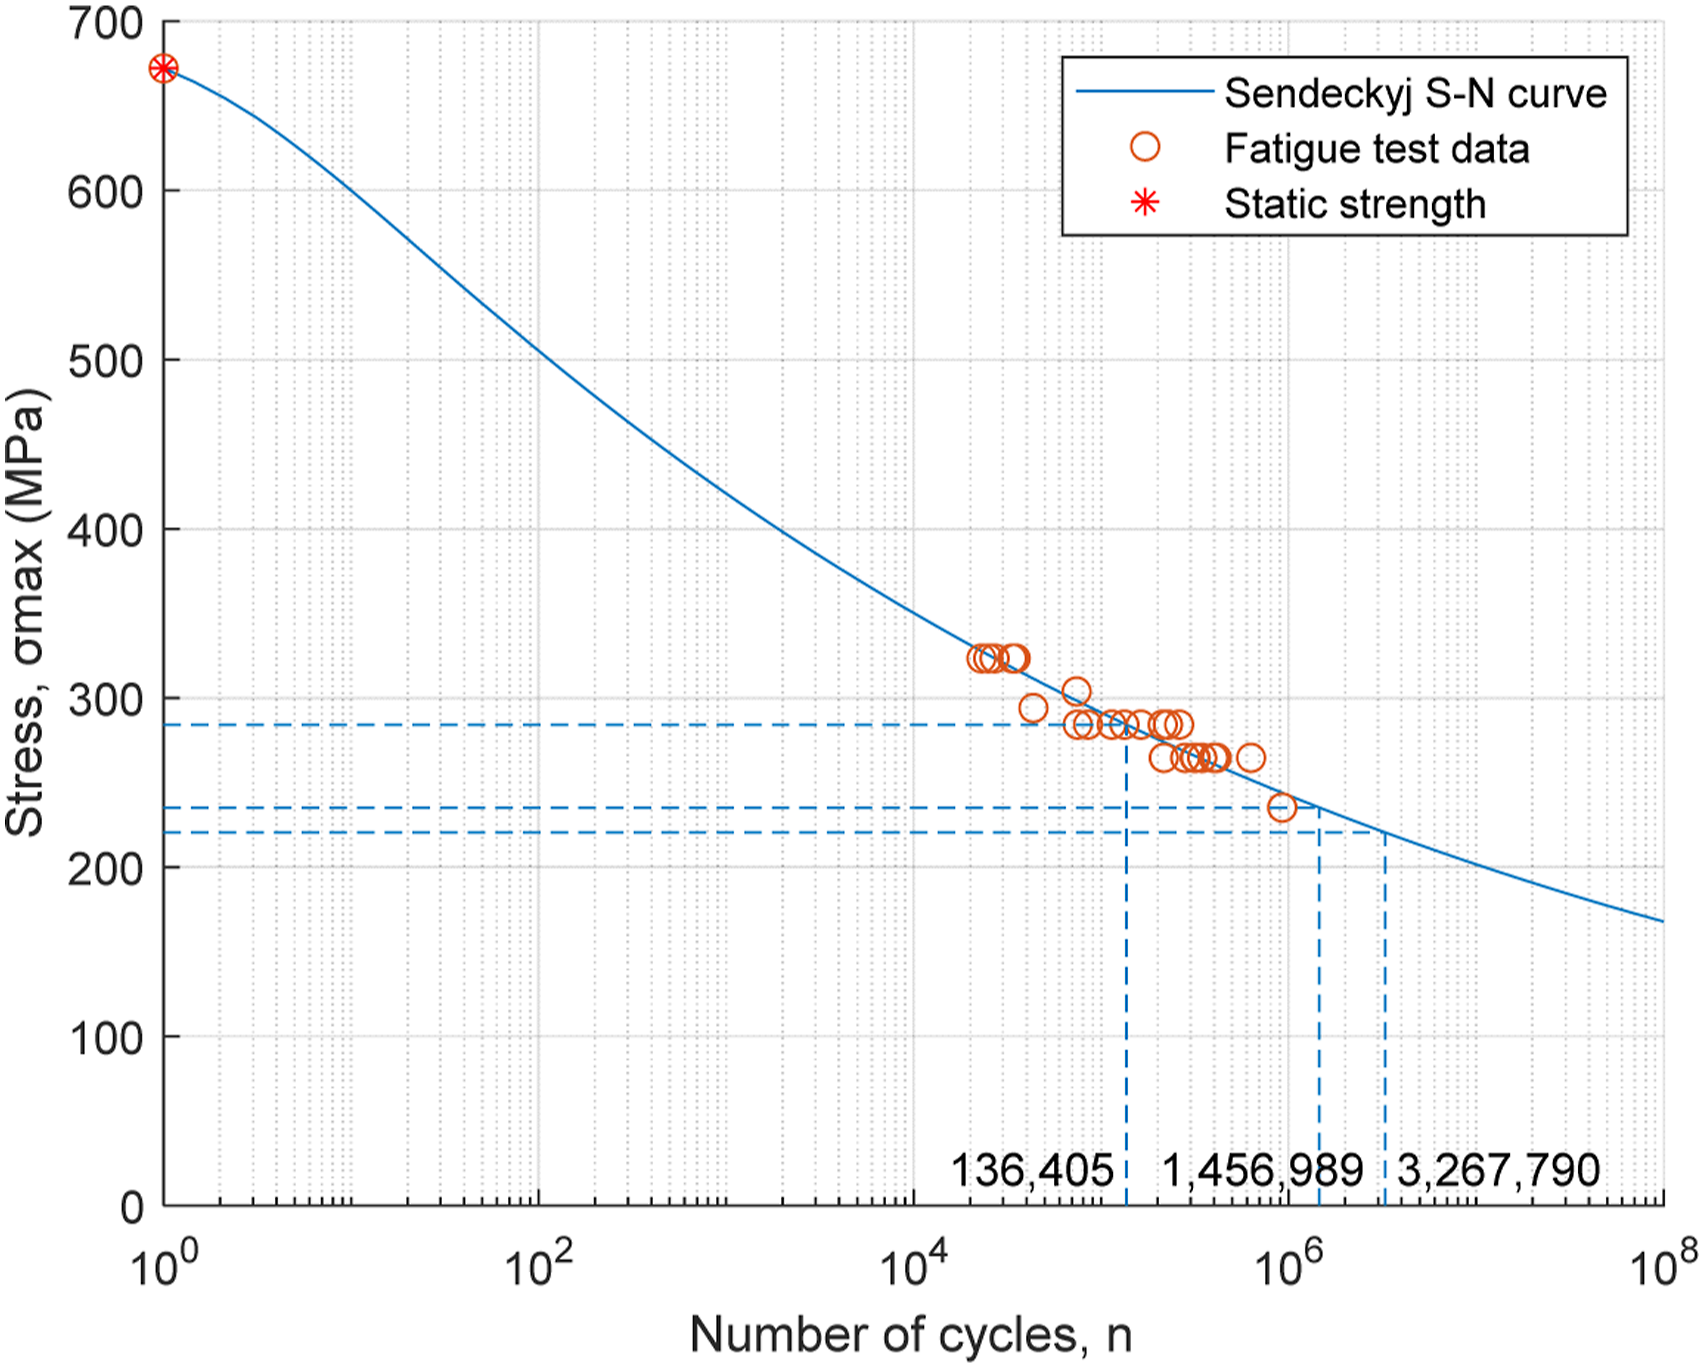
Comparing new strategy parameter with experimental parameter in Case 3.
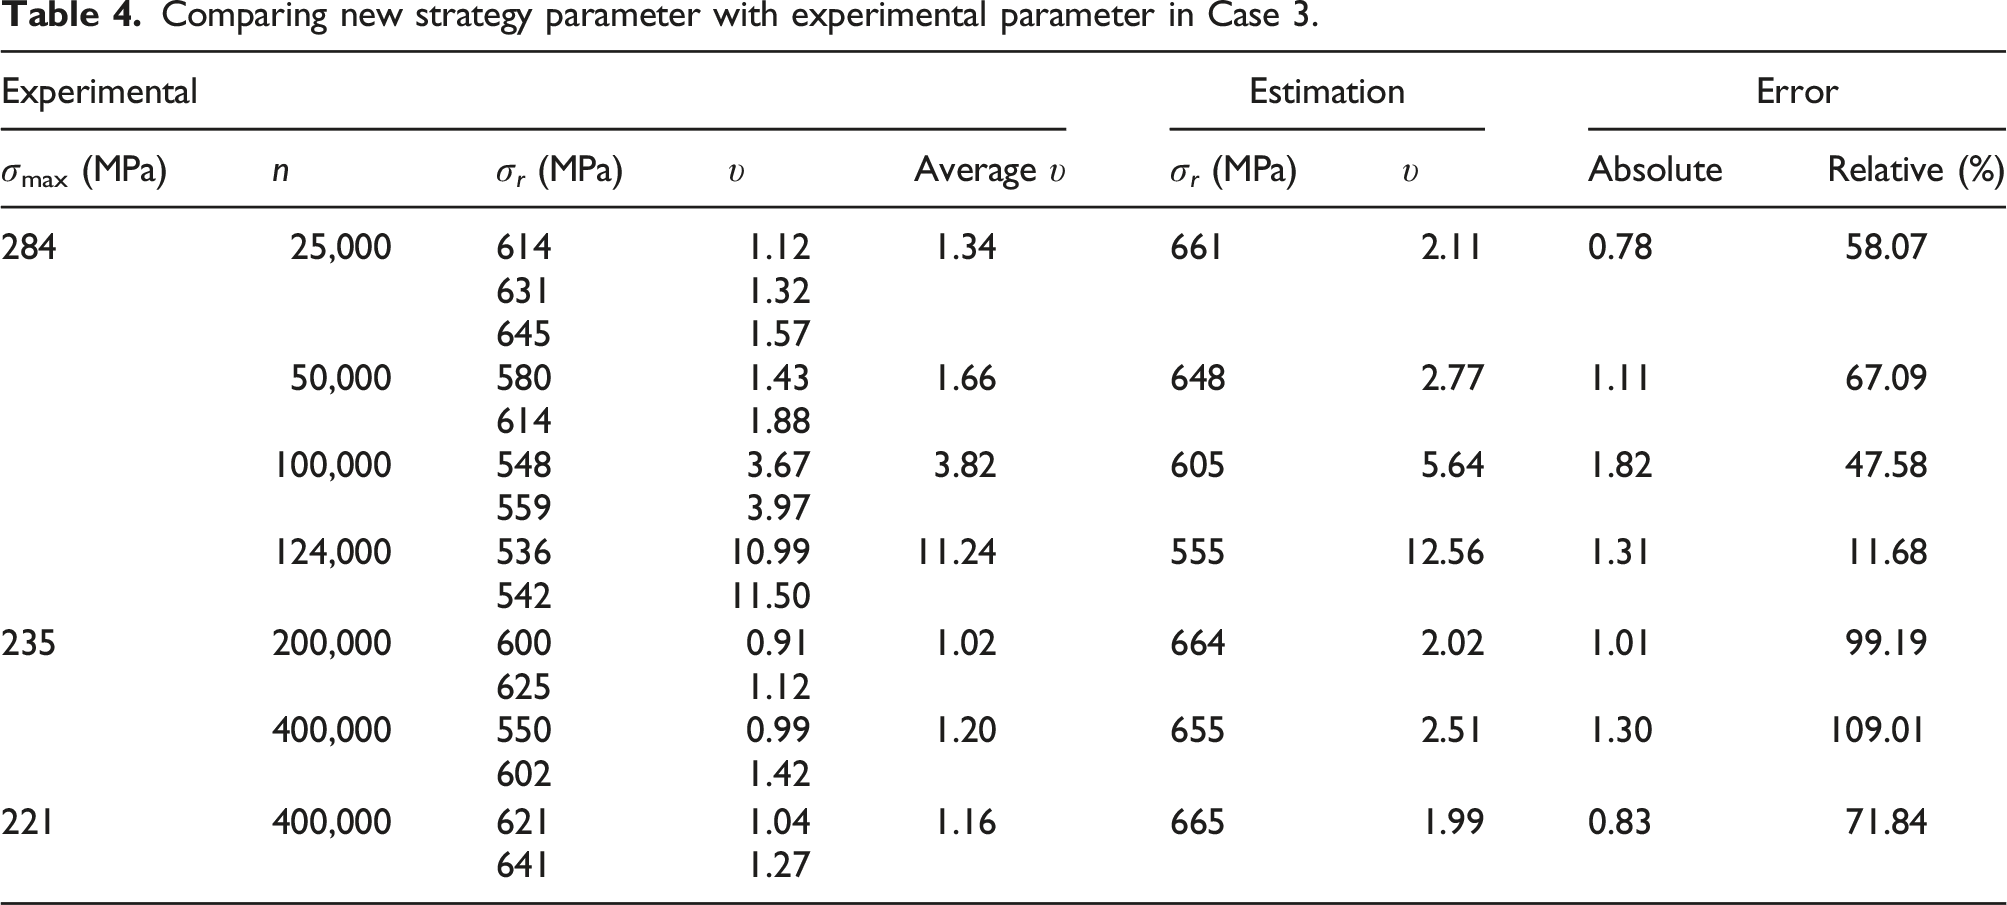
The table also shows that for each stress level, several residual strength and experimental strength degradation parameter values were determined for different cycle counts. Thus, experimental υ is directly related to stress levels. Considering the same number of elapsed cycles of 400,000 at both stress levels of 235 MPa and 221 MPa, it is concluded that the strength degradation parameter decreases as the stress level decreases.
In addition, different experimental υ values for various fatigue lives of a single stress level proves that the strength degradation parameter depends on the number of elapsed cycles. As the number of cycles increases, the strength degradation parameter increases. However, this relation is nonlinear, as shown in Figure 11. This is the first time that the number of cycles is involved in estimating the strength degradation parameter. In previous studies,29,30 the value of υ was estimated only by considering the stress level and cycle numbers were not considered. Therefore, for a constant stress level with different cycles, the value of υ was constant. Relationship between strength degradation parameter (υ) and number of elapsed cycles (n) in stress level of 284 MPa in case 3.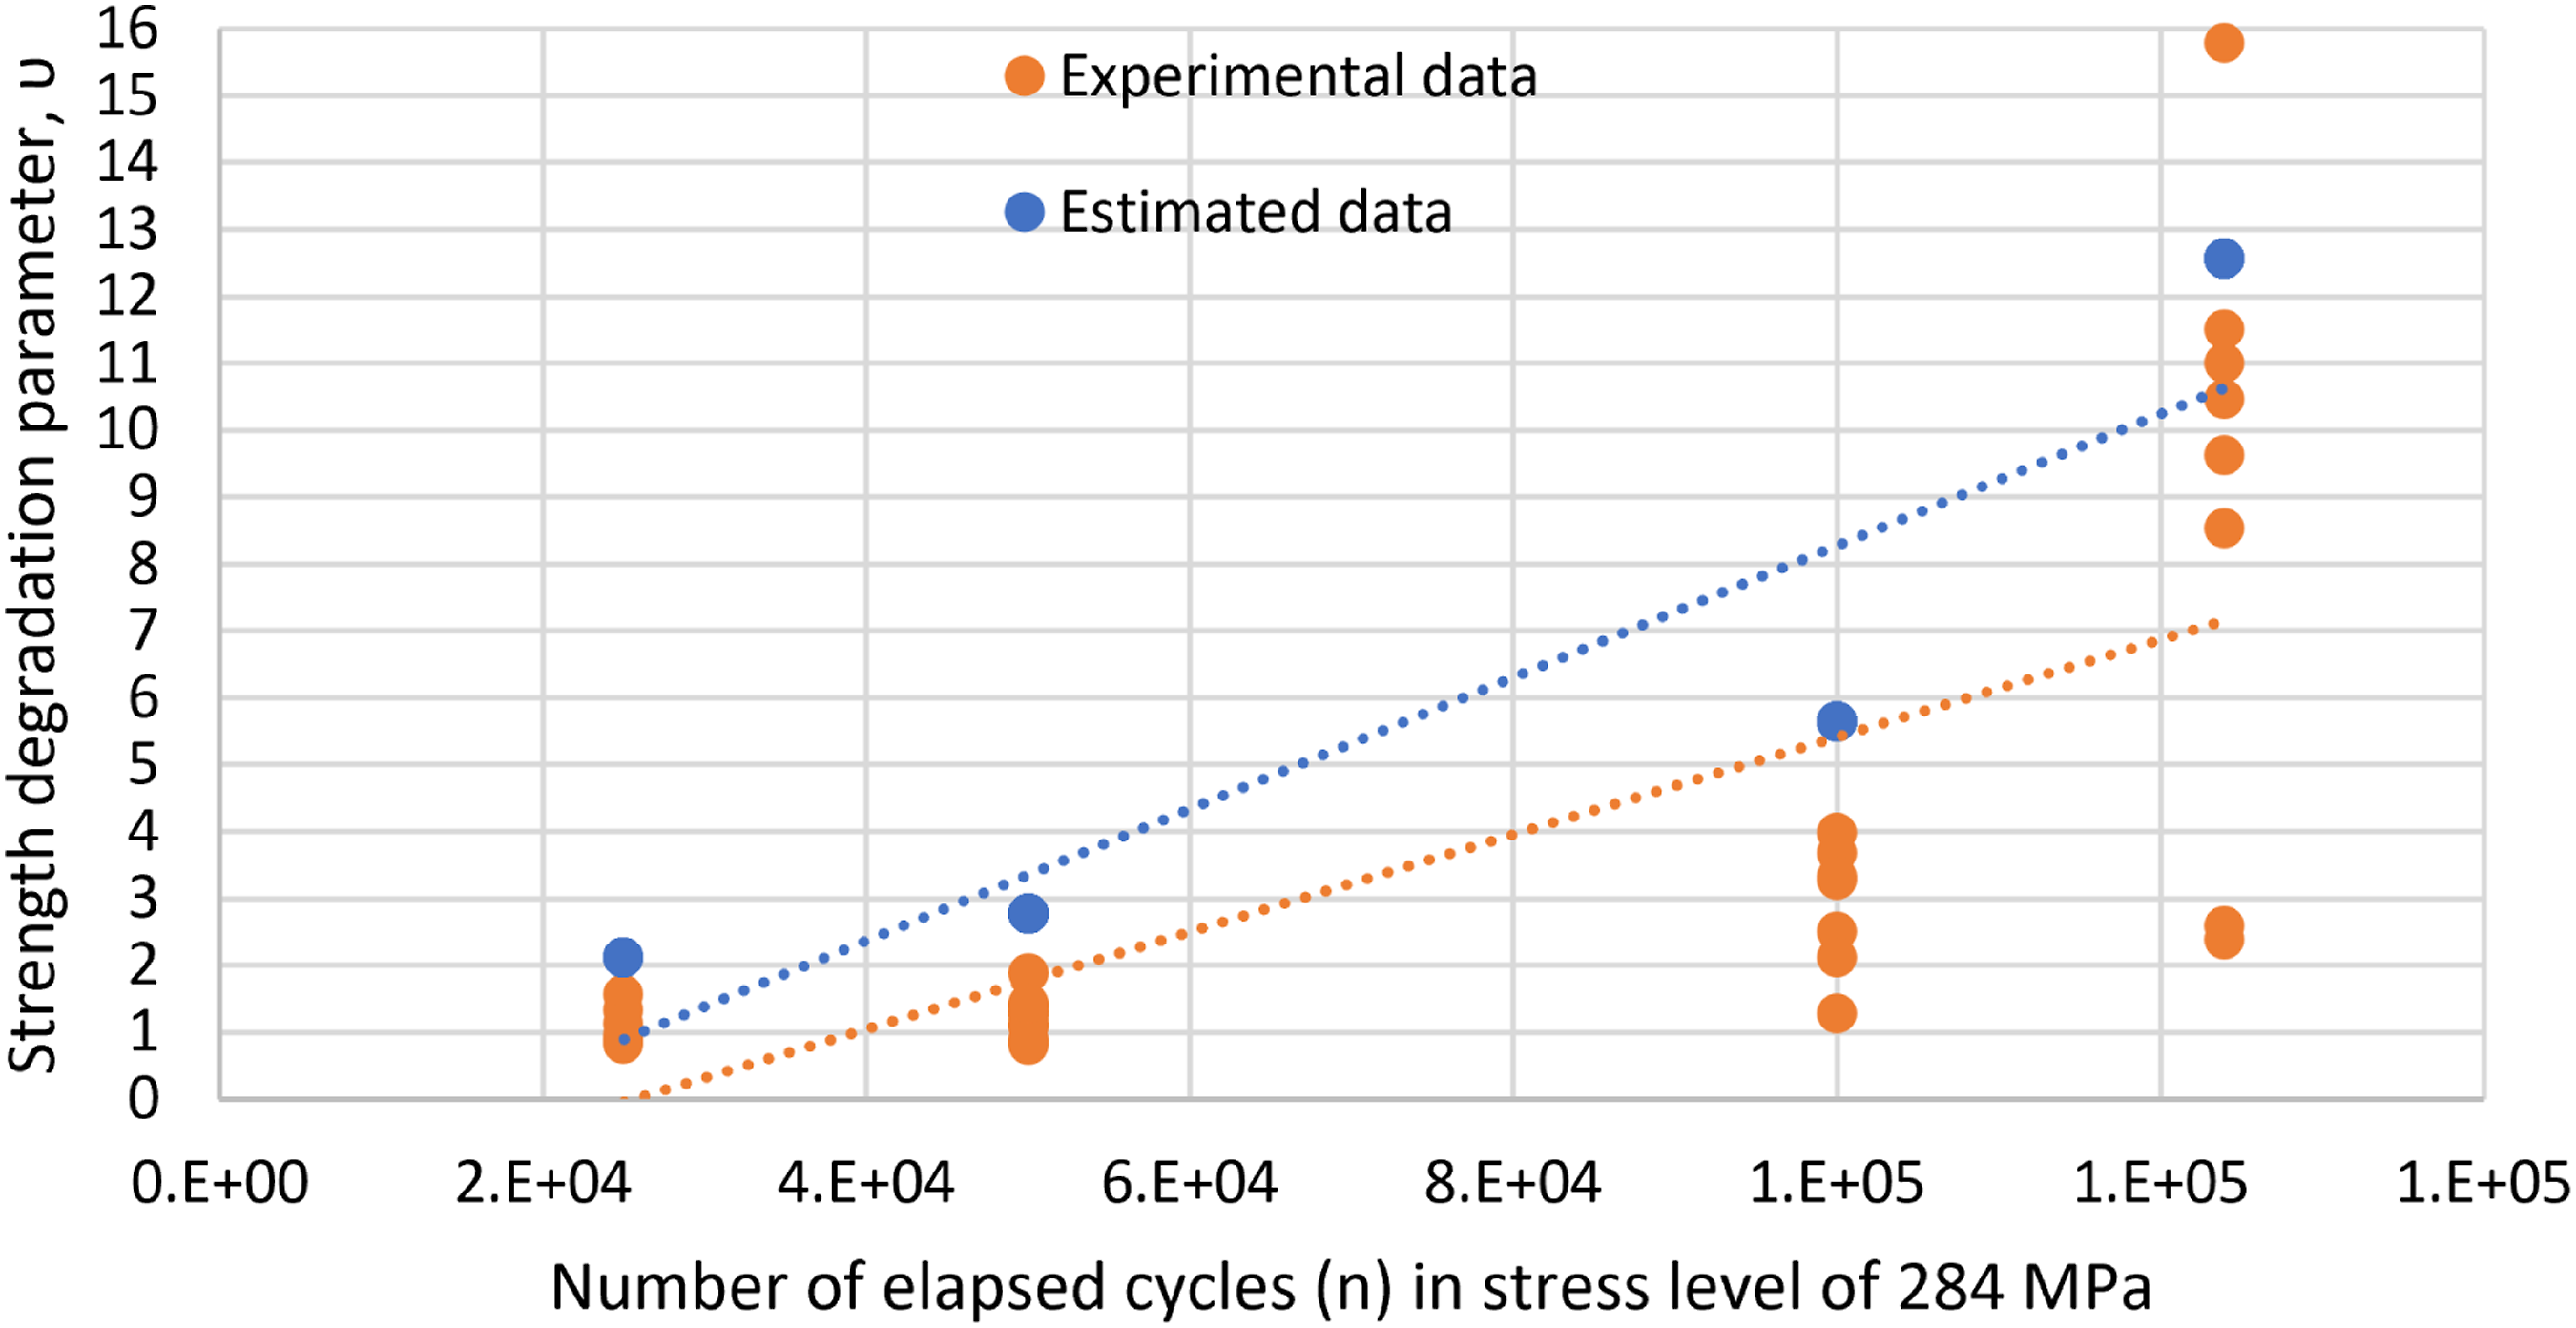
Case 4: E-glass/vinylester composite (Post et al.)
In this case, produced by Post et al.
39
on E-glass/vinylester composite laminate, the initial tensile strength of 20 specimens was reported with a mean of 333 MPa and a median of 334 MPa. When taking into account a Weibull distribution for strength data, the location parameter (β) and the shape parameter (α) are equal to 339 and 41.9, respectively. A total of 88 constant amplitude fatigue tests were performed to find the S-N curve. Stress levels were targeted for lifetimes of approximately 1000, 10,000, 50,000, 100,000, 500,000, and 1,500,000 cycles. 185 residual strength tests were also performed using a similar approach to Case 3. Specimens were tested at five cycle counts for each of three stress levels. The stress levels chosen were 174, 147 and 120 MPa. Cycle counts correspond to 10%, 30%, 50%, 60% and 70% of the target lifetime for that stress level. The Sendeckyj model in Figure 12 is a curve fit to the entire 88 sample fatigue data set. After estimating parameters C and S, the number of cycles to failure is calculated for the three stress levels selected for residual strength testing. S-N curve for case 4 at R = 0.1.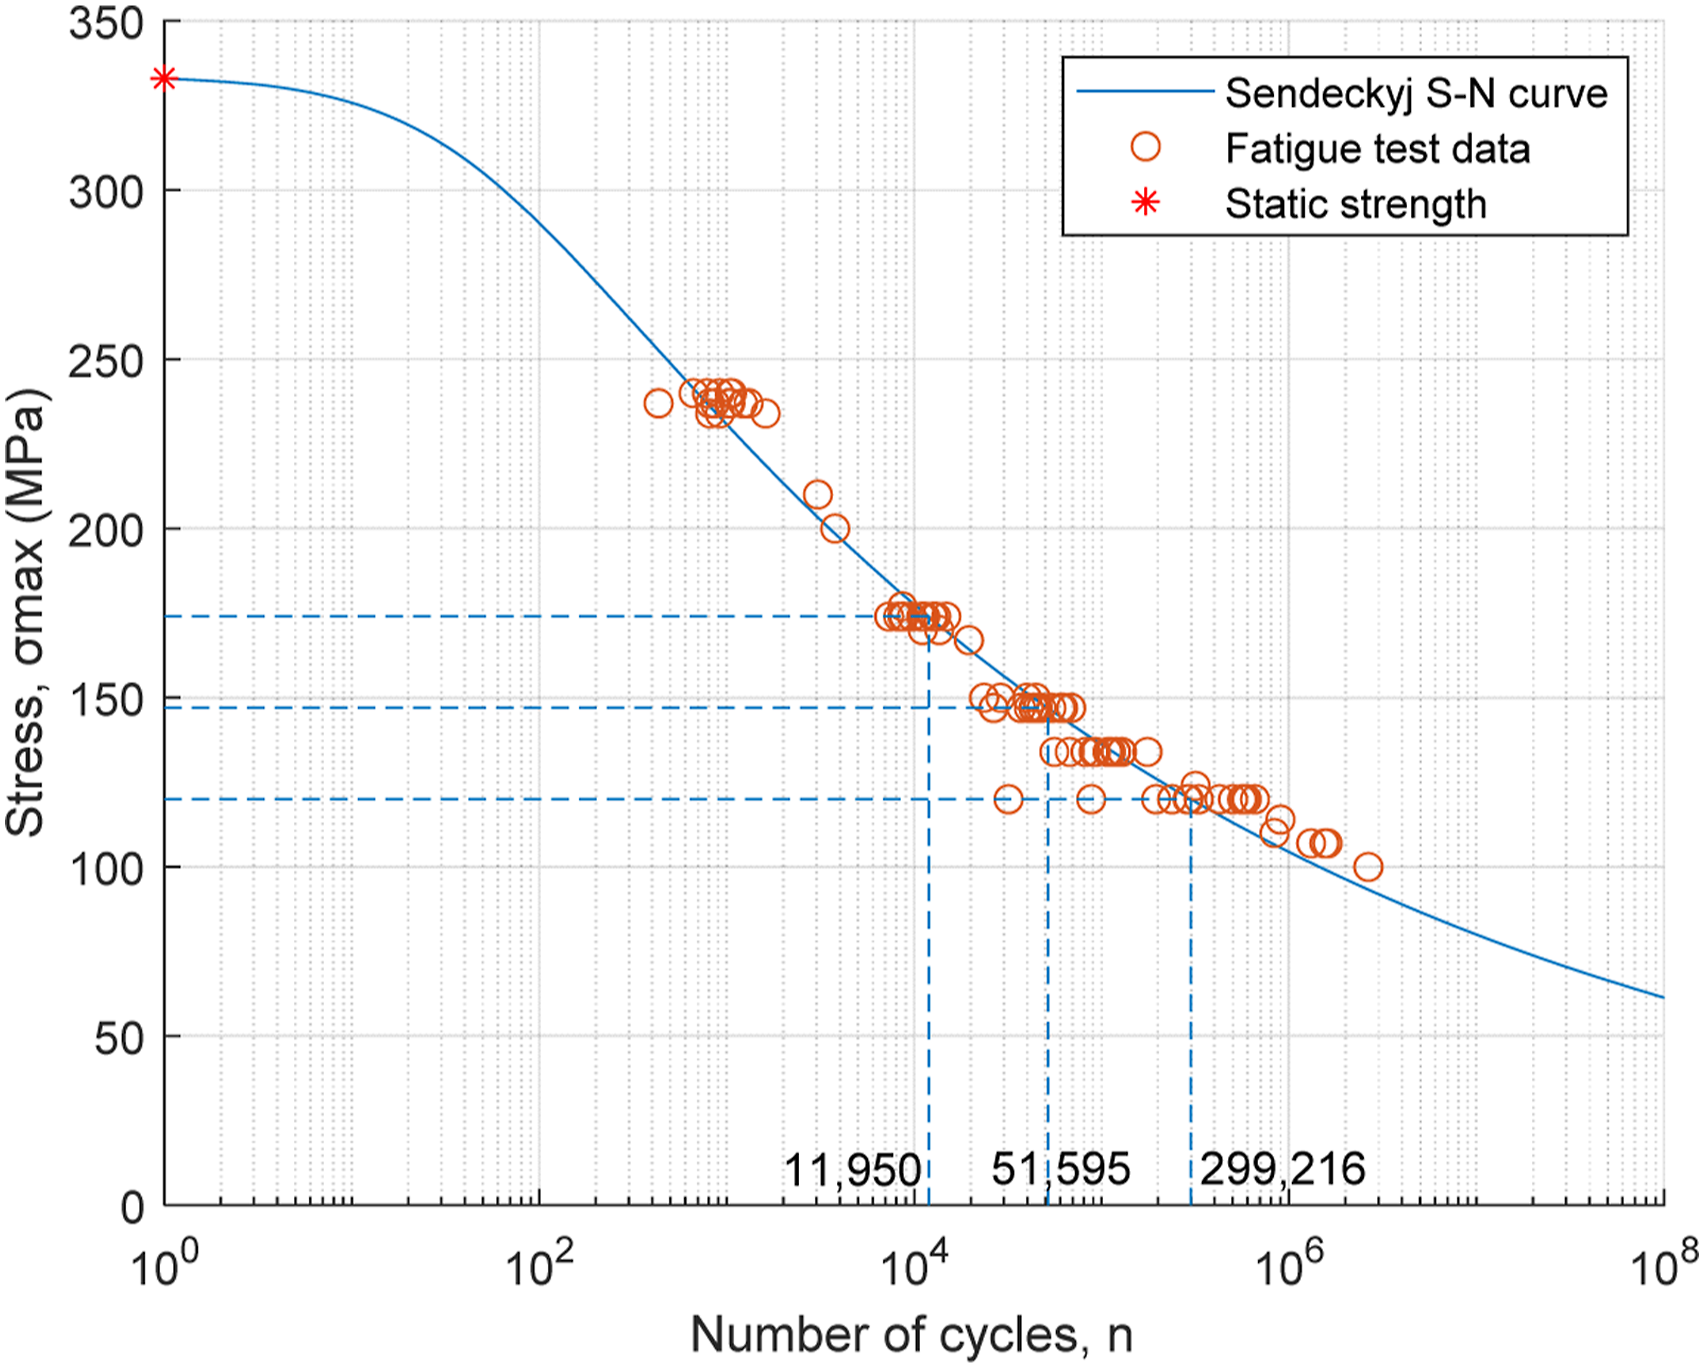
Comparing new strategy parameter with experimental parameter in Case 4.
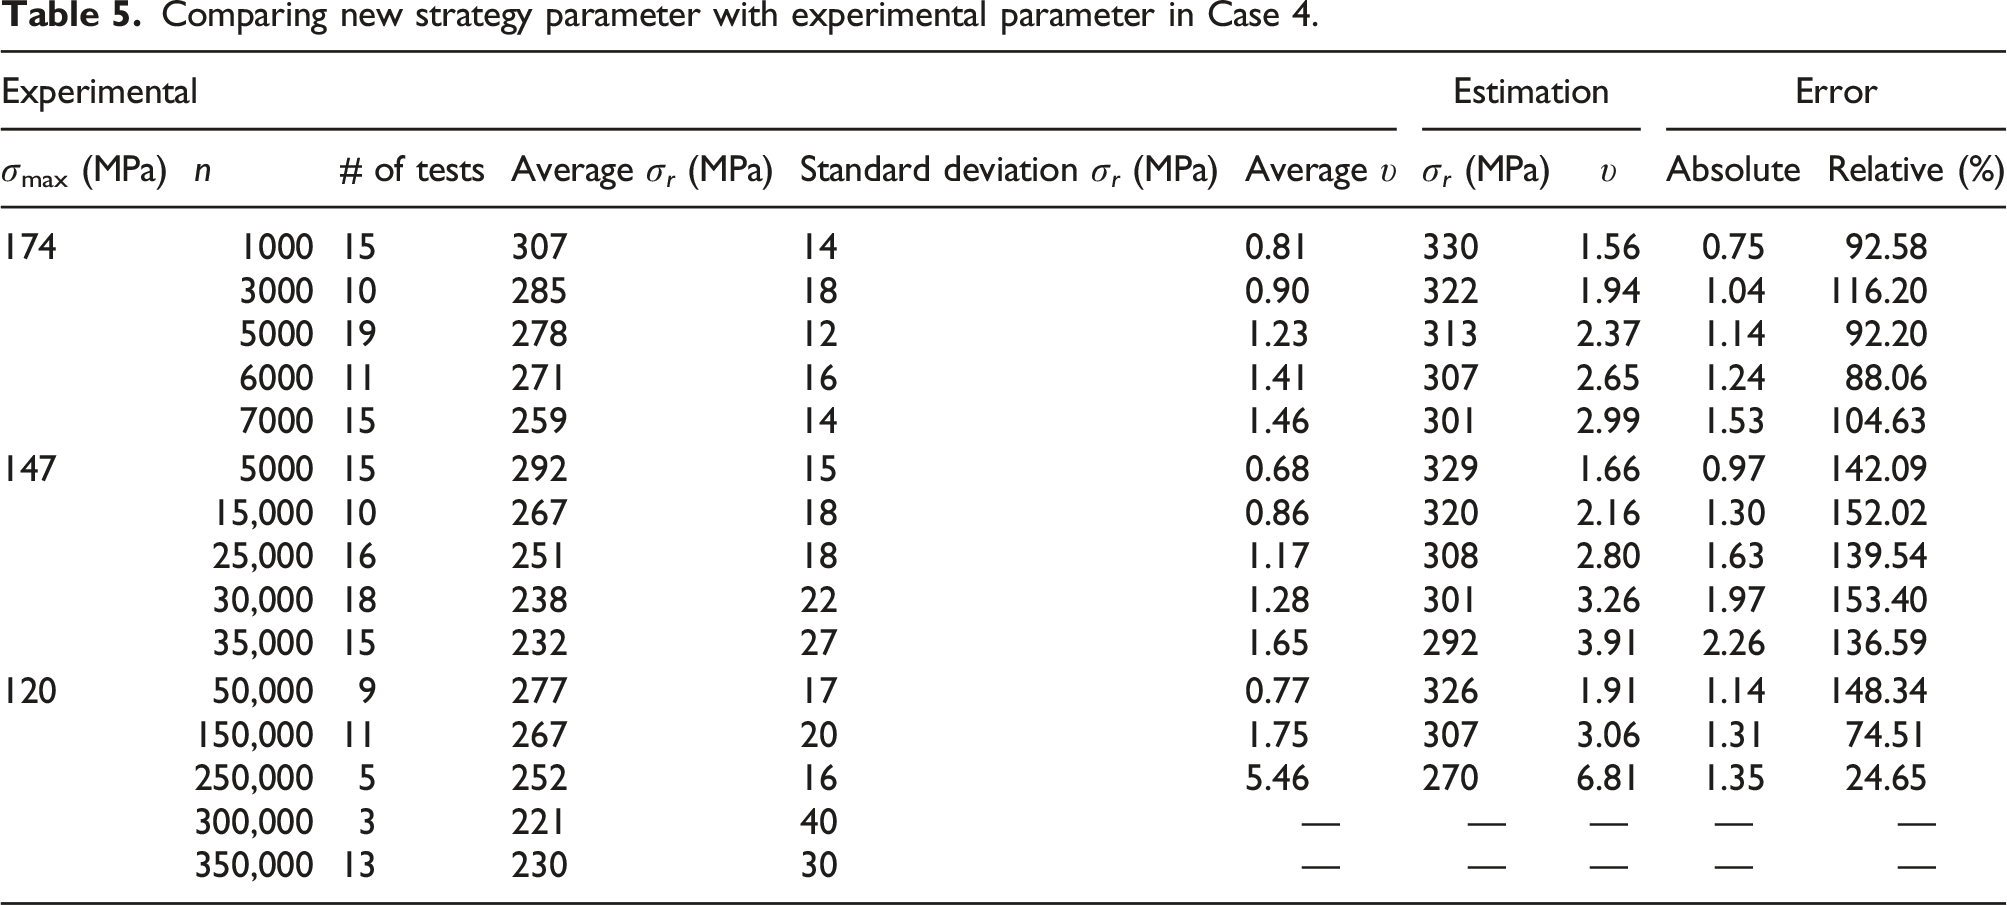
Table 5 shows that at each stress level, the absolute error between the experimental and estimation strength degradation parameter is related to the number of cycles. As the number of cycles increases, the absolute error also increases. To make this conclusion more understandable, Figure 13 is made to illustrate the connection between the stress level, the number of cycles and the strength degradation parameter. In the figure, at a constant stress level, the strength degradation parameter increases with the increase in the number of cycles. However, at higher cycles, the strength degradation parameter tends to be vertical and changes significantly with a slight difference in cycles. Figure 13 indicates that the strength degradation parameter depends on the stress level in addition to the number of cycles since residual strength depends on these variables. Strength degradation parameters at higher loads are larger than at lower loads with similar cycles. This further demonstrates that the stress level and the number of cycles passed must be considered to determine the strength degradation parameter. Relationship between the measured strength degradation parameter and number of elapsed cycles in different stress levels in case 4.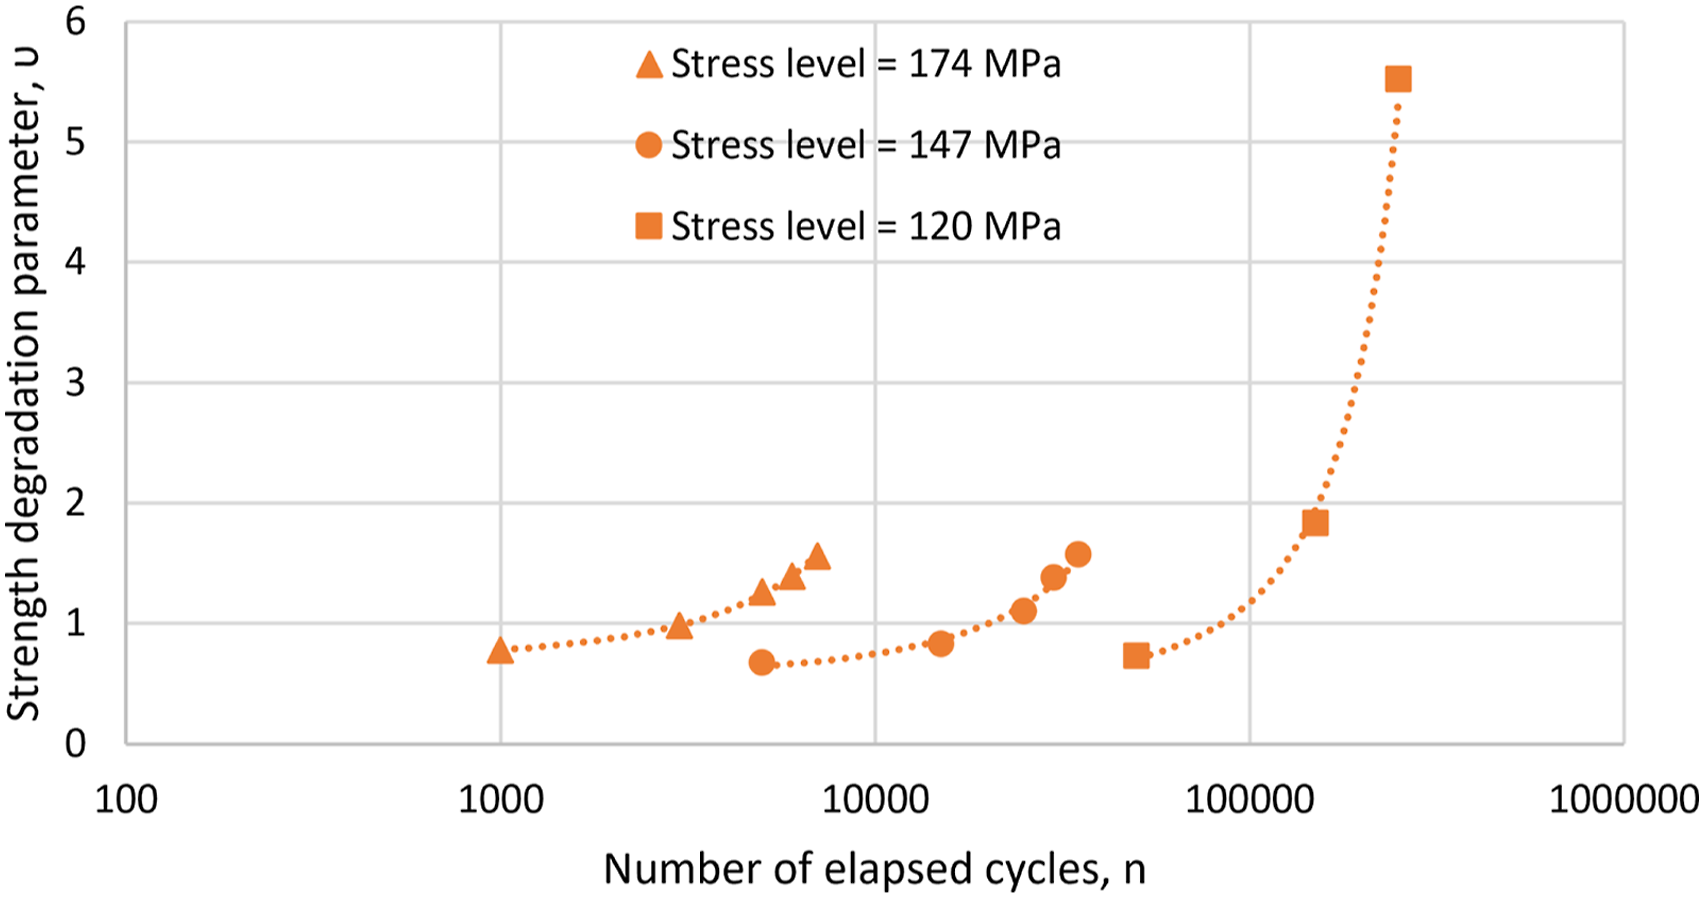
Case 5: Glass/epoxy composite (Passipoularidis)
In this case, reported by Passipoularidis,
40
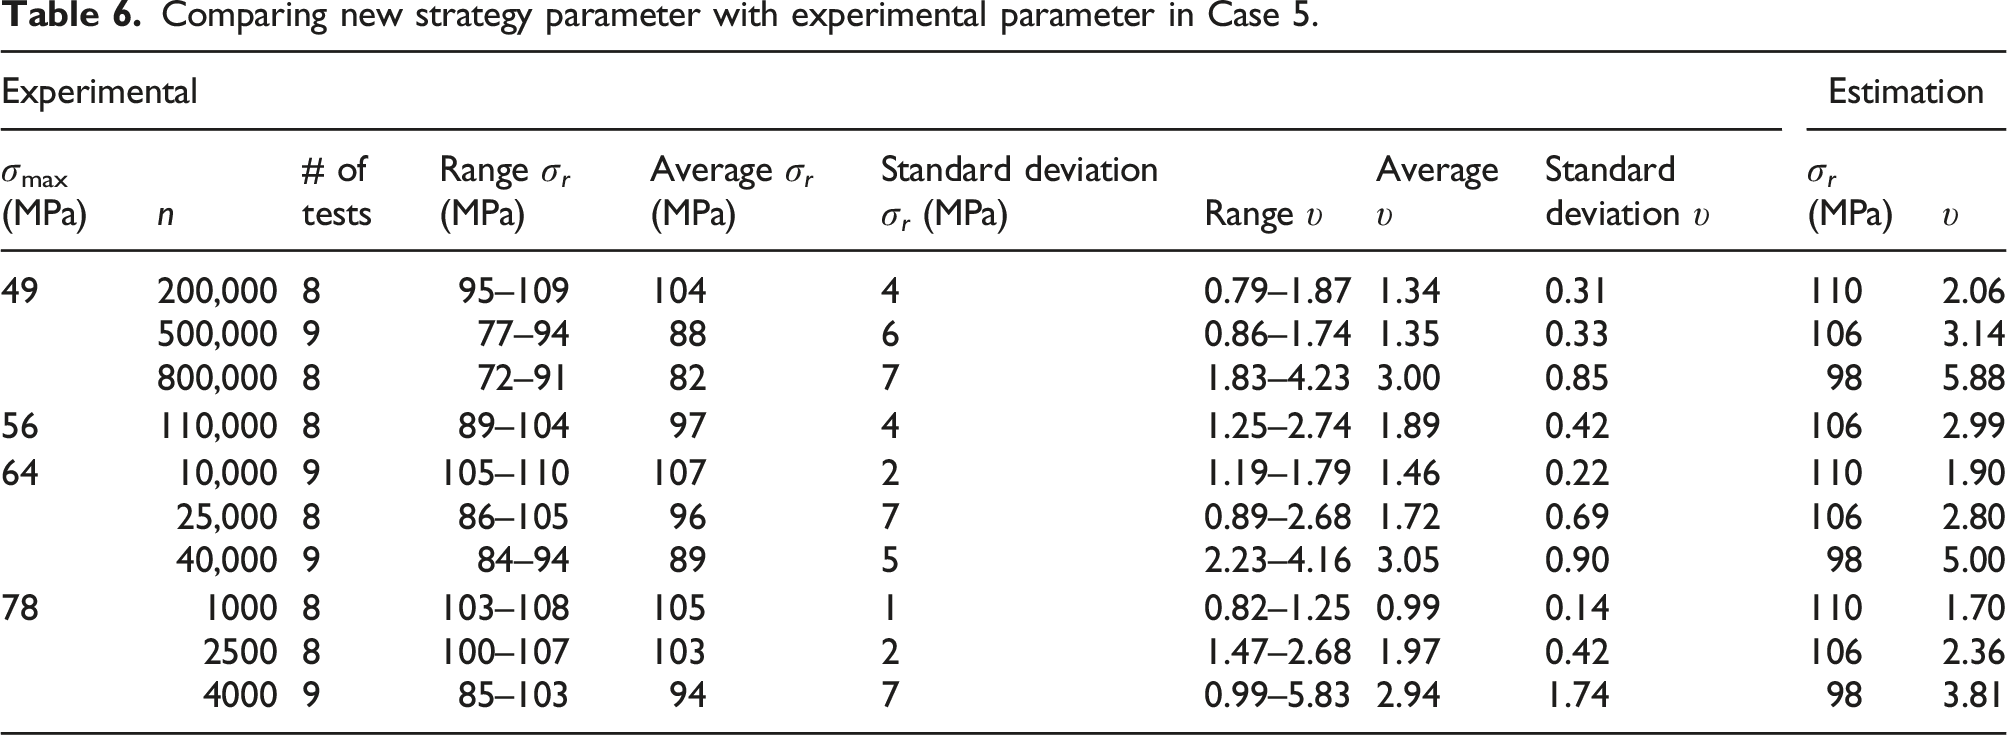
a set of 26 coupons were tested under displacement control until fracture with an average static strength of 112 MPa and a standard deviation of 2 MPa. To determine the material response under cyclic loading, 16 coupons were tested under sinusoidal loading. In addition, a total of 84 residual strength tests were performed for four stress levels of 49, 56, 64 and 78 MPa. Figure 14 shows the S-N curve and estimated fatigue lives for these stress levels. S-N curve for case 5 at R = 0.1.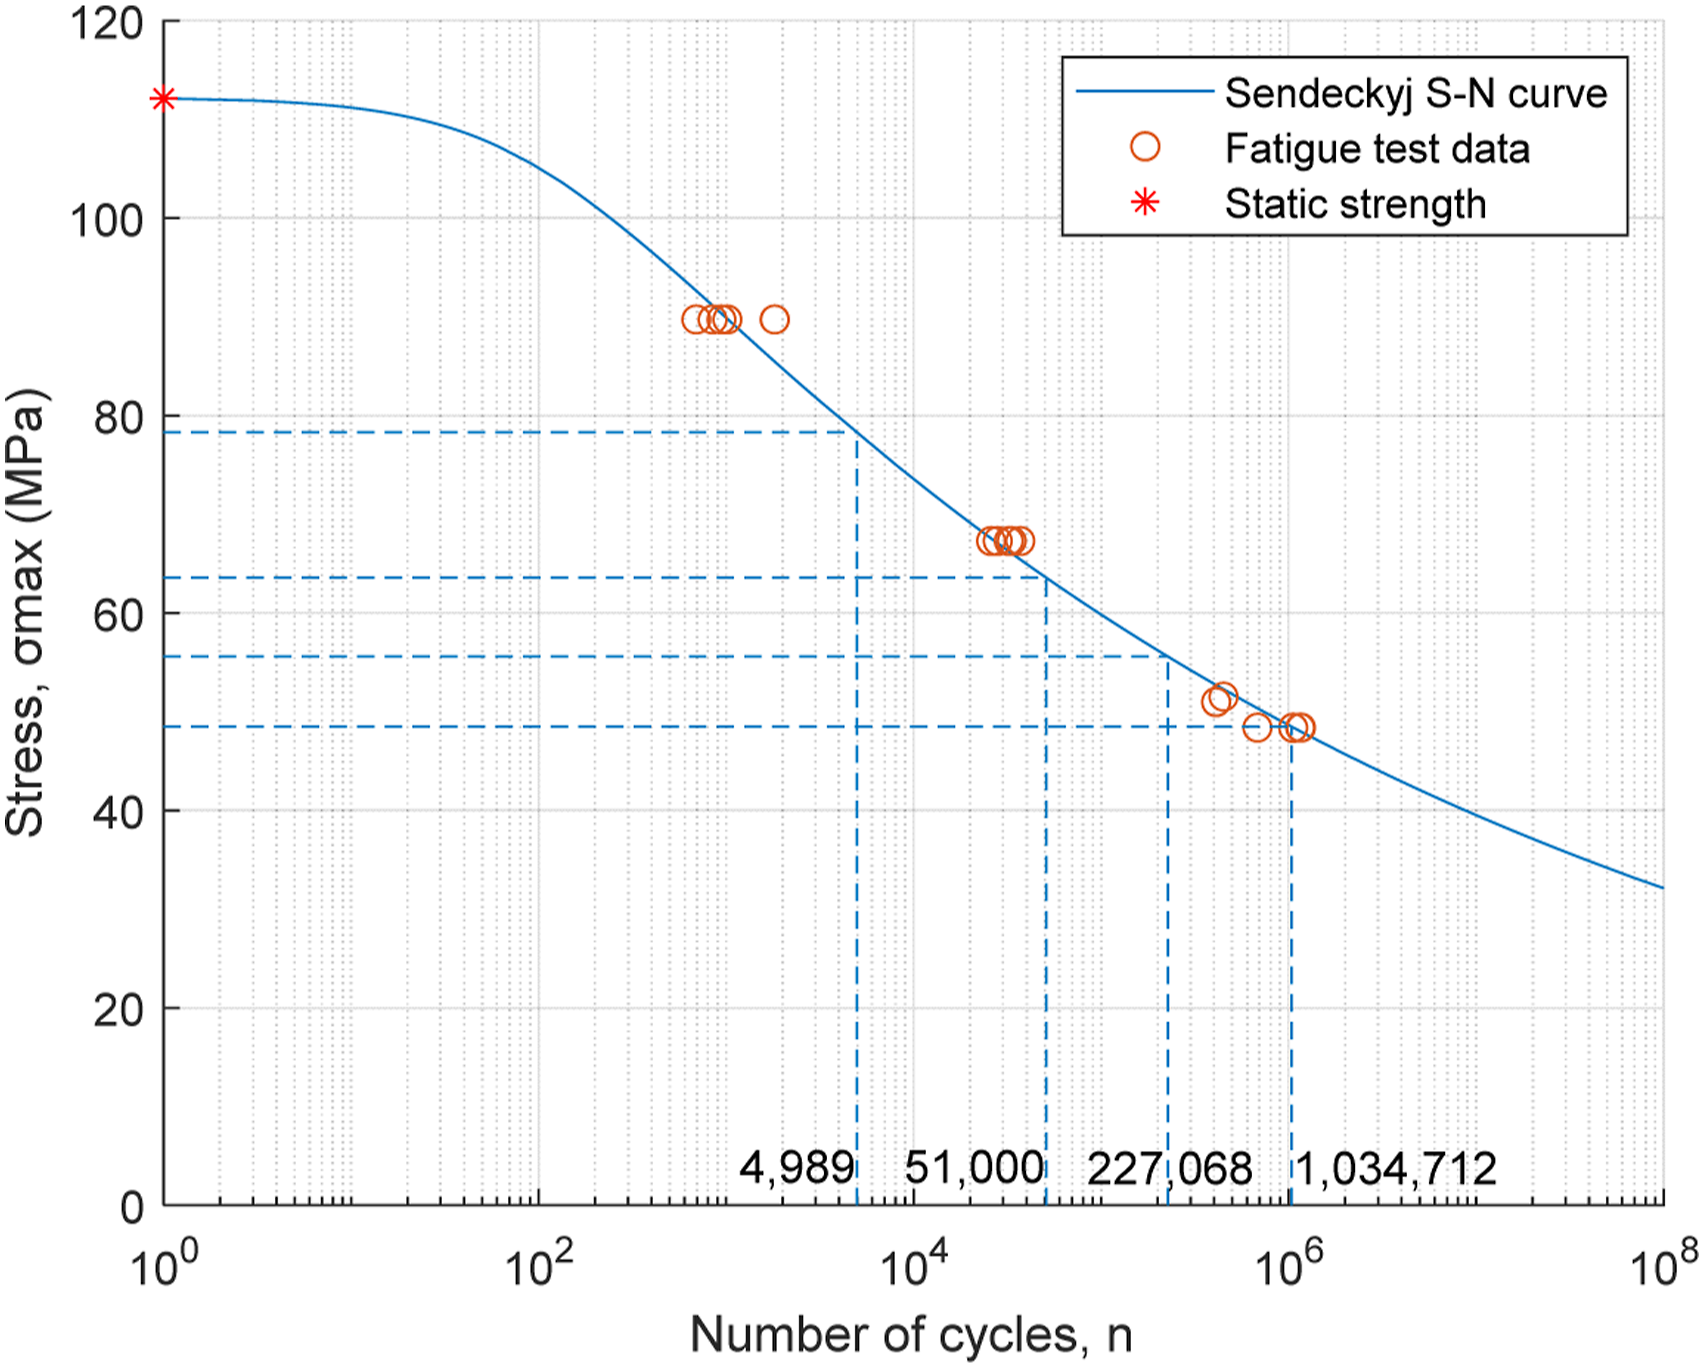
Comparing new strategy parameter with experimental parameter in Case 5.
Calculated error between experimental and estimated strength degradation parameter.
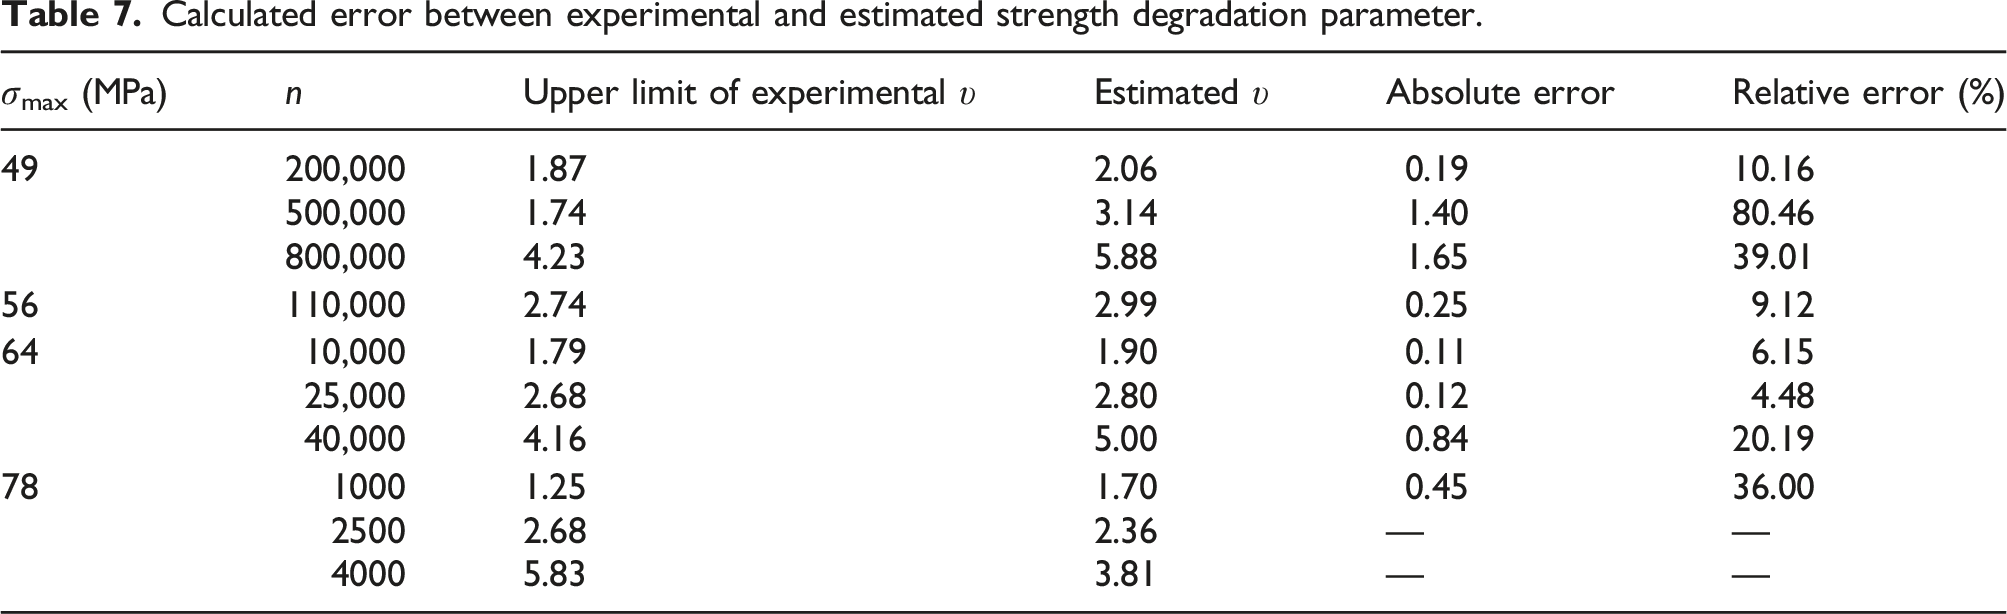
The results in both tables show that the estimation of the strength degradation parameter in the low cycle fatigue region, such as the 78 MPa stress level, is much better than the high cycle fatigue region (49 MPa). This means that when modelling the S-N curve using the Sendeckyj formula, parameter C, which corresponds to the low cycle fatigue region, is estimated more accurately than parameter S, which corresponds to the high cycle fatigue region. However, with respect to both parameters C and S, both the residual strength and the strength degradation parameter are estimated. In this case, as illustrated in Figure 14, the available fatigue tests are only at three levels of stress with poor scattering. However, the number of fatigue tests is not less for each level of stress. This is the main reason that the estimation of residual strength and strength degradation parameter is higher than the experimental result. The maximum relative error is 80%, which corresponds to a stress level of 49 MPa with 500,000 cycles. However, in this test, the estimated υ is less than twice the experimental upper limit.
Summary
In all cases, the experimental strength degradation parameter indicates that this parameter depends on two variables, the maximum applied cyclic stress and the number of loading cycles experienced at this stress level. According to the inherent natural failure criterion in strength-based models, failure takes place when the applied stress equals the residual strength. The residual strength represents the remaining ability of the material to withstand stress before failing. As the applied load increases, the material experiences more significant stress, leading to more pronounced damage and a faster decline in its residual strength. Consequently, the strength degradation parameters at higher loads are larger than those at lower loads because the material is losing its strength more rapidly. Moreover, it is observed that the strength degradation parameter increases as the number of loading cycles increases and the fatigue life approaches. This is because the accumulation of damage in the material leads to microcracks and other forms of damage, which eventually lead to the failure of the material. As the material approaches the end of its fatigue life, the damage accumulation rate increases, leading to a larger strength degradation parameter.
The new strategy estimates this parameter by considering both variables, and this is the first time the number of cycles plays a role in predicting the strength degradation parameter. Other studies such as Schaff and Davidson model29,30 give a single value for a single stress level without considering the number of cycles the specimen has been exposed to at that stress level. The only drawback of the method found in this study is its sensitivity to the scatter of fatigue test data. In fact, for a stress level with poor fatigue life scattering, a wide range of possible values for the parameters C and S occurs. This extensive range leads to inaccurate estimation of parameters C and S. As a result, the residual strength and the strength degradation parameter are not well calculated. There are numerous geometric and material parameters that can significantly affect composite materials mechanical behavior and fatigue performance. Although the proposed method has advantages over the Schaff and Davidson model, it may not account for all of these parameters, which could limit its applicability to specific composite material systems or configurations. Further research and development of the method is necessary to enhance its capability in handling a broader range of parameters and to improve its predictive accuracy across various composite materials and loading conditions. However, despite this weakness, the estimates are not far from the experimental range and it is worth eliminating residual strength tests at high costs and time.
Conclusion
This study introduces a new strategy for estimating the residual strength model parameter for fibre reinforced polymer composite materials. The methodology combines the Sendeckyj model, which describes the S-N curve, and the Schaff and Davidson model, which calculates the residual strength. The calibration tests required by this new strategy are fatigue tests only to determine the parameters of the S-N curve, removing the need for residual strength tests. Then, with a mathematical operation, the residual strength model parameter in the Schaff and Davidson model is also estimated using the S-N formulation removing the need for any residual strength tests.
This method was applied to five published data sets. The results indicate that the strength degradation parameter depends on the number of elapsed cycles in addition to the stress level. The strength degradation parameter at higher loads is greater than at lower loads for similar cycles. Furthermore, the strength degradation parameter increases with increasing number of elapsed cycles. Therefore, both variables should be used to estimate the strength degradation parameter. The new strategy presented in this paper calculates the strength degradation parameter taking into account both variables.
The results show that the estimation of the strength degradation parameter is sensitive to the scattering of fatigue test data. For well-scattered fatigue life data, the estimation is located with almost one times standard deviation of the mean of the measured data and can be used in strength-based models. For less scattered fatigue life data, at stress levels with high cycles, the absolute error is greater than unity, and the estimate is not in the experimental range. However, it is not far from the upper limit of the experimental data. This level of accuracy is such that it may be worth reducing or even removing costly residual strength tests from a material characterisation campaign.
Footnotes
Declaration of conflicting interests
The author(s) declared no potential conflicts of interest with respect to the research, authorship, and/or publication of this article.
Funding
The author(s) disclosed receipt of the following financial support for the research, authorship, and/or publication of this article: This work is supported by the Science Foundation Ireland MaREI research Centre for Energy, Climate, and Marine under grant numbers 12/RC/2302 and 12/RC/2302_2. The second author also acknowledges the financial support from Science Foundation Ireland Through an Industry Fellowship Award (grant number 18/IF/6362).
Contributorship
Afrooz Kazemi Vanhari: Conceptualization, Methodology, Software, Validation, Writing – Original Draft.
Edward Fagan: Conceptualization, Investigation, Writing - Review and Editing, Supervision.
Jamie Goggins: Conceptualization, Writing - Review and Editing, Supervision.