
Abstract
Embedded optical fibre sensors (OFSs) offer the potential to monitor the internal strains at various stages during the manufacturing and service life of fibre-reinforced polymer (FRP) composite structures. Various aspects associated with the embedment of OFSs, such as integration, material compatibility, and sensing performance of the embedded sensor needs to be investigated to develop reliable OFSs based internal sensing platform for composite structures. In this study, Polyimide (PI) and Polyether ether ketone (PEEK) coated optical fibres (OF) were embedded into glass fibre-reinforced polymer (GFRP) composites to evaluate four important aspects associated with the embedment of OFs, which include; i). Structural integrity of the OFs against chemical reactions from vinyl ester resin and its additives through immersion testing, ii). Methods of integrating the OFs into layered glass fibres for the vacuum resin infusion manufacturing process, iii). Sensing performance of the embedded OFs during manufacturing and structural testing (tensile and compressive), and iv). Internal structural integrity of the embedded OFs and the host composite structure using X-Ray micro-computerised tomography technique (μ-CT). The results from the immersion testing and manufacturing process monitoring showed that both PEEK and PI coated OFs can resist the chemical and mechanical stresses caused by resin polymerisation during curing process. The subsequent mechanical testing showed a similar sensing performance by the PI and PEEK coated OFs. Under tensile loads, the OFs monitored the tensile strain distribution up to 7,000 με and compressive strain distribution up to −1,200 με under flexural loading without compromising their optical performance. Finally, the μ-CT scanning results had shown a minimal structural deterioration of the embedded OFs and host composite structure. The outcomes from this detailed experimental investigation on the embedment of OFS in GFRP structures provided useful information towards the integration and performance of optical sensors in composite structures.
Keywords
Introduction
Composite structures made from fibre-reinforced polymer matrices are widely used for manufacturing various load-bearing structures in the defence, aviation, marine, space, civil engineering, and transportation industry. 1 When compared with their traditional metal counterparts, they offer unique advantages such as lower weight, design flexibility, corrosion resistance, and non-magnetic nature.2,3 However, the composite structures are susceptible to manufacturing and in-service defects such as dry spots, excess resin concentrated areas, matrix cracking, and delamination.4,5 These defects are mostly internal and may progressively degrade the structural performance of composite components. Hence, composite structures undergo regular periodic inspections using non-destructive testing (NDT) tools for detecting and managing defects. 6 However, NDT tools cannot be used for real-time inspection, they are time-consuming and also require external equipment resulting in additional financial and human resources.6,7
There is a growing demand for reliable sensing technologies which can replace traditional NDT tools to monitor the internal characteristics of a composite structure’s lifecycle from manufacturing to decommissioning. There are a variety of sensors that are suitable for structural sensing applications, such as foil strain gauge (FSG), optical fibre sensor (OFS), micro-electro-mechanical systems (MEMS), and electromagnetic sensors. 8 Among all, OFSs because of their small footprint, lightweight, and multiplex ability are favourable for embedded internal sensing applications. Further, they have additional advantages such as their ability to measure multi parameters, both strains and temperature, dielectric in nature, low signal attenuation, and ease of installation and operation.9–11 OFSs can be classified into two types, namely discrete sensors and distributed fibre optic sensors (DFOS). Discrete optical sensors based on fibre bragg gratings (FBG) can measure structural properties such as strain, temperature, and vibration at a single location along its length. Whereas a DFOS can measure similar structural properties at multiple locations along its entire length, making them highly desirable for structural inspection of large composite structures.11,12
The OFs are either surface bonded or embedded internally into a composite structure for inspection. When surface bonded, the OF is prone to damage from the external environment during installation or maintenance. 13 Therefore, special attention must be given to secure the OFs from damage. However, internal embedment of the OFs can eliminate the problems associated with surface bonding and also have a wide range of composite design applications such as an in-depth understanding of the manufacturing, refinement in structural design, development of real-time early warning systems, and reducing the inspection frequency. Despite the advantages, there are certainly technical challenges associated with the embedment of OFs into composite structures. In the available literature, several research studies demonstrated internal strain monitoring in FRP structures using FOSs. Davidson & Roberts, 7 have discussed in detail the fabrication and material considerations that need to be addressed for the development of viable OFs embedded composite structures. In this review, the highlighted practical challenges from the fabrication aspects include; i). What is the best method for the deposition of the FOS into a composite structure? ii). How do embedding and subsequent fabrication of the composite affect the optical characteristics of the OF? iii). Can the accurate position of the OF be maintained during manufacturing? and iv). How can cure/fabrication monitoring be assessed? Similarly, the highlighted material considerations included i). How does embedding the OF affect the composite strength characteristics both statically and in fatigue, ii). What diameter of OF should be employed, iii). What is the optimum choice and thickness of the OF surface coating, and iv). Is the OF damaged by the environment during the fabrication or while in operation.
The research work on the development of OFS-embedded composite materials began in the late 20th century.14–20 The initial studies focused on evaluating the feasibility of internal strain monitoring using embedded FOSs, characterising the mechanical properties and evaluating the surface interactions between the host material and OF. The FRP specimens used in these studies were manufactured using pre-impregnated materials containing epoxy resin, in which the OFs are integrated by sandwiching in between the resin impregnated FRP plies and curing at the required temperature. This fabrication method causes no damage to the embedded OFs from the environment as there is no external resin application. However, using prepregs is considered to be the most sophisticated and expensive technology for composite fabrication, thereby limiting its usage to certain industries.1,21 Alternatively, large composite structures can be manufactured using a vacuum resin infusion (VRI) process with fast production times and low cost while maintaining a high quality. 22 However, embedding an OF in a VRI composite laminate is complex and challenging, requiring initial integration of the OF with the dry fabrics and subsequent resin infusion and curing. In this fabrication procedure, special attention must be given to maintaining the position of the integrated OF during the resin infusion. Also, the OFs ingress and egress points must be protected from breakage due to resin shrinkage, and their terminals must be positioned to avoid contact with the flowing resin. In addition, the consolidation forces applied due to vacuum pressure may damage the OFs or may induce undesired morphological changes that can deteriorate their optical performance.
Investigations undertaken in this study.
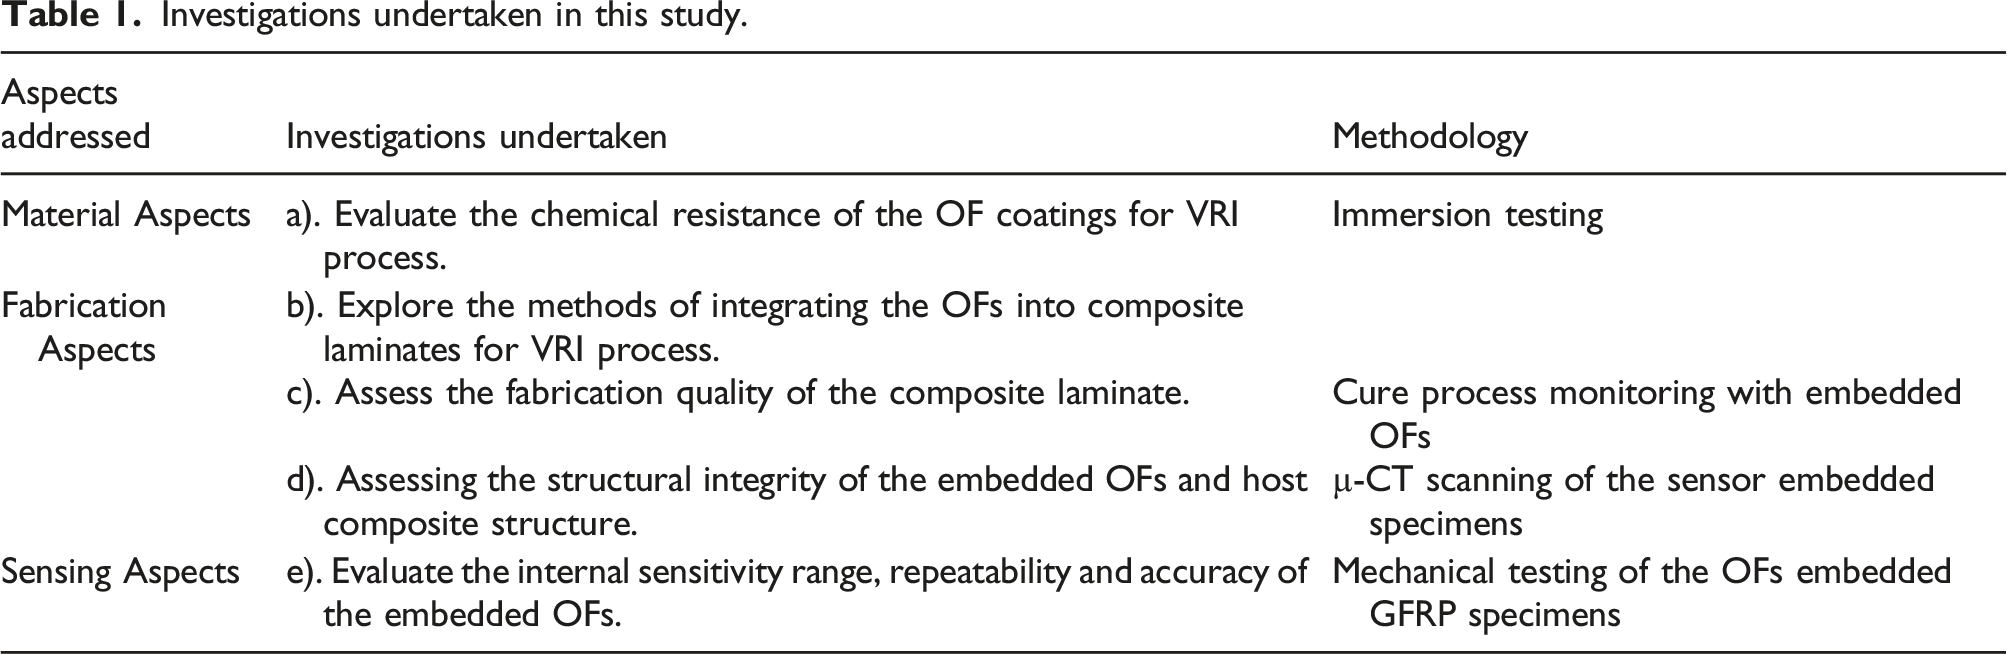
Traditionally PI and Acrylic coated OFs are used for strain monitoring applications. However, Acrylic coated OF is discouraged from embedded sensing applications due to their low modulus and temperature resistance.
42
Alternatively, PEEK coated OF has higher mechanical strength and temperature resistance when compared with PI and Acrylic coated OFs, but their compatibility with the composite structures has not been researched. These two types of OFs used in this study differed in their material type and coating thickness, as shown in Figure 1. The knowledge generated from this research study aids in the development of a reliable long-term passive DFOSs based structural health monitoring platform for VE-based composite structures. Schematic of the PI and PEEK coated OFSs.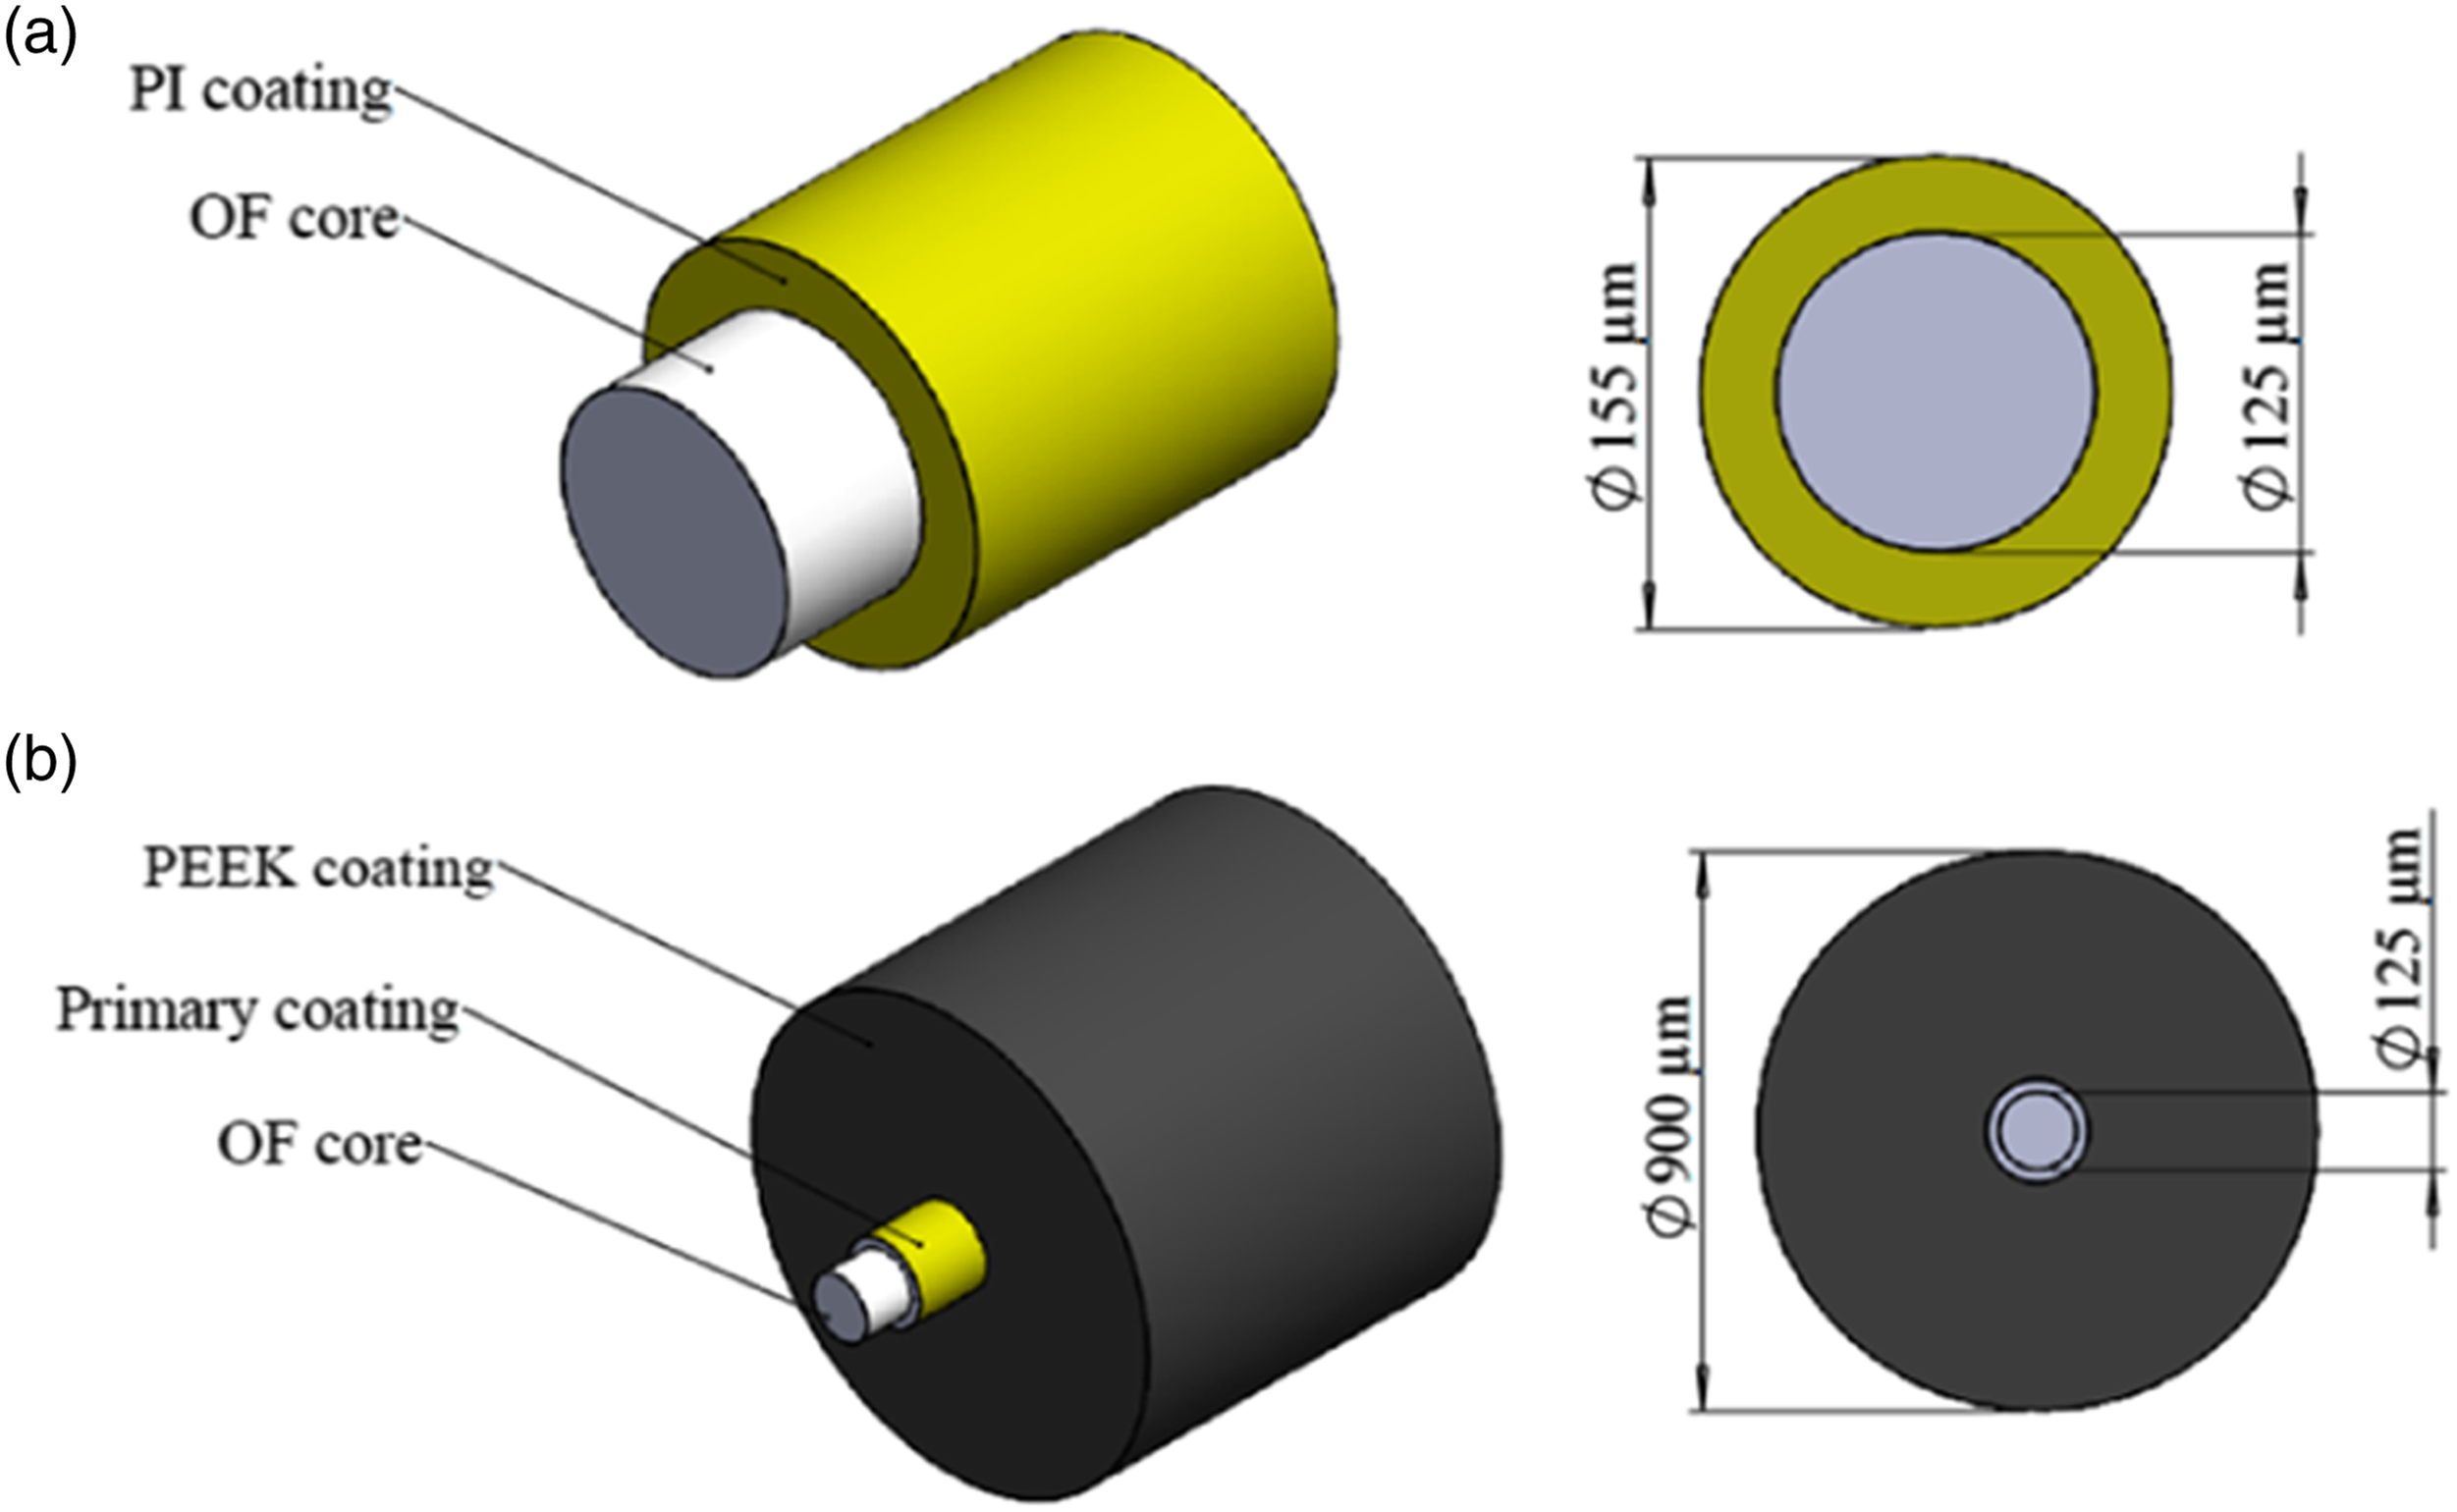
Experimental program
This study encompasses a series of investigations, including material compatibility of the sensors, cure-induced strain monitoring, and mechanical tests. Initially, damage to the OFs due to contact with the VE resin was characterised by immersing the OFs in the VE resin and its chemical constituents and subsequently analysing them under optical microscopy to assess the damage. The OFs-embedded GFRP laminates were then manufactured by integrating the two types of OFs into uni-directional glass fibre plies and infusing the resin through the VRI technique. During the curing, the strains inside the GFRP laminates were monitored in situ by the embedded sensors. Subsequently, the embedded distributed sensors performance was investigated under tensile and flexural loads. Finally, μ-CT scanning was performed on the laminated GFRP specimens to investigate the internal structure of the host GFRP specimens and the morphology of the embedded OFs. The graphical summary of the investigations included in this study is presented in Figure 2. Summary of the investigations undertaken.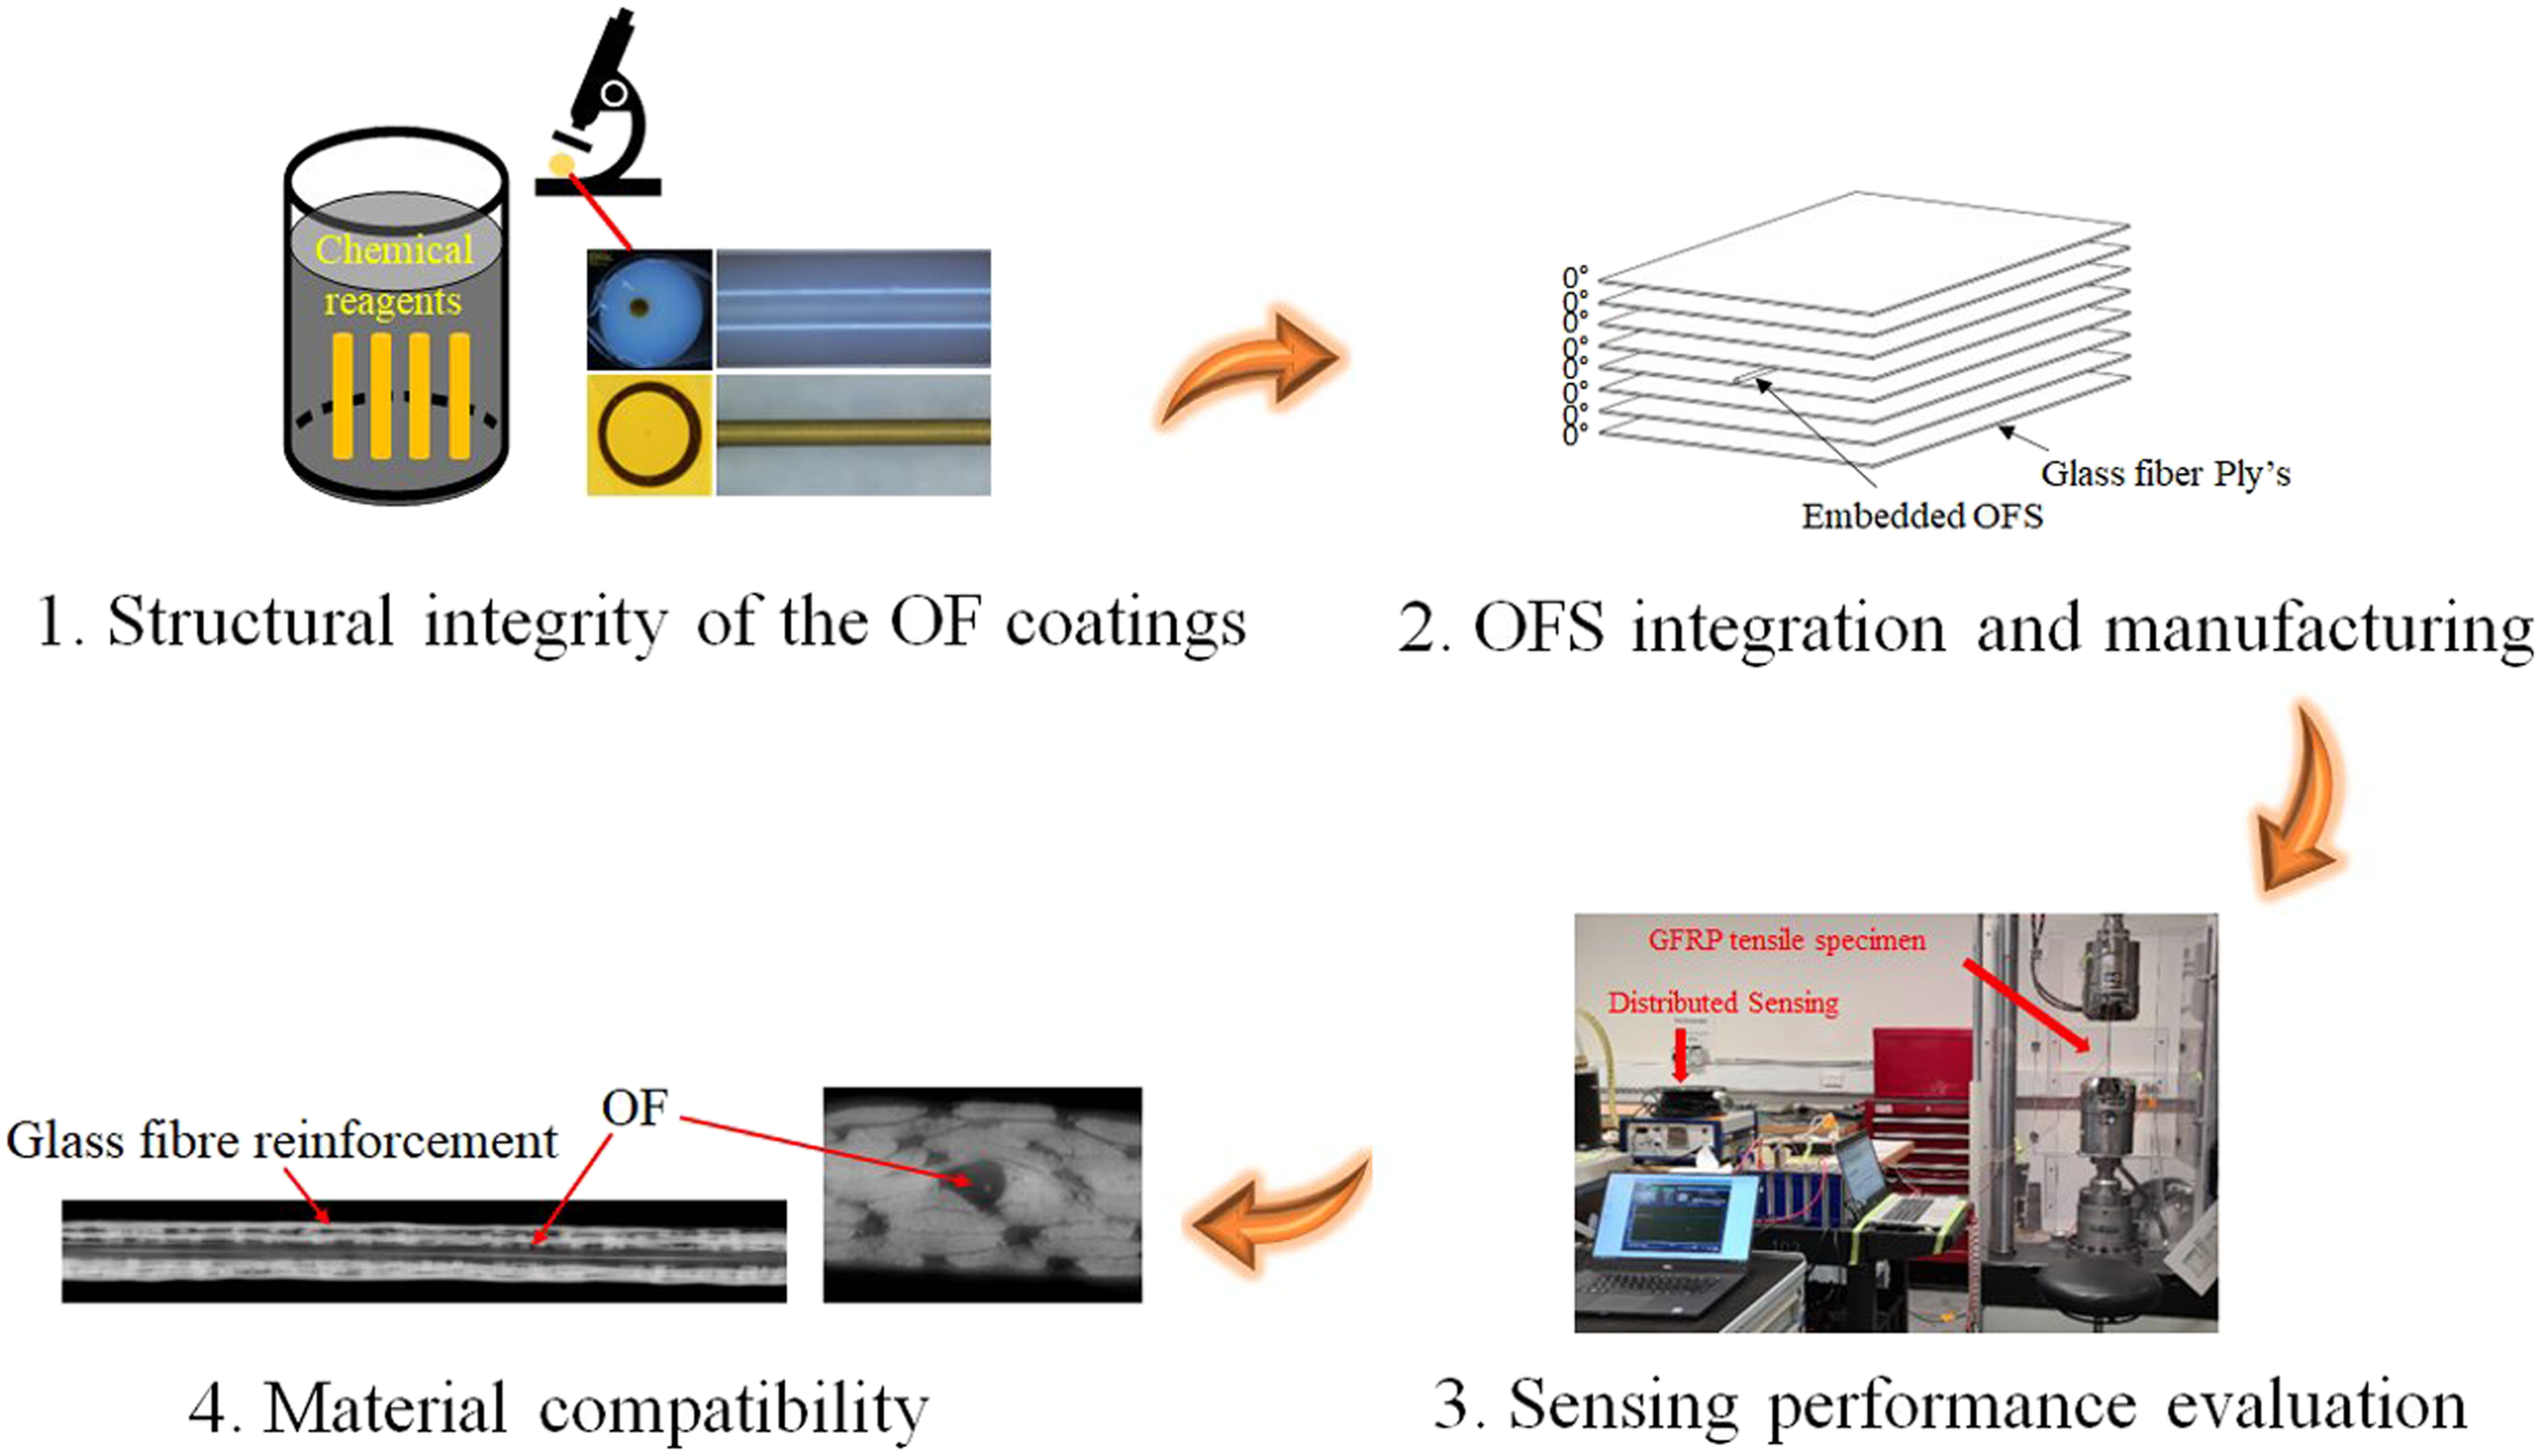
Chemical immersion test and microscopic observation of OF sensor
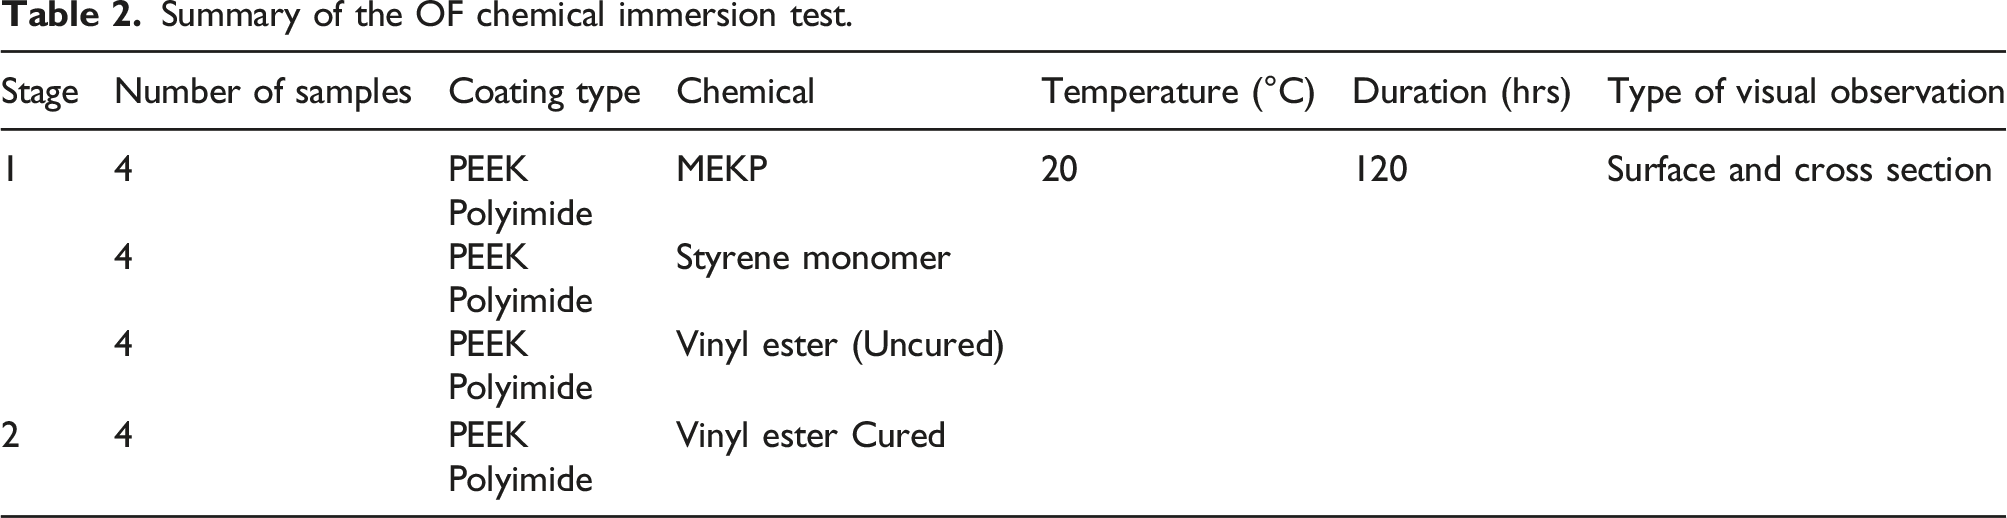
The GFRP specimens used in this study were manufactured with VE resin. The VE resin required styrene monomer and Methyl ether ketone peroxide (MEKP) catalyst as its additives for initiating the VE resin curing process. Therefore, VE resin along with MEKP and styrene monomer were of particular interest to the degradation study of the OF coatings. Previously published literature on OFs43–45, has revealed that they are permeable when placed in wet environments and also suffer from chemical damages resulting in micro-cracks, etching and shrinkage or swelling of the OFs due to chemical penetration. For successful integration and operation of the OFs in GFRP laminates, it was necessary that their coatings resisted the damage caused by the VE resin and its ingredients used in specimen manufacturing. The procedure for studying the OF coatings structural integrity consisted of initially assessing the physical characteristics of untreated OFs under the microscope then followed by immersion testing, and microscopic evaluation and comparison with the untreated OFs images to assess the chemical damages.
Summary of the OF chemical immersion test.
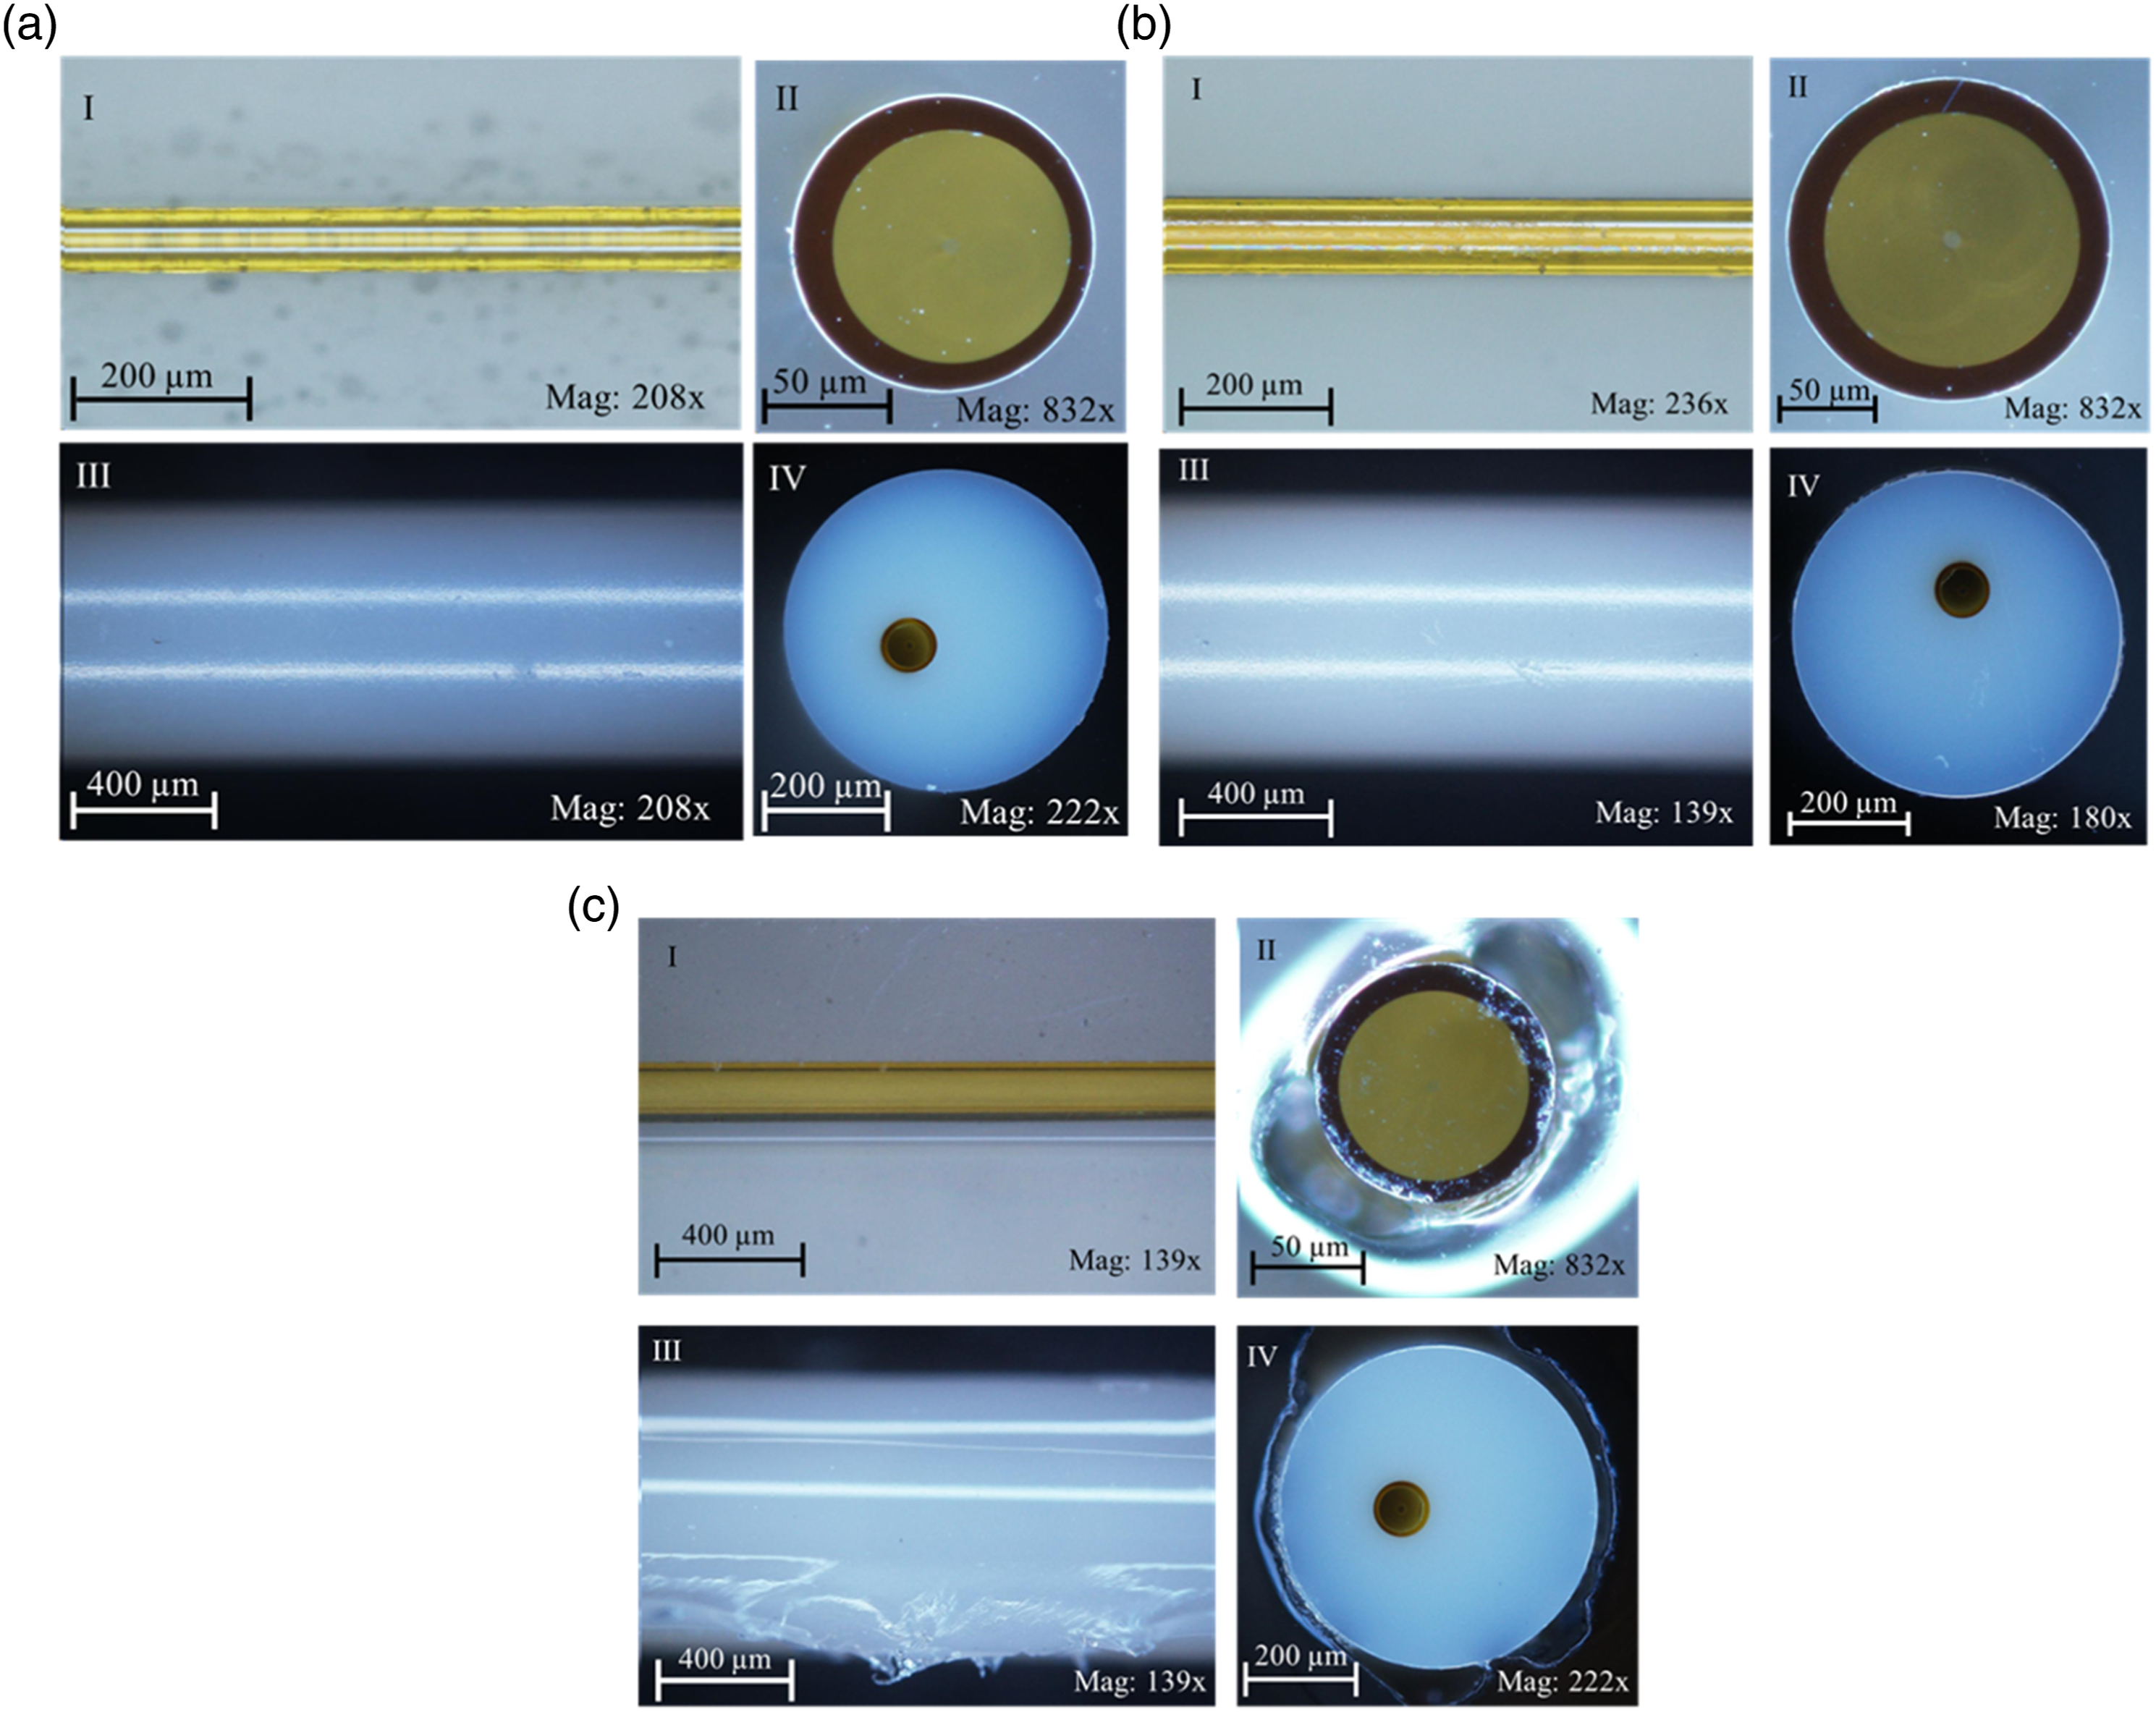
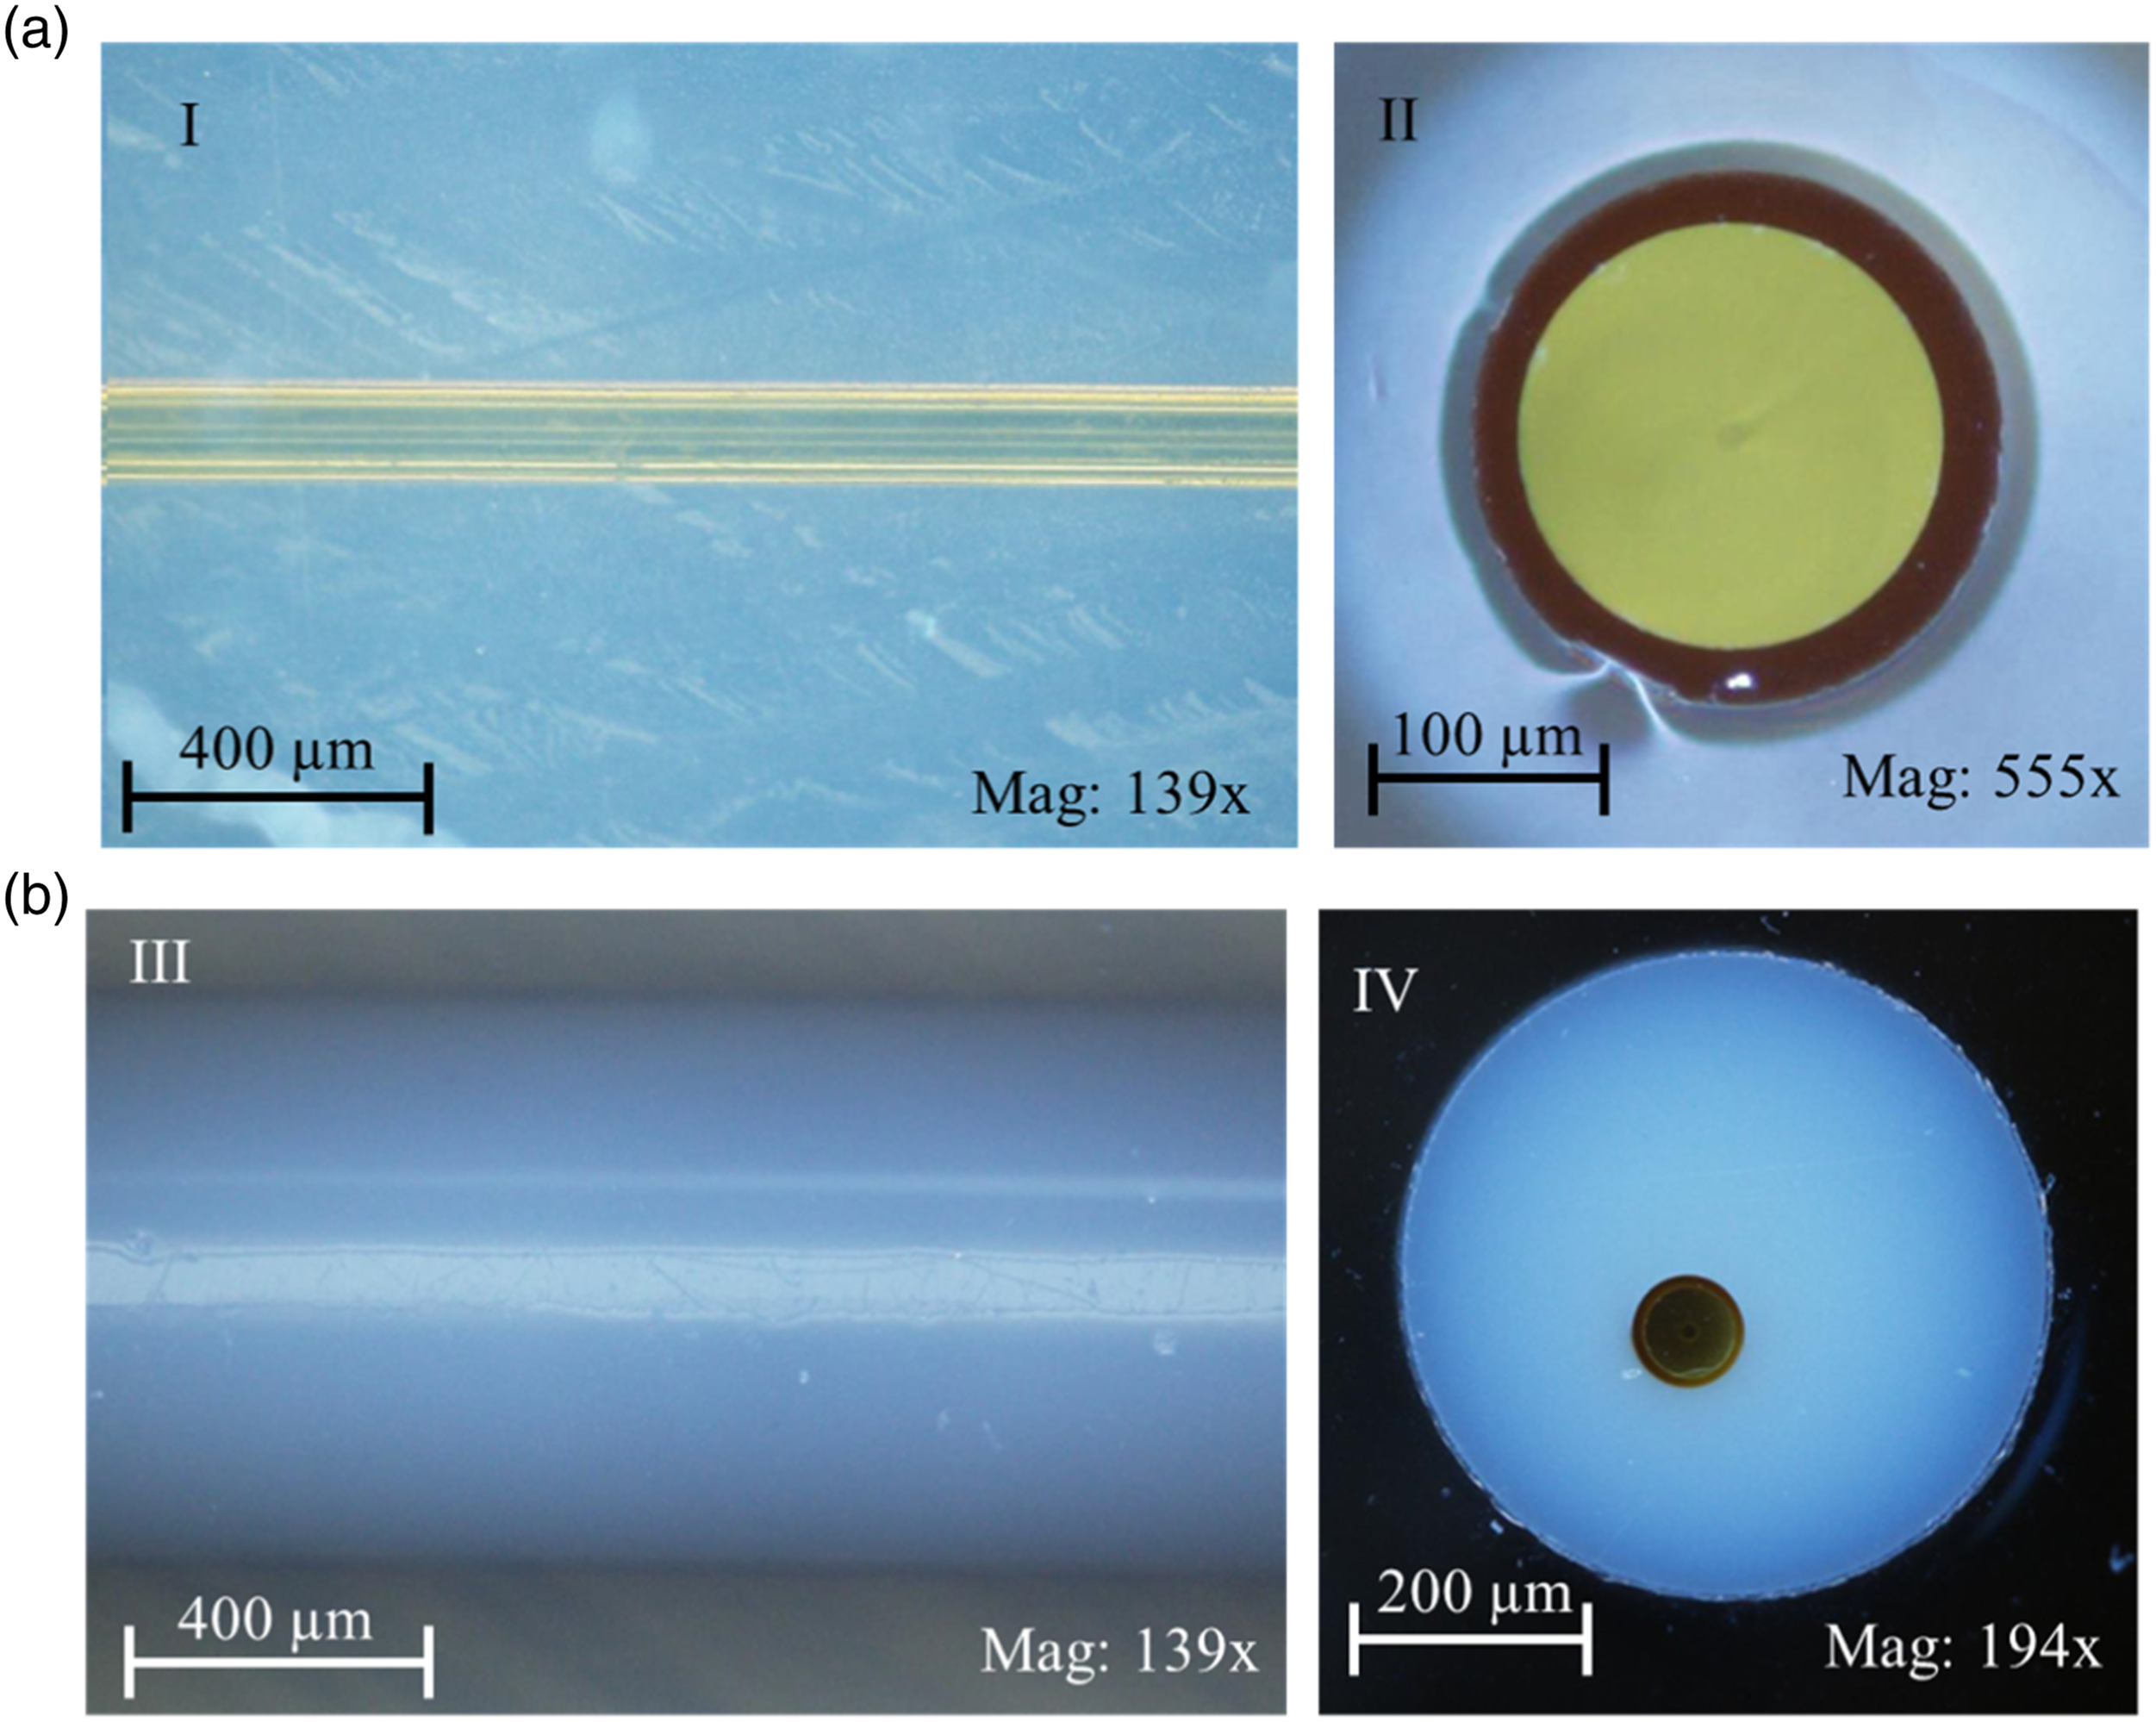
The microscopic images of the untreated PI and PEEK OFs are shown in Figures 3(a)(b). From the presented images, two important physical characteristics of the OFs are noted. Firstly, the thickness of the OF coatings was not uniform around its circumference, and secondly, the cores of the OFs were not concentrically positioned to their coatings. Subsequently, the microscopic images of the PEEK and PI coated OFs surface and cross-section after the two stages of immersion testing are shown in Figures 4(a)–(c), and Figures 5(a)(b), respectively. The entire surfaces of the OFs were imaged under an optical microscope, which resulted in multiple images per sample. However, for ease of representation, only one image of the PEEK and PI coated OFs per chemical is presented here. The OFs surface images were used for characterising the micro-cracking and etching. Whereas the cross-sectional images were used for characterising the shrinkage or swelling of the OFs. The presented surface images showed no micro-cracking nor etching to the coating surfaces from chemical contact. However, some minor abrasions can be seen on the surface, which may have been caused during the handling of the OFs. Subsequent examination of the cross-sectional images showed that the immersed OFs had similar characteristics to that of the non-immersed OFs. The non-uniformity in the coating thickness and eccentricity between the core and outer coating was present. Further, the diameter of the immersed OFs was the same as the untested OFs indicating no swelling or shrinkage of the OFs due to chemical contact. As no damage or physical changes were observed in the microscopic examination this showed that both PEEK and PI coated OFs can resist the chemical reactions during the resin curing process. Cross-sections of the untreated OFSs; (a) PI coated, (b) PEEK coated. Microscopic images of the OFSs surface and cross-section after immersion in; (a) MEK, (b) Styrene, (c) uncured VE resin. Microscopic images of the OFSs surface and cross-section after curing in VE resin; a) PI coated; b) PEEK coated.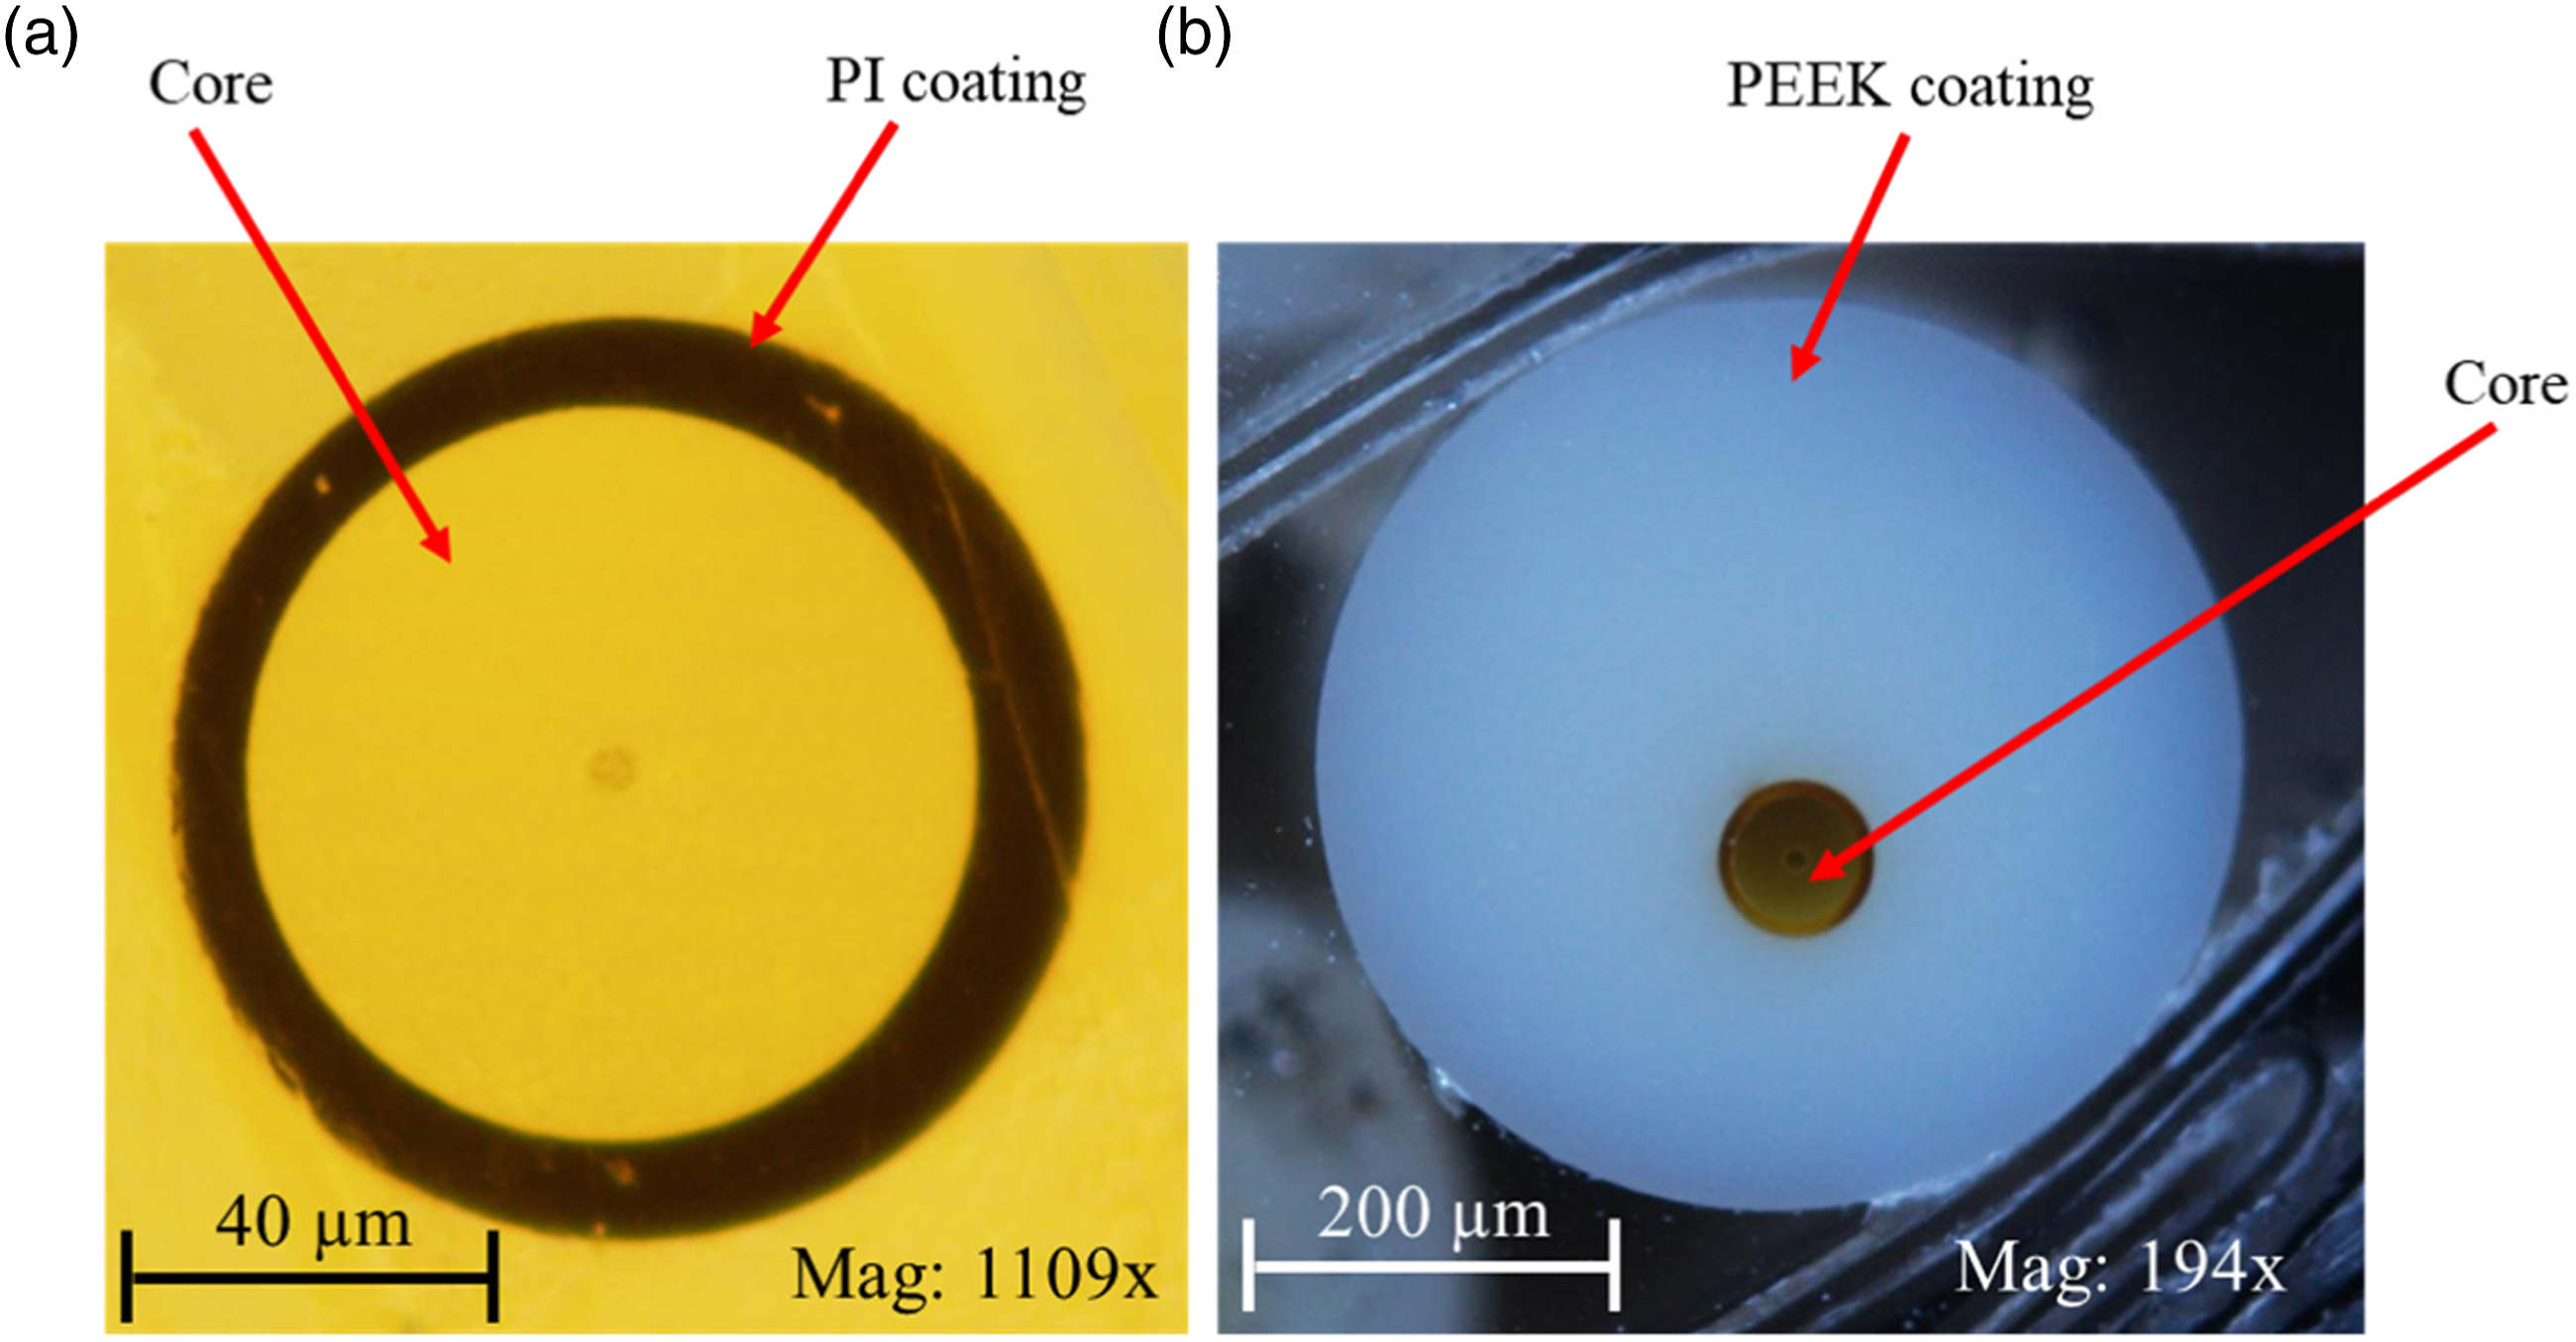
Sensor integration and manufacturing
Laminates for tensile test
Two GFRP laminates consisting of eight layers of uni-directional E-glass fibre plies with OFs running along the mid-ply, as shown in Figure 6(a), were manufactured for tensile testing. Preliminary trials were conducted to evaluate the best method for sensor deposition and securing its position during resin infusion before producing a successful laminate. Initially, the OFs was bonded to the individual glass fibre ply with the aid of a cyanoacrylate adhesive. However, after resin infusion, the presence of adhesive resulted in a dry spot along with the OFs location. Therefore, to avoid this manufacturing flaw the OFs was initially integrated into a single dry glass fibre ply by routing them underneath the ply stitches with their axes aligning parallelly with the glass fibre reinforcement axes. The integration of the OFs into the dry glass fibre ply is shown in Figure 6(b). This routing of the OFs through the ply stitches not only eliminated the usage of adhesive but also gave the opportunity for applying the pre-tension to the embedded OFs for securing their position during the VRI process. Integration of the OFS; (a) Embedment of the OFS, (b) Glass fibre laminates with OFS for vacuum resin infusion process (dimensions in mm).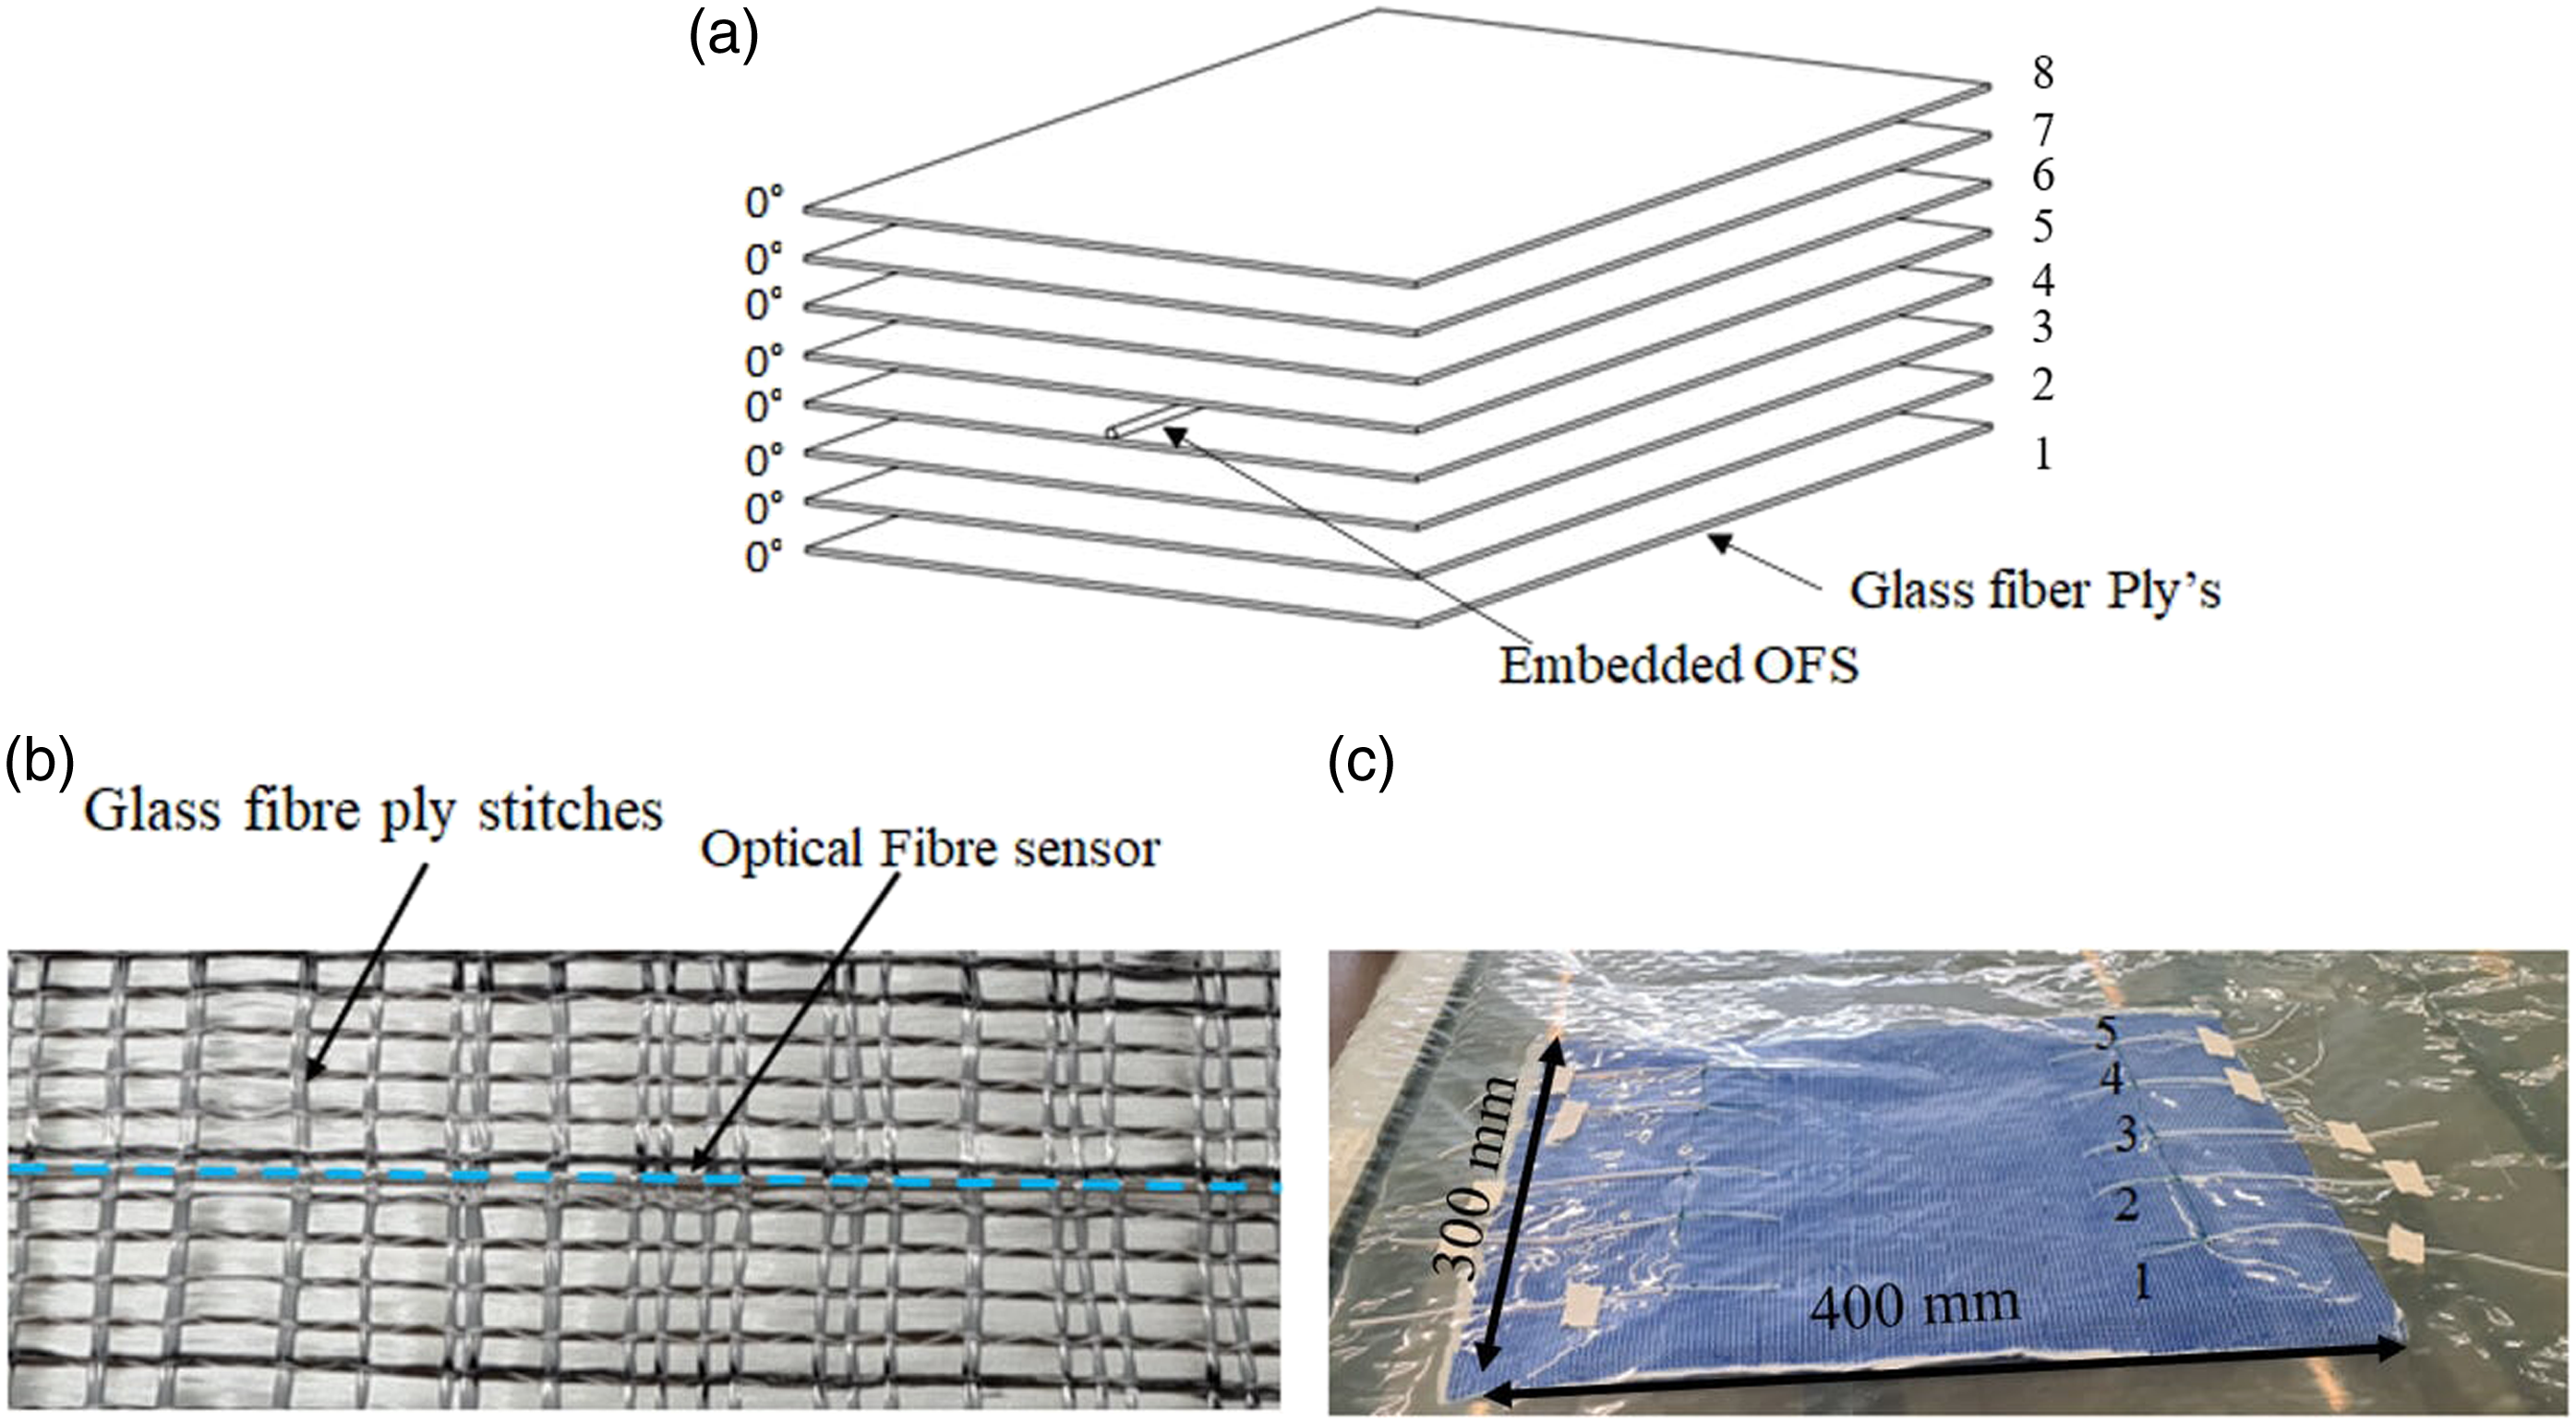
Subsequently, after stitching the ply containing the OFs was placed in between the glass fibre plies 4 and 5. Then the embedded OFs were drawn out from the top layer of the glass fibre plies to provide the space for gripping the GFRP specimens during tensile testing. Further, during the resin infusion the contact between the OF terminals and resin was avoided by routing the OF ends through the peel ply, flow mesh and plastic bag, which were used for facilitating the flow of resin and creating the vacuum conditions for the GFRP laminate curing. The prepared dry glass fibre plies and OFs along with the ply dimensions are shown in Figure 6(c). For optimal sensing performance, the ingress and egress points of the OFs had to maintain a smooth curvature and also resist the mechanical stresses from resin infusion and shrinkage. Therefore, the fragile ingress and egress points of the PI coated OFs were secured with PTFE sleeves. However, the PEEK coated OFs, due to their higher strength and large thickness required no additional protection. Finally, the resin infused GFRP laminate was cured under vacuum conditions at a room temperature of 20°C for 24 h as specified by the supplier. The individual coupon specimens for tensile testing were machined from the cured panel using computerised numerical control (CNC) machine.
Laminates for flexural test
The GFRP laminate for flexural testing was fabricated with 10 layers of uni-directional E-glass fibres containing PI coated OFs. The stacking sequence of the GFRP laminate for flexural testing is shown in Figure 7(a). The GFRP laminate produced five specimens with two sensors per specimen. The OFs positioned in between the 8th and 9th ply monitored the compressive strains, and the OFs embedded in between 2nd and 3rd ply monitored tensile strains. Similar to the tensile test specimens, the OFs were routed underneath the ply stitches and aligned parallel to the glass fibre reinforcement axes. Further, a pre-tension was applied to hold the OFs in position during the resin infusion. The flexural test specimens did not require grips to hold the specimen in the loading machine during the testing. Therefore, the ingress and egress points of the OFs were taken out from the same layers in which they were positioned using PTFE sleeves at the ends to resist the applied mechanical stresses during the fabrication. The prepared glass fibre plies and OFs along with its dimensions for vacuum infusion, are shown in Figure 7(b). After integration of the OFs and VE resin infusion, the laminate was cured in vacuum conditions for 24 hrs at a room temperature of 20°C. The VE resin used for manufacturing the tensile and flexural test specimens was Scott Bader Crystic VE679-03 infusion resin with a tensile strength of 53 MPa and a modulus of 4.9 GPa. GFRP laminate for Flexural testing (dimensions in mm).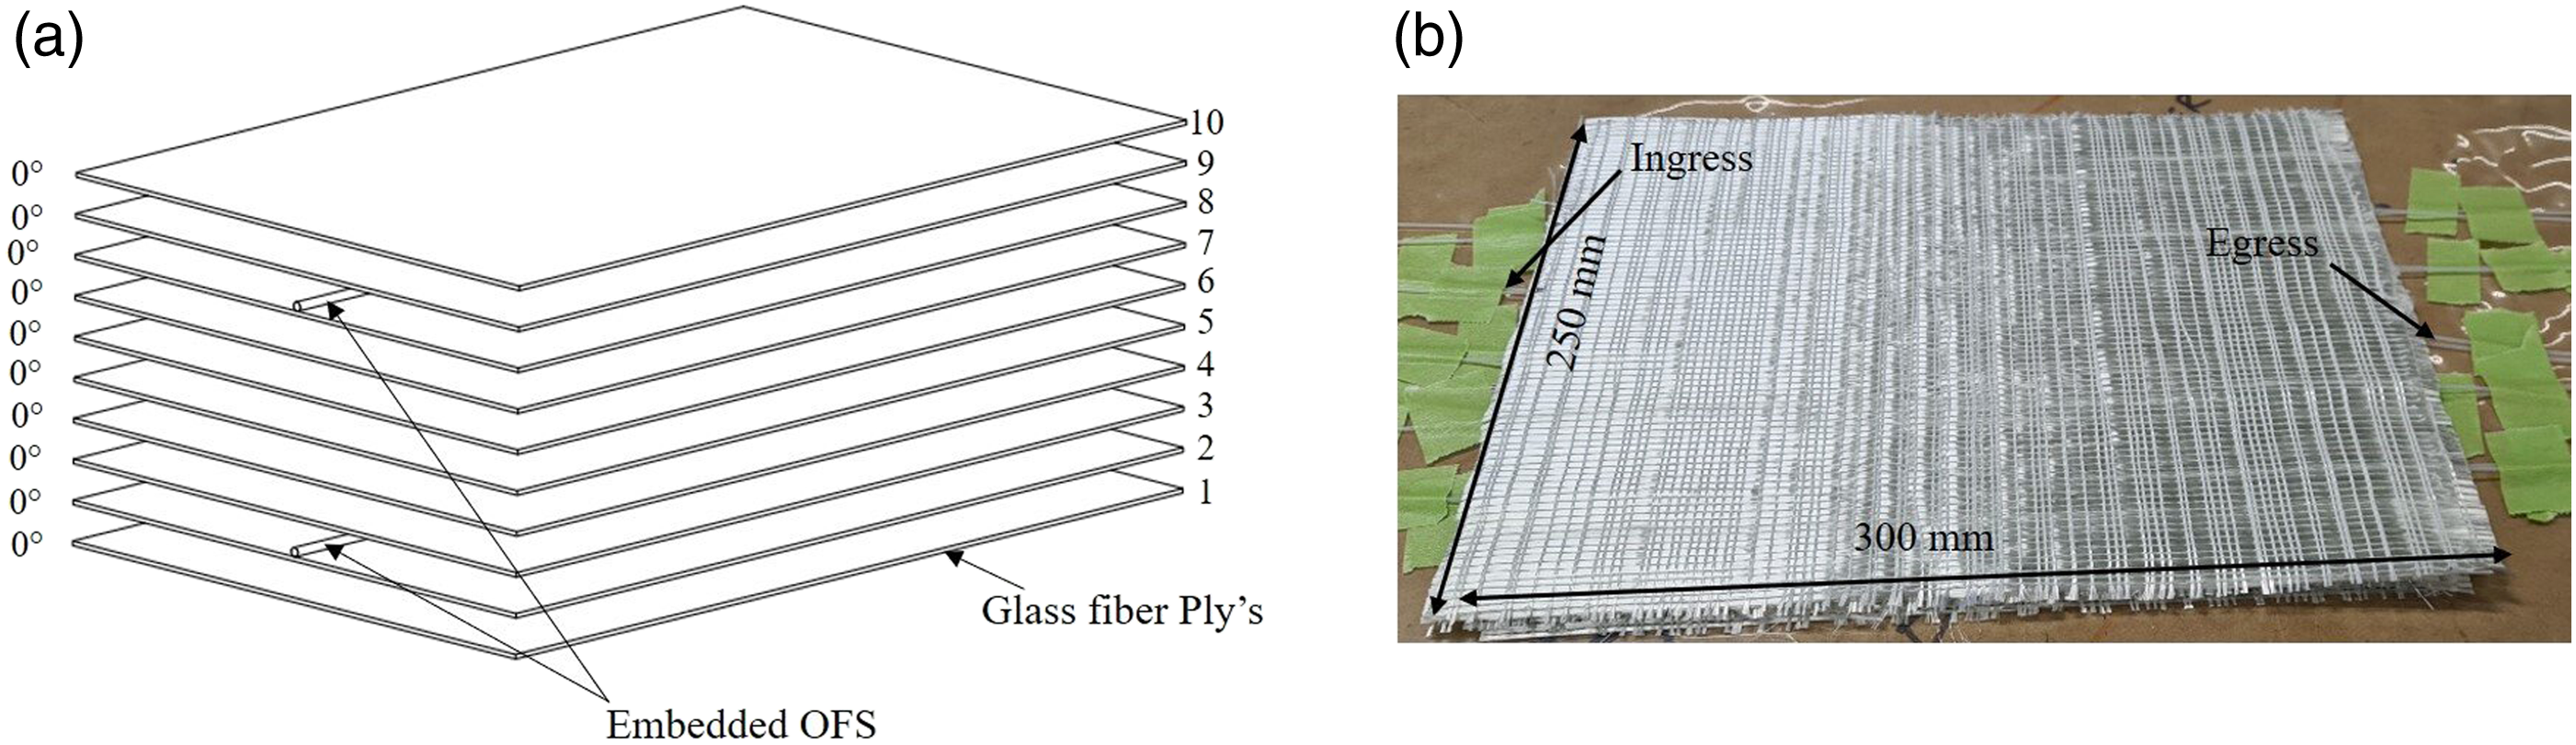
Sensing principle and DFOS system
A single-mode telecommunication-based optical fibre can be transformed into a distributed strain sensor by measuring the Rayleigh backscatter in the OFs. For a given fibre, its backscatter amplitude as a function of distance is unique and remains unchanged over time forming a unique spectral signature of that OFS. 46 In this study, the distributed strains were measured using an Optical Distributed sensor interrogator (ODiSI-B) from Luna Technologies. The ODiSI-B system uses the optical frequency domain reflectometry (OFDR) technique for characterising the Rayleigh backscatter to derive strain as a function of position along the OF length.
The main components of the ODiSI-B system include a tuneable laser source (TLS) and a Mach Zehnder interferometer with a detector. Initially, the TLS of the ODiSI-B system injects a pulse of light into the unstrained OFSs and stores the reflected backscatter profile from the fibre as a reference measurement. Subsequently, during testing, any strain applied to the OFSS will cause a change in its backscatter amplitude and is recorded and stored by the ODiSI-B system as a measurement profile. Then the data sets from the two scatter profiles are divided into smaller segments and correlated along the length of the sensor to determine the spectral shift induced by the applied strain or temperature. This frequency shift in each segment is then cross correlated to determine the change in strain or temperature along the OFSs length. The OFDR sensing principle is summarised in Figure 8. OFDR sensing principle.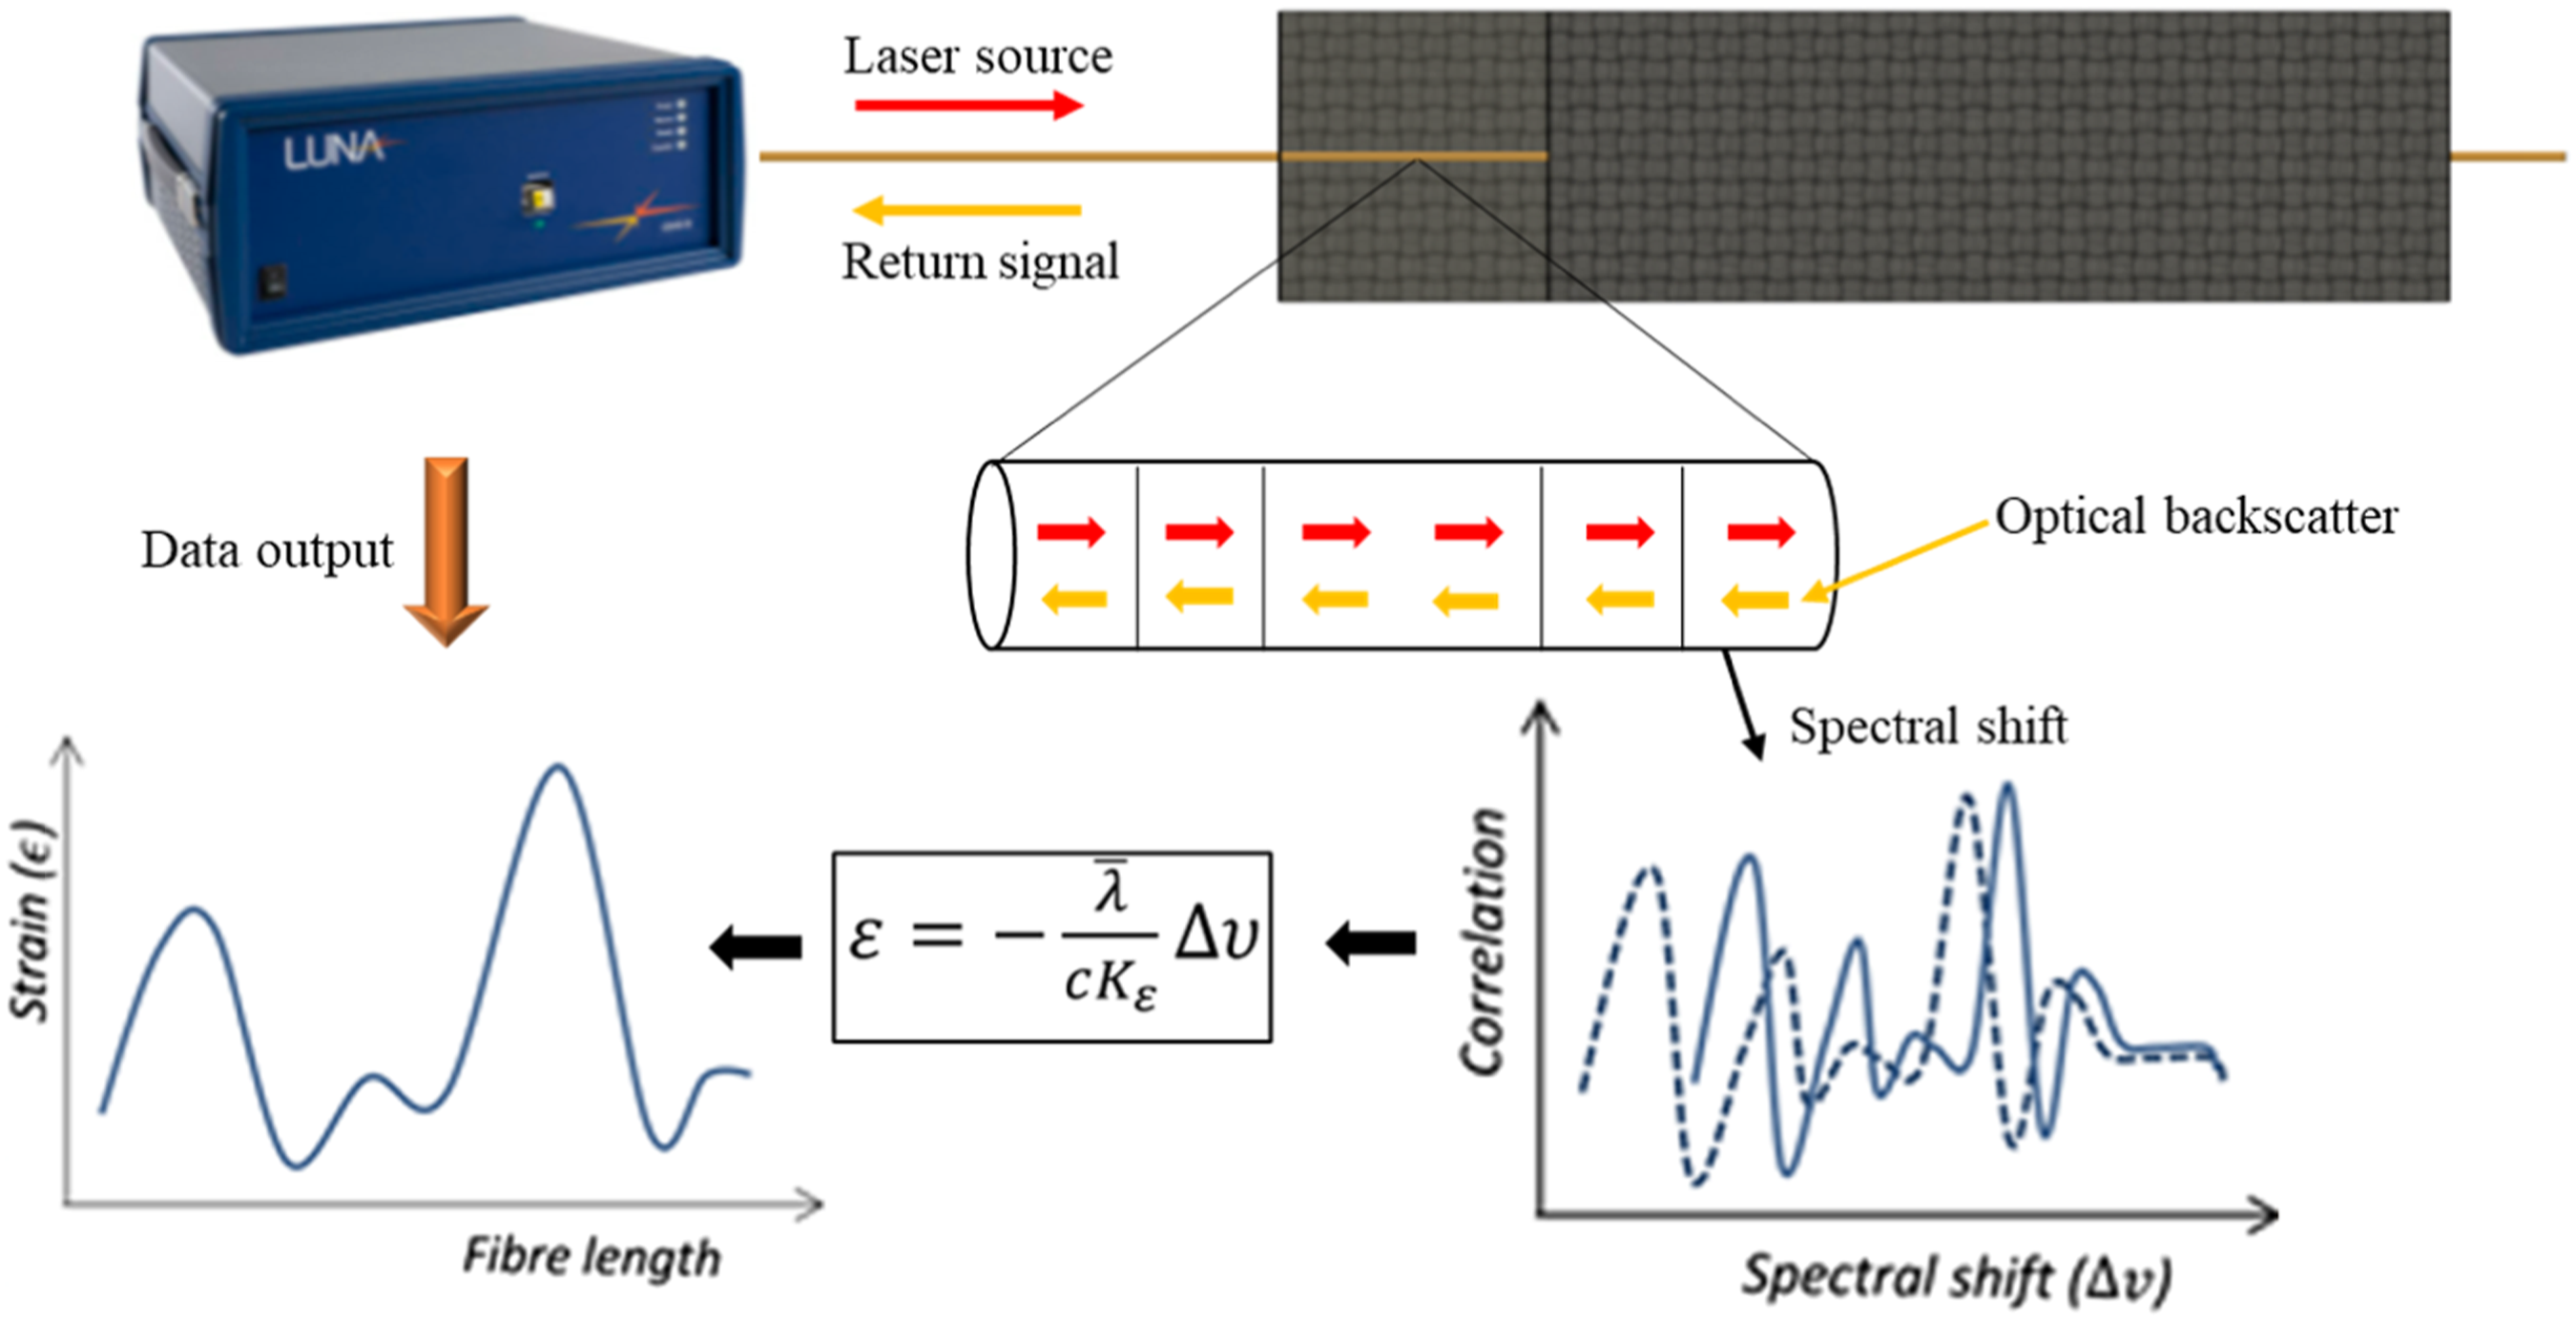
Process monitoring
The fabrication quality of the sensor-embedded composite laminates was monitored by measuring the internal strain distribution during the curing of the GFRP laminates that were prepared for tensile testing. The cure strain distributions were measured by the embedded PEEK and PI OFs at various intervals during the 24 hrs curing time. The initial strain measurements were taken at 1-hour intervals during the first 6 hrs of the curing cycle at 1 Hz frequency. Subsequently, the final measurements were taken before the cured laminate was disconnected from the vacuum pump. The final strain measurements were then compared with the strain measurements from the previous day to quantify the change in residual strains overnight during the curing process. The PEEK and PI OFs designated by number 3 in Figure 6(c), were used for monitoring the internal strain distribution during the laminate curing process.
Specimen geometry and structural loading
Specimen geometry
Individual specimens were machined from the manufactured GFRP laminates for structural testing. The representation and dimensions of the tensile test specimens containing PI and PEEK coated OFs are shown in Figures 9(a)(b), respectively, and the dimensions of the specimen for flexural testing are shown in Figure 9(c). For tensile testing, the OFs were routed by taking a sharp turn, which caused the OFs to undergo bending. It was expected that this bending would have a detrimental impact on the OFs sensing performance. Despite the bending, the PEEK OF was functional and measured strains, whereas the PI OF was non-functional. To reduce the impact of the bending, smooth L-shaped groves were made on the PI OF-GFRP specimen tabs for routing the sensor through the specimen grips, as highlighted in the representative image shown in Figure 9(a). Representation of GFRP specimens for structural testing; (a) Tensile test specimen with PI coated OFS, (b) Tensile test specimen with PEEK coated OFS, (c) Flexural test specimen with PI coated OFSs.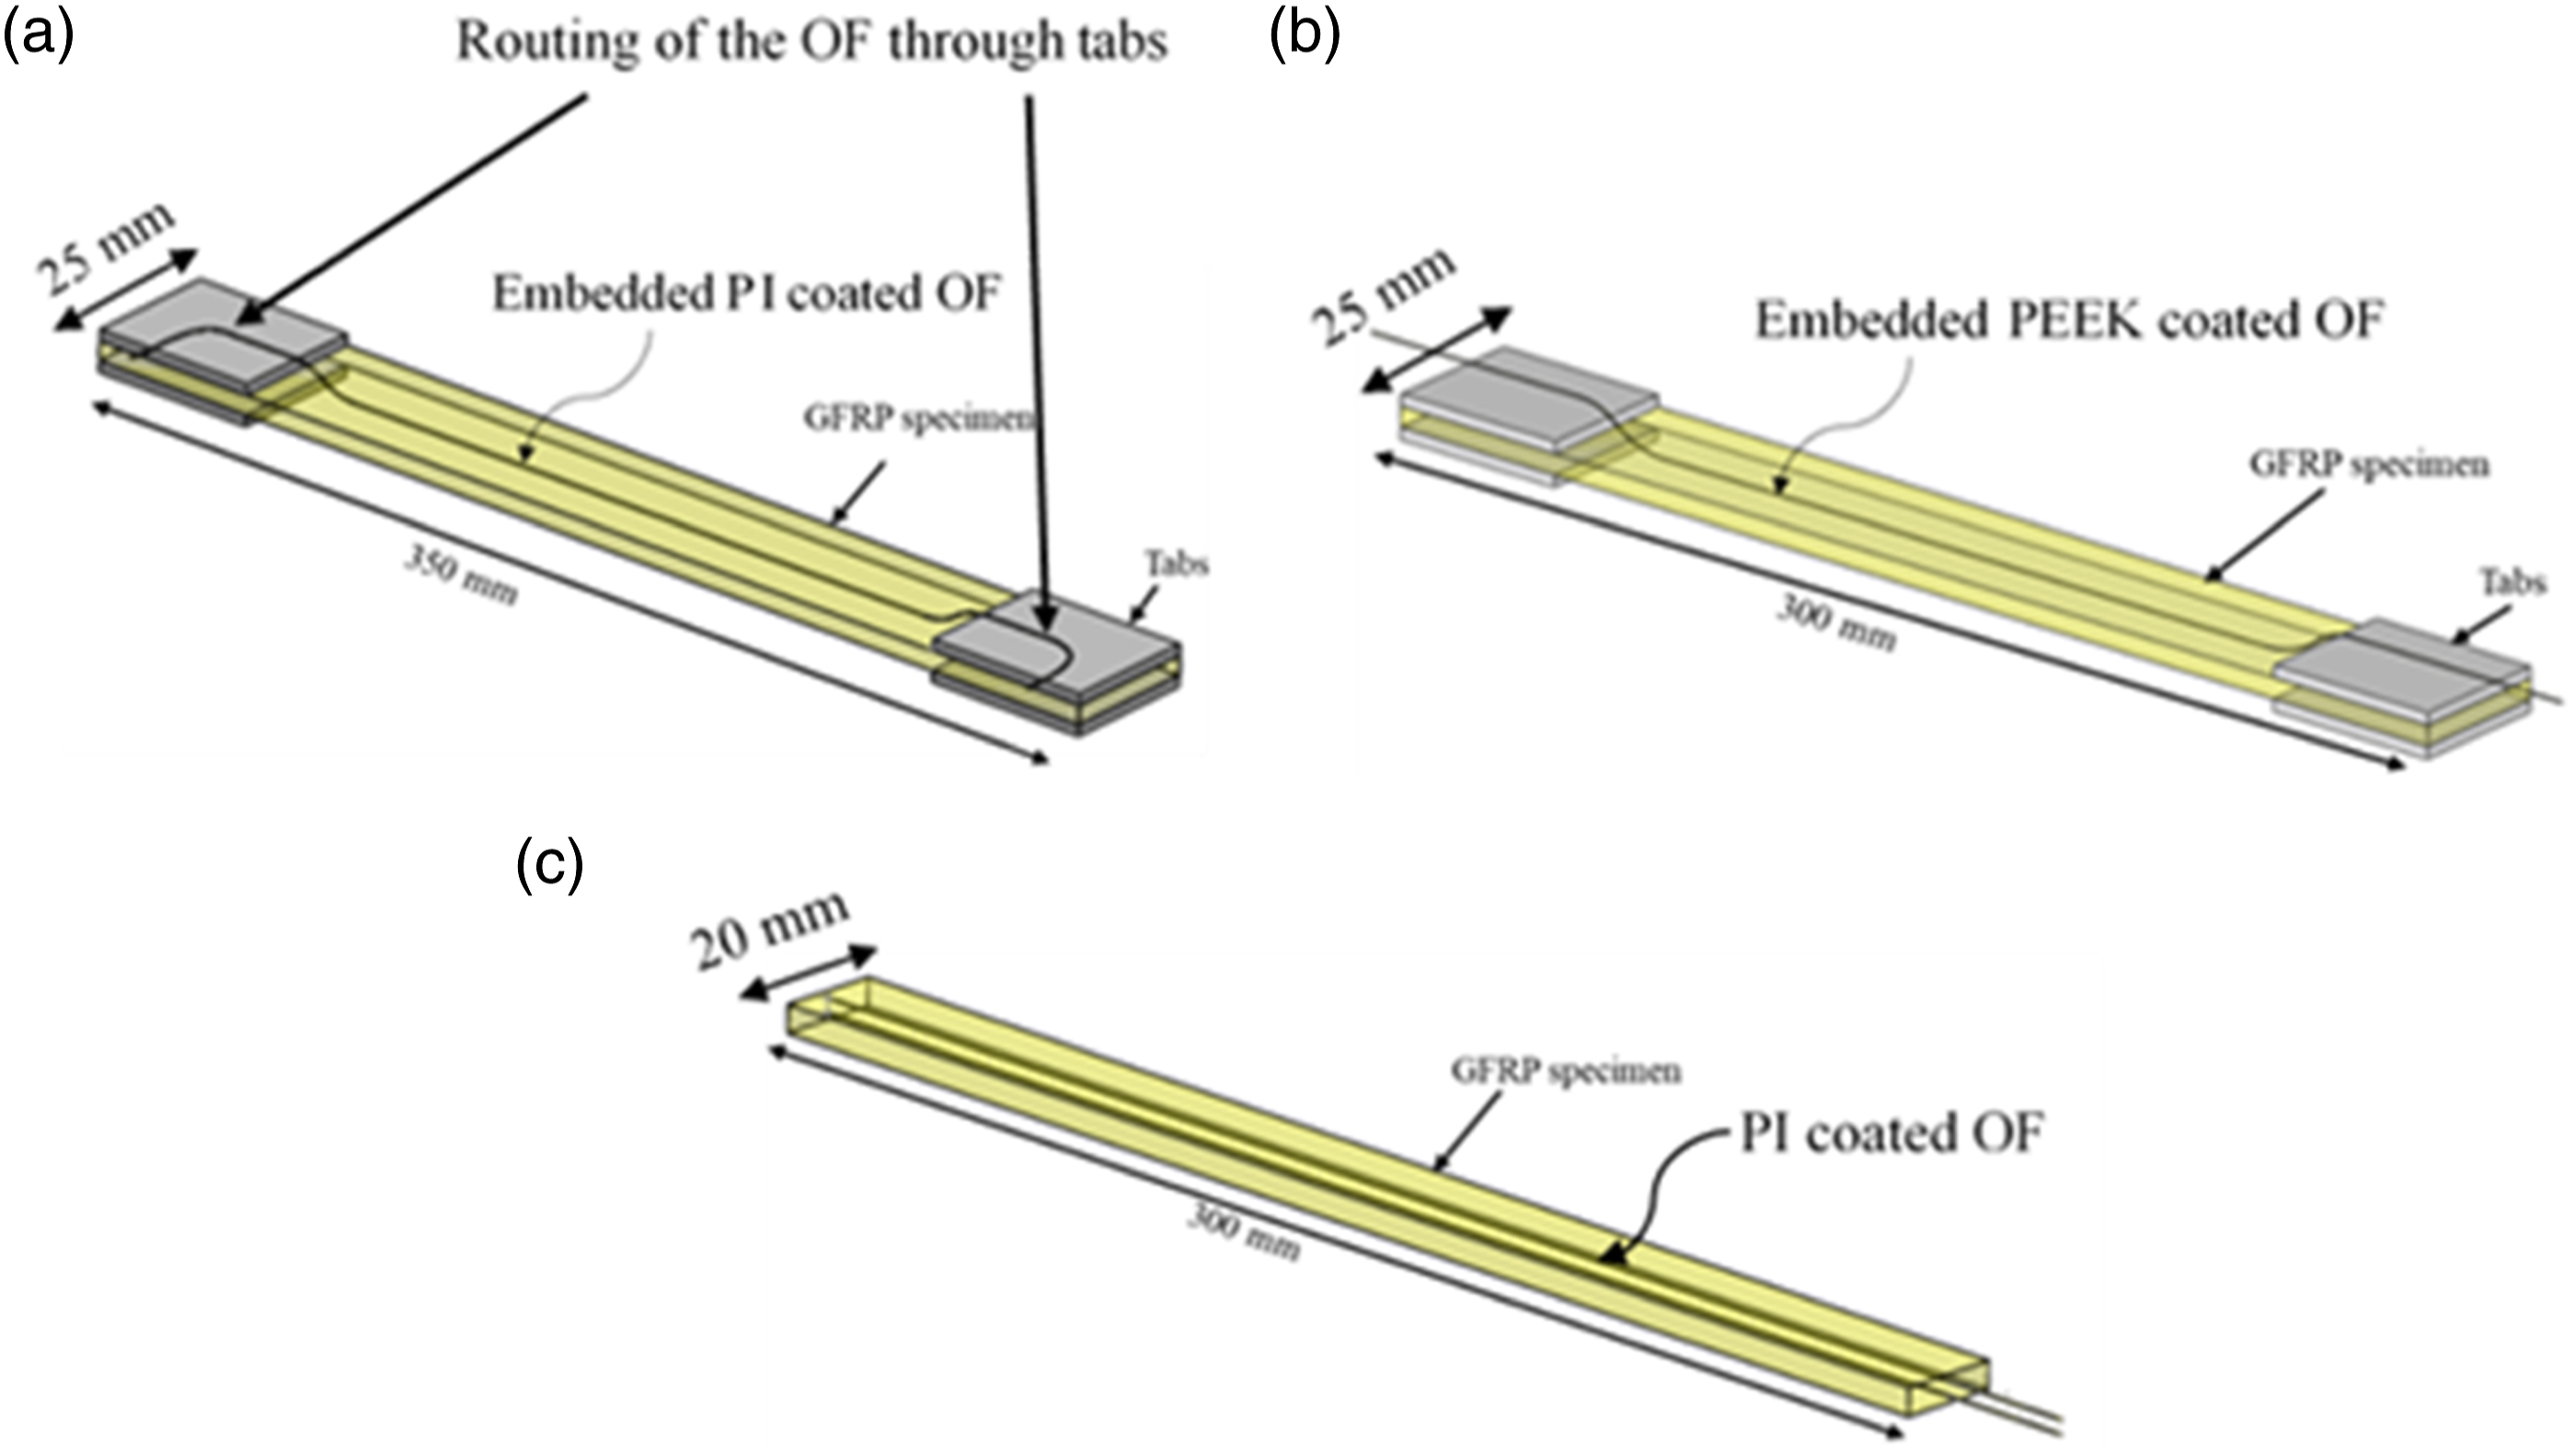
Tensile testing
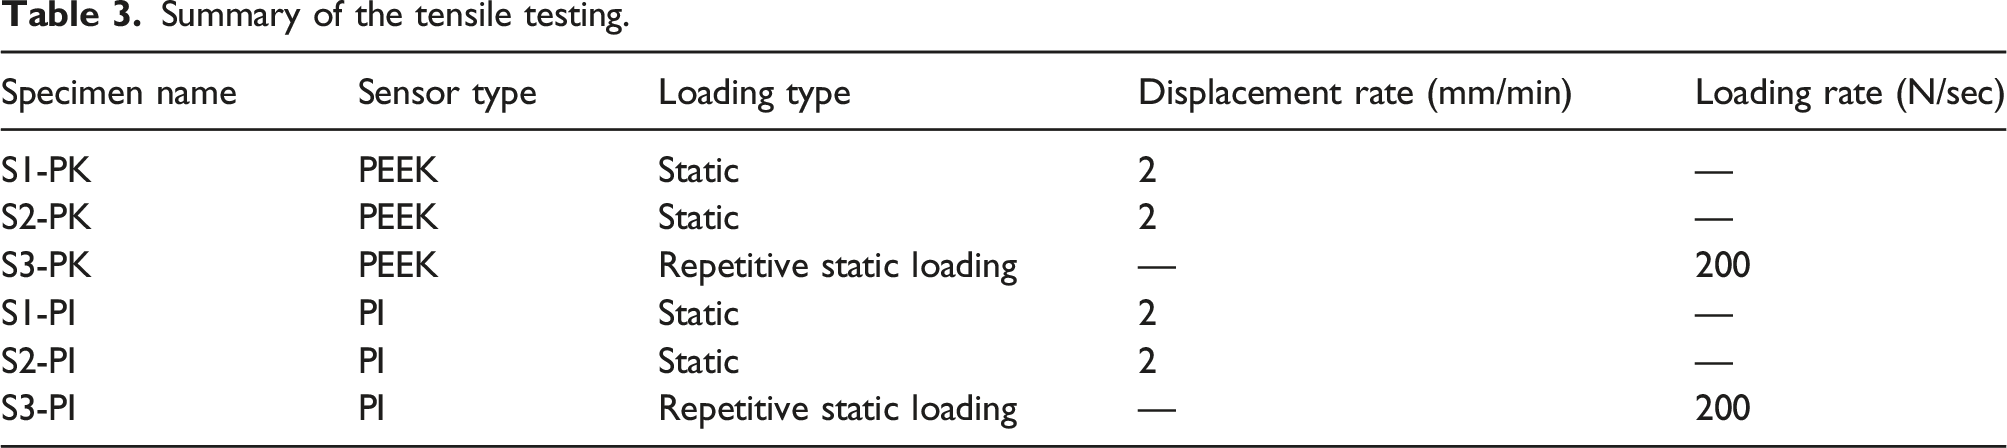
The tensile distributed sensing performance of the embedded OFs was evaluated under quasi-static and repetitive static loading. Under quasi-static loading, the sensing range and optical performance of the embedded OFs were evaluated. Whereas, under repeated loading the measurement repeatability of the embedded OFs was evaluated. The tensile loading was applied on the GFRP specimens using Intron 8,852 biaxial tensile testing machine rated to 100 kN load. The quasi-static load was applied on the specimens under displacement control settings with a displacement rate of 2 mm/min. Whereas the repetitive loading was applied on the specimens under load-control settings with a loading rate of 200 N/sec and frequency of 5 Hz.
In total, six specimens were tested, which included three GFRP specimens with PEEK OFs and three GFRP specimens with PI OFs. A similar test procedure was adopted for the two categories of the GFRP specimens. The quasi-static loading until the failure was applied on two GFRP specimens from each category. Subsequently, one GFRP specimen from each category was tested under incremental repetitive static loading. Furthermore, during the repeated loading, an initial load of 5 kN was applied on the specimen for three loops, and in the subsequent loading steps, the applied load was increased in 5 kN increments until the specimen failed. The internally distributed strains during the tensile testing were monitored by the embedded OFs at a frequency of 20 Hz. In addition to the OFs, bi-axial FSGs were also instrumented on the external surface of the test specimens for validating the OFS strain measurements. The GFRP specimen in the tensile test machine, along with the ODiSI-B system, is shown in Figure 10, and the sensor type, specimen nomenclature and loading condition during the tensile testing are summarised in Table 3. Tensile testing of the GFRP specimen. Summary of the tensile testing.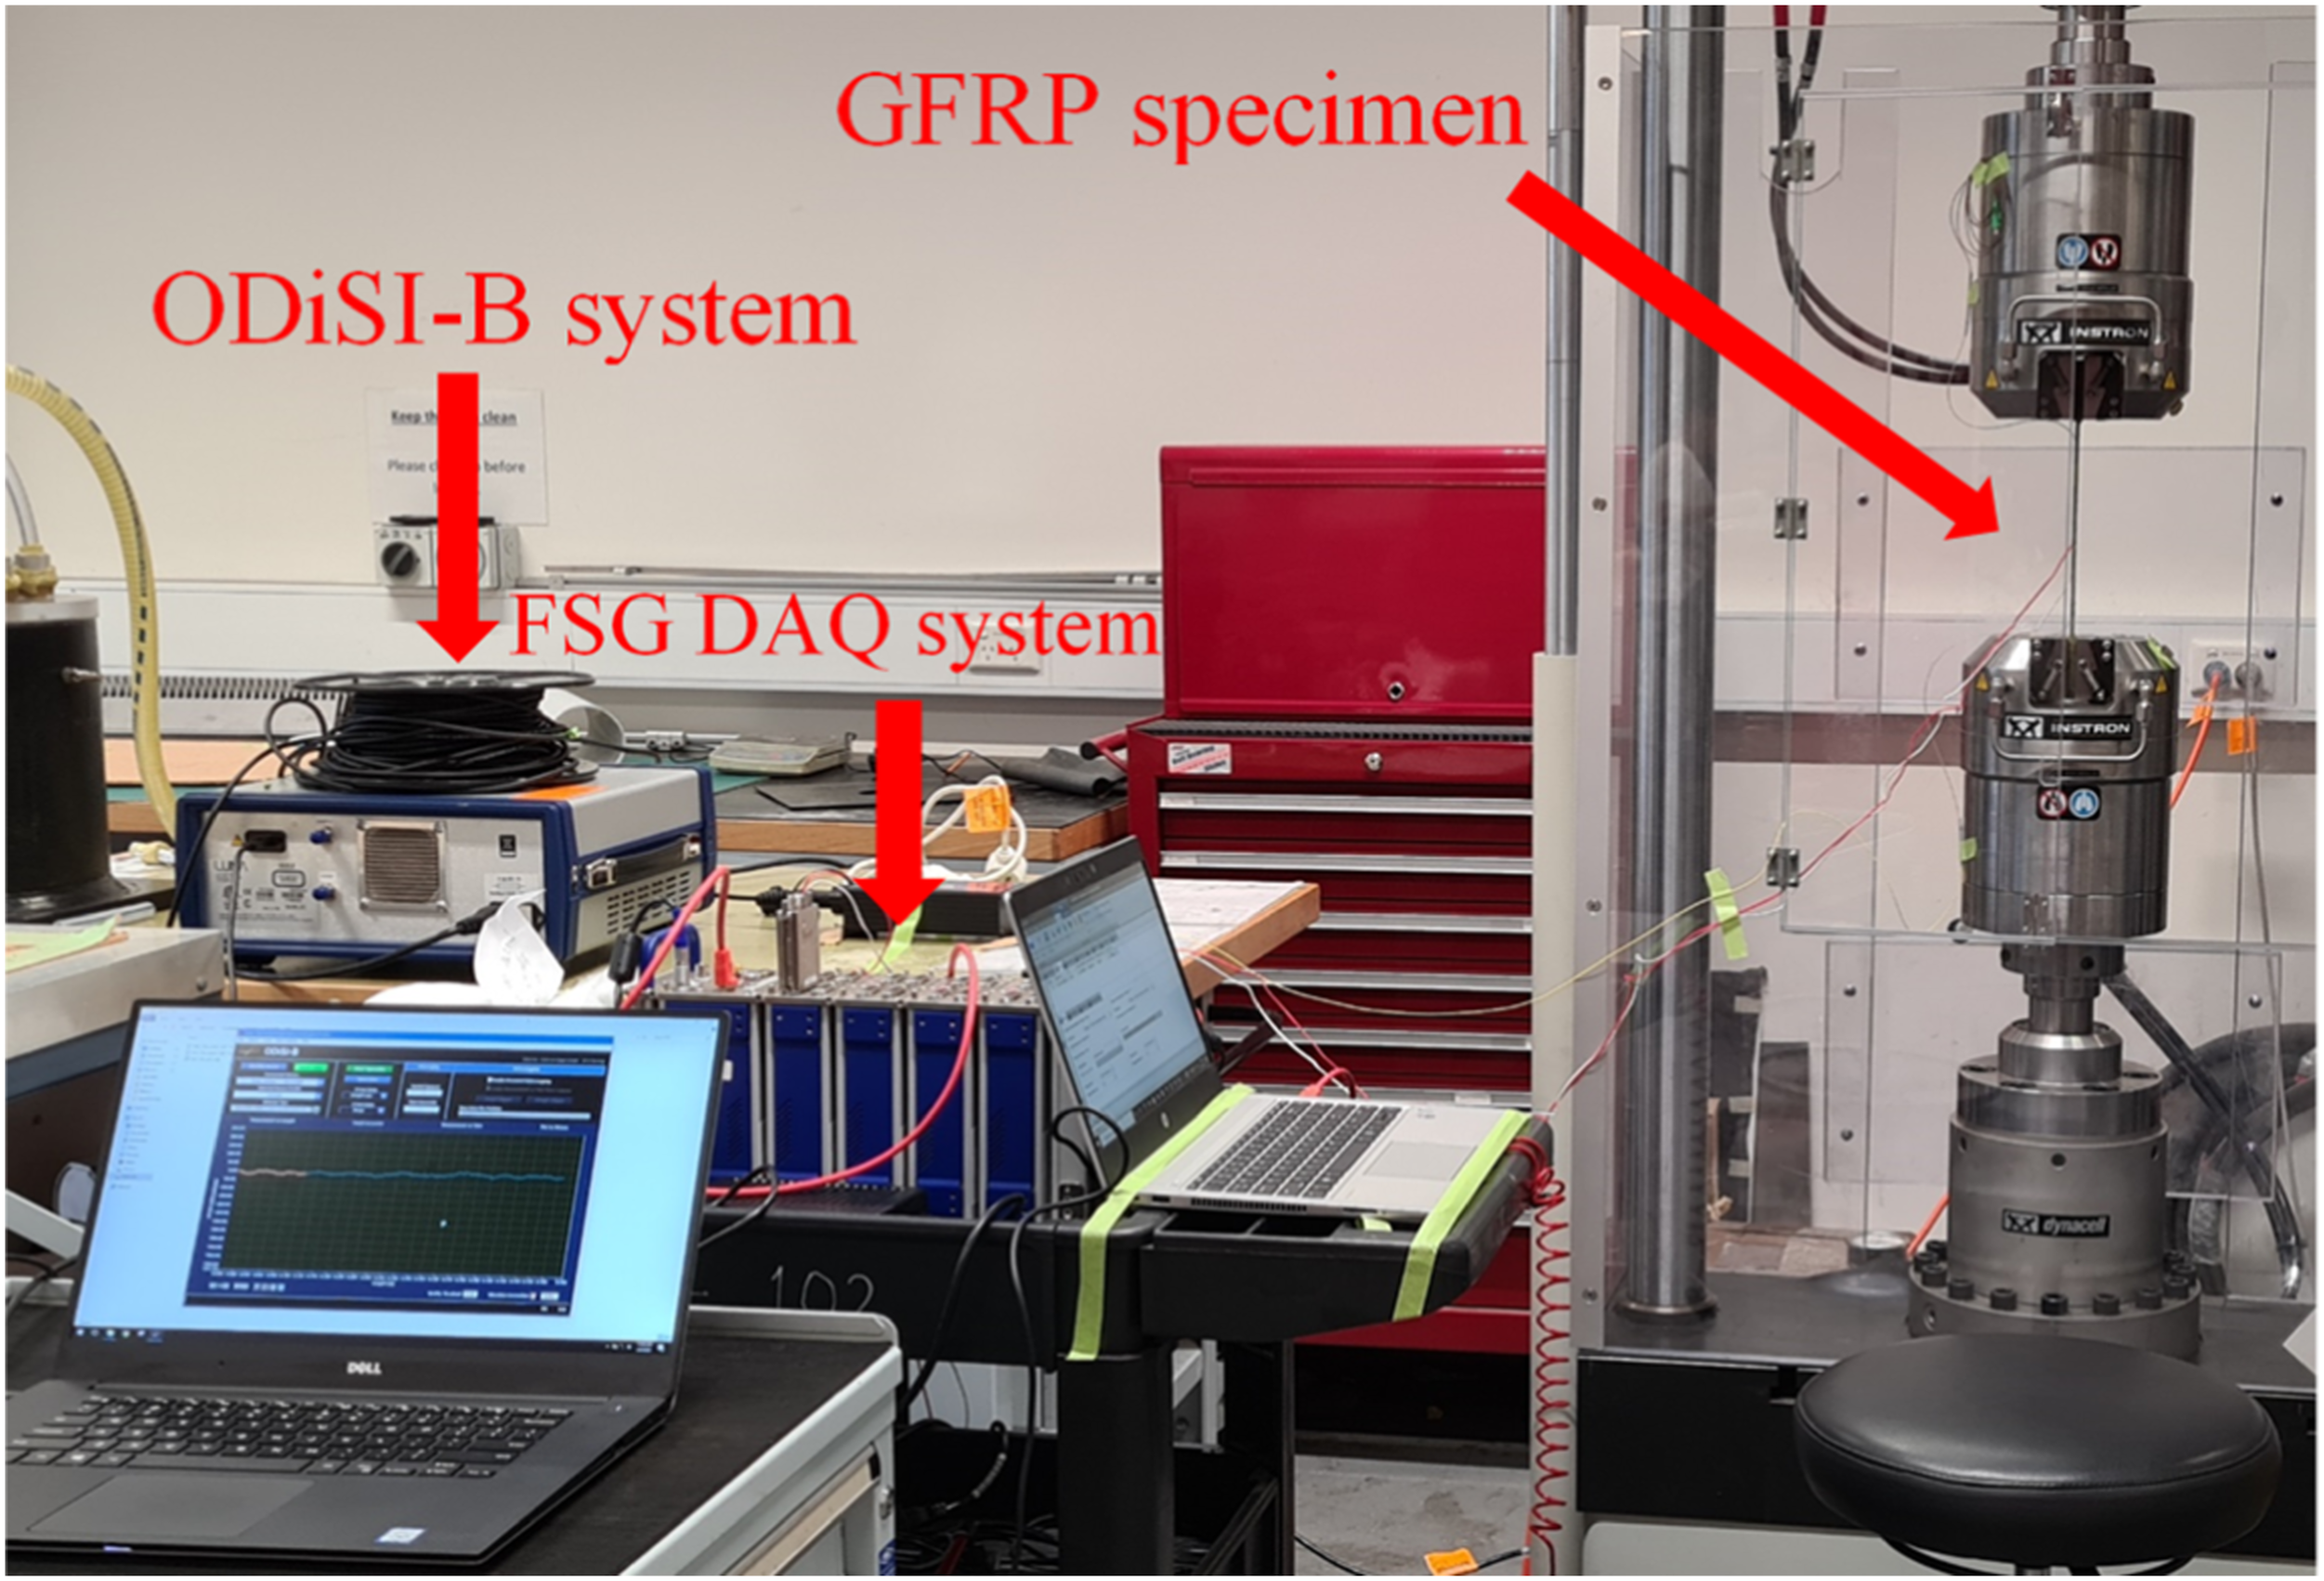
Flexural testing
The four-point bending flexural testing was conducted on the GFRP specimens to evaluate the embedded OFs sensing characteristics under compression and to compare the sensor response with the tensile loads. Application of the four point bending load caused tensile and compressive strains of the specimen along the thickness direction. Three OFs embedded GFRP specimens were tested under flexural loading to characterise the embedded sensors performance. Besides the OFs, top and bottom surfaces of the GFRP specimens were instrumented with uniaxial FSGs, which aligned with the OFs axes for validating the accuracy of the OFS strains.
The test set up for applying the four-point bending load was configured according to the ASTM D7264M-21 standard.
47
The schematic diagram in Figure 11(a) shows the distance between the support and loading spans during the testing of the specimen. An Instron 3,369 universal testing machine with a maximum loading capacity of 50 kN was used for applying the load on the specimens, and applied loads ranged from 50 N to 300 N with increments of 50 N under load control settings with a loading rate of 1 N/sec. The three test specimens were named S1, S2, and S3. Concurrently, during the loading of the specimen the distributed compressive and tensile strains were monitored by the embedded OFSs with a frequency of 20 Hz. The GFRP specimen along with its sensor under flexural loading, is shown in Figure 11(b). Flexural testing of the GFRP specimens; a) Four-point bending test configuration, b) GFRP specimen along with its sensors under four-point loading.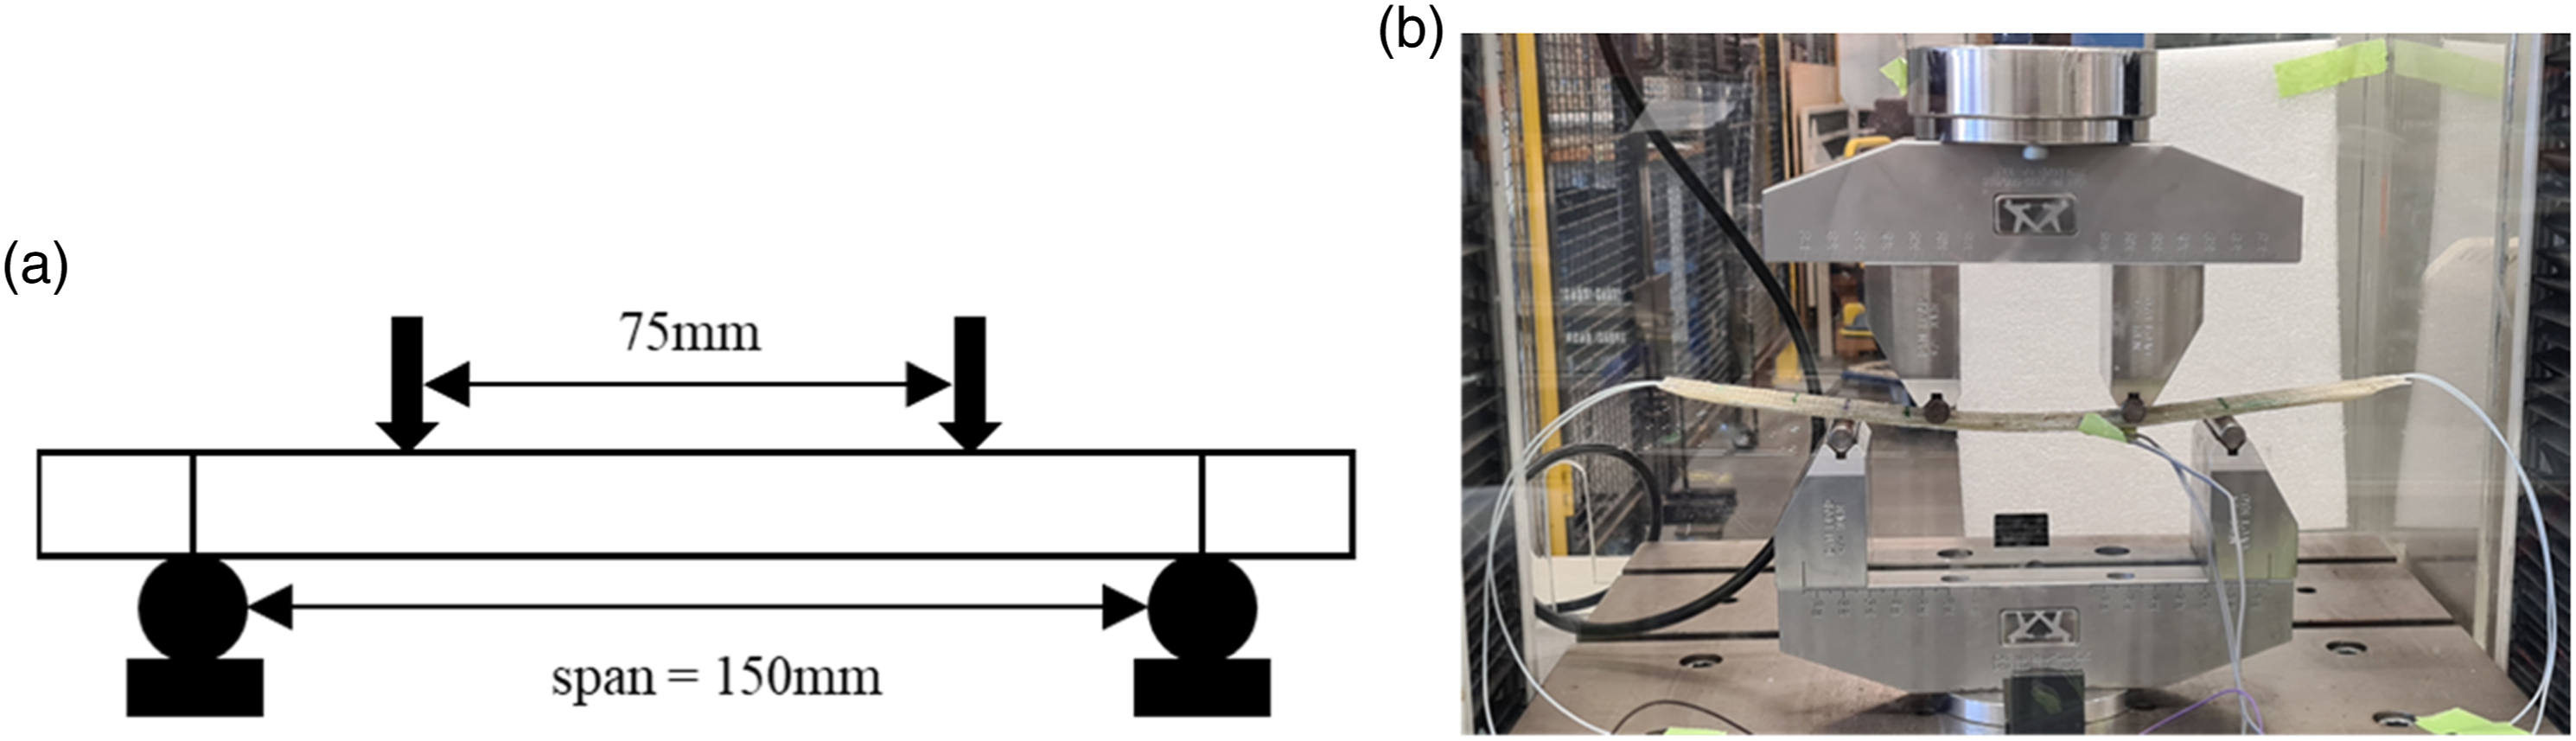
Micro-CT technique
The internal structure of the OF embedded GFRP specimens was examined through a μ-CT technique for evaluating the defects to the OFs and the host GFRP specimen due to the sensor integration. The 3D Micro-CT scan was performed on the 50 mm length of the two GFRP specimens containing PEEK and PI coated OFs separately. The two specimens were scanned with a voxel resolution of 25 µm along the XY, YZ, and ZX planes as illustrated in Figure 12. XY, YZ, and ZX planes of the GFRP specimens.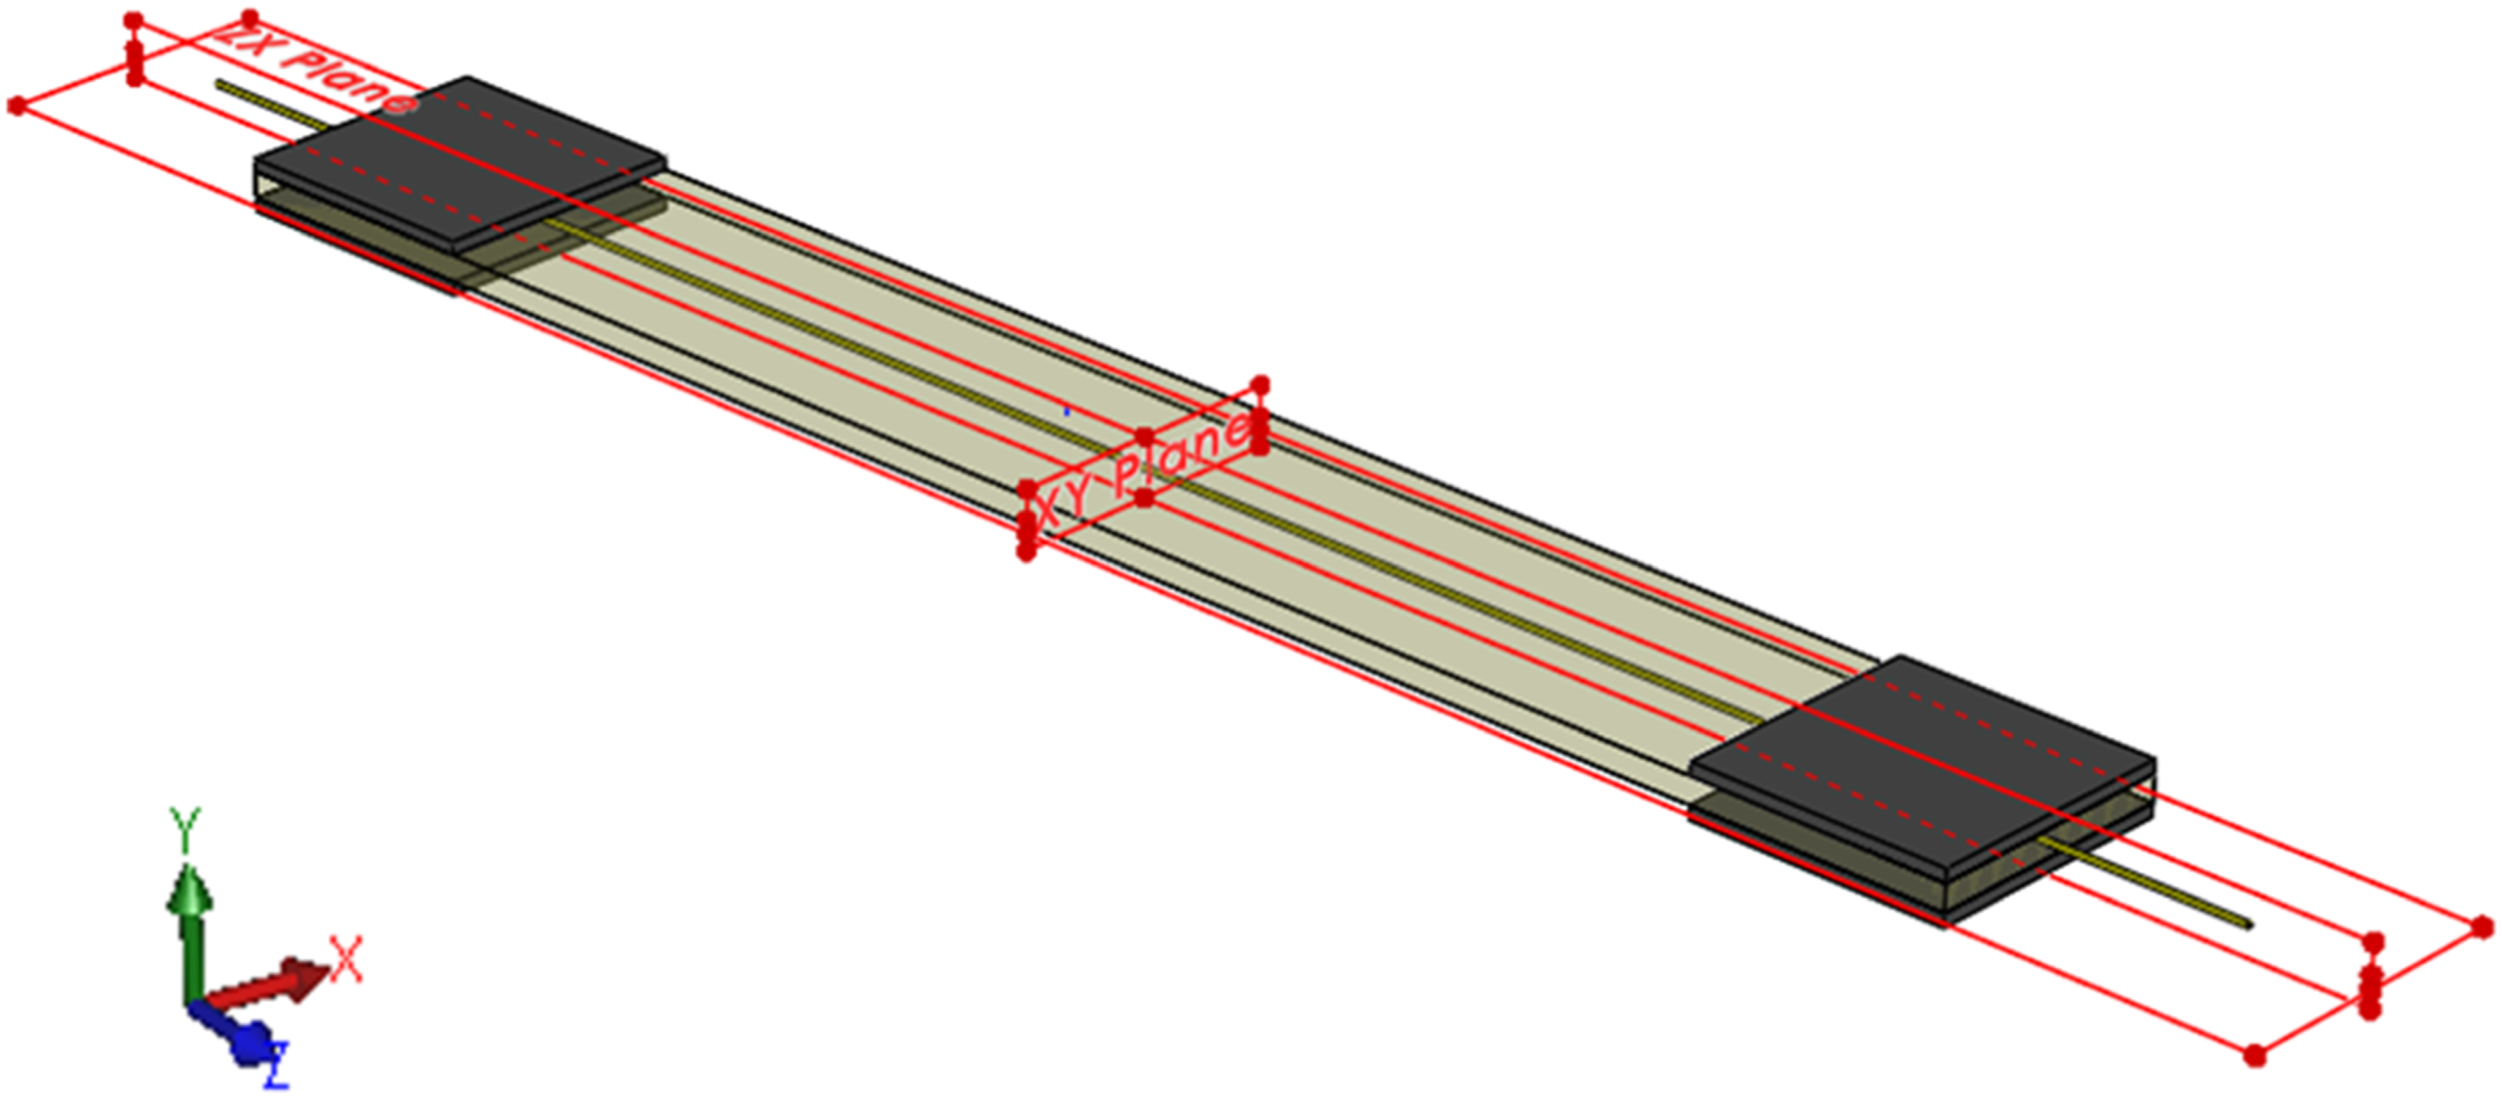
Results and discussion
Cure monitoring using OFS
The strain distribution measured by the PEEK and PI coated OFs along their length at the start and end of the curing process are shown in Figures 13(a)(b), respectively. From the plot it can be seen that the PEEK coated OF provided uniform strain distribution along the length of the embedded sensing region, whereas the strain distribution from the PI OF along the embedded region was not uniform due to the use of the PTFE sleeves at the ingress and egress points of the OFs. Despite the large strain gradient in the measurements at the ingress and egress points, uniform distribution can be observed at locations from 329 mm to 381 mm along the OF sensing length. The presented strain distribution measurements indicated that the two embedded OFs were capable of resisting the applied mechanical stresses during the vacuum resin infusion process and also remained functional for the entire duration of the curing process. Further, the compressive strain distribution at the end of the curing cycle indicated the resin shrinkage due to polymerisation. In addition to measuring the strains at the start and end of the curing cycle, the internal strains changes at various stages during the curing process could also be characterised from the two OF strain measurements. Strain distribution measured by the PEEK coated OFS at the start and end of the curing process.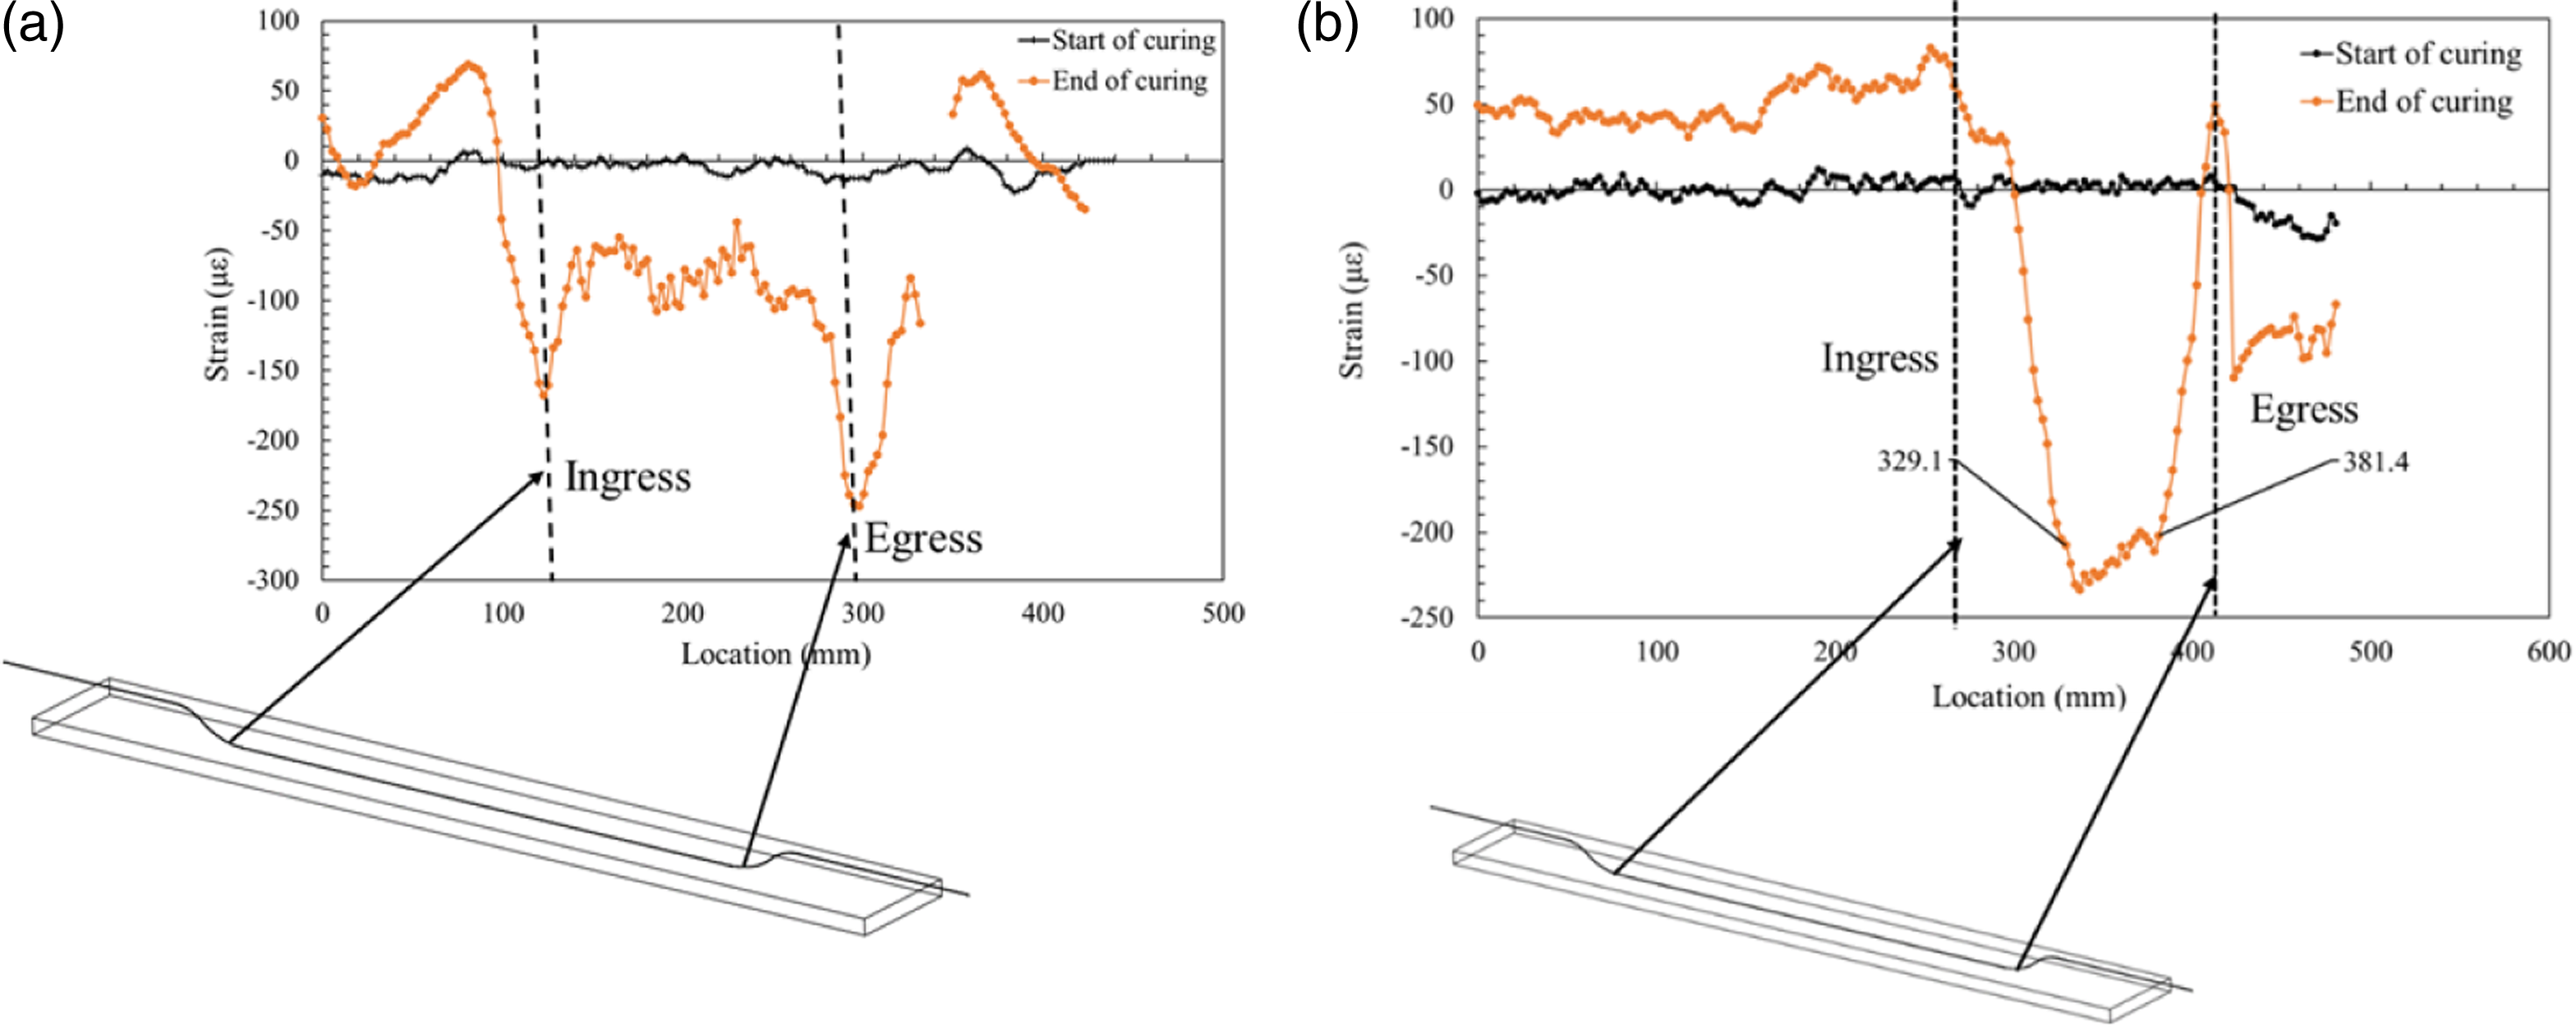
The strain distribution from the PEEK coated OF immediately and 30 min after resin infusion are showed in Figure 14(a). The presented plots showed an equal strain distribution indicating that at 30 min after infusion the resin was still in its initial viscous state. The subsequent strain distribution from 1 h to 3 h after infusion in Figure 14(b), showed an increase in the compressive strain distribution, indicating the initiation of the chemical reaction between the resin and its curatives. Moreover, when the strain measurements in the similar plot are compared against each other, it can be seen that at 90 min and 120 min the strains can be seen to experience a slight shift from compression to tension as a result of heat generated during the resin curing process. However, at 180 min along the locations from 30 mm to 70 mm, the strains can be seen to experience a shift to compression with a higher magnitude than in previous time periods because of the cooling and shrinking of the resin. The evolution of strains from 4 h to 24 h after resin infusion is shown in Figure 14(c). From the plot it can be seen that the strain distribution at 24 h from resin infusion was higher in magnitude than the previous day's strain measurements due to continued polymerisation. Furthermore, in a similar plot, the strain measurements at 1,392 min and 1,440 min equal strain levels and distribution, indicating the hardening of the panel. Strain distribution measured by the PEEK coated OFS in the region of interest at various time steps during the curing process.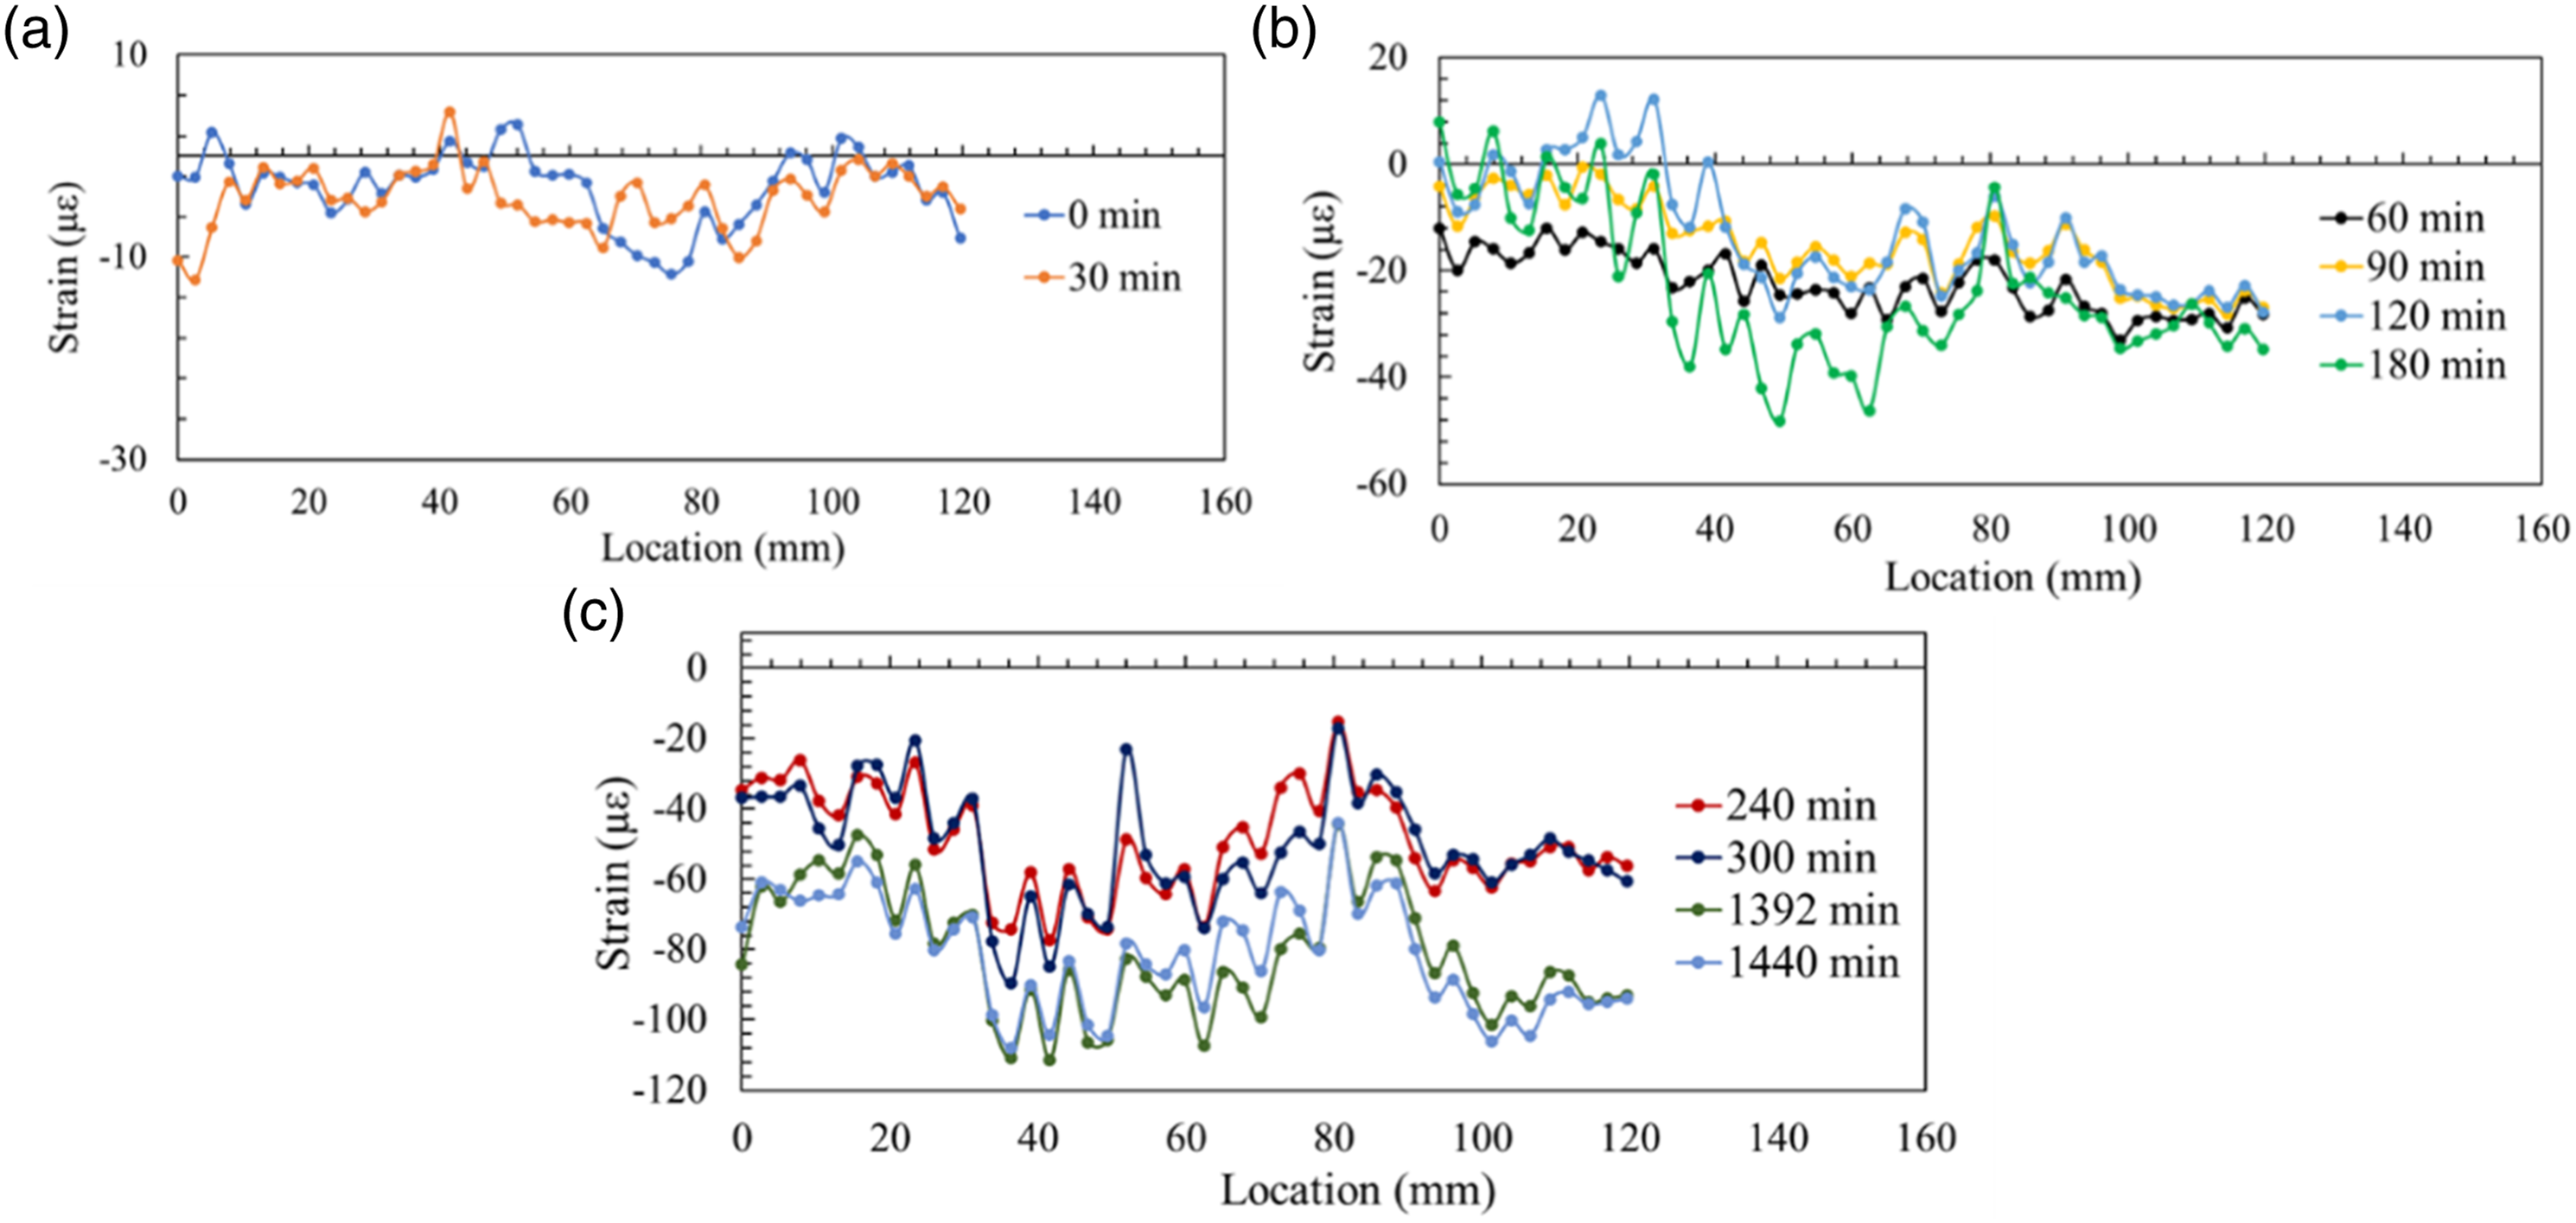
The strains measured by the PI OF at various times during the curing process shown in Figures 15(a)–(c), also followed a similar trend to what was observed with the PEEK OF measurements. From the strain measurements in Figure 15(a), the heating and cooling of the resin due to polymerisation can be seen in the form of a change in the strain levels at 30 min and 60 min, respectively. Subsequently, in Figure 15(b), strain levels can be seen to increase in compression during the time steps from 90 min to 300 min as a result of resin shrinkage due to continued polymerisation. Finally, the residual strain values in the GFRP laminate at 24 h from the resin infusion are shown in Figure 15(c). The two strain data sets presented in the plot at 1,392 min and 1,440 min showed a similar strain level indicating the completion of the curing cycle. Strain distribution measured by the PI coated OFs along the region of interest at various time steps during the curing process.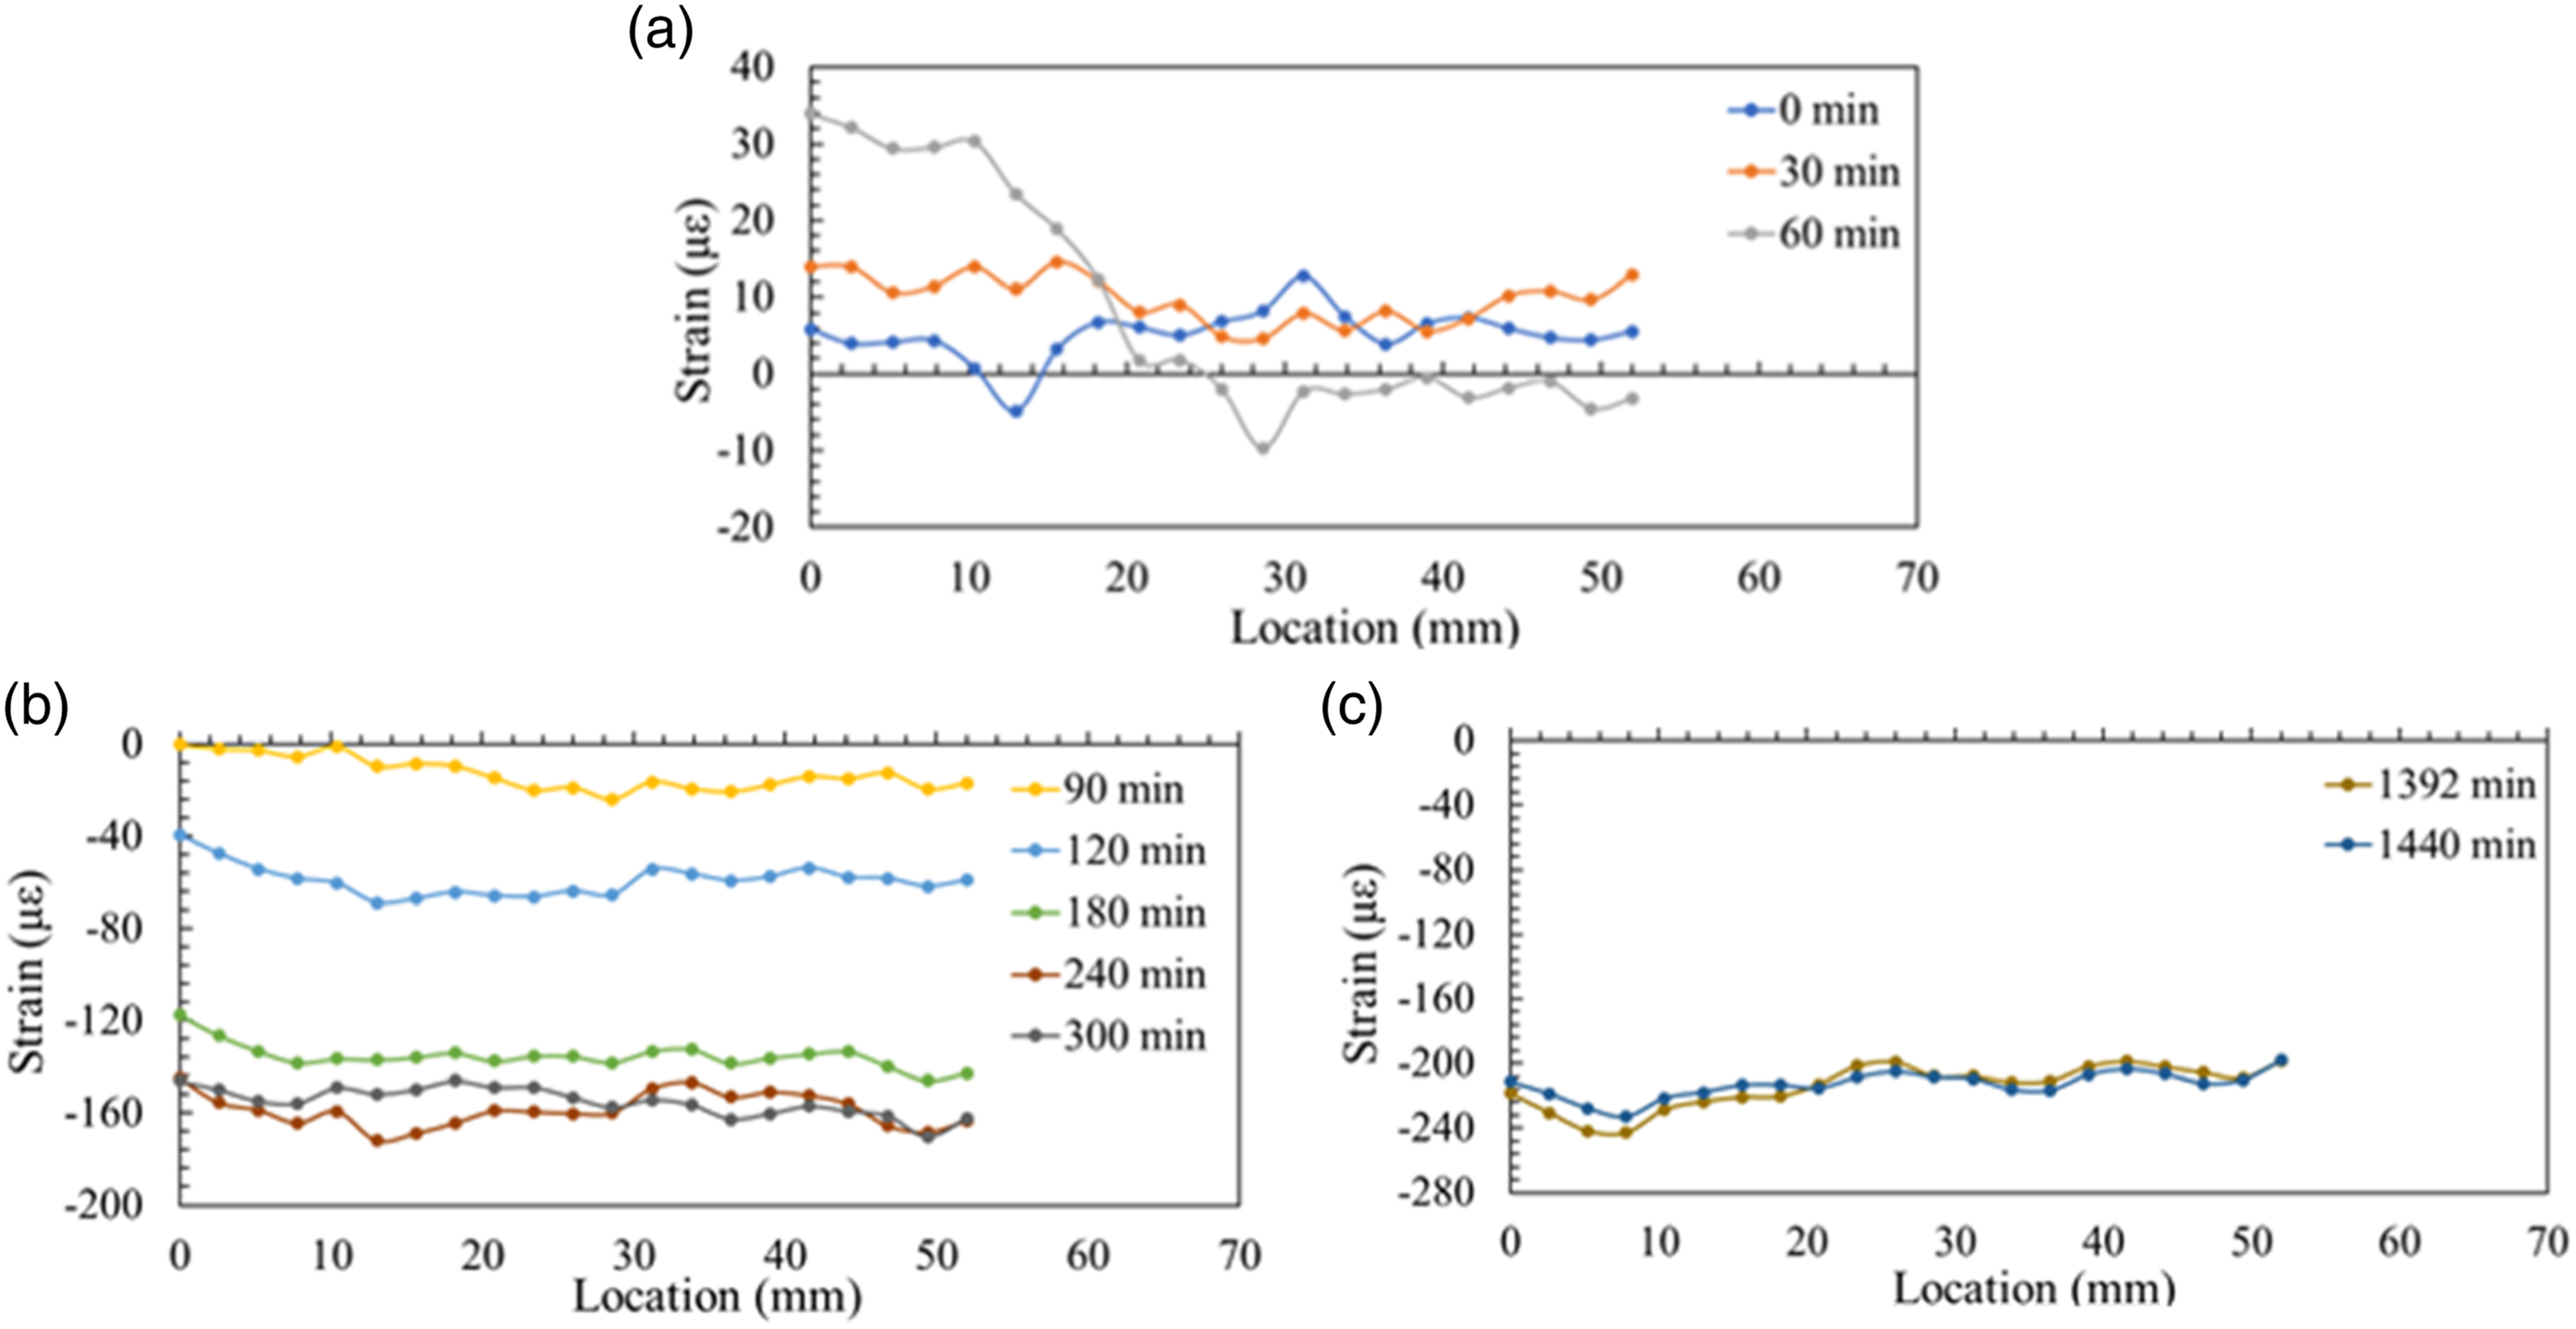
Cure strain comparison between OFSs
The average of the strains measured by the PEEK and PI coated OFs along their respective regions of interest have been compared for evaluating the residual strains in the two laminates at various stages during the resin curing process. The average of the cure strains measured by the two OFs at various time steps during the curing cycle is shown in Figure 16. The three phases of the curing process, which are divided based on the strain changes with time are also highlighted in Figure 16. In the three phases, the evolution of strains in the two GFRP laminates had a similar qualitative pattern. However, quantitively the PI coated OF had measured higher strains than the PEEK coated OF. In the final post-gelation phase, it can be seen that the PEEK OF had measured a residual strain value of −81.09 µε, whereas the PI OF measured −213 µε. In a previous research paper authored by Rufai et al.
6
, the residual strains measured in various composite laminates by the variety of OFs are summarised. When compared with the reported values, the maximum residual strain value of −213 με lies within the limits of previous observations. Despite having measured different strain magnitudes, the distributed strain measurements from the PEEK and PI OFs during the curing process showed no large strain concentrations or abnormalities indicating a uniform resin distribution inside the GFRP laminates. Comparison of cure strains between the PEEK and PI coated OFs.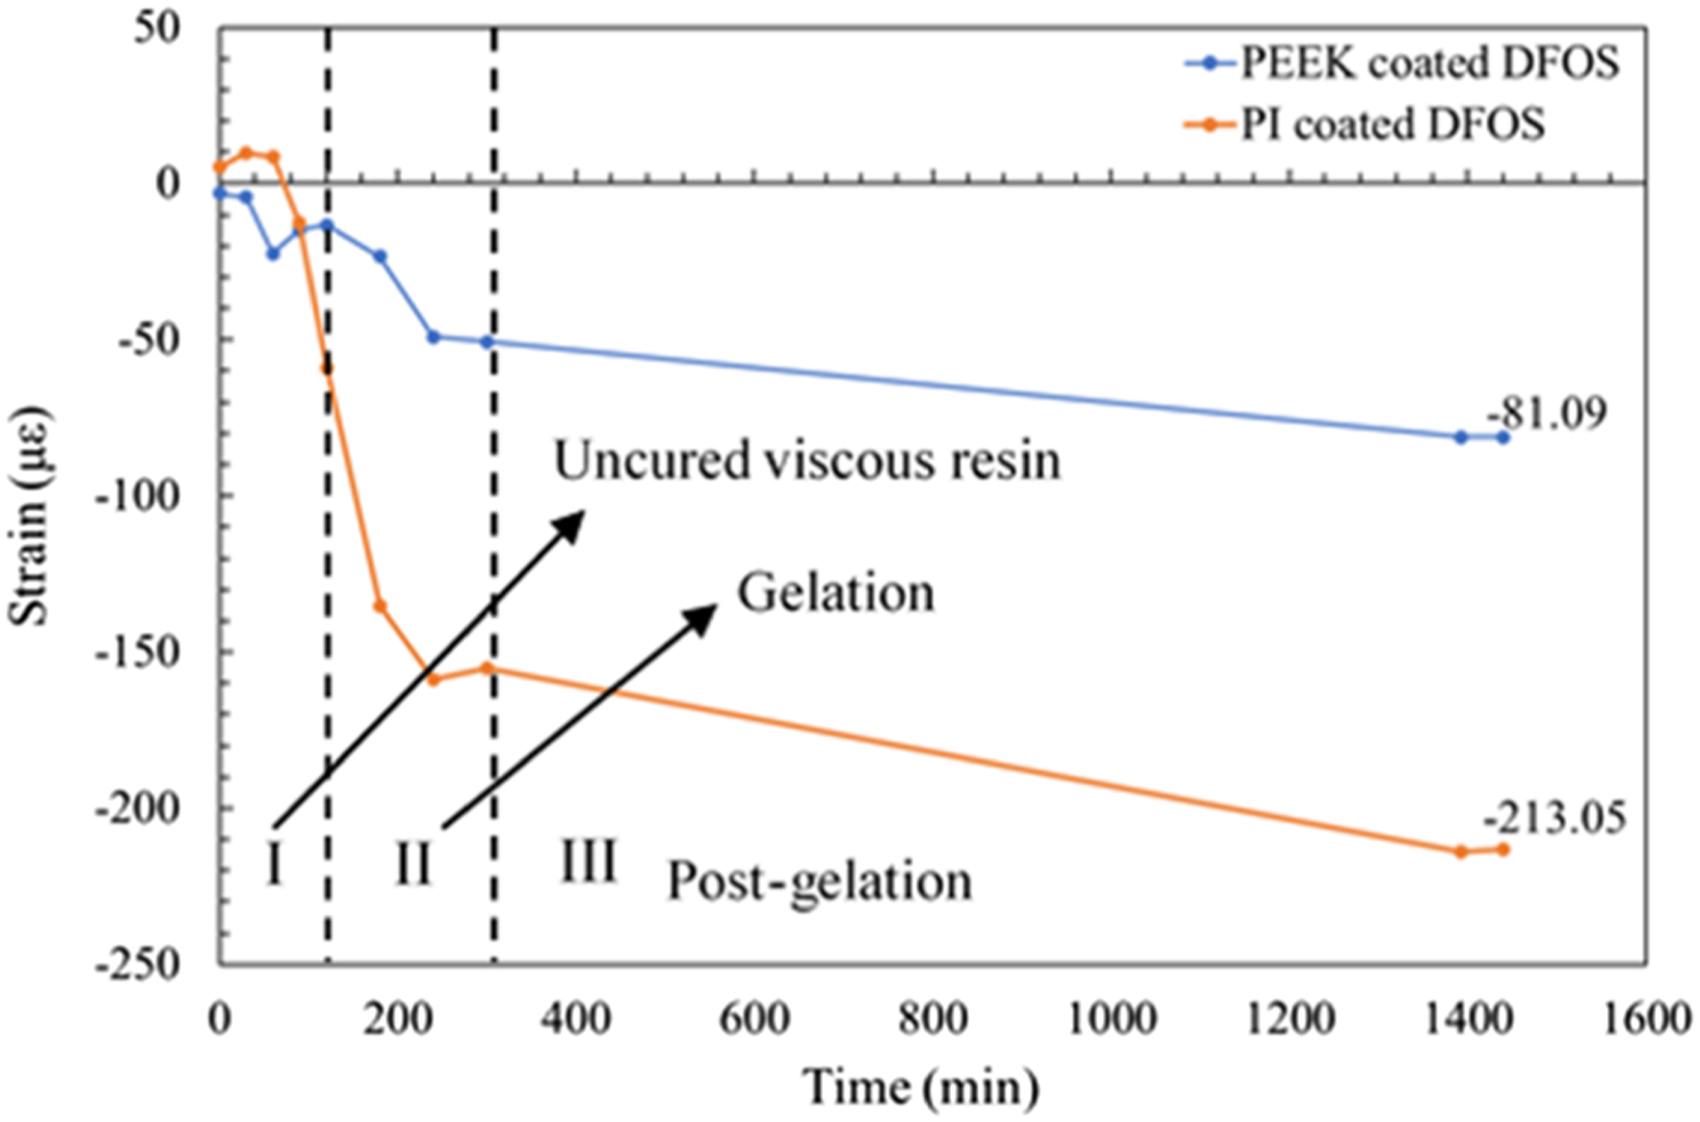
Embedded sensor characteristics under tensile loading
Sensing performance and repeatability of PEEK coated OFS
The internal strain distribution measured by the PEEK coated OFs at load steps from 10 kN to 40 kN are shown in Figures 17 (a)–(e), respectively. Even though specimen S3 was tested under repetitive static loading, the strain measurements at peak loading of each loop provided the opportunity to compare the strain distribution in S3 with specimens S1 and S2. In the presented plots, it can be seen that the three specimens had a similar qualitative strain distribution. However, when compared quantitively the strains inside specimen S1 were lower in magnitude than the strains inside S2 and S3. Further, the strain distribution along the specimen length was not uniform. The strains at the mid-region were higher than in the ingress and egress regions. The locations inside the specimens where maximum strains occurred are highlighted in the presented plots. Strain distribution measured by the embedded PEEK OFS under tensile load at load steps of: (a) 10 kN, (b) 15 kN, (c) 20 kN, (d) 30 kN, (e) 40 kN.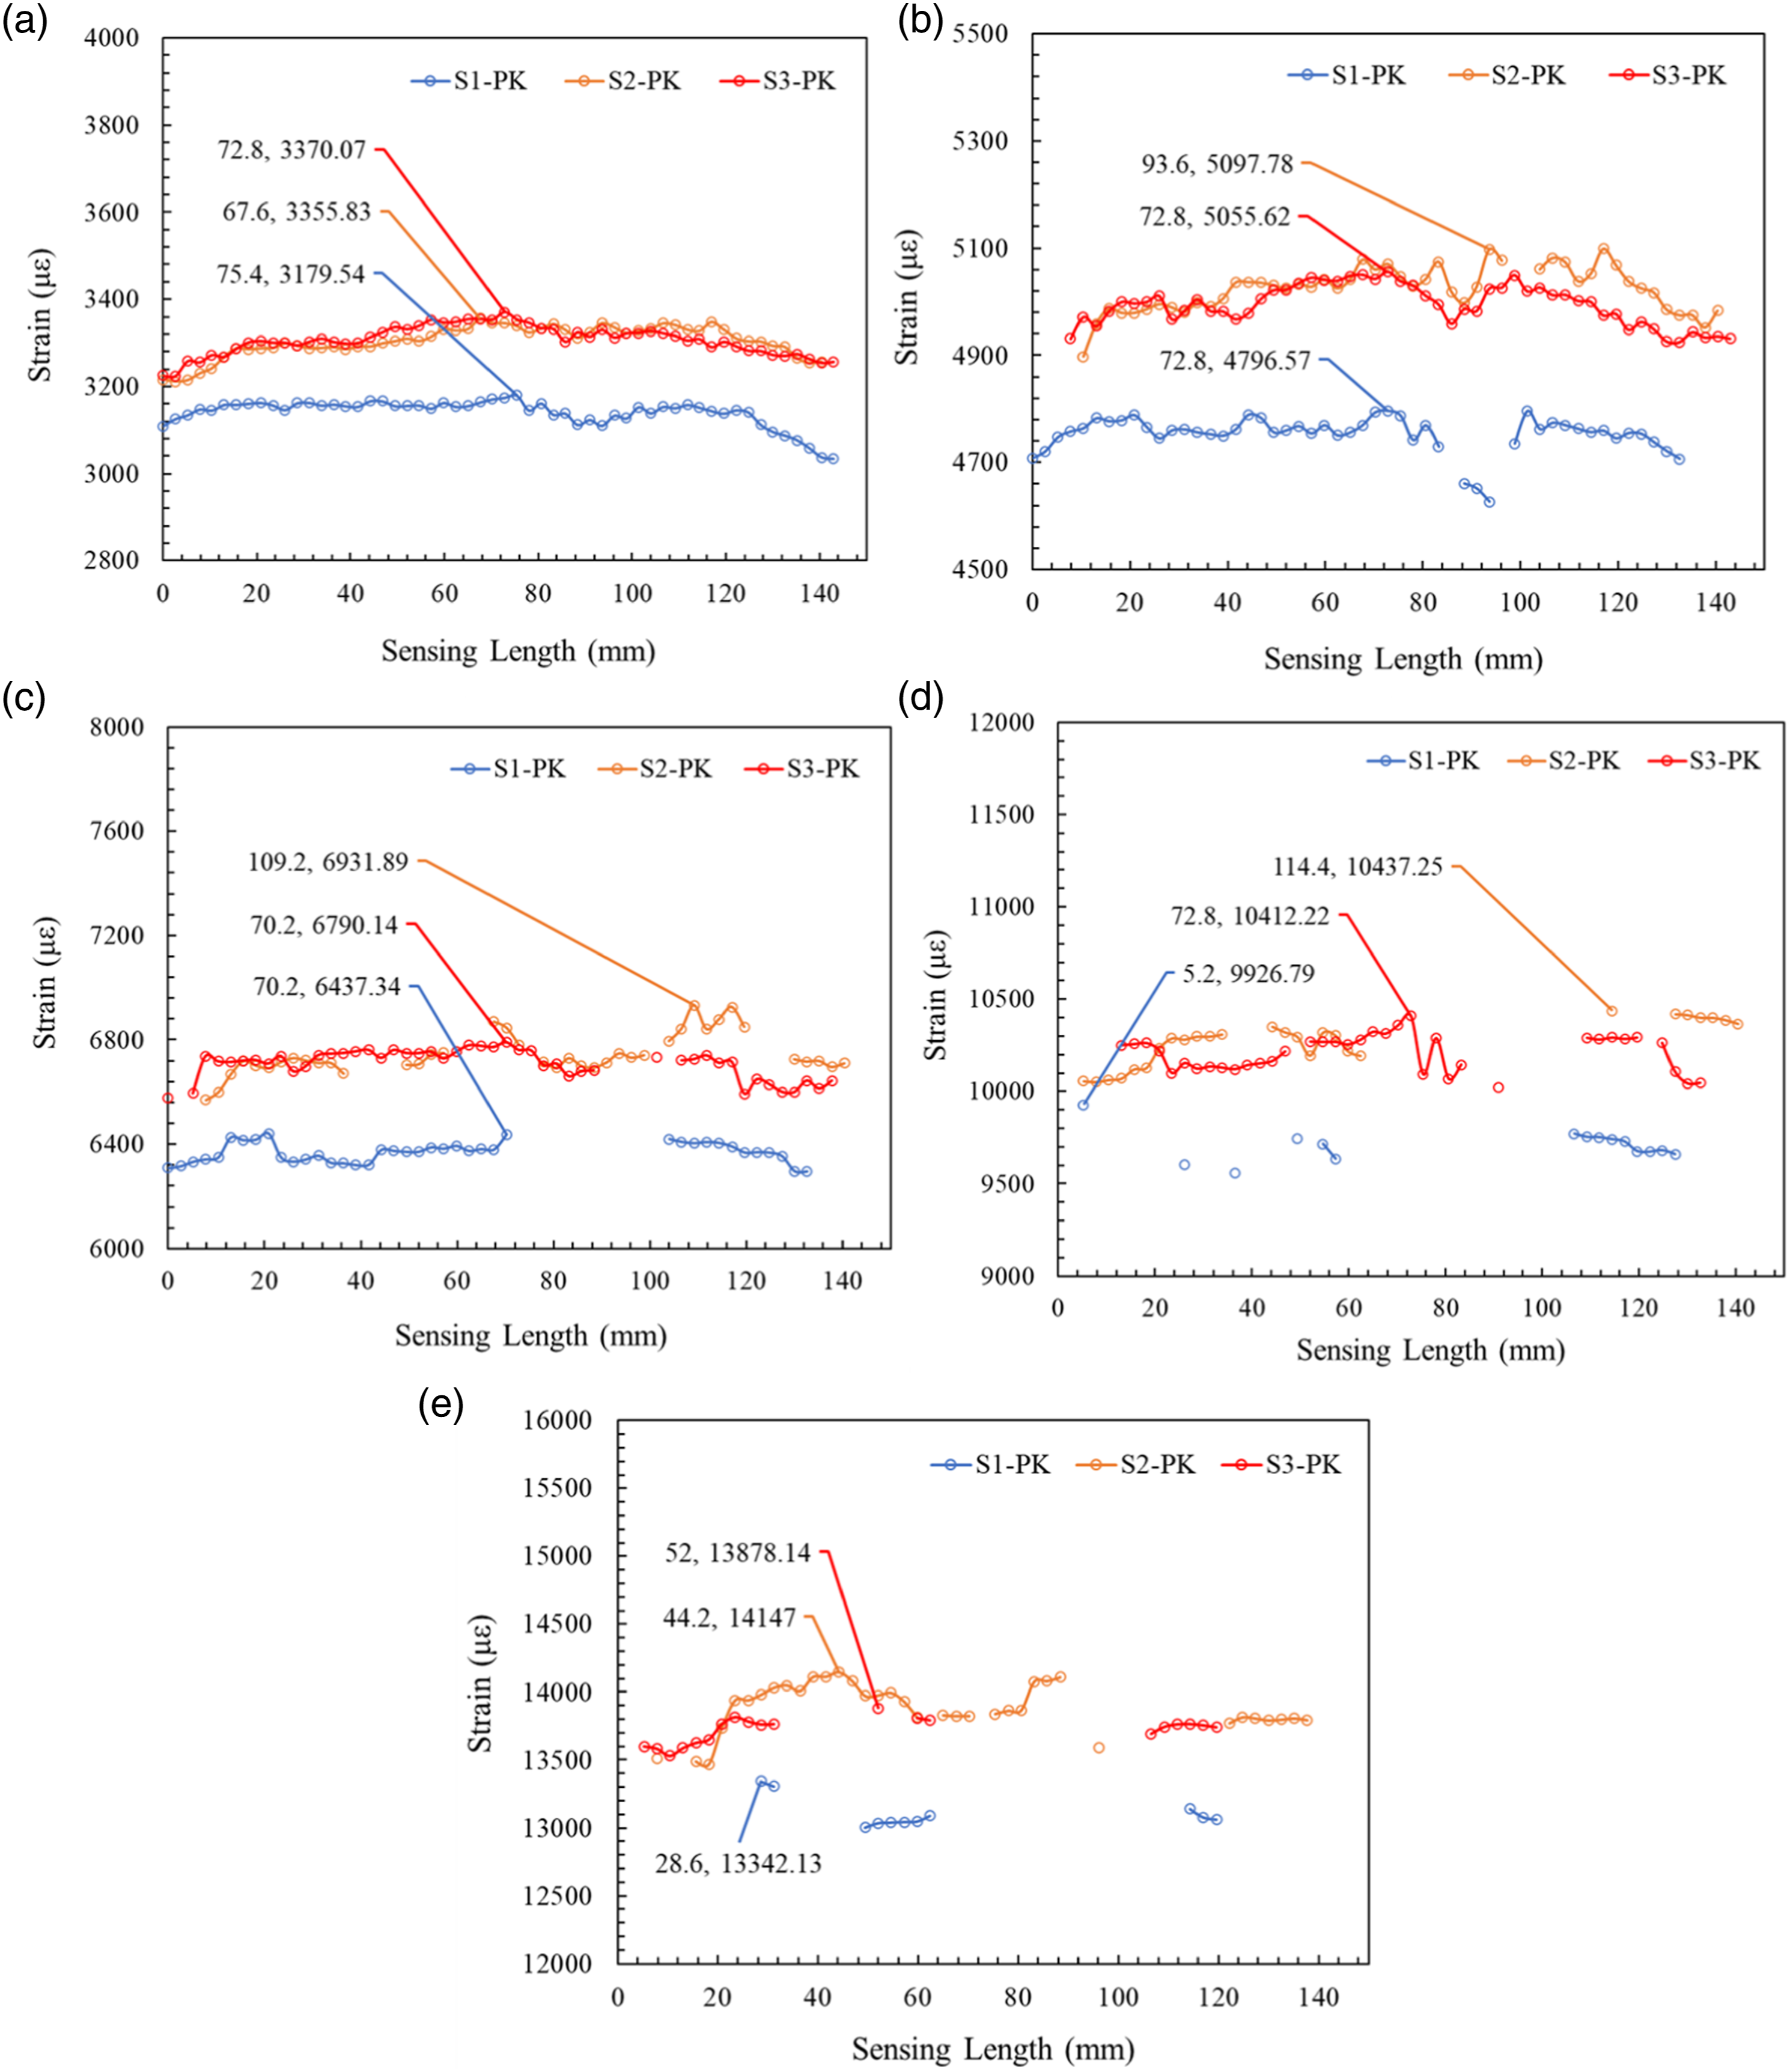
The three specimens, S1, S2, and S3, failed at an ultimate load of 50, 48, and 45 kN, respectively, and the PEEK OFs were functional up to 40 kN load. Until the strain reached 5,000 με, the OFS was able to monitor the internal strain distribution without experiencing significant deterioration in its performance. However, when the strain distribution inside the specimen was close to 7,000 με at 20 kN, the OFS in S1 started to experience deterioration in its performance along the region from 70 mm to 100 mm. Whereas the OFs in S2 and S3 performed optimally. In the subsequent load steps of 30 kN, the OFs in S2 and S3 also experienced deterioration at various locations along their length, and the OF in S1 provided the strain measurements only at the egress region. In the further load step of 40 kN, the strain levels inside the GFRP specimens were greater than 13,000 µε, at which the sensing performance of the OFs in all the specimens deteriorated further. However, with the deteriorating performance the PEEK coated OFs were able to provide the information about the maximum strain inside the specimens.
The cyclic performance of the PEEK OFs was evaluated from the strain-load hysteresis plot that was constructed from the strain distribution measurements taken during the repetitive static loading on specimen S3. The strain-load hysteresis plot along with the percentage of data retained by the PEEK OFs at load steps from 10, 20, 30 and 40 kN are shown in Figures 18(a)–(d), respectively. The PEEK OF was able to measure the repetitive strain distribution along its length. However, for ease of representing the strain-load hysteresis plot was constructed using the strain at the location of 70.2 mm along the sensing length. From the presented plots, it can be seen that until 20 kN load at the peak strain level of 6,837 με the OF was able to measure a similar strain hysteresis continuously for the three loading and unloading steps without deterioration in its optical performance. However, from Figure 18(c), at 30 kN load the deterioration in its sensing performance can be observed. The dropouts in the sensor measurements can be observed between 18 kN to 20 kN loads, and thereafter the OF was able to measure the strains until peak load, at which it measured a peak strain value of 12,303 με. Despite the performance deterioration, the PEEK OF was able to measure equal strains during the three loading and unloading loops. In the final load step of 40 kN, a similar trend can be observed where the OF was able to measure the peak strain value of 13,646 με at maximum load, but its performance deteriorated after 13 kN load. However, below 13 kN load the PEEK OF was able to measure equal strains during the three loading and unloading steps. Strain hysteresis measured by the embedded PEEK OF under repetitive tensile loading of: (a) 10 kN, (b) 20 kN, (c) 30 kN, (d) 40 kN.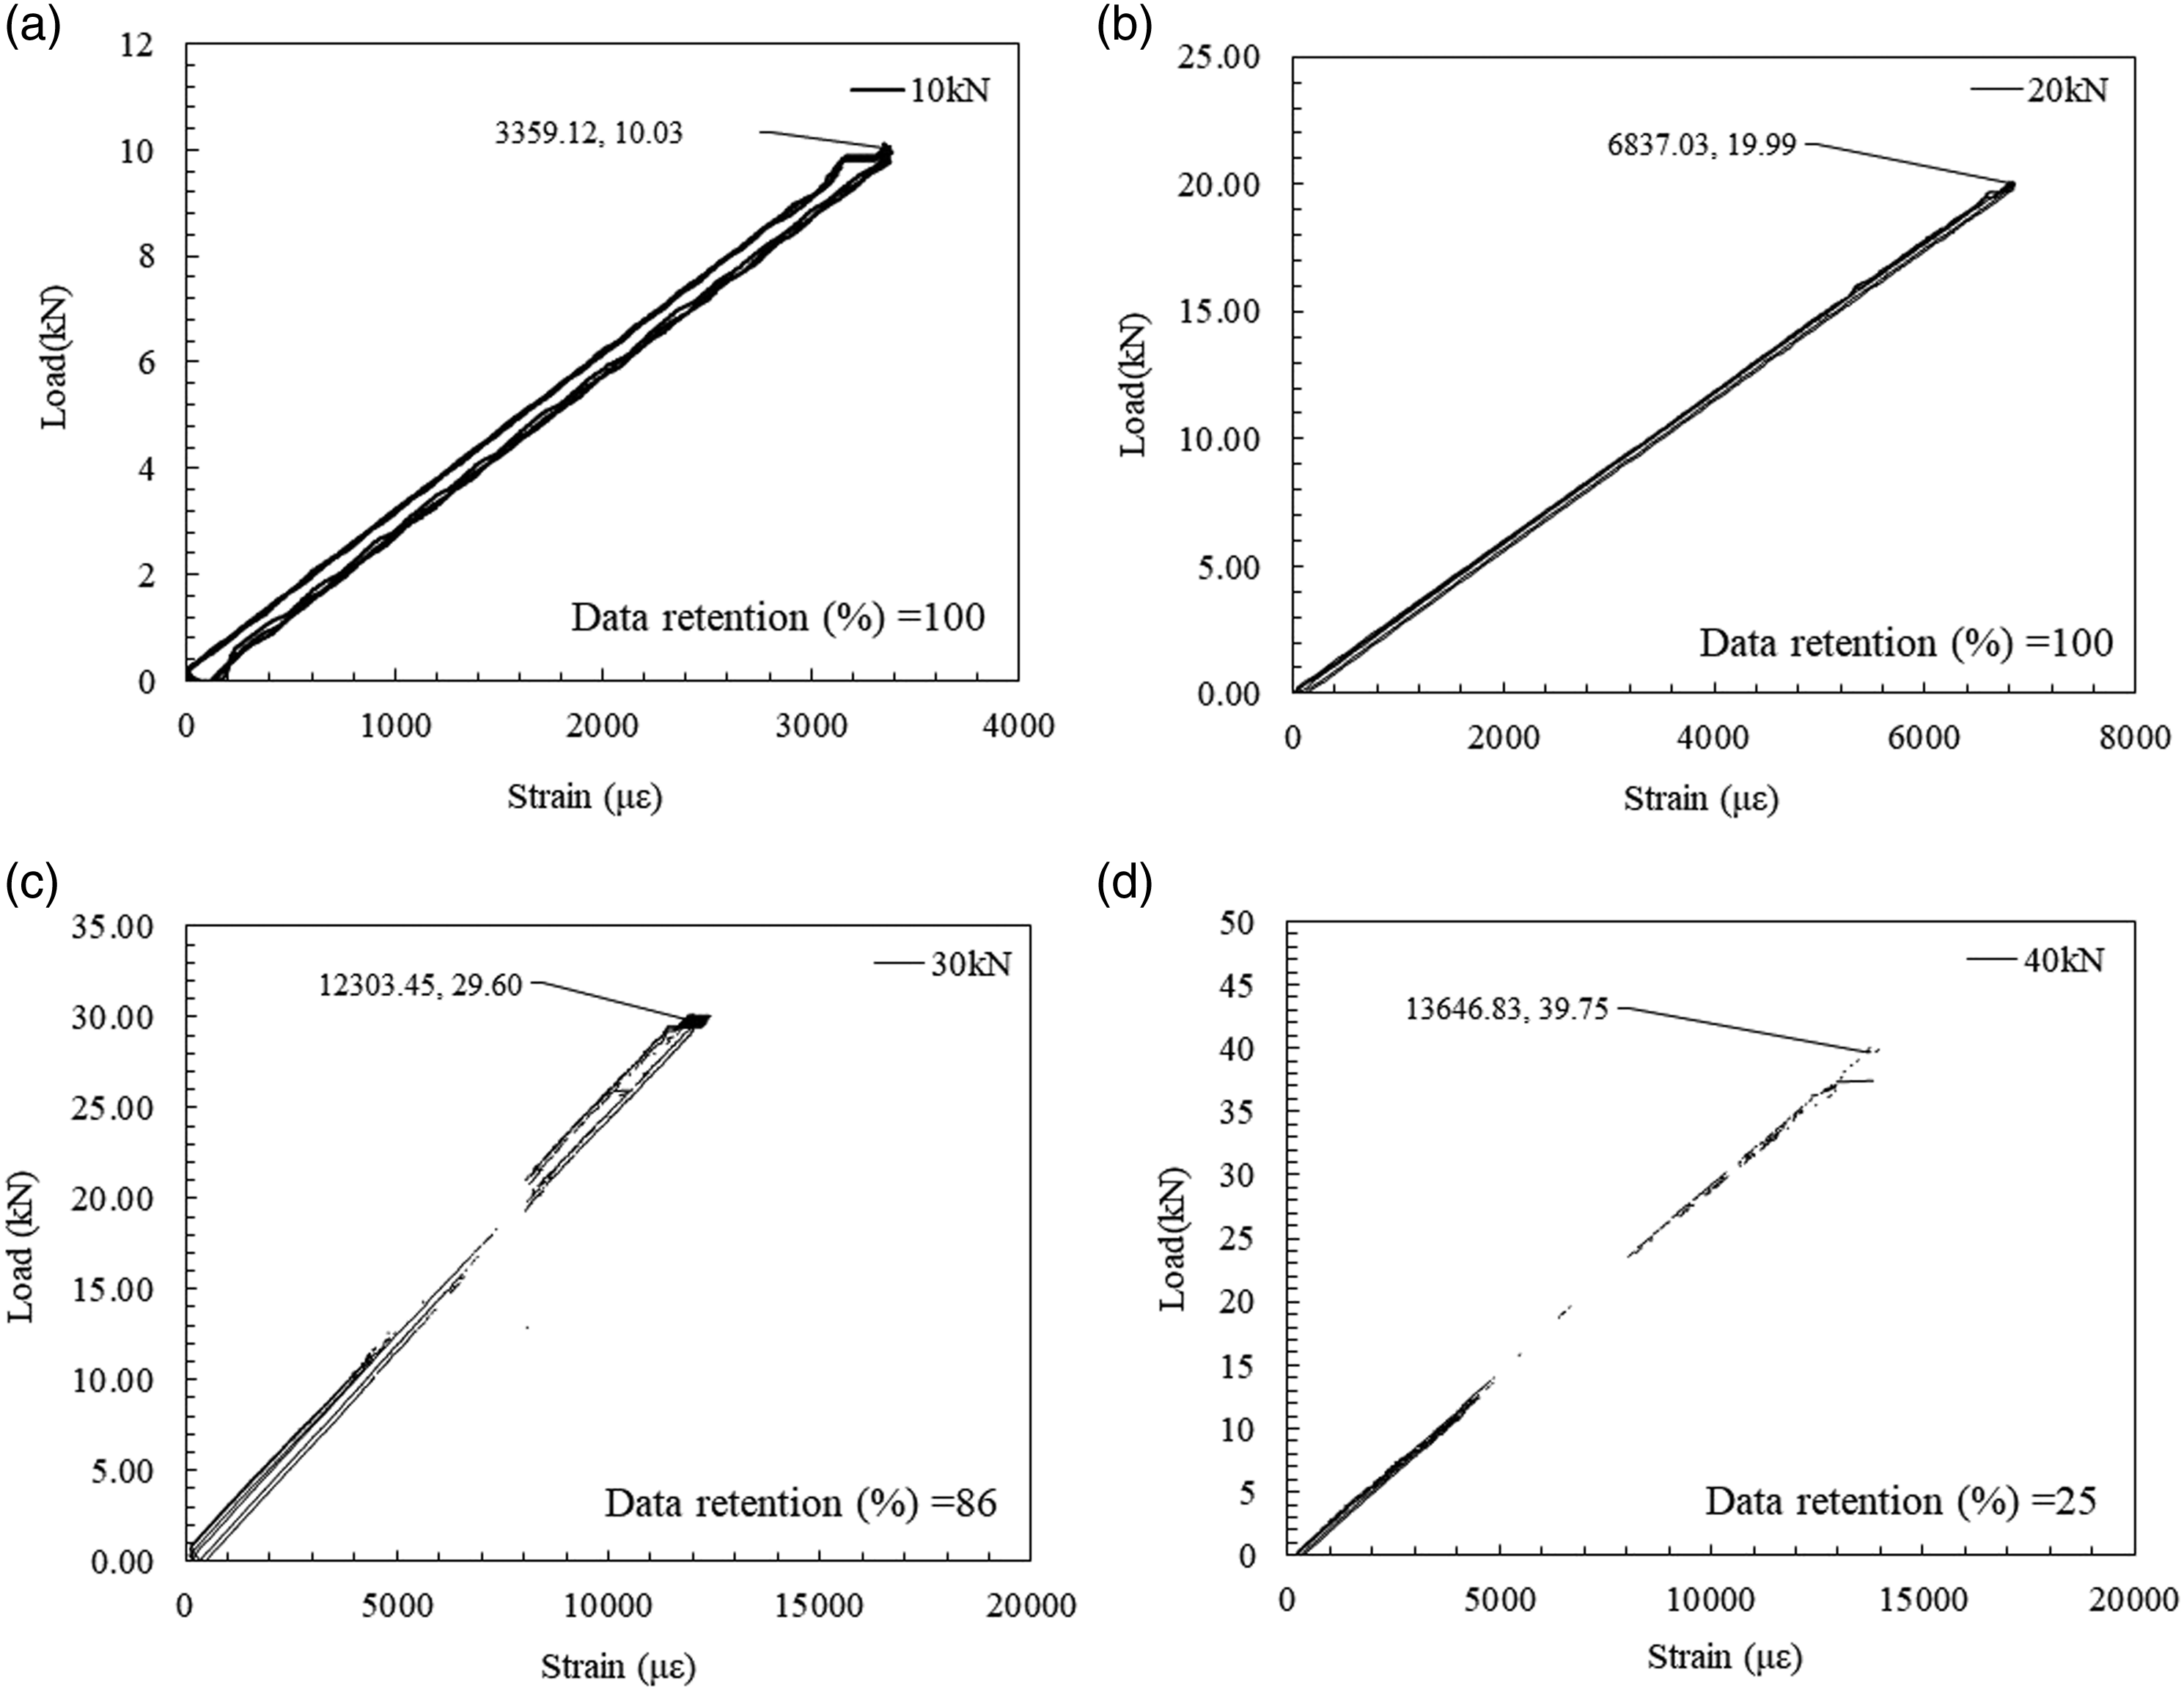
Sensing performance and repeatability of PI coated OF
The strain distributions measured by the embedded PI coated OFs at loads steps from 10 kN to 40 kN in specimens S1 and S3 are shown in Figures 19(a)–(e), respectively. The PI OF in specimen S2 was broken during the installation process and was unable to measure strains. The specimens S1 and S3 failed at 41 kN and 45 kN loads, respectively, and the PI OFs were functional up to 40 kN load. Qualitatively, the PI OFs measured similar strain distribution inside the two specimens. The region near the ingress and egress points experienced minimum straining, and the mid-section experienced maximum straining. Further, when compared quantitatively the two PI OFs measured similar strain levels inside the two specimens with a difference of 100 µε between their maximum strain values until 30 kN load. However, at 40 kN load when the PI OFs performance deteriorated completely the difference between their maximum strains was 367 µε. Strain distribution measured by the embedded PI OFS under tensile load at load steps of: (a) 10 kN, (b) 15 kN, (c) 20 kN, (d) 30 kN, (e) 40 kN.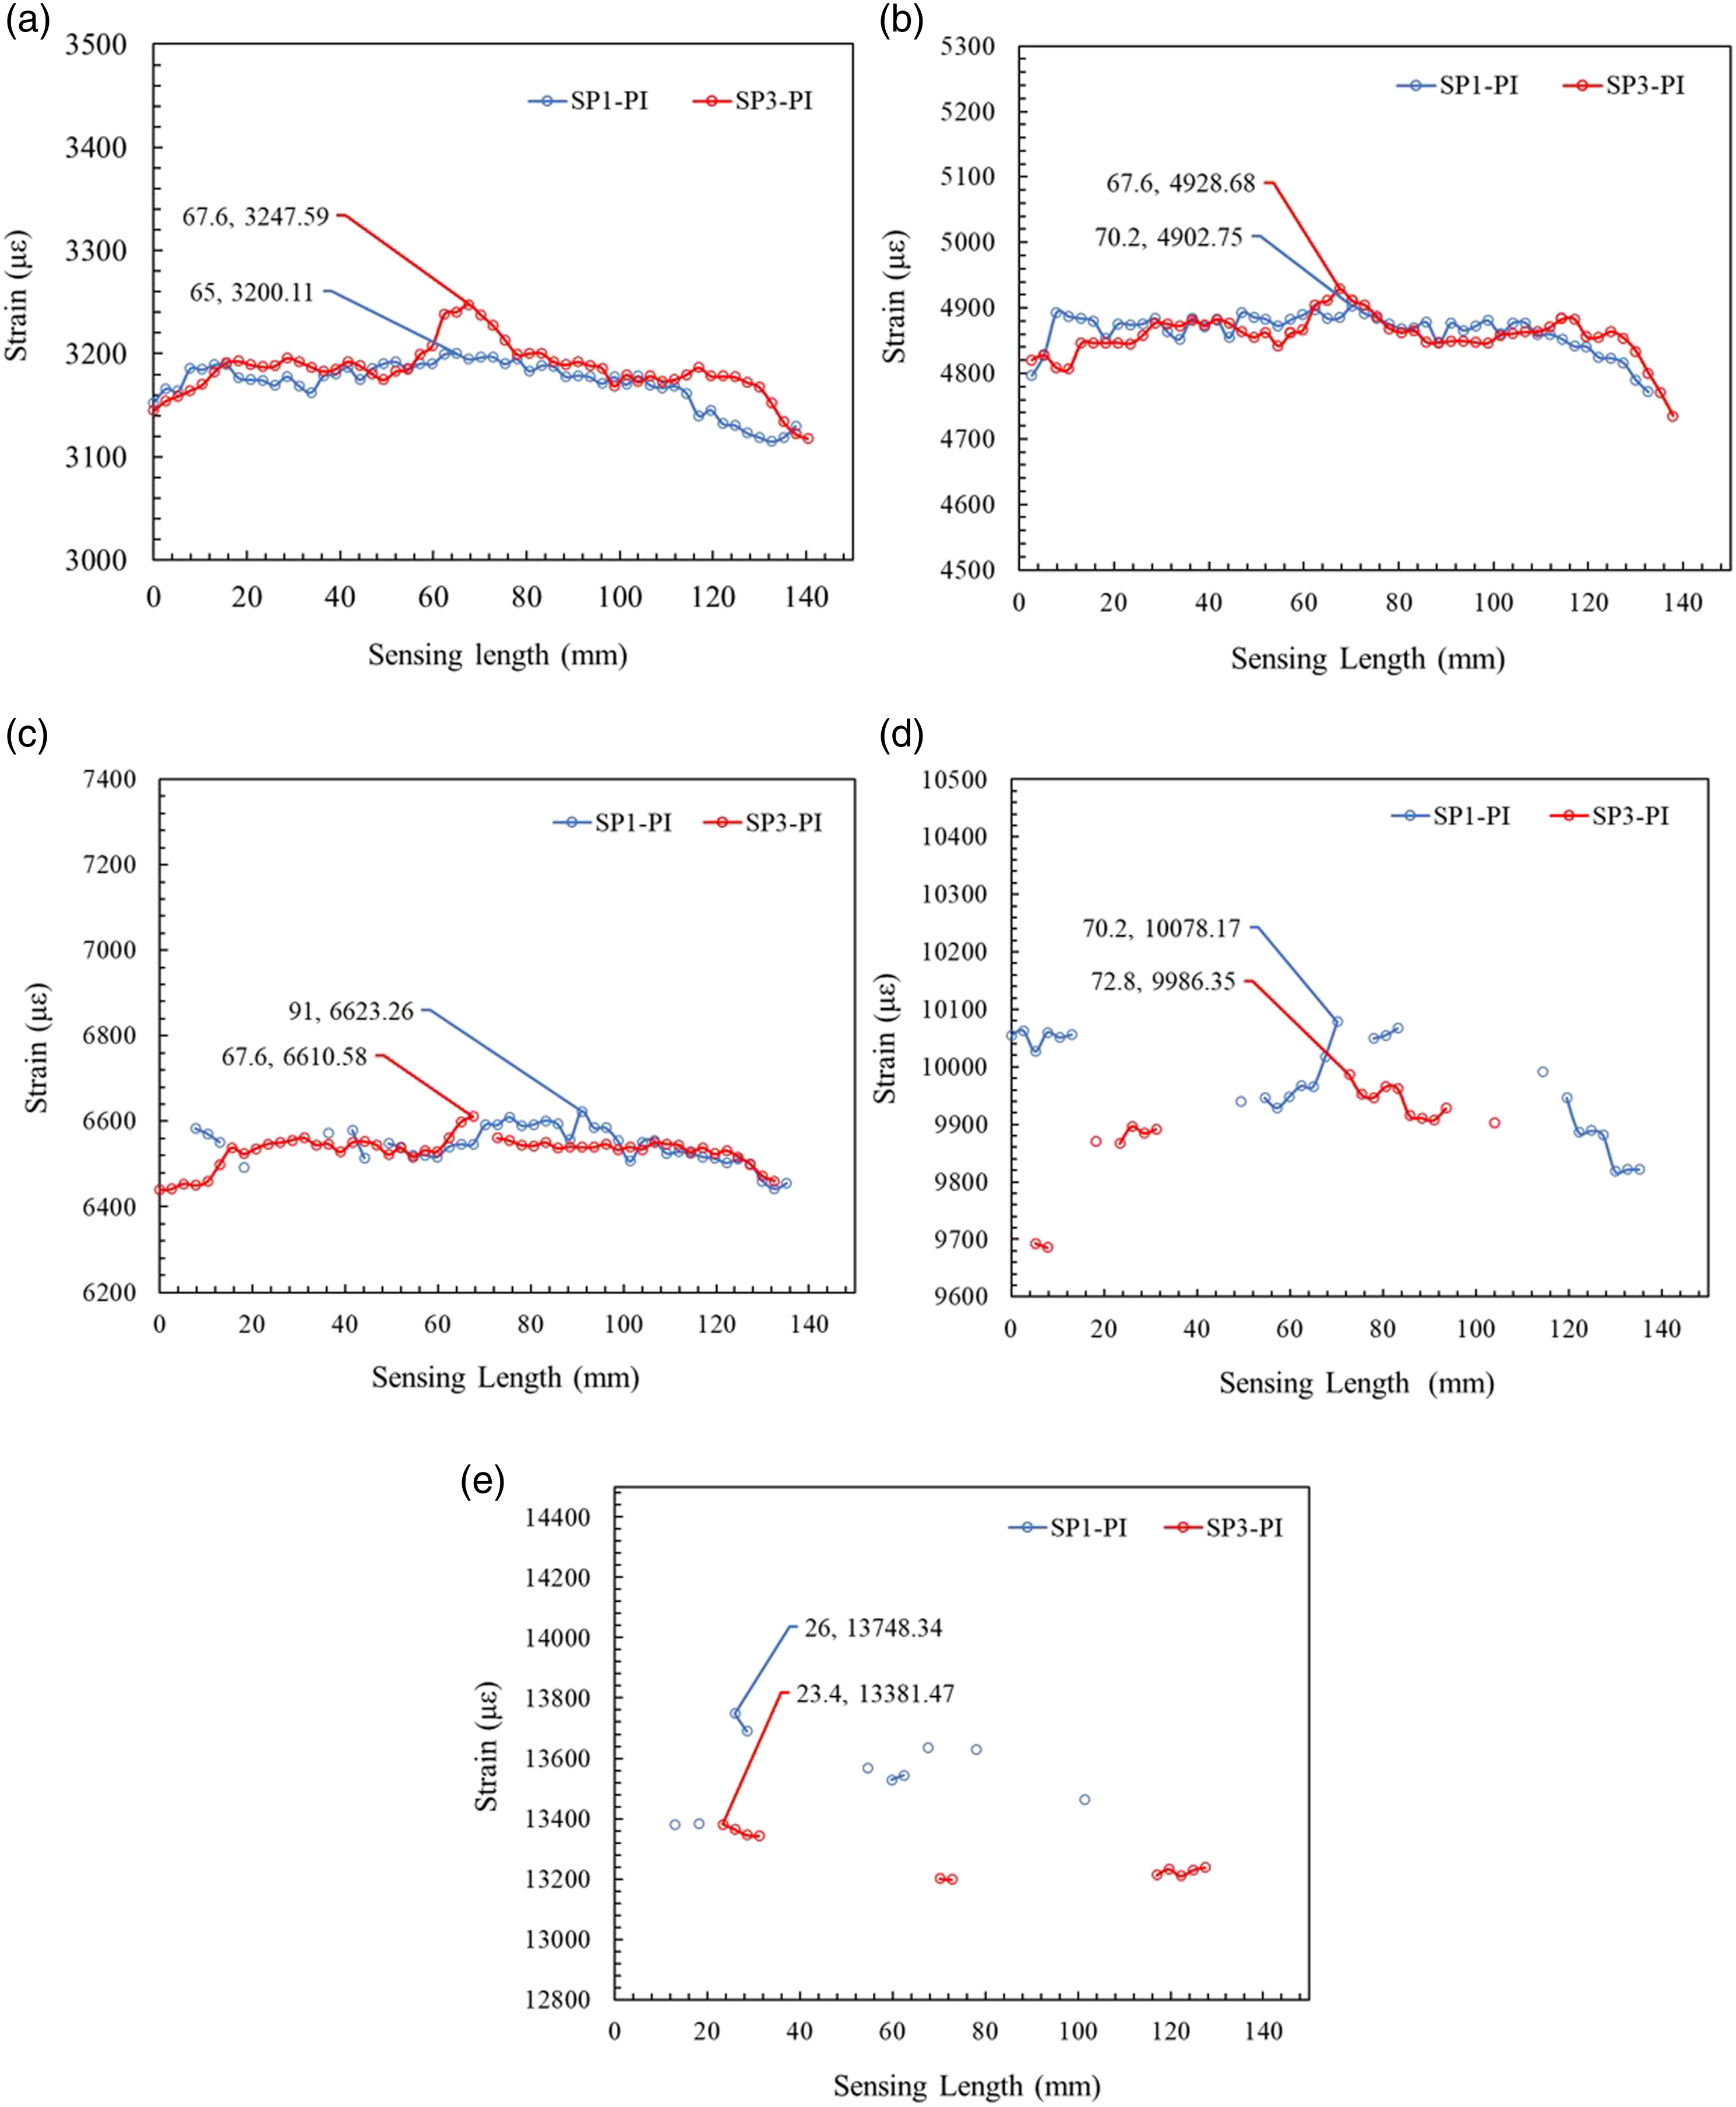
The strain value measured at the location of 70.2 mm in specimen 3 was used for constructing the strain-load hysteresis plot and the data retention percentage for the PI OF. The strain-load hysteresis plot of the PI coated OF for all the load steps are shown in Figures 20(a)–(d), respectively. From the presented plots it can be seen that the PI coated OF was able to measure similar strain hysteresis continuously for the three loading and unloading steps until 20 kN load. In the subsequent load of 30 kN, at a peak strain of 9,943 με the PI OFs performance started to deteriorate while approaching maximum peak load. However, during the three loading and unloading events, the OF measured similar strain magnitude. Further, In the final load step of 40 kN, the OF was unable to measure the strains after 20 kN. However, below the 20 kN load the OF was able to measure the strains continuously for the duration of loading and measured similar strain values. Strain hysteresis measured by the embedded PI OFS under repetitive tensile loading of; (a). 10 kN, (b). 20 kN, (c). 30 kN, (d). 40 kN.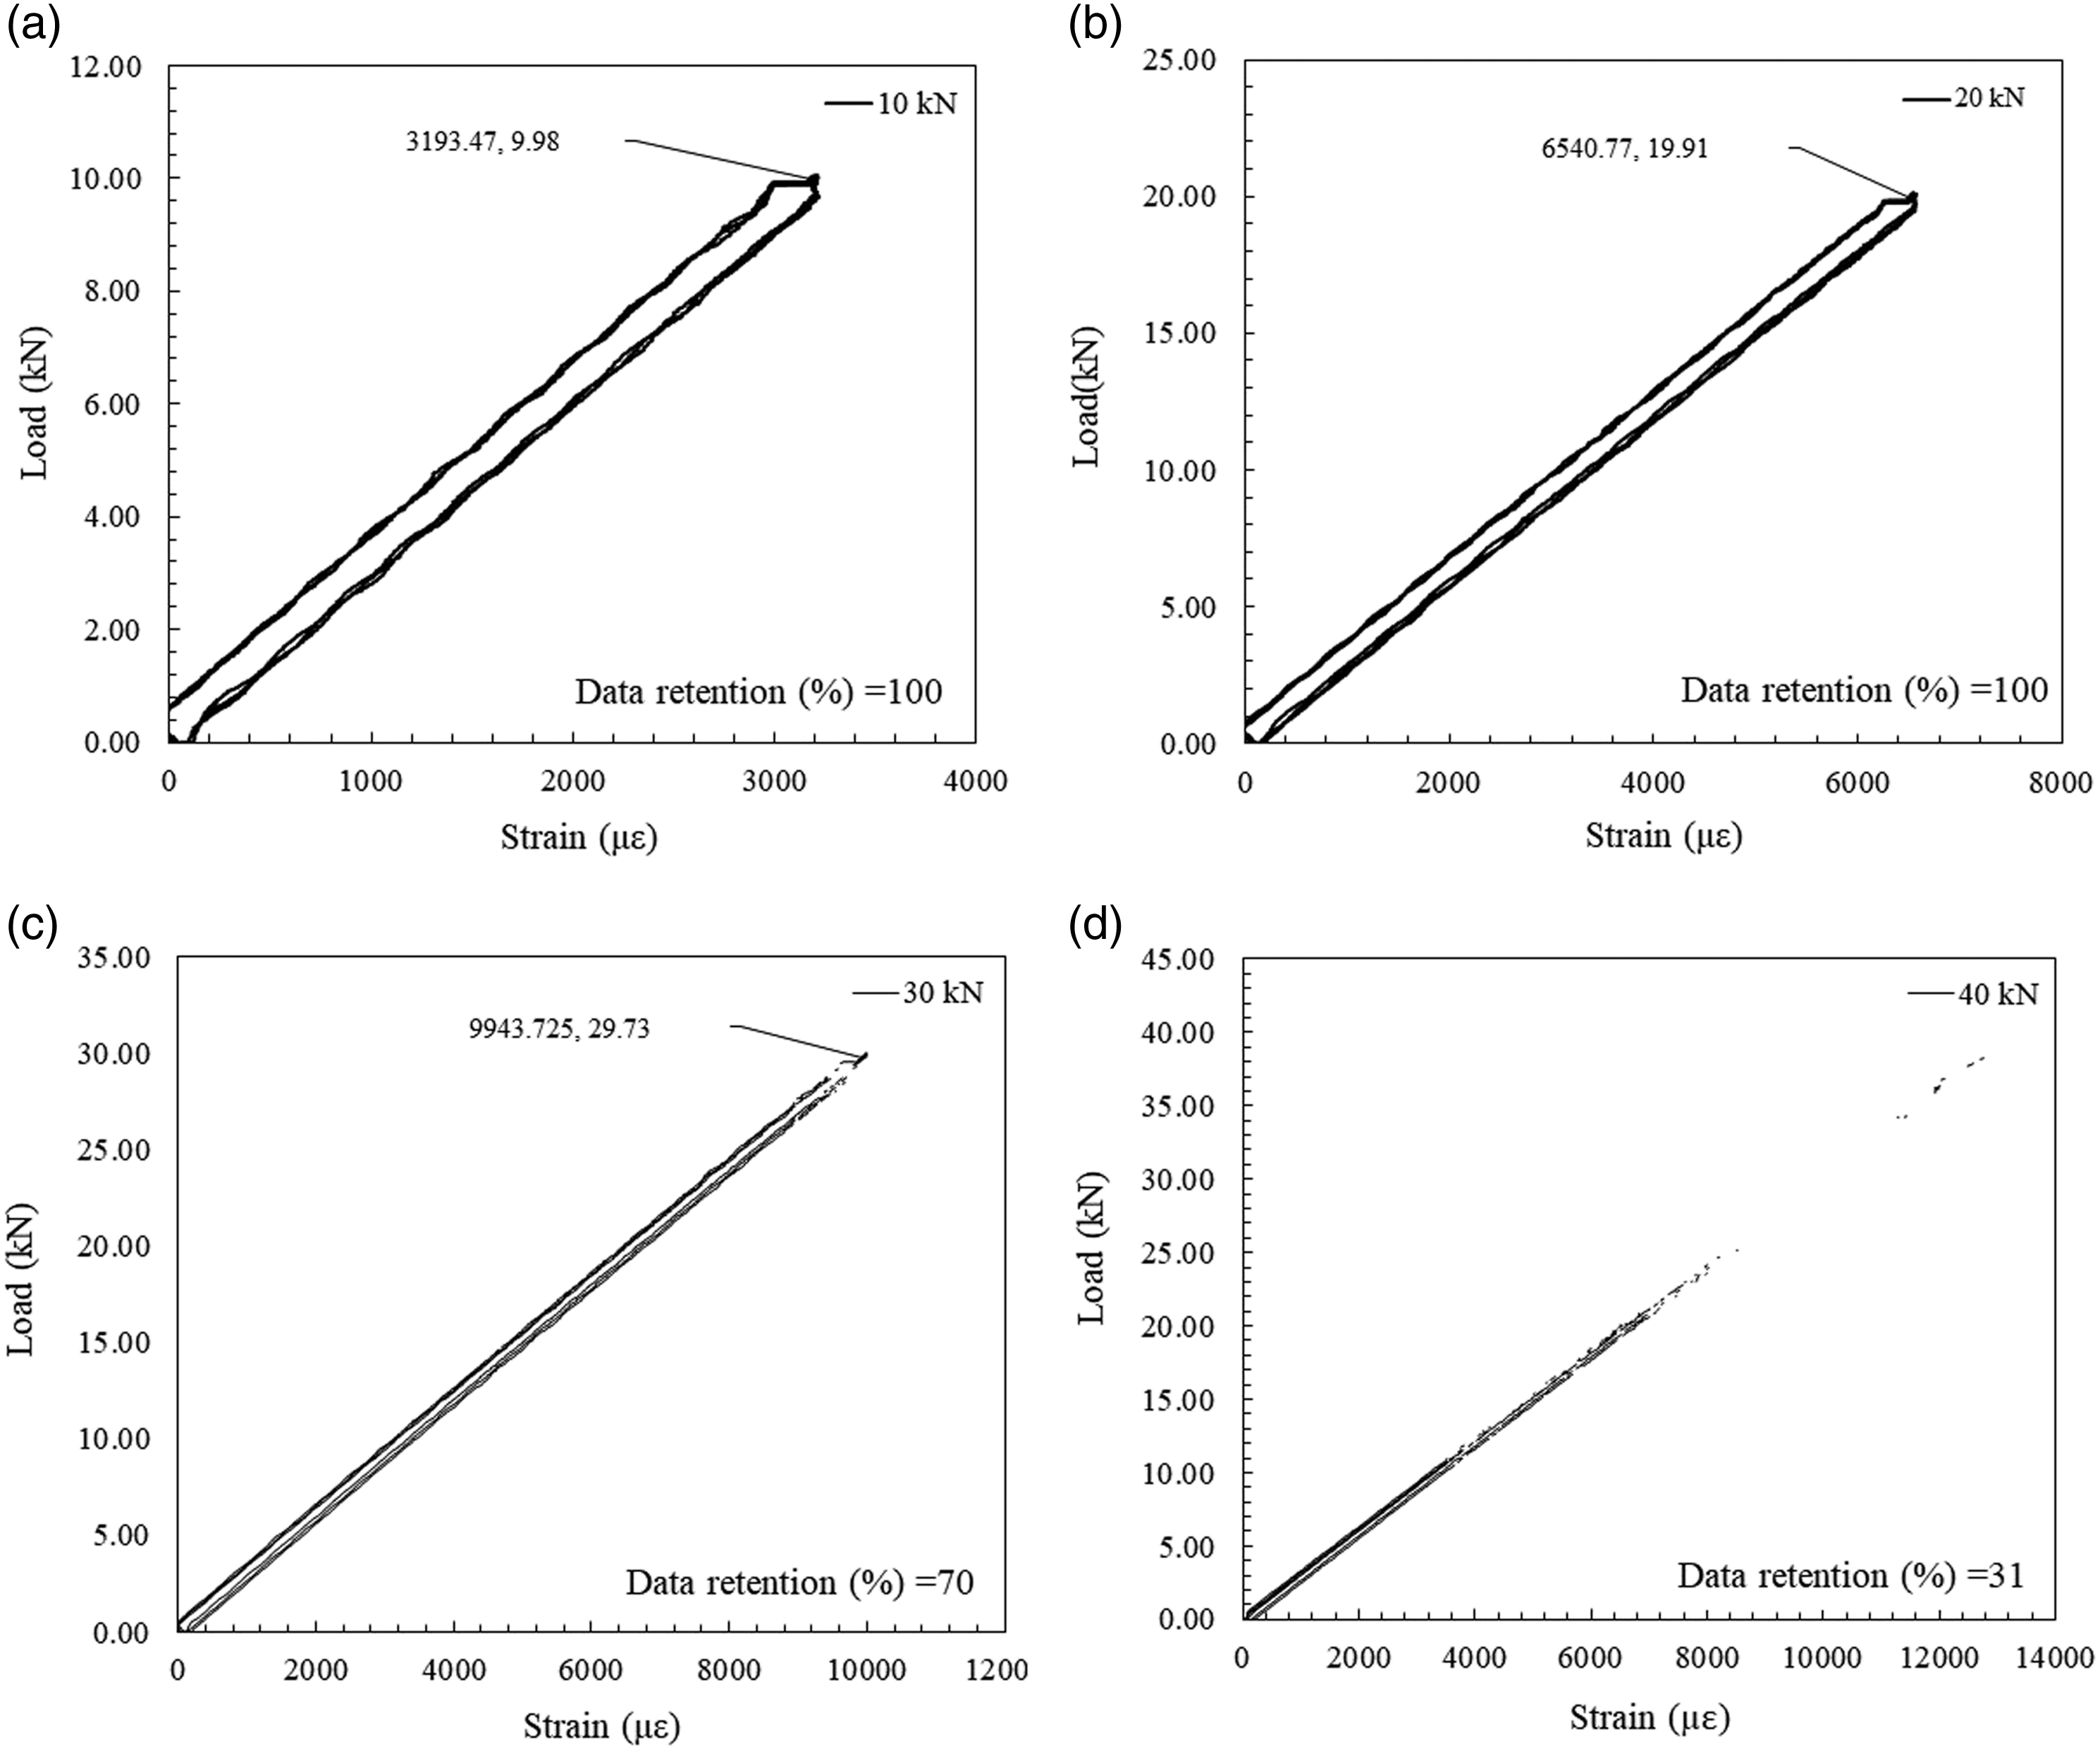
Comparison of strains measured by PEEK and PI coated OFS with strain gauge
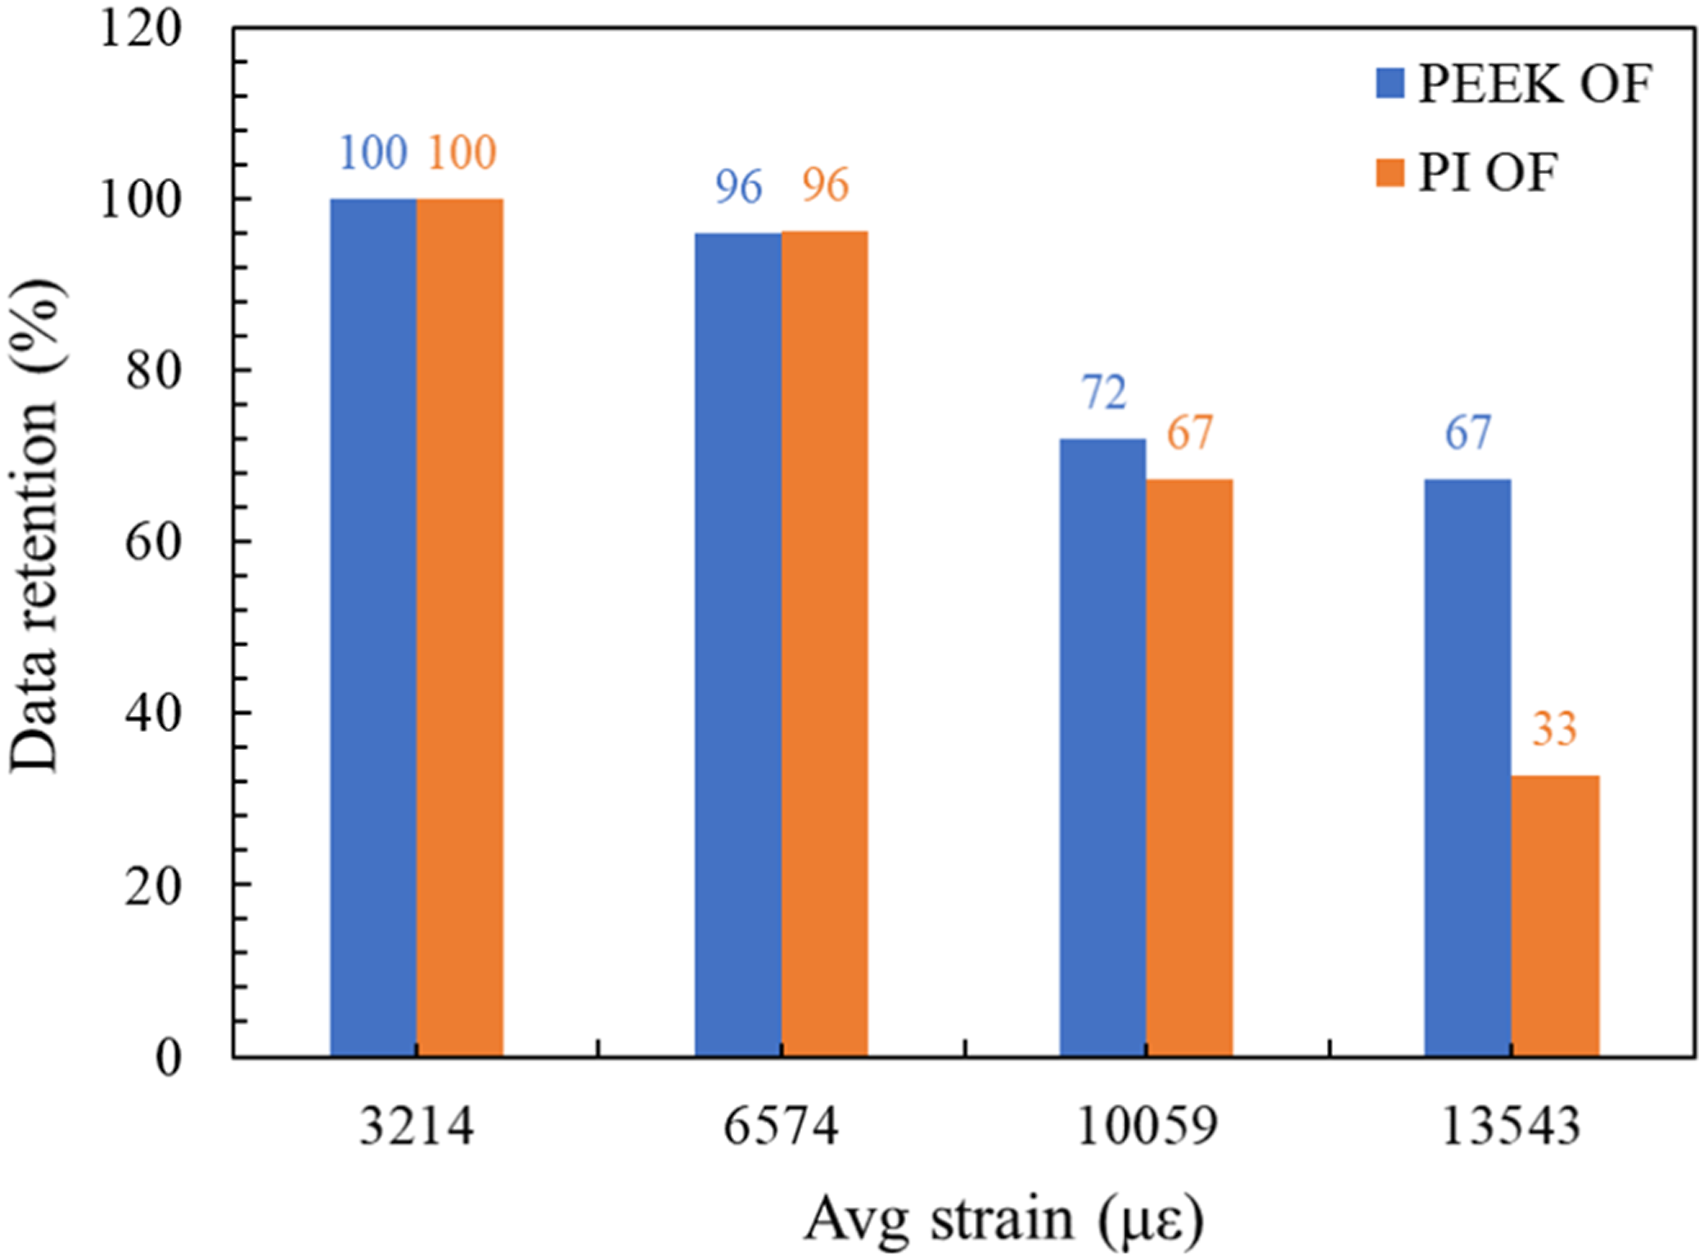
The strain distribution from the PEEK and PI OFs were compared against each other to evaluate their embedded sensing performance against each other. The average strain distribution measured by the embedded PEEK and PI coated OFs along with the average strains from the surface installed FSG measurements from 10 kN to 40 kN load steps, are shown in Figures 21(a)–(d), respectively. From the presented plots, it can be seen that at 20 kN load when the strain levels inside the GFRP specimens were higher than 6,000 με, the optical performance of the PEEK OF started to deteriorate, whereas the PI coated OFs performance started to deteriorate from 30 kN load. However, both the OFs were unable to measure any strains after 40 kN load. A comparison in the percentage of strain data retained by the two OFs along their embedded region at increasing strain levels are summarised in Figure 22. From the plot, it can be seen that at the strain level of 10,000 με the difference in data retention between the two OFSs was 5%. However, at a strain level of 13,500 με the data retention in the PEEK OFS was 76%, while the data retention in the PI coated OFS was 37%. Comparison of the strain distribution measured by the PEEK and PI coated OFSs under static tensile loading of: (a) 10 kN, (b) 20 kN, (c) 30 kN, (d) 40 kN. Comparison of the data retention by the PEEK and PI coated OFSs under varying tensile strain levels.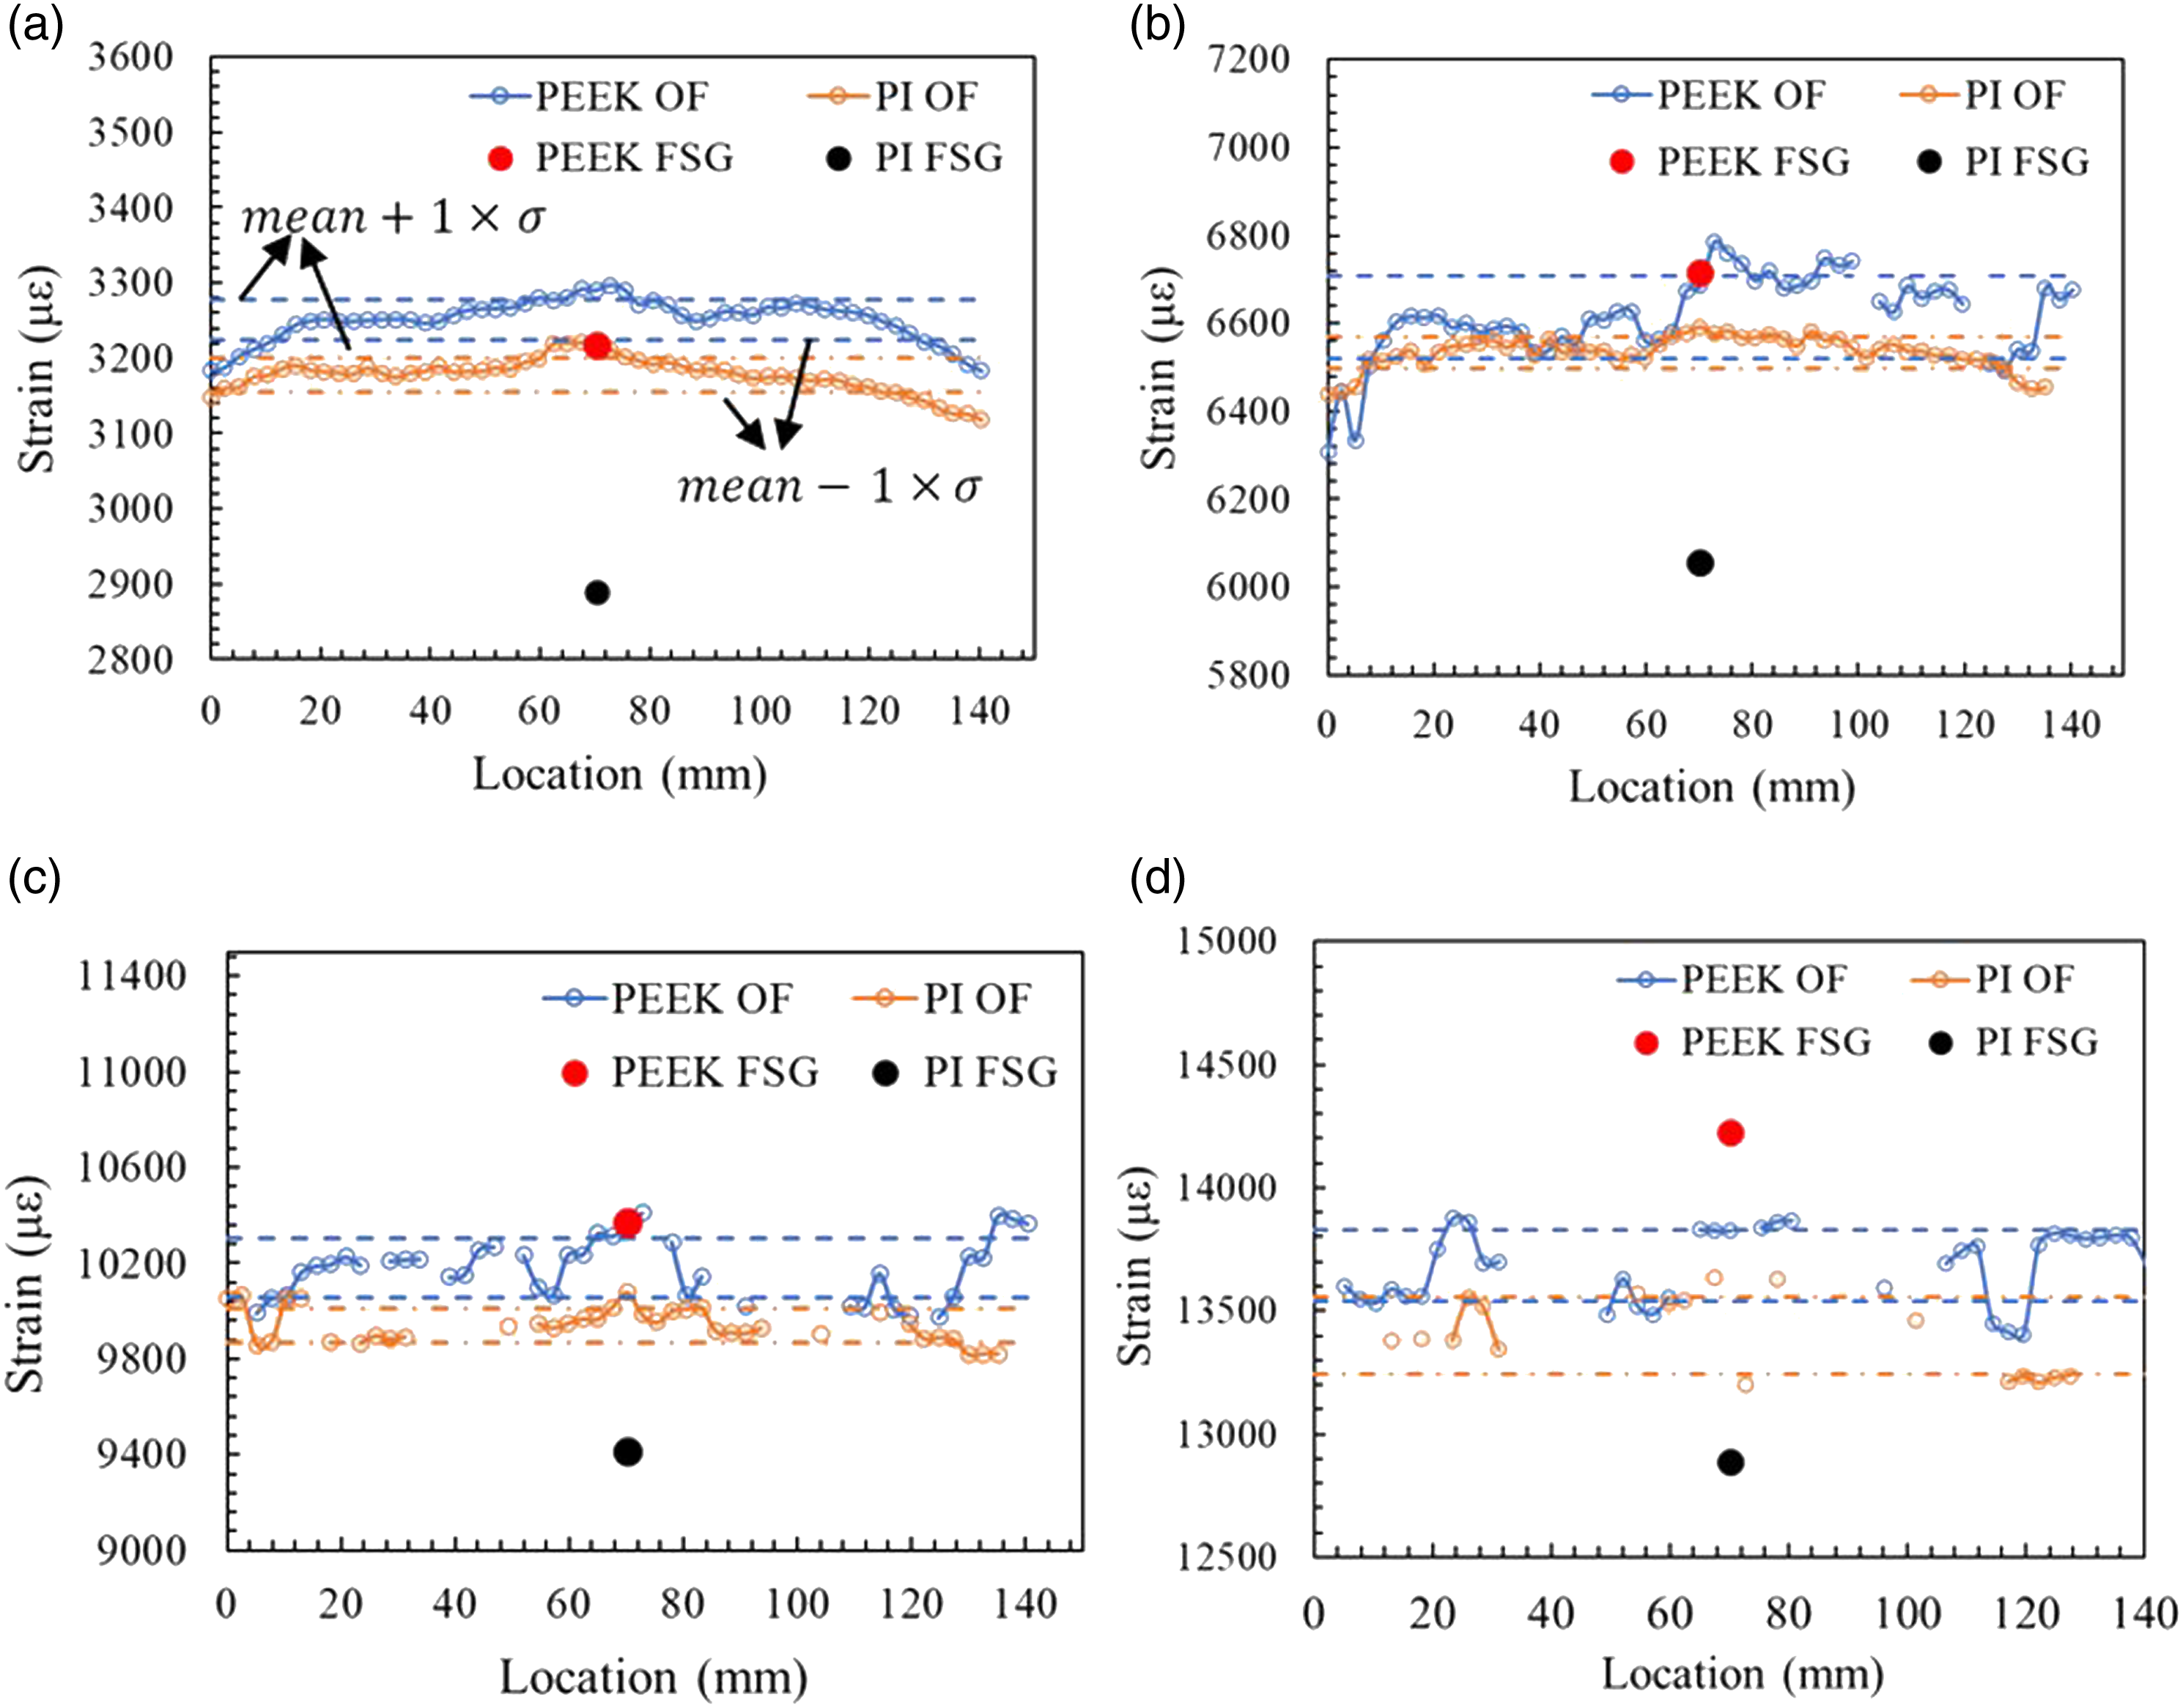
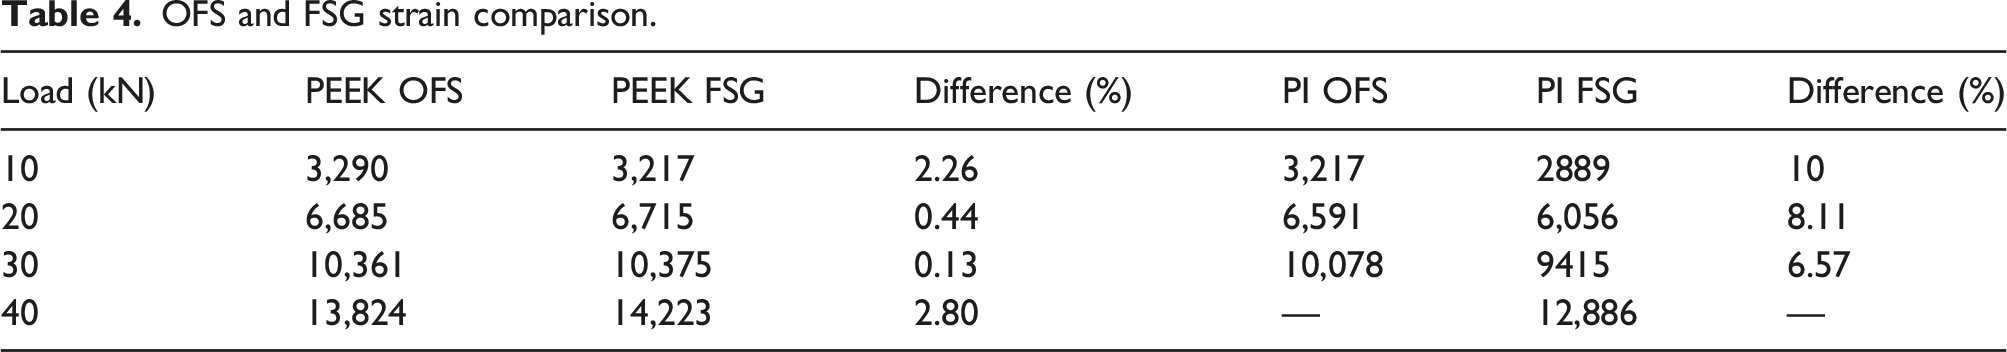
OFS and FSG strain comparison.
Embedded sensor characteristics under flexure load
The internal strain distribution across the length of the PI OFs in three specimens at 50, 150, and 250 N flexural loads levels are shown in Figures 23(a)–(c), respectively. In the presented plots, it can be seen that the GFRP specimens have undergone tensile and compressive straining along a 75 mm length, which correlated with the loading span of 75 mm used in the flexural testing of the specimens. From the strain distribution plots, it can be seen that at minimum load of 50 N the OFs were able to measure both tensile and compressive strain distribution without deterioration in its optical performance. In the next load step of 150 N the tensile performance of the OFs in three specimens was normal. However, the compressive performance started to deteriorate in specimen S2 at locations from 28.6 mm to 46.8 mm, whereas the specimens S1 and S3 were able to measure the compressive strain distribution normally at which the strain levels approached −700 με. Further, in the final load step of 250 N, the magnitude of the tensile and compressive strains in the GFRP specimens ranged from 1,200 με to 1,500 με. At this load level, the embedded OFs sensing performance on the tension side was similar to what was observed during the 150 N load. However, on the compression side the OFs compressive performance deteriorated further in specimen 1 and specimen 2, whereas in specimen 3 the OF functioned optimally. Tensile and compression strains measured by the OFS at load levels of; (a) 50 N, (b) 150 N, (c) 250 N.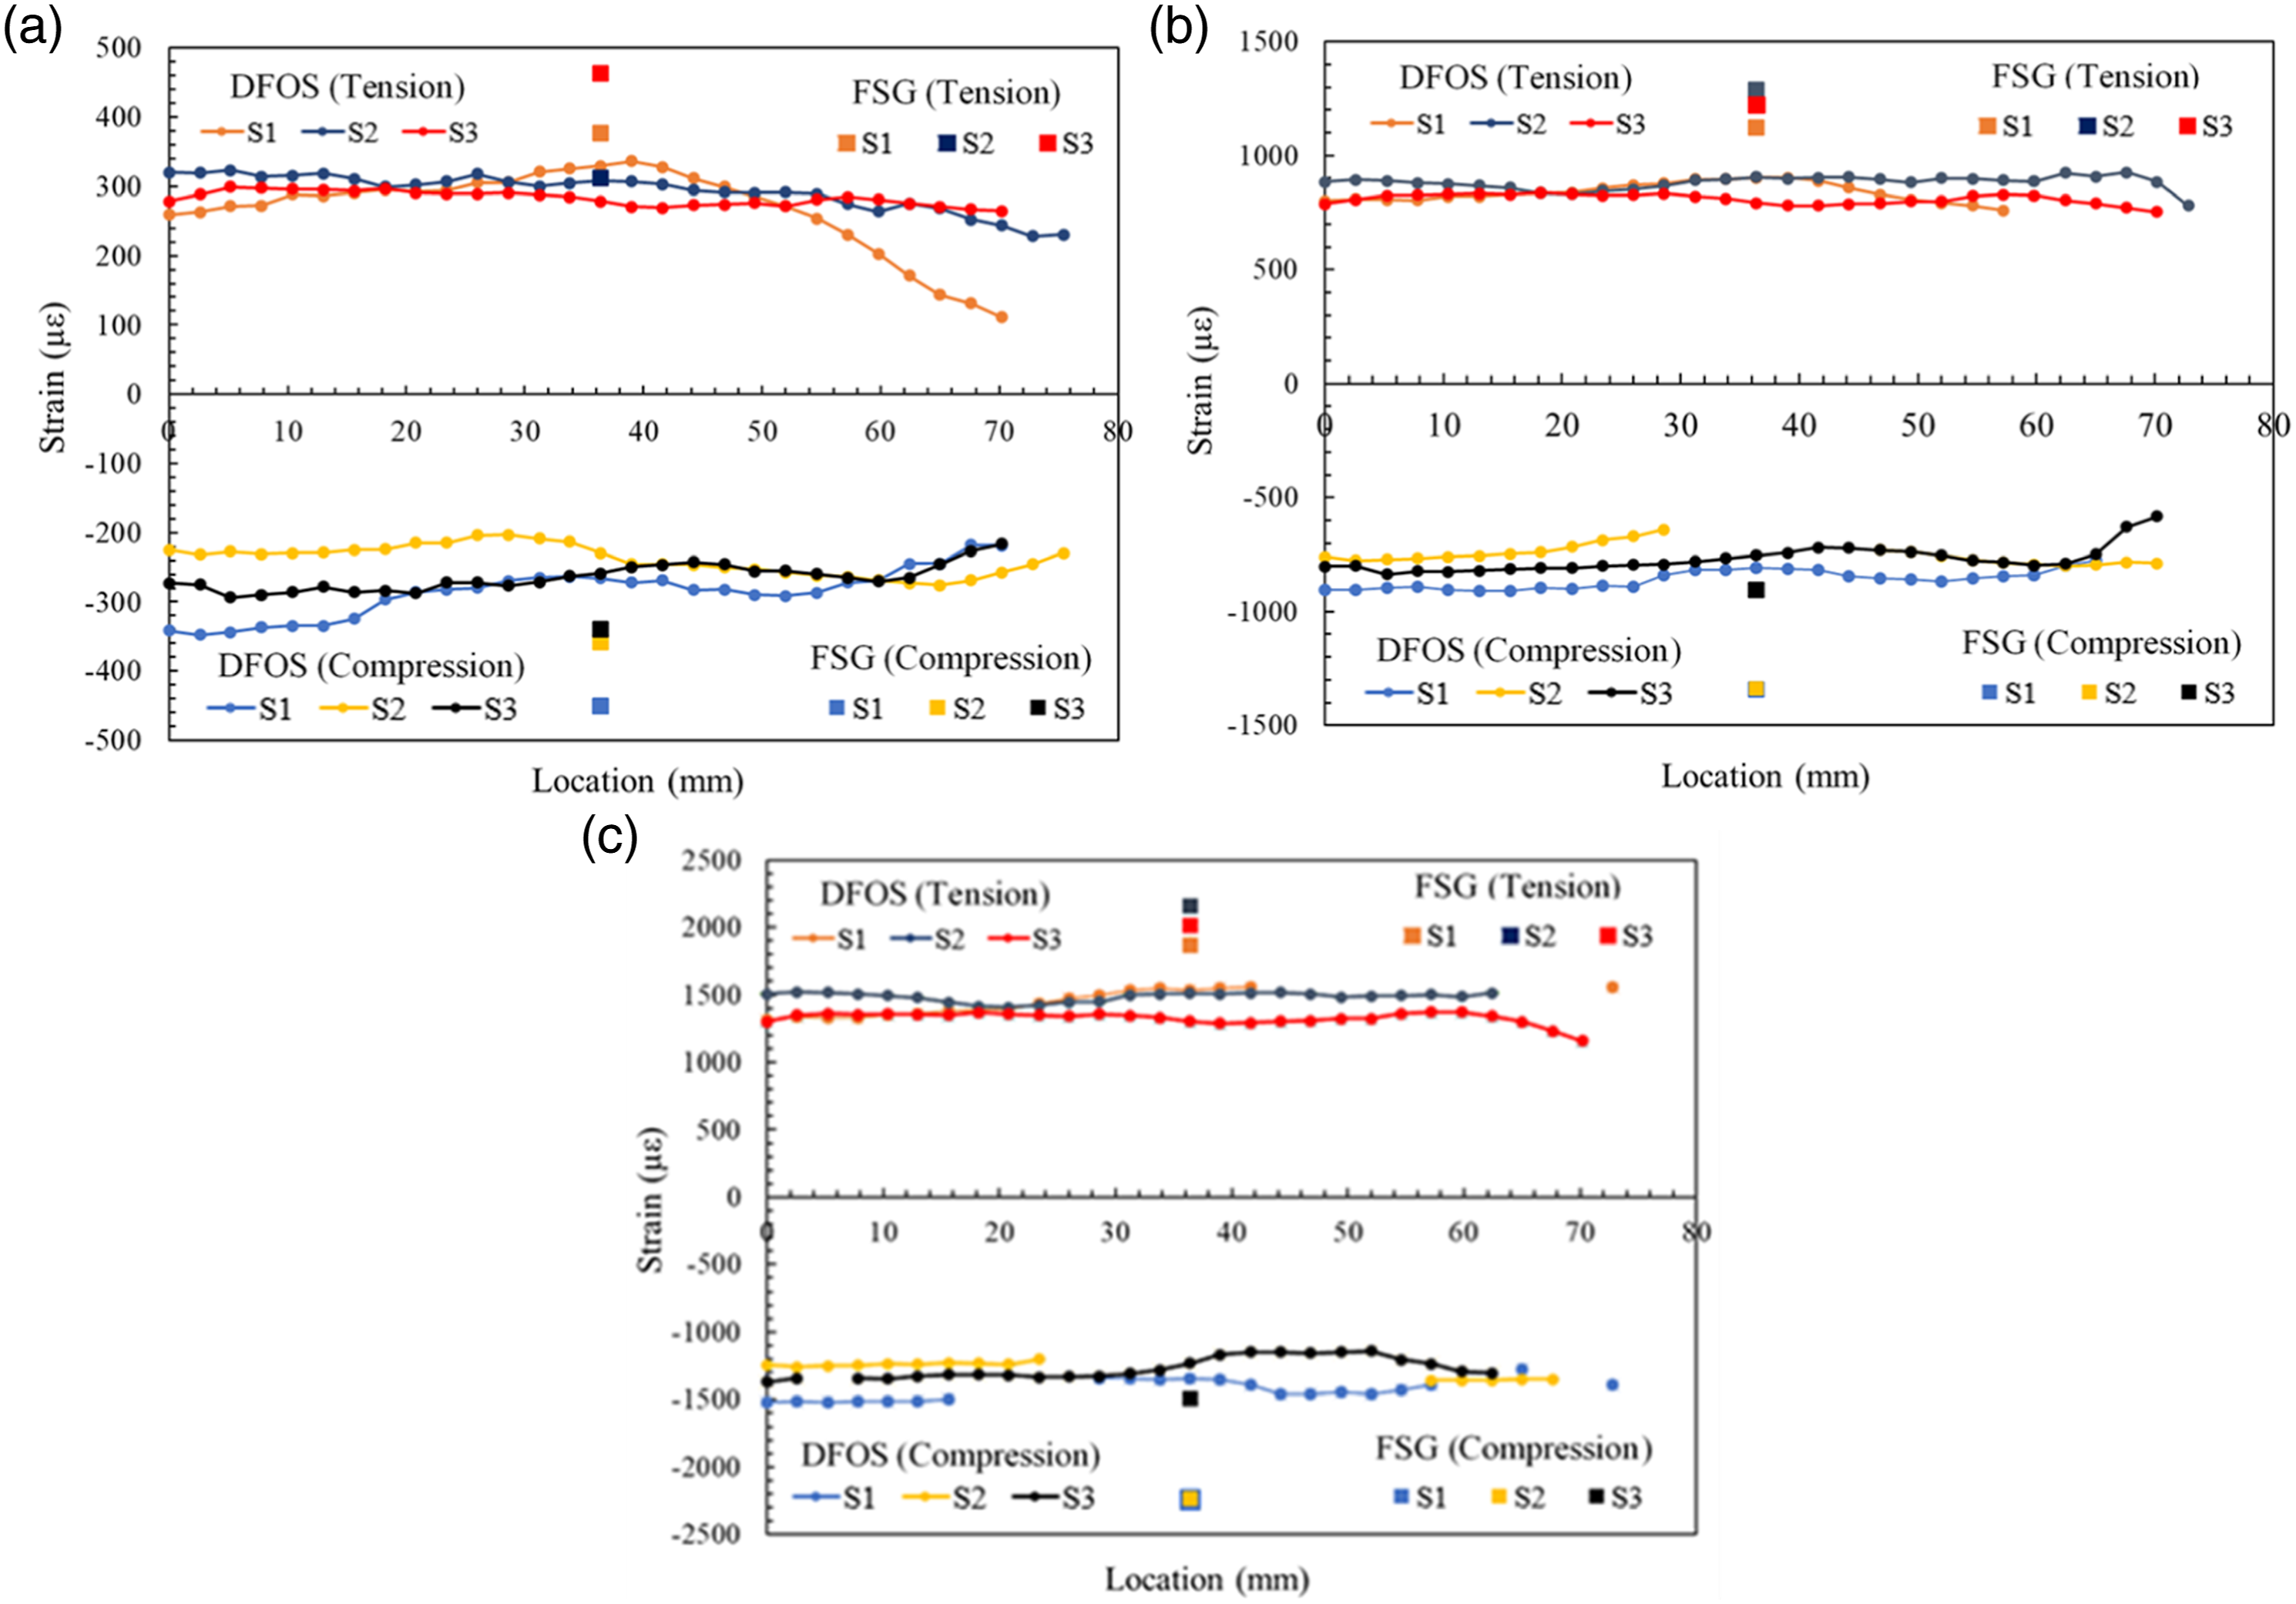
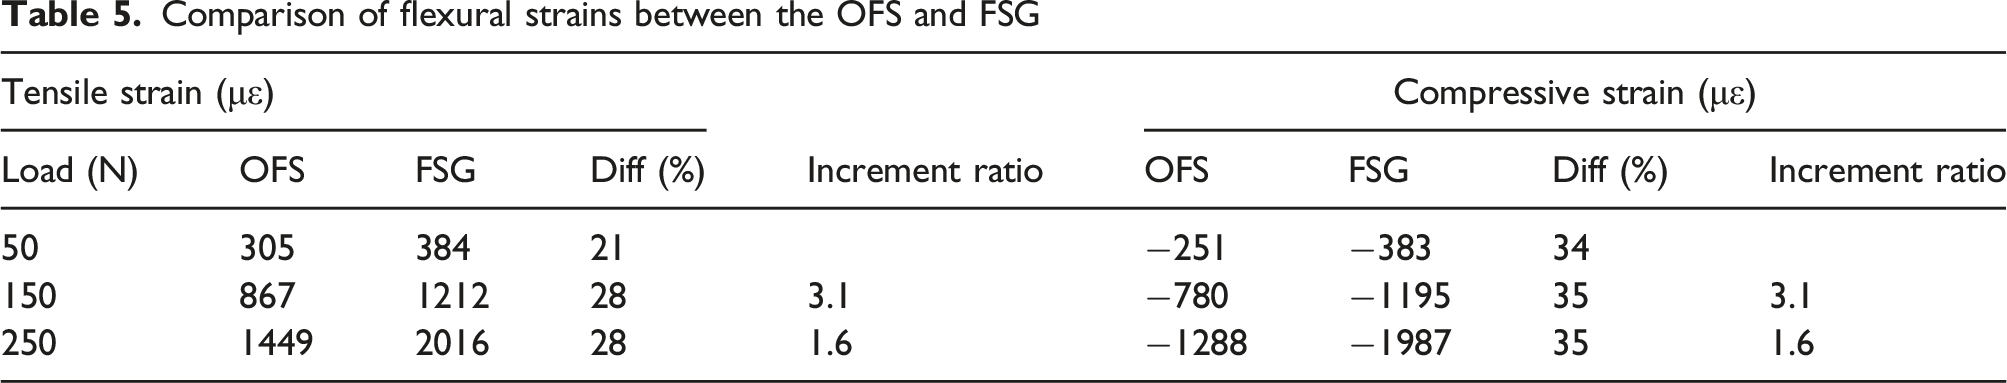
Comparison of flexural strains between the OFS and FSG
Morphology of the embedded OFSs
GFRP specimen with PEEK OFS
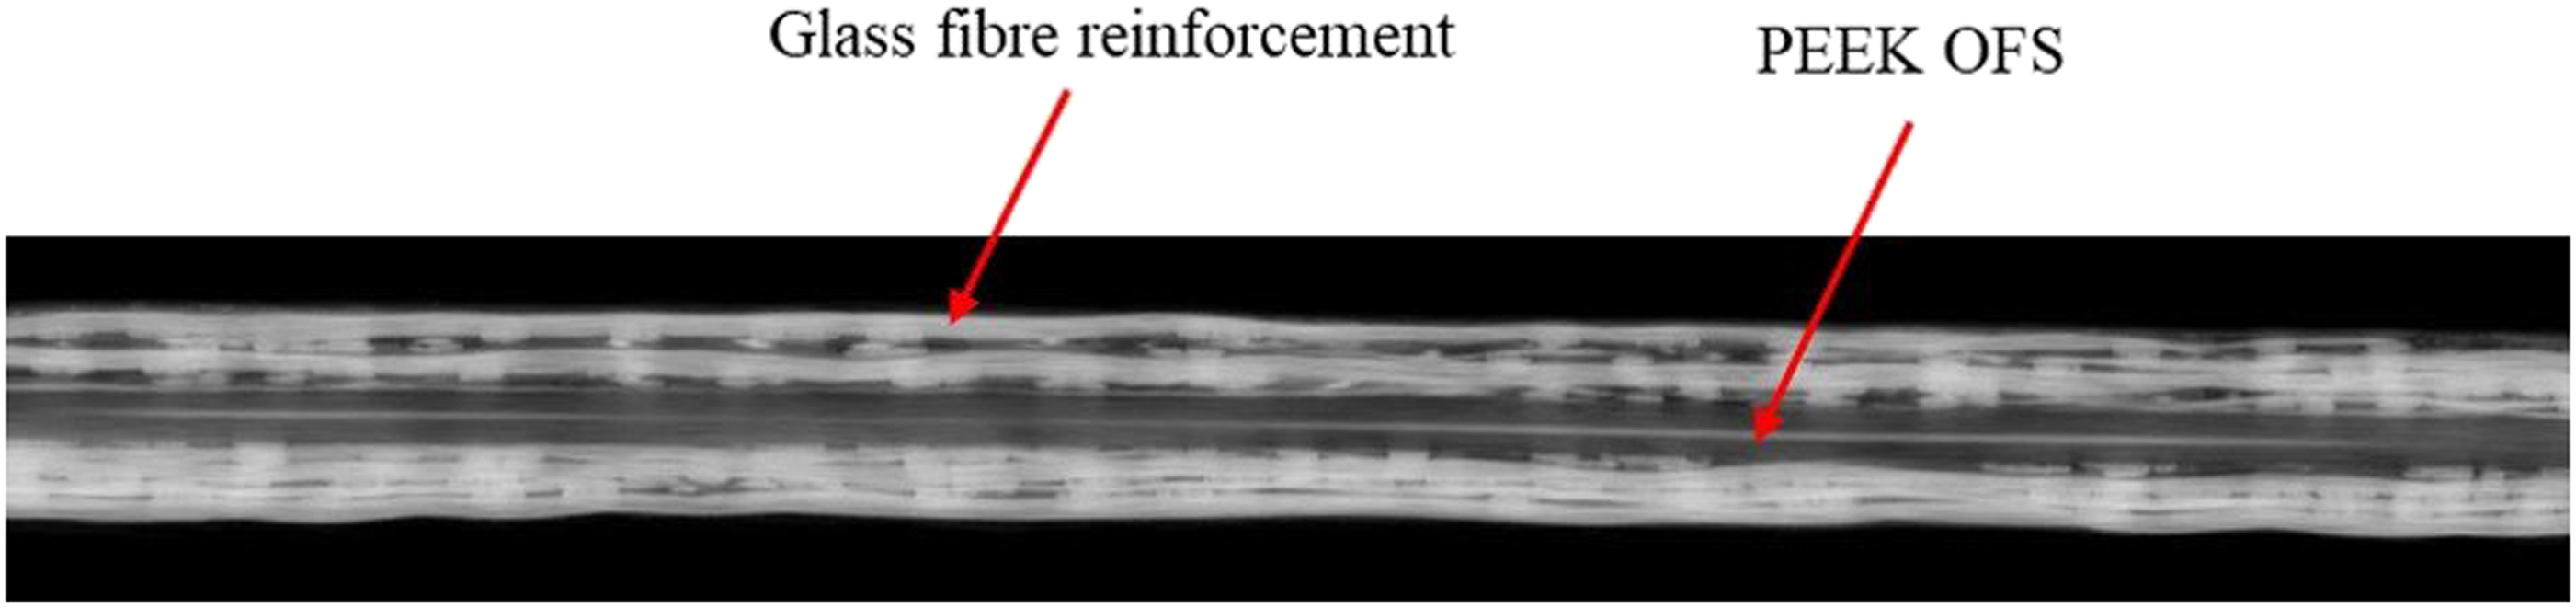
tThe µ-CT images of the GFRP specimen containing PEEK coated OF are shown in Figure 24 and Figure 25. The cross-sectional images along the XY plane were obtained continuously for 50 mm length. However, for ease of representation, only three samples of the images of the scanned specimens are shown here. By analysing the images in Figure 24, no change to the embedded OF diameter was detected, indicating that the embedded OF can resist the deformation the consolidation forces of the VRI manufacturing process. However, some intrusions such as voids, resin concentrated areas, and glass fibre reinforcement waviness were detected at various locations inside the specimen, as highlighted in Figures 24(a)–(c). In addition to the identified defects, the waviness of the glass fibre reinforcements can be observed in Figure 25. The detected intrusions may act as a potential weak spot that can degrade the structural performance of the host composite structure. Cross-section of the PEEK OFS embedded GFRP specimen along the XY plane. Cross-section of the PEEK OFS embedded GFRP specimen along the YZ plane.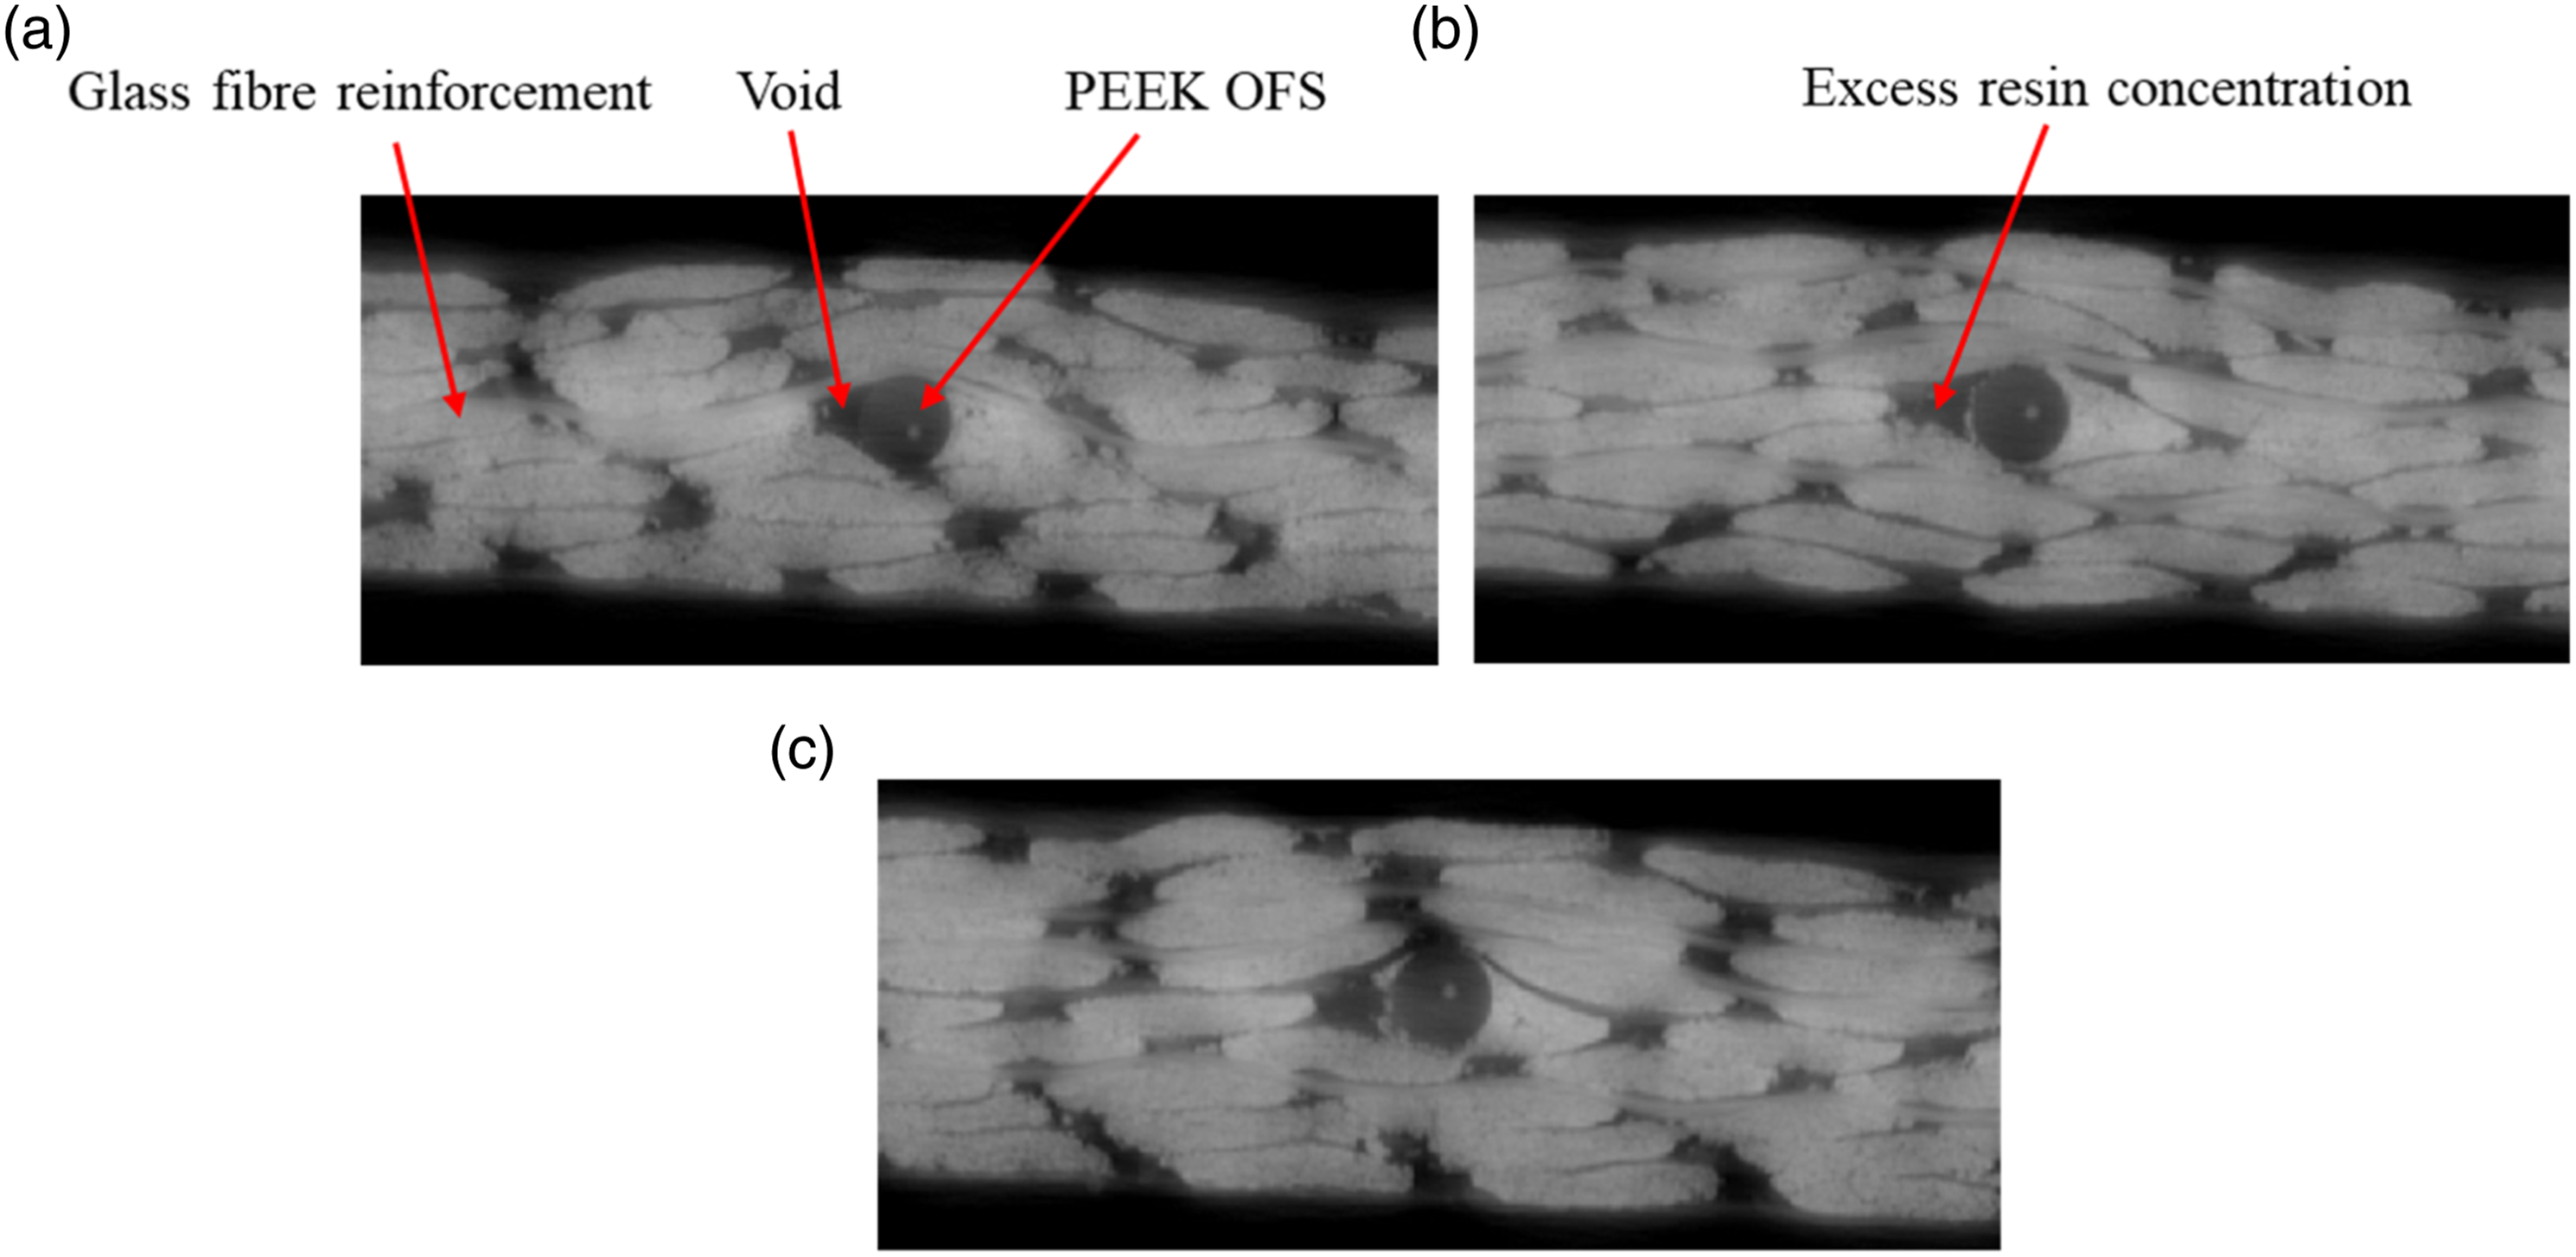
GFRP specimen with PI coated OFS
The micro-CT images of the GFRP specimen embedded with PI coated OF along the XY plane are shown in Figure 26. The location of the embedded PI coated OF, and the glass fibre reinforcements are also highlighted in Figure 26. From the presented image, it can be seen that the PI coated OF is cushioned within the glass fibre reinforcements and when compared with the images in Figure 24 and Figure 25, no large intrusions to the host GFRP structure near the PI OF region can be seen. The presence of the intact OF with its core and coating along the scanned length of the specimen suggests that the PI coating can also resist the consolidation forces and chemical reactions generated during the VRI fabrication process. However, the changes to the PI OFS cross-section and its morphology could not be determined due to the low voxel resolution of the scanned images and requires further investigation. Cross-section of the PI OFS embedded GFRP specimen along the XY Plane.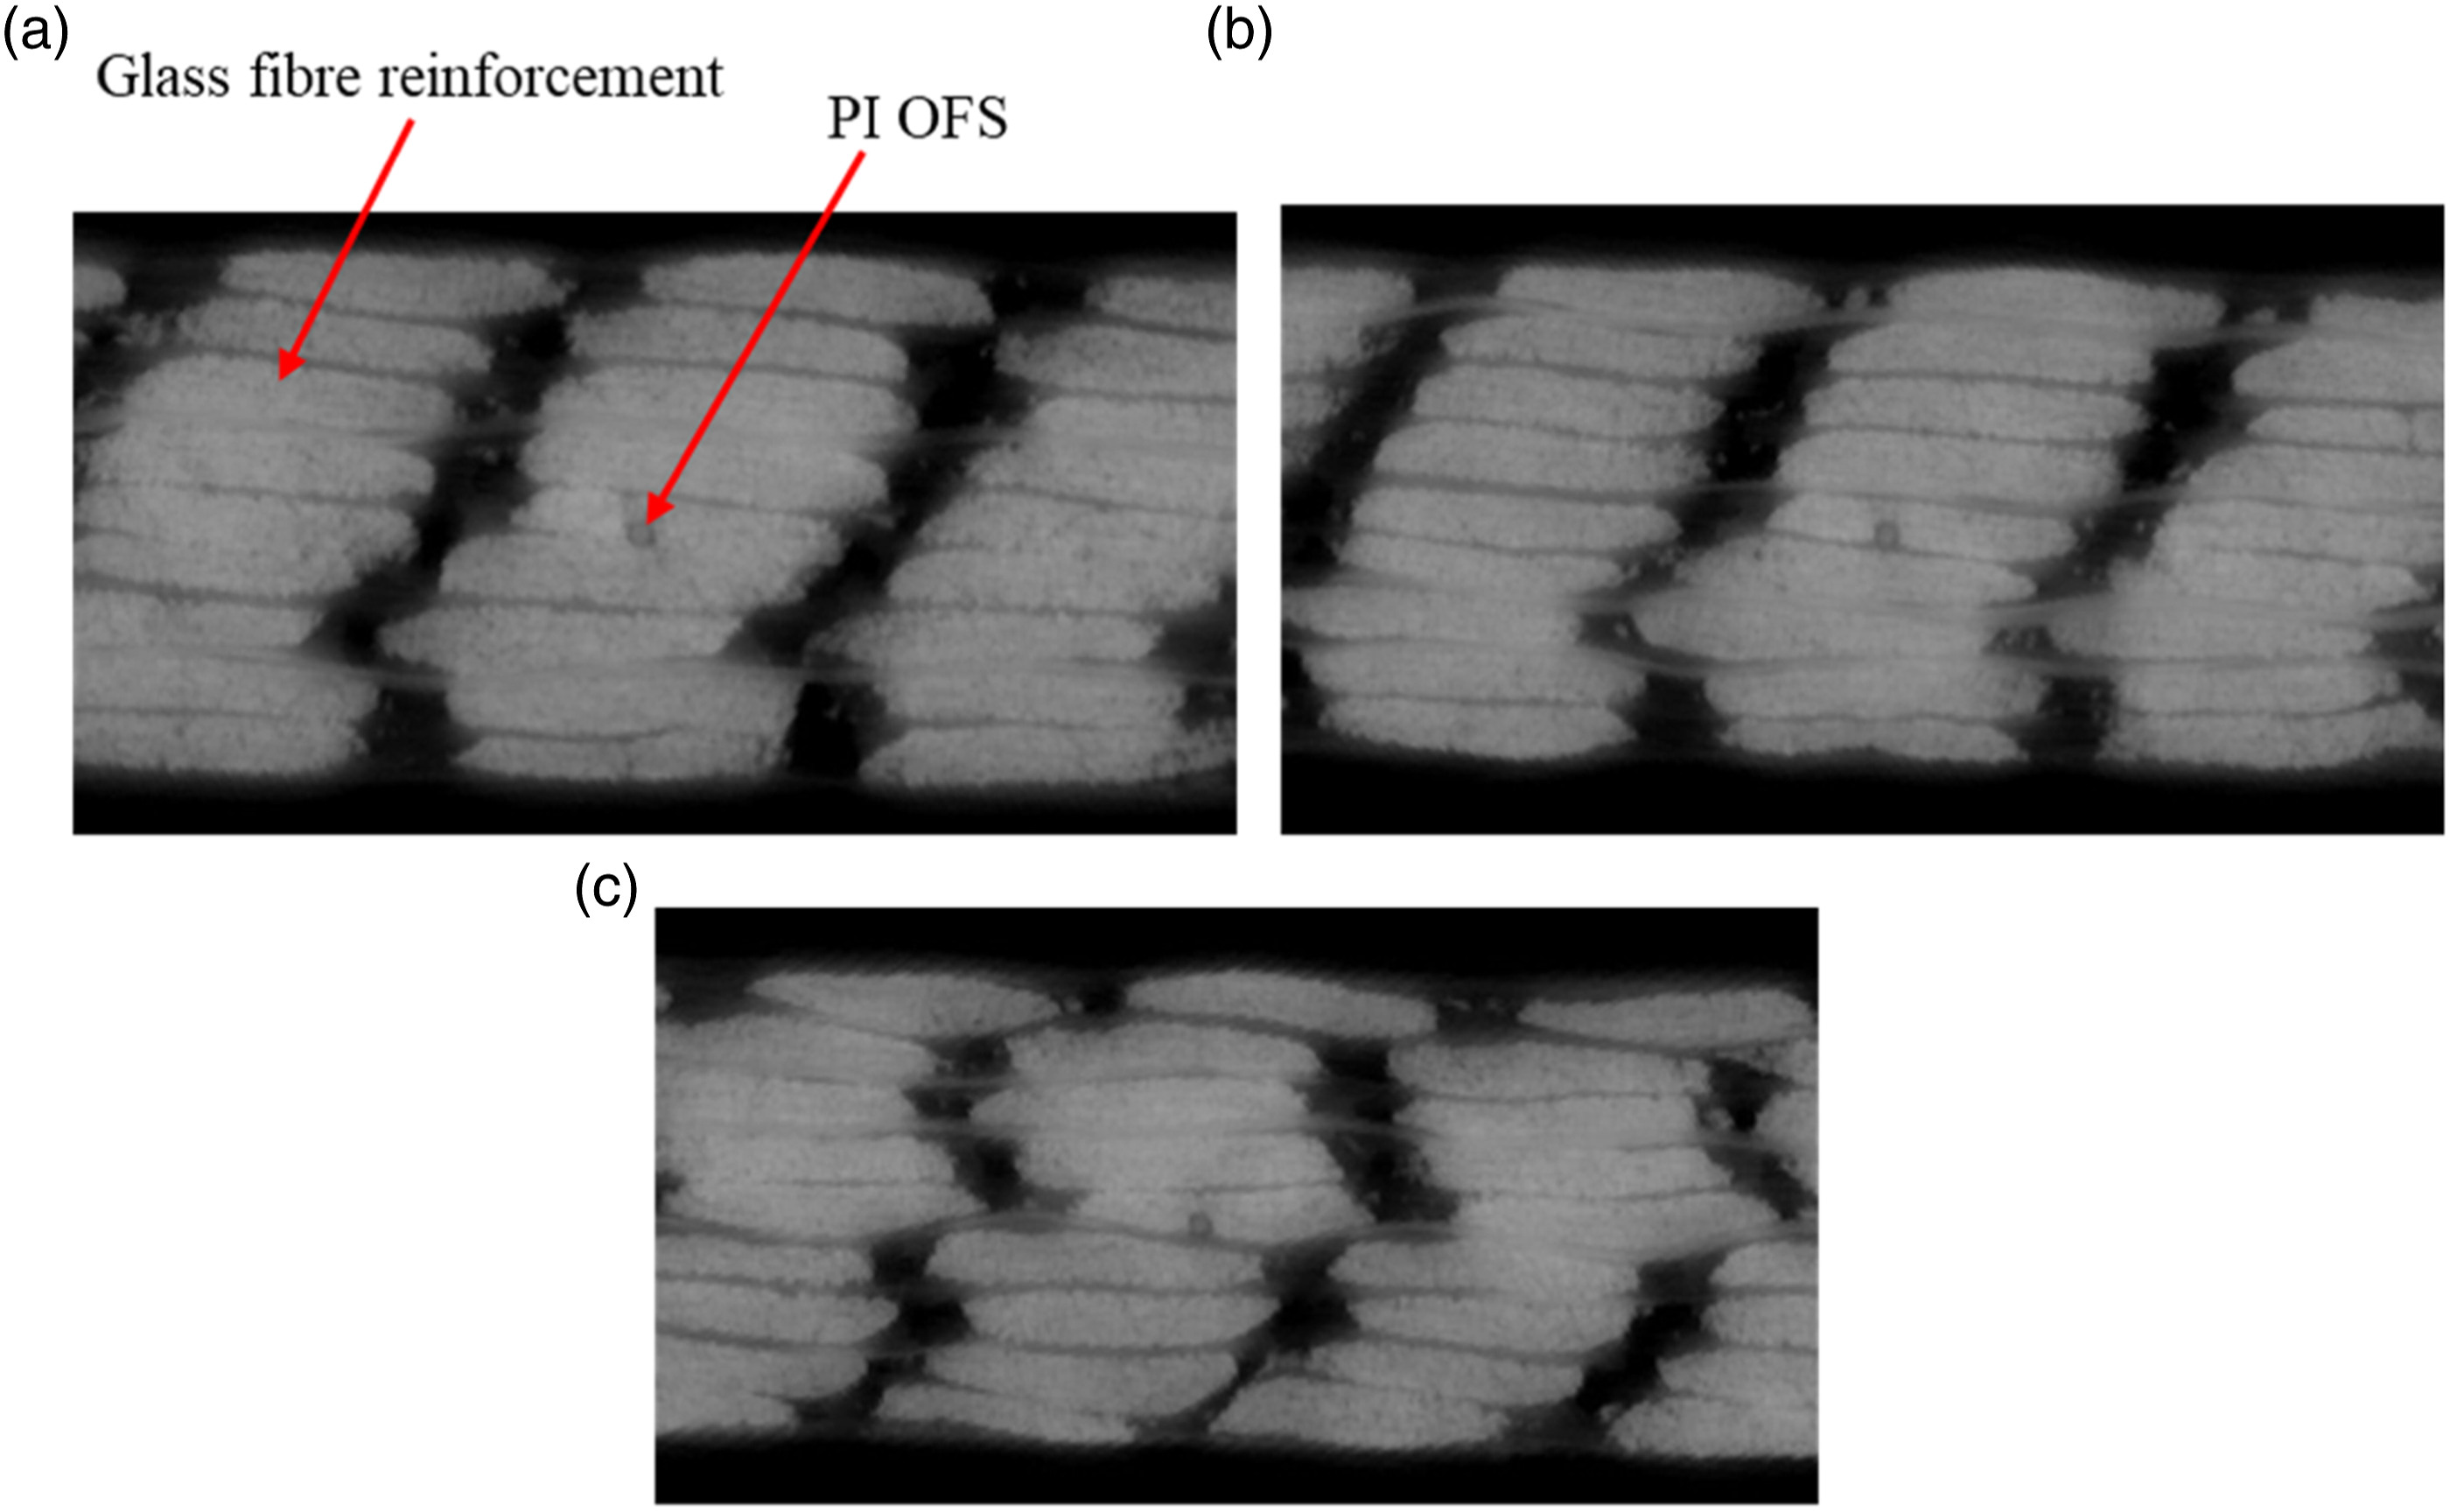
Conclusions
Two types of optical fibres with different coating materials (polyimide and PEEK) were embedded inside the glass fibre reinforced composite materials to investigate their distributed sensing capability, challenges, and potentials of such sensor systems for layered composites. Chemical compatibility of the PEEK and polyimide (PI) coated OFs with the vinyl ester resin system were investigated followed by the embedment of OFs in glass fibres and strain monitoring during vacuum resin infusion assisted curing process. Subsequently, the embedded sensor characteristics were evaluated under tensile and flexural loads. Finally, the internal structure of the sensor embedded glass fibre reinforced polymer structure along with the internal morphology of the sensors were evaluated using µ-CT imaging. The key findings from this study are: • Both PEEK and PI coated OFs used in this study survived the chemical contact from the vinyl ester resin immersion and also resisted the penetration of resin into its core for 120 hours. This showed that OFs are compatible with vinyl ester resin system and resin curing causes no damage to the OFs during the vacuum resin infusion process. • The OFs could be integrated within the layered glass fibre reinforcements by positioning them underneath the ply stitches provided that a smooth gradient in egress location is maintained to obtain optimal performance of the OFs. • The residual strain could be monitoring during the curing process by both PEEK and PI coated OFs without any interruption to the resin distribution in the laminates during the curing process. The cured GFRP laminates with PI coated OFs had a higher residual strain of −213 με, whereas the GFRP laminate with PEEK coated OFs had a residual strain of −81 με. • The embedded PEEK and PI coated OFs under tensile loading could monitor the internal strains distribution optimally up to 7,000 με even under hysteretic loading conditions. Above the strain level of 7,000 με the OFs can still measure the internal strain distribution and maximum strain inside the glass fibre reinforced composites. However, quality would start to decrease gradually with increasing strain. • The embedded PI coated OF under flexural load could measure both tensile and compressive strains beyond a magnitude of 1,200 με. However, the sensing performance under compression would be affected at higher strains compared to tension. • The micro-CT scanning of the OFs embedded GFRP specimens showed that both PEEK and PI coated OFs when embedded internally can withstand the deformation and sustain damages caused during the installation and fabrication procedure. This indicates that the OFs when embedded internally does not require additional maintenance or retrofitting during the service life of the composite structure. However, some defects to the host composite structures are expected particularly with the integration of 950 µm diameter PEEK coated OF in laminates with relatively lower thickness.
Comparison of the strain distribution from the PEEK and PI coated OFs, had shown that despite the difference in the thickness of their coating both the OFs can measure equal strain distribution under similar loading conditions. Furthermore, the PEEK coated OF is suitable for embedded sensing applications in composite materials as they have a higher chance of survival during the life cycle of a composite material. In addition, the need for using the extra sleeves to protect the ingress and egress points of the OFs is eliminated by using PEEK coated OF. However, a PI coated OF may be warranted where a lower intrusion area is crucial due to thickness limitations. The choice of an OF system would thus depend on dimensions, intended purpose, loading and application of the structures of interest.
Footnotes
Acknowledgement
The authors would like to acknowledge the support received through funding schemes of the Australian Government: ARC ITTC: ARC Training Centre for Automated Manufacture of Advanced Composites (IC160100040). The authors would also like to acknowledge ZEUS Industrial products, USA, for supplying the PEEK coated optical fibre.
Declaration of conflicting interests
The author(s) declared no potential conflicts of interest with respect to the research, authorship, and/or publication of this article.
Funding
The author(s) disclosed receipt of the following financial support for the research, authorship, and/or publication of this article: This waork was supported by ARC ITTC: ARC Training Centre for Automated Manufacture of Advanced Composites (IC160100040).