
Abstract
Process-induced surface waviness effects represent a major concern for series production of high-quality lightweight structures based on fiber reinforced plastics (FRP). This paper suggests a method for the numerical prediction of these effects by using the example of processing glass fiber reinforced plastics (GFRP) in a resin transfer molding (RTM) process. The influence of reaction kinetics, chemical shrinkage and cure-dependent viscoelastic properties of the resin are taken into account. Furthermore, the dependence of surface quality on curing cycle, consolidation pressure, textile architecture and thickness of neat resin layer (NRL) at the part surface are investigated. The work is based on published material data and a visco-thermo-elastic simulation approach which has been previously presented and validated. All numerical results are compared to the surfaces of FRP plates that were manufactured with the corresponding parameter variations. Based on a literature survey, different surface waviness values have been identified for comparison of experimental and numerical results. Satisfactory agreement between experiments and simulations is found. Furthermore, it is shown that the analyzed NRL thickness has no relevant influence on the surface waviness while the curing temperature significantly affects the surface waviness. The role of relaxation-induced change of the surface waviness is highlighted by performing long-term measurements and corresponding time-dependent simulations. It is concluded that relaxation plays a decisive role in the appropriate selection of the subsequent surface finishing process. The suggested simulation approach provides a basis for optimization strategies to improve surface quality and reduce post-processing effort.
Introduction
Fast-curing resin systems are commonly used for cost-effective production of automotive structural parts in wet compression molding (WCM) or resin transfer molding (RTM). For cosmetic parts, in addition to structural requirements, the visual and textural appearance of the surface represents a key requirement to the customer. 1 In addition, ensuring class A surface finish and affordable manufacturing costs 2 represent prerequisites for the series production of exterior parts e.g. for automotive applications.
The fiber print through (FPT) effect represents a major surface defect of fiber reinforced plastics (FRP) and emerges from heterogeneous distribution of fiber and matrix at the laminate surface. Spatially resolved resin-rich and resin-poor regions having different thermomechanical and shrinkage properties result in non-uniform contraction during processing and cause the fiber architecture to become visible to the human eye.3–5 For the evaluation of the surface quality, both the waviness formed by FPT and subordinate roughness can be utilized as measurement quantity. Standardized methods are available for the calculation of the roughness and waviness quantities from primary profiles. Likewise, established industry test standards, such as the wave-scan dual (WSD), utilize the waviness as main parameter for the description of FPT.6,7
It is well accepted that FPT and related surface properties of FRP are dependent on textile structure,7–10 resin material,8,9 curing cycle,8,9,11 consolidation pressure8,11 conditions during cooling process 12 and boundary conditions, e.g. tool surface.7,9 The influence of the curing cycle during RTM curing was investigated by Kunze et al. 9 The authors find a beneficial effect of low curing temperatures and thus long curing cycles on surface roughness and waviness as a reduced thermal and chemical shrinkage of the resin system is assumed at lower curing temperatures. By applying a temperature gradient between the mold plates, the surface finish is slightly improved. 8 A crucial effect of the heating rate on the surface quality was found by Herring et al. 11 According to the authors, a small process window and reduced time for pore defect removal by resin transport yields increased surface roughness and porosity. The effect of consolidation pressure was investigated in.8,11 During RTM manufacturing of GFRP laminates changing the injection pressure from 0.2 MPa to 0.6 MPa results in higher surface roughness of the parts. 8 In, 11 laminates were manufactured by the infusion process with vacuum bag pressures of 3.2–18.4 kPa. Although the pressure shows a slight effect on the surface roughness, the porosity of the surface is significantly increased using low infusion pressures. The influence of the textile architecture on the surface characteristics is investigated in 11 by manufacturing laminates based on carbon fiber pre-impregnated unidirectional (UD) and 2 × 2 twill fabrics in autoclave processing. No significant influence of fabric architecture on surface roughness is found for the unpainted state. In contrast to that, the surface roughness of the painted surface depends on the fiber architecture used. The underlying long-term waviness is lightly influenced by the fiber architecture. In 9 , carbon fiber reinforced polymer (CFRP) laminates with different textile architecture were fabricated in vacuum-assisted RTM (VARTM). Lower characteristic surface roughness is obtained using UD fiber reinforcement instead of satin weave fabric. Moreover, no improvement in surface quality was achieved by reducing the fiber volume content (FVC) which is attributed to more pronounced total volume shrinkage caused by deeper neat resin nests.
Beside the process inherent parameters, the resulting surface quality is affected by the tool surface7,9 and additional surface modifications, such as application of gelcoat,13,14 in-mold coating, 15 surface films, 16 and subsequent painting process. 3
To evaluate the FPT effect, the quality control systems of original equipment manufacturer (OEMs) are either based on subjective perception of professional auditors 1 or on objective parameters resulting from optical5,17–19 and tactile measuring7,8,20,21 methods. In9,17 a white light interferometer (WLI) is used to determine the regions 17 and linear 9 surface roughness. Profile filters according to ISO 16610 22 are commonly used to two dimensionally distinguish roughness and waviness profiles. 23 Stylus profilometry represents a common method for tactile measurement of the surface roughness. In7,8,20,21 stylus profilometry is applied to measure the roughness profile of composite parts manufactured in the RTM process. The wave scan dual (WSD) measuring device is well established in the automotive industry as it allows a fast assessment of the surface quality and can be used in a portable and flexible environment. 9 In5,7, WSD analysis is used for the surface assessment of composites. The measurement of the surface quality is complemented by analyzing the cross-section based on micrographs.5,7 Moreover, digital image correlation (DIC)18,19 and wavelet texture analysis 19 can be applied to measure the surface quality of exterior components. Although many experimental studies focus on roughness, the waviness values derived from the WSD have established as industrial standard to quantify FPT effect and represents a significant processing-relevant measured variable. Consequently, the investigation of the waviness is of major importance.
Besides the experimental characterization of the surface quality, modelling approaches for the description of surface properties of thermoplastic4,24–28 and thermoset FRP13,29–32 have been developed. First, analytical models to calculate the surface waviness of thermoset UD-GFRP were developed by Kia33–35. The model describes the displacement of the part surface by an array of parallel elastic beams and only considers shrinkage effects in thickness direction. It is shown that the coefficient of thermal expansion (CTE) of the resin material significantly controls the magnitude of FPT.
34
By substantially increasing the top NRL thickness,
33
FPT effect can be significantly decreased. However, the investigated NRL thicknesses of up to 1 mm are significantly higher than usually occurring in FRP components. Lin et al.
30
investigated the FPT of GFRP for marine applications by manufacturing parts in the Seemann composites resin infusion molding process (SCRIMP), quantifying the effect and subsequently identifying causes of FPT. Furthermore, the authors proposed a thermo-elastic simulation model with a simplified textile geometry to predict cooling-induced residual stresses. Based on the model the authors developed methods to unify the distribution of residual stresses and thus reduce FPT and improve surface quality.13,31 A one-dimensional analysis of surface displacement of a carbon fiber-reinforced plastics (CFRP) laminate was conducted in.
21
In contrast to previous studies, chemical shrinkage was included in the simulation approach, so that measured average roughness
Although a large number of experimental studies of the FPT and the associated surface properties (waviness, roughness) have been carried out, only few attempts were made to predict FPT and resulting surface properties of FRP. The present simulation models are commonly running simplified linear elasticity models13,31 or geometrical simulation tools 21 while the use of viscoelastic and cure-dependent simulation approaches is mostly limited to the computation of residual stresses and the resulting process induced deformations (PID).36–38 Viscoelastic cure-dependent models provide a more reliable description of the epoxy resins material behavior during cure and accompanying process induced residual stresses. 39 Indeed these models also yield good results for non-conventional cure cycles and allow the consideration of relaxation effects during and after processing. 40 However, a comprehensive and complex experimental characterization of the resin material represents a prerequisite for the use of cure-dependent viscoelastic models. 41
To close this gap and to numerically predict the surface properties of FRP, the cure-dependent visco-thermo-elastic model introduced in42,43 is used to predict the surface waviness of an epoxy resin composite. The underlying material data are taken from12,44 and have previously been determined under process-specific conditions. Particular importance is paid to the temporal change of strains during processing, post-processing relaxation effects and the precise characterization and modelling of the underlying complex fiber architecture of the fabric. In addition, extensive experimental investigations of the surface waviness are performed comparing different optical measurement methods to verify the proposed simulation model (for detailed studies of the processing conditions) on surface waviness.
Experimental and numerical methods
Methodology
In the present paper, the interaction between surface waviness and processing conditions is investigated in numerical and experimental studies. Therefore, both numerically and experimentally determined primary surface profiles are processed with the same filter methods to extract the waviness profiles from the primary surface profiles. Afterwards, the results are evaluated and experimental as well as numerical studies are directly compared. The overall methodology is schematically shown in Figure 1. First, the experimental investigation, the evaluation of the measured and numerically predicted primary surface profiles including applied filter methods are described in detail. Then the numerical methods are presented. Overview of assessment method for numerical and experimental evaluation of FPT effect for thermoset FRP.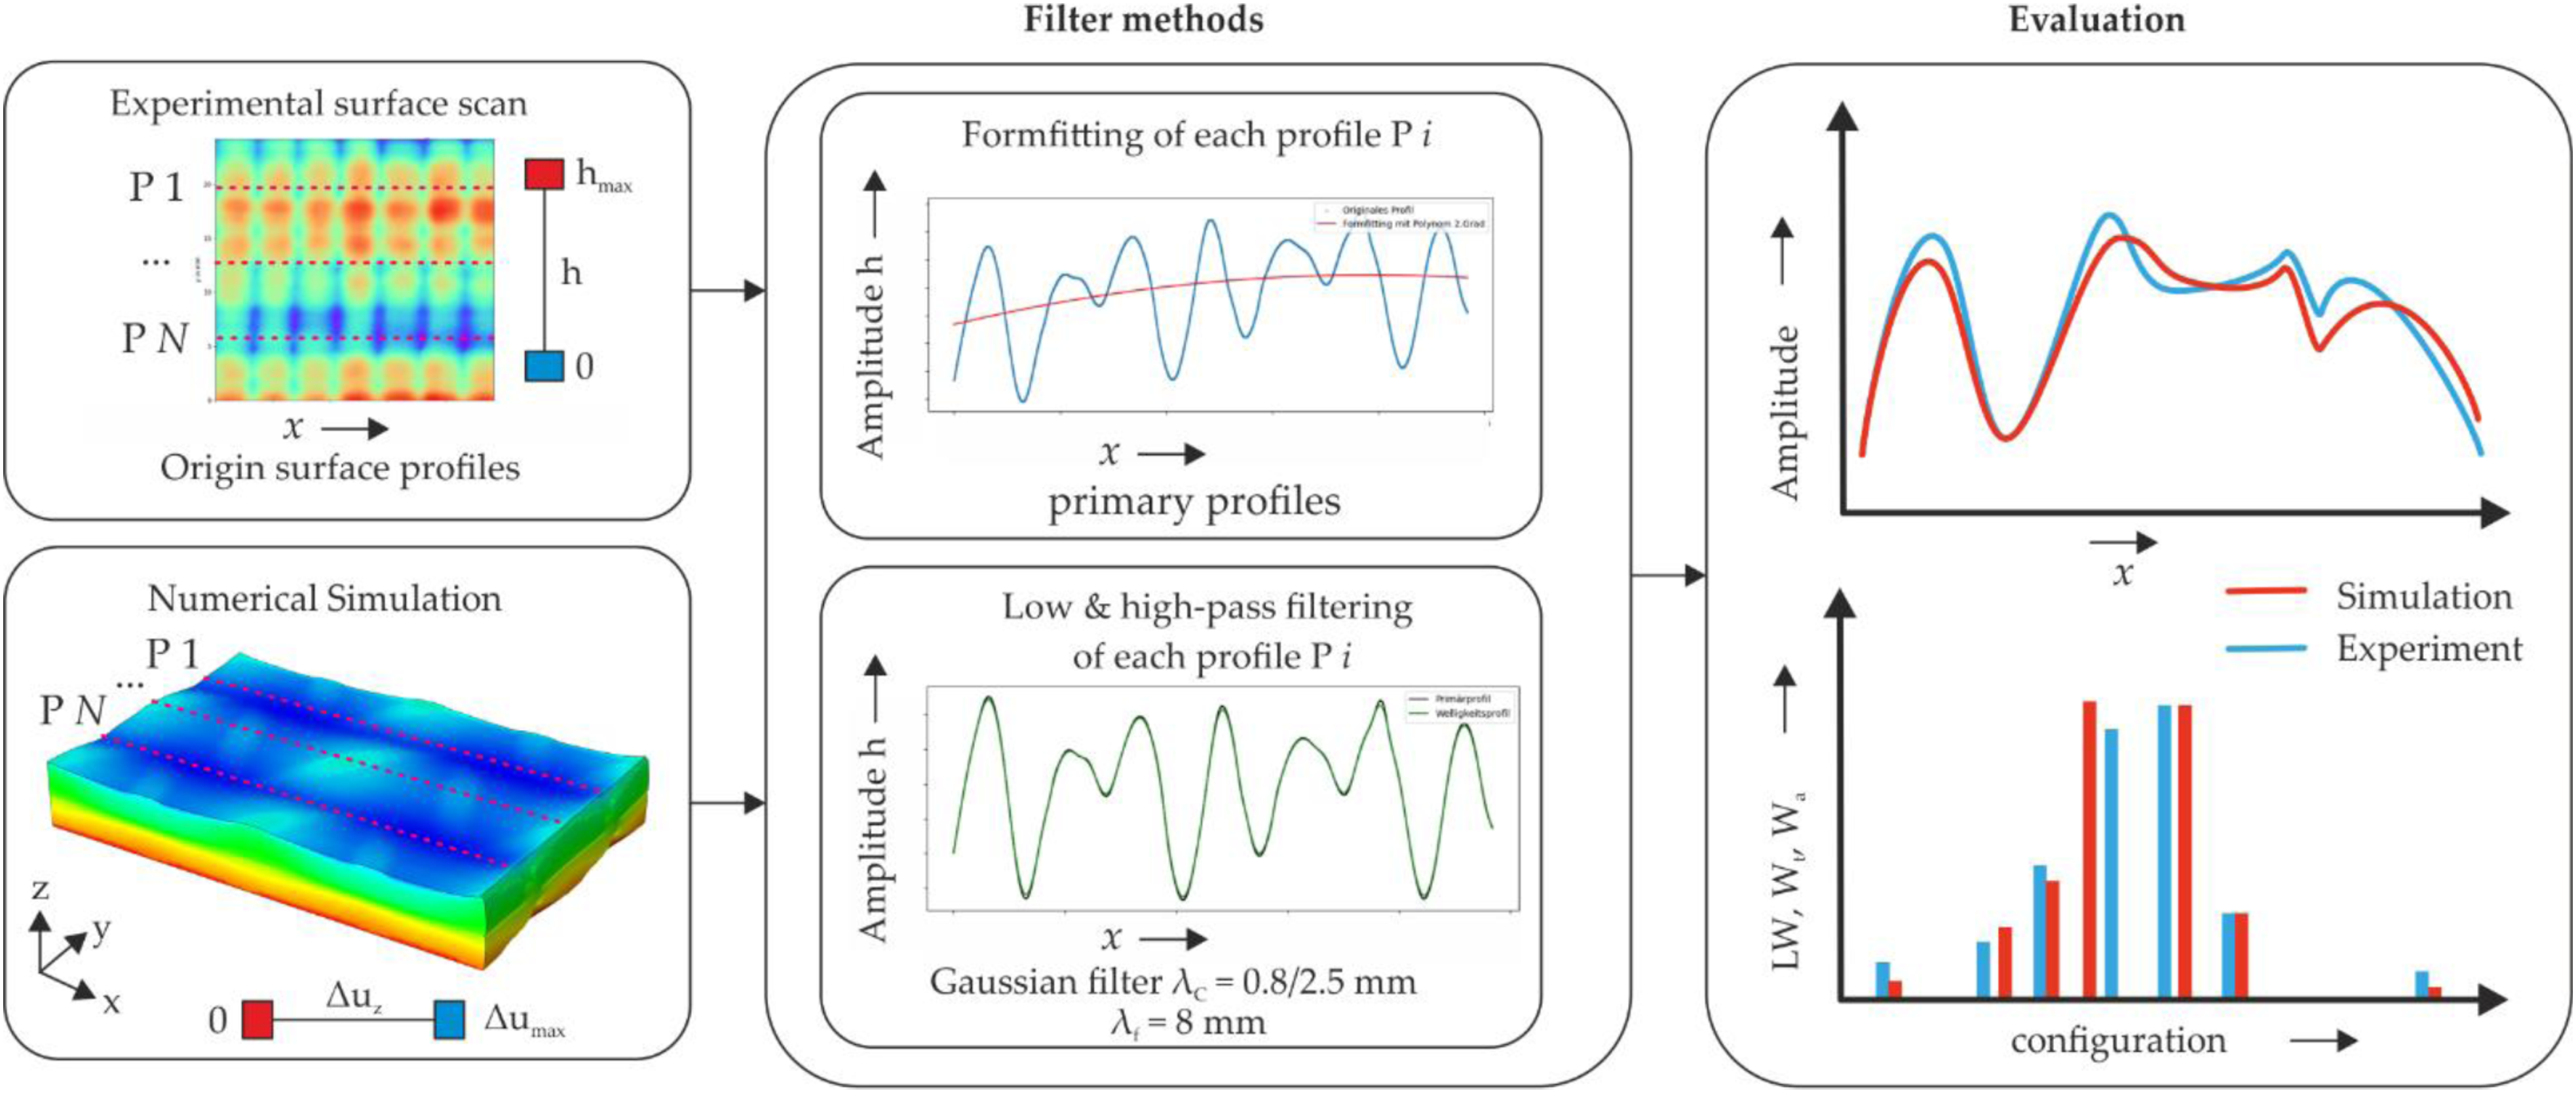
Experimental investigation
A fast-curing resin-hardener combination consisting of a bisphenol-A based resin system (EPIKOTE™ Resin TRAC 06150 from Hexion Inc.) and an amine-based curing agent (EPIKURE™ Curing Agent TRAC 06150 from Hexion Inc.) is investigated in the present work. Extensive characterization of the resin material data was carried out in preliminary work.12,42,44
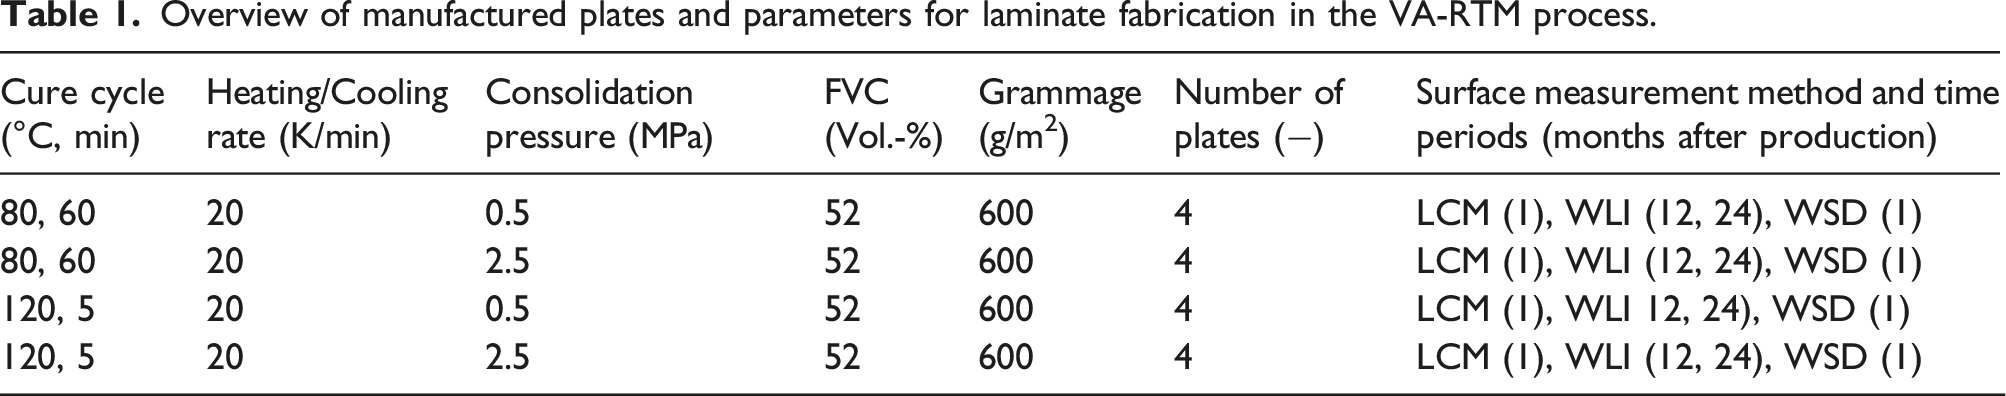
Overview of manufactured plates and parameters for laminate fabrication in the VA-RTM process.
To experimentally characterize the primary surface profiles of the manufactured GFRP plates, three different optical measuring methods are employed. A laser confocal microscope (LCM) VK-X 200 of Keyence AG, Japan, is used for surface analysis. Three equidistant line measurements (0.2 mm width) with a length of 40 mm and spacing of 10 mm are carried out in the center of the component. Measurements are performed in both in-plane coordinate directions with data points being recorded every 2.8 µm in high-precision mode. The LCM measurements are carried out 1 month after the production of the FRP plates. A WLI by Fries Research & Technology, Germany is being used to determine the vertical profile of a of 40 × 40 mm2 surface area which corresponds to a data matrix of 640 × 640 measurement points with equidistant spacing of 0.06 mm. The z-resolution of 20 nm allows reliable determination of standardized surface values. In contrast to the LCM measurements, the WLI measurements are carried out 1 year after FRP plate manufacture. After 2 years the WLI measurements are repeated. During this period, the FRP plates are stored hermetically isolated and in the absence of light to minimize aging effects. The WSD measuring device from BYK Additives & Instruments GmbH, Germany, is being used to measure the surface properties (
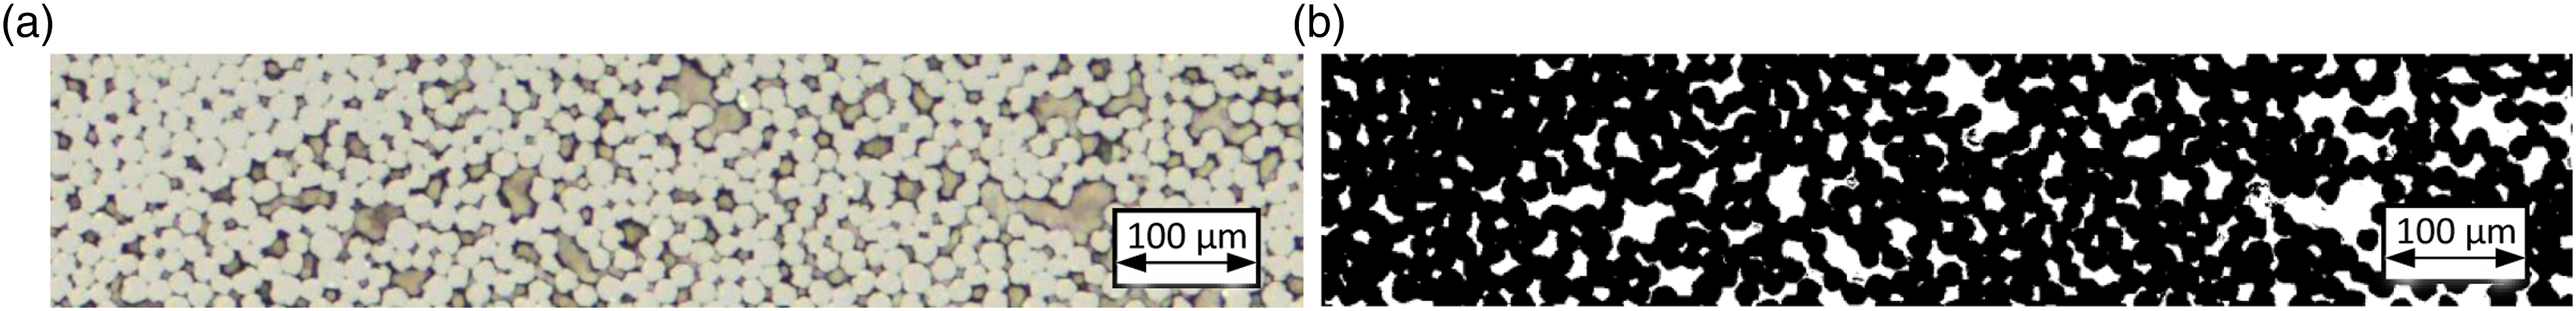
Additionally, micrographs of the cross-section area are analyzed using a digital microscope VHX5000 of Keyence AG, Japan with a 100 and 200 magnification factor to both map the geometry of the NCF and to identify neat resin pocket depth and thickness of NRL at the surface (Figure 2(a)). By WLI scans of the NCF, additional measurement data for the yarn cross section and stitching pattern are obtained (Figure 2(b)). Part Cross section area (a) and WLI image (b) of the fiber architecture.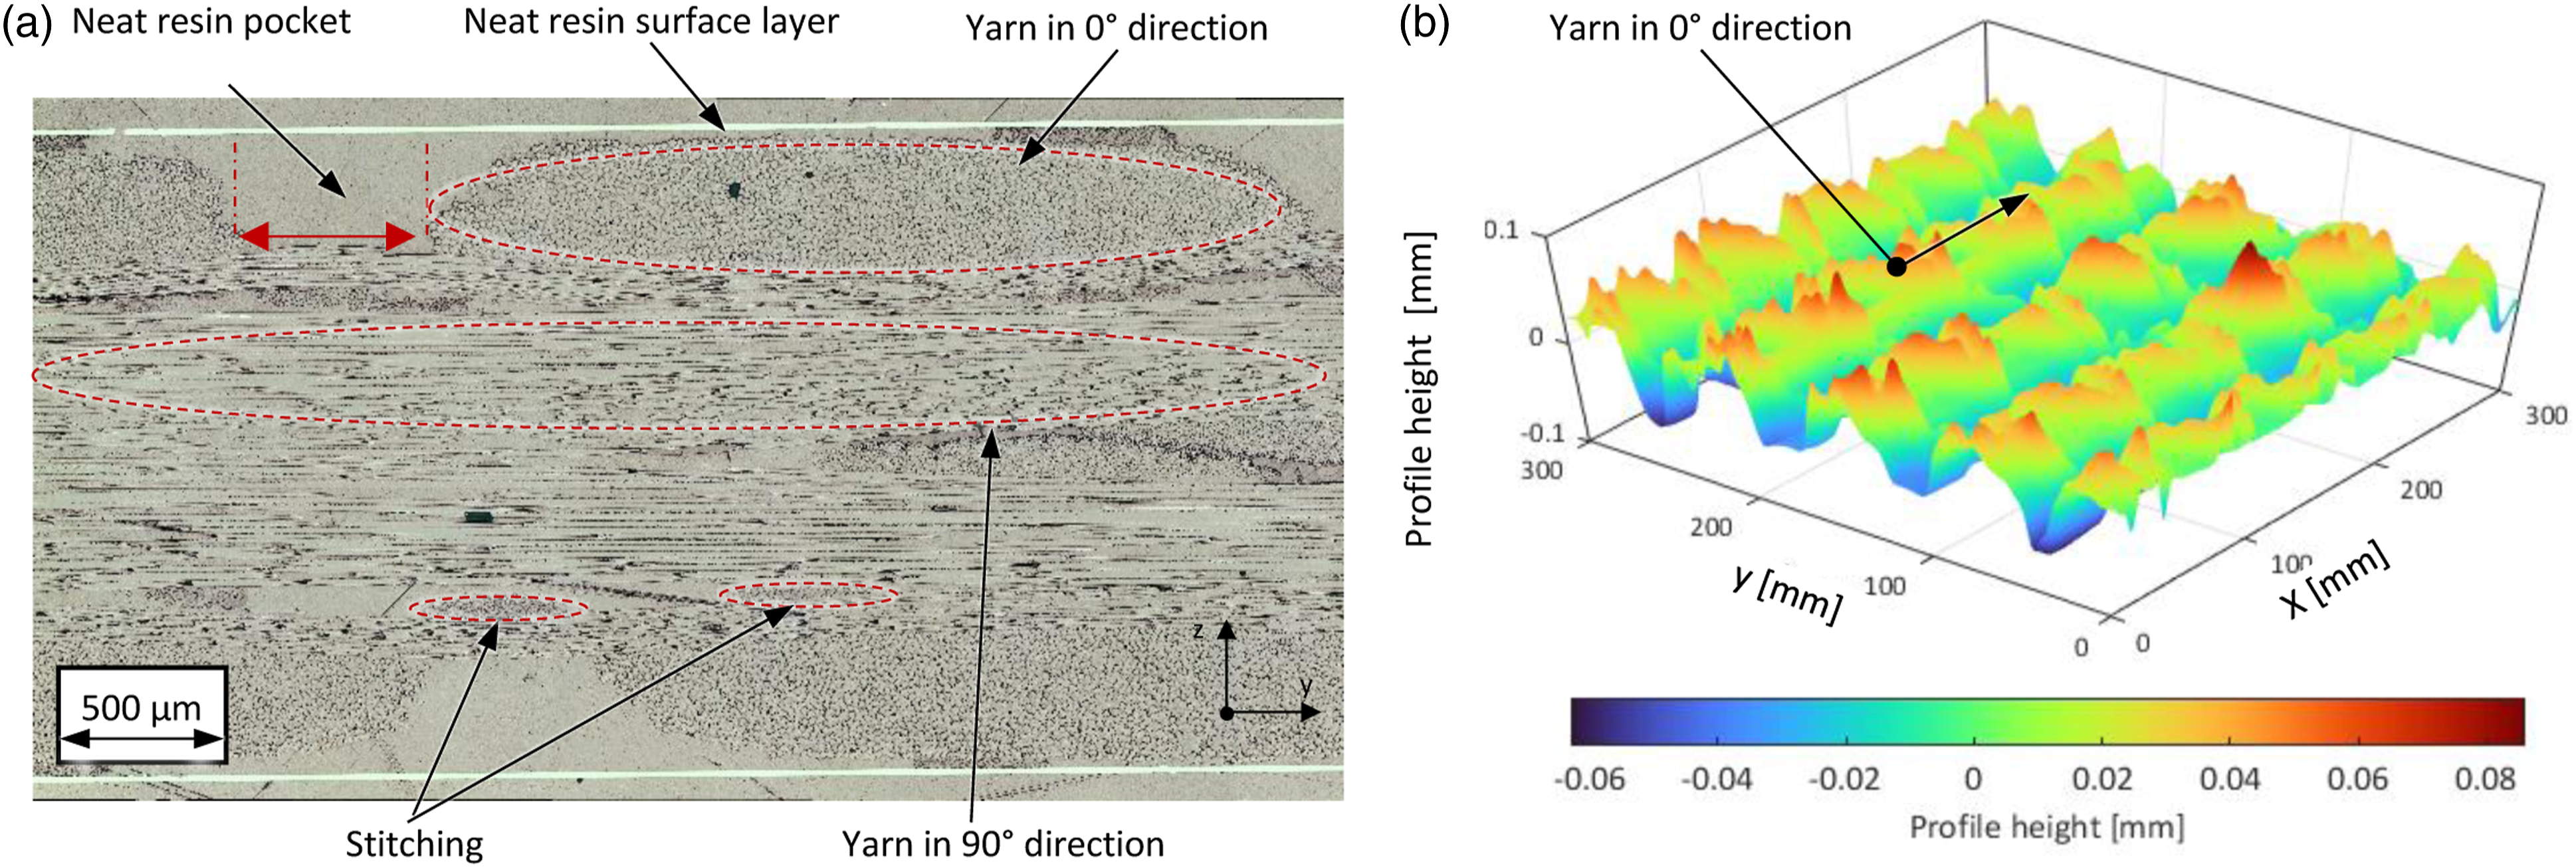
After determining the primary surface profile by means of the described measuring method, the measured primary surface profile is subsequently filtered for the calculation of waviness characteristics. First, form deviation is eliminated by describing it using a 2nd order polynomial to approximate the primary profile. According to DIN EN ISO 4288, an expected average groove width of 3 mm and underlying measuring length of 40 × 40 mm2 (WLI) and 40 mm (LCM) cut-off wavelengths of Measured profile height and applied filtering technique using WLI (a). Surface displacement from numerical simulation and calculated profile height (b).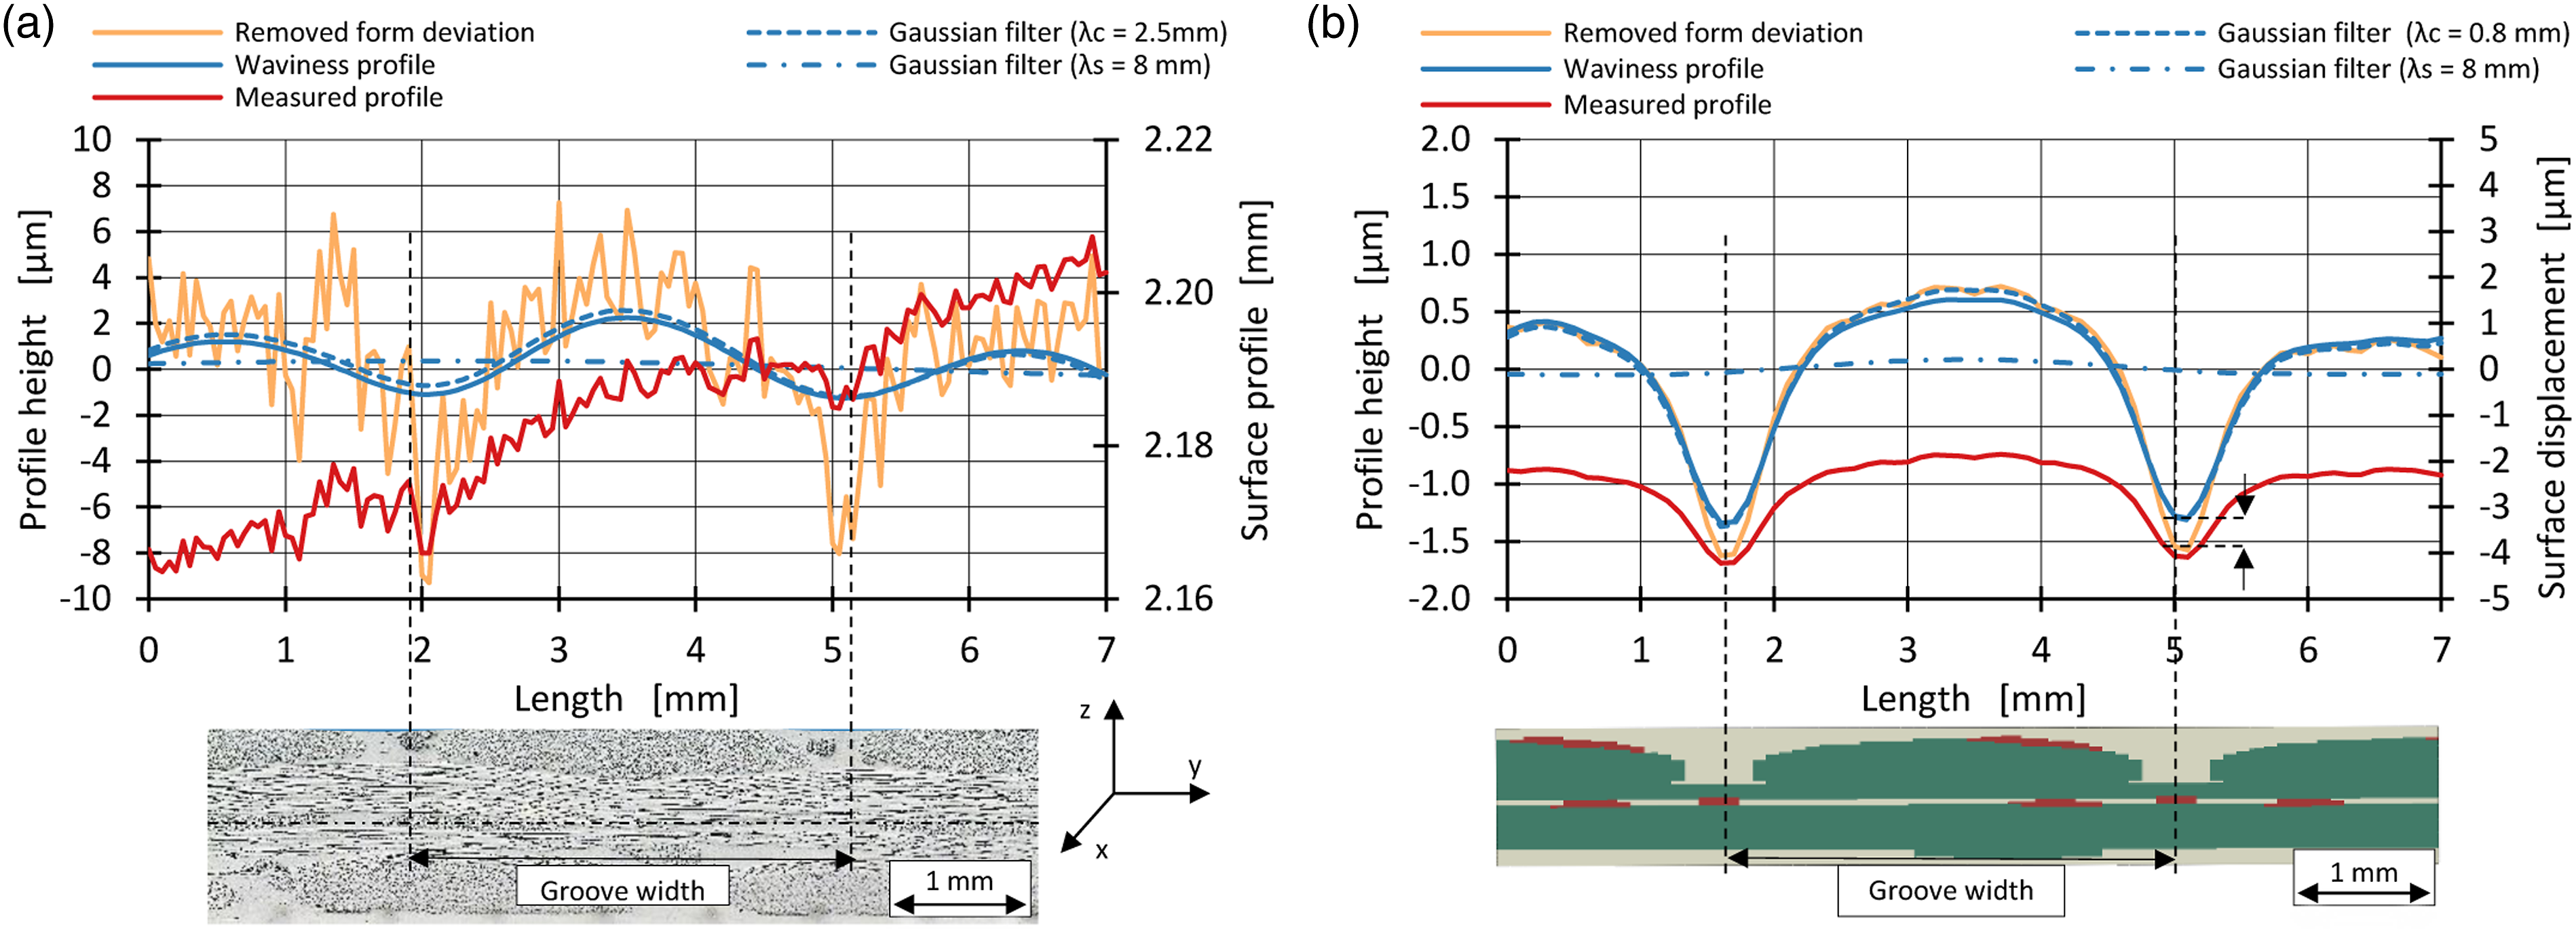
To minimize evaluation method-dependent errors, the post-processing of the numerical data is conducted using the same approach as for the experimental data. However, the numerically predicted node displacements in z-direction is used as input data set. After removing the form deviation from the primary profile using 2nd order polynomial approximate no further Gaussian filtering is applied as it is found that subsequent filtering strongly effects and artificially smoothens the waviness profile (Figure 3(b)). Since the simulation data is based on an idealized geometry, no further filtering to remove non-relevant surface structures is required. Based on the numerically and experimentally determined waviness profiles, two surface parameters
In addition to the experimental method of the WSD, a method to determine the 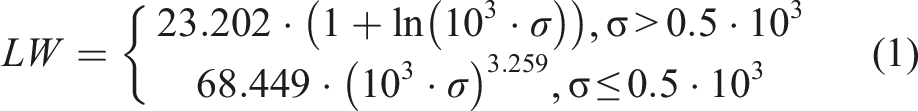
Numerical methods
For the numerical modelling the textile architecture the open-source tool of TexGen v3.12.2 is used. 46 The modelling parameters of the UD-NCF are based on the microscopic and computed -tomography analysis of the final specimen plates (Figure 2(a)). The simulation of the curing process is carried out using abaqus© 2022 combined with a subroutine of thermo-viscoelastic material model of the matrix developed in42,43 and extensive material characterization previously published in.12,44
It has to be mentioned that the numerical model of the textile architecture is based on the consolidated specimens which means that the effects of impregnation, compaction and cure on yarn shape are included. Due to this, overlapping of the yarn’s sections and thus reduction of the total laminate thickness reduction arise allowed. A representative volume cell is generated using TexGen. For reduction of computational cost, only the half thickness of the laminate is modelled, and two regions of interests (ROI) are simulated and evaluated in detail (Figure 4). The voxel method is used for mesh generation which excels at generating accurate meshes for a wide range of textile structures 47. Hence, the knots of the stitch yarns are not modelled in detail. Characteristic element lengths of 0.1 mm in in-plane(x-y) and 0.02 mm in out-of-plane (z) direction are defined. Five elements are used for the thickness of the ROI which represents the second in-plane direction. The resin rich zone on the surface (Figure 5) is modelled by extrusion of the upper voxel elements of the TexGen-model. This ensures a defined thickness distribution over the ROI. ROI 1 is a cross section of the 0°- direction yarns. The resin rich zones between the yarn and the stitch yarn at the top can be seen and are supposed to influence the resultant surface profile. Modelled textile structure and definition of ROI 1 and ROI 2. Cross section area of numerical model for ROI 1 and ROI 2.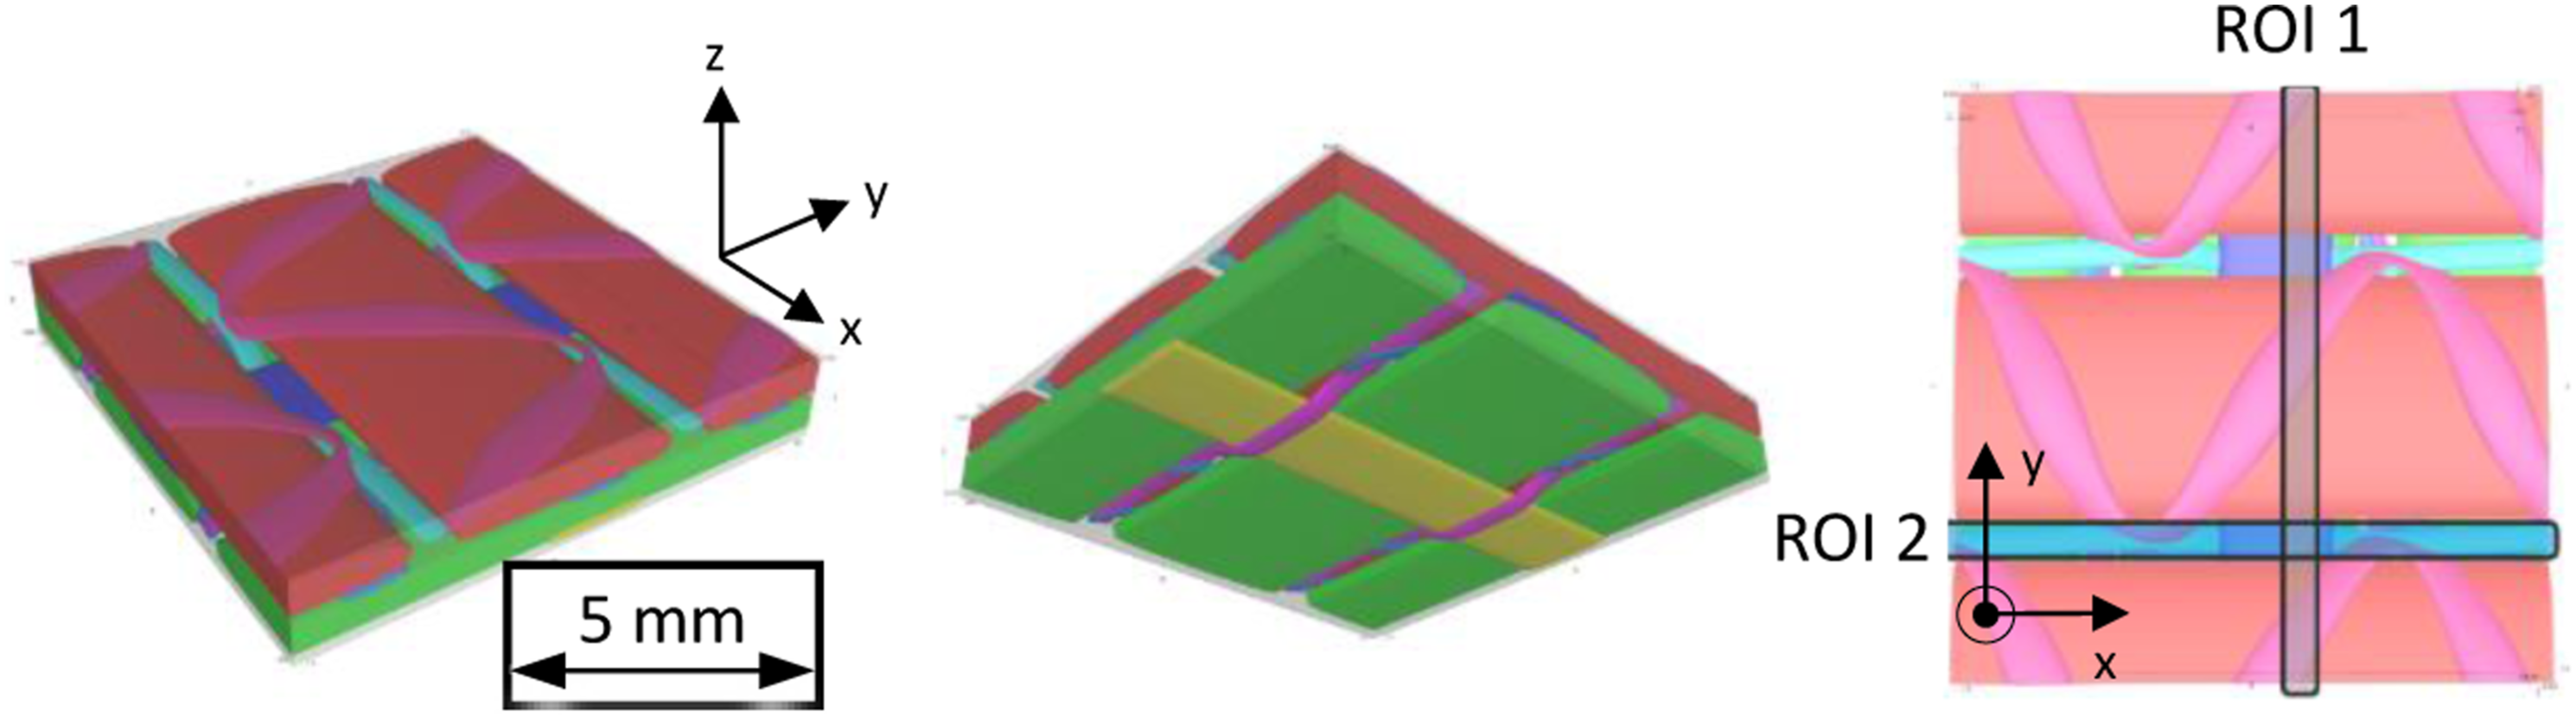
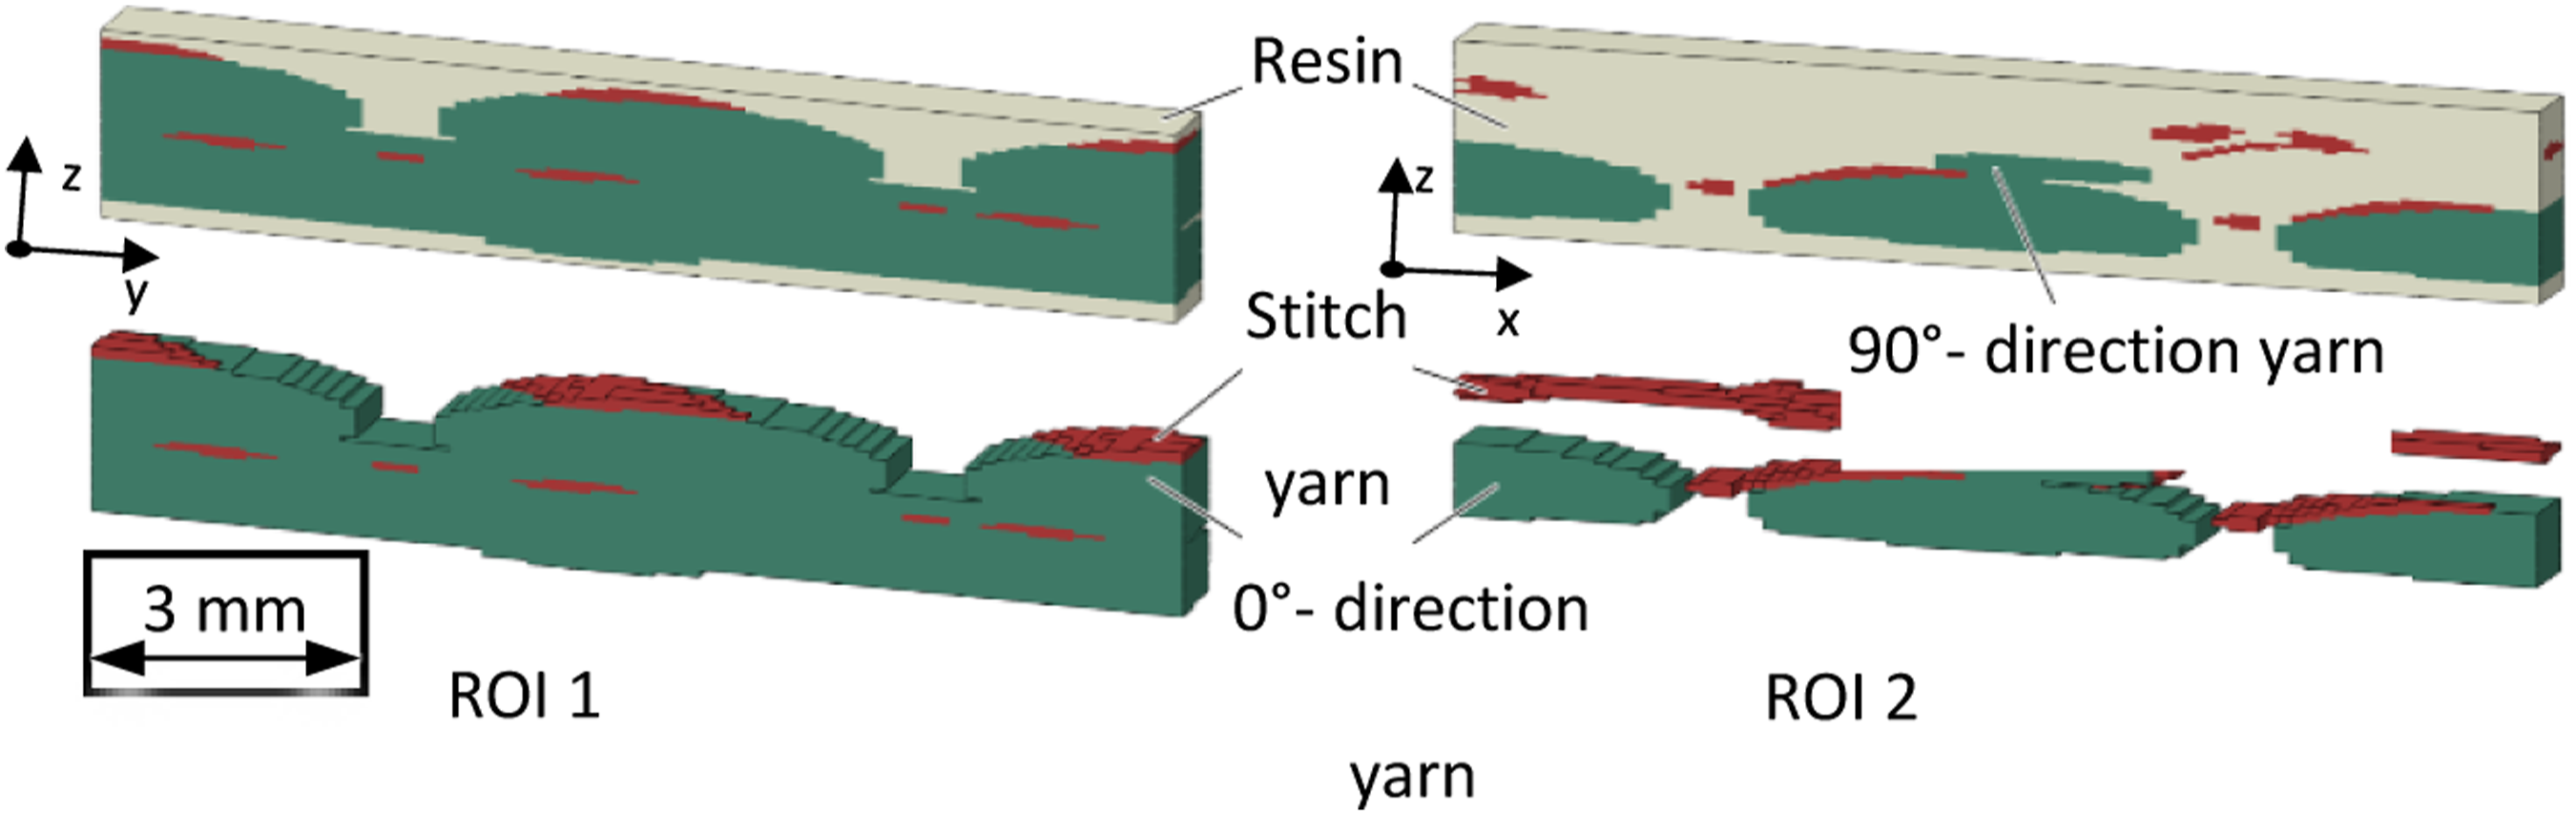
The other region (ROI 2) runs parallel between two 0°- direction yarns. The 90°- direction yarns at the bottom and the stich yarns in the top of the region embedded in the resin can be seen in Figure 5.
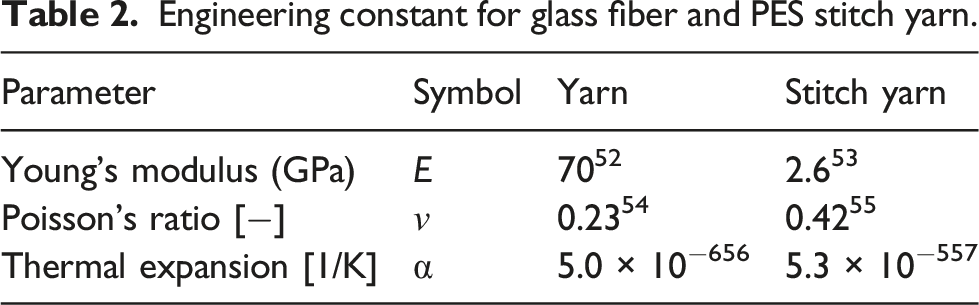
Engineering constant for glass fiber and PES stitch yarn.
(a) Micrograph of a yarn section and (b) Weka segmentation to determine the in-yarn FVC.
The initial and boundary conditions for the two regions are adapted to the RTM process. The numerical process includes four steps. A heating step from initial room temperature to process temperature by a rate of 20 K/min. A holding step with constant temperature and a cooling step by a rate of 20 K/min to room temperature. After reaching 23°C, the final relaxation step begins. The consolidation pressure is defined over all steps within the material model of the resin. No mechanical pressure is applied during curing and cooling process as an additional boundary condition. The boundary conditions of the regions are in accordance with the process and continuum mechanics. Therefore, the symmetry plane of the laminate and the cutting planes are defined with symmetric boundary conditions for the whole process except the surface plane at the top. Until the final relaxation step is reached the surface plane is fixed in normal direction as the part surface tightly sticks to the mold 30 and stays in contact with the mold surface throughout the process. 21 During the additional relaxation step representing a demolded part, deformations in all directions are allowed. Since the relative displacement of the component to the tool is of subordinate importance in the RTM process, a modelling of the adhesion to the tool surface 39 e.g. by Coulomb’s friction law50,51 is not included. Furthermore, based on the assumption that the exothermic effect of the curing reaction is less pronounced for thin-walled parts (1.8 mm thickness) with high content of reinforcement fibers, no modeling of heat conduction and exothermal effects is considered. No plasticity and damage of resin and fiber-matrix-interface is considered in the present model.
Results and discussion
The influence of the top NRL thickness on the surface waviness is analyzed using numerical investigations as the experimentally determined thickness is scattered and its influence on the formation of the surface waviness is to be evaluated first. The aim is to prove that NRL thickness, which are smaller than those in,
33
are of subordinate importance for the formation of surface waviness. Since the NRL thickness cannot be controlled experimentally, a further impact of layer thickness on the experimental results needs to be excluded. Subsequently, numerical and experimental investigations on the influence of the process-specific parameters on the developing surface waviness are presented. Particular attention is paid to the accurate numerical modelling of the process-specific conditions such as applied curing cycle and consolidation pressure. During the experimental determination of the surface parameters, it is ensured that the investigated ROI is accurately represented by the measurement data. The surface scan method and evaluation approach for WLI and LCM measurements is depicted comparatively in Figure 7. Finally, the relaxation behavior after completion of the cooling process is presented so that the advantage of the cure-dependent visco-thermo-elastic approach becomes apparent. Measurement of surface properties using WLI (a) and LCM (b) for ROI 1. The upper row pictures show the location of measured area and profiles. Middle row pictures depict the filtered surface plots and the bottom row pictures show the waviness profiles and the corresponding Wt values. Numerical analysis - Influence of top NRL thickness.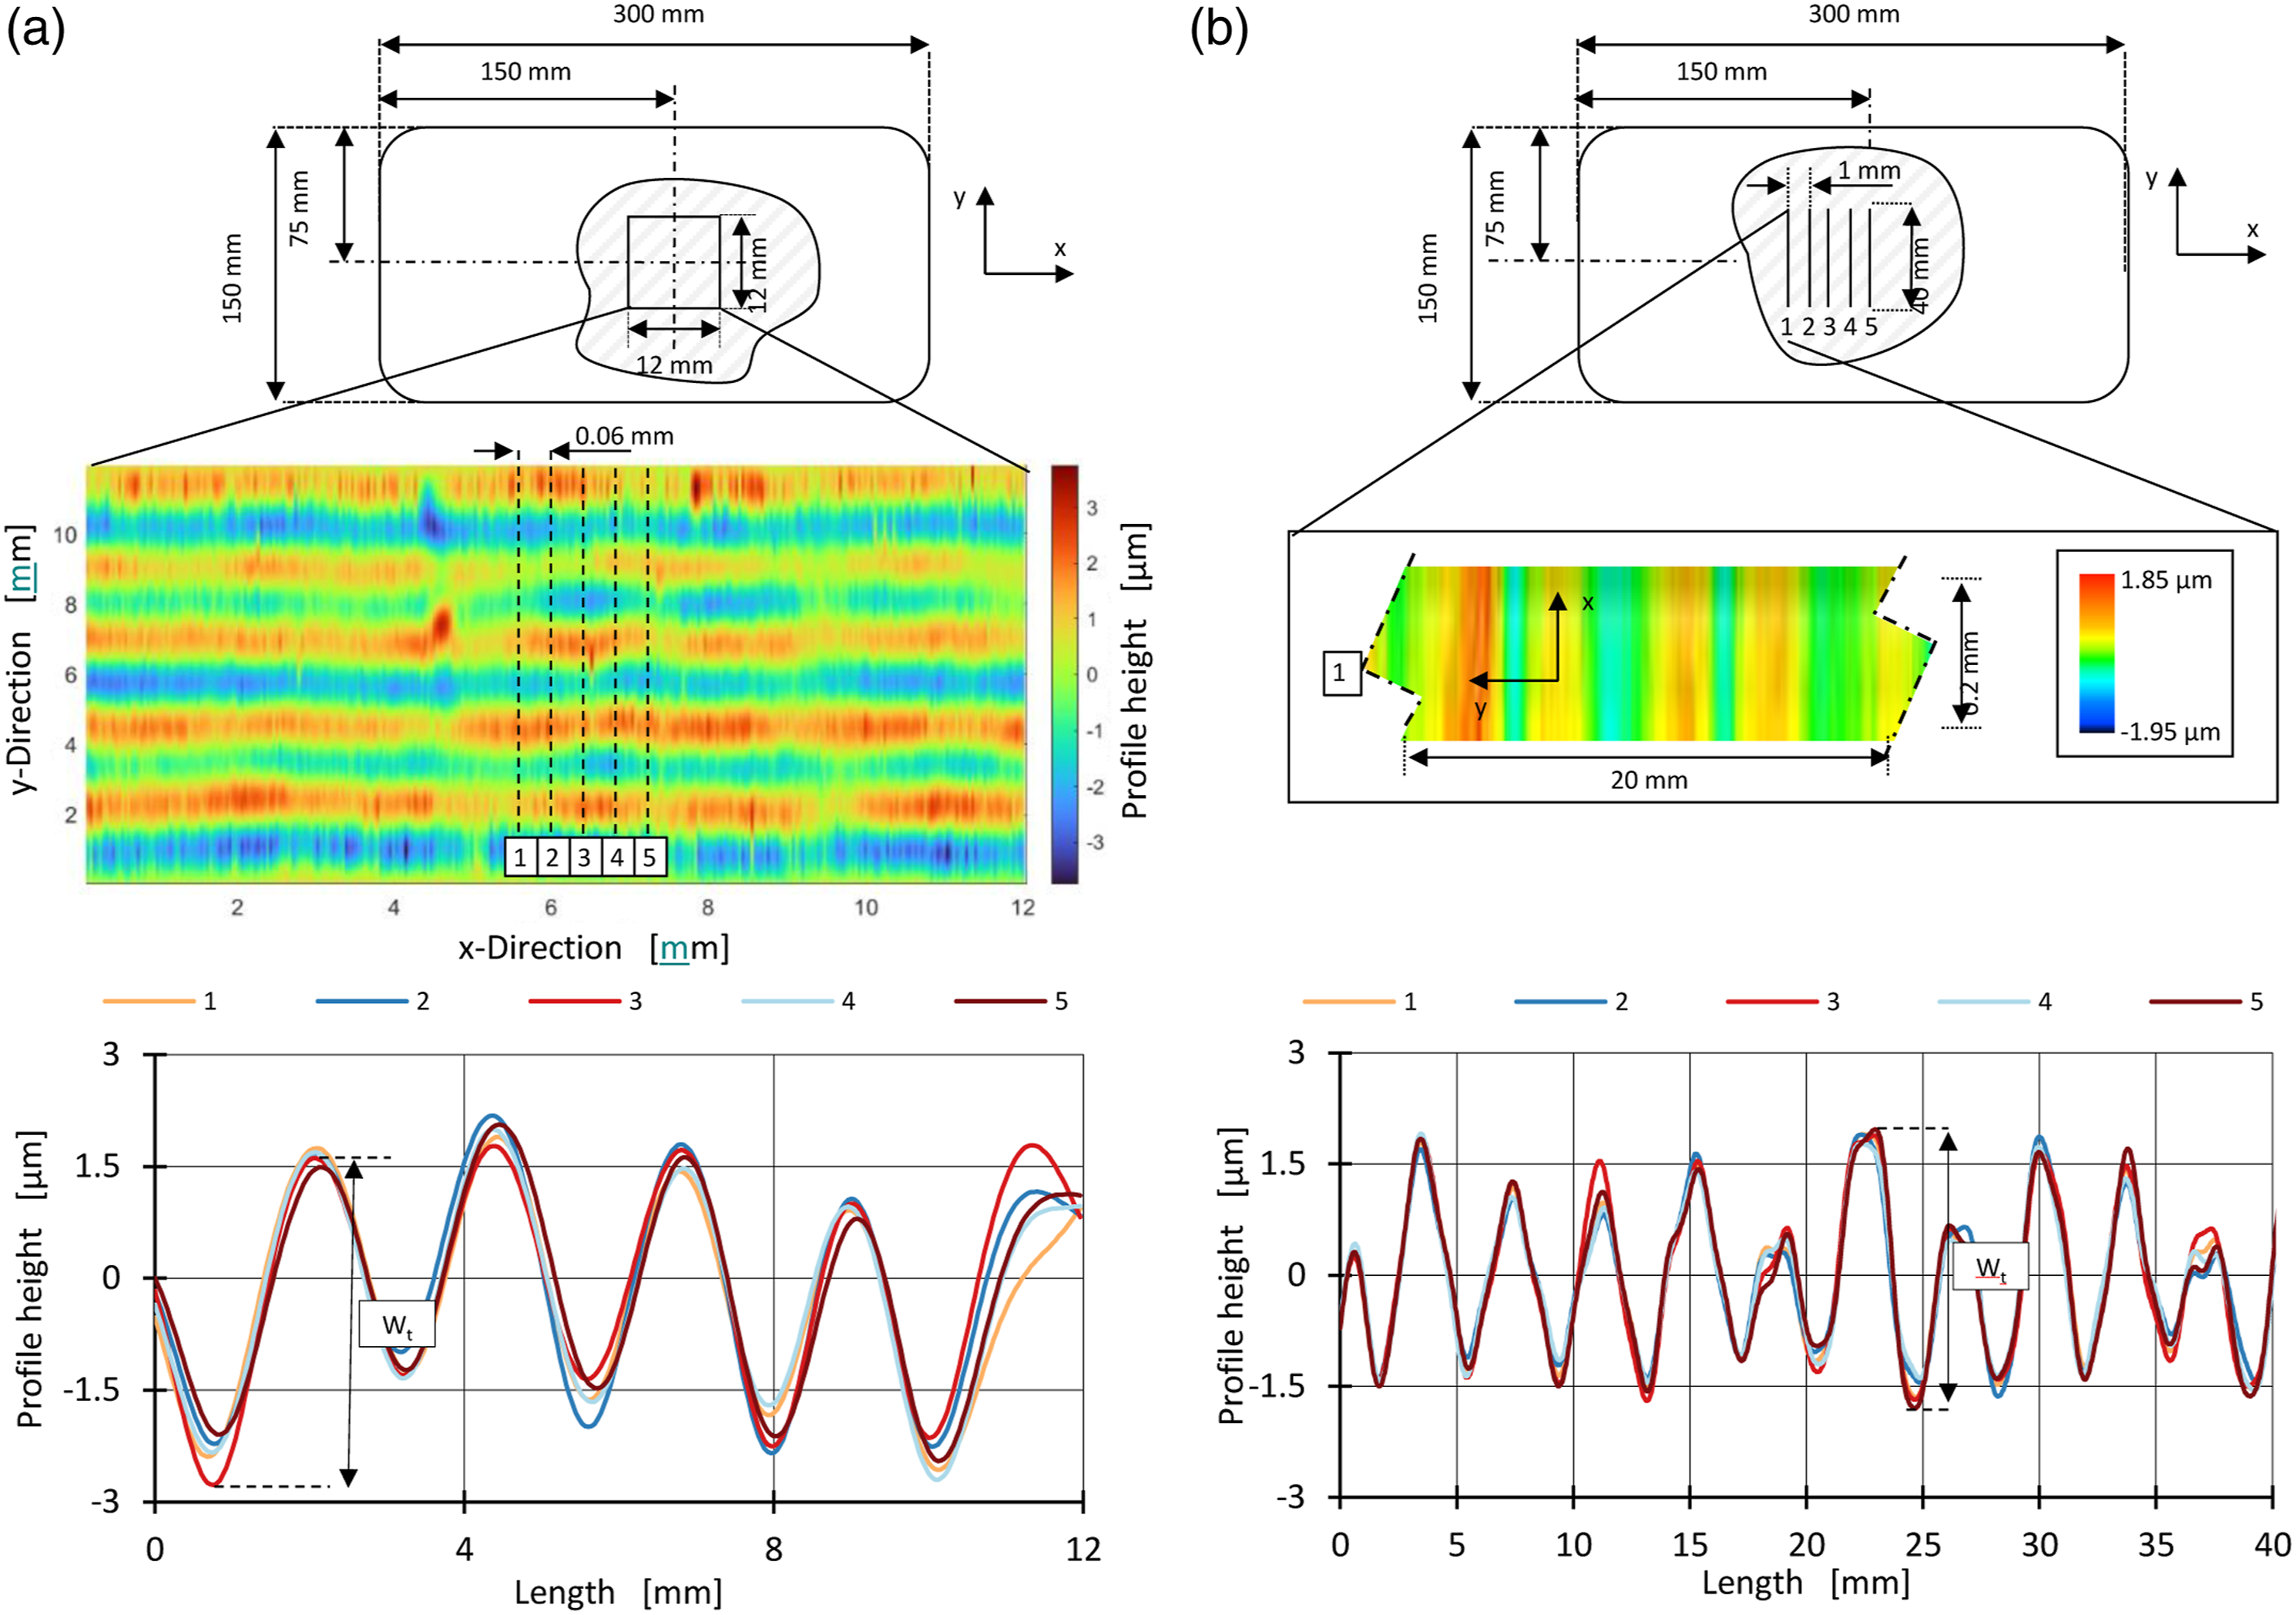
First, the top NRL thickness is evaluated as previous microscopic investigations of cured part cross section area showed significant variations and cannot be adjusted experimentally. For this reason, three NRL values (3, 50 and 100 µm) covering the entire span of measured thickness values (Figure 8) were selected for the first numerical consideration. ROI 1 for setup 1 is chosen as a representative cross-section, as the neat resin top layer proportion in the thickness direction is comparatively smaller than in ROI 2 (Figure 5) and thus a greater influence is to be expected. Microscopic image with measured NRL thickness (a) and distribution of the measured NRL thickness values (b) at top and bottom of the plate cross section. The red marks indicate measured values from depicted cross section whereas the orange marks show the boxplot diagram of all measured NRL thicknesses.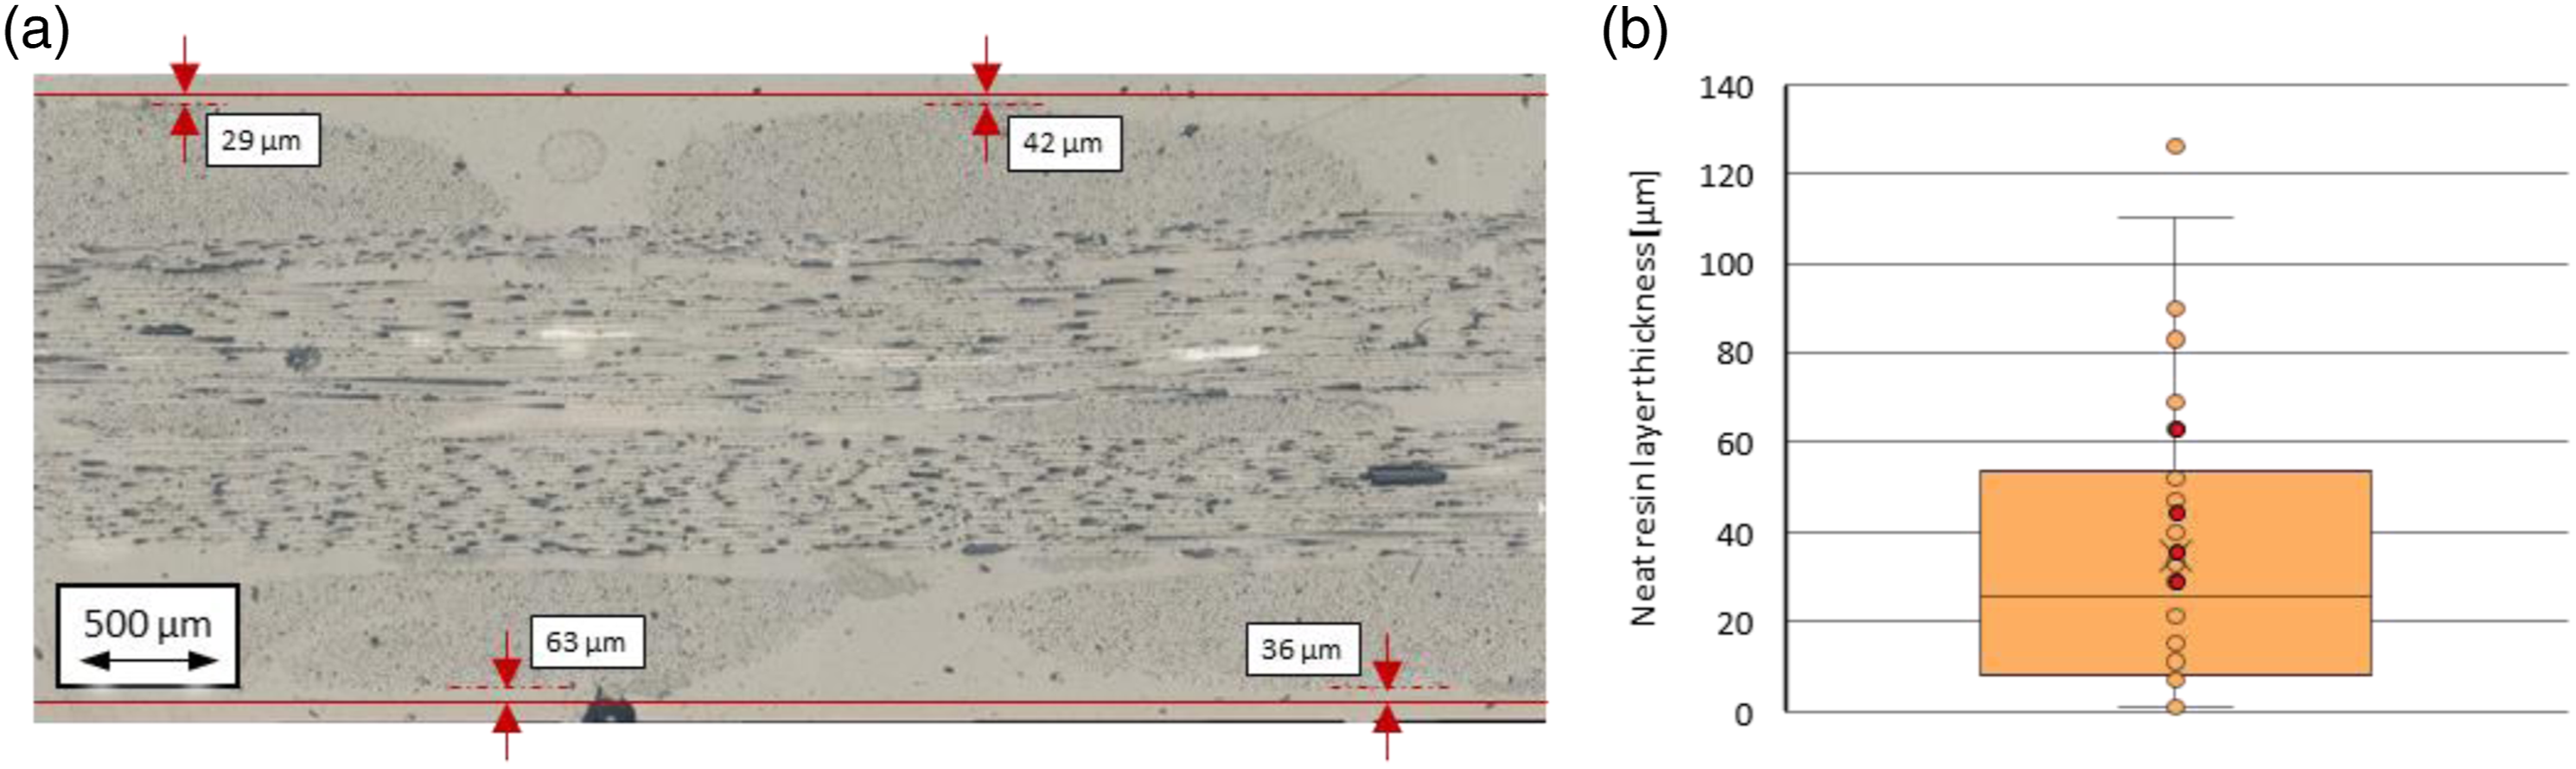
Figure 9 depicts Surface waviness 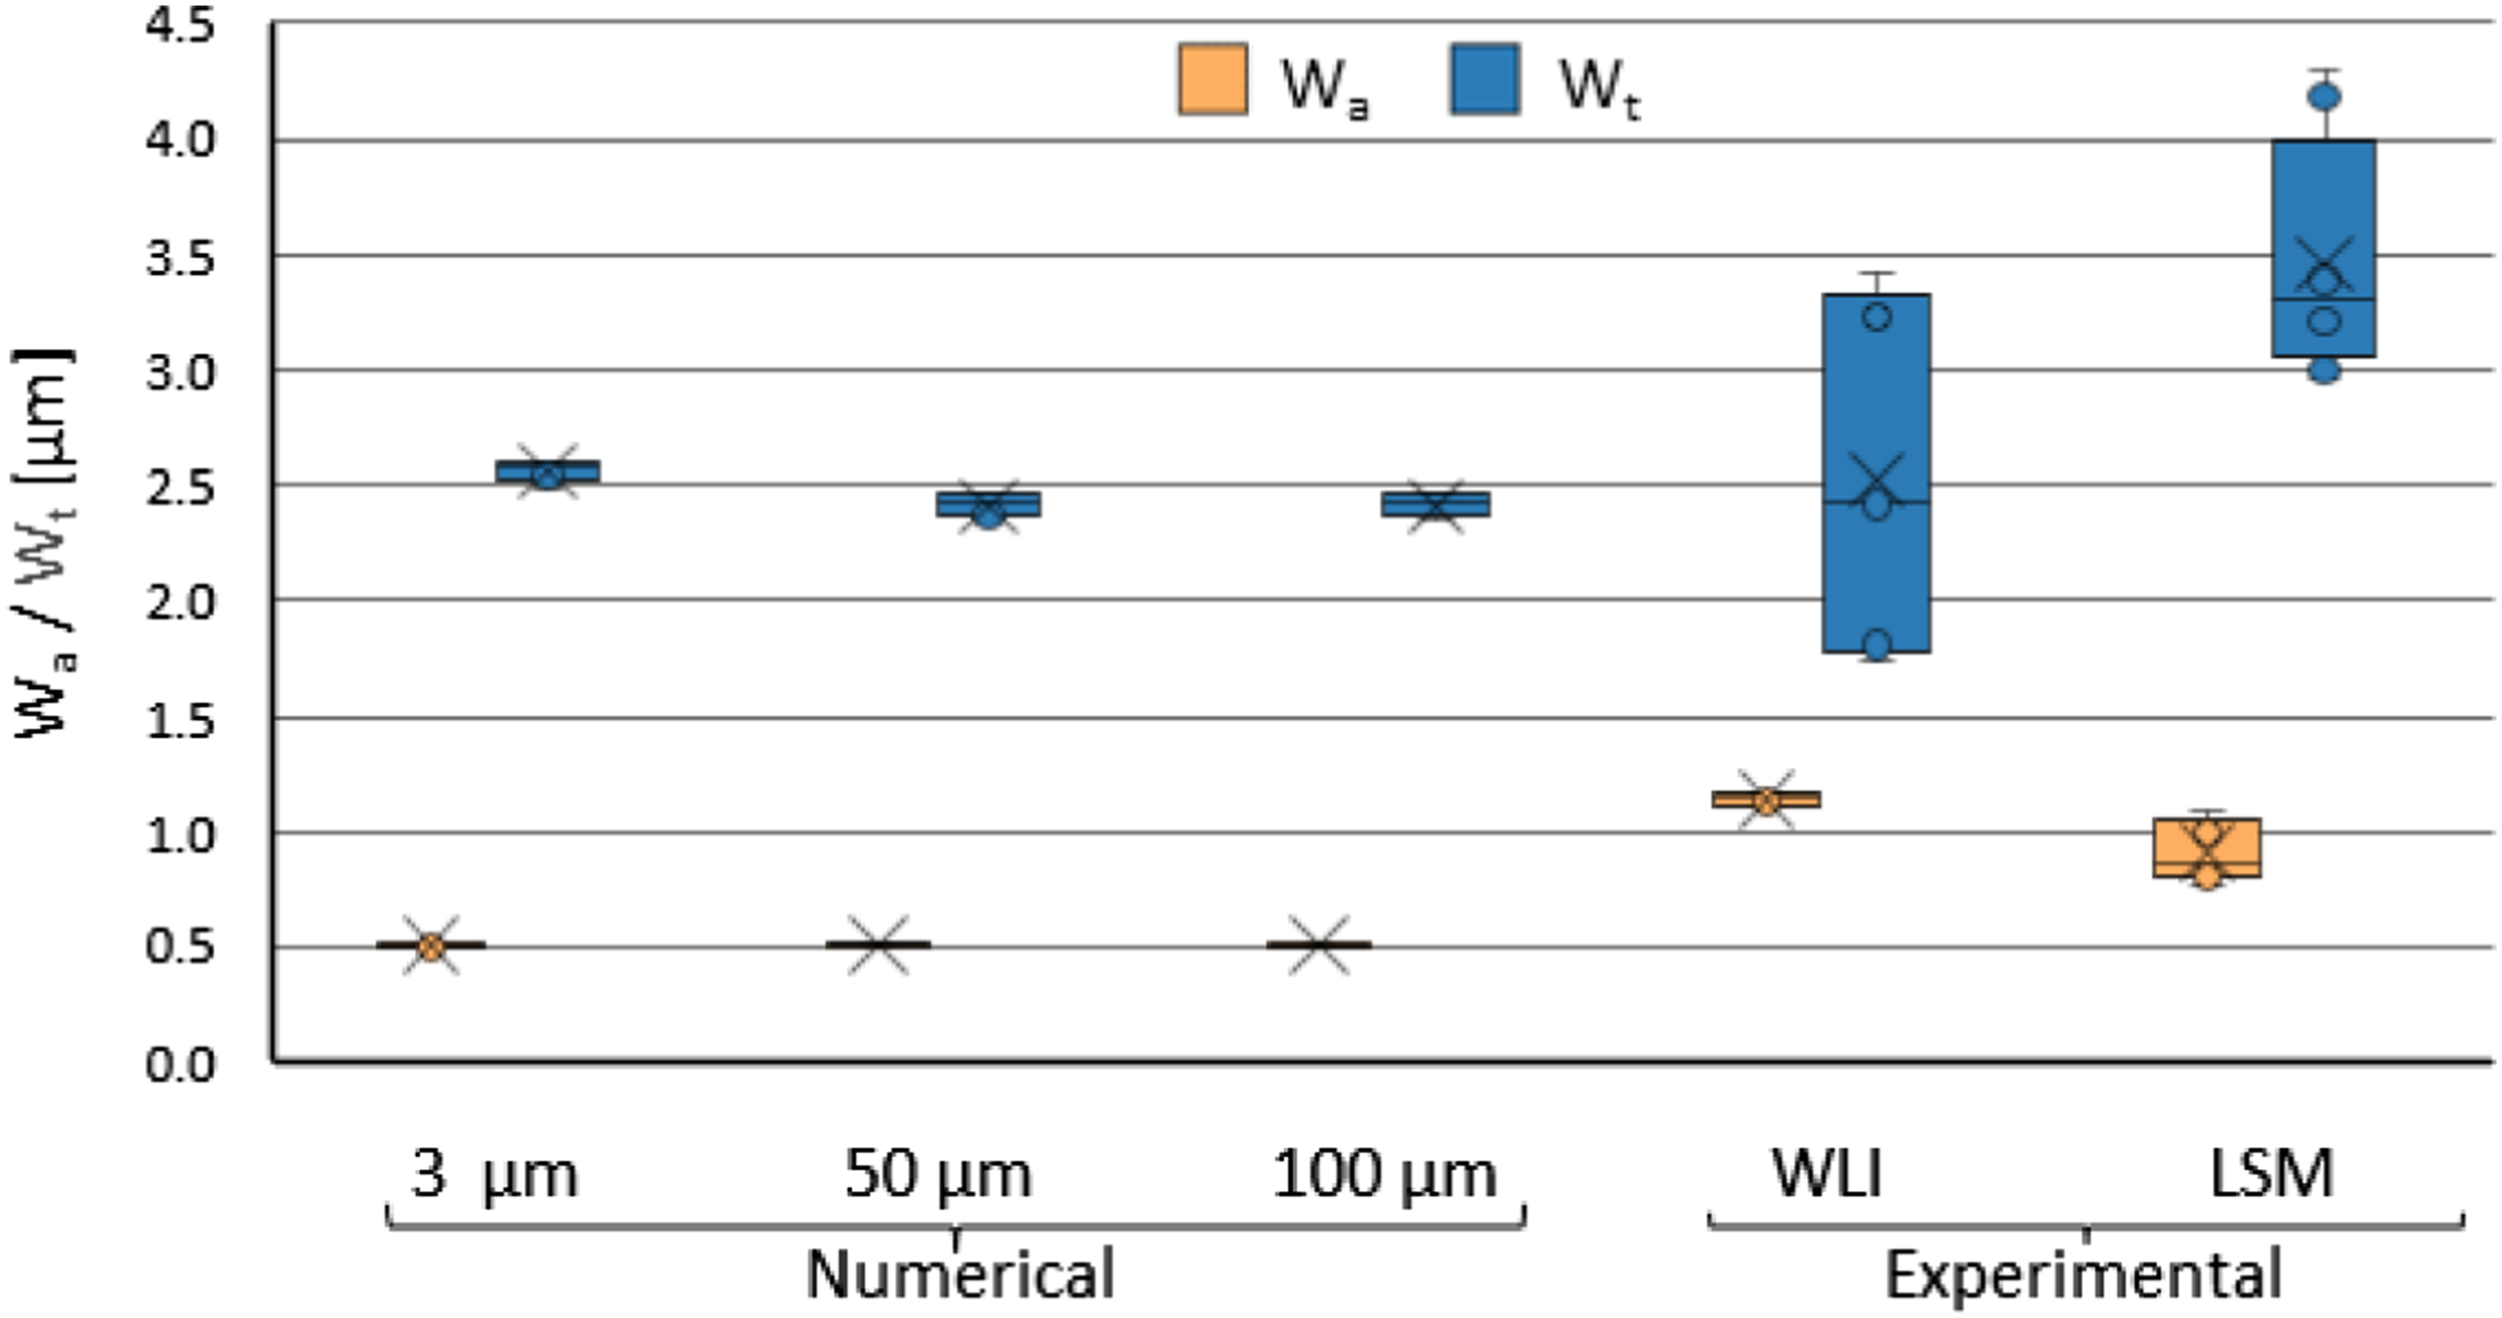
In general, the experimental data of the LCM in Figure 9 show slightly higher
Since these defects are not considered in the numerical simulation model, a discrepancy can be expected between the experimental data and the simulation. Still, for the underlying processing conditions especially the WLI data show good agreement with the numerically determined
It can be stated that the influence of the NRL thickness is of minor importance for the underlying range of 3–100 µm. No significant influence of NRL thickness on the waviness due to varying NRL thicknesses is to be expected for the manufactured FRP.
Experimental and numerical analysis on the impact of the processing conditions on
and
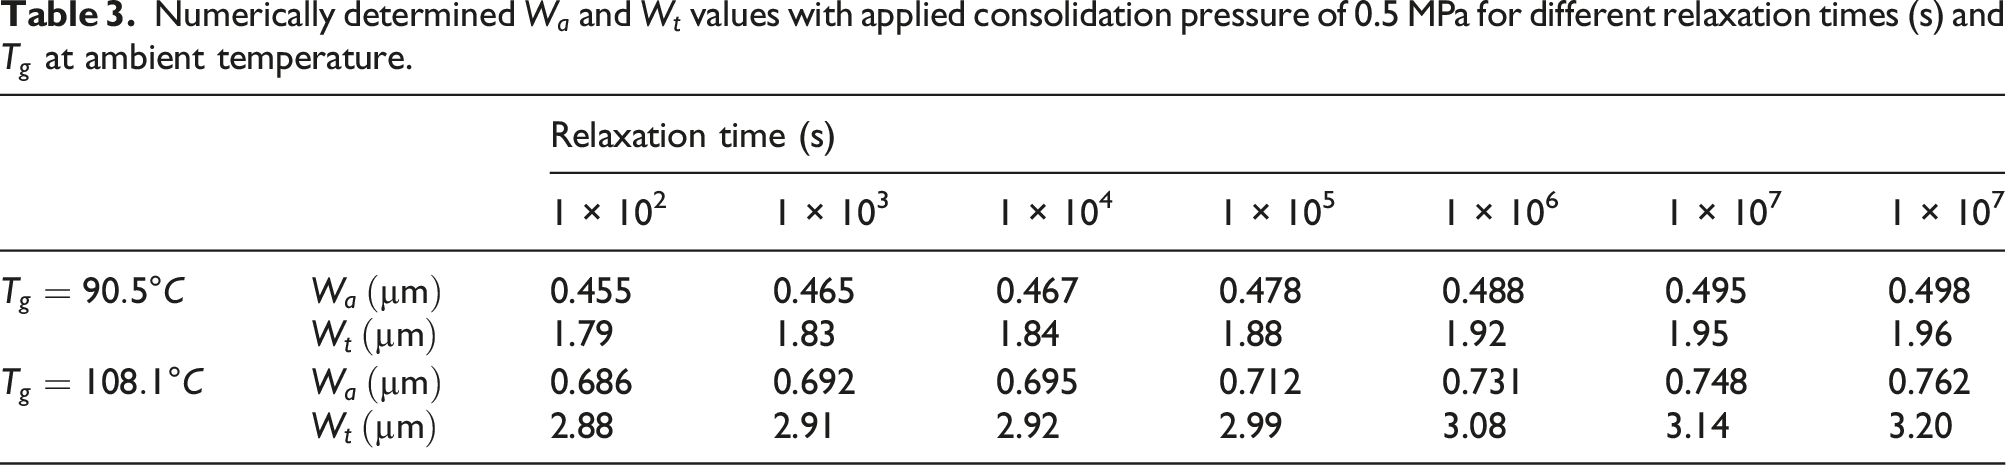
The influence of cure cycle and applied consolidation pressure on the experimentally and numerically determined surface waviness is depicted in Figures 10 and 11. Changing the applied consolidation pressure from 0.5 to 2.5 MPa in the underlying material model shows no measurable influence on the surface waviness. According to44,58 the pressure slightly influences the chemical shrinkage so that a slightly increased waviness was expected. Thus, on meso-scale the pressure-dependent effect of chemical shrinkage that is included in the present simulation approach is stated to be neglectable for the formation of surface waviness. Surface waviness Surface waviness 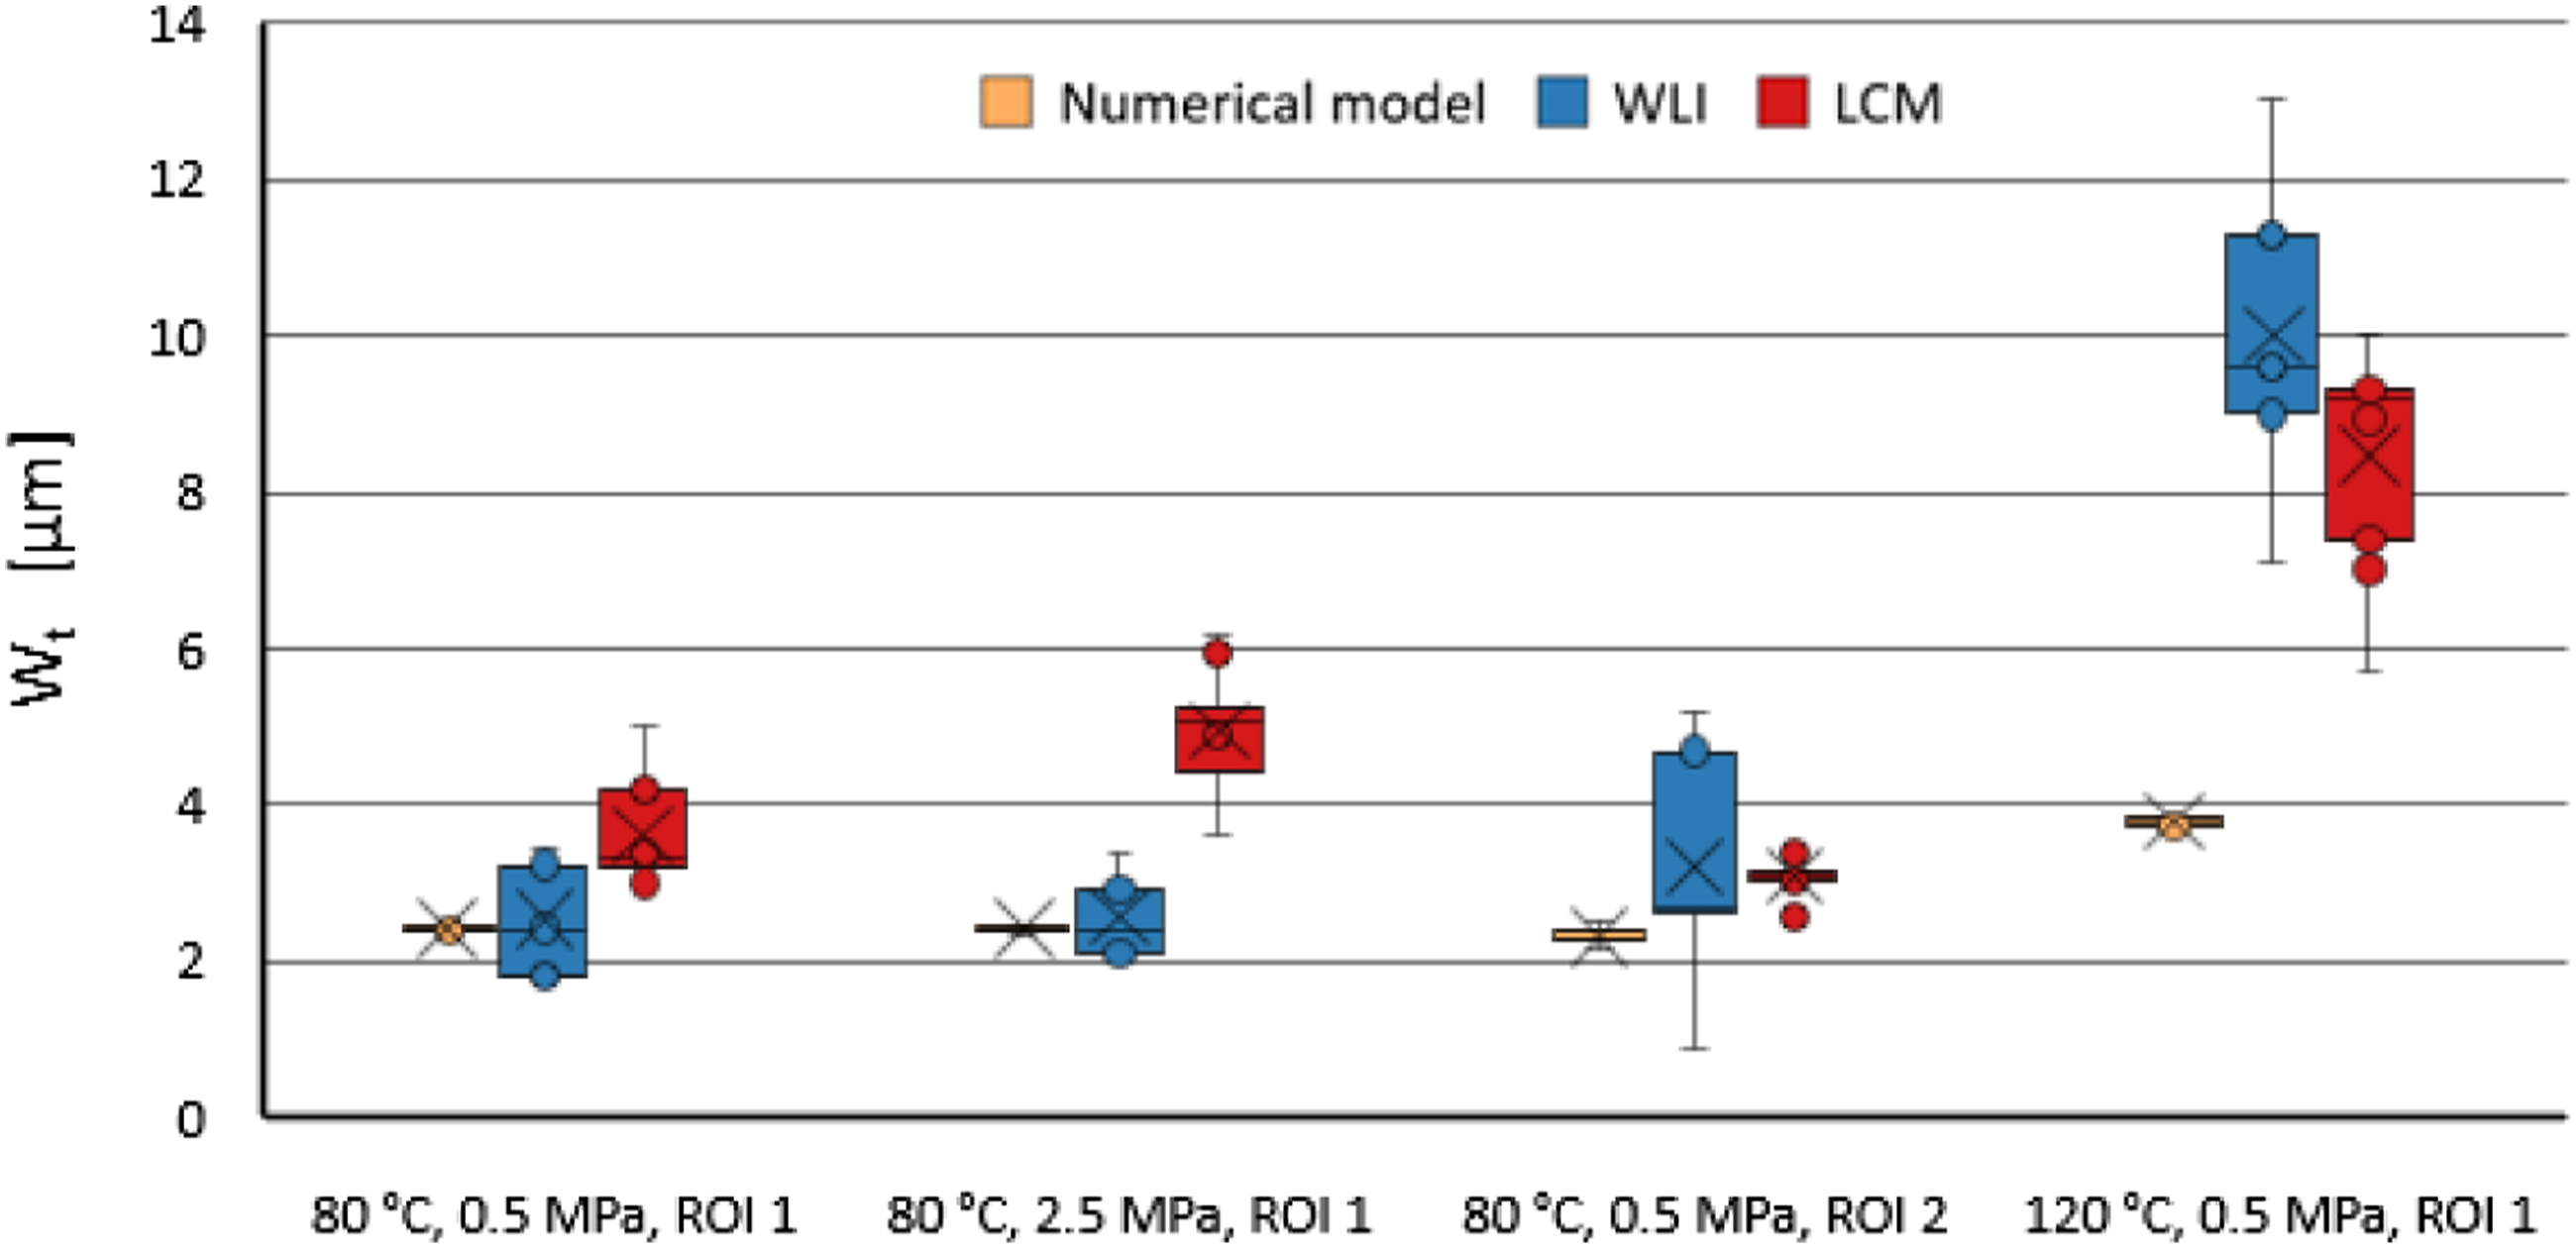
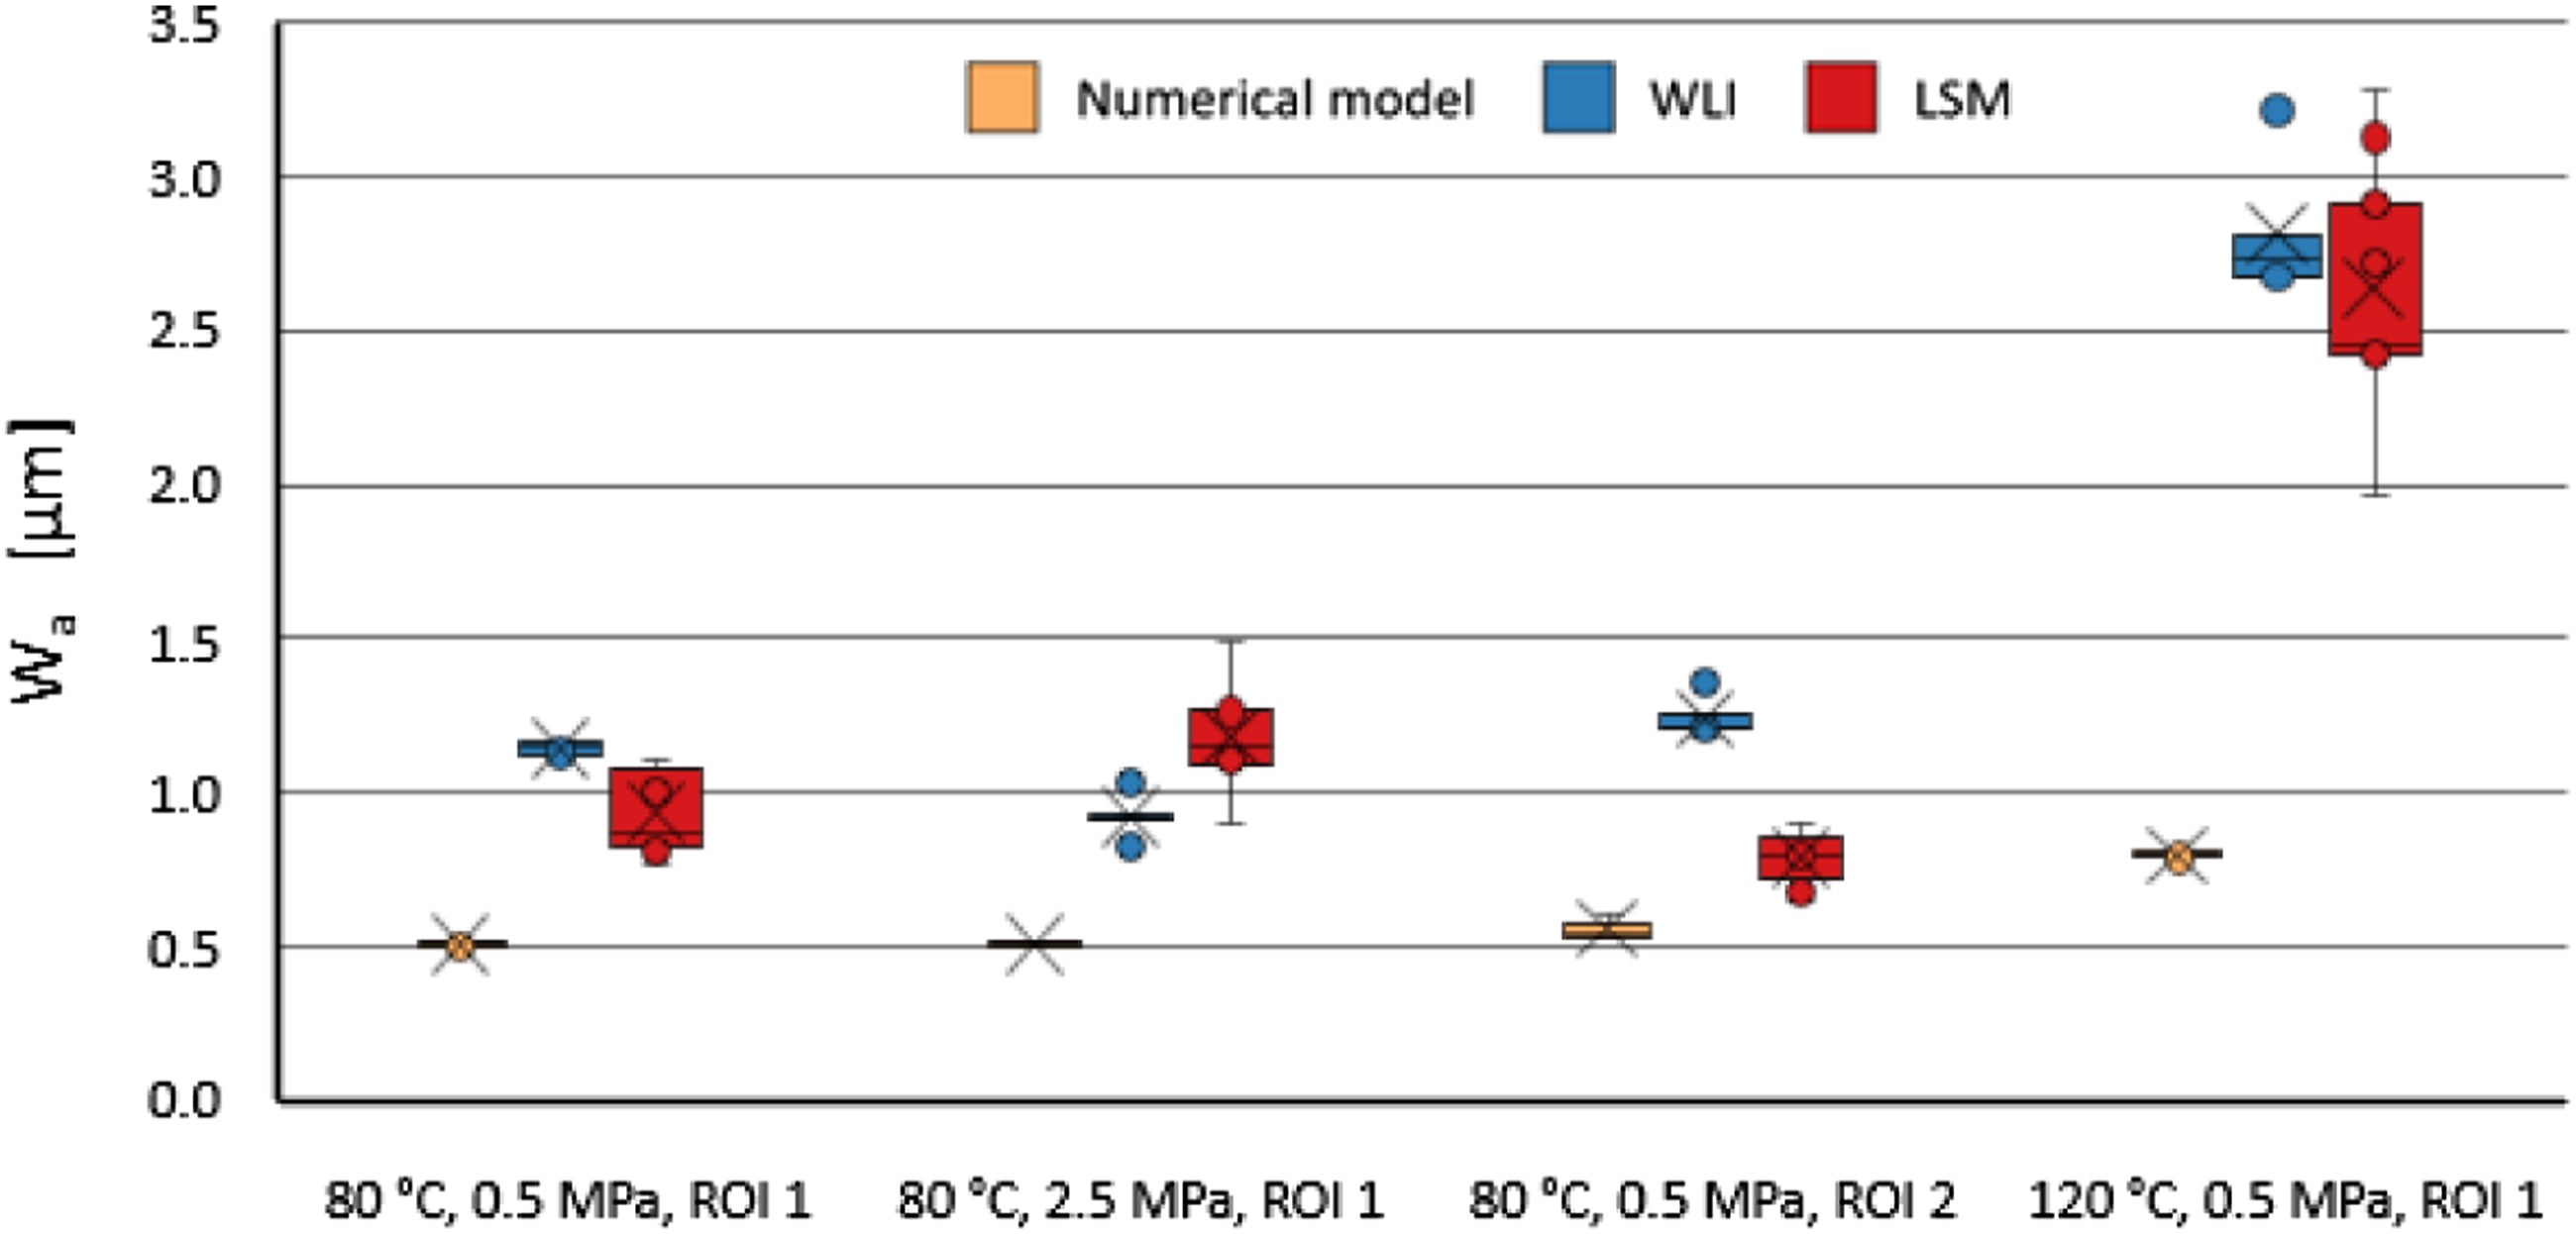
Within ROI 2 predicted
An elevated processing temperature of 120°C leads to a significant increase in predicted
Numerical and experimental values at the elevated curing temperature show significant differences which can be attributed to following aspects: The material data show particularly good fitting at 80°C.
42
Furthermore, fiber-matrix-interaction60,61 is intensified through faster injection process which non-reproducibly influences fiber architecture and favors voids at elevated tooling temperatures.
62
Since impregnation defects during the impregnation process and subsequent formation of voids
63
are not taken into account in the numerical model, the surface waviness is underestimated in the numerical prediction. Figure 12(b) and (c) shows a laminate manufactured with a 120°C tooling temperature exhibiting impregnation defects and voids, while the laminate manufactured with a 80°C tooling temperature (Figure 12(a)) shows no apparent defects. Assuming a generic temperature cycle that is imposed on all nodes, the thermal shrinkage may be underestimated by the model due to the exclusion of temporary temperature increases by the heat generated as a consequence of the exothermal curing reaction. Since this most likely occurs at higher curing temperatures (and thus higher reaction rates Transmitted light photographic images of the manufactured components. The part manufactured at 80°C is depicted in (a) while (b) shows micropores and (c) inter-tow impregnation defects of parts manufactured at 120°C. To clearly highlight the surface defects, the component surface in (c) has been painted and subsequently cleaned. The color remaining in the surface near impregnation defects cause the matt surface appearance.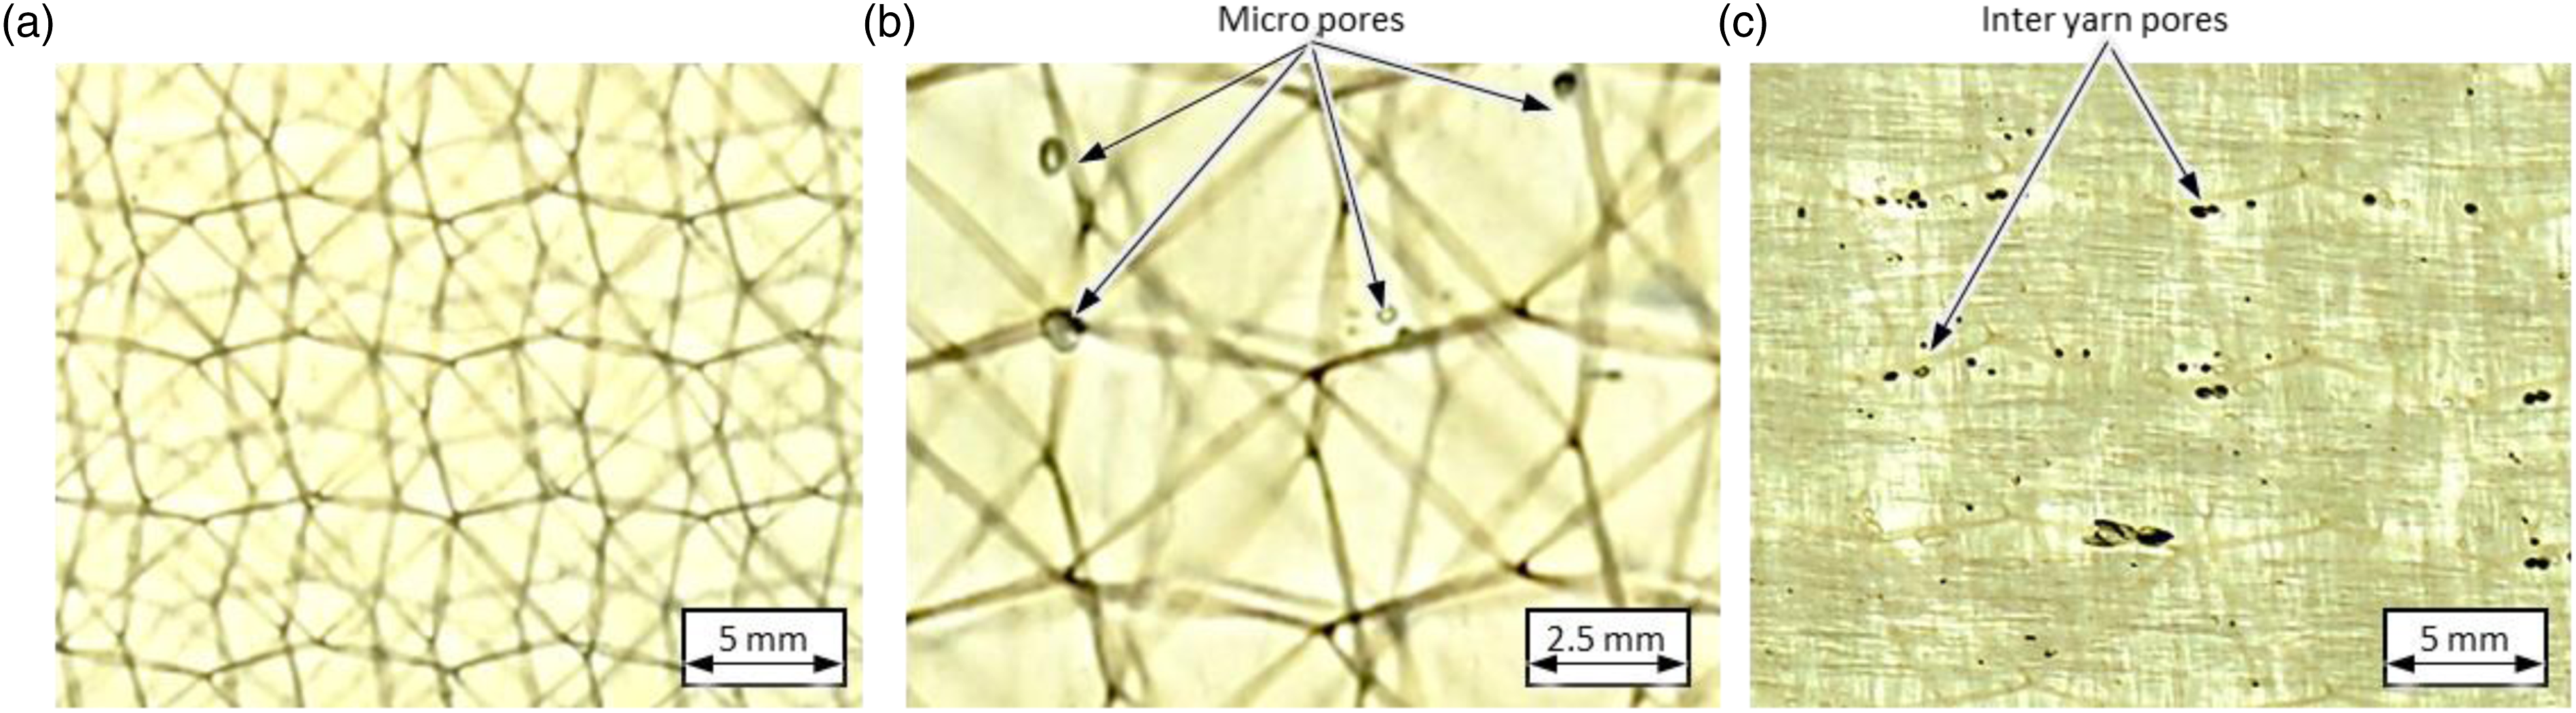
In particular, the processing temperature is of decisive importance for the level of
Experimental and numerical analysis on the impact of the processing conditions on LW
In the following, the numerical and experimentally determined Surface waviness 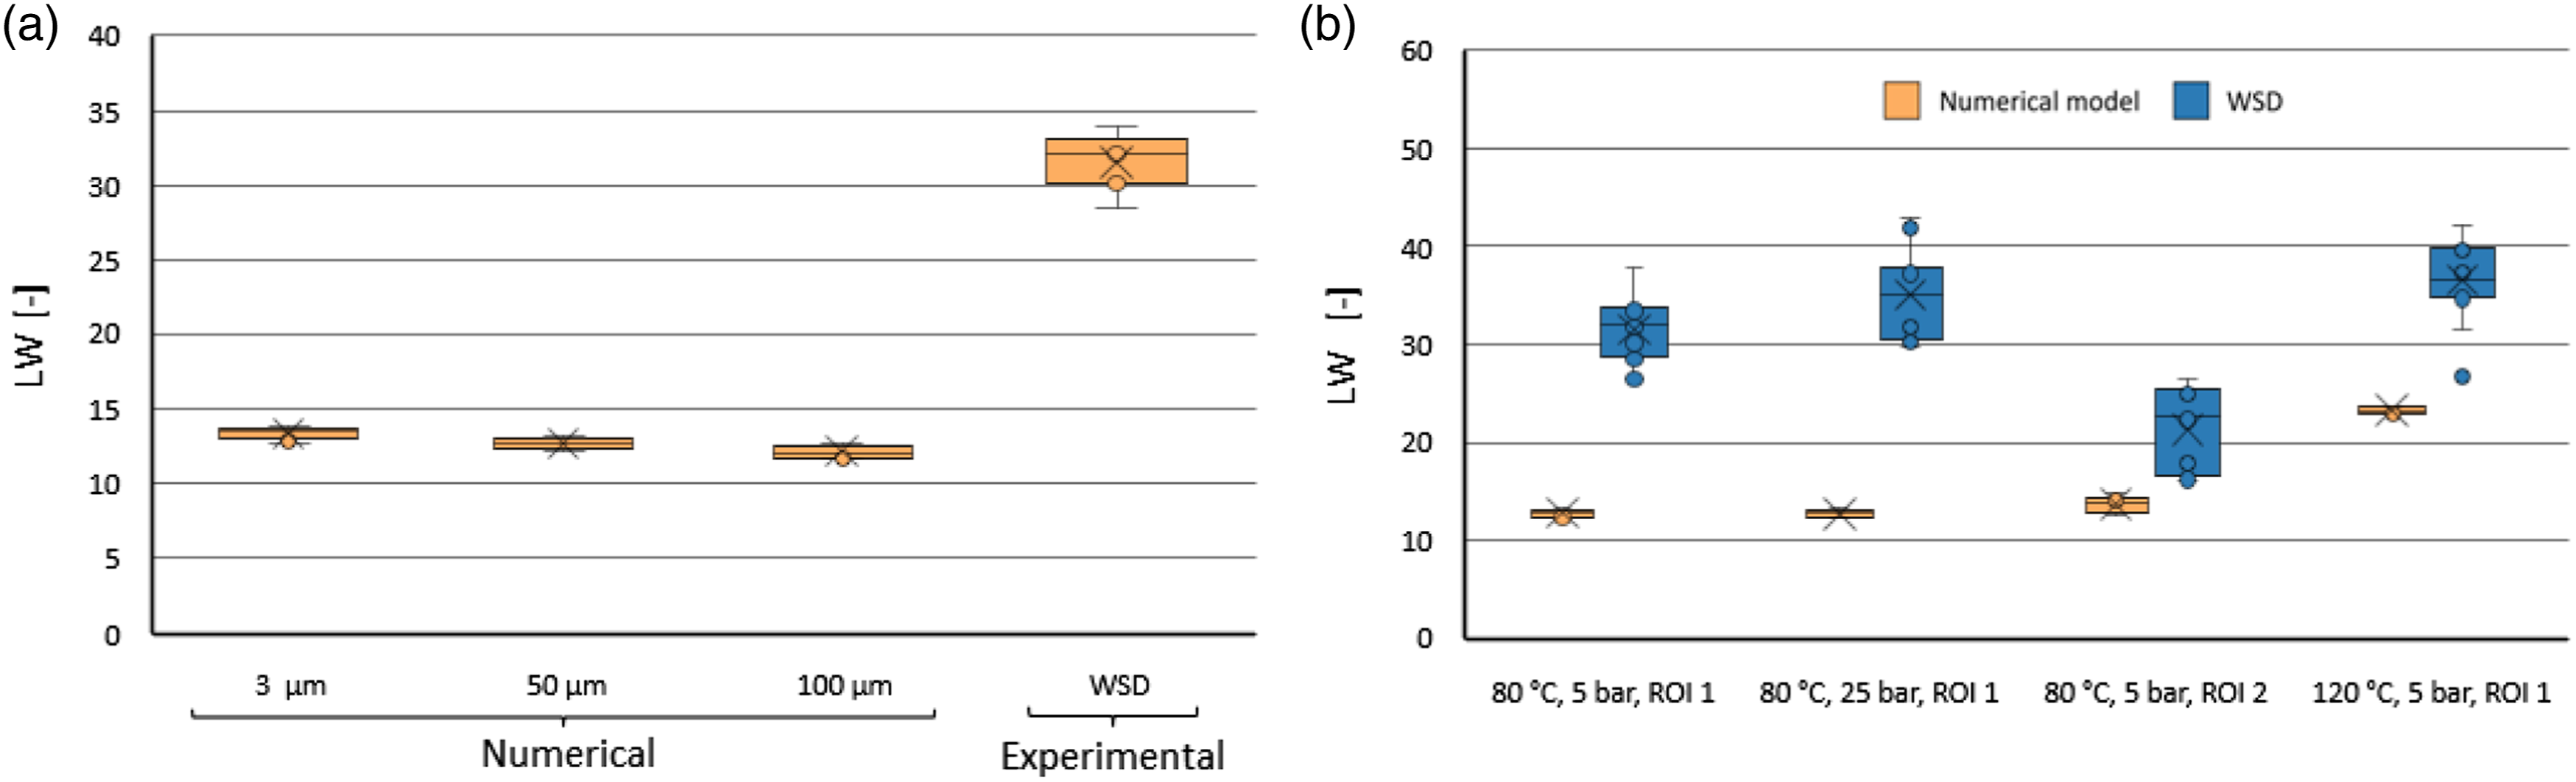
The reason for the deviations might be that a surface area of 100 × 10 mm2 is measured with the WSD, while only a surface area of 7 × 0.5 mm2 is numerically calculated. Since no separation into the ROIs is possible for the experimental measurements, different sized areas and thus the mean value of a large width is being compared with a smaller and defined ROI. Furthermore, it should be noted that the correlation equation (1) was mainly validated for non-translucent carbon fiber fabric components. Since the studied GFRP have a translucent surface and therefore exhibit different reflection and transmission behavior of the surface. That circumstance can lead to measurement errors and deviations based on the reduced reflectivity of the components surface and resulting low image forming qualities. 66
The influence of the process parameters is shown in Figure 13(b) and is also underestimated by the simulation. Qualitatively, the results for the analysis of the process influence are comparable to those for the
Numerical analysis - Formation of surface waviness caused by long term relaxation
To consider the relaxation effects after accomplished the cooling process, the time-dependent surface waviness profile after demolding is proposed in Figure 14. The corresponding Change of profile height cured at 80°C ( Numerically determined Absolute 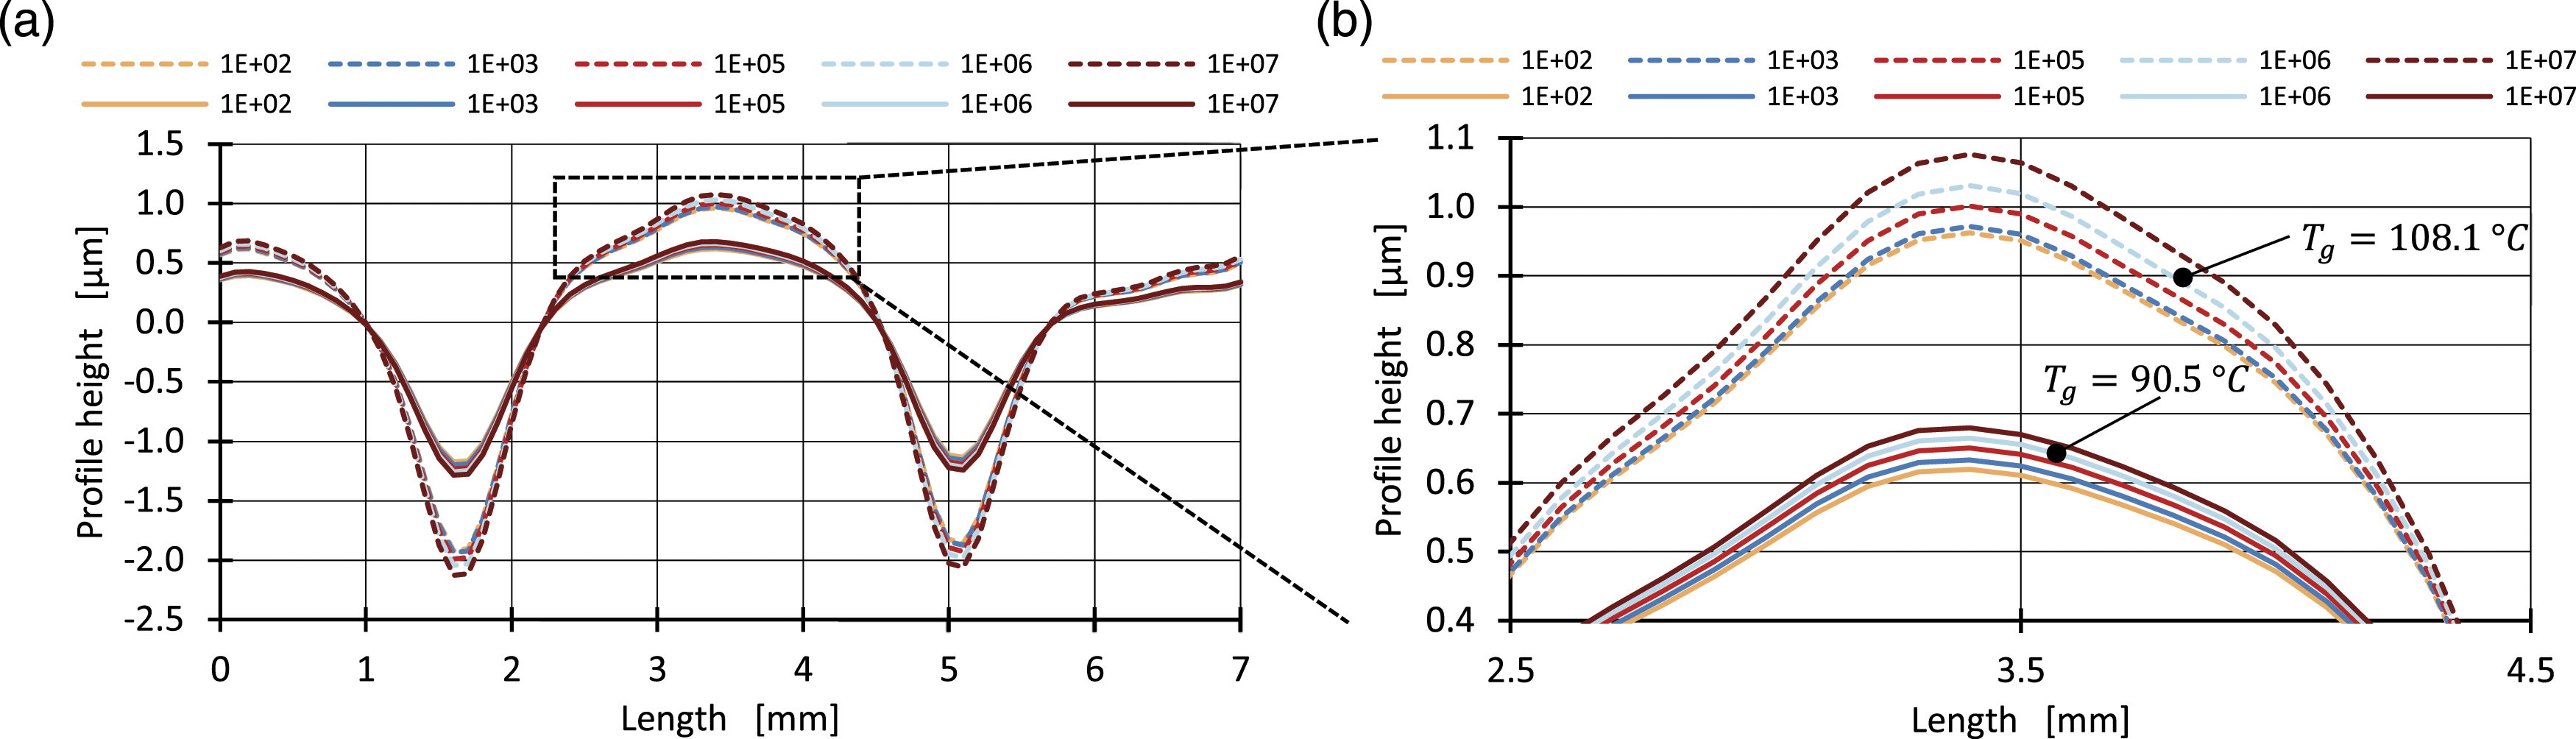
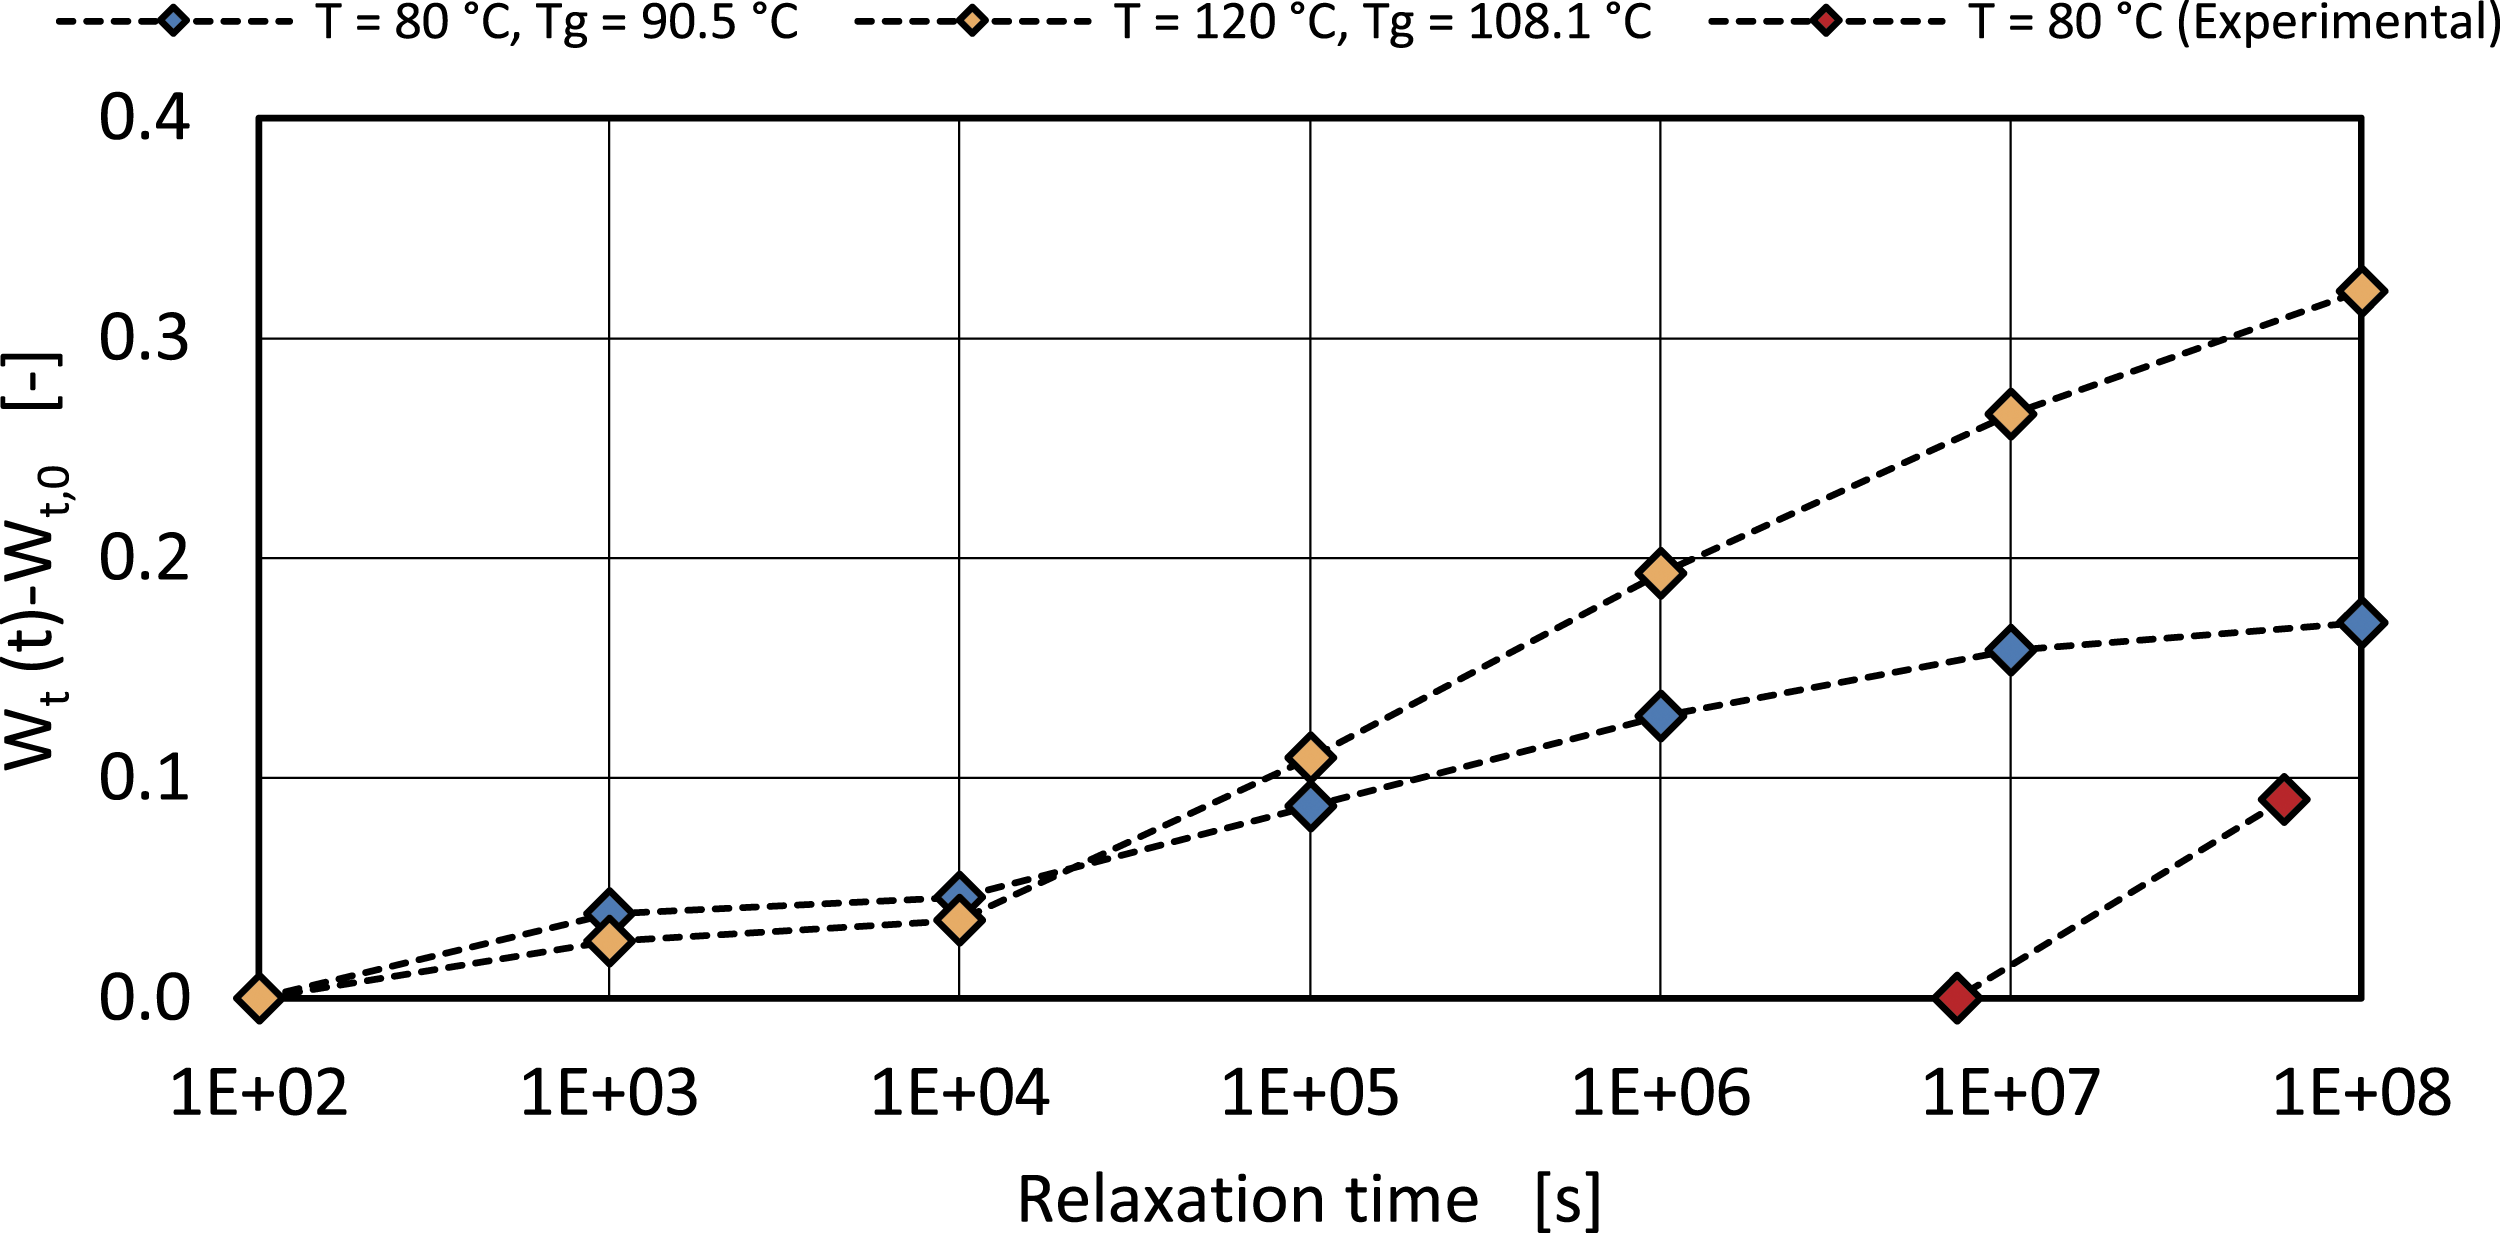
A direct comparison of time-dependent development of
In addition to the numerical analysis, the time-dependent influence on Surface profiles determined by WLI 3 and 24 month after the manufacturing process.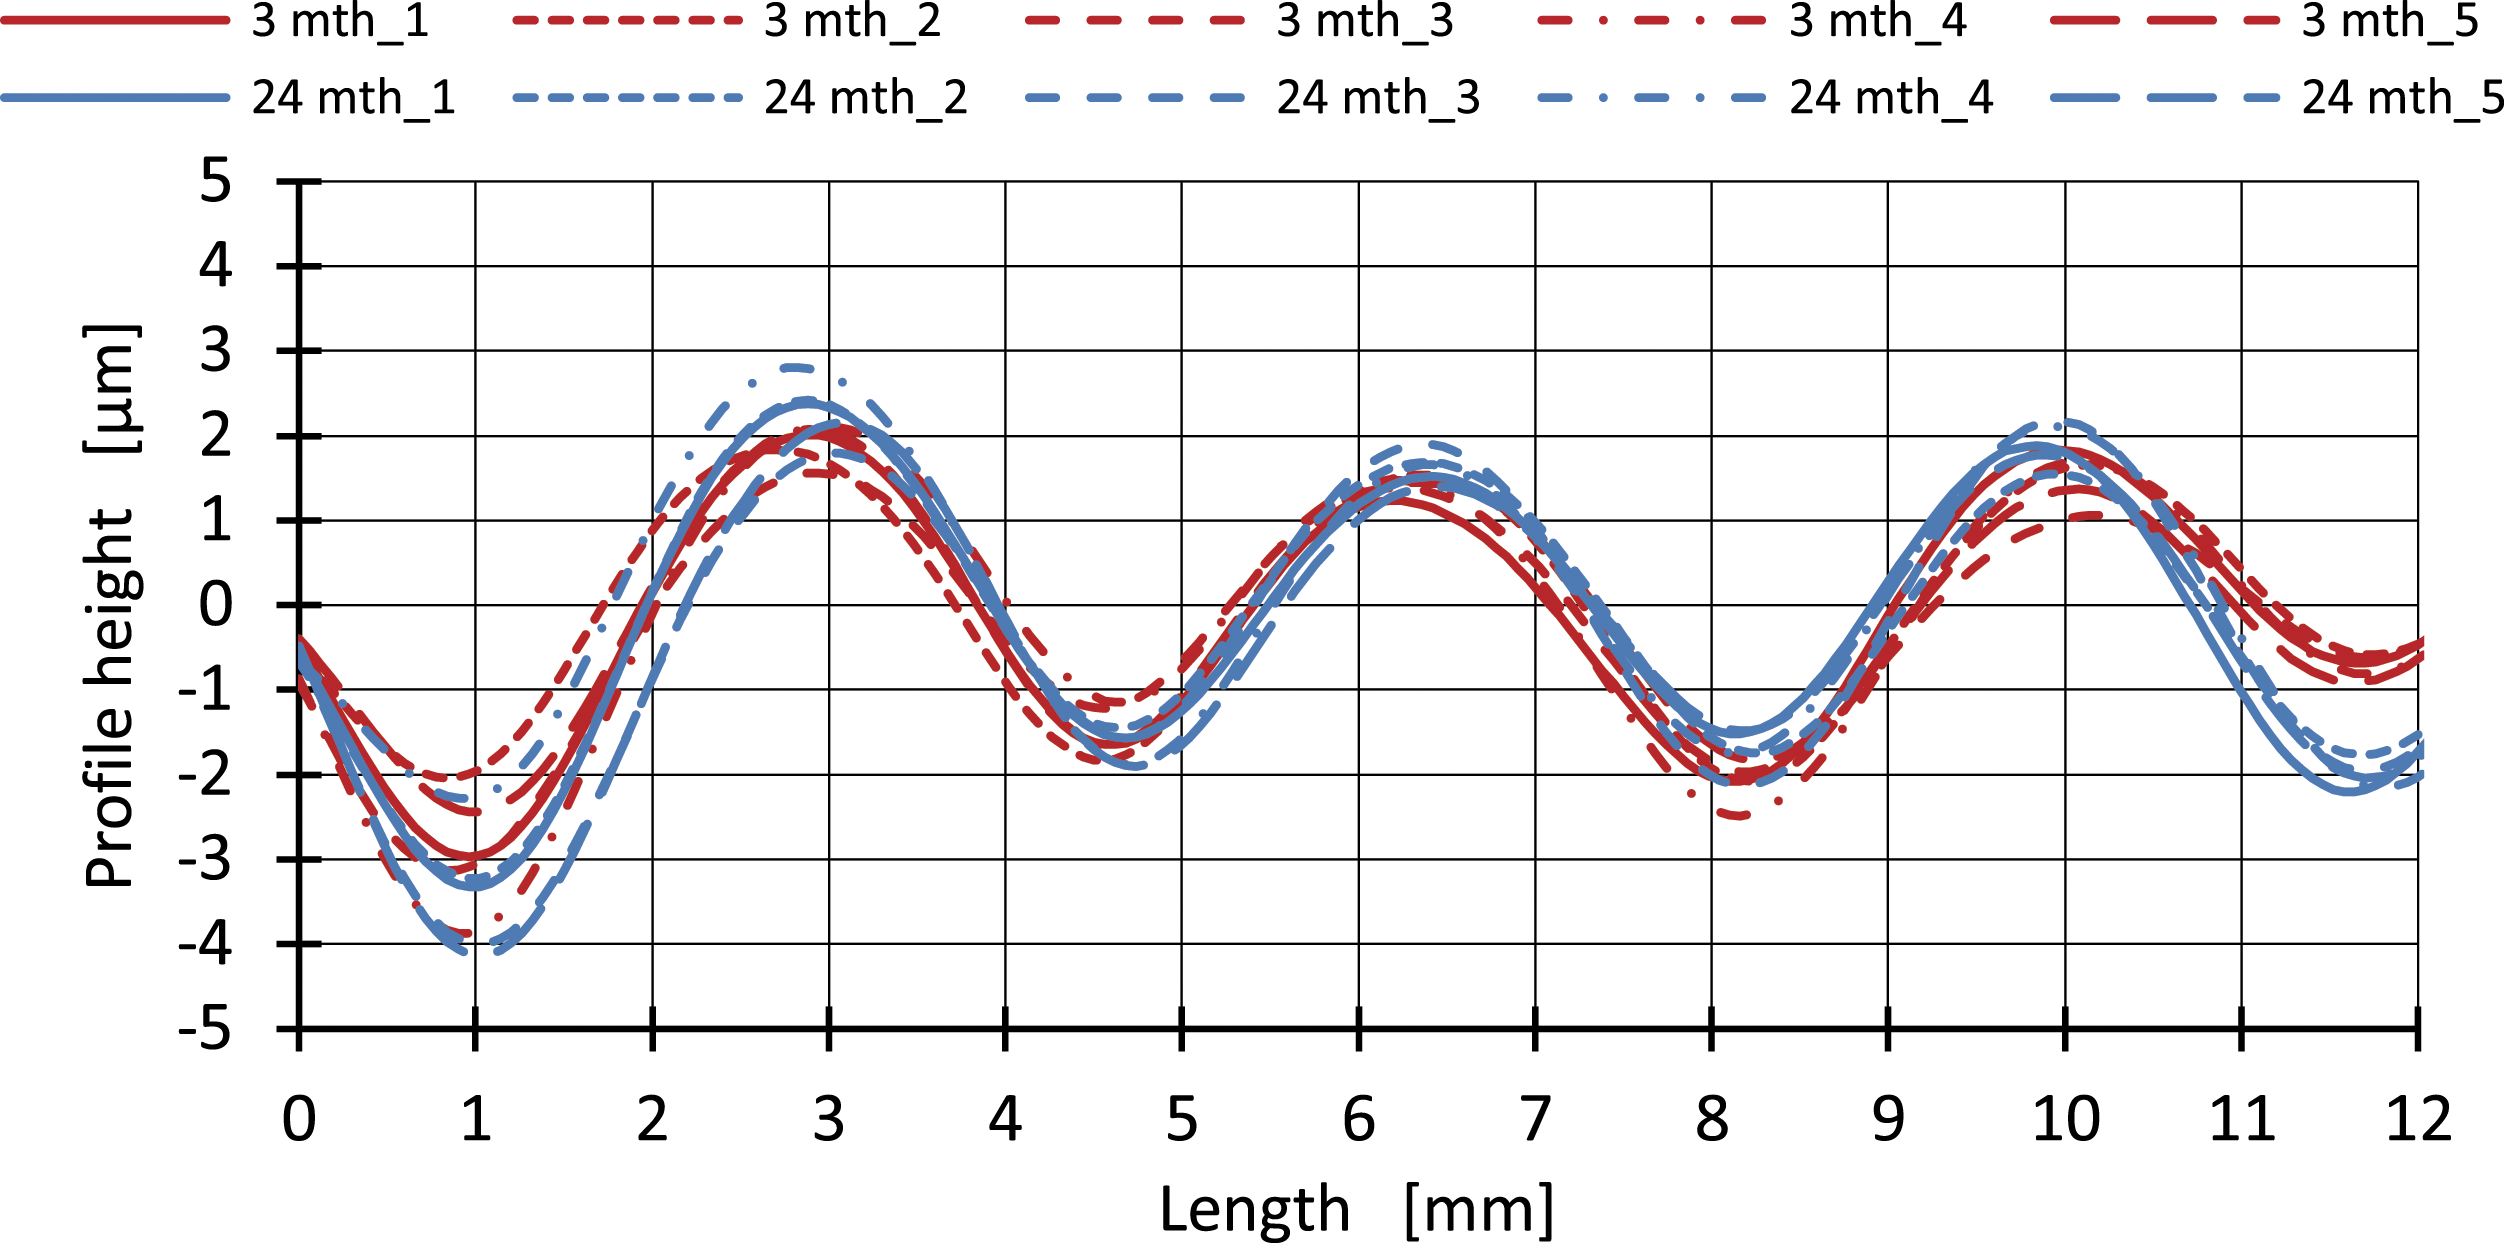
Mean
For a post-painting process of parts cured at elevated temperatures, the coating film thickness should be increased to compensate for the surface waviness that develops during the relaxation process. The present findings represent an important advice for subsequent coating processes as time-delayed surface displacement is to be considered for predicting final part surface properties.
Conclusions
In this paper, the surface waviness of GFRP with fast-curing epoxy resin matrix was investigated and analyzed numerically and experimentally. A thermo-viscoelastic simulation approach was applied to predict the formation of the surface waviness during the manufacturing process. The numerical results are compared with experimentally obtained results. To accurately represent the processing conditions and the material behavior, a cure-dependent thermo-viscoelastic simulation approach has been used and extensive characterization and modelling of the textile geometry has been carried out. • Based on the present numerical investigation, a subordinate effect of the NRL on the resulting surface quality has been found. • Further, a good agreement between numerically predicted and experimentally determined surface waviness • Based on the deviations between predicted and simulated • By considering the relaxation behavior after the cooling process, the surface displacement was simulated for a time up to 10 × 108 s which corresponds to 3.2 years. This resulted in an additional displacement up to 0.32 µm. The relaxation-induced change of
The present simulation approach provides a basis for optimization strategies to improve surface quality of fast-cured GFRP and reduce post-processing effort by advanced process design. Further work will focus on generalizing equation (1) for translucent parts.
Footnotes
Acknowledgements
The authors are grateful to the Center for Information Services and High-Performance Computing [Zentrum für Informationsdienste und Hochleistungsrechnen (ZIH)] at TU Dresden for providing its facilities for high throughput calculations.
Declaration of conflicting interests
The author(s) declared no potential conflicts of interest with respect to the research, authorship, and/or publication of this article.
Funding
The depicted research has been funded by the Deutsche Forschungsgemeinschaft (DFG) within the Project 415849481. We would like to extend our thanks to the DFG.