
Abstract
The stiffness of polymeric materials can be improved dramatically with the addition of nanoparticles. In theory, as the nanoparticle loading in the polymer increases, the nanocomposite becomes stiffer; however, experiments suggest that little or no stiffness improvement is observed beyond an optimal nanoparticle loading. The mismatch between the theoretical and experimental findings, particularly at high particle loadings, needs to be understood for the effective use of nanoparticles. In this respect, we have recently developed an analytical model to close the gap in the literature and predict elastic modulus of nanocomposites. The model is based on a three-phase Mori-Tanaka model coupled with the Monte-Carlo method, and satisfactorily captures the experimental results, even at high nanoparticle loadings. The developed model can also be used to study the effects of agglomeration in nanocomposites. In this paper, we use this model to study the effects of agglomeration and related model parameters on the stiffness of nanocomposites. In particular, the effects of particle orientation, critical distance, dispersion state and agglomerate property, and particle aspect ratio are investigated to demonstrate capabilities of the model and to observe how optimal particle loading changes with respect these parameters. The study shows that the critical distance defining agglomerates and the properties of agglomerates are the key design parameters at high particle loadings. These two parameters rule the optimal elastic modulus with respect to particle loading. The findings will allow researchers to form design curves and successfully predict the elastic moduli of nanocomposites without the exhaustive experimental undertakings.
Introduction
Nanoparticles have great potential to enhance the mechanical properties of polymeric materials. Various nanoparticles are shown to improve the stiffness of polymers: nano clay,1,2 carbon nanotubes,3,4 cellulose nanocrystals (CNC),5,6 layered aluminosilicates. 7 This improvement is mostly due to the nanoparticles’ high surface-to-volume ratio,8,9 and extraordinary properties. It is also shown that the addition of nanoparticles can change the polymer crystallinity 1 and initiate specific interactions between polymer chains and nanoparticles, 10 also known as the polymer-particle interface.
The volume of the polymer-particle interaction is maximized when nanoparticles are uniformly dispersed; however, nanoparticles tend to agglomerate due to their high surface area and energy. Particularly, high nanoparticle loadings could result in agglomeration 11 and cause overlaps of the polymer-particle interfaces. Beyond a certain particle concentration, agglomeration is shown to be a limiting or even detrimental factor to the targeted properties of polymers in many studies.12–15 This adverse effect could cause mismatches between experimental findings and model predictions. Therefore, producing polymer nanocomposites with accurately predicted properties is still a challenge.16,17
Predicting nanocomposites’ elastic properties at various particle loading levels is an important aspect of nanocomposite studies. Accurate predictions increase the efficient use of nanoparticles and lower the cost and time spent on the experimental work. In recent years, many numerical and analytical models were developed to predict the elastic modulus of nanocomposites.18–23 Numerical models, especially molecular-level simulations, such as molecular dynamics, may produce accurate predictions in small length scales; however, they require high computational power to achieve macro-scale responses due to complex interactions between simulated elements. On the other hand, analytical micromechanical models may serve as a viable alternative for predicting the elastic modulus of polymer nanocomposites. They are, in general, easy to use, low cost, and reasonably accurate.6,24
Short-fiber micromechanical models such as the Mori-Tanaka, 25 have been used or modified to predict nanocomposites’ behaviour. For example, Jinsu et al. used the Mori-Tanaka micromechanics to predict elastic moduli of the silane functionalized ceramic nanocomposite. 26 It was shown that the Mori-Tanaka model agrees well with the experimental data of 0.04 volume fraction of TiO2 in acrylate matrix. 26 The Halpin-Tsai micromechanics is another short-fiber composite model 27 that was modified and implemented to estimate material properties of nanocomposites. Zhang et al. 4 included carbon nanotube distribution, waviness, and networks for accurate predictions. Their model agrees well with two existing literature data; however, they suggested that a more compressive model capable of considering carbon nanotube agglomeration is needed. Researchers also introduced new variables to micromechanical models or used multiscale approach for more accurate predictions. Arash et al. 28 developed an effective interface model that considers the interface between the reinforcing element and matrix to predict elastic modulus of carbon nanotube polymer composites. The properties of the interfacial region were obtained based on molecular simulations, and these properties were utilized in a modified Mori-Tanaka model. Kim et al. 29 investigated the mechanical properties of carbon nanotube modified carbon fiber reinforced epoxy composites by developing a multiscale composite model. The Halpin-Tsai model was applied to obtain carbon nanotube/Resin 2-phase system and then woven fiber micromechanics was used for the integration of fibers into the model. The model overestimates the experimental results. Kim et al. 29 claimed that the assumption of perfect bonding increases the discrepancy between modeling and experimental results.
Many investigators included agglomeration as another variable into analytical micromechanical models for better predictions. Luo and Daniel 30 proposed a three-phase analytical model based on a hybrid use of the Mori-Tanaka model and rule of mixtures to predict the elastic modulus of polymer clay nanocomposites. The developed model incorporates random orientation of clay layers and various exfoliation levels to capture the mechanical responses. In their experimental work, only low concentration levels (up to 1 w%) of clays were utilized, and higher concentration levels were not explored. The predictions agree well with the experimental findings when experimental parameters are accurately implemented. Shi et al. 4 studied the CNC waviness and agglomeration and their effect on the mechanical responses of the composites. The authors employed Eshelby’s inclusion model to predict the elastic modulus of the composite with a spherical inclusion/agglomeration assumption; however, they withheld the exact definition of agglomerates. Villoria and Miravete 31 focused on the effects of clusters on the stiffness of composites. They applied the Reuss model to predict the stiffness of clusters because it was assumed that fibers would stick side by side in agglomerated regions. Their study predicts composite stiffness as a function of clustered fibers; however, agglomerated regions’ definition needs further expansion.
Many researchers solely investigated the clustering/agglomeration effect on the mechanical properties of composites from different perspectives. Bhattacharyya and Lagoudas 32 studied different possible microstructures to calculate the clustering effect on the stiffness of composites. In the study, the clustering state is represented by probability distribution functions and a sensitivity study is conducted with respect to different clustering states. Although it is a great approach to studying the clustering effect, Bhattacharyya and Lagoudas did not discuss the exact definition of agglomerates in their study and the elastic modulus. Segurado et al. 33 studied the effect of particle clustering in finite element analysis by dispersing particles randomly in the computer setting. They idealized the inhomogeneous structure with clustered particles in a spherical manner and created this structure with random dispersion. The dispersion state was limited to random dispersion and only 15 v% particle loading was studied. Hammerand et al. 34 also used the finite element method to calculate the elastic modulus of carbon nanotube embedded epoxy for different cases of clustering. In this study, clustering is defined as a deviation state from uniformly dispersed particles; however, the exact definition of a cluster is not presented, and RVE is limited to only a few particles. Further, they only studied low particle loadings that is up to 1.0 v%.
Attempts to predict elastic properties of nanocomposites are invaluable; however, current studies in literature suggest that there is a gap in knowledge as the available analytical models are, in general, limited in their ability to capture experimental trends at high nanoparticle loadings. Furthermore, exact definition of an agglomerate is missing in the current literature. Intuition and existing analytical model predictions suggest that improvement in stiffness increases as the particle loading increases. On the other hand, the reinforcement is limited to optimal particle loading. Additional particle loadings higher than the optimal particle loading become detrimental to the mechanical properties of nanocomposites35–39. It can be claimed that the existing analytical models do not account for the complex nature of nanocomposites and agglomeration, and thus they fail to predict the elastic modulus of nanocomposites at high particle loadings.
Recently, we developed an analytical model that uses a three-phase Mori-Tanaka model and the Monte-Carlo method to predict the stiffness of nanocomposites. 40 The model predictions and experimental findings match well. A comprehensive study of the model’s parameters can allow us to examine and understand the effect of agglomeration on nanocomposites to address the aforementioned gap in the literature.
Consequently, in this paper, we focus on and study the effect of the model’s parameters to establish a sensitivity analysis for the model. We investigate the effect of critical design variables defined in the model, such as the critical distance, agglomerates’ properties, aspect ratio, particle loading, and various dispersion states of nanoparticles. The predictions of the proposed model are cross-examined with experimental results from the previous study 40 where polyamide 6 (PA6) is reinforced with cellulose nanocrystals (CNC).
Modelling
The current micromechanical models41,42 assume uniformly dispersed particles; however, obtaining uniformly dispersed nanoparticles is unrealistic because of nanoparticles’ high surface energy and area. This non-uniform dispersion state of nanoparticles could result in mismatches between model predictions and experimental results, particularly at high particle loadings. We aim to lower these mismatches by introducing an agglomerate phase into the model. The model, in this study, combines the Monte-Carlo approach with analytical models to capture the effect of agglomeration on the elastic modulus of nanocomposites.
The previously developed model 40 aims to offer a simple yet accurate method to predict elastic properties of nanocomposites with respect to particle loading. Its mainframe is introduced here for ease of following; however, interested readers can see the details in the original publication. 40
The proposed model is developed based on six main steps: (1) particles are dispersed in a computational setting, (2) agglomerated particles are detected using a machine learning method, (3) agglomerates are averaged based on their volume fractions and particles concentrations, (4) the elastic modulus of the averaged agglomerate is calculated using analytical models, (5) a three-phase Mori-Tanaka model is applied for homogenization, and (6) the Monte-Carlo method is utilized for obtaining statistical information about the elastic modulus of composites. Each step has various parameters, and these parameters are explained in the subsections of this section. For the visualization purpose, the schematics of the homogenization approach are given in Figure 1. Schematics of the homogenization approach.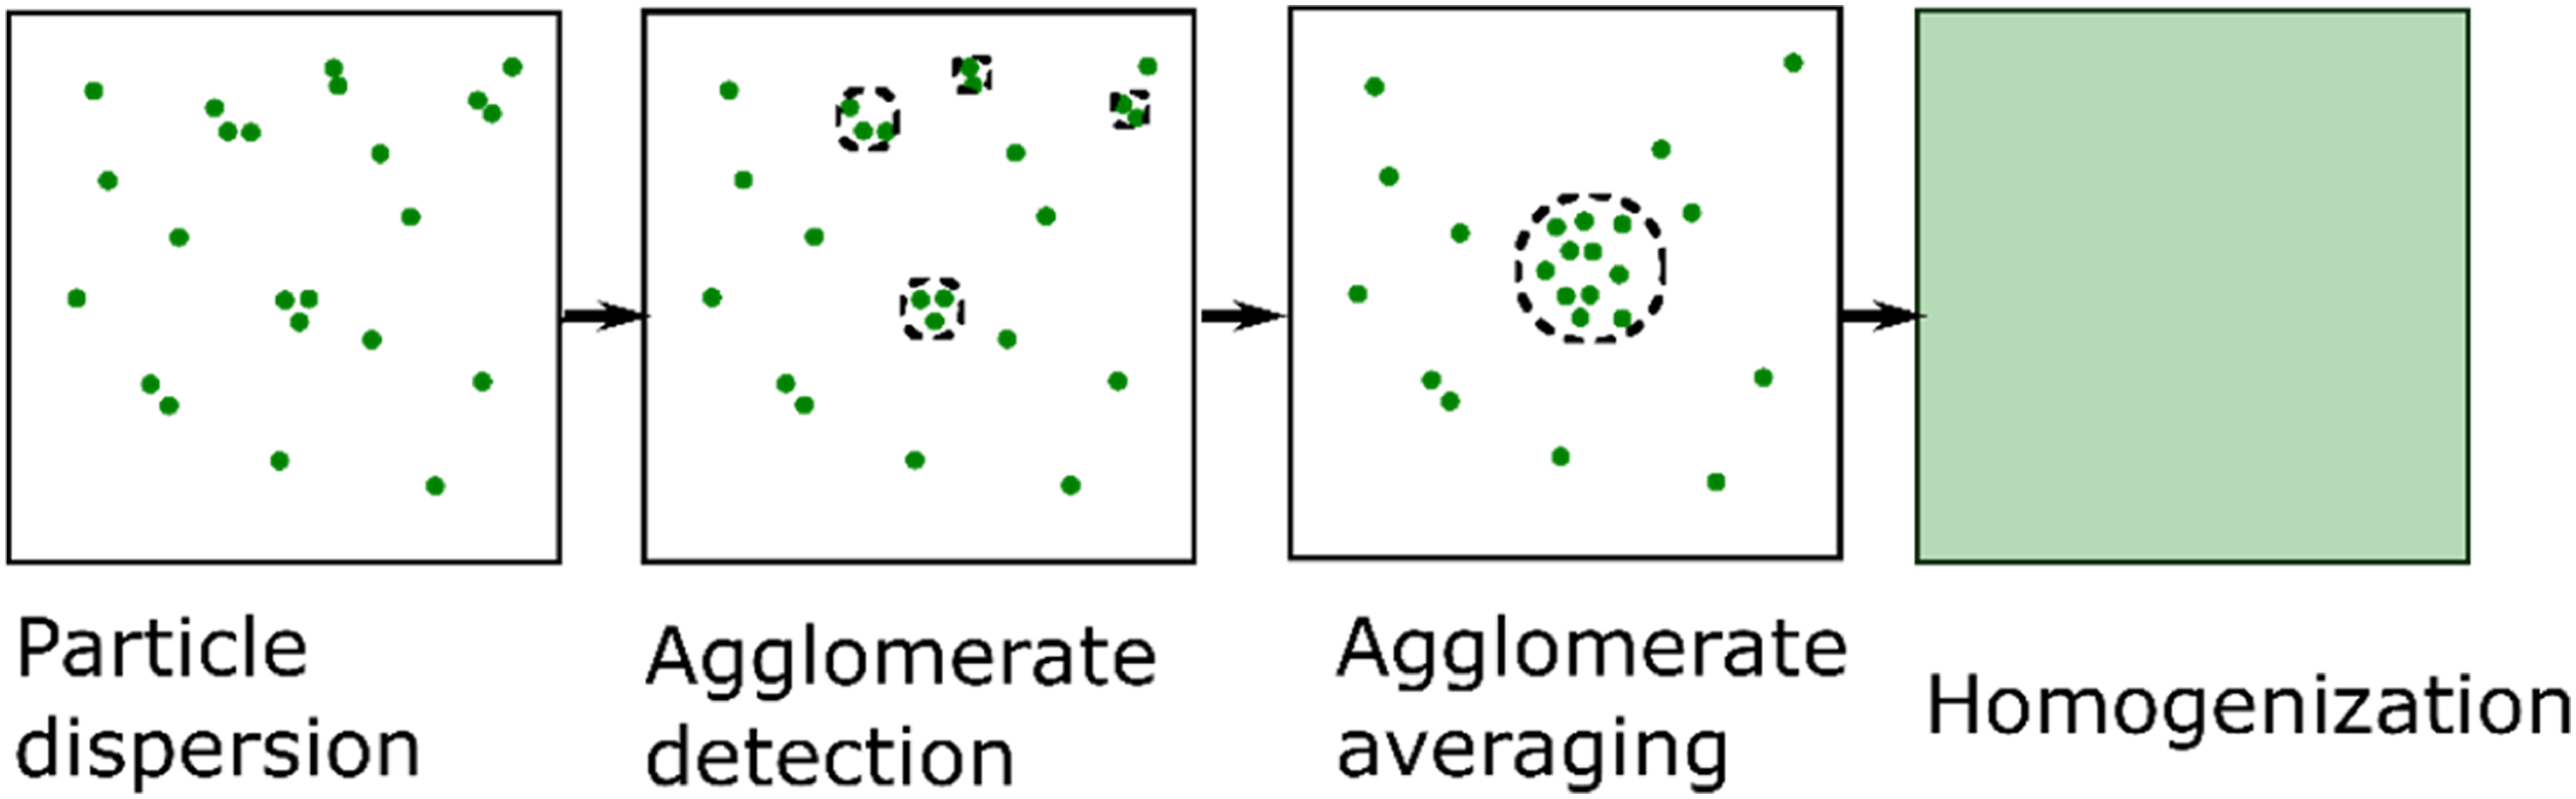
We assume that nanocomposites can be modelled using a three-phase Mori-Tanaka approach where the phases are the particle phase, the agglomerate phase, and the matrix phase. The application of this model requires the shape and aspect ratio of particles, as well as the elastic properties and volume fractions of the phases. The shape and aspect ratio of particles are assigned based on literature data; on the other hand, the elastic properties and volume fractions of the phases are determined using analytical and computational tools. The phases’ volume fractions are calculated based on a computational approach that we developed. A 2-dimensional space (1000 × 1000 nm) in a computational environment is set up for particle dispersion using MATLAB software. The number of particles is calculated based on a particle loading, and particles are dispersed in the two-dimensional space using the Mersenne-Twister algorithm, a pseudorandom number generator. Various dispersion states are covered by changing value of dispersion parameter,
The dispersed particles are classified either as agglomerated particles or free particles using the hierarchical clustering method, a machine learning method.
43
The implemented hierarchical clustering algorithm measures Euclidian Distances between particles to detect agglomerated particles. When the Euclidian Distance between two particles is shorter than the value of the critical distance parameter,
The volume fractions of the particle and matrix phases are calculated based on the detected agglomerated regions. The particle phase represents the free particles (non-agglomerated particles). Because the total number of agglomerated particles and initial particles are known, the number of free particles is easily calculated. The total volume of free particles is found by multiplying the volume of a particle by the number of free particles. In the end, the particle phase’s volume fraction is obtained by dividing the volume of free particles by the composite volume. Lastly, the matrix phase’s volume fraction is calculated by subtracting the volume fractions of the agglomerate and particle phases from one.
Once the volume fractions are calculated, the elastic properties of each phase are required to utilize the three-phase Mori-Tanaka method. The matrix material is tested for its properties whereas the particle phase’s elastic properties are retrieved from the literature because testing the nanoparticle’s properties is considerably challenging and requires another major study. For the agglomerate phase’s properties, we used two micromechanical models: Halpin-Tsai and Reuss model (detailed in section 2.5).
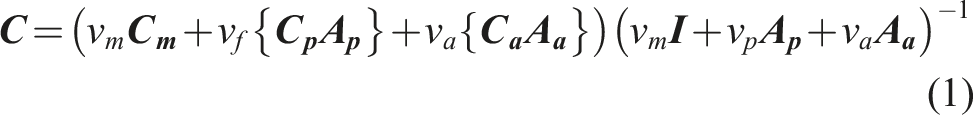
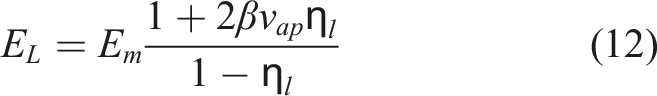
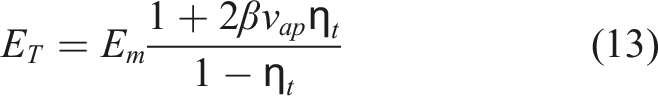
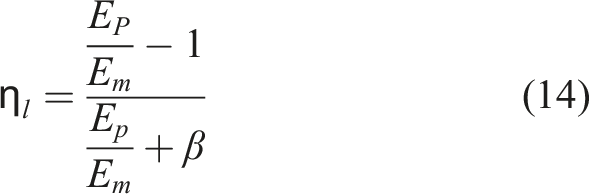
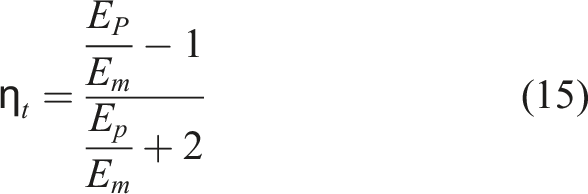
The calculated volume fractions and elastic properties of the phases are inserted into the Mori-Tanaka model to homogenize the composite system and predict the elastic modulus of the nanocomposite. Main modelling equations are presented here. Standard notation is used throughout the manuscript. The notations

In the last step of the model, the Monte-Carlo method is utilized to acquire comprehensive data about the elastic modulus of nanocomposites. The Monte-Carlo method uses repeated random sampling to predict an outcome range of an uncertain event or problem. 46 The uncertain problem, in this study, is the lack of knowledge about the exact dispersion state of particles. The dispersion state is the main foundation of stiffness prediction. In our model, random sampling corresponds to determining the particles’ locations randomly in the defined 1000 × 1000 nm2 space. As soon as particles are randomly dispersed, the aforementioned modelling steps are completed to calculate the volume fractions of the three phases. Based on the calculated volume fractions, the elastic modulus of the composite is found using the three-phase Mori-Tanaka model. For accurate and reliable predictions, this process is repeated one hundred times for each particle loading. We kept the repetitions at one hundred to ensure the timely completion of Monte-Carlo and reach the near-infinite number of possible predictions. The results for each particle loading are illustrated in boxplots.
Particle dispersion
In the developed model, we introduce a parameter
Particles’ locations are determined based on random numbers that are generated from the established lognormal distribution. The location of the first particle is selected from the uniform distribution. For the second particle, a random angle and a random distance are chosen from the uniform probability distribution and lognormal probability distribution, respectively. The chosen random values for the angle and distance are utilized to locate the second particle with respect to the location of the first particle. Each particle is located in the same manner – the angle and distance are selected to locate the new particle’s location with respect to the previous particle’s location. The dispersion of particles is continued until all particles are located. It is important to note that particles cannot occupy the same location in the model. Thus, in the case of particle intersection, a new location is assigned to the newest particle based on the random location selection from all possible locations.
In addition to the lognormal distribution, a uniform probability distribution is used to disperse particles. In the case of uniform distributions, the constant probability distribution function is used to assign the location of a particle. Once a particle is located, the next one is located using the uniform distribution. In the case of an overlap, a new location is assigned to the newest particle. Here, we aim to capture various dispersion states, from uniformly dispersed particles to agglomerated particles. Although different states of dispersion are established, agglomerates are needed to be defined and understood well to investigate their effects on the stiffness of nanocomposites.
Critical distance
The critical distance parameter
The hierarchical clustering, a machine learning method, is used to group data sets into a cluster tree where the tree represents a hierarchy of clusters. Two hierarchical clustering methods exist: agglomerative (bottom-up approach) and divisive (top-down approach). In this study, we utilize the agglomerative hierarchical clustering method because it is a built-in tool in MATLAB Statistics and Machine Learning Toolbox, and it is easier to comprehend intuitively. In the agglomerative hierarchical clustering method, particles start with their own cluster and then combine into bigger clusters based on the distance between them. This method can be described in three main steps: (1) the distance between particles is calculated using a “distance” metric, (2) particles are linked and grouped with a “linkage” method, and (3) the number of clusters (agglomerates) is determined using the value of “cutoff” argument.
In this study, the agglomerative hierarchical clustering method is adopted as a solution to detect agglomerates based on the location data set. Firstly, the distance between particles is calculated using the “Euclidean distance” metric. The “Euclidean distance” is the length of a line between two points that is calculated using the Pythagorean theorem. Secondly, the particles are linked together based on the “single” linkage method. The “single” method takes the shortest distance between particles to link and group them. Herein, the “single” method is used because we assume that particles that are closest to each other should belong to the same agglomerate. Thirdly, each agglomerate is classified, and the number of agglomerates is found using the critical distance parameter. The critical distance parameter is used as the “Cut-off” argument that determines the number of agglomerates in the system. If the critical distance is higher than the shortest distance between two particles or agglomerates, they are grouped together and become members of the same agglomerate. The critical distance parameter is defined as a function of the particle diameter and the value assigned to
The value of
The MATLAB code assigns a number to each agglomerate so that we can detect individual agglomerates and differentiate one from another. The number assigned to the agglomerate is also associated with particles within that agglomerate. For example, if we consider a case where there are two agglomerates, one with 3 particles and the other one with 5 particles. Here, the one with 3 particles is associated with number 1 and the one with 5 particles is associated with number 2. Hence, one can tell which particle belongs to which agglomerate. Once the agglomerates and the particles within each agglomerate are numbered, we establish a spherical border around the agglomerated particles to define agglomerated regions. Figure 2 shows the schematics of an agglomerate. The green filled circles represent the fillers, and the white region between them represents the matrix. Because agglomerated particles do not have to be in contact, an agglomerate can include particles and matrix within its border. The border is fit around the agglomerated particles such that the longest distance between two particles is assumed to be the diameter of the agglomerate. With the knowledge of the agglomerate boundary, the volume fraction of particles within the agglomerate can be calculated and monitored for various critical distance values. Schematics of an agglomerate for better understanding of a center-to-center distance.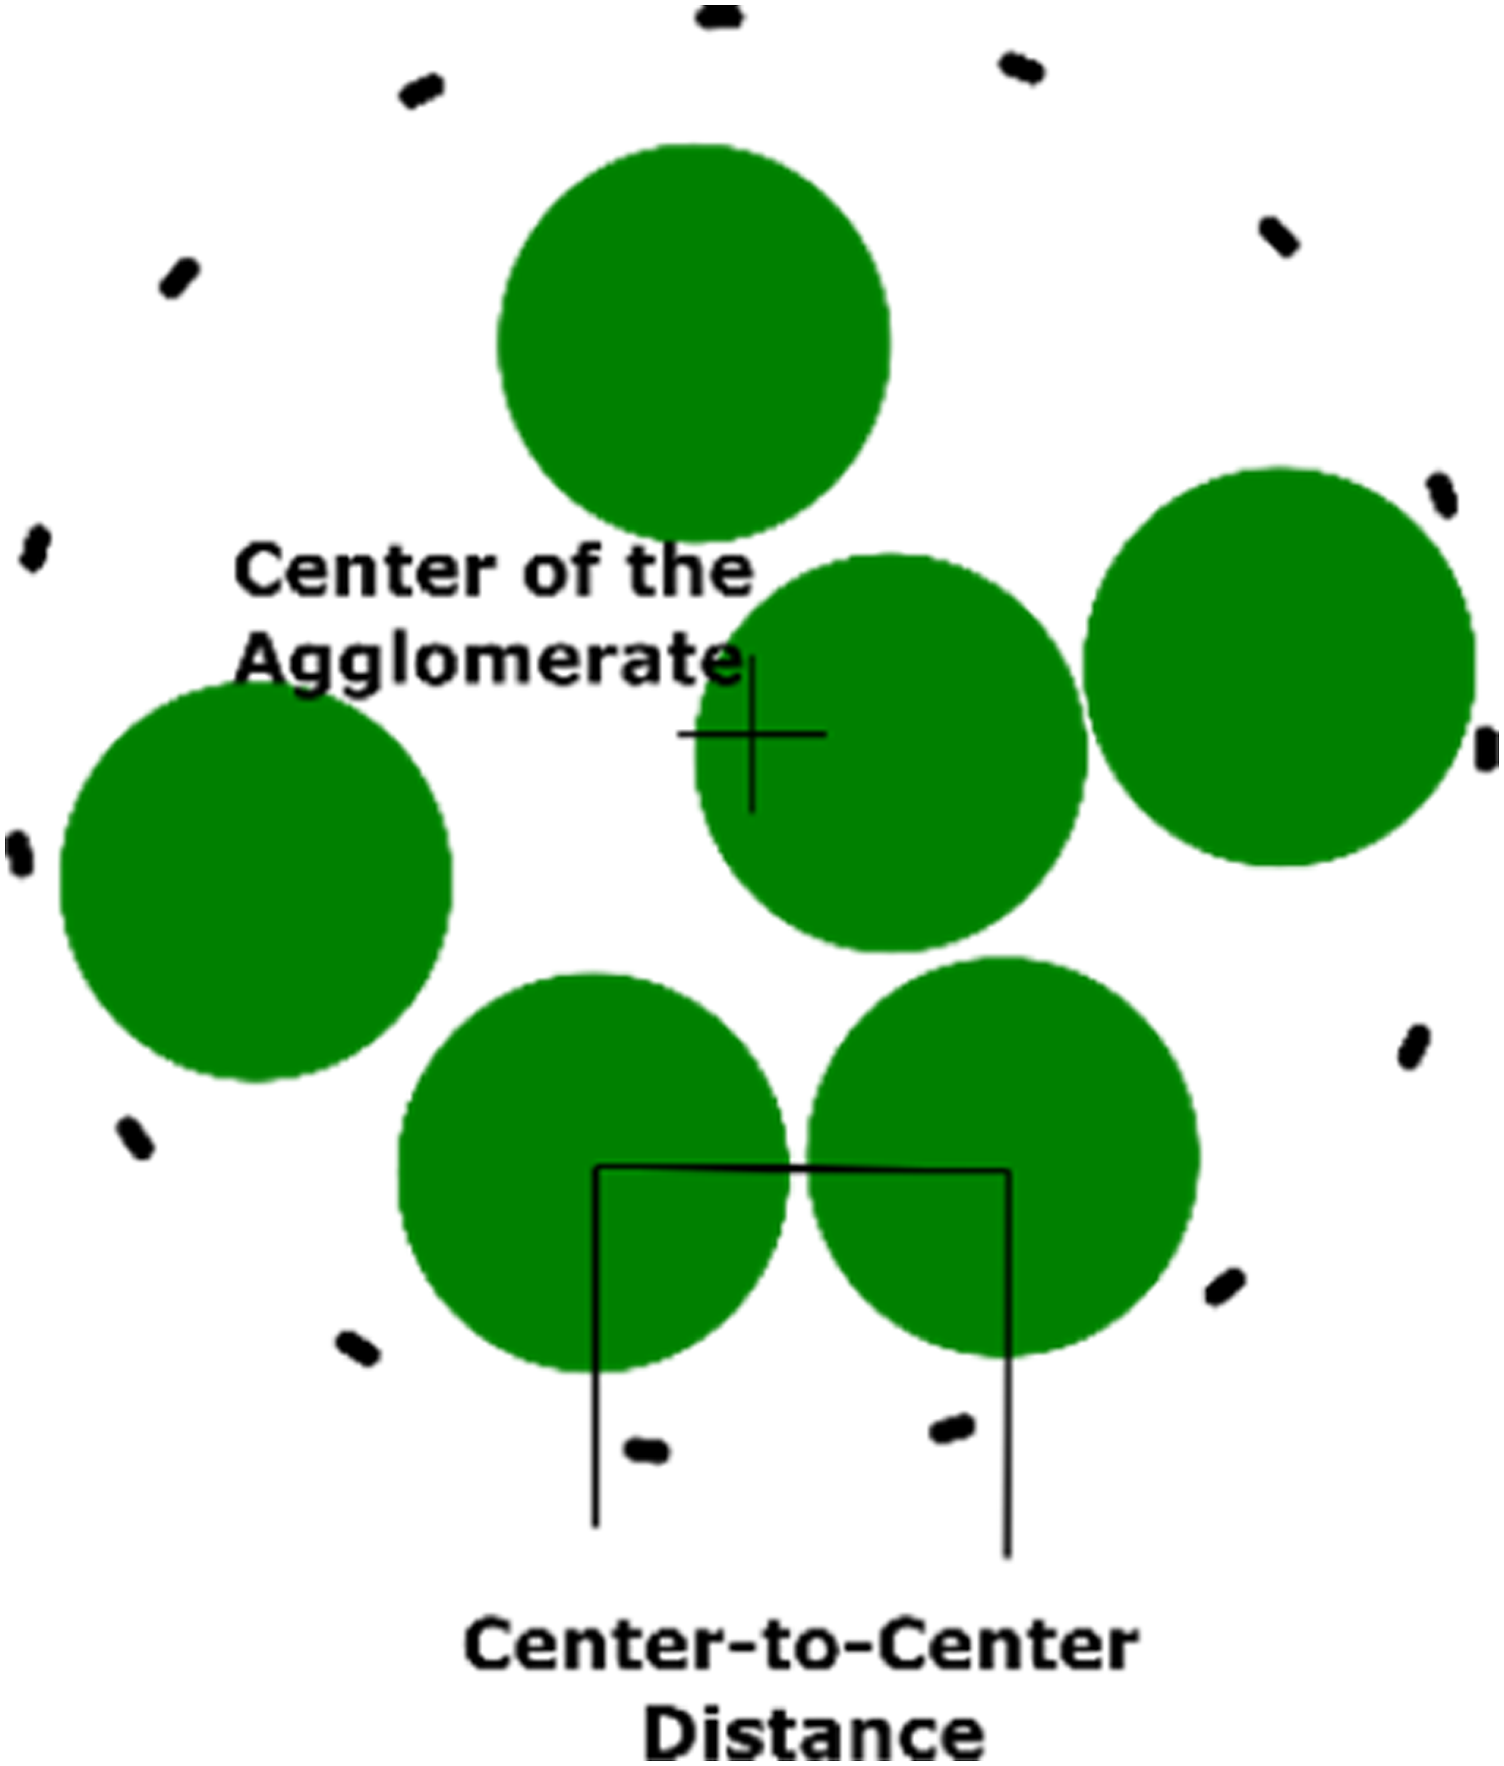
Particle orientation
Nanocomposites are stiffer in the direction of oriented fibers; however, representing and utilizing the orientation of fibers in modelling may vary and can be challenging. One possible representation of fibers’ orientation is a probability distribution function. According to Advani and Tucker,
52
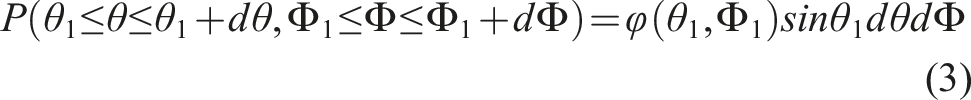
this probability distribution function can be replaced by an orientation tensor for ease of calculation in continuum equations. The orientation of the fiber is required to establish the orientation tensor. Figure 3 describes the orientation of a fiber using spherical coordinate angles ( The definitions of 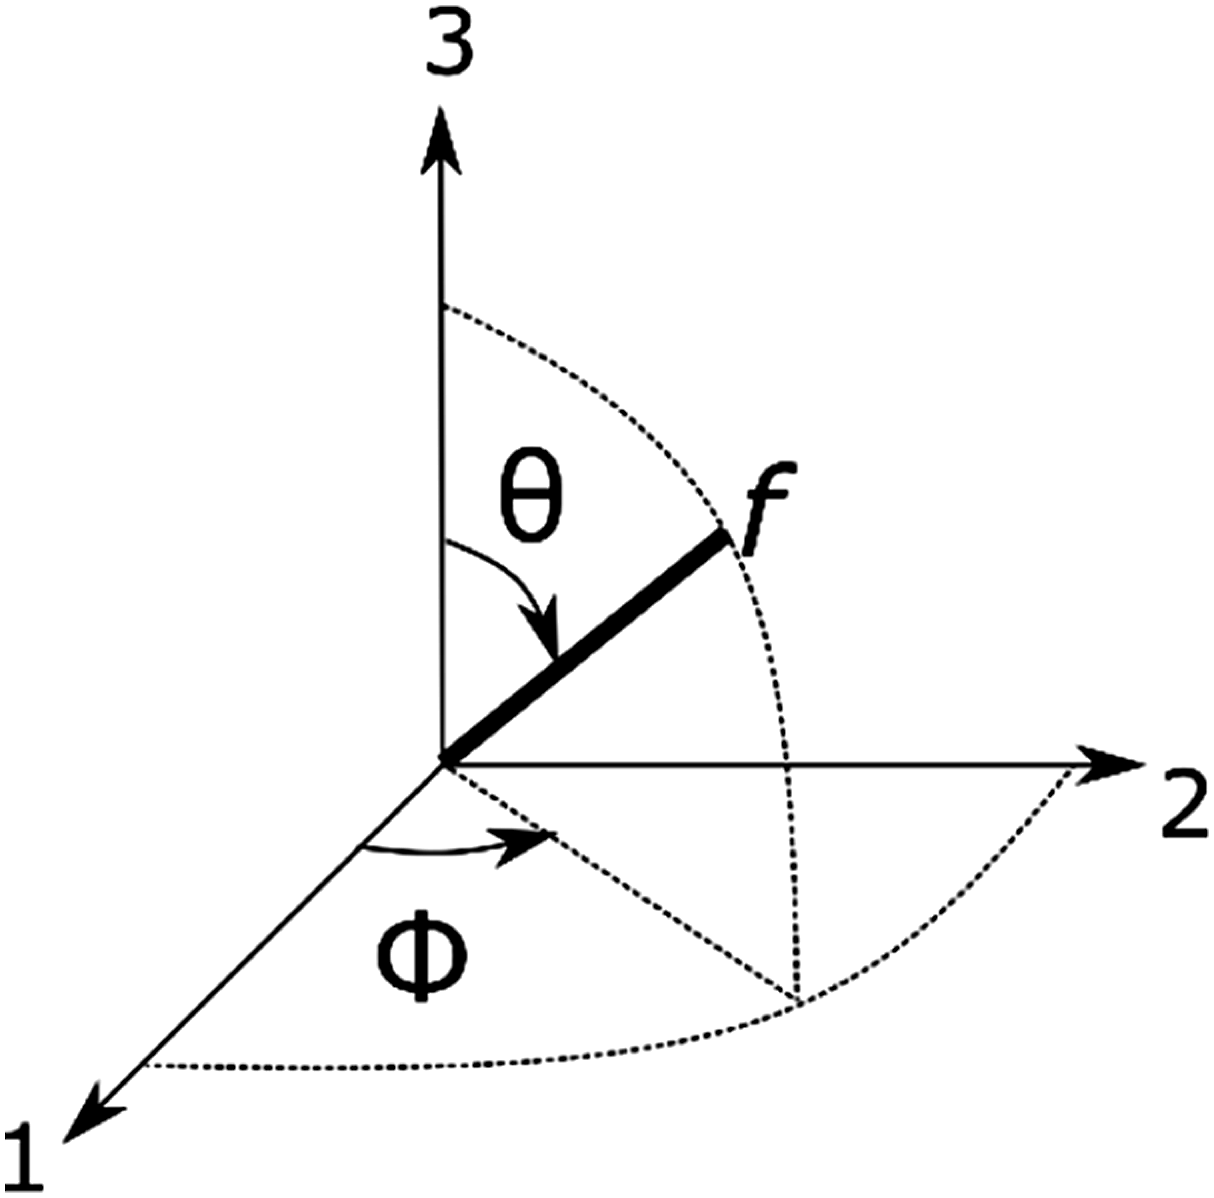
The probability of having a fiber between angles


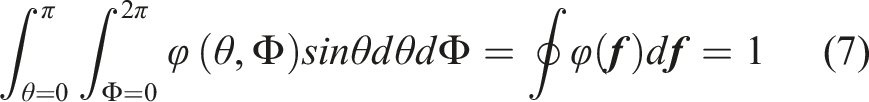
Advani and Tucker
52
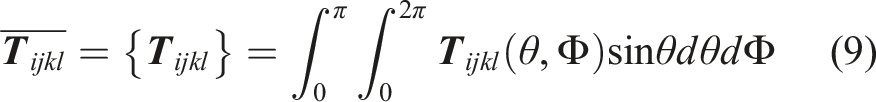
showed that the probability distribution function can be represented by tensors, and they provided a widely used orientation tensor that represents the orientation state of fibers. The fourth-order orientation tensor that is defined by dyadic products of the vector is given by equation (8)
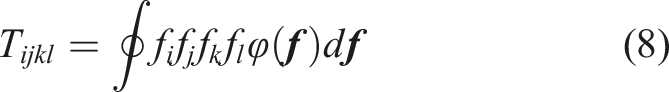
The integration of the product including all possible directions with
Aspect ratio of particles
The aspect ratio, defined as the length to diameter ratio, is another key design parameter in composite modelling and manufacturing. Some micromechanical models, such as Shear-log, Halpin-Tsai, Mori-Tanaka take the aspect ratio as a variable. In this study, we investigate the effect of the aspect ratio using the Mori-Tanaka model.
In the three-phase Mori-Tanaka model, the aspect ratio of particle phase and agglomerate phase is required for the elastic modulus calculations. The aspect ratio of the agglomerate phase is taken as one because it is assumed that particles agglomerate in a spherical form due to the minimum surface energy requirement and mechanical stability.4,54 On the other hand, we investigated the effect of the aspect ratio of the free particles on stiffness with three different values: 15, 30 and 60. We selected that range because the aspect ratio of reinforcement used in our experiments, CNC, changes from 10 to 70 depending on the source of CNC. 55
Material properties
Material properties of the particle, agglomerate and matrix phases are needed for the model implementation. The matrix (PA6) is tested for its elastic modulus, and the particle’s (CNC) elastic modulus is retrieved from the literature data
55
for calculations. The agglomerate phases’ properties are more complicated than matrix and particle phase’s properties, because of the lack of the agglomerate definition and studies in the literature. Although many studies examine the effect of agglomeration on the properties of composites,
51
there is no consensus about the individual agglomerate’s elastic modulus. Some studies
56
assume that agglomerates behave like a void, whereas others calculate their properties based on the Reuss model
57
or the Halpin-Tsai model.
58
For examples, Khodayari et al.
59
used Reuss model to predict elastic modulus of cellulose nanofibrils and generalized the findings for multiphase nanocomposites. Esmizadeh et al.
58
used the Reuss model and Halpin-Tsai model to predict elastic modulus of orgonoclay nanocomposite

The randomly orientated Halpin-Tsai model is calculated based on the particle volume fraction within agglomerated regions by equation (11)

Experimental methodology
The experimental work to validate the model was presented in a previous study. 40 Herein, we summarize the procedure, and readers are encouraged to see the previous study for detailed information.
PA6 was dissolved in formic acid, and then CNC was added to the suspension based on the target concentration. The prepared suspension was kept under agitation for approximately an hour. The prepared suspension was sonicated for 45 min before the spinning process. 2 mL of the suspension was cast on a rectangular glass substrate, and the glass substrate was spun at 2000 r/min for 15 s and at 3000 r/min for 30 s.
CNC-PA6 nanocomposite samples were tested using TA Instrument ElectroForce 3200 with 10 N load cells. The elastic modulus of samples was calculated from the linear region of the stress-strain curve and reported for comparison of the model predictions and experimental results.
Model implications and discussion
Effect of critical distance and particle orientation
The elastic modulus of randomly and aligned fiber composites in the longitudinal direction are calculated with the critical distance parameter Elastic modulus predictions of cellulose nanocrystals with polyamide 6 (CNC-PA6) composite as a function of CNC loading for (a) aligned and (b) randomly oriented particles at various 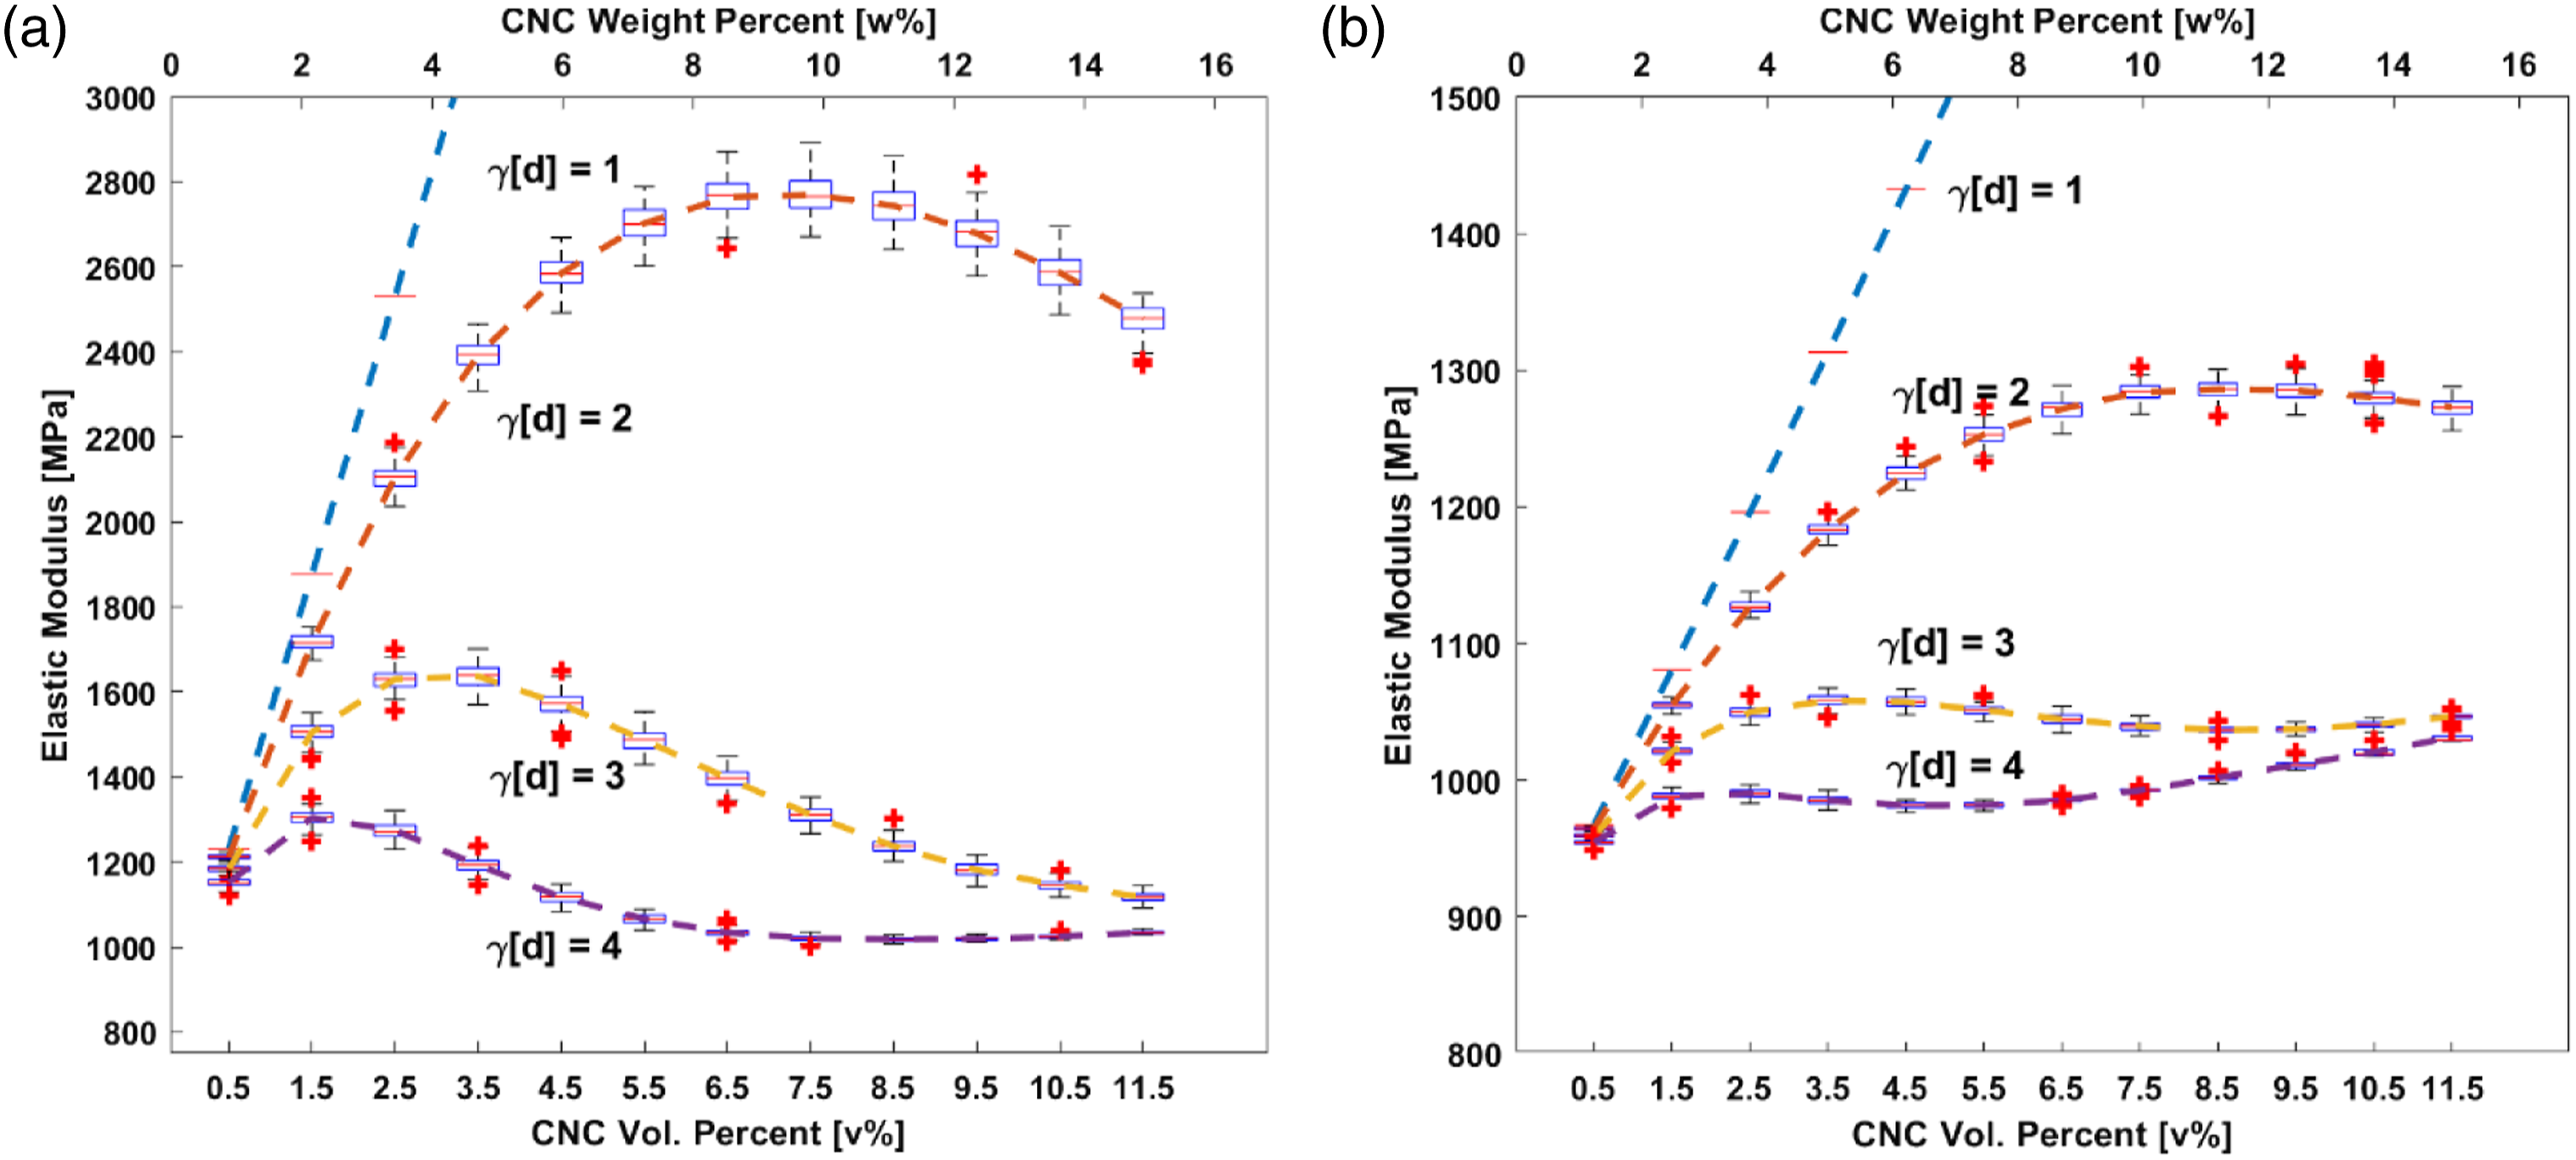
The trends of predictions in Figure 4(a) and (b) are similar at the same values of
Particles are expected to agglomerate when
Another reason for lower model predictions after the optimal particle loadings at
The prediction values for the aligned particles are higher than randomly oriented ones, although the trends are similar at the same value of
Volume fractions and number of each constitute at various
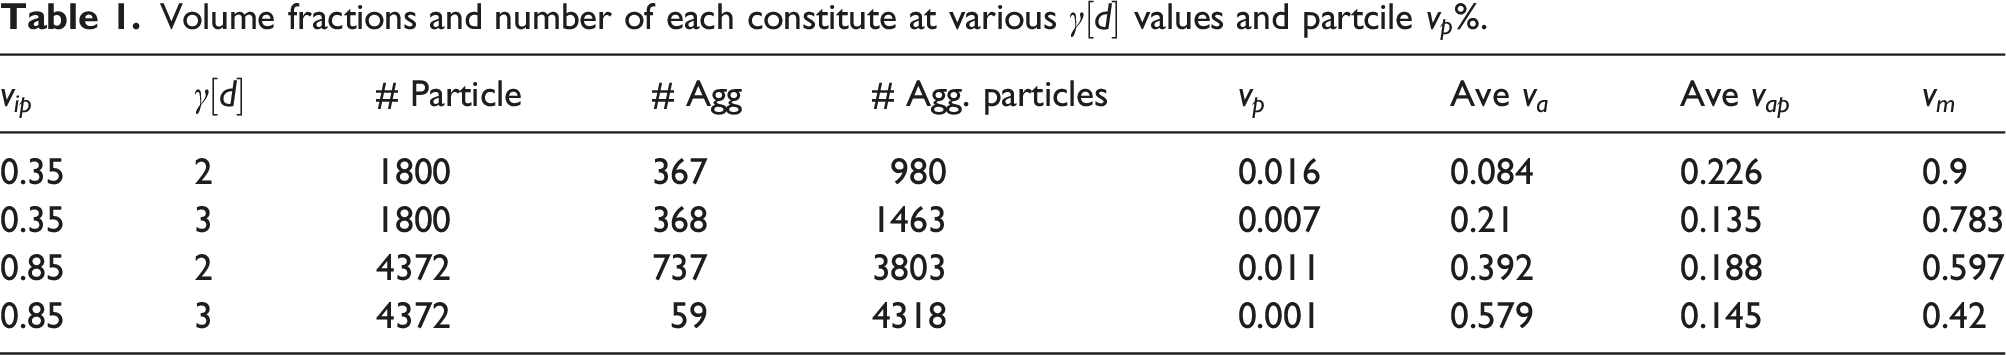
The decrease in the number of agglomerates is related to the particle concentration and size of agglomerates. When
The volume fraction of free particles and matrix highly depend on
Effect of critical distance and agglomerate property
The effect of The effect of 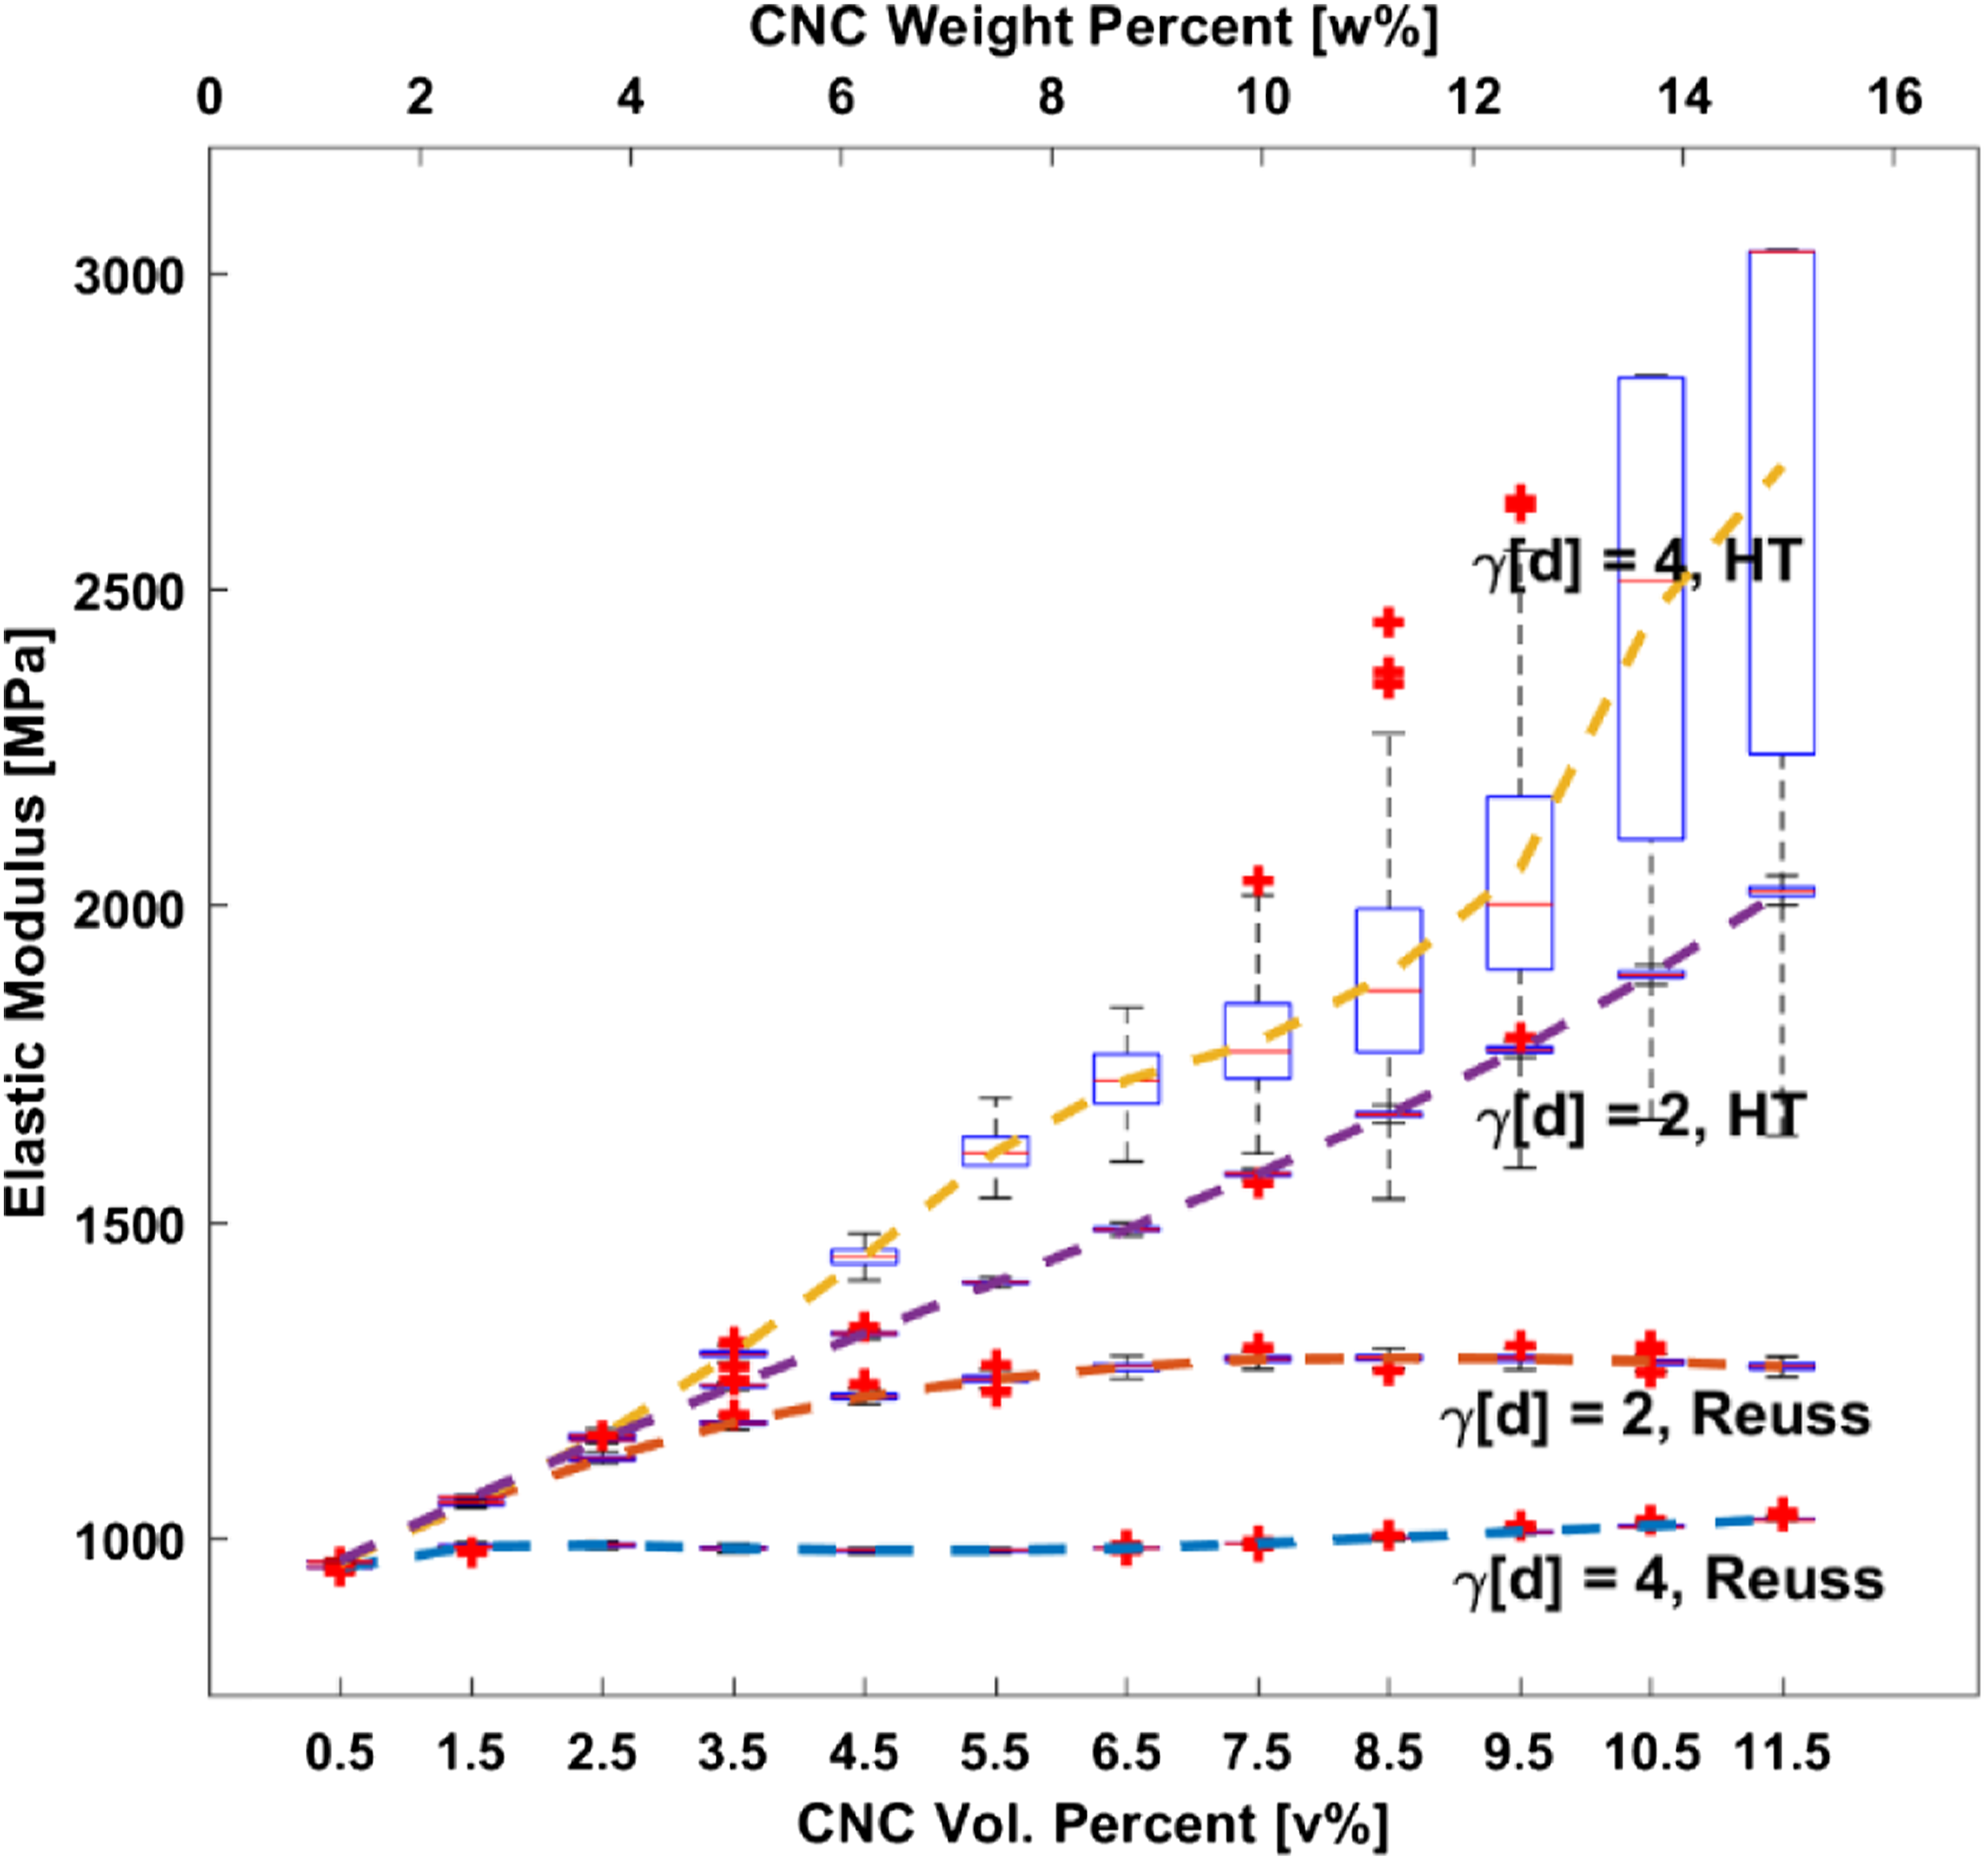
In the case of the Halpin-Tsai model, the elastic modulus of nanocomposites increases with increasing particle loading regardless of the
The prediction trends are quite different in the case of the Reuss model. We first observe an increase in the elastic modulus, and then a decrease regardless of the
Predicting the mechanical behaviour of nanocomposites becomes difficult with increasing particle loadings because experimental findings vary substantially. For example, the elastic modulus values59,58,57,56 reach a plateau value or decrease with particle over loading. Peng et al.
61
observed a plateau value at 3.5 w% of CNC in PA6 whereas Morelli et al.
62
observed that optimal particle loading is between 5 and 10 w% for unmodified CNC. These studies demonstrate that the optimal particle loading, and the amount of increase and decrease depend on experimental settings; however, the proposed model suggests that the combination of agglomerates’ property and
The critical distance parameter is the main parameter that controls the agglomerate formation, and higher
Effect of orientation and aspect ratio of the particles
The effect of orientation and aspect ratio of the particles is shown in Figure 6. Uniform probability distribution is utilized for the particle dispersion, and Predictions of the longitudinal elastic modulus of CNC-PA6 composites as a function of CNC concentrations for various orientation and aspect ratio (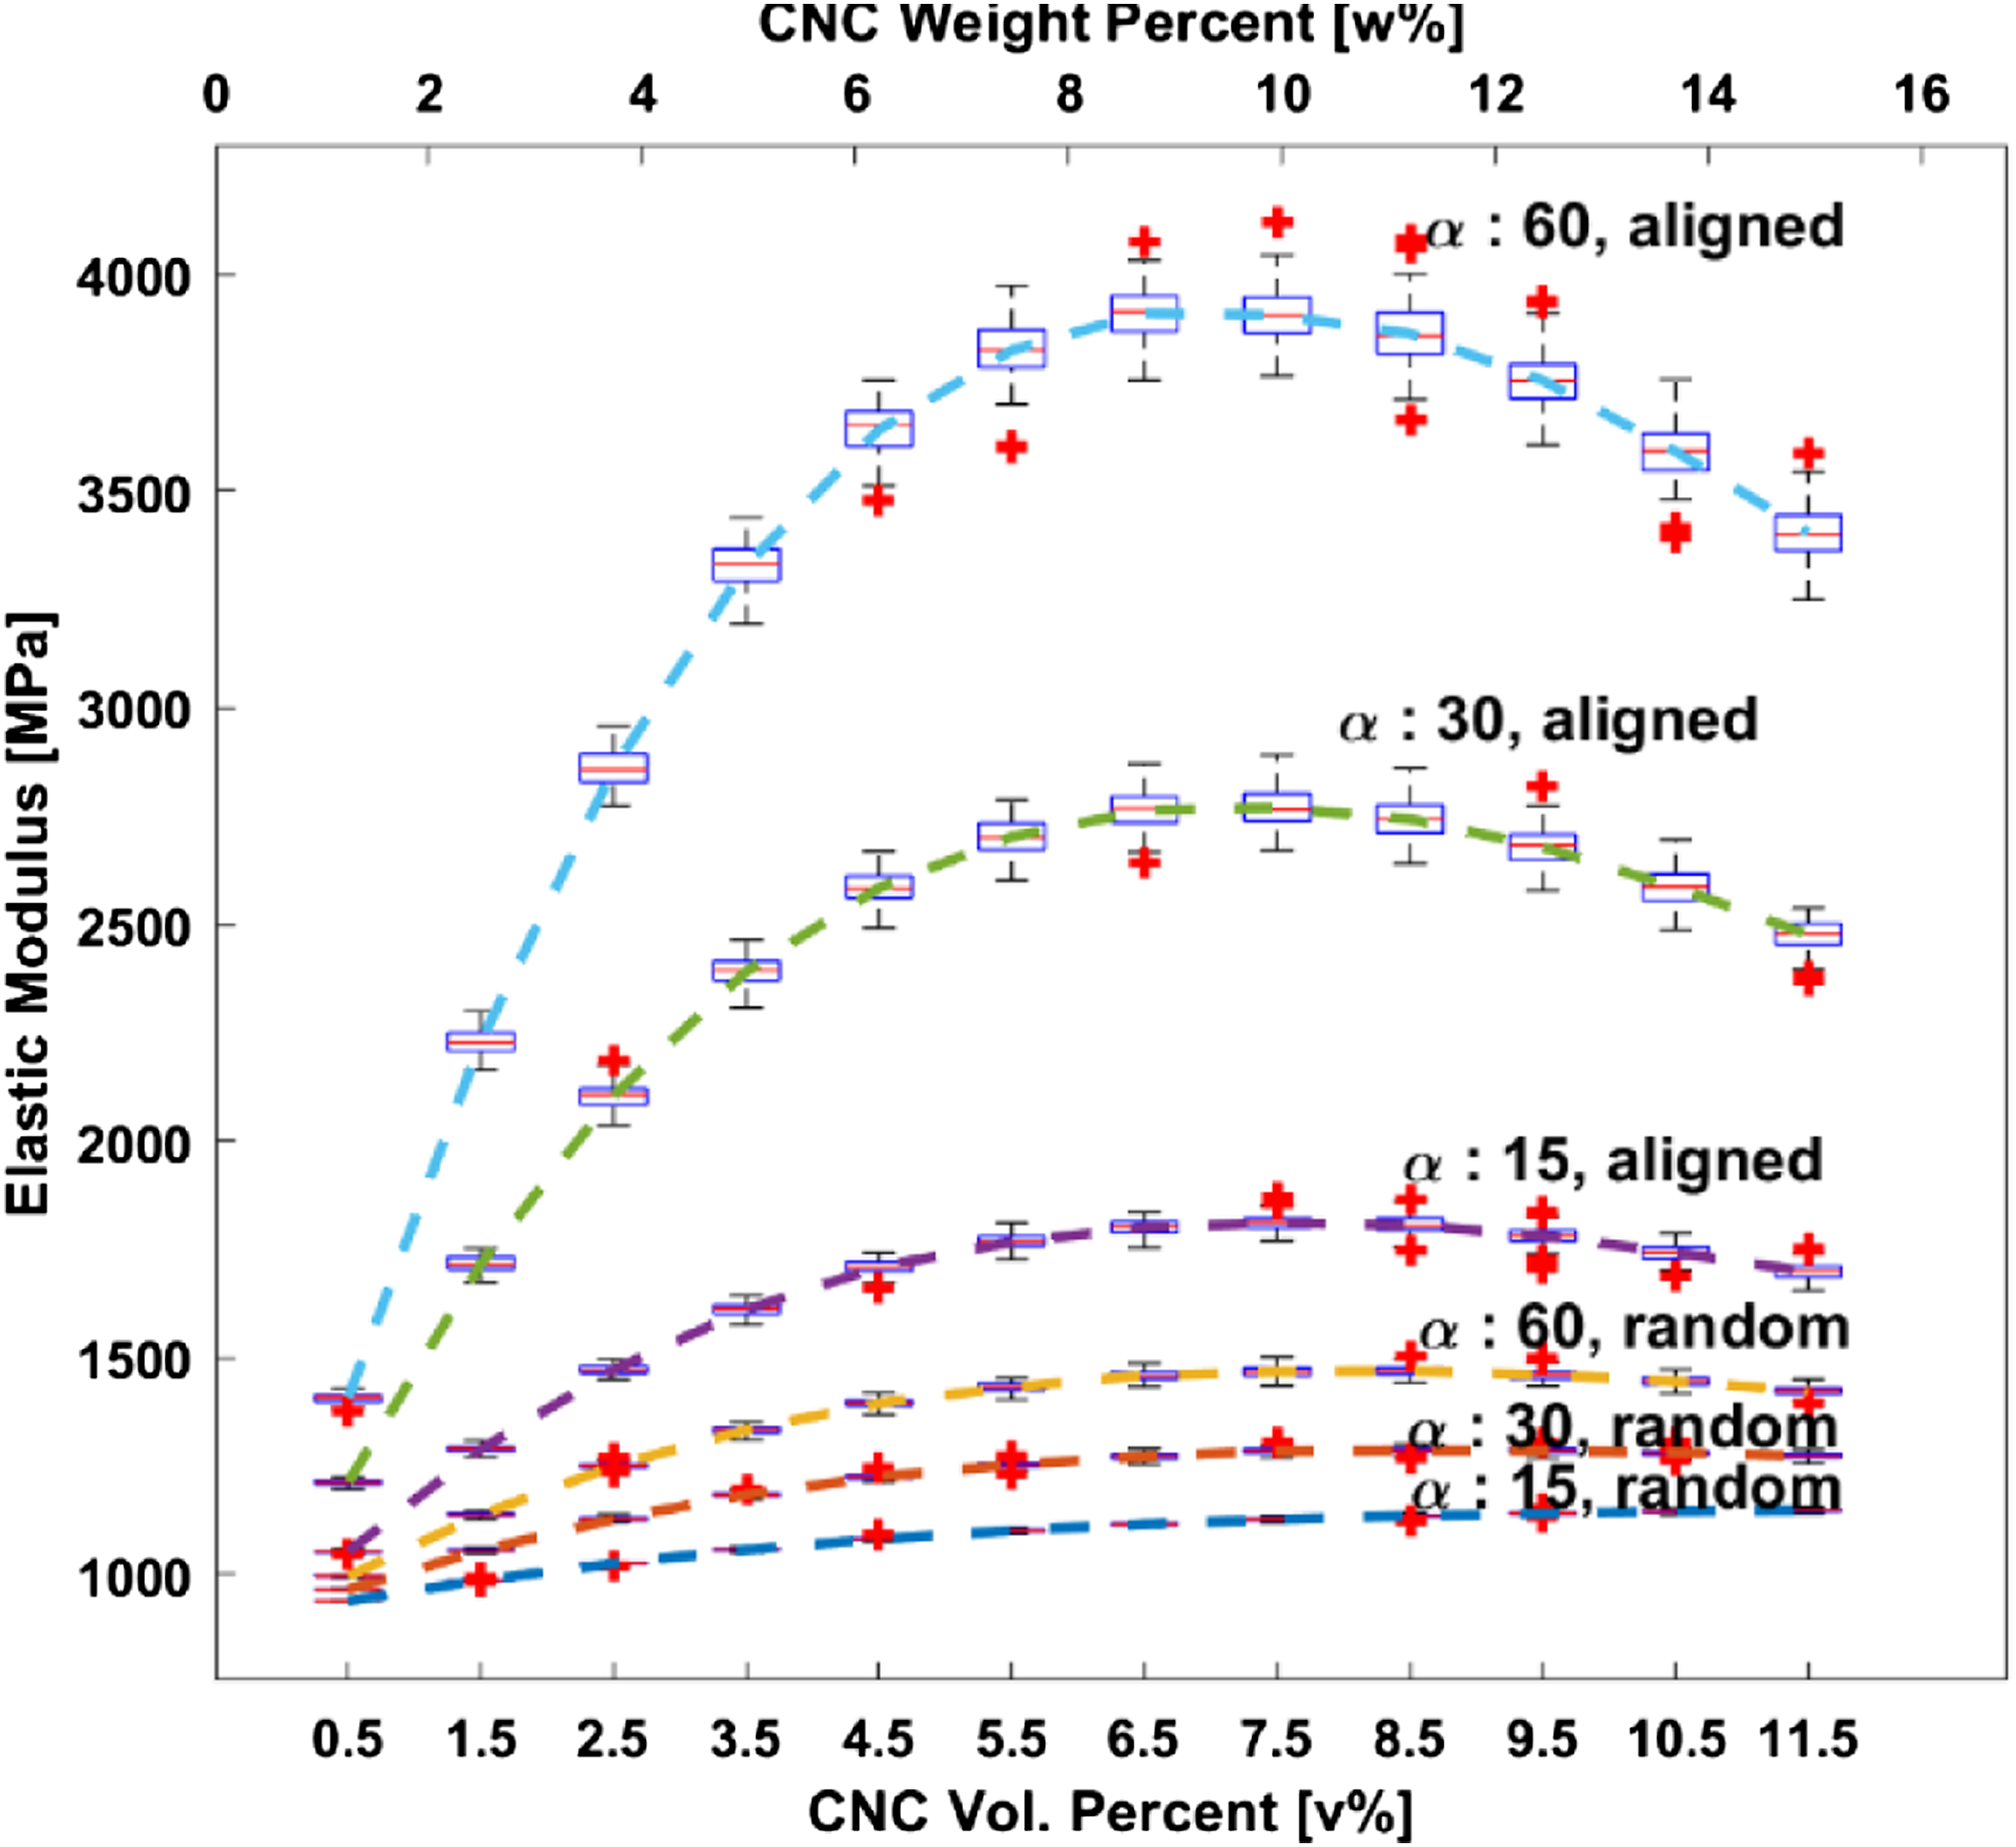
Figure 6 contains six predictions based on various aspect ratios and particle orientations. The highest three elastic modulus values are from the aligned composites. For a better understanding of the orientation effect, the aligned and randomly oriented CNC with the aspect ratio (
The elastic modulus of nanocomposites is improved with an increasing aspect ratio according to the Mori-Tanaka model. This improvement is much higher when particles are aligned. For example, at 6.5 v% CNC, the increase in the elastic modulus is approximately 150% (from 1600 MPa to 3600 MPa) for the aligned particles when the aspect ratio changes from 15 to 60; however, it is approximately 40% (from 1125 MPa to 1460 MPa) for the randomly oriented particles at the same particle loading.
The maximum improvement with respect to neat PA6, ∼330% increase, is predicted to be at 7.5 v% with
Effect of dispersion and critical distance
The effect of dispersion is explored by selecting the location of particles from the lognormal probability distribution instead of using the uniform probability distribution. The main reason to choose lognormal distribution is that distances between neighbour particles obey lognormal distribution according to dispersion quantification studies.63,51,48
The lognormal probability distribution is defined by
The effects of the dispersion Predictions of elastic modulus of nanocomposites as functions of 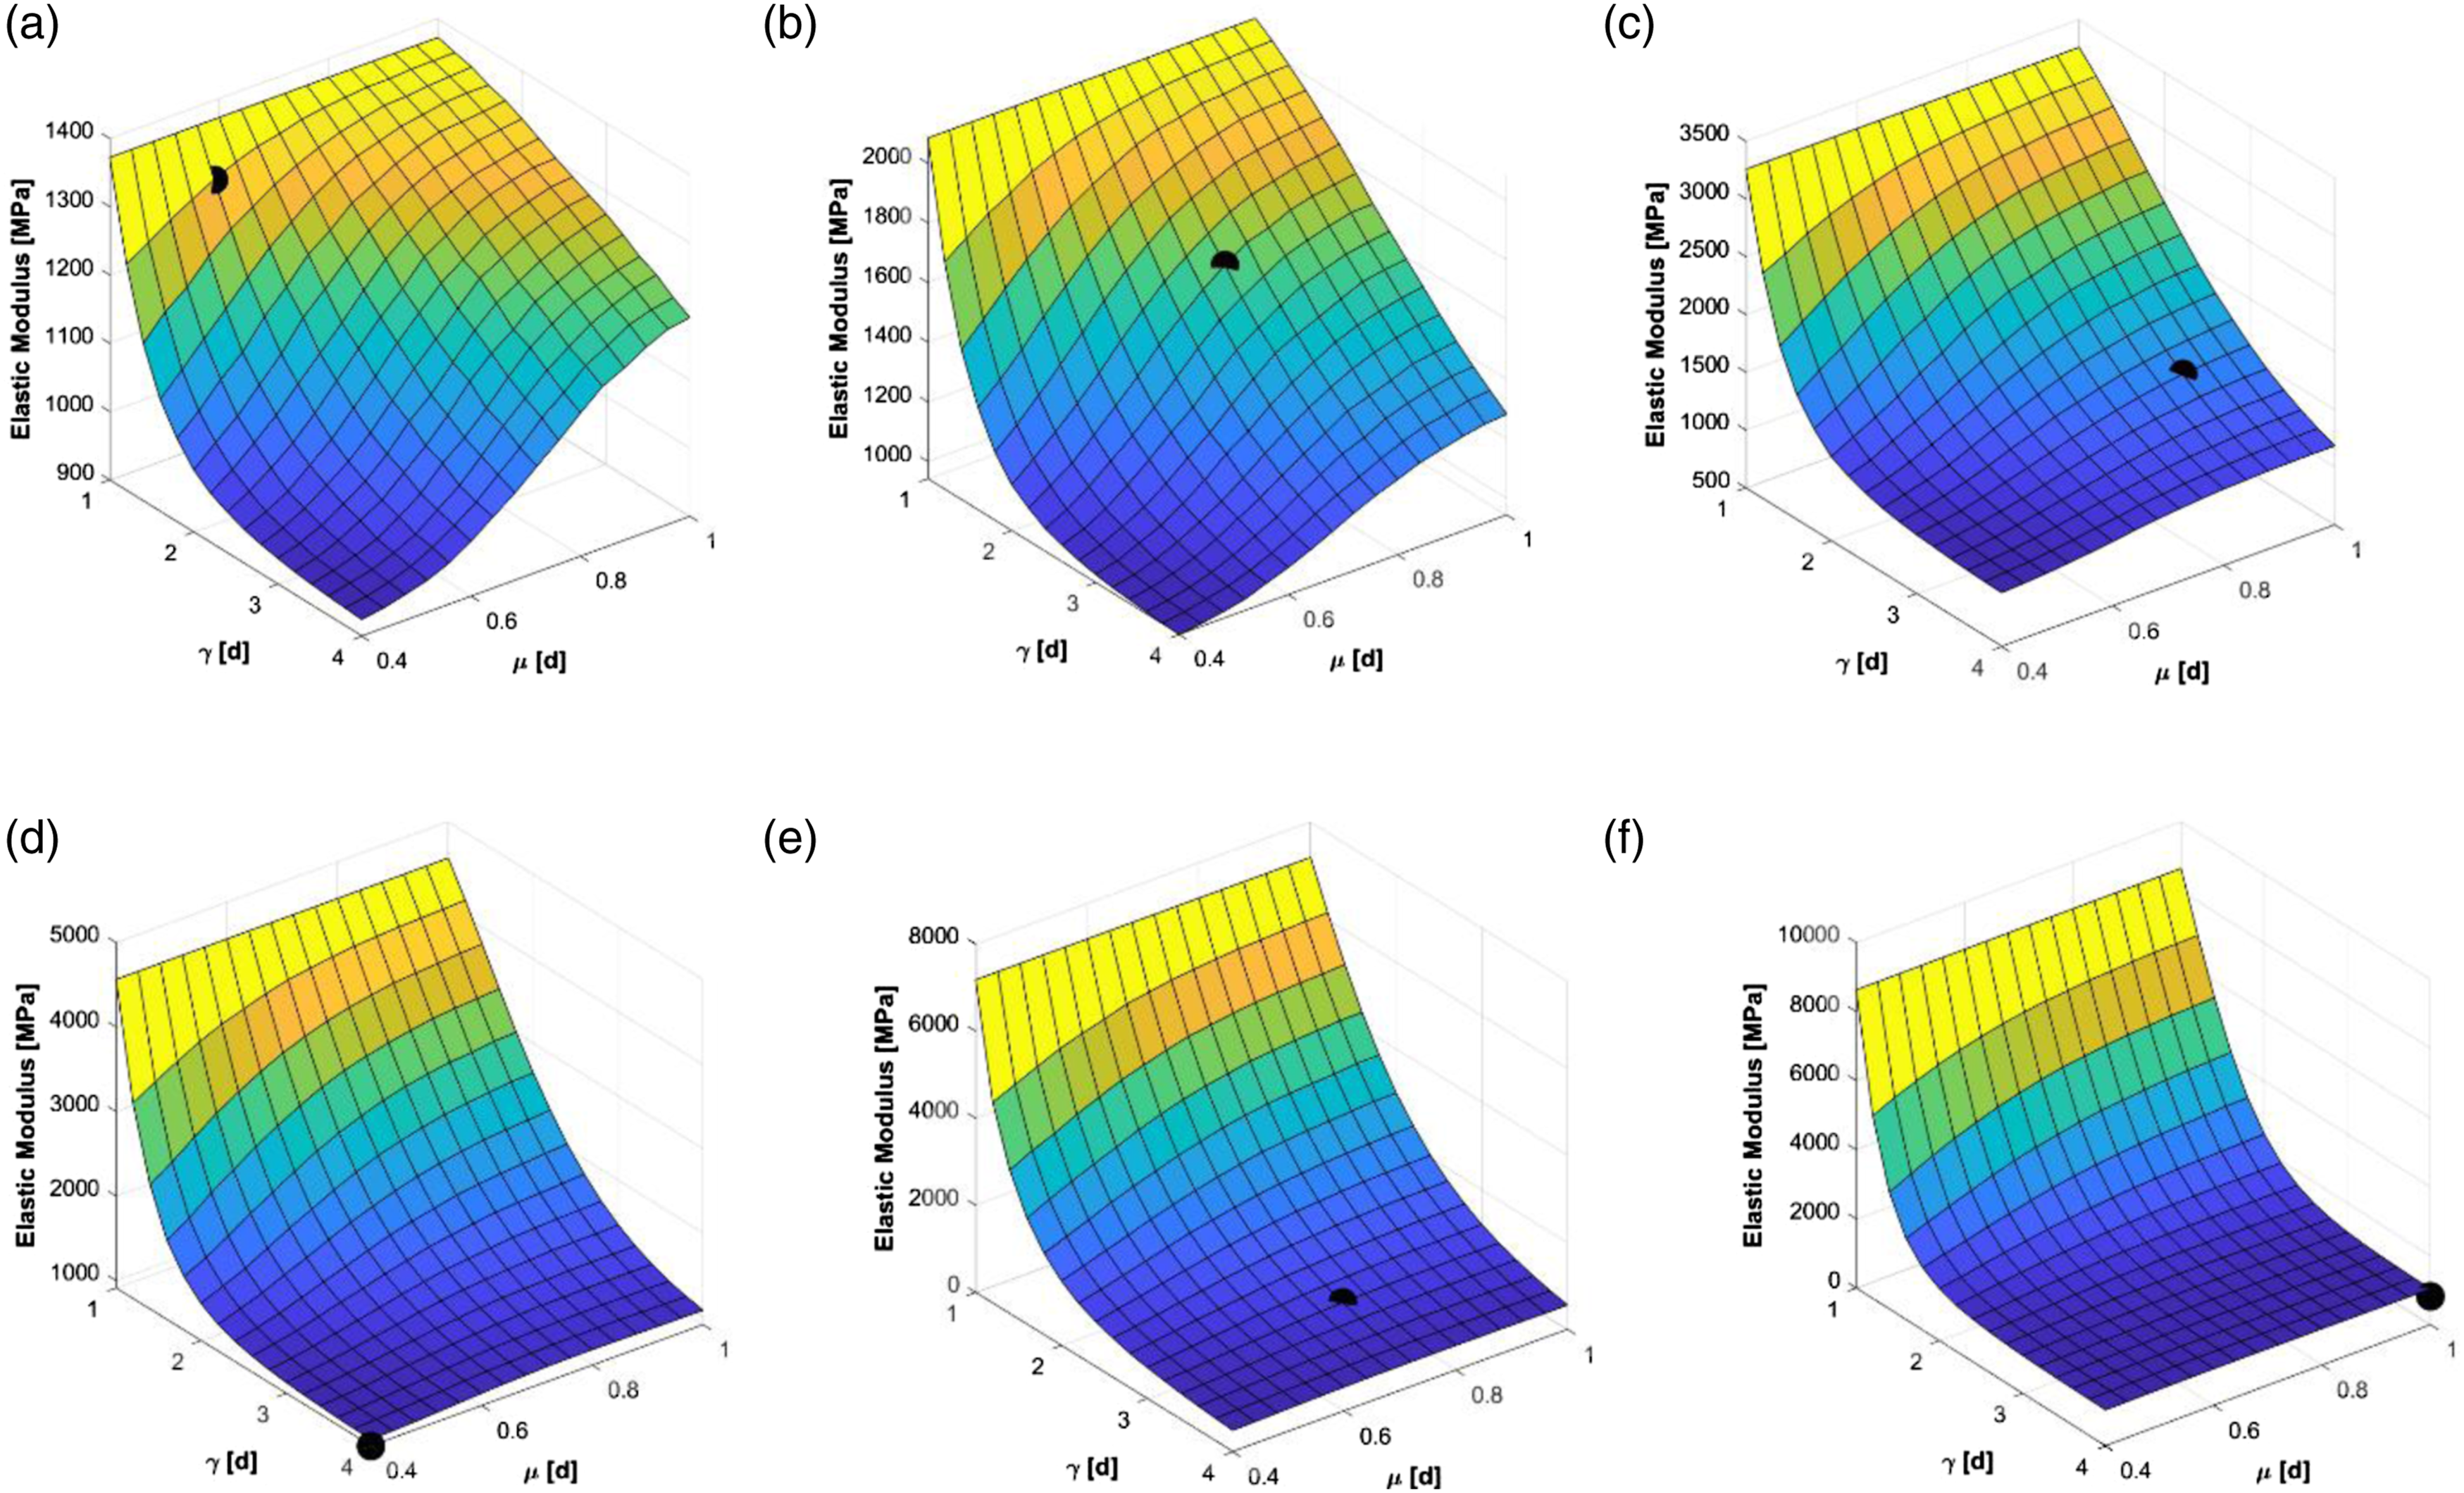
The surface plots show that the model can predict experimental findings well for each CNC loading. The model calculates the highest outputs at
Experimental results are relatively high compared to neat PA6 (911 MPa) at 1.0, 2.5 and 5.0 w% CNC and they are captured with low
Higher values of
Another aim of this study is to cross-examine the model predictions with respect to particle loadings. Here, we fine-tune the values of the model parameters depending on the experimental setting. In the experimental study,
40
the particles and the matrix were dissolved in a solvent before producing the samples. Various agitation methods were used to disperse particles uniformly in the suspension during the mixing process. Thus, it seems reasonable to use the uniform probability distribution to predict the locations of particles in the model. Based on TEM images of the previous study,
40
free particles were mostly aligned, and the average aspect ratio was taken to 30. Here, we assume fully aligned particles with the aspect ratio of 30 for the calculations. Furthermore, based on the modeling predictions in this study and experimental results from the literature, the Reuss model seems acceptable to calculate the agglomerates’ elastic modulus. According to these assumptions, Figure 8 exhibits the predictions of elastic modulus of nanocomposites with respect to CNC particle loading along with some conventional analytical models. Predictions of elastic modulus of nanocomposites with respect to CNC concentration and experimental findings adapted from.
40
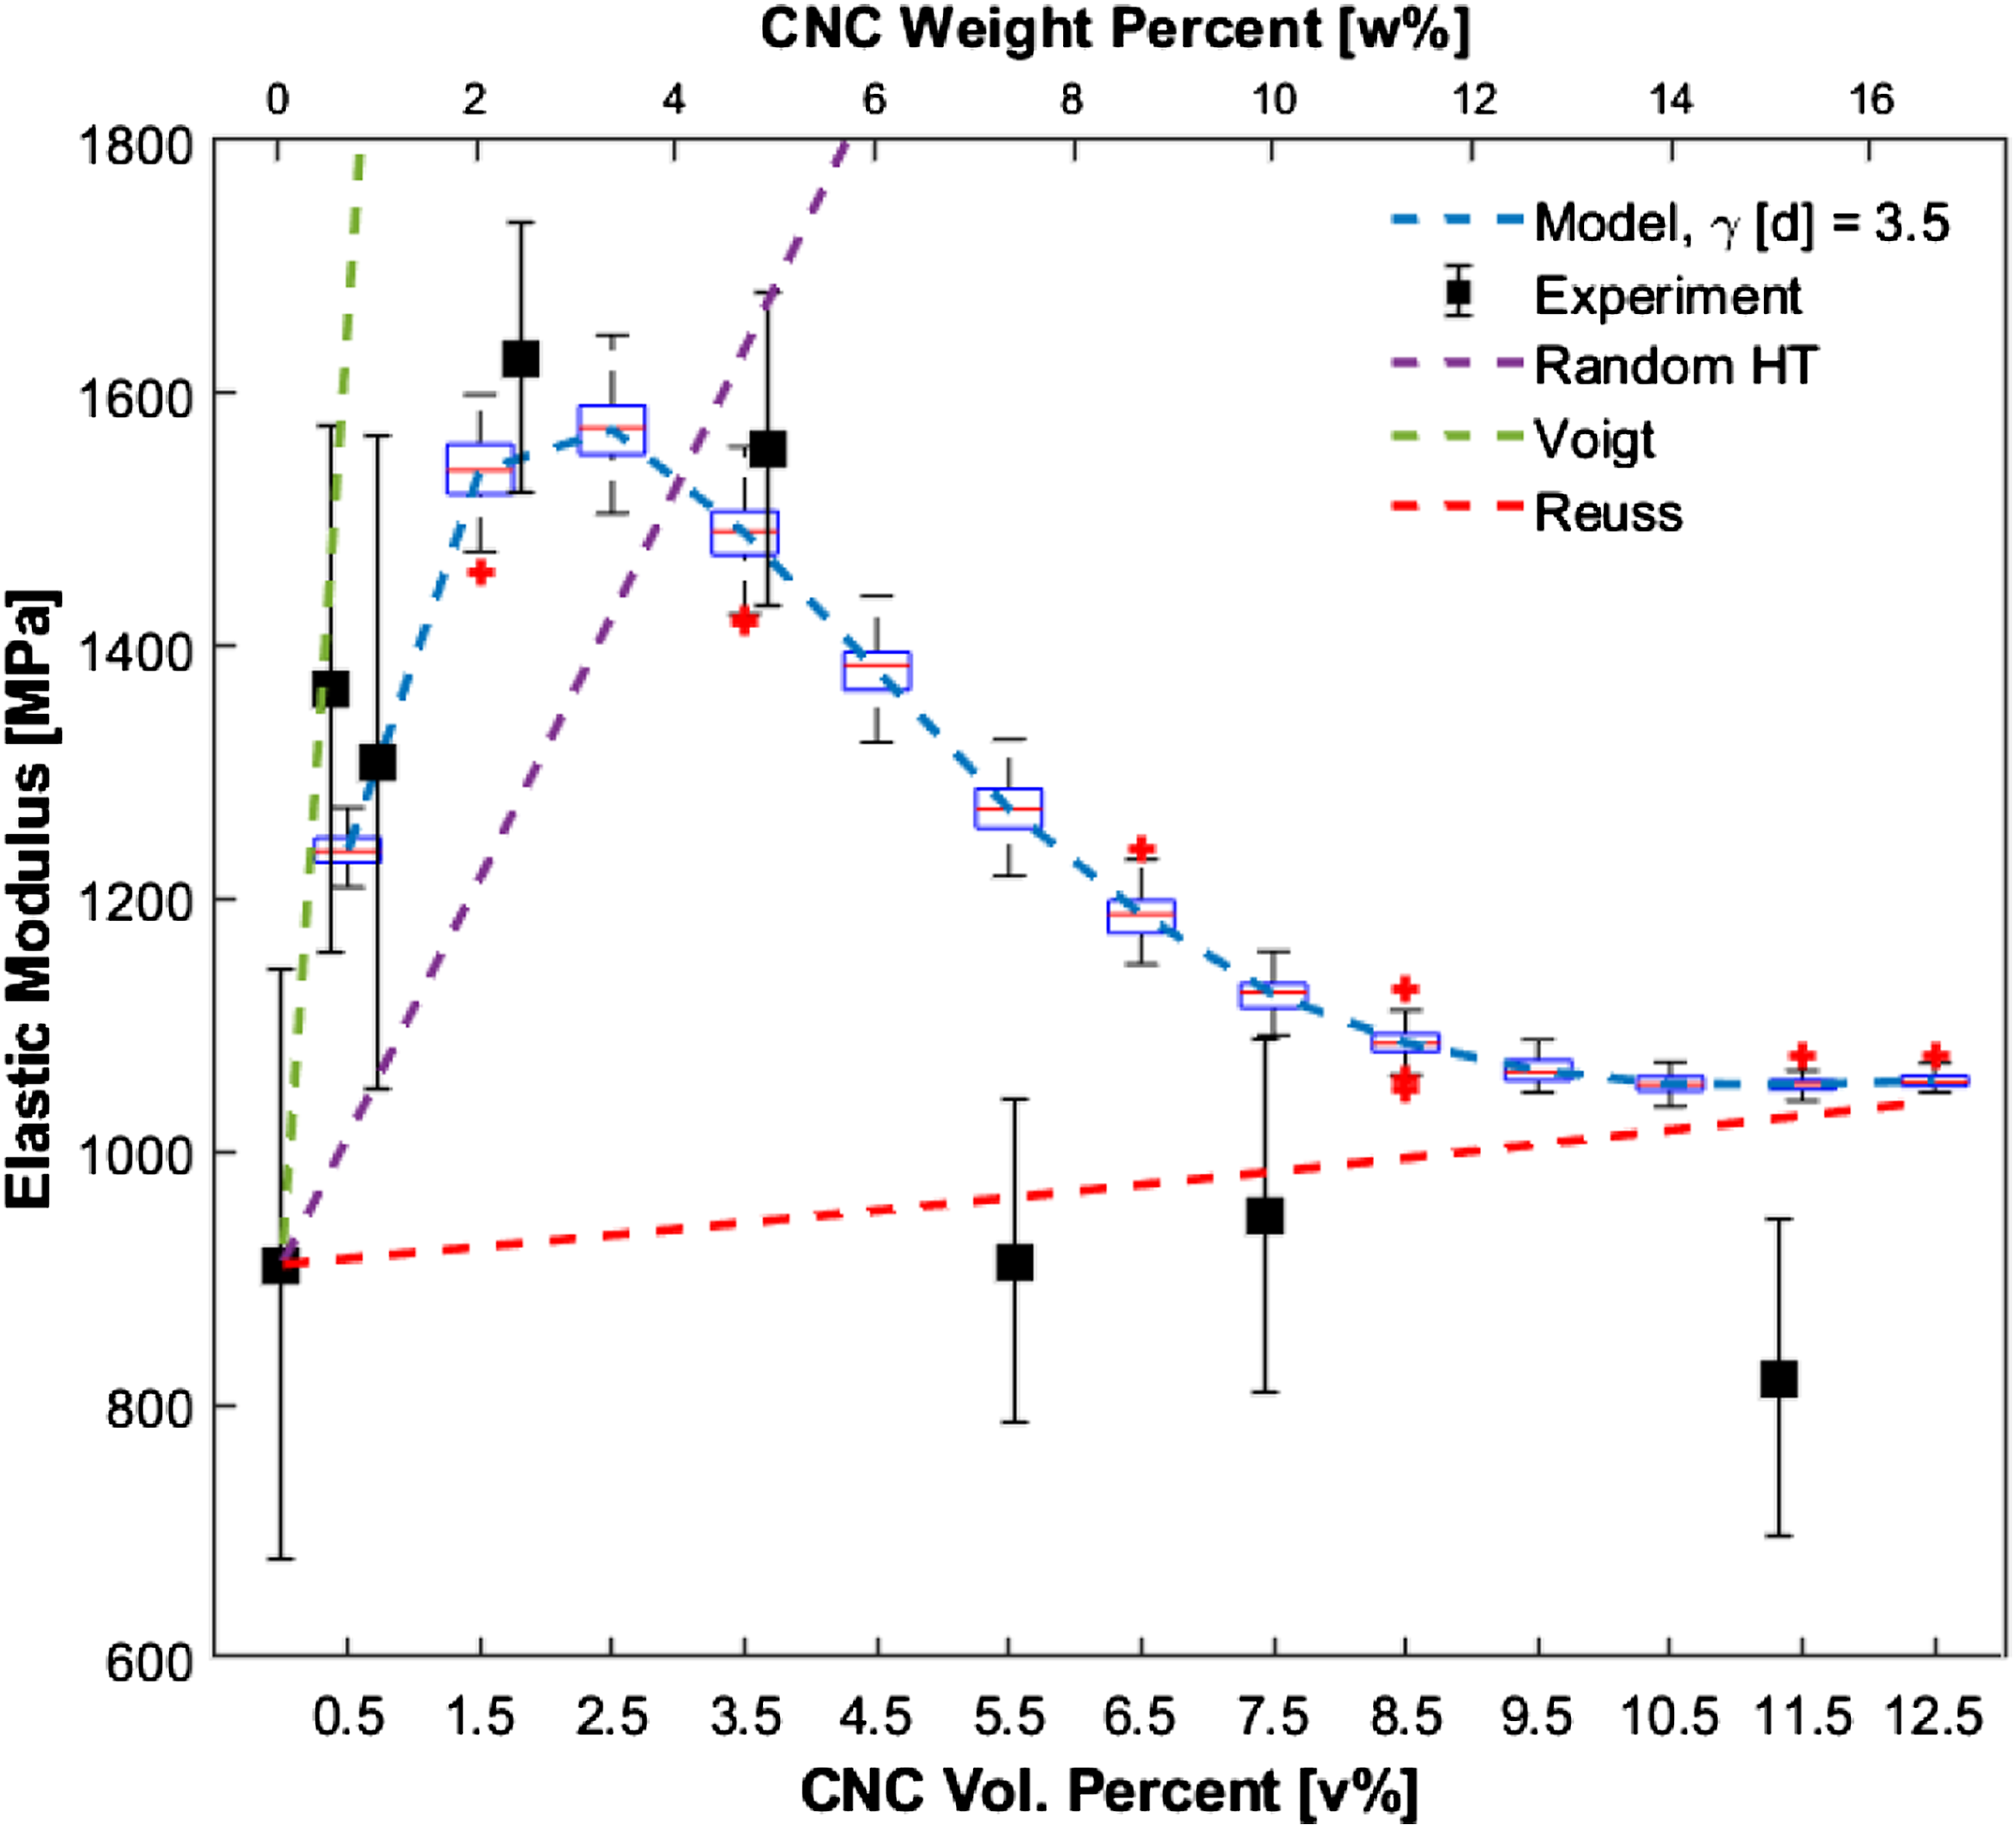
A drop in elastic moduli, and high standard deviations, at higher CNC loadings are observed in Figure 8. This can be related to agglomeration state of the particles and their potential effects on homogeneity of specimen thickness. During the experiments, the agglomerated particles were observed with the naked eye at high CNC loadings. TEM analysis from our previous study 40 also shows how agglomerates reach micron-size dimensions at 15.0 w% CNC loading where the thickness of the sample was approximately 5 μm. It can be discussed that some micron-sized agglomerates are partially embedded into the matrix. These defects may lead to variations in results of the experiments and could lower the elastic modulus of the nanocomposite. As can be seen, in high loadings, this could even result in nanocomposite’s elastic modulus to be lower than the matrix’s elastic modulus. Although the nature of the specimens result in variations in experimental results, our model captures the trend of the experimental results relatively well compared to existing conventional models.
It is still important to understand the deviations from experimental findings. In our predictions, we assumed aligned particles with a specific aspect ratio value. However, even if it is reasonable to assume particles are aligned, the complete particle alignment at the nanosize level is challenging to achieve. The alignment might also depend on the particle loading. In addition, particle size is likely to have distribution instead of a certain value; however, an average value is used in this study instead of distribution. These uncertainties are thought to be the main reasons for the difference between the model predictions and experimental results. In addition, the dispersion is assumed to be uniform for all concentrations in these predictions, which may not be completely valid. The particle dispersion may change with increasing particle concentration due to increased viscosity or particle-particle interactions. Kalfus et al. 71 discussed these physical relations and noted that a stable dispersion could be possible with favorable interactions between particle and matrix. Kalfus et al. 71 also state that temperature and particle loading affects the particle dispersion. Thus, the effect of temperature and particle loading can be related to dispersion parameter in the model. Moreover, Janjar et al. 72 reviews the physical relationships between nanoparticles and properties of polymer nanocomposites and shows how matrix type – amorphous versus crystalline can change mechanical response and dispersion state. The interactions between chains and nanoparticles surfaces based on molecular dynamic data and material type can be used when deciding the value of the critical distance parameter. Although variabilities exist in the model and the experimental setting, it can be said that the model satisfactorily captured the experimental results. The proposed model reflects the experimental trend well whereas common analytical models predict a continues increase with increasing particle loading. Linear relationship between the elastic modulus and particle loadings.
Conclusion
The proposed study focuses on a parametric study of our recently developed model that predicts the elastic modulus of nanocomposites based on the three-phase Mori-Tanaka model: free particles, agglomerated regions, and a matrix. The aim is to study the effect of agglomerations on nanocomposites at a broad range of reinforcement loadings. Since the agglomeration tendency of nanoparticles is a challenging problem to predict, the Monte-Carlo and hierarchical clustering method are proposed to capture the agglomerate formation. Along with agglomerate formation, a systematic study is performed to understand the effect of aspect ratio, critical distance, particle orientation, agglomerate property, and dispersion state of particles.
The critical distance parameter and elastic modulus of agglomerates are the key design parameters at high particle loadings. The critical distance parameter defines the agglomerated region that contains matrix and particles. Higher critical distance values result in easier agglomeration. As agglomerates are formed, the agglomerates’ properties begin to dominate the general response of nanocomposites. In that sense, predicting agglomerates’ properties become crucial for the model. Either the Halpin-Tsai or the Reuss models are assigned to predict agglomerates’ properties and examine agglomerates’ effect on the elastic modulus of nanocomposites. While the Halpin-Tsai overestimates the elastic modulus, the Reuss model provides more reasonable results.
The aspect ratio, orientation and dispersion of particles are also investigated to understand the model’s sensitivity. The drastic effect of aspect ratio and particle orientation on the elastic modulus of nanocomposites is observed at high particle loadings. At any aspect ratio, aligned fillers exhibits shows steeper slope than randomly oriented particles. It is concluded that alignment has more influence on the elastic modulus than the aspect ratio in the range of 15–60 for the case of uniform particle dispersion. Particle dispersion, another key parameter, is studied by locating the particles differently in the computational setting. The more uniform dispersion results in higher elastic modulus of nanocomposites regardless of other parameters. It is also observed that the agglomeration is inevitable at high particles even if particle locations are selected from uniform distribution function.
In this work, the capability of the previously developed model is analyzed with a systematic study. The proposed approach captures the experimental trend of elastic modulus of CNC reinforced PA6 samples relatively well compared to the conventional analytical models. As future of this work, the manufacturing methods and critical distance could be categorized based on the material system, and they could be correlated to the dispersion state of nanoparticles. With the existing data in the literature, we believe these correlations can be established via machine learning techniques.
Footnotes
Acknowledgements
Finally, the authors would like to also acknowledge the supports of NSERC Discovery Grants of Professors Ayranci, Kim, and McDermott.
Declaration of conflicting interests
The author(s) declared no potential conflicts of interest with respect to the research, authorship, and/or publication of this article.
Funding
The author(s) disclosed receipt of the following financial support for the research, authorship, and/or publication of this article: This work was supported by the Alberta Innovates and Alberta-Ontario Innovation Program through Alberta Innovates, FPInnovations [SFR02735 Nanocellulose Challenges]; and Natural Science and Engineering Research Council of Canada (NSERC) Collaborative Research and Development Grants [CRDPJ 500602-16].