
Abstract
Conventional superalloys possess high strength, high oxidation resistance and high creep resistance. Nonetheless, some lose strength at elevated temperatures, while others suffer high temperature oxidation and creep. This work was aimed at developing high entropy alloy (HEA) of Ti36-Al16-V16-Fe16-Cr16 at near equi molar configuration using spark plasma sintering technique which would be able to address the challenges of conventional superalloys. The powders were mixed with Turbular mixer at 69 rpm for 10 h. The sintering was carried out with the same sintering pressure of 40 MPa, time of 10 min, heating rate of 100°C/mins on all the samples. Only the sintering temperature was varied. The temperatures used included 700°C, 800°C, 900°C, 1000°C and 1100°C, respectively. The powders and sintered samples were characterized with Scanning electron microscopy connected to Energy Dispersive Spectroscopy and X-ray diffractometer. The mechanical properties were tested with Nano indenter using ASTM D785 standard; while the thermal stability was investigated with thermogravimetric analyzer. Results showed that HEA sintered at 1000°C possessed the best nanomechanical, thermal and microstructural properties while that sintered at 700°C had the weakest properties. The best developed alloy had an improved elastic modulus of 671.17 ± 50 GPa and 930.12 ± 38 GPa at darker flakey phase and white phase, respectively. It had creep resistance of 1.82%, densification of 98.96% and porosity of 1.04%. It was concluded that the developed alloy can perform much better than most superalloys in high temperature and high strength and applications.
Introduction
High temperature embrittlement and oxidation susceptibility are some of the challenges ravaging traditional superalloys and research reveals that their strength collapses when tempered at 350 – 550°C. Nevertheless, alloys applied in aerospace turbines, nozzles and thermo-engines are expected to retain their strengths at elevated temperatures together with exhibiting low creep. Unfortunately, superalloys of Ti, Ni, Co and Al fall into this category and are still being used despite their low efficiency because of the dearth of functional and hybrid alloys. It was to address these challenges that high entropy alloy (HEA) was developed. It consists of five or more elements combined in equi or near equi molar configuration. The high number of elements that form HEA induces the formation of solid solution in place of intermetallic compound. Excellent characteristics of HEA are stimulated by high entropy effect, lattice distortion effect, sluggish diffusion effect, and cocktail effect. The high entropy effect enhances the formation of solid solution more than intermetallic compounds; lattice distortion effect induces distortion and strain in the lattice configuration thereby promoting solid solution strengthening and forestalling dislocation; sluggish diffusion lowers grain growth and phase segregation, improves thermal stability and creep resistance; while cock tail effect enhances the reaction of the constituent elements in order to promote high temperature performance of the alloy.1-5 All these effects synergize to impart HEA with superior characteristics. Conventionally, arc-melting was used in developing HEA but suffers segregation of elements with evolution of cracks and cavities. 6 Other methods employed included severe decomposition, 7 ultrasonication, 8 carbothermal shock synthesis, 9 fast-moving bed pyrolysis, 10 but all these techniques were either not cost effective or had low production output. Spark plasma sintering (SPS) has been recently employed in the development of HEA. Fu et al., 11 fabricated Co0.5FeNiCrTi0.5 HEA with mechanical alloying (MA) and SPS and obtained high microhardness and good microstructure. Yeh et al., 12 observed that NiCoCrCuFe HEA developed via SPS had superior mechanical and microstructural properties than its counterpart prepared via stir casting. Fu et al., 13 further noticed that HEAs developed via SPS showed lower porosity than those produced with hot pressed (HP) technique. This is because pulsed DC of SPS reduces activation energy of defect diffusion and migration, thus vaporizing impurities and eliminating cavities. So, SPS has proven to be useful in developing HEA as it produces samples devoid of micro pores with low grain growth and strongly bonded particles.14-16 Ti6Al4V has been so popular in recent years because of its low density, high strength, high modulus, low coefficient of thermal expansion (CTE) requisite in high temperature applications. However, it has poor shear strength and very susceptibility to corrosive acids; and subsequently exhibit low performance in some critical areas of application. 17 So, to address these shortcomings, development of Ti36-Al16-V16-Fe16-Cr16 HEA with SPS was conceptualized. Fe is a ferromagnetic element bequeathed with the characteristics of improving the modulus, wear resistance, oxidation and corrosion resistance of Ti-alloys. It is an α-phase BCC crystal at room temperature but transforms to FCC γ-phase at 910°C which help in improving the strength and solid solution formation of the ensuing alloy. Recall also that FCC crystal induces lattice distortion effect which prevents dislocation of atoms and improves strain hardening reaction. Cr in the other hand enhances strength in HEA and enhances the evolution of BCC + FCC double phase solid solution with improved modulus and ductility.18-20 It is expected that the excellent properties of Fe and Cr will be able to improve the high temperature strength, oxidation and creep resistance of the alloy being developed. Moreover, consolidating the HEA with SPS will impact superior properties to the alloy. This is because SPS has proven to improve mechanical, thermal, physical and other properties of alloys and composites. Therefore, this research was motivated by the quest to develop a HEA that will perform better than conventional Ti6Al4V alloy in high temperature and strength demanding applications.
Experimental procedure
The powders used in this experiment included Ti with purity of 99.9%, particle size of 45 -55 μm and density of 4.54 g/cm3; Al with purity of 99.9%, particle size of 45 μm and density of 2.7 g/cm3; V with purity of 99.9%, particle size of 45-50 μm and density 6.1 g/cm3); Fe with purity 99.9%, particle size of 45 μm and density of 7.87 g/cm3 and Cr with purity of 99.9%, particle size of 45-65 μm, and density of 7.19 g/cm3. They were supplied by TLS Technik, Germany.
The powders were blended with Tubular shaker mixer after measuring out appropriate weight of corresponding powders that would generate Ti36-Al16-V16-Fe16-Cr16 near-equi molar HEA. The mixing was conducted for 10 h to ensure homogenous dispersion of particles at a rotating speed of 69 revolutions per minute. Steel balls of 8 mm diameter were incorporated into the powder being blended to enhance homogenous dispersion at ball-to-powder ratio of 4:5. 21 After blending the powders, the mixture was poured into a graphite die, closed and transferred into the sintering chamber of the machine.
After blending the powders, appropriate weight to produce pellet of 30 mm diameter and 5 mm thickness was measured into a graphite die and transferred to sintering chamber of SPS machine (KCE-FCT-HHPD 25, Germany). Then initialization of the machine was conducted as follows: vacuum pressure = 70.5 Pascal, relative pressure = −6×10⁴ Pascal, absolute pressure = 100 Pa. As the initialization was completed, the sintering of the first sample was set running by fixing the sintering temperature at 700°C, pressure at 40 MPa, dwell time at 10 min, and heating rate at 100°C/mins. Subsequently, other samples were fabricated with this set of parameters; except the sintering temperature which was adjusted to 800, 900, 1000, and 1100°C, one after the other. At the completion of each sintering, the pellet was sandblasted to remove contamination from graphite paper shield. 22 Five samples fabricated included samples A, B, C, D, E which were pellets sintered at 700, 800, 900, 1000 and 1100°C respectively.
The samples were then sent for metallography. They were cut into various sizes for microstructural characterization, mechanical and thermal testing. Thereafter they were etched using Kroll’s reagent and KOH in di-ionized water. The cut samples were polished to mirror surface using 120 grit emery cloth lubricated with fumed 0.1 μm fumed silica.
The microstructure of as-received powders and sintered samples were conducted with scanning electron microscope connected to energy dispersive spectroscopy (SEM-EDS, TESCAN), and X-ray diffractometer (XRD - Bruker D8, Madison, WI, USA). The theoretical density (bulk density) of the blended powders was calculated using rule of mixture. The experimental density was calculated using Archimedes principle.
23
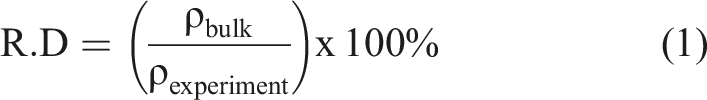
The relative density was calculated as follows

The thermal stability (oxidation resistance) of the sintered samples was investigated with the use of thermogravimetric analyzer (TGA). The analyzer (Universal V8.10A TA Instruments, USA) was employed to determine the oxidation behaviour of the developed HEA. It was conducted at a heating rate of 20°C/min and temperature range of 25 – 1000°C for 120 min in air atmosphere as employed and reported in Ref. 25.
Results and discussion
Powder characterization
Scanning electron microscope images of as-received powders are shown in Figure 1. As can be seen, all the powders except V have spherical particles while V powder has flakey shape. The predominantly spherical grains of the constituent powders have the propensity to improve the young’s modulus of the HEA as observed by Zhou et al.,
26
because the packing density of spherical grains is higher than that of rod-like or flakey grains. More so, higher relative density and lower grain growth are promoted more by spherical grains than other grain shapes.
27
Scanning electron microscope images of as-received powders (a) Ti (b) Al (c) V (d) Fe (e) Cr.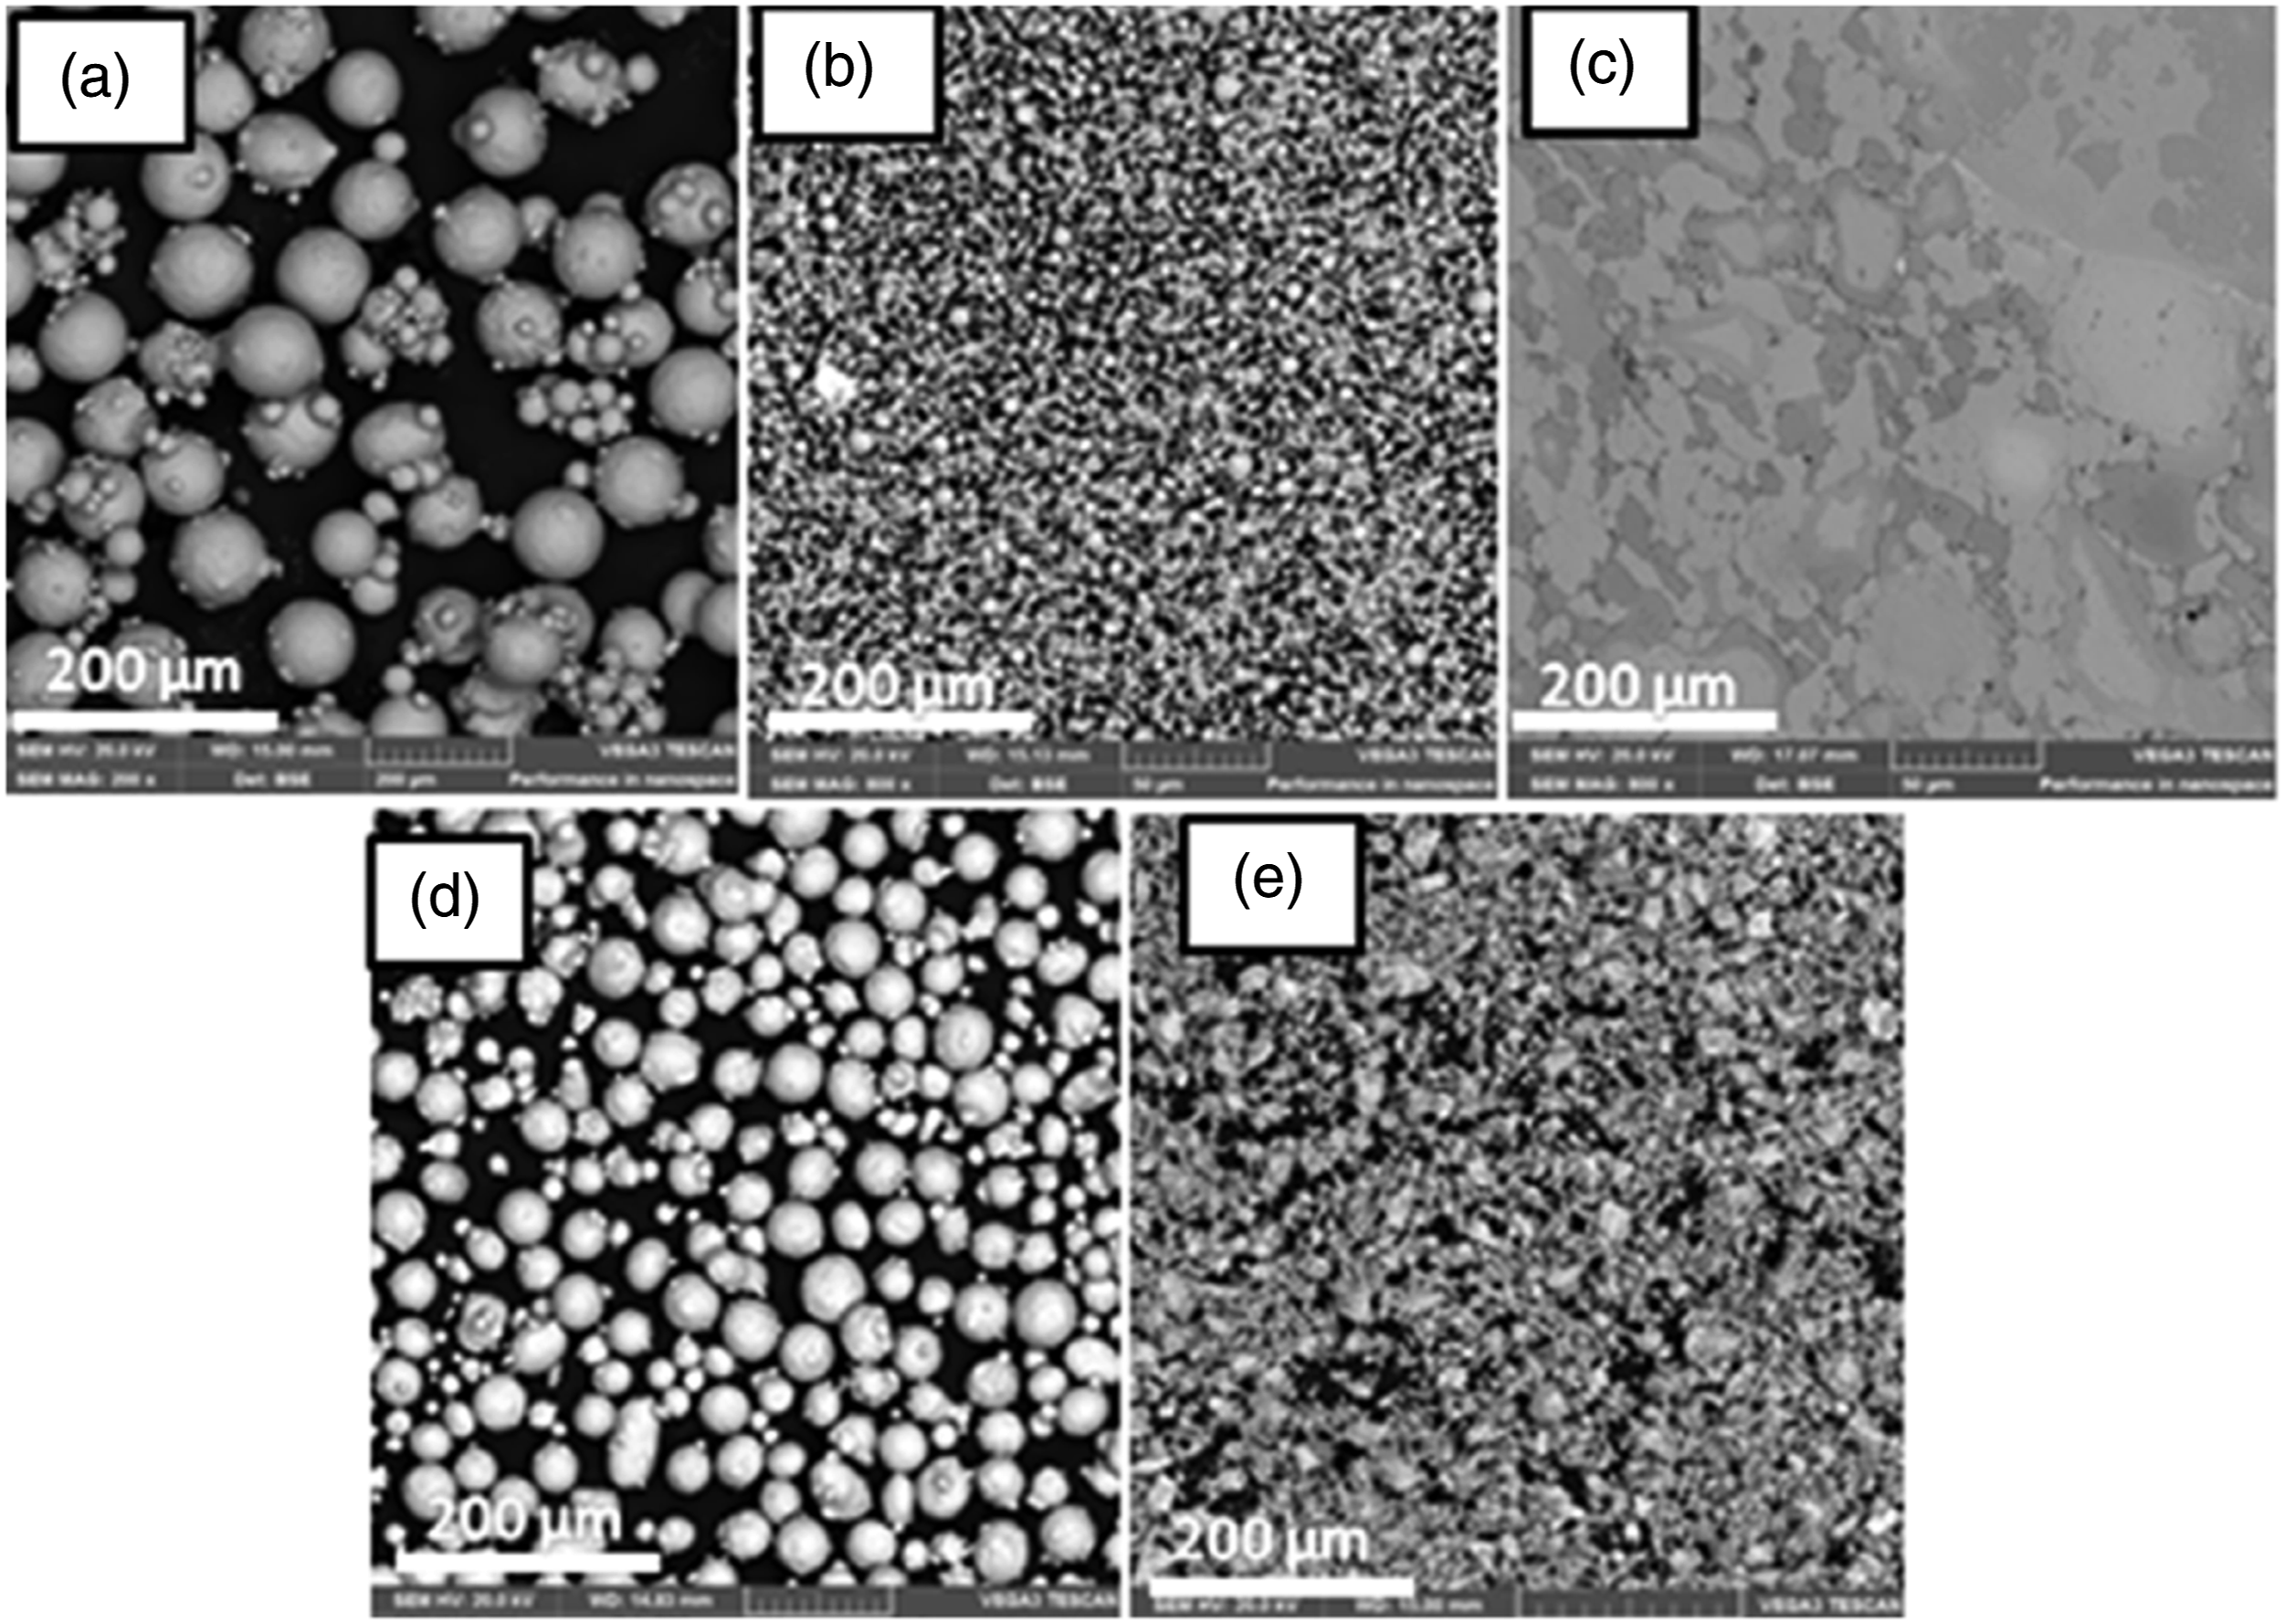
X-ray diffractometer images of as-received powders are shown in Figure 2. Ti possesses 8 peaks and has the highest number of peaks among the constituent elements. All the peaks are thin in shape because the particle sizes are in microns and not nano that are usually strained and results in broad peaks.
23
X-ray diffractometer images of as-received powders.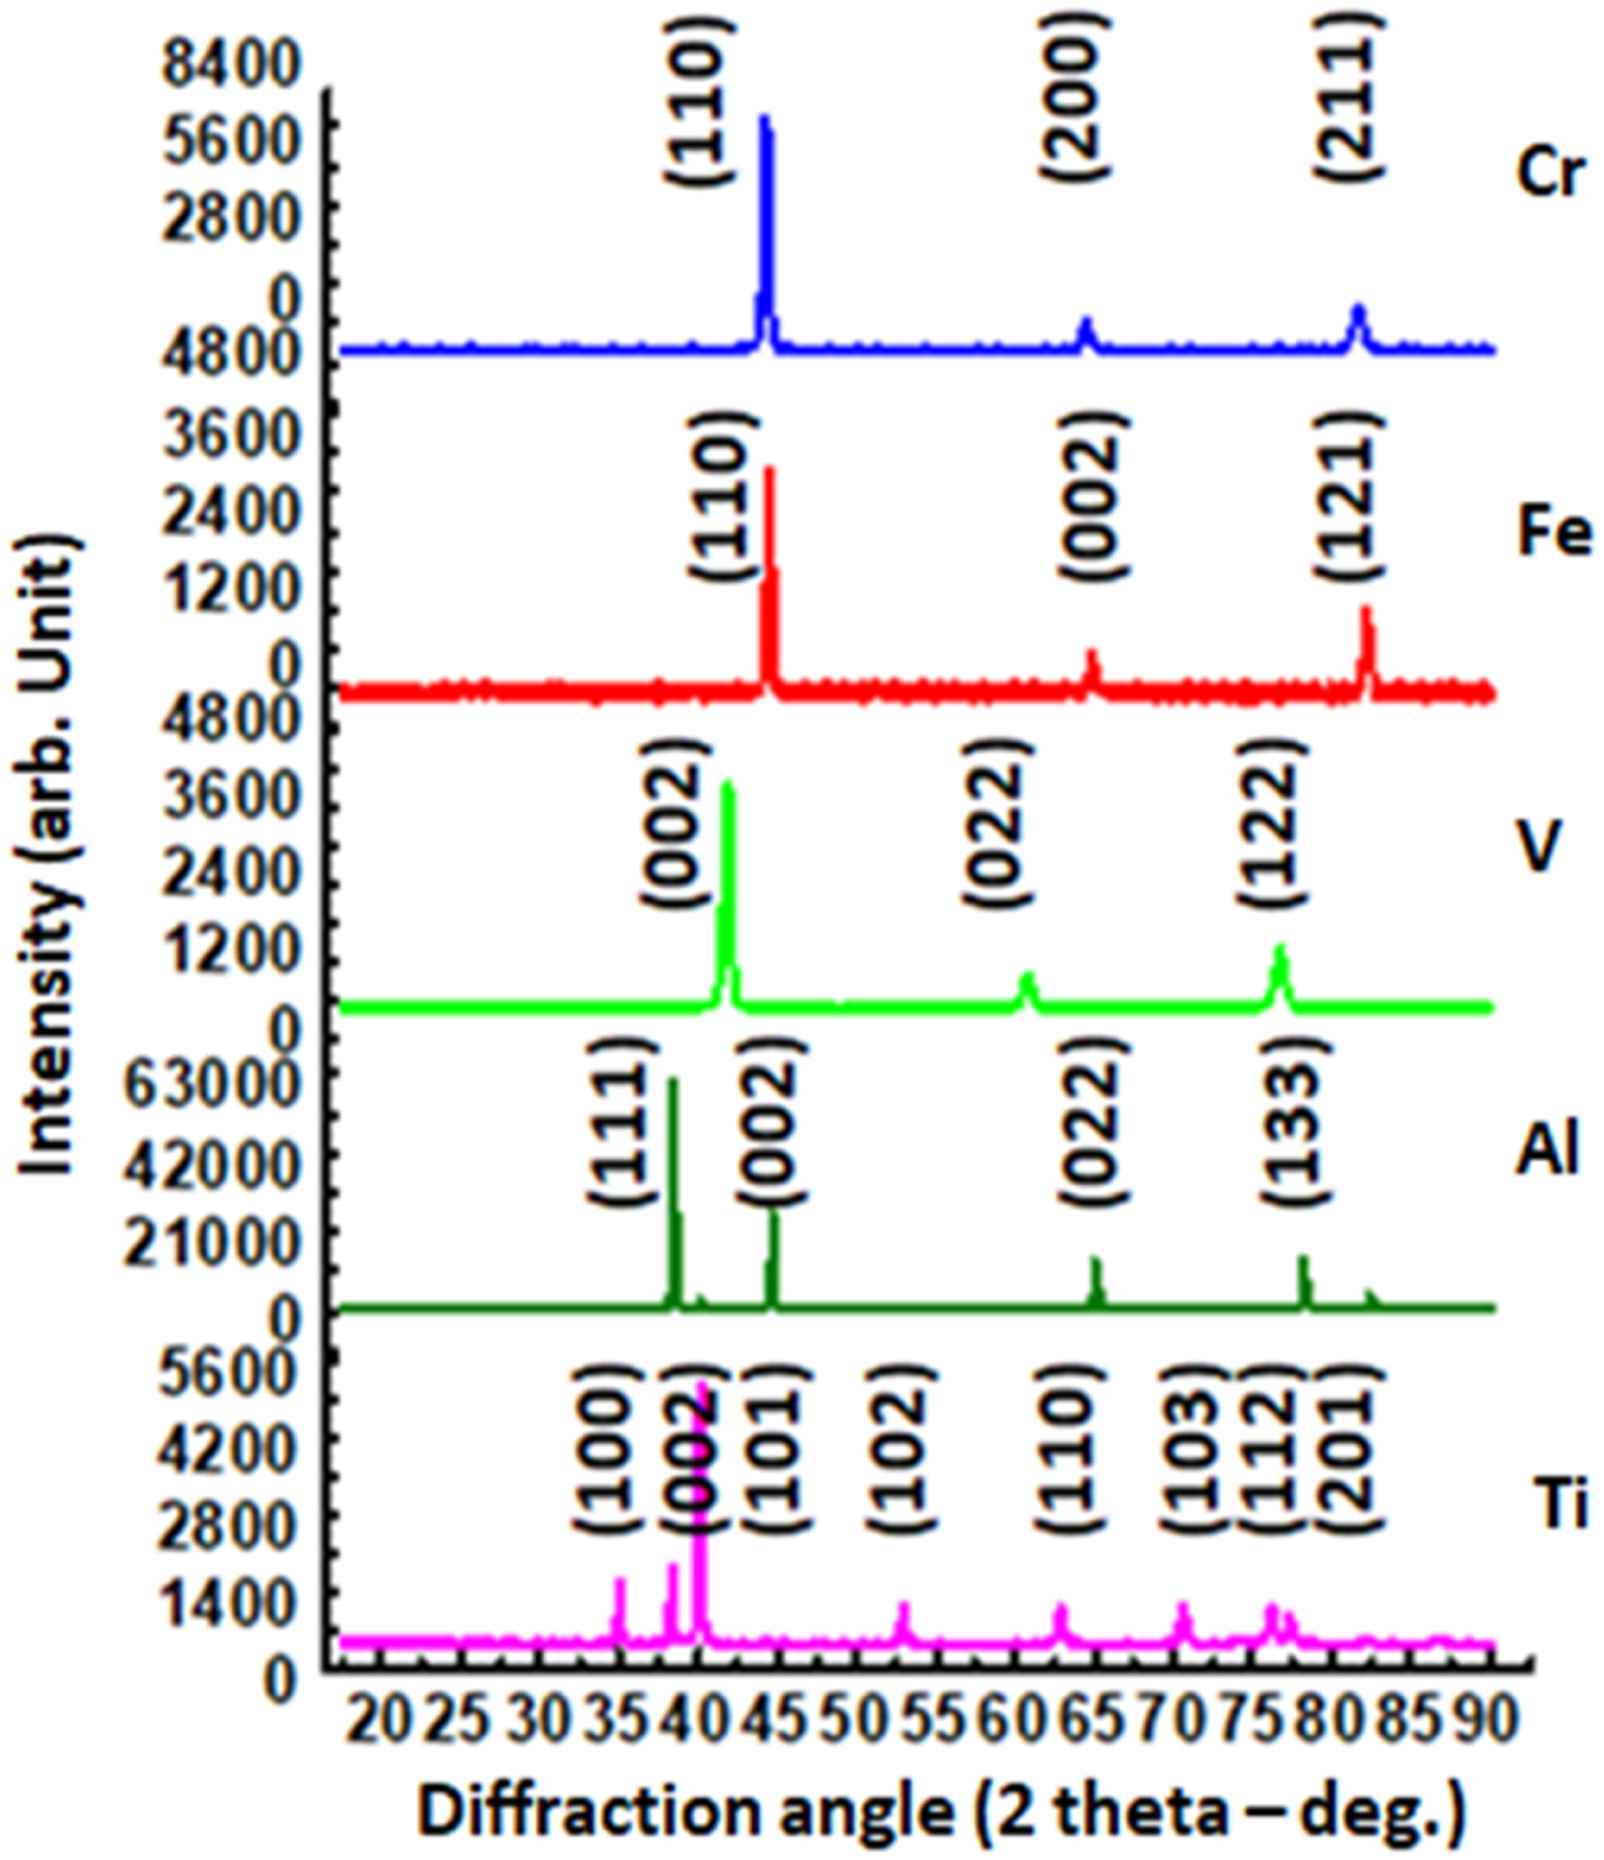
Microstructure of sintered HEA
Scanning electron microscope images of sintered HEA are shown in Figure 3. In Figure 3(a), sample sintered at 700°C, shows two distinct phases. First is rich in α-Ti (lighter in colour) while second is rich in α-Fe (darker in colour and flakey in shape) as revealed by EDS (Figure 4). Evolution of phases manifested as dendrites loosely bonded to each other giving a microstructure with poor homogeneity, scattered pores and weak grain bonding. XRD revealed the metastable phases as BCC1. The poor microstructure is attributed to incomplete vaporization of impurities at this temperature coupled with weak migration of particles across the adjoining atoms which would have homogenized the crystal grains and improved grain bonding and strengthening.
14
This sintering temperature was not adequate enough to stimulate full grain compaction. So, full solid solution formation could not take place at this sintering temperature. This is the reason for poor strength exhibited by this sample as will be seen in subsequent section. Sample sintered at 800°C is shown in Figure 3(b). Homogenization of the grains and the boundaries has improved somewhat while pores and cracks are not as predominant as in the previous sample. Macro and micro migration of particles across the atoms that herald full densification has improved as a result of increased sintering temperature. It could be seen more refined grains and improved boundary strengthening and bonding. Thus improved strength is expected in this sample. Increase in the sintering temperature actually induced better microstructure. For samples sintered at 900°C (Figure 3(c)), it could be observed that even though the temperature had increased, micro pores (shown with yellow arrows) were still present, at reduced numbers, though. But crystallization of stable phases was beginning to take place. Scanning electron microscope images of sintered HEA at various temperatures and constant parameters (a) 700°C (b) 800°C (c) 900°C (d) 1000°C (e) 1100°C. Energy dispersive spectroscopy images sample sintered at 1000°C and the phases present.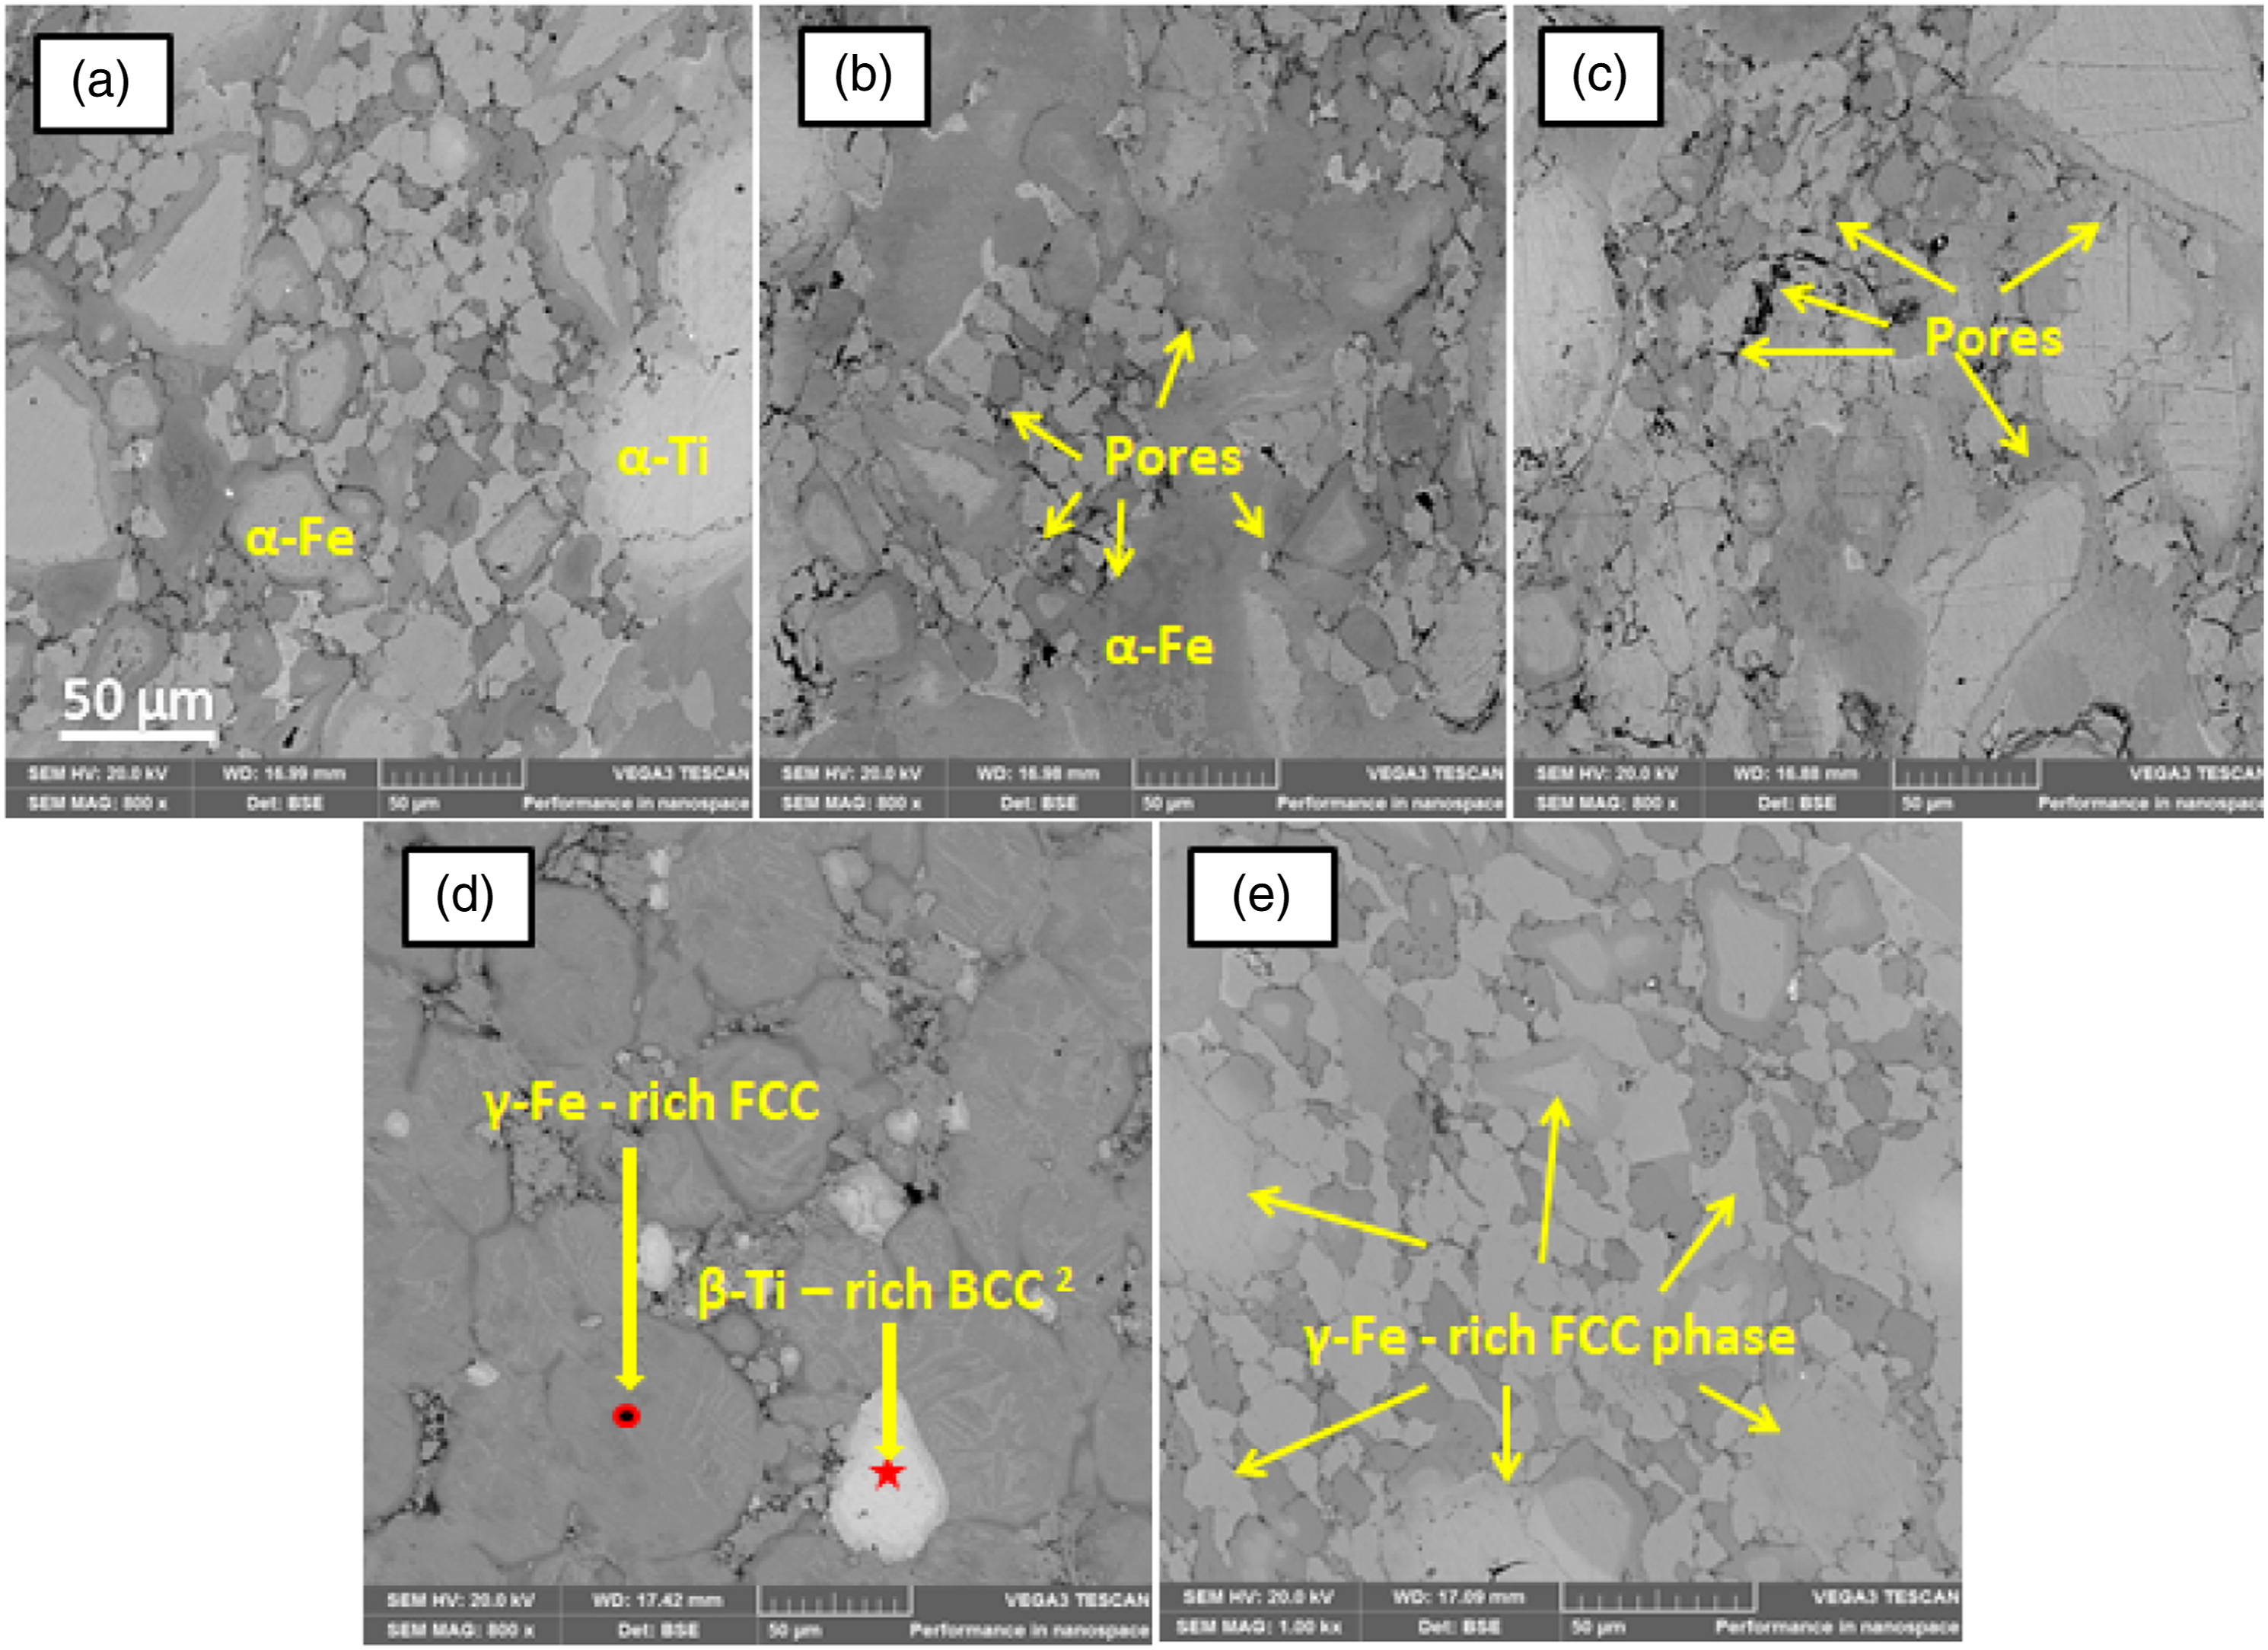
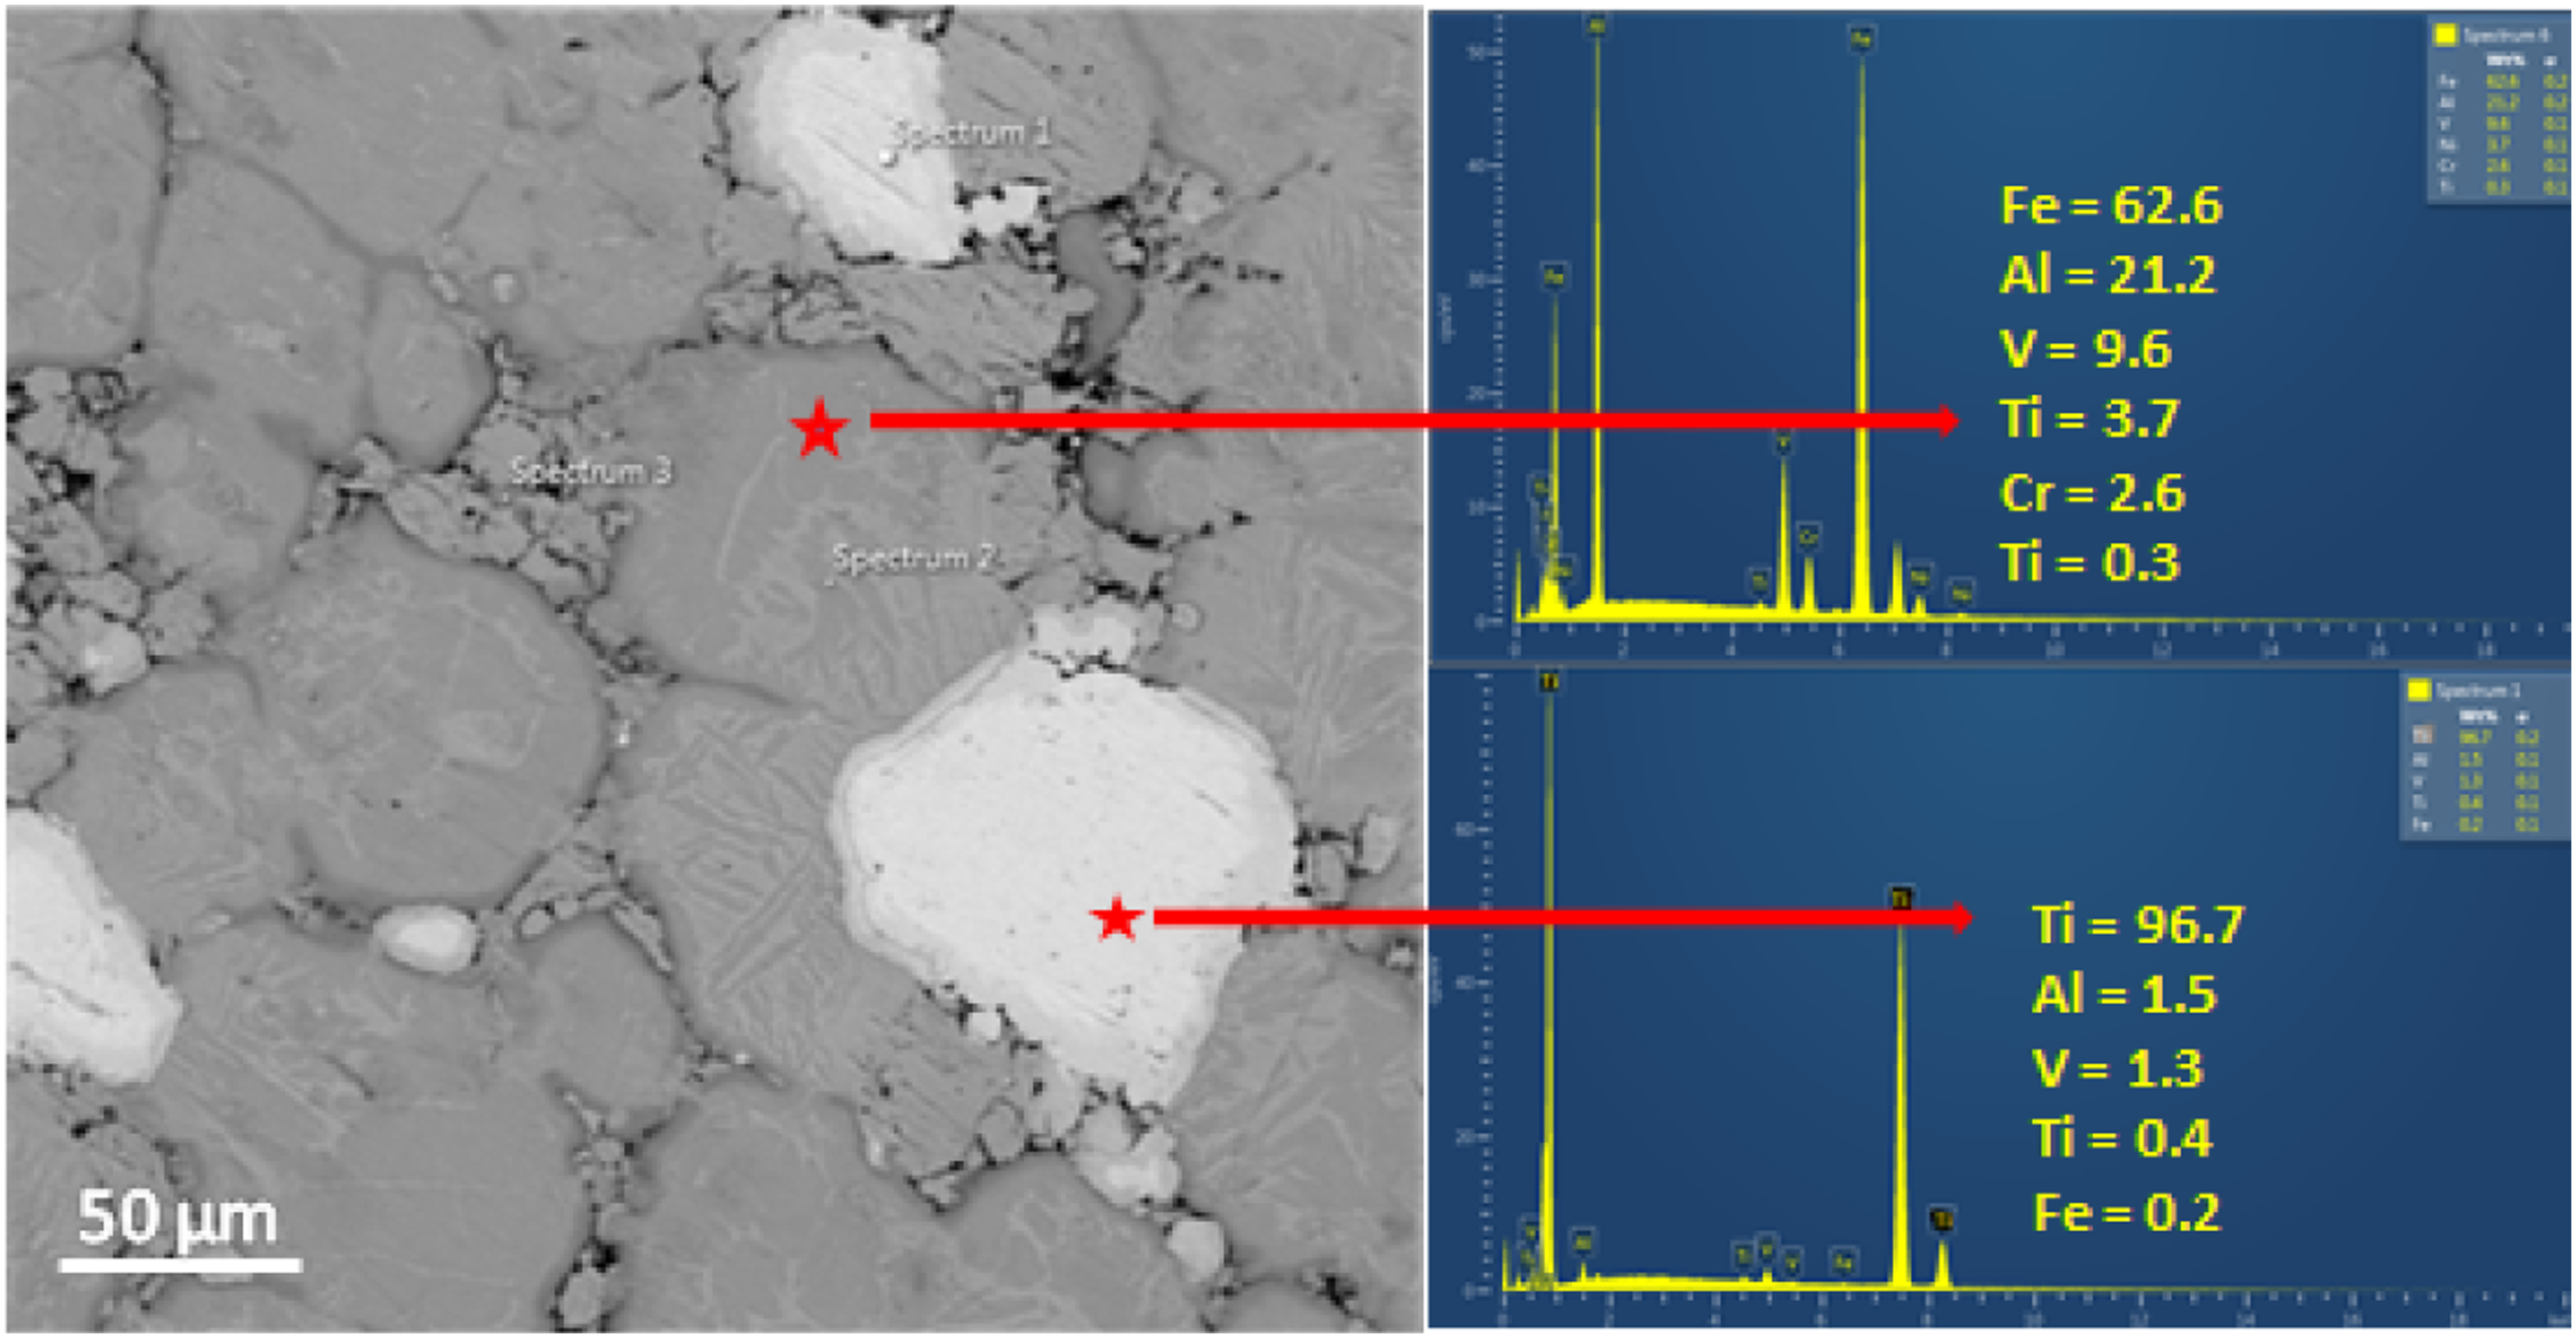
At the sintering temperature of 1000°C (Figure 3(d)), it can be seen that full compaction of the sample had taken place with complete crystallization of stable phases. EDS result with XRD characterization revealed that the lighter phase was rich in β-Ti with a BCC2 structure while the darker phase is rich in γ-Fe with FCC structure. The presence of α-stabilizer (Al) and β-stabilizer (V) in the alloy promoted the formation of α-Ti -rich BCC1 phase at sintering temperature of 700 and 800°C; and β-Ti rich BCC2 phase at 1000 and 1100°C. So, as the sintering temperature exceeded the transformation temperature (883°C) of α-Ti to β-Ti, V which is β-stabilizer promoted the formation of β-Ti rich BCC2. There was total disappearance of BCC1 peaks at the sintering temperature of 900°C leaving only FCC peak (Figure 5) because the transformation may be still on-going. The evolution of BCC2 phase which is rich in β-Ti at higher sintering temperature must have improved the ductility of the alloy system because alpha BCC Ti is more brittle than β-Ti with BCC phase structure.
28
X-ray diffractometer images of sintered HEA and the phases present.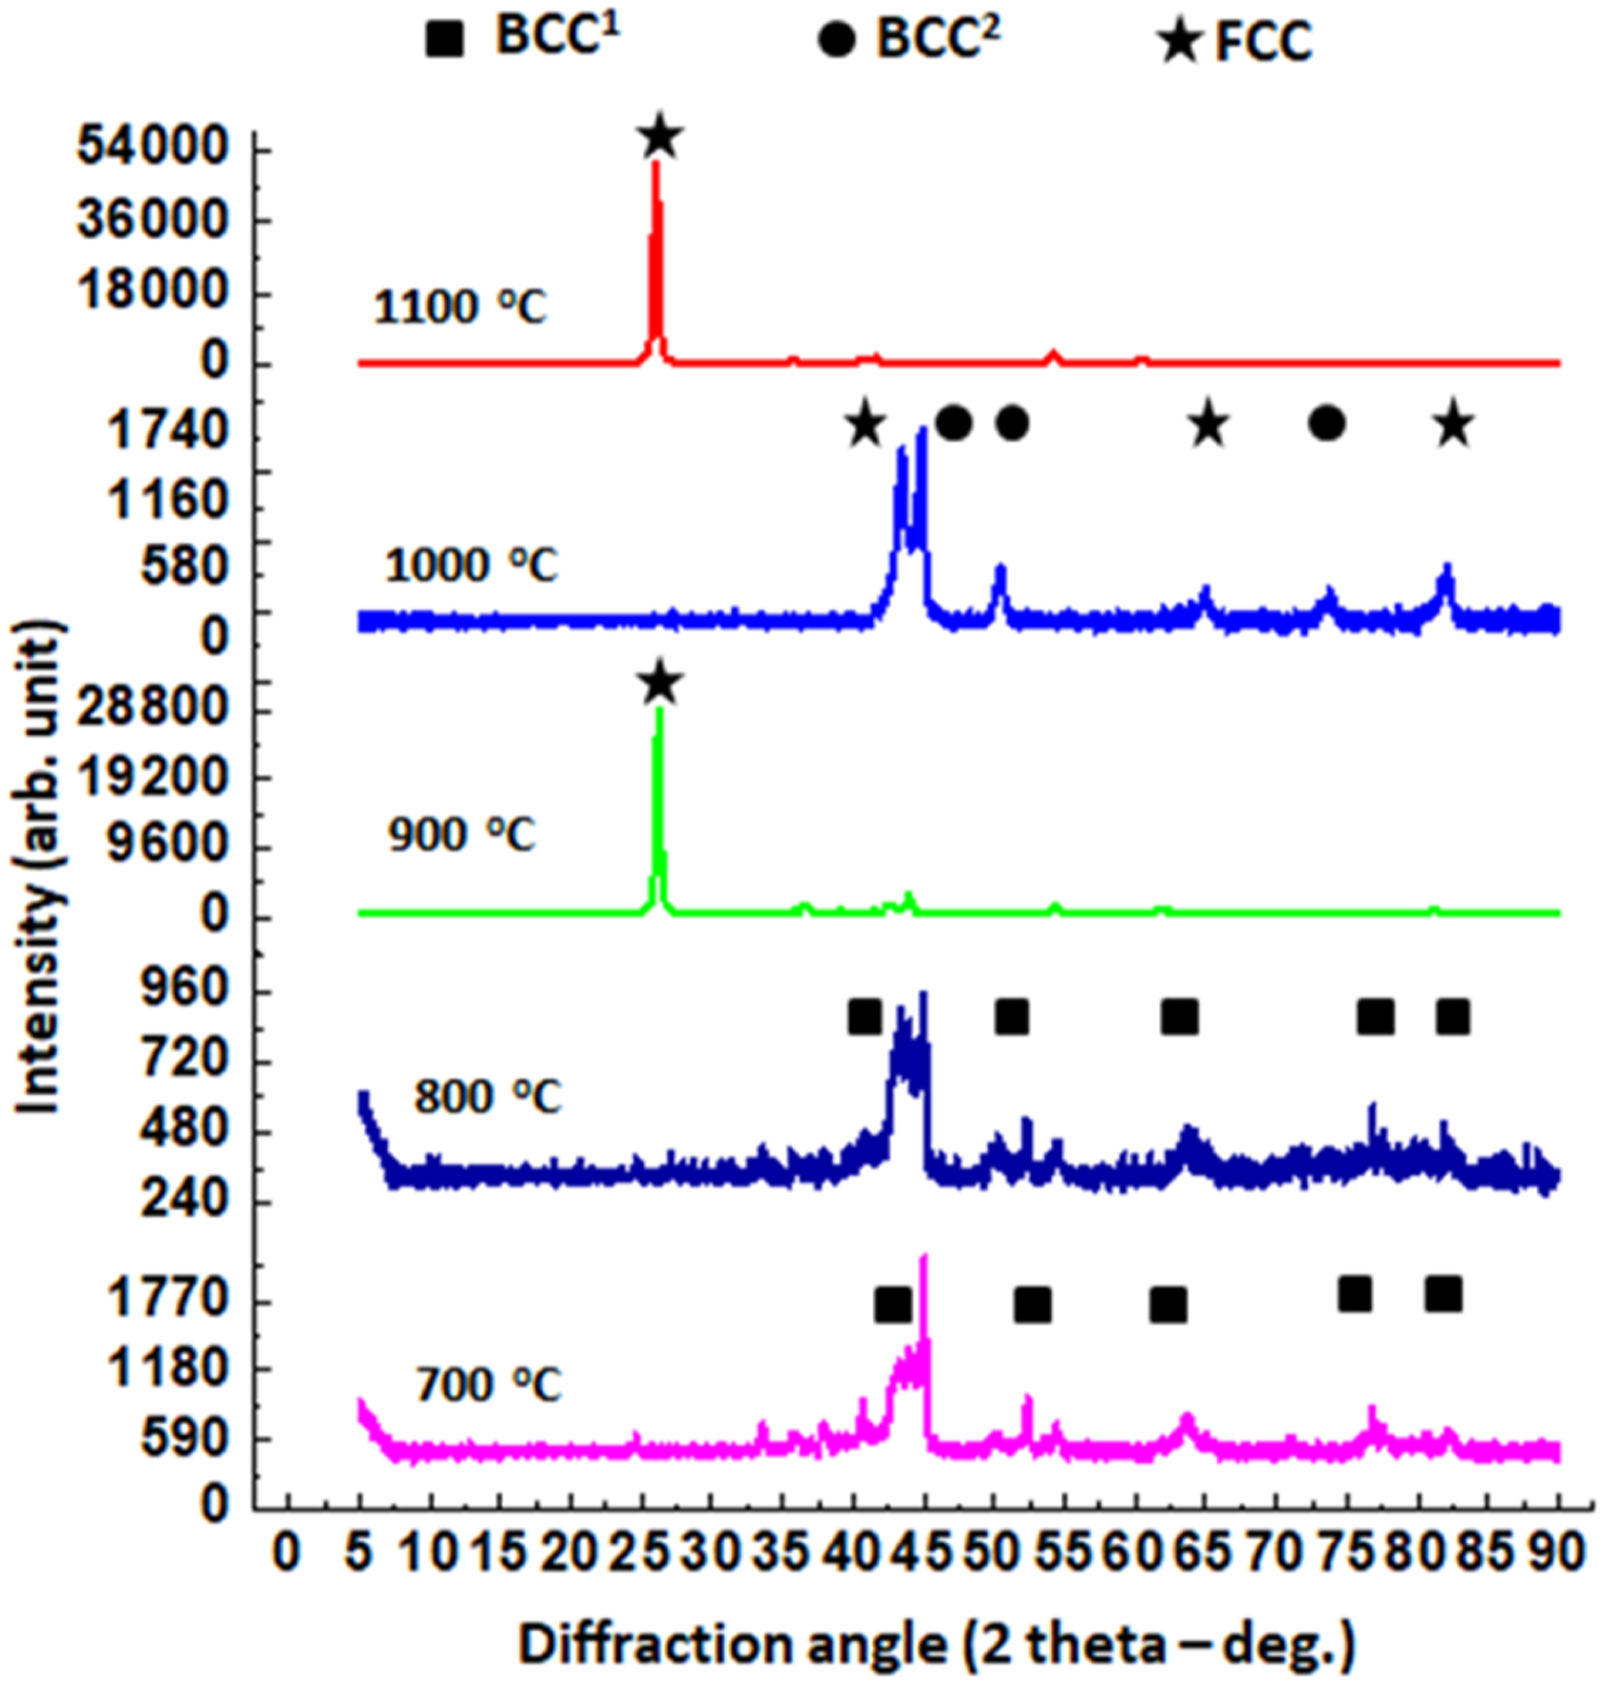
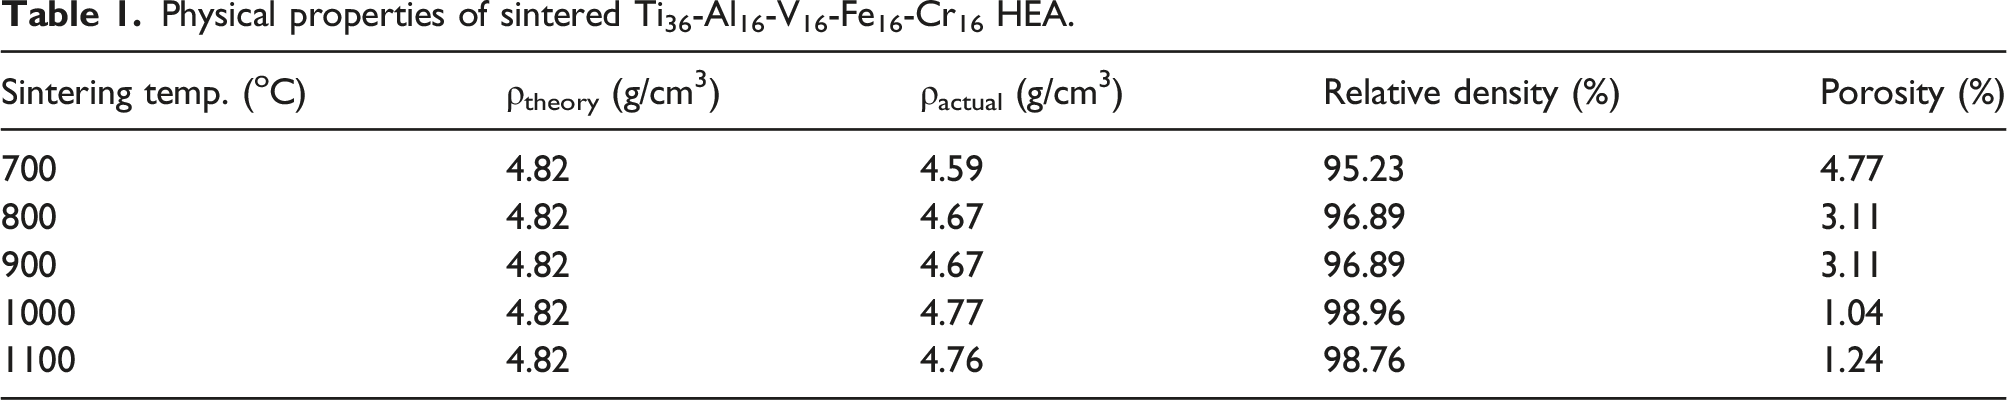
Physical properties of sintered Ti36-Al16-V16-Fe16-Cr16 HEA.
Density of sintered HEA
Theoretical density designated as ρbulk was calculated with use of rule of mixture as stated earlier and equalled 4.82 g/cm3; while the experimental density or actual density was computed using Archimedes principle was obtained individually for the various samples. It was observed that the sample sintered at 700°C had the least actual density but that sintered at 1000°C had the highest density of 4.77 g/cm3 corresponding to a densification of 98.96%. The high densification at higher temperature is attributed to higher metallurgical bonding, higher diffusion coefficient at the optimum sintering temperature. 35
So, at lower sintering temperature, neck formation on the atoms was low; so there were low contact areas between adjacent atoms, and it is through the neck that micro diffusion of particles which facilitates full densification takes place. The maximum densification and minimum porosity were obtained at sintering temperature of 1000°C and 1100°C as reported elsewhere. 36 It should be noted that porosity induces poor mechanical strength because fracture nucleation and propagation initiate at cavity sites. 37 Yu et al., observed that when porosity is above 5%, material strength will diminish hugely. 38 So, the high porosity of samples sintered at 700°C and 800°C would have collapsed their properties if they had exceeded 5%. High porosity was caused by poor densification which was induced by inadequate SPS sintering temperature that led to weak metallurgical bonding. 35
Mechanical properties
The Nano hardness and elastic modulus of the sintered HEA are shown in Figure 6(a) and (c). As was stated that weak microstructure, weak metallurgical bonding and inhomogeneous crystalline grains distribution affect strength of sintered alloys, it was observed that samples sintered at lower temperatures (700 and 800°C) obeyed the law. They possessed lowest hardness and elastic modulus. The low values were attributed to the fact that dislocation slip density is higher in materials with weaker metallurgical bonding. Hence, resistance to indentation as well as return to former shape after unloading tend to be low. There was a decrease of strength at sintering temperature of 900°C which was as a result of transformation reaction going at that temperature which collapsed all the crystal peaks (Figure 5) except one. It will be recalled that more crystal peaks enhances material strengths. Plots of mechanical characteristics of developed HEA (a) Nano hardness (b) SEM image of white and dark phases (c) Elastic modulus.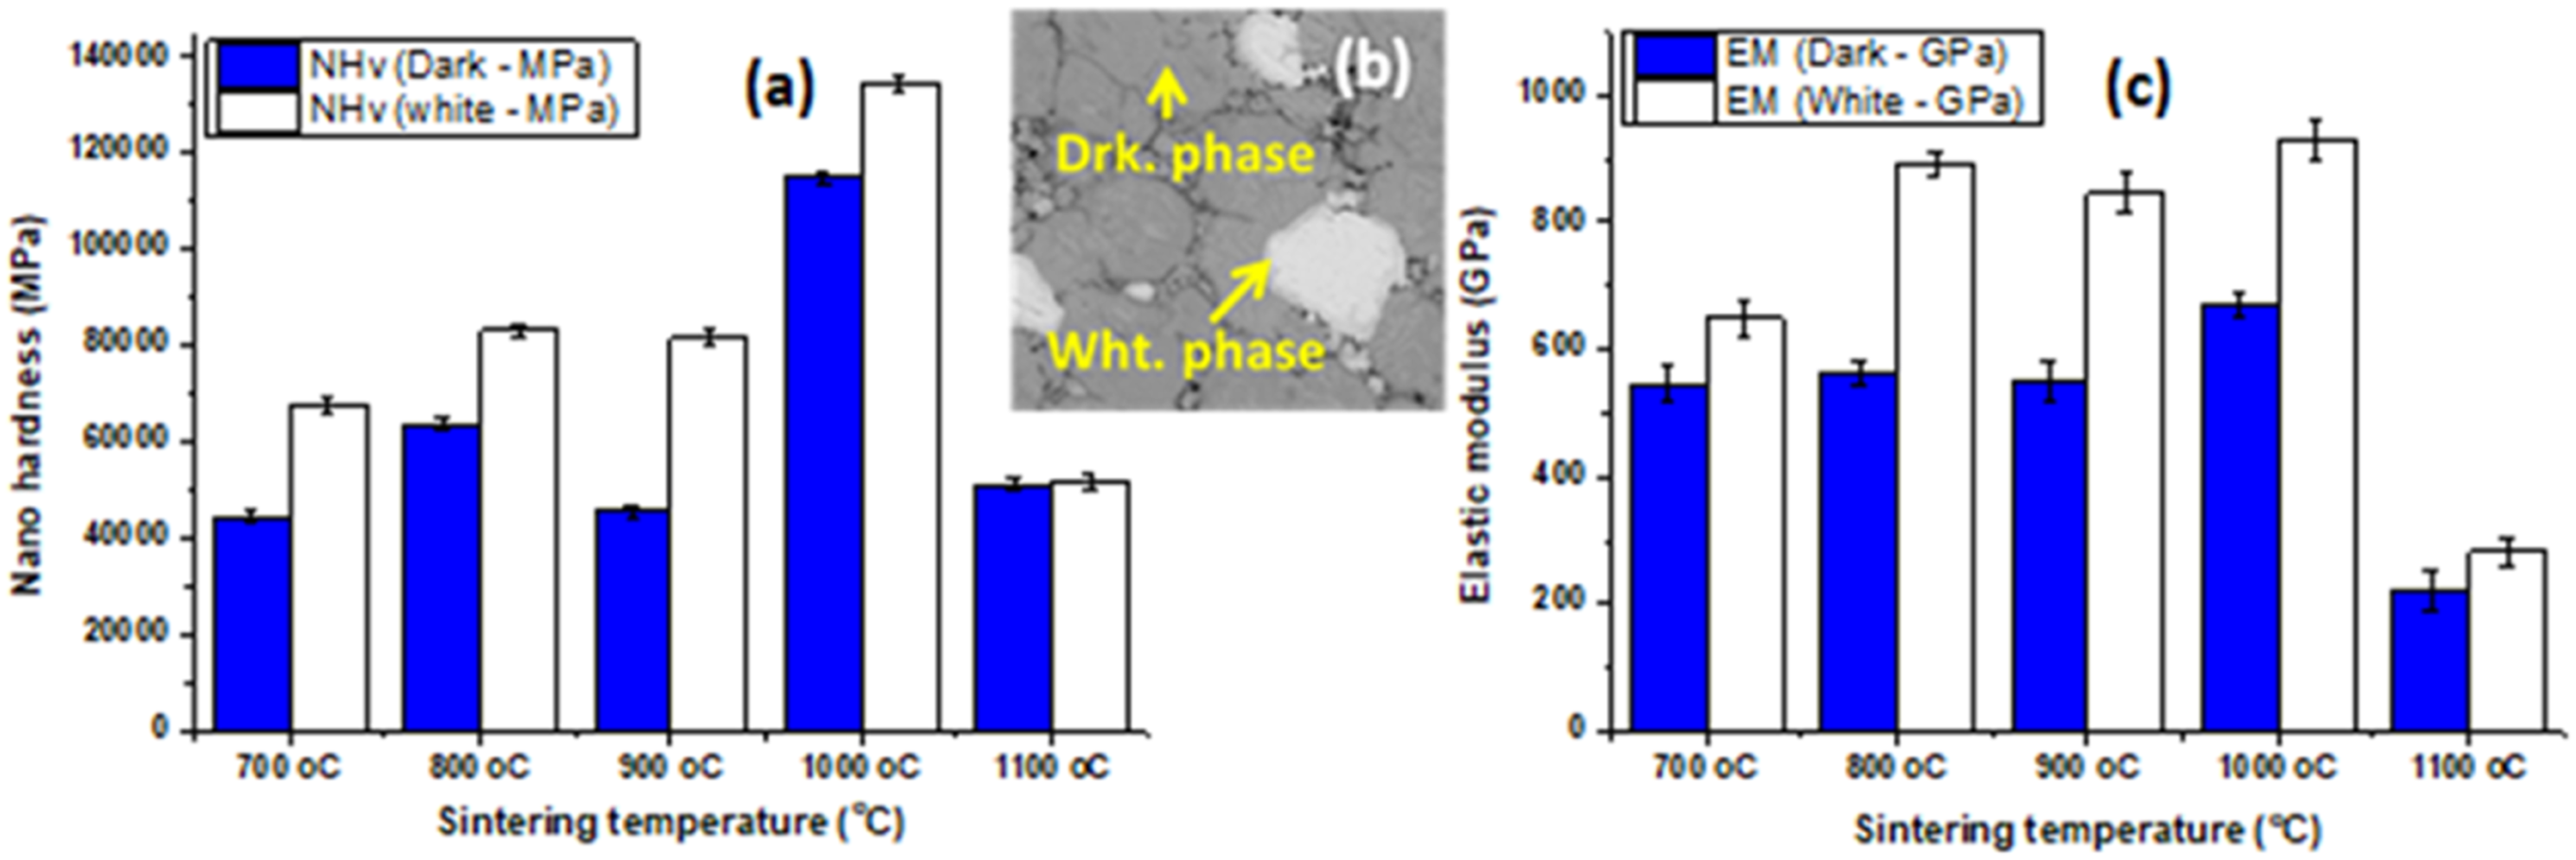
However, sample sintered at 1000°C had the highest nano hardness of 115183.60 ± 366 MPa and 134582.50 ± 544 MPa at dark flakey phase and white phase (Figure 6(b)), respectively. Crystallization of FCC phase rich in Fe, V and Al together with BCC phase rich in β-Ti induced the superior mechanical characteristics of this sample as the BCC improved hardness or dislocation resistance, FCC enhanced the ductility or elastic modulus.39,40 From the SEM image, it was noticed that solid solution strengthening was equally a factor that enhanced the nano hardness as it was observed in the SEM where full solid solution had completely evolved at 1000°C. The optimum sintering temperature of 1000°C stimulated the full utilization of SPS attributes in sample improvement through full vaporization of inclusions and voids together with strong matrix interface bridging.
41
The elastic modulus of the HEA sintered at 1000°C had the highest value (671.17 ± 50 GPa and 930.12 ± 38 GPa) at darker flakey phase and white phase, respectively. Nano hardness and elastic modulus of white phase were higher because the white phase is rich in β-Ti BCC structure while the darker phase is richer Fe, V and Al FCC structure. Let it be recalled that BCC structure invokes more lattice distortion strengthening than FCC structures.
42
The high elastic modulus recorded in Ti36-Al16-V16-Fe16-Cr16 HEA sintered at 1000°C is about 48% higher than that possessed by Ti-6Al-4V-0.55B developed by Sen et al.,
43
and 623% higher than that possessed by Ti-6Al-4V developed in another study,
44
and points out that this HEA developed via SPS technique is superior to Ti64. Meanwhile, the decrease in nano hardness when the sintering temperature increased to 1100°C may be attributed to the decrease in crystallinity of the alloy as seen in XRD micrograph (Figure 5). Only one crystal peak of FCC phase was present. The disappearance of BCC phase at 1100°C, as said earlier, was due to a eutectic reaction of Fe at 1085°C which led to increased diffusivity of Fe into β-Ti and stimulated the evolution of only FCC phase.
33
The creep resistance of the developed HEA as well as its stiffness are plotted and shown in Figure 7. Percentage creep and stiffness plots of sintered HEA.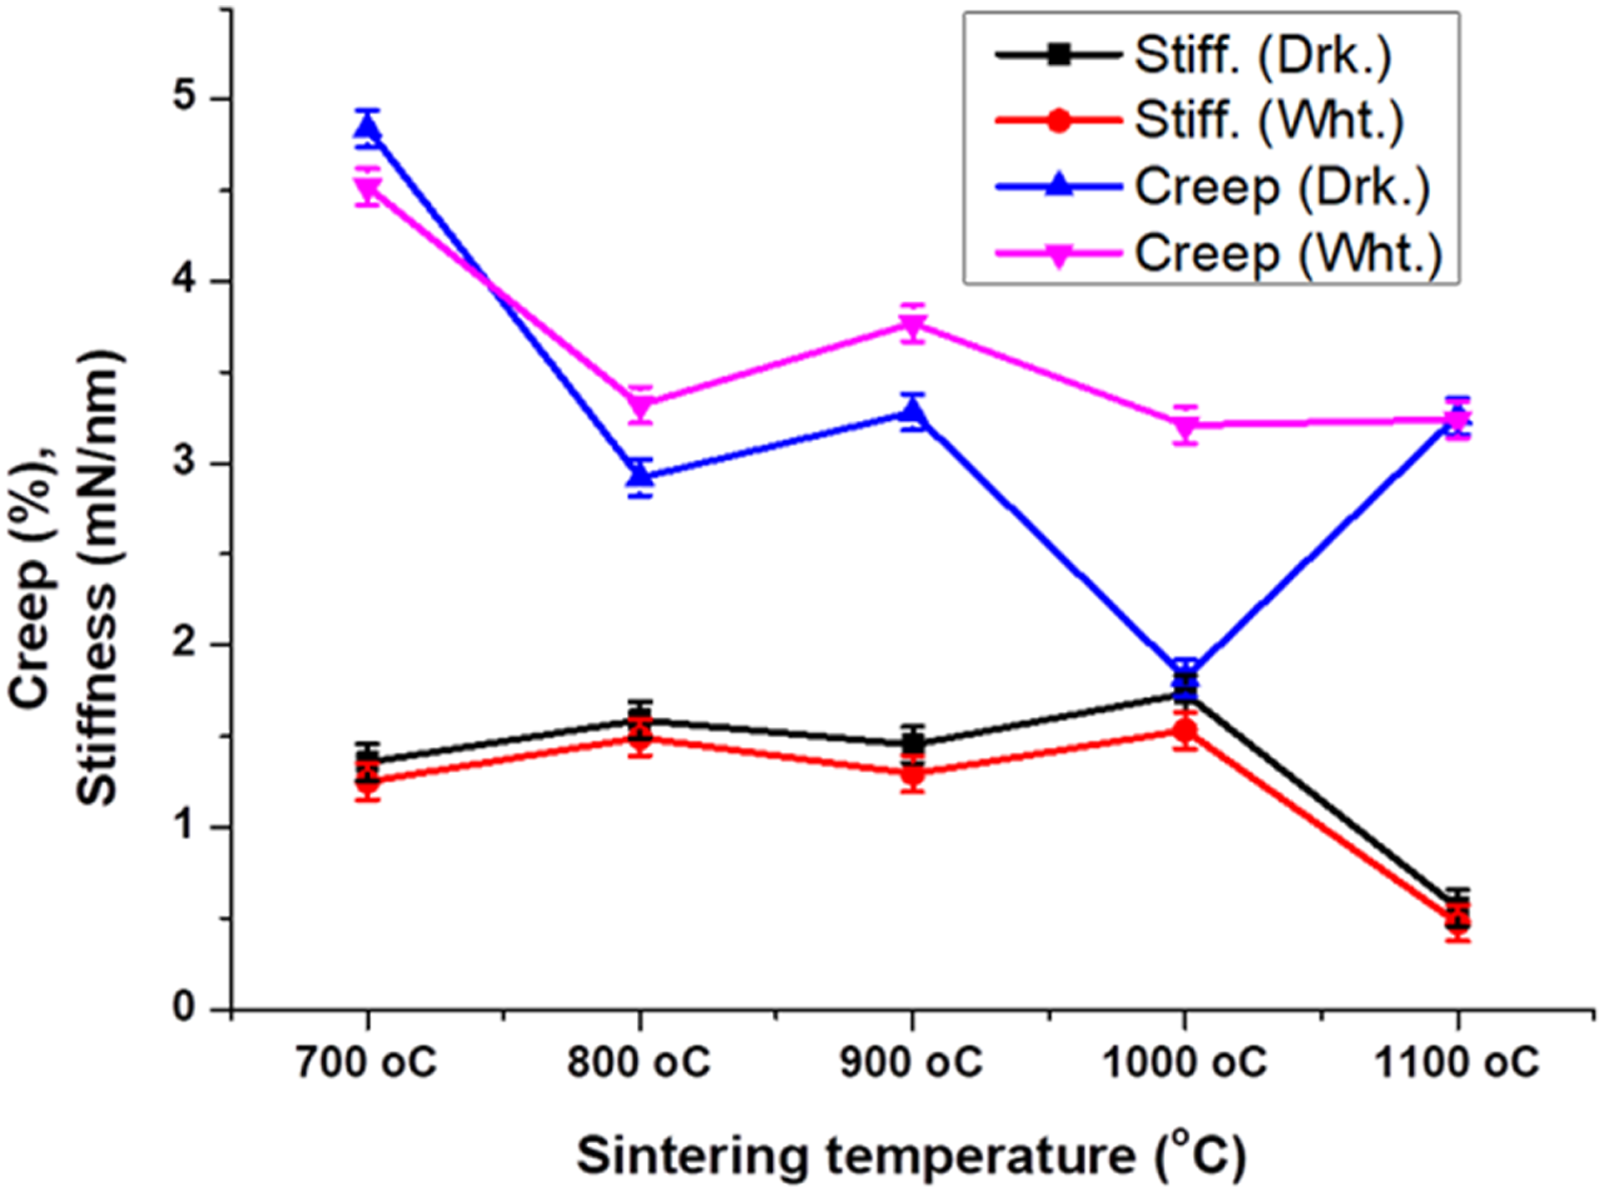
It can be seen that sample sintered at 700°C exhibited highest percentage creep of 4.84% (dark flakey phase) and 4.52% (white phase), while sample sintered at 1000°C displayed the lowest creep of 1.82% (dark flakey phase) and 3.21% (white phase). Sample sintered at the optimum temperature had superior creep and stiffness because material with higher hardness and modulus tend to resist creep more than that with lower hardness since these properties are dependent on the bonding energy, compaction rate, rate of particle migration and thermodynamic stability attained during sintering.35,45 More so, the stiffness was highest on the sample sintered at 1000°C and lowest on the sample sintered at 700°C. Of course stiffness which is the ability to resist bending should tow the same route with hardness of the material. Also observed was that darker flakey phase possessed higher creep resistance and stiffness than white phase. This was because the darker flakey phase is made of FCC crystals richer in γ-Fe, V, Al and Cr while the white BCC phase was composed of predominantly β-Ti. So, the elements that decomposed in the darker phase synergized and improved mechanical properties much more than the white phase which was composed mainly of mono element. Figure 8 shows plots of loading characteristics of the developed HEA. Applied load plotted against penetration depth is shown in Figure 8(a). This is a characteristic curve demonstrating the deformation caused by the applied load during indentation. It can be seen that sample sintered at 700°C (black curve) suffered the highest deformation and that is why it could not return to its original shape when the load was removed. Also, sample sintered at 1000°C (pink curve) suffered the least deformation as the material returned to its original shape after the load was removed. The rate of deformation in sample sintered at 1100°C was higher than that at 1000°C because the strength of the latter is higher than the strength of the former. Loading and penetration characteristics of developed HEA (a) applied load versus penetration depth (b) penetration depth versus penetration time.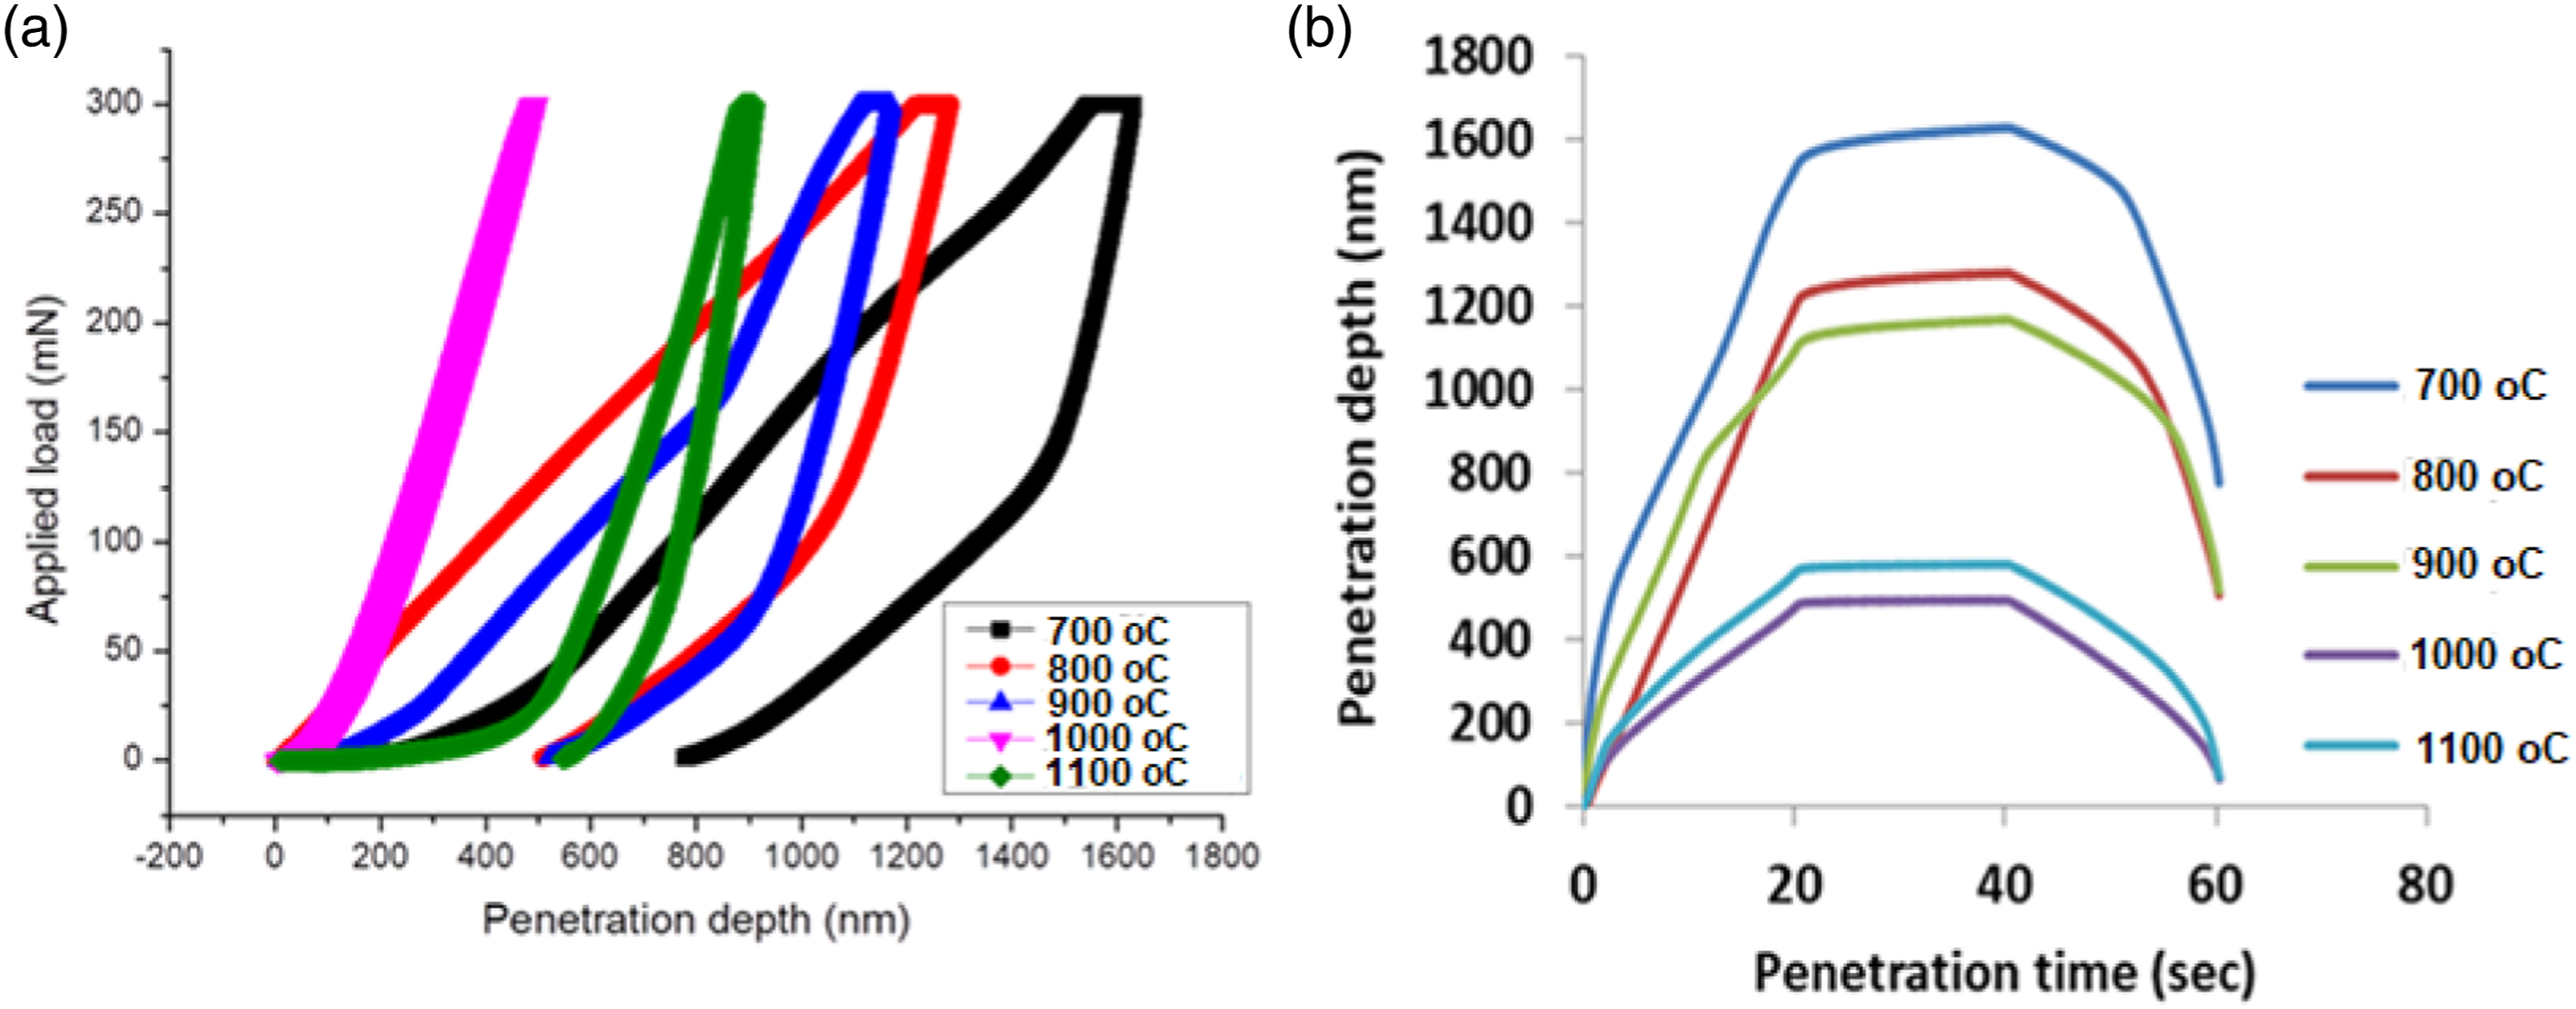
It is the dislocation interlock that limited the deformation of the nano indenter in sample sintered at 1000°C as reported in another study
24
while high dislocation slip field perpetrated high deformation as the indenter was mounted on the sample sintered at 700°C. Another plot shown in Figure 8(b) is penetration depth against penetration time. The penetration depth of the sample sintered at 1000°C was least followed by that sintered at 1100°C. The sample with highest penetration depth was that sintered at 700°C because it had the least resistance to dislocation while that with the highest thermodynamic stability resisted penetration most. Figure 9 shows displacement profile used in ascertaining the deformation mechanism exhibited by the developed HEA. It was reported that deformation of material during nano indentation resulted in pile-up of material or sink-in of material. Plastic deformation can occur in either ways while elastic deformation exhibits sink-in only.46,47 During the loading regime in nano indentation, elastic and plastic deformation occurred; but during unloading regime, only elastic deformation occurred.
48
So, a plot of ratio of final penetration depth (Hf) and maximum penetration depth (Hm) i.e. Hf/Hm (Figure 9(a)) was used to confirm the HEA elasticity behaviour. More so, Figure 9(b) shows the plot of ratio of elastic modulus (E) and nano hardness (Hv) i.e. E/Hv. It was reported that if a large value results from the computation, it is an indication that heavy pile-up of the material took place.
49
Strength characteristics of sintered HEA (a) Plot of final penetration (Hf) versus maximum penetration (Hm) (b) Plot of elastic modulus versus nano hardness.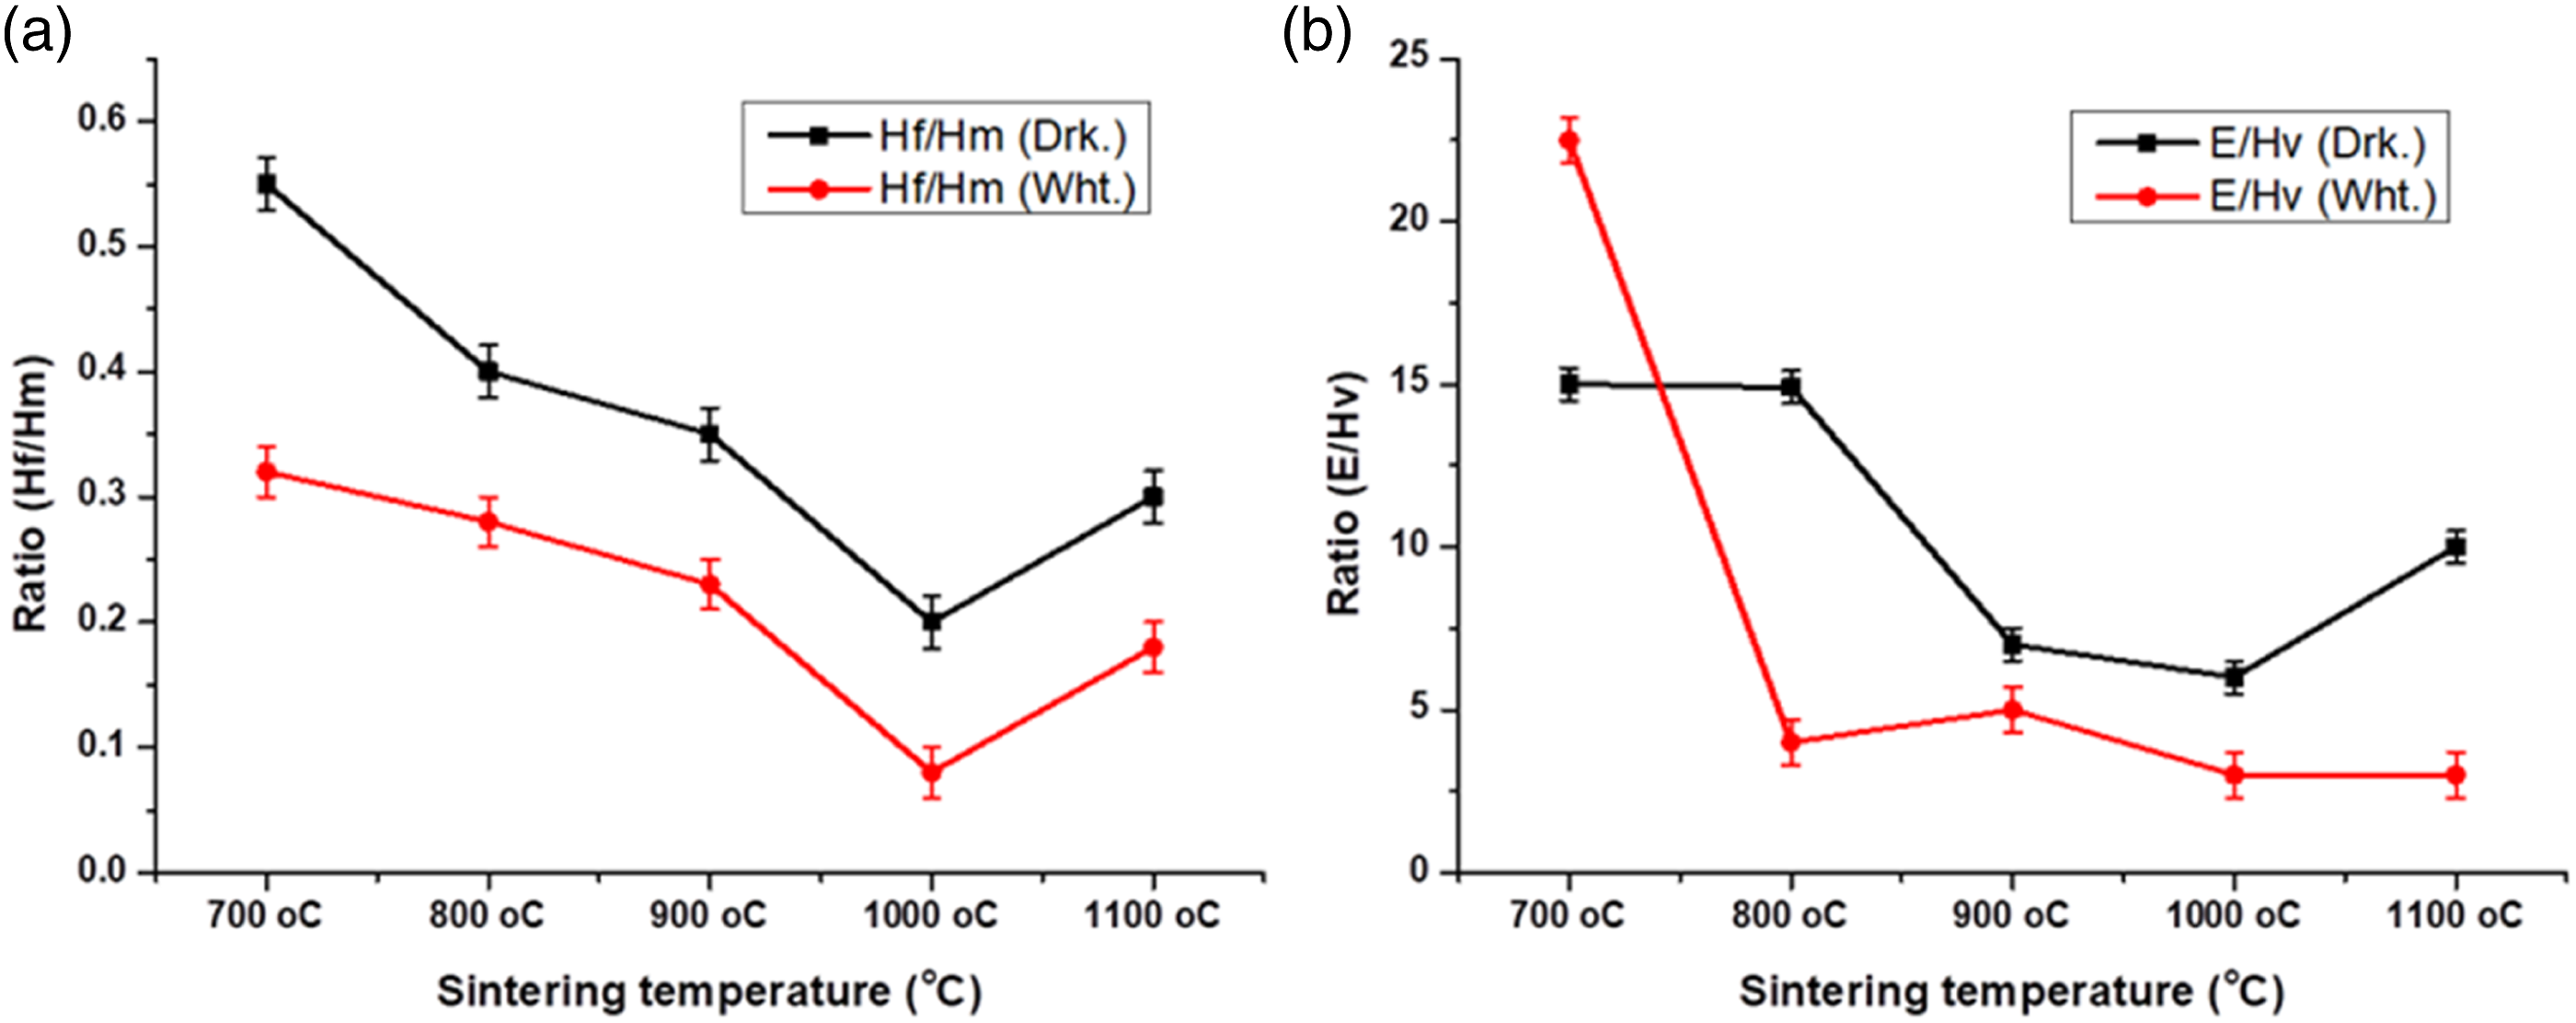
It can be seen that the highest value of Hf/Hm was 0.54 at white phase loading and 0.32 at dark flakey phase loading in sample (700°C). This implies that there was pile-up of material at the contact area of the indenter, though insignificant. For sample with the highest strength and elastic modulus (sample 1000°C), a ratio of 0.19 and 0.08 at white phase and dark phase loading, respectively were obtained. This implies that the pile-up was very little. Therefore, pile-up mechanism was inversely proportional to the material’s strength and modulus. The pile-up was highest in sample sintered at700°C and least in sample sintered at 1000°C according to the following trends: pile-up (1>2>3>5>4); strength (1<2<3<5<4); low value of pile-up infers high strength. Moreover, the ratio of modulus to hardness (Figure 9(b)) showed a similar trend with hf/hm. This corroborates the earlier results that sample sintered at 1000°C possessed superior strength and modulus while that sintered at 700°C possessed the weakest strength and modulus.
Thermal properties
One of the determining factors that confirm superalloy as a candidate for high temperature applications is its thermal stability which some refer to as high temperature oxidation resistance. Interestingly, oxidation resistance is a celebrated repute of HEA which is improved via its ‘cock tail’ effect.4,50 In order to ascertain the high temperature performance of the developed alloy, TGA test was conducted on the samples in an air environment and the result is displayed in Figure 10. It was observed that throughout the heating regime (25 – 1000°C), the increase in weight (oxidation) was very minimal. Sample 700°C increased by 0.6%, sample 800°C increased by 0.48%, sample 900°C increased by 1.20%, sample 1000°C increased by 0.232%, sample 1100°C increased by 0.48%. Therefore, it can be said that thermal stability of all the samples up to temperature of 1000°C was high. Thermal characteristics of sintered HEA.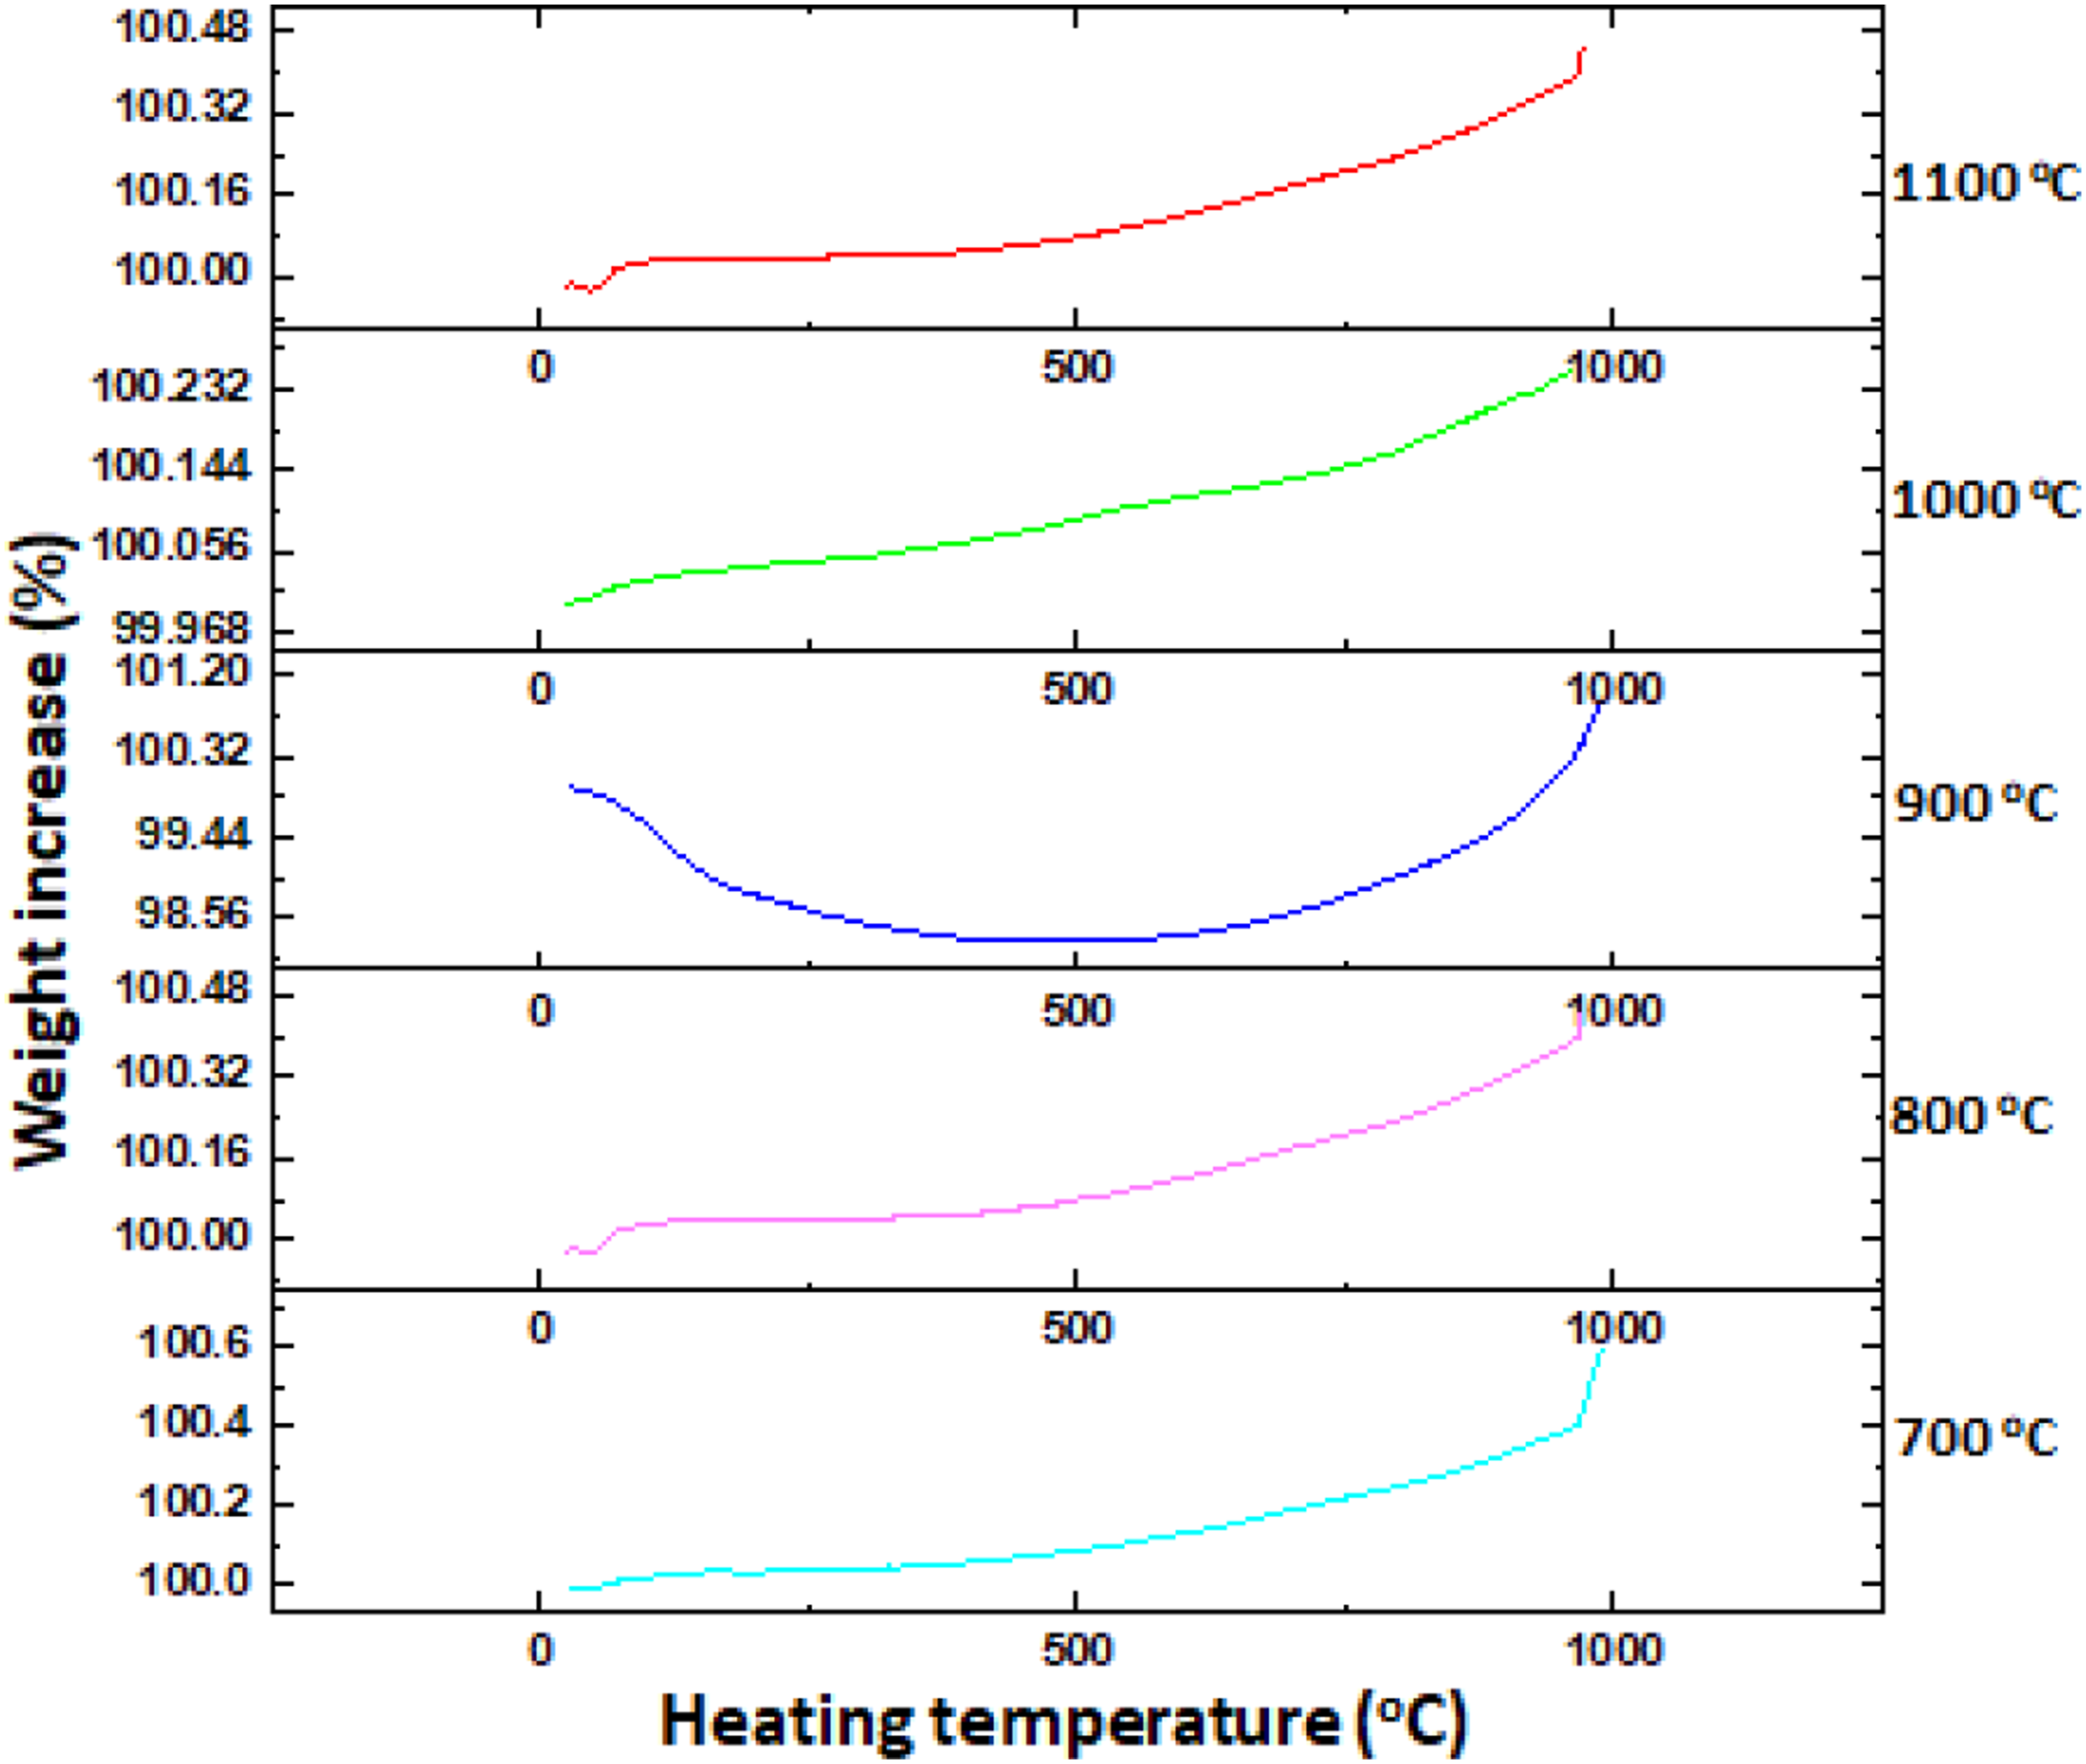
However, sample 1000°C recorded lowest oxidation and hence, highest thermal stability. Sample sintered at 900°C showed a different curve from other ones. There was initial decomposition (downward curve) followed by oxidation (upward curve). This confirms its thermodynamic instability since it is the metastable phase present that decomposed into solid solution before high temperature oxidation took place. The resistance to oxidation of sample sintered at 1000°C is attributed to the fact that it possessed the most refined grains in the microstructure devoid of pores and impurities which helped in the formation of thick protective layer that resisted oxidation just as was reported in another study. 25
Conclusion
The development of Ti36-Al16-V16-Fe16-Cr16 HEA via SPS with varying sintering temperature has been successfully conducted and the following conclusion can be drawn. (i) The optimum SPS temperature was 1000°C which produced a sample with fully homogenized solid solution HEA with refined grains replete of FCC and BCC phases. (ii) The highest elastic modulus of 671.17 ± 50 GPa and 930.12 ± 38 GPa at darker flakey phase and white phase, respectively were recorded on sample sintered at 1000°C. Also, the highest nano hardness of 115183.60 ± 366 MPa and 134582.50 ± 544 MPa at dark flakey phase and white phase, respectively were recorded on the same sample. The improvement in the strength and modulus was attributed to the full evolution of solid solution at the optimum sintering temperature with subsequent solid solution strengthening and thermodynamic stability. An increase of the temperature to 1100°C saw segregation of phases/grain growth, and re-evolution of cavities which diminished the mechanical, microstructural and thermal properties. But sample sintered at 700°C had the least elastic modulus of 546.67 ± 76 GPa and 649.65 ± 64 GPa at darker flakey phase and white phase, respectively; and least nano hardness of 44542.29 ± 223 MPa and 67680.33 ± 334 MPa at darker flakey phase and white phase, respectively. (iii) The pile up behaviour of the samples was inversely proportional to the mechanical strength of the HEA. The highest creep was 4.84% and recorded on sample sintered at 700°C, while the least creep was 1.82% which was recorded on sample sintered at 1000°C. So, the creep resistance increased when the sintering temperature increased up to 1000°C and started decreasing. The stiffness increased as the sintering temperature increased as well. This was attributed to strong bonding energy generated in sample produced at the optimum temperature. (iv) Thermal stability or oxidation resistance of the developed HEA was high, showing highest percentage of oxidation of 0.6% in sample sintered at 700°C and least percentage of oxidation of 0.232% in sample sintered at 1000°C. The thermal stability was attributed to the high thermodynamic stability which induced formation of oxidation protective layer. (v) The excellent microstructural, mechanical and thermal properties obtained in the sample prepared with the optimum parameters indicate that the new HEA can perform much better than the traditional Ti-6Al-4V alloy in aerospace and other high temperature applications.
Footnotes
Acknowledgements
The authors do appreciate and acknowledge Tshwane University of Technology, Pretoria, South Africa and the Africa Centre of Excellence for Sustainable Power and Energy Development (ACE-SPED), University of Nigeria, Nsukka for their supports.
Declaration of conflicting interests
The author(s) declared no potential conflicts of interest with respect to the research, authorship, and/or publication of this article.
Funding
The author(s) disclosed receipt of the following financial support for the research, authorship, and/or publication of this article: The funding was provided by Tshwane University of Technology (Post-Doctoral Research Fellowship Fund, 2021).