
Abstract
Stiffened composite panels have been extensively used thanks to their ability to withstand high load and large deflection. However, their nonlinear behavior and complex damage modes during the post-buckling regime remain challenging and still require research work to improve understanding. In the current study, the buckling and post-buckling responses of a hat-stiffened panel made with carbon fiber reinforced polymer composite material are investigated experimentally and numerically with identifying the damage process and its effect on the panel stiffness. The experimental analysis is achieved by performing quasi-static multi-step compressive loading up to failure with full displacement assessment. A Structural Health Monitoring strategy is also deployed for registering and localizing the Acoustic Emission (AE) activities during each run. Matrix data extracted from the AE waveforms are processed and classified with respect to damage mechanism. Additionally, this research proposes predictive Finite Element Model based on Progressive Failure Analysis. Modified Chang-Chang failure criteria is adopted and implemented using Ansys Usermat subroutine. Numerical and experimental data have been compared and good agreement is demonstrated.
Keywords
Introduction
In the last few years, damage tolerance of composite stiffened panels has received increasing attention as they are widely used in the design of principal structural elements (PSE) like fuselage, rudder, and stabilizer. These structures benefit from the advantages of carbon fiber composite materials and the outstanding mechanical performances of thin-walled structures. 1 In service, composite panels subjected to in-plane compression or shear loading are sensitive to buckling failure.2,3 Unlike a simple plate or beam, for which the buckling stage is, typically, very close to final failure, stiffened panels have considerable post-buckling reserve strength and can continue to bear load even after the onset of the first signs of buckling. Taking advantage of this phase requires a good understanding of the complex non-linear responses and the different failure’s modes involved throughout the buckling process. In this context, Non-Destructive Testing (NDT) has played a key role in identifying damage mechanisms. In several research4-7, the analysis of inspection results emphasized that skin-stiffener separation was the most common damage mode in post-buckling regime while the final failure is often the result of stringer collapse. Although effective, conventional NDT techniques provide limited results compared to new Structural Health Monitoring techniques when continuous and real time information are required on structural integrity.8,9 Hence, knowing the damage location and the corresponding loading can be an asset to identify vulnerable spots and enhance panel design. Among the techniques being investigated, Acoustic Emission (AE) has the specificity of being very sensitive to stress waves released from fracture mechanisms. This attribute makes it suitable for monitoring composite structure as it can achieve valuable insights by detecting damage initiation and growth. Another interesting feature of the AE technique is that by using multiple sensors, it is possible to achieve planar localization of the damage source. The most common approaches for AE localization are based on the calculation of Time of Arrival (ToA) and the velocity of the propagating stress wave, which is related to the composite geometry, laminate configurations, and the nature of material components. Wu et al. 10 have used a planar localization algorithm to isolate signals related to delamination initiation and evolution from an inserted flaw in woven carbon fiber reinforced polymer (CFRP) material. Crivelli et al. 11 have successfully located fatigue matrix cracking and delamination released from a notched and impacted carbon fibre panel. A review of the advantages and disadvantages of different localization approaches is provided by Kundu. 12
Additional to monitoring techniques, damage tolerance of complex composite structures relies on developing analytic and numerical tools that can predict damage development in the design stage.
With high computational capability, Finite Element Modeling (FEM) has become a powerful tool capable of handling large-scale structures and predicting their in-service behavior. 13 Several attempts have been made to conveniently model fracture and damage scenarios in composite structures in the last few decades. However, the wide variety of micro-failure mechanisms and their interaction make the adoption of universal approach much more complex. 14
Considered as the primary cause behind failure under compression loading, interlaminar delamination could be efficiently characterized by measuring the material toughness for different fracture modes. 15 In this respect, the fracture mechanics-based approaches namely Virtual Crack Closure Technique (VCCT) and Cohesive Zone Model (CZM) are the most widely used techniques. Indeed, as specified in Ref. 16, VCCT can explicitly determine the energy-release rate and the fracture-mode separation in a predefined crack tip. The separation between two layers is expected when the calculated total energy-release rate exceeds the measured interlaminar fracture toughness. VCCT is generally used to study the growth stage of existing defects where the propagation path is well known. Krueger 17 demonstrated how using VCCT along the flange it is possible to identify the fracture mode in a stiffened panel subjected to shear load.
On the other hand, CZM can overcome some limitations related to VCCT by predicting both the initiation and the propagation of damage. CZM is based on a presumption of a softening zone ahead of a sharp crack tip in the material. Within this zone, cohesive elements follow a constitutive response defined in terms of a traction-separation law which relates the separation displacement between the top and bottom faces. Once the maximum stress criterion is exceeded, the crack initiates then the propagation is controlled by another propagation criterion which ensures that the correct amount of energy is absorbed by each element. 18 CZM technique has been commonly used in modeling interface strength like delamination,19,20 adhesive bonding21,22 and more specifically skin-stringer separation.23,24
In general, failure in a composite structure is the combination of different damage mechanisms, where the crack paths are not always identifiable, hence more versatile numerical methods have been developed. The extended finite element has allowed to model crack initiation and propagation along arbitrary paths. 25 The smeared crack method and more recently the phase field model has been employed for the modelling of various problems by diffusing surface crack into the volume,26,27 nerveless the computational cost of these techniques restrict their application on microscopic and mesoscopic length scales problems. 28 The stress-based criterion approaches instead have attracted much attention. 29 Indeed, progressive failure models can provide answers to how and where damages initiate and accumulate in a composite laminate by verifying a set of analytic criteria specific to each damage mechanisms. Significant evolvement have been made since the first empirical models30–34. Currently phenomenological and interactive failure criteria are being developed considering the effect of out-of-plane stresses and material non-linearity with better assessment of the failure envelopes and fracture plane35–37. Invoked for each Gaussian integration points, if the criteria is fulfilled, the mechanical properties are reduced according to a degradation law which report the loss of load-carrying capacity in a particular direction. Specific degradation factors are attributed to each failure mechanism, however there is no consensus on their values and are likely defined to correlate experimental results. Sepe et al. 38 used Hashin’s criteria to predict the buckling response of two stringers panel subjected to impact damage. Shroff et al. 39 proposed a combination of the Hashin, and Puck failure criteria for modelling composite panels under compression. Bisagni 40 assessed the damage tolerance of a hat-stiffened composite panel by applying LaRC03 failure criteria and cohesive material model. Kolanu et al. 24 studied the collapse behavior of the single blade stiffened composite with and without embedded debonding defects by applying 3D Hashin criteria’s.
In this study, the main objective is to evaluate damage development during the post-buckling regime in two-hat stringer CFRP panel subjected to multi-step compression loading and correlate it to damage mechanisms and stiffness degradation. To achieve this purpose, the buckling deformation and displacement are measured using a Digital Image Correlation (DIC) system and eight strain gages positioned at different locations on the skin and stringer. Simultaneously, continuous monitoring strategy by AE technique was applied permitting to detect the damage onset and growth for each loading step. The deploying of a planar localization strategy aims to determine the AE source coordinate and therefore build a map of damage location versus applied load. AE signals are, therefore, clustered using an unsupervised pattern recognition technique and correlated to principal failure mechanisms. In the second part of this research work, a 3D FEM is developed using progressive failure analysis (PFA). The model considers simultaneously matrix cracking, fiber breakage, shearing failure, and interlaminar delamination which allowed to follow the damage sequence and identify critical zones. The validation of this model is achieved by comparing numerical results to experimental data.
Experimental approach
Carbon fiber reinforced polymer stiffened panel design
The stiffened composite panel used in this paper is a typical fuselage structure composed of two hat-stringers made from unidirectional carbon/epoxy prepregs of type Cytec 977-2/HTS which was manufactured by our industrial partner according to typical aerospace requirements. The nominal dimensions of the stiffened panel are 660 mm (length) by 382 mm (width). The structure has 12-ply skin with a symmetric stacking sequence of [90/45/-45/0/-45/45]
s
and a thickness of 1.5 mm. The stringers are made up of 10 plies with the layup [90/45/0/-45/0]
s
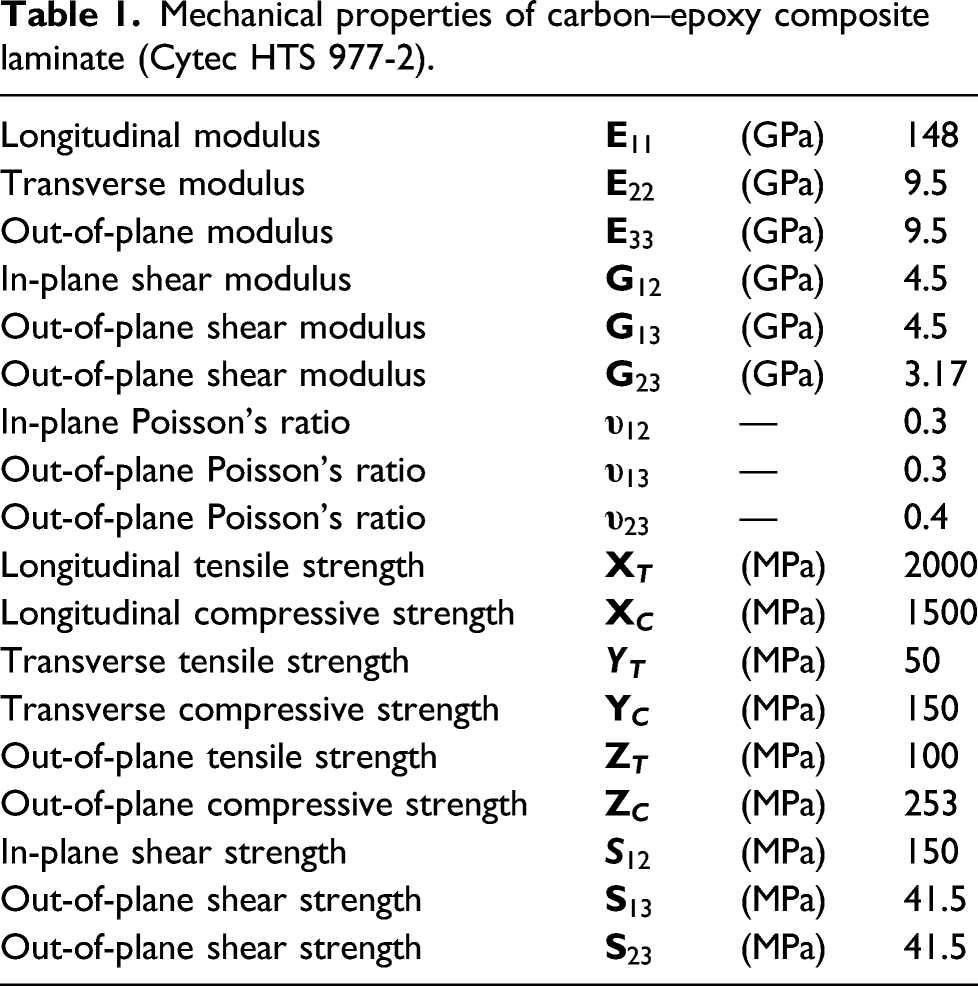
. The details of the panel design and dimensions are illustrated in Figure 1(a). Both sides of the panel are potted in two resin blocks (Figure 1(b)) to ensure clamped boundary conditions and guarantee uniform load distribution during the compression tests. The resin blocks have 40 mm depth, which reduces the effective length of the specimens to 580 mm. Material property parameters of the quasi-isotropic unidirectional lamina are listed in Table 1. (a) Geometries and dimensions of two-hat stringers panel, and (b) panel fixation. Mechanical properties of carbon–epoxy composite laminate (Cytec HTS 977-2).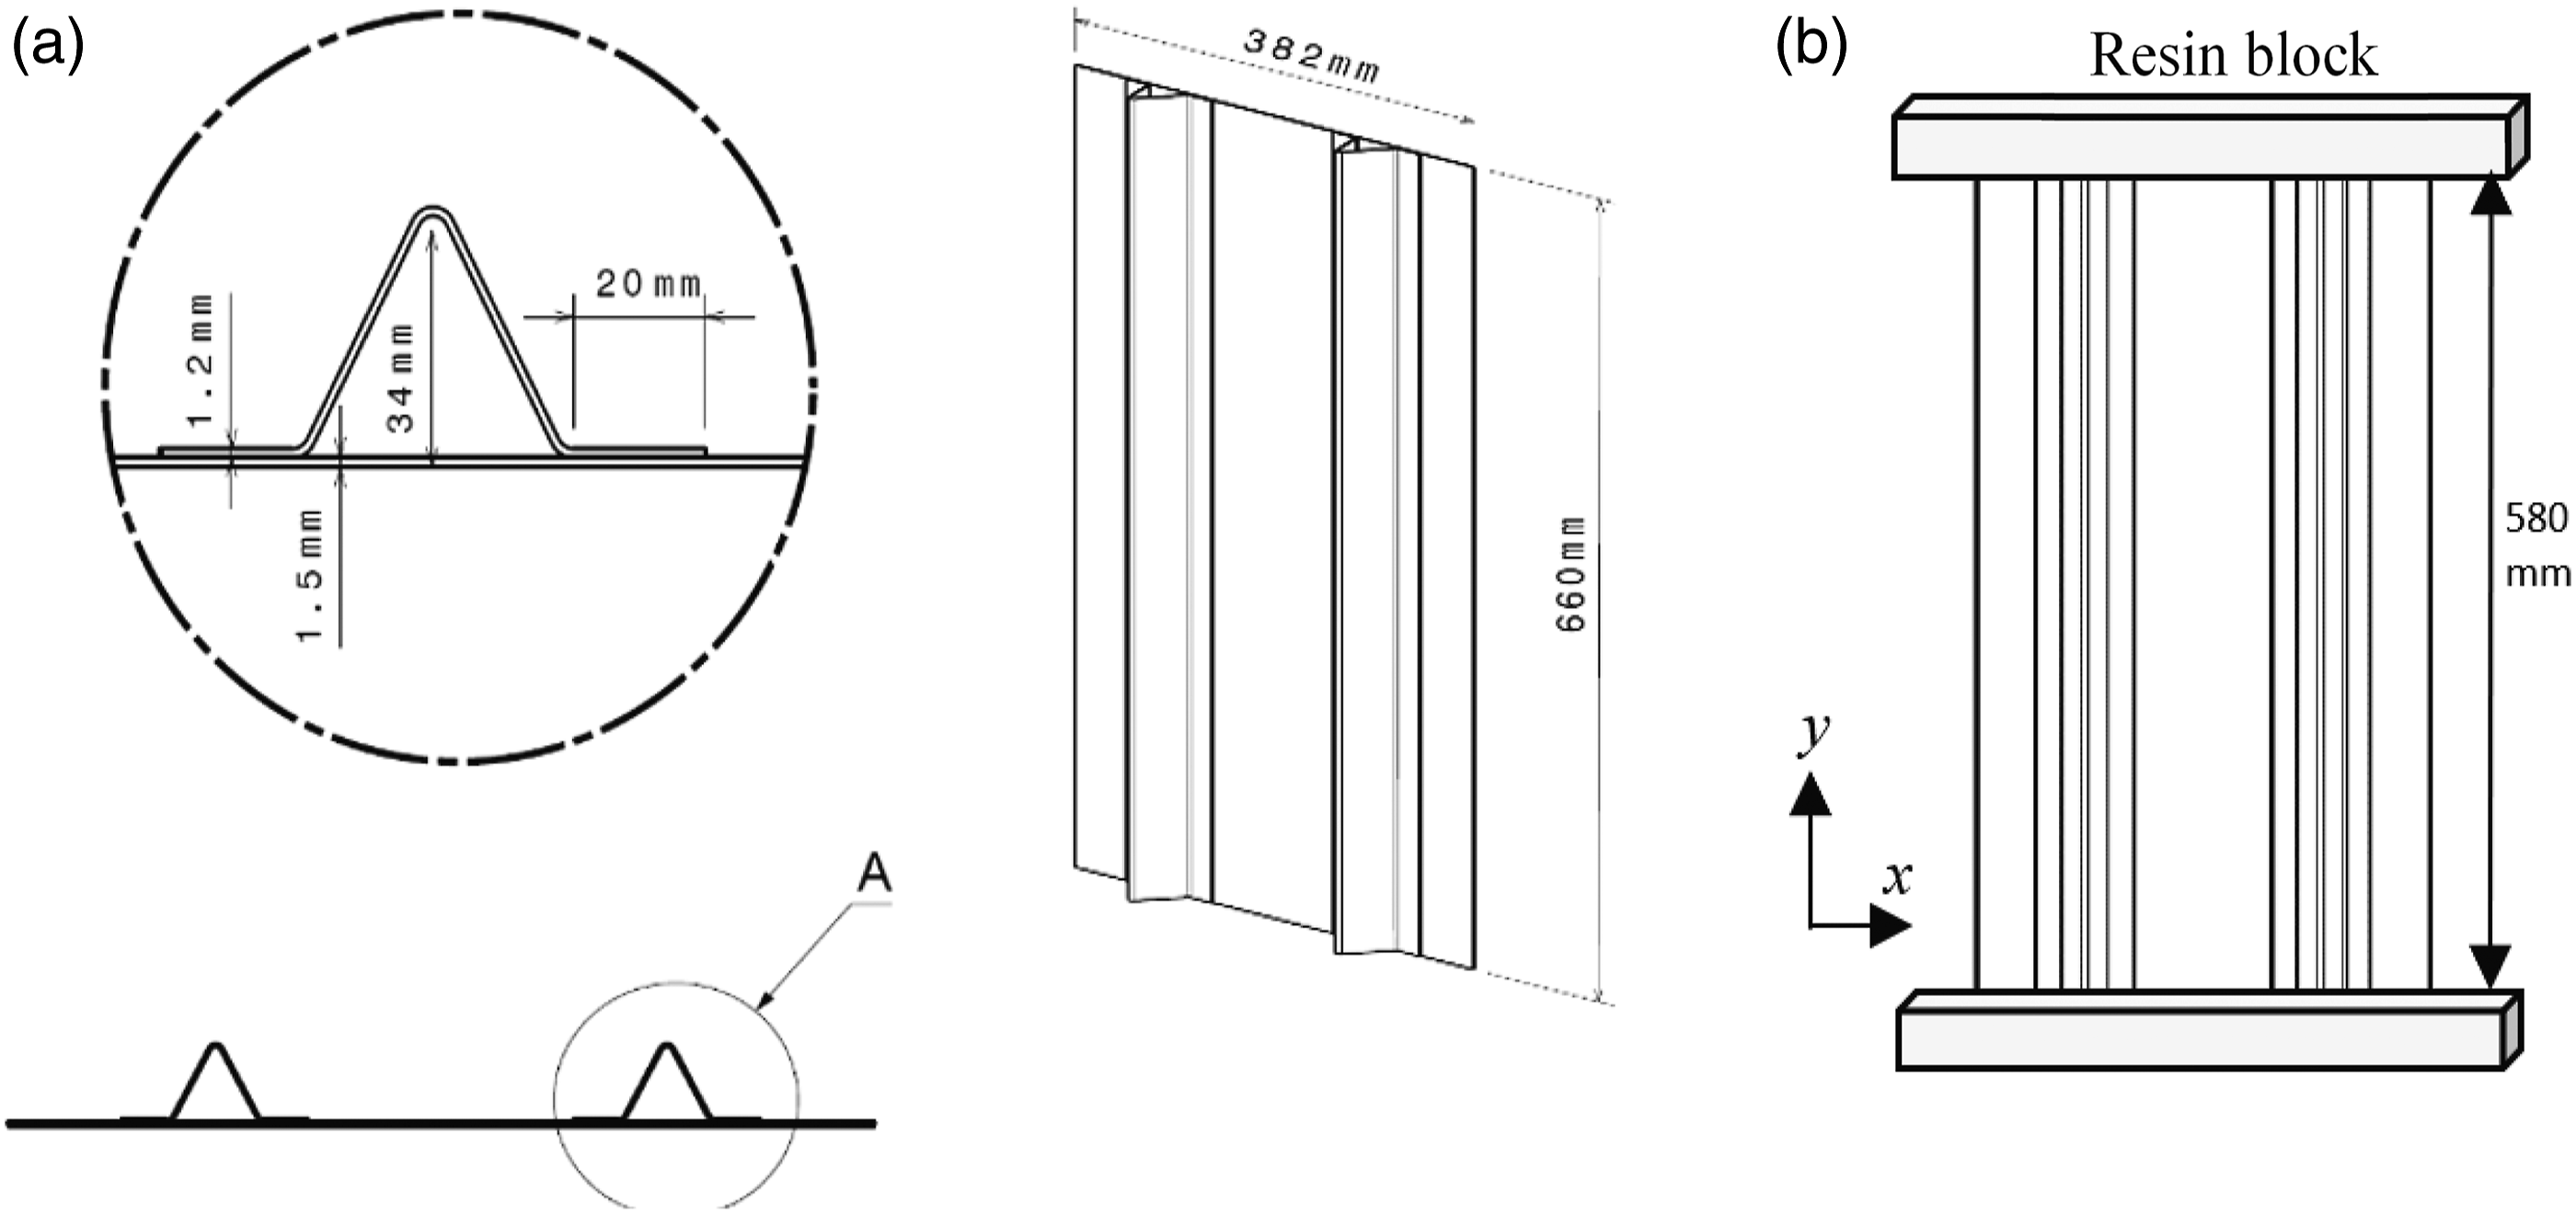
Experimental procedure
The experimental characterization of the panel response has been achieved on a hydraulic test machine (MTS-458) equipped with a 500 kN cell sensor (Figure 2). The tests have been conducted in eight successive runs where the crosshead displacement was fixed at 1 mm/min. The structure is first loaded up to 40 kN then released, thereafter the force is incremented by 20 kN per run until final failure. The displacement along the longitudinal axis of the panel is measured by a laser displacement device. The specimen is instrumented with eight uniaxial strain gages arranged on the skin, the flange, and the stringer web. Each strain gage is connected to an acquisition system through a quarter-bridge linkage. The details of the strain gauge positions are given in Figure 3(a). Experimental setup. (a) Strain gages and AE sensors positions, and (b) speckle pattern application.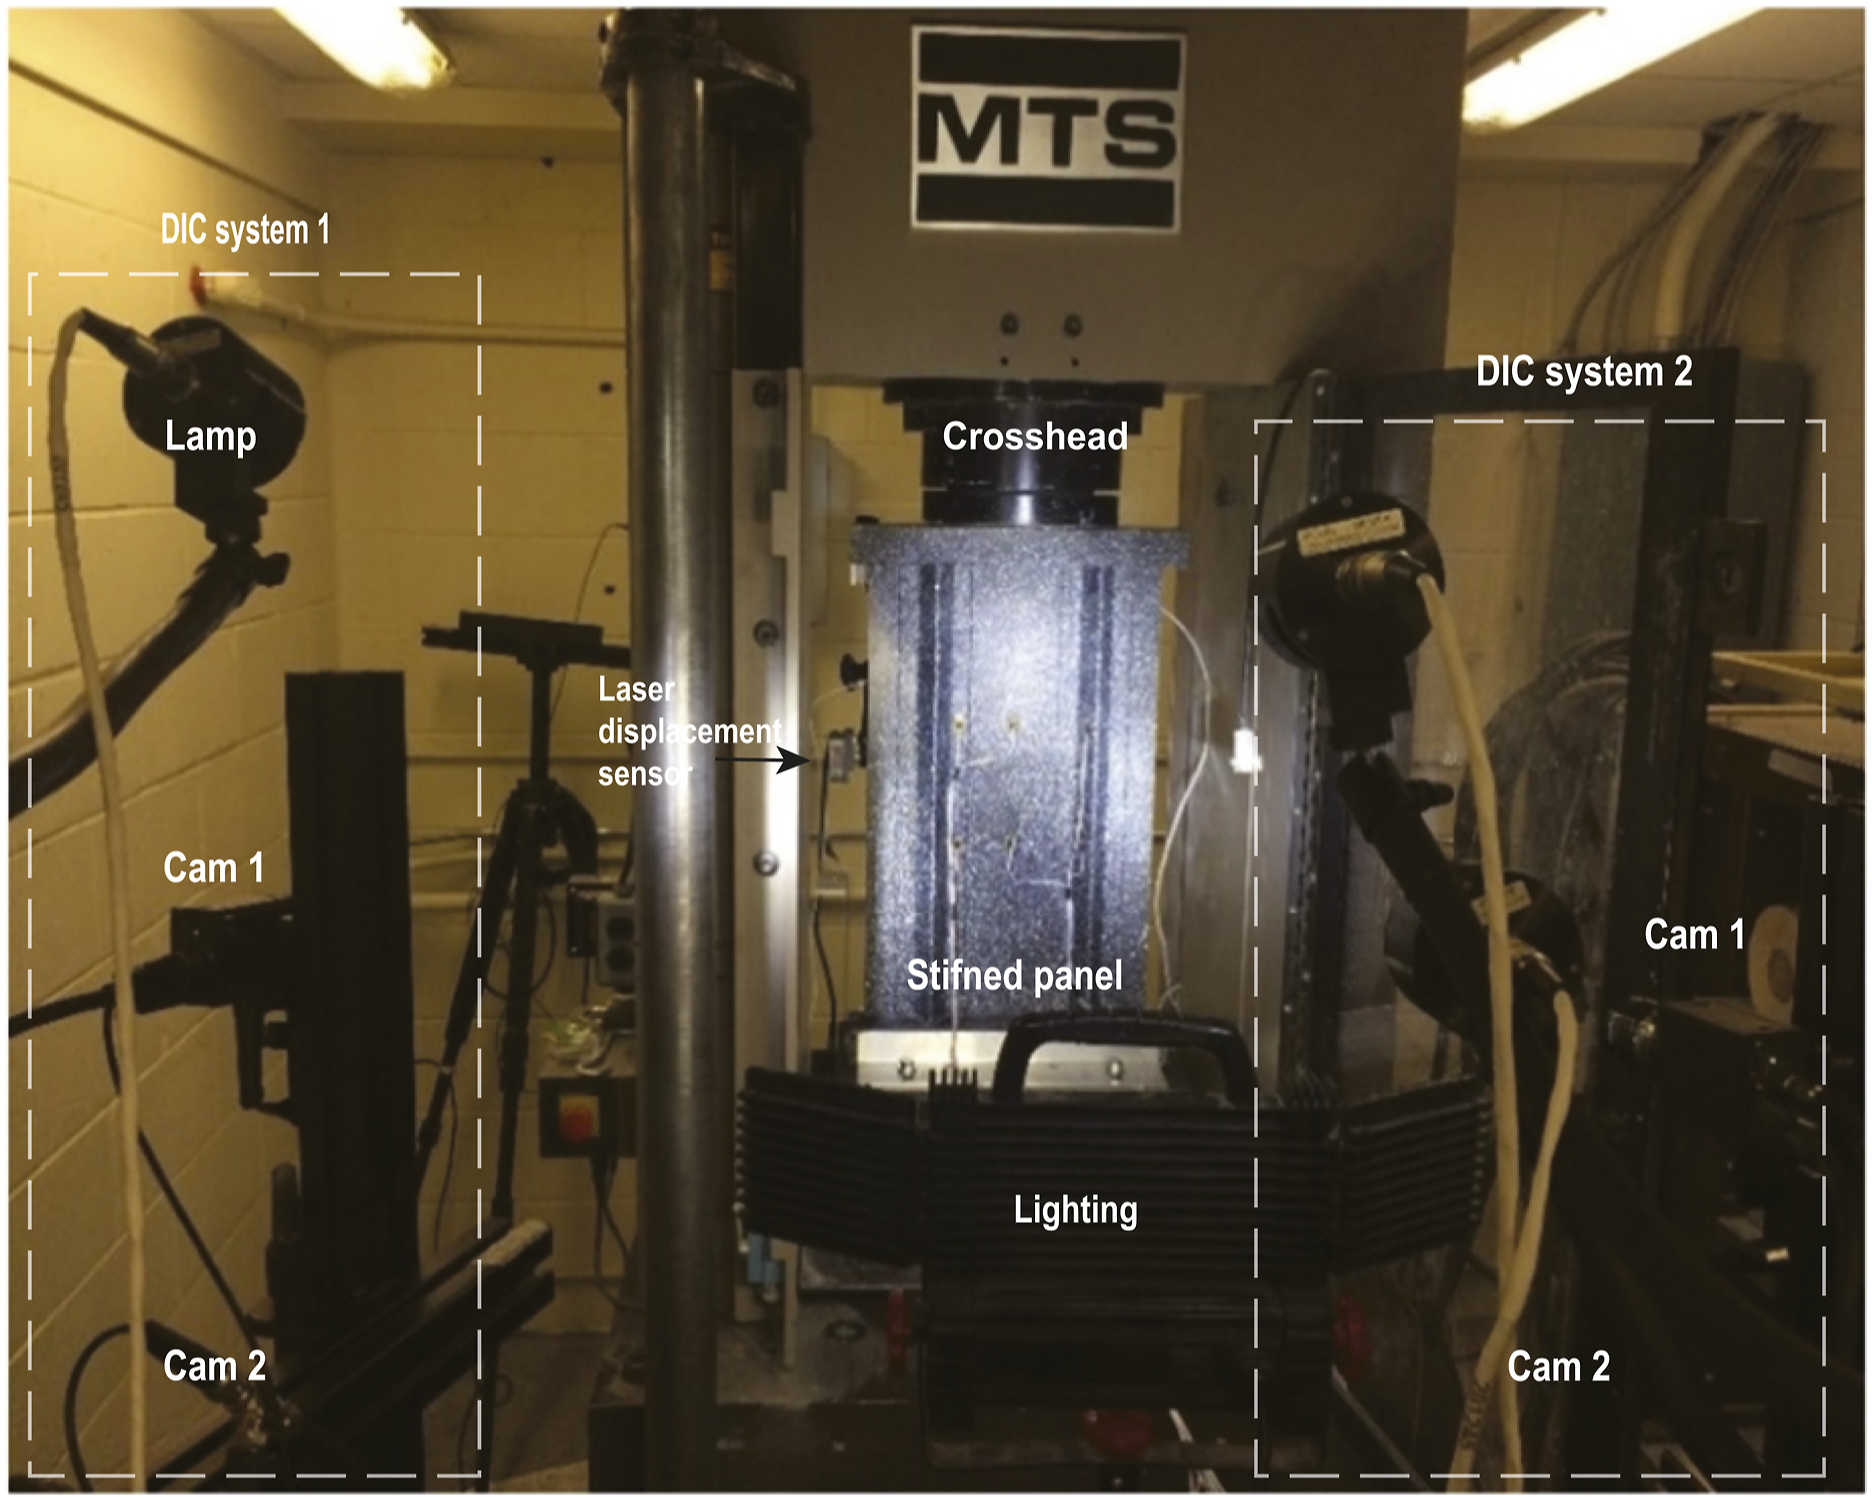
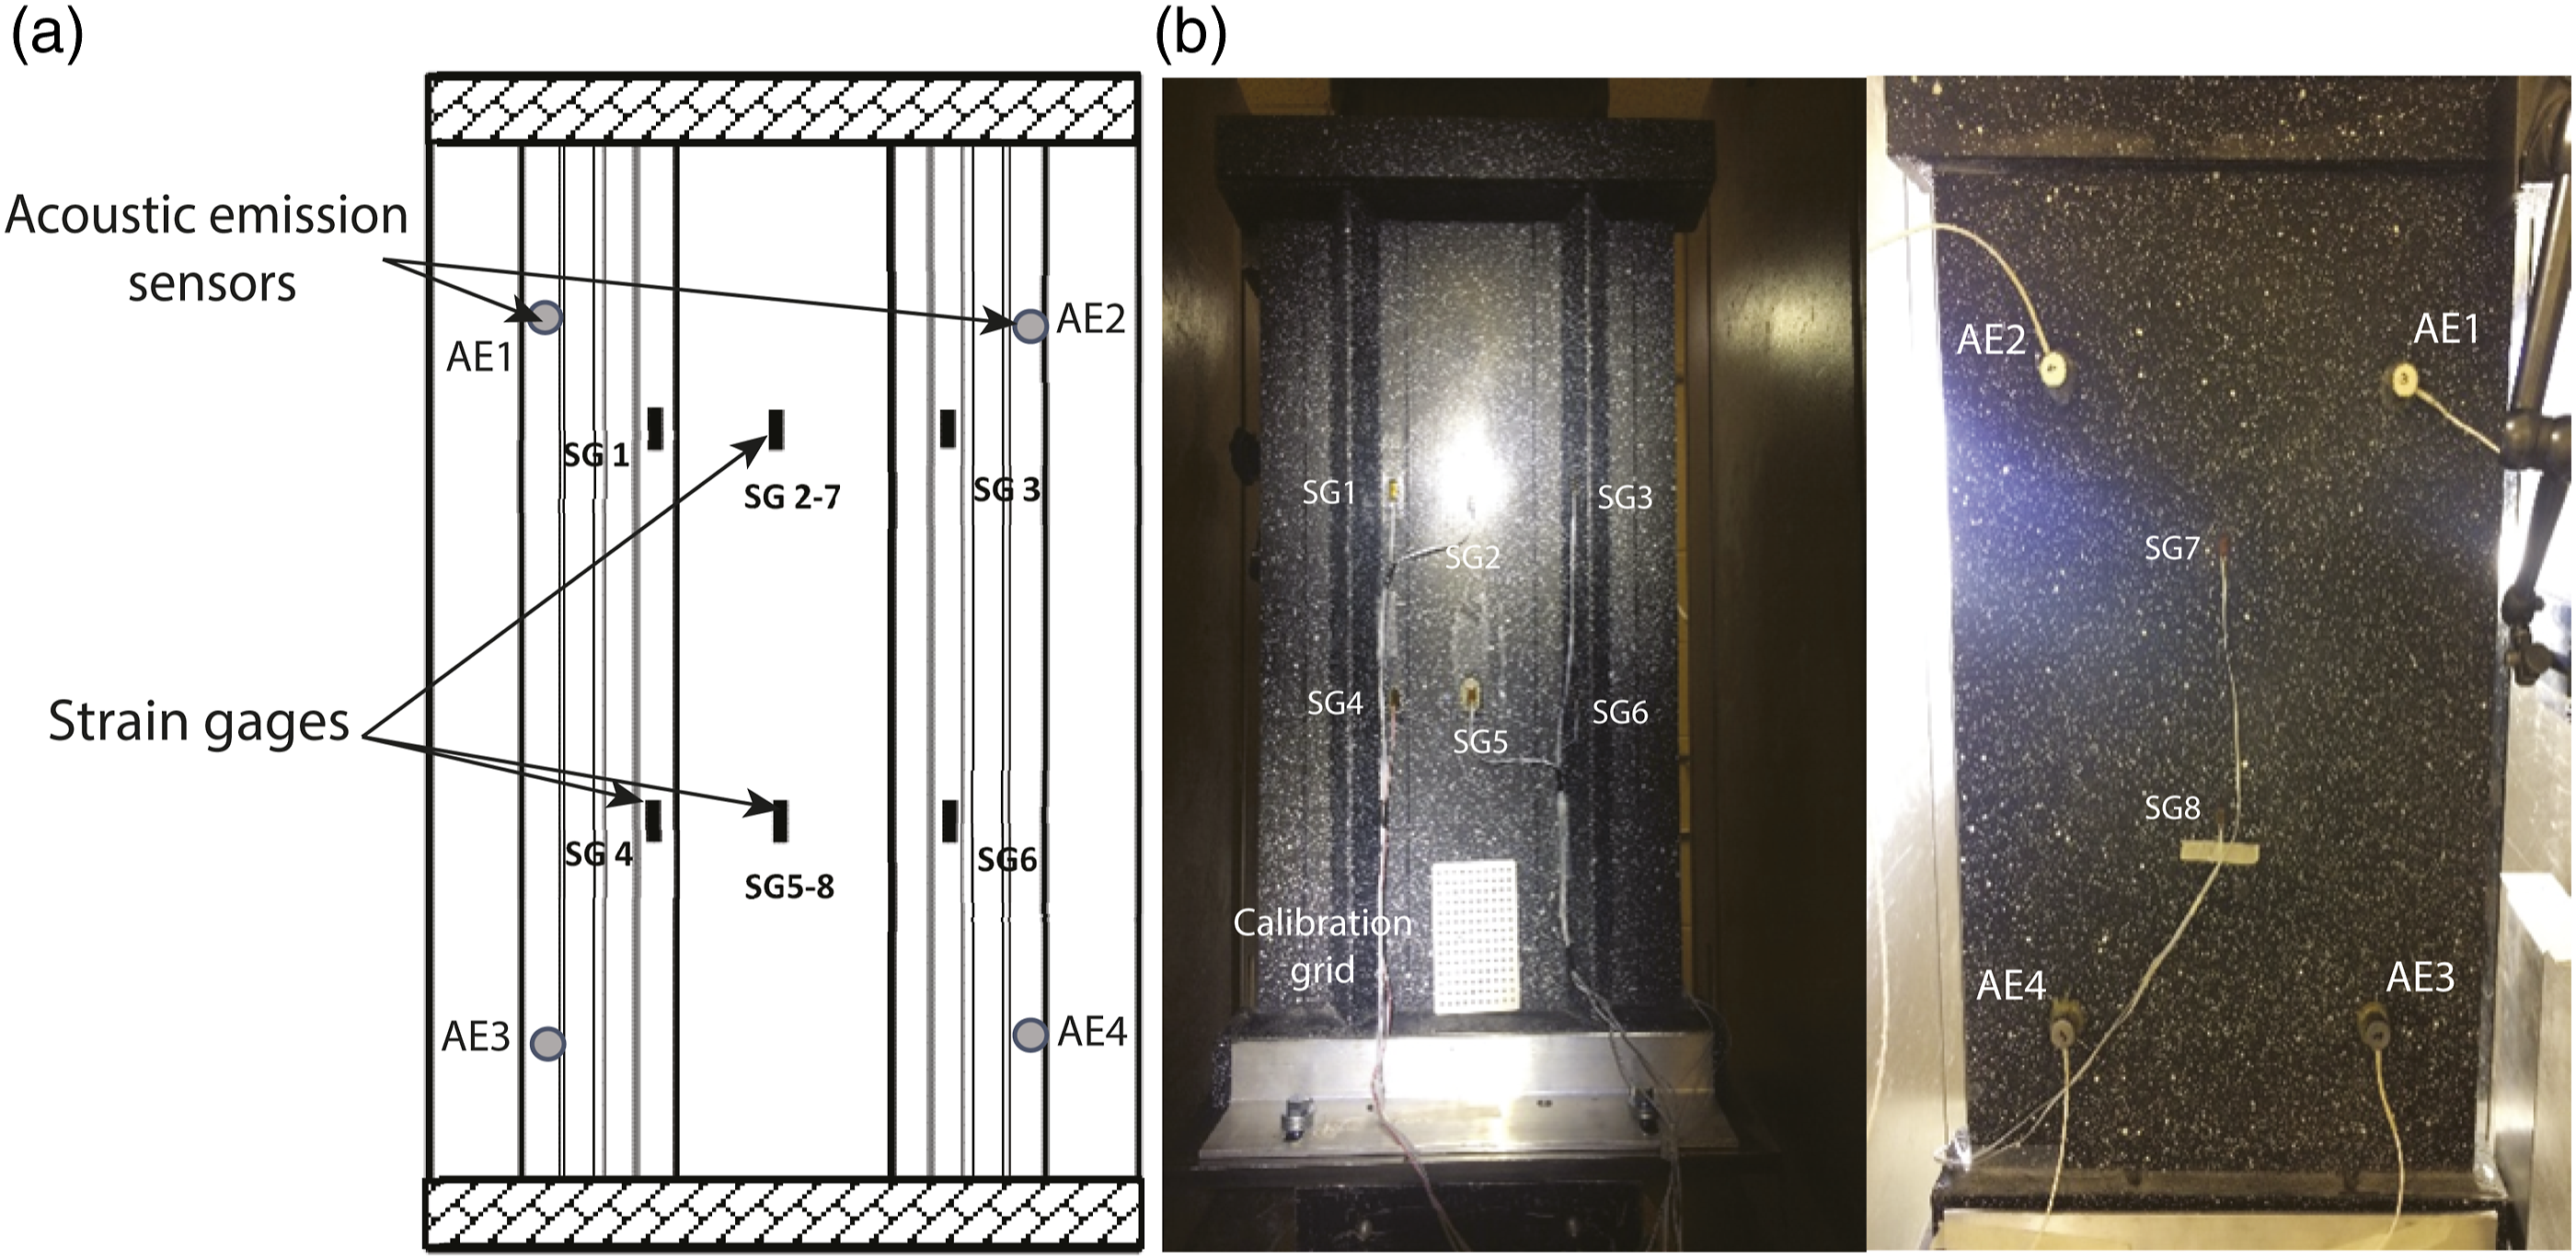
The shape of the panel during the post-buckling regime is measured by non-contact three-dimensional digital image system VIC-3D from Correlated Solutions. The DIC requires the application of a random speckle pattern on the surface of interest so that the system can track the changes in grayscale values between successive images during the loading process. Hence, a speckle pattern was applied over the front side of the panel, as is shown in Figure 3(b). Due to the sharp geometry of the stringers, the measurement of both sides of the webs requires the deployment of four cameras. Each pair system is calibrated separately based on a series of images of a grid with a known line spacing. The merging process consists in calculating the transformation between the two coordinate systems then applying this transformation to the alternate view. Thus, displacement data from the second system are transformed into the first coordinate system. As recommended in Ref. 41 merging multiple-view requires the presence of at least 5%–10% of shared image (overlaying areas) between the two systems results. Following this process, it was possible to rebuild the full displacement field of the panel. The experimental setup of the VIC-3D with respect to the test panel and the loading machine is shown in Figure 2.
The AE monitoring is performed using a Mistras-DiSP (Physical Acoustics) equipped with four piezoelectric sensors attached at the back corners of the panel with hot melt adhesive. The piezoelectric transducers have large band response (50–1000 kHz) with a maximum sensitivity between 125 kHz and 450 kHz. Each sensor is connected to a preamplifier that transmits analogic signals to an eight-channel acquisition and treatment unit μDISP, with a gain set at 40 dB and a noise threshold of 45 dB. The arrangement and the distance between sensors are illustrated in Figure 3(b). The position of the AE event is determined using 2D anisotropic planar location mode of AEwin software. 42 This algorithm evaluates the difference in the time of arrival (ToA) for the traveling wave between the different sensor positions compared with the first hit sensor. Multiple regression analyses are performed to provide the location that best fit all available data.
The data acquisition system is calibrated by conducting preliminary guided wave velocity measurements according to the pencil lead break procedure defined by ASTM E976 and previous works using the same localization procedure. 10 As a result, longitudinal and transverse velocities were fixed at 5200 m/s and 5000 m/s, respectively.
Experimental results
Post-buckling response
The experimental results of the load versus displacement curves obtained from the eight successive runs are reported in Figure 4. After a linear behavior in the first run, the panel buckles in the second one at around 43 kN into seven half waves located in the main bay and along each edge. Despite the relatively low buckling force, the structure offers a large loading range without significant loss of stiffness as it is shown by the responses during the next runs, which demonstrates its excellent post-buckling performance. The final collapse occurred at the value of 178 kN, where the panel displayed a first load drop before failing catastrophically. The response of the last run (curve in black) is drawn in conjunction with the measured out-of-plane displacement patterns extracted for different load levels. Load-displacement responses.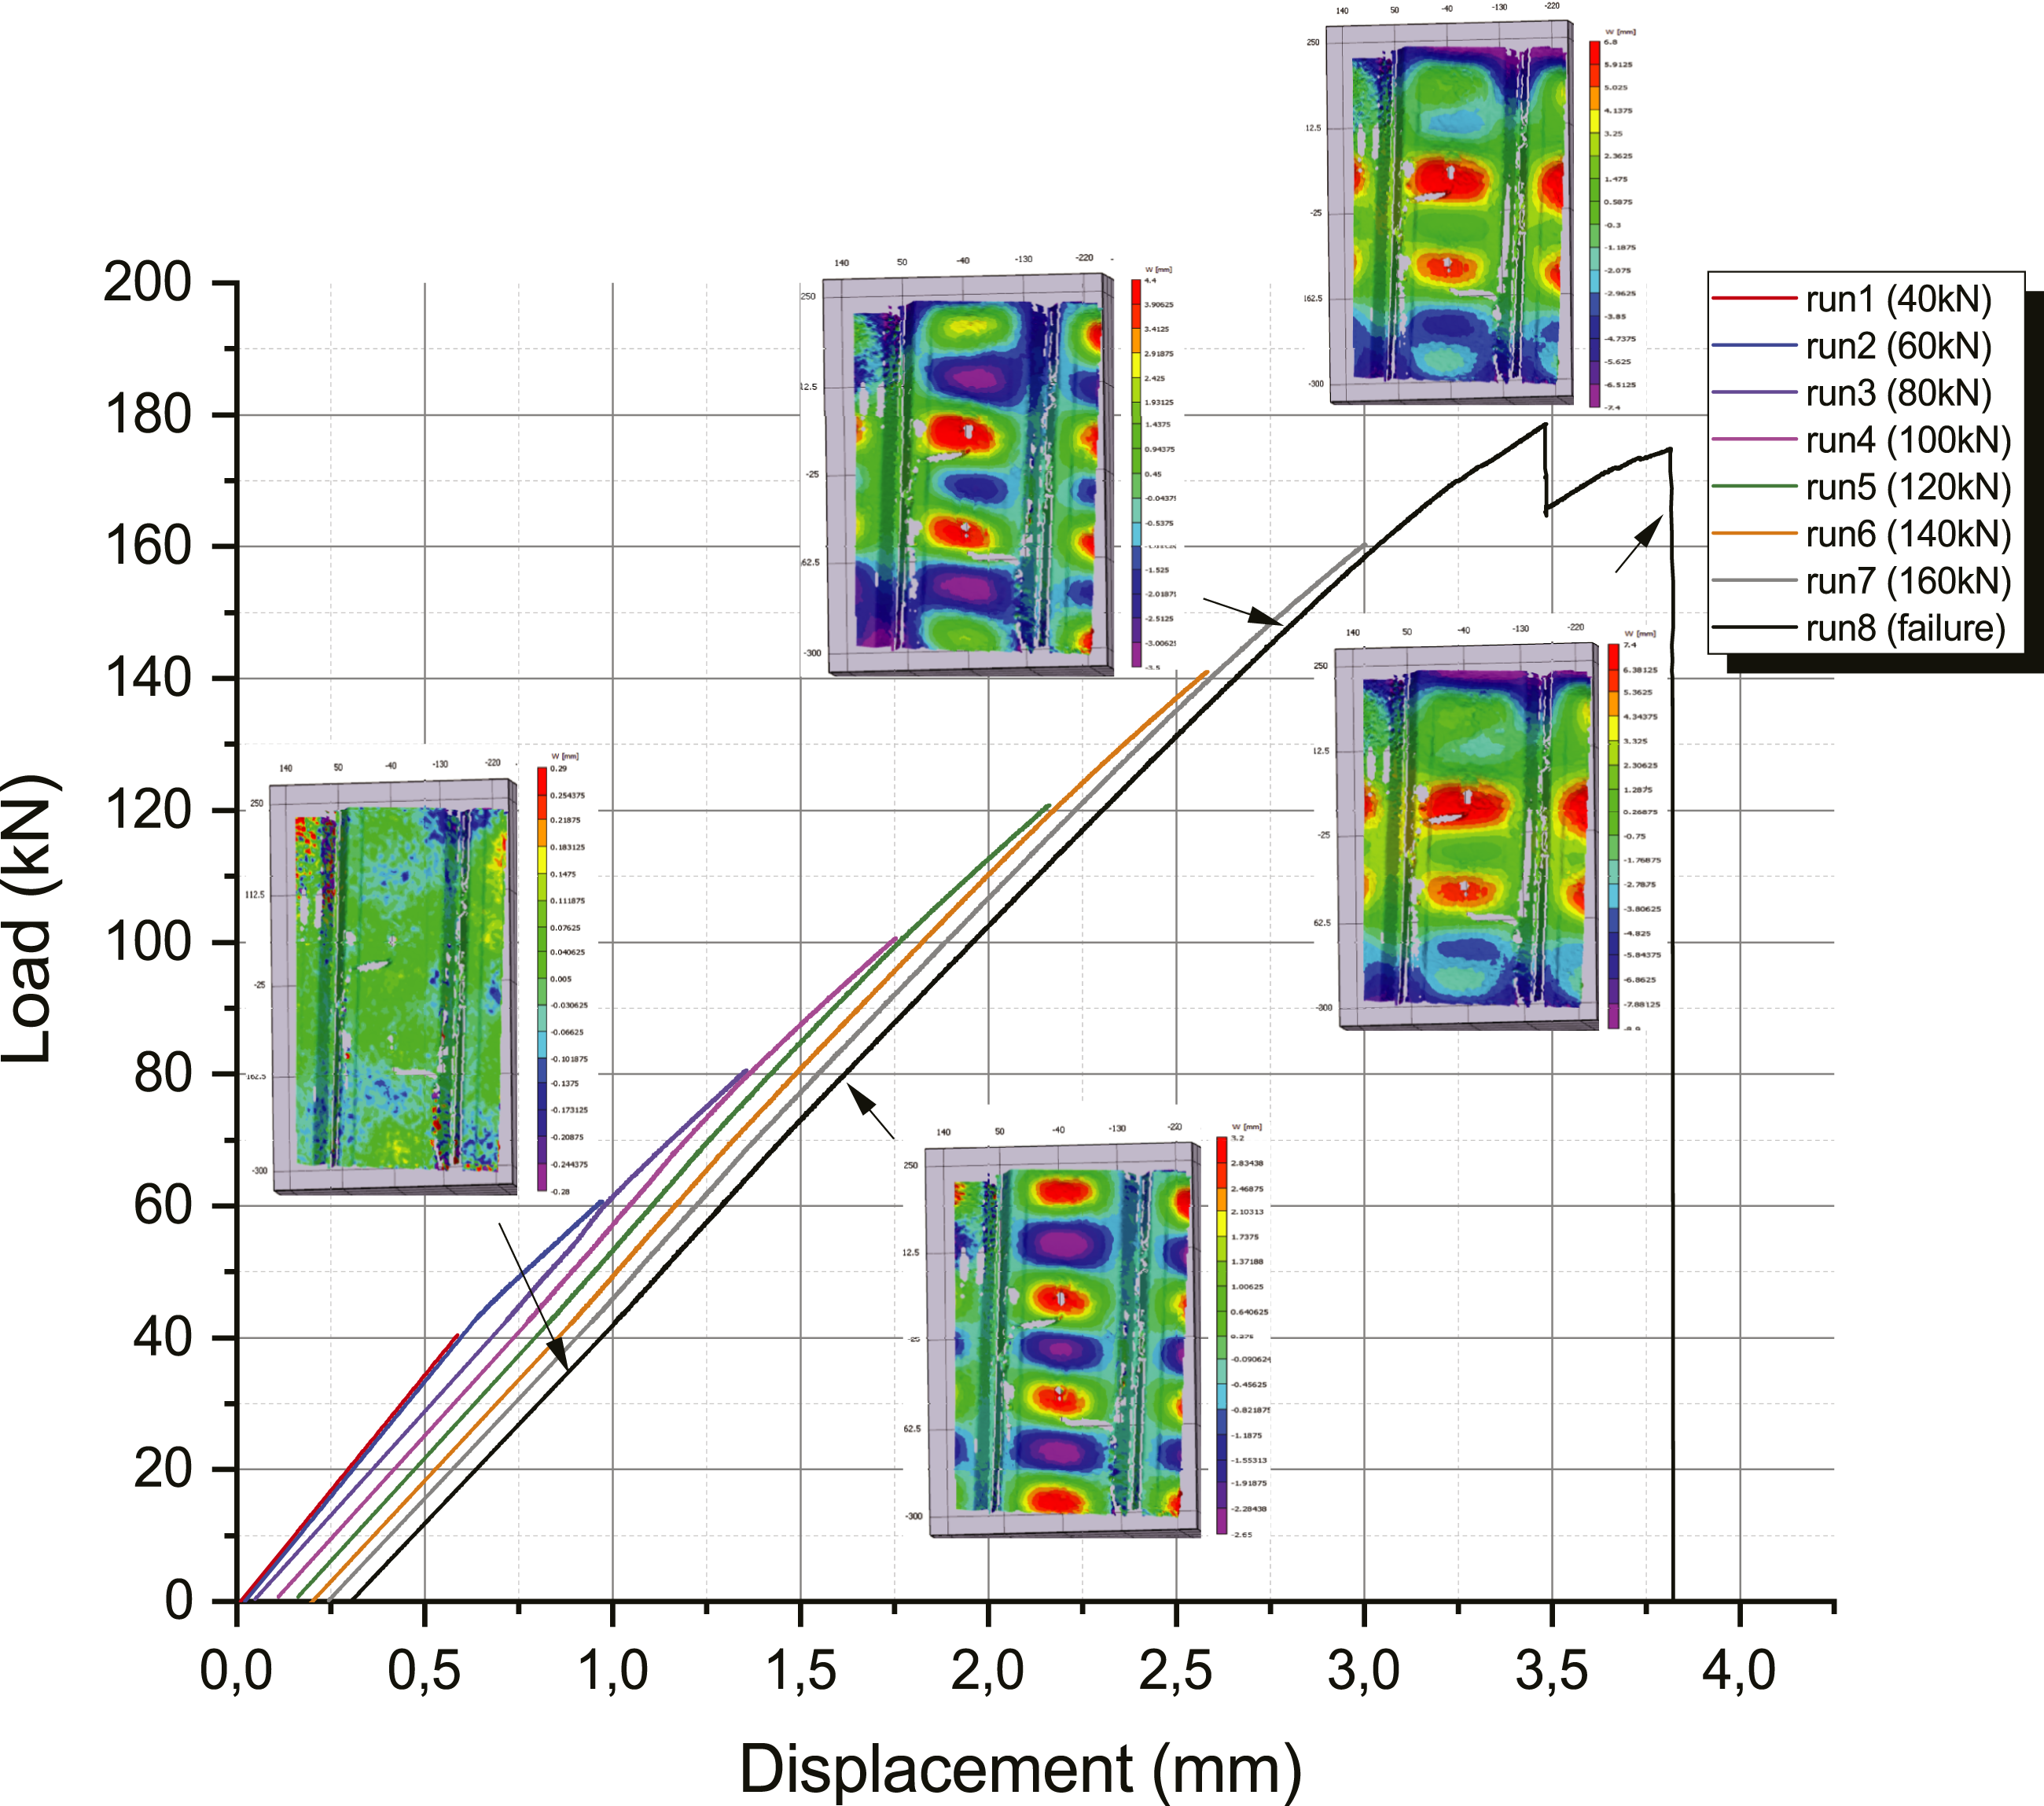
The failure mode and its location at the end of the test are presented in Figure 5. Post-mortem analysis reveals that the collapse was caused by extensive skin-stiffener debonding near the top end of the panel. The deflection sequence from DIC highlights the development of a negative out-of-plane cavity that spreads on the bay between the two stringers (Figure 5(a)), leading to skin-stringer separation as illustrated in the circled region (Figure 5(b)). Final failure mode: (a) Digital image correlation results, (b) panel damaged area.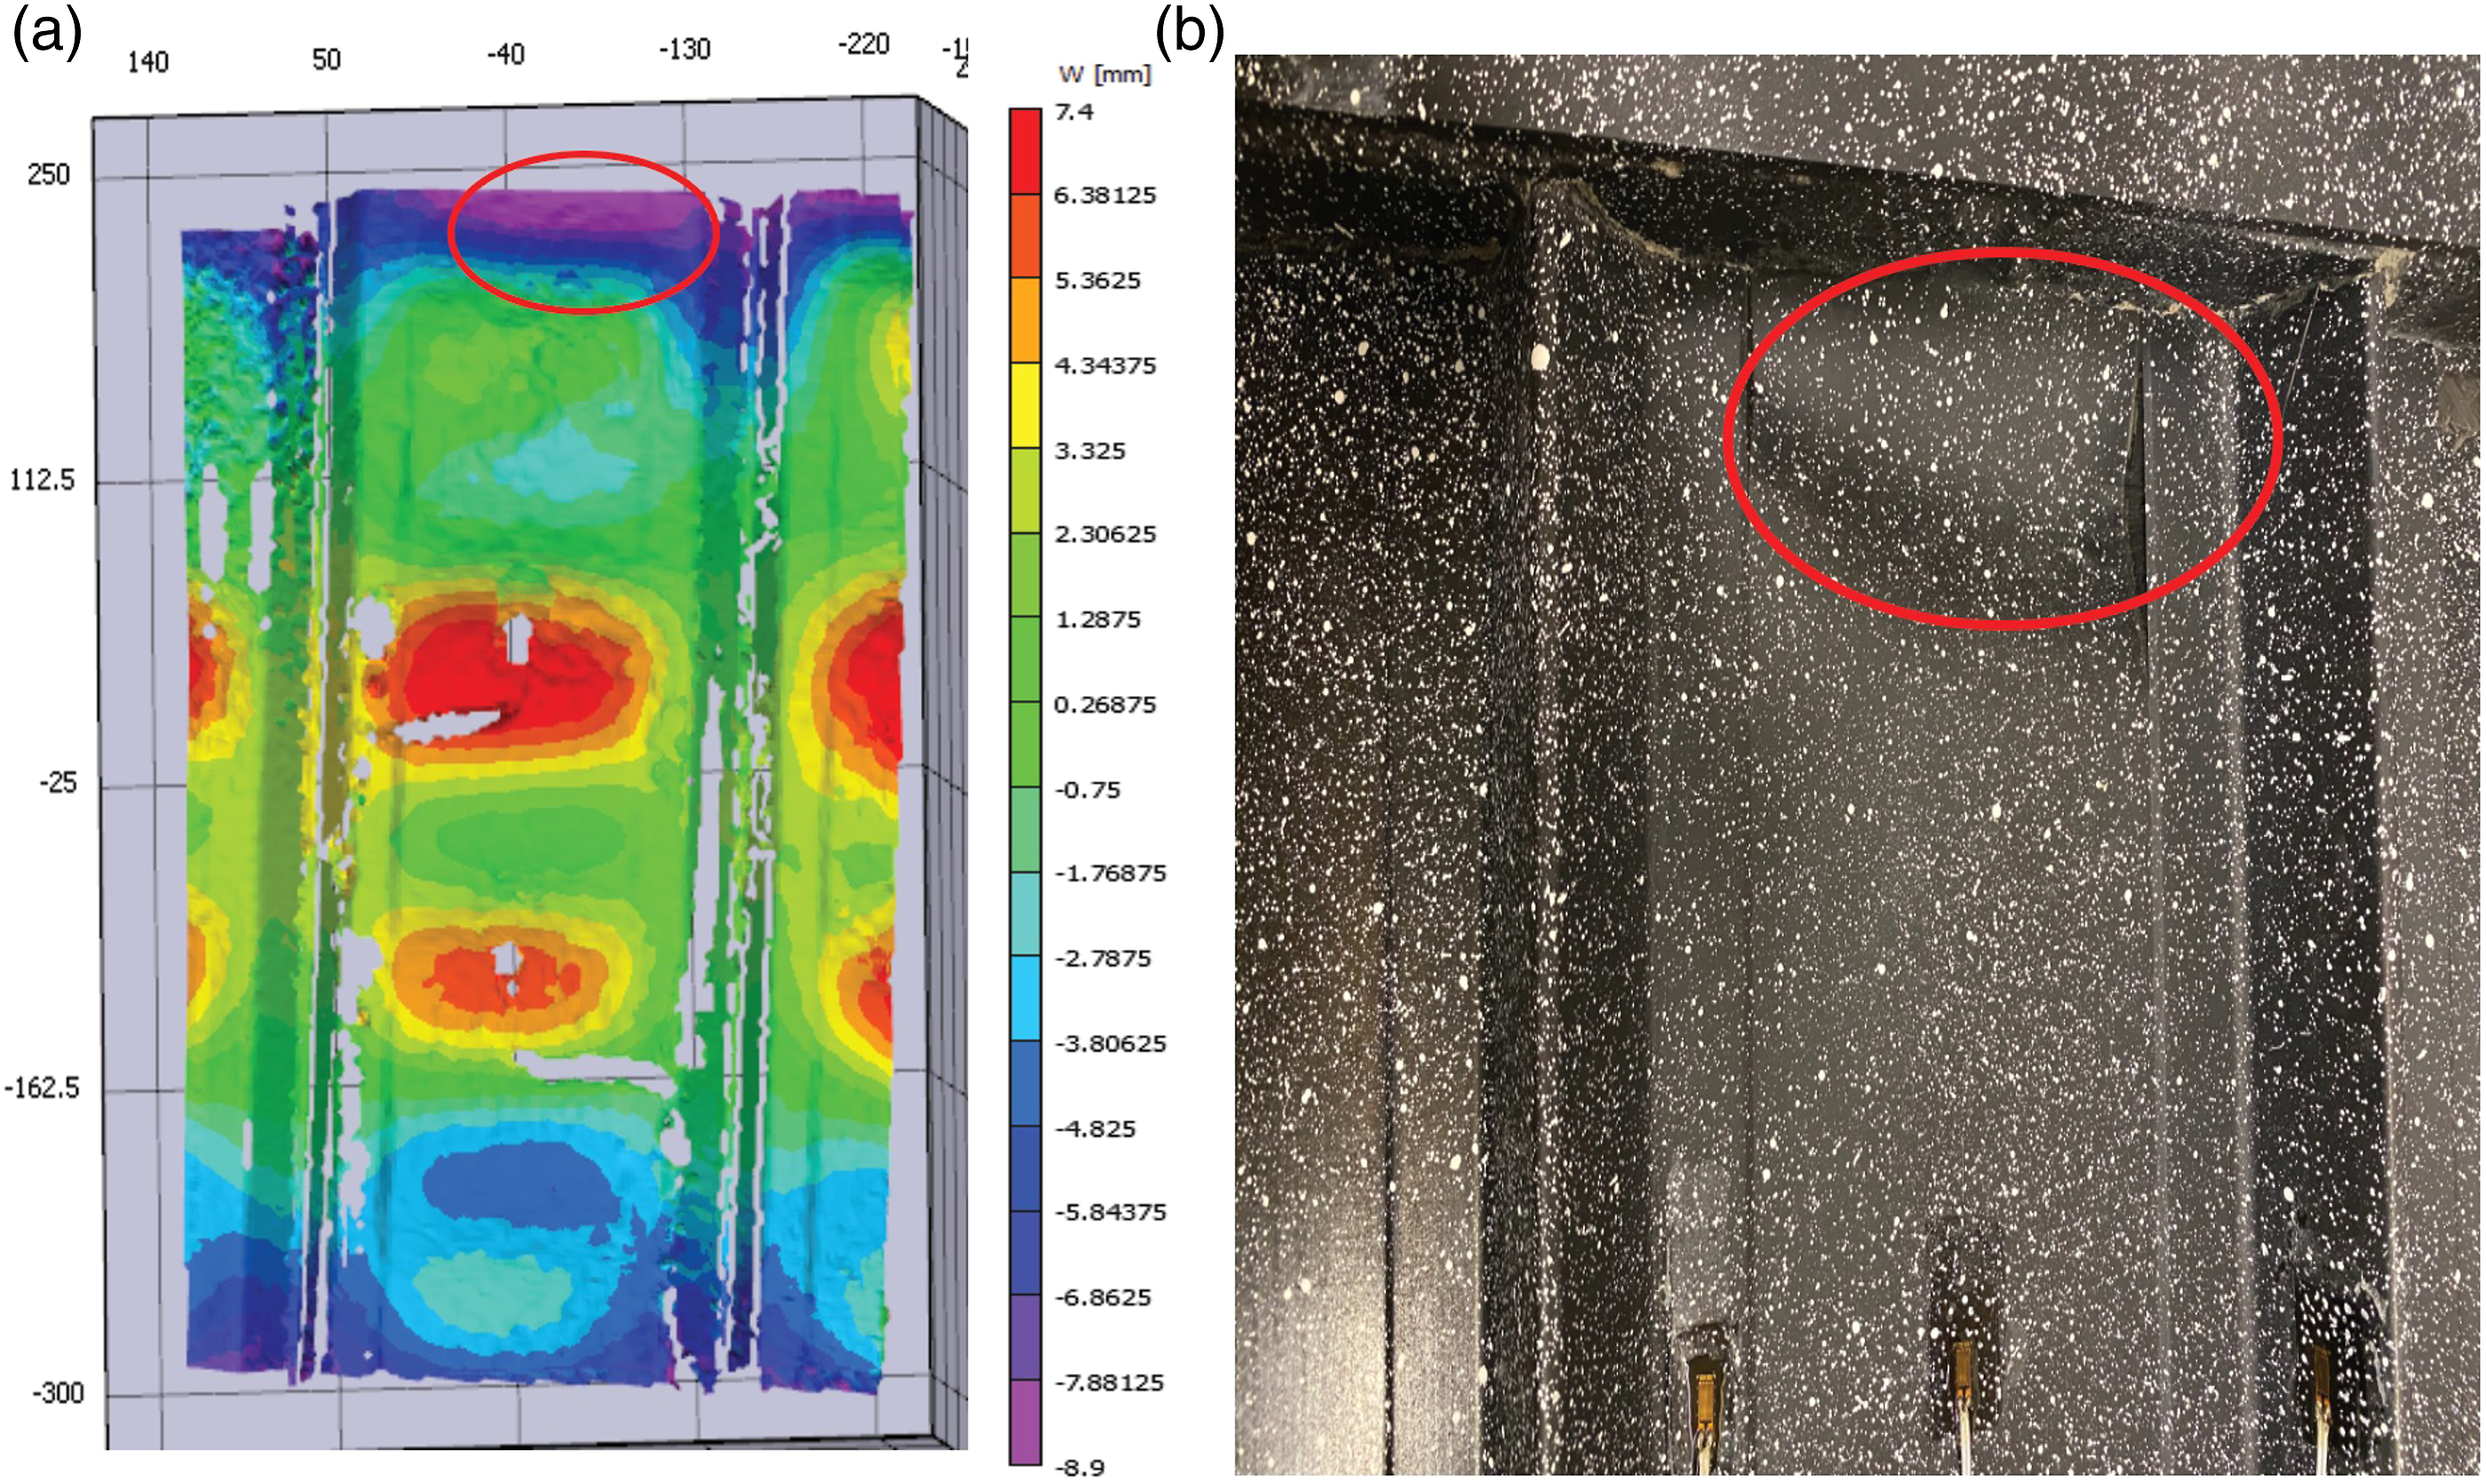
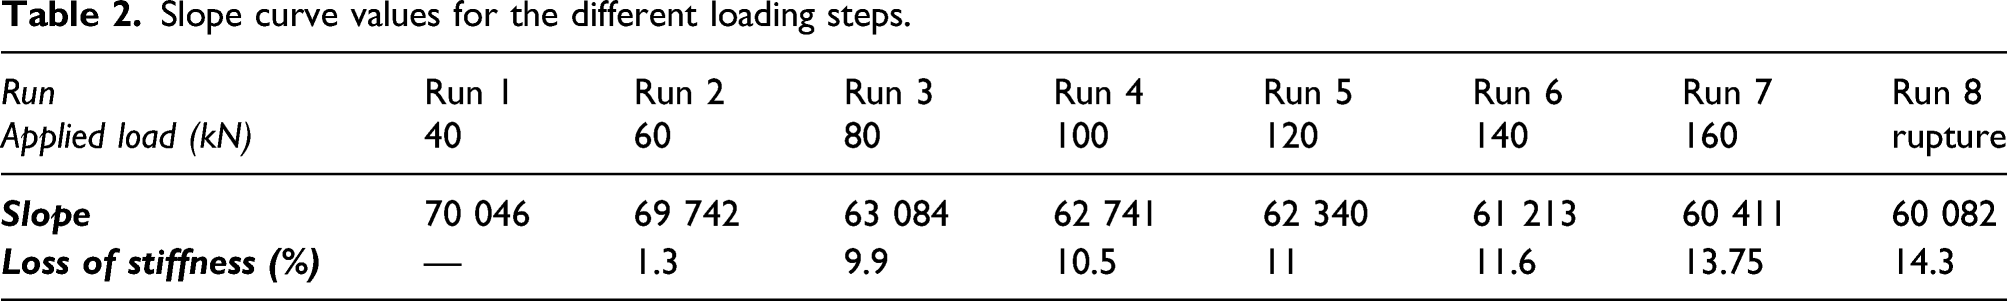
The comparison between the different load-displacement curves (Figure 4) shows that the loading and unloading sequences lead to a decrease in the curve slope accompanied by a relative displacement shift.
Slope curve values for the different loading steps.
Acoustic emission analysis
In Figure 6, the curves of cumulative counts registered during each step are plotted versus the applied compression loading. The first elastic run, (prior to buckling), displays limited number of hits with weak energy and amplitude related to some micro-failures, such as matrix and resin-rich zones cracking. The second loading is characterized by an important and strong AE activity with maximum amplitude of 80 dB (Figure 7). These waveforms accompanied the buckling of the panel and the apparition of out-of-plane deflection. Additional to various microcracks, the sudden change in the shape promotes peel stress between skin and stiffeners which may locally exceed the material strength and initiate interlaminar delamination. The transition to post-buckling regime is relatively quiet where there is no substantial AE activity between [60–120 kN]. The low number of damage sources at this stage confirms the excellent post-buckling behavior of this panel. From around 125 kN, the AE counts start increasing rapidly with significant raise in the last two runs. Signals in this stage have by far the highest amplitude signals (98 dB) and the strongest energy as illustrated in Figure 7. The principal damage mechanism behind this activity is related to the skin-stiffener debonding causing the panel failure. AE counts versus applied load. AE features: cumulative energy and amplitude.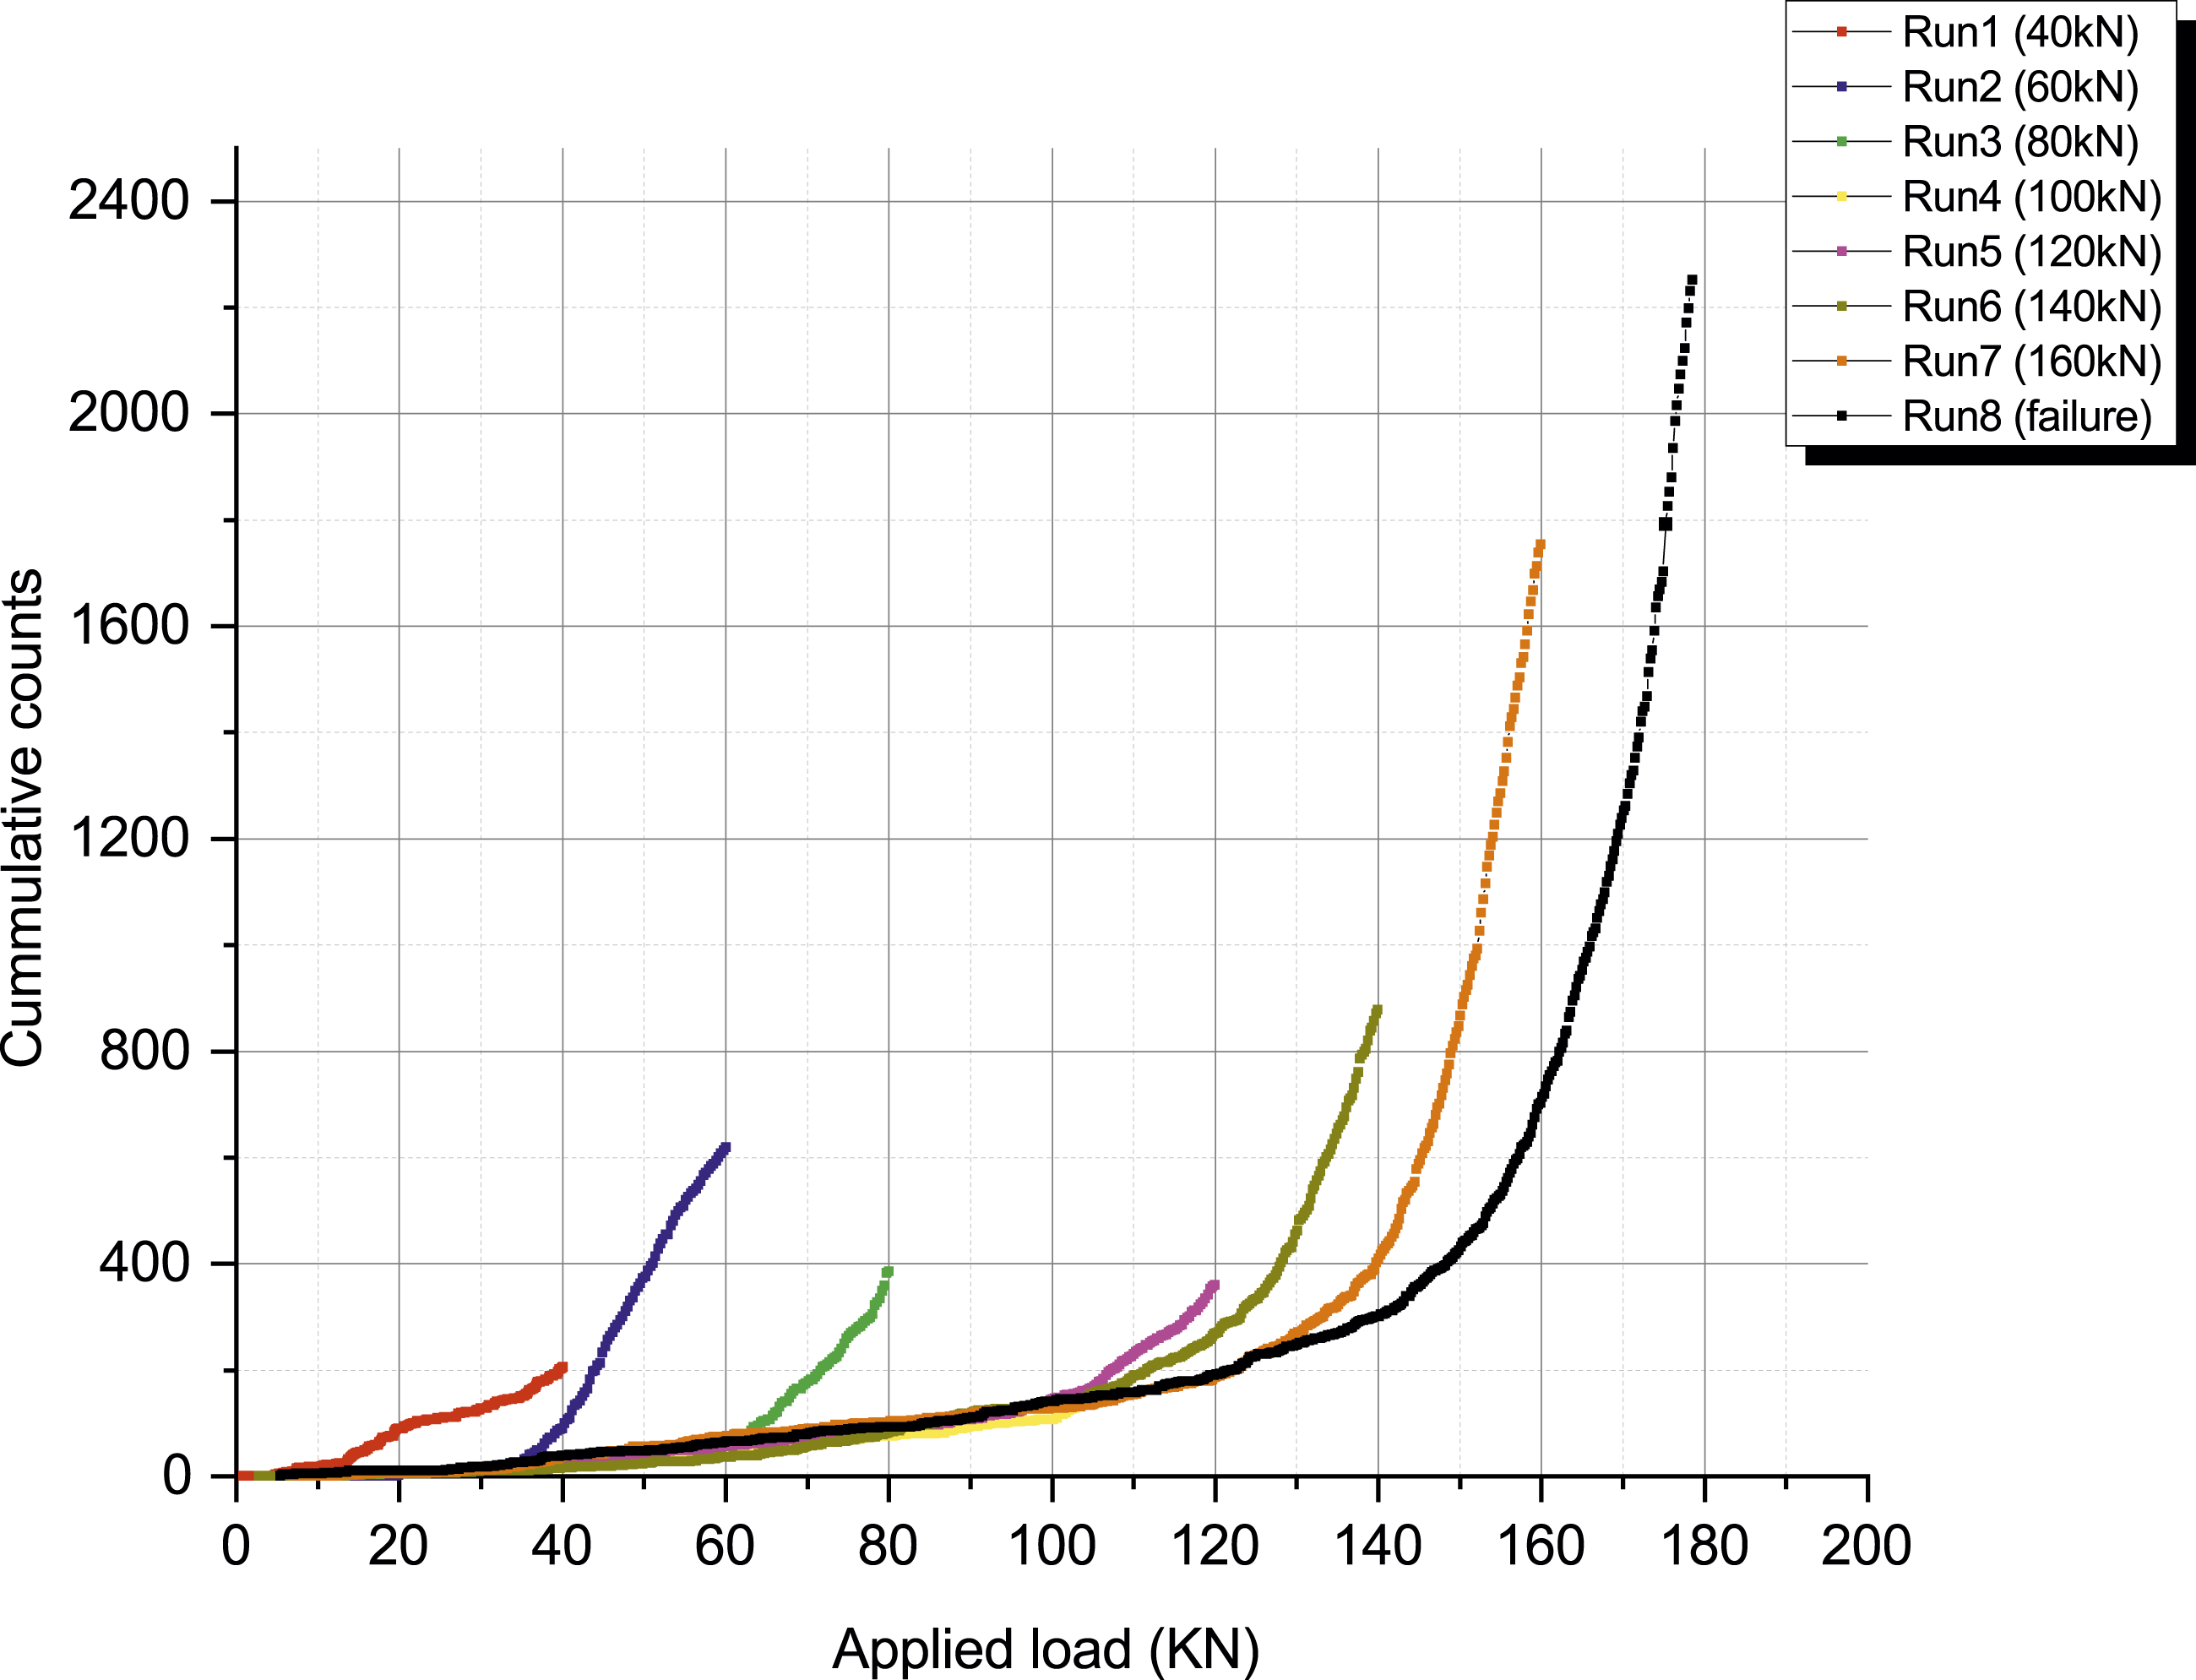
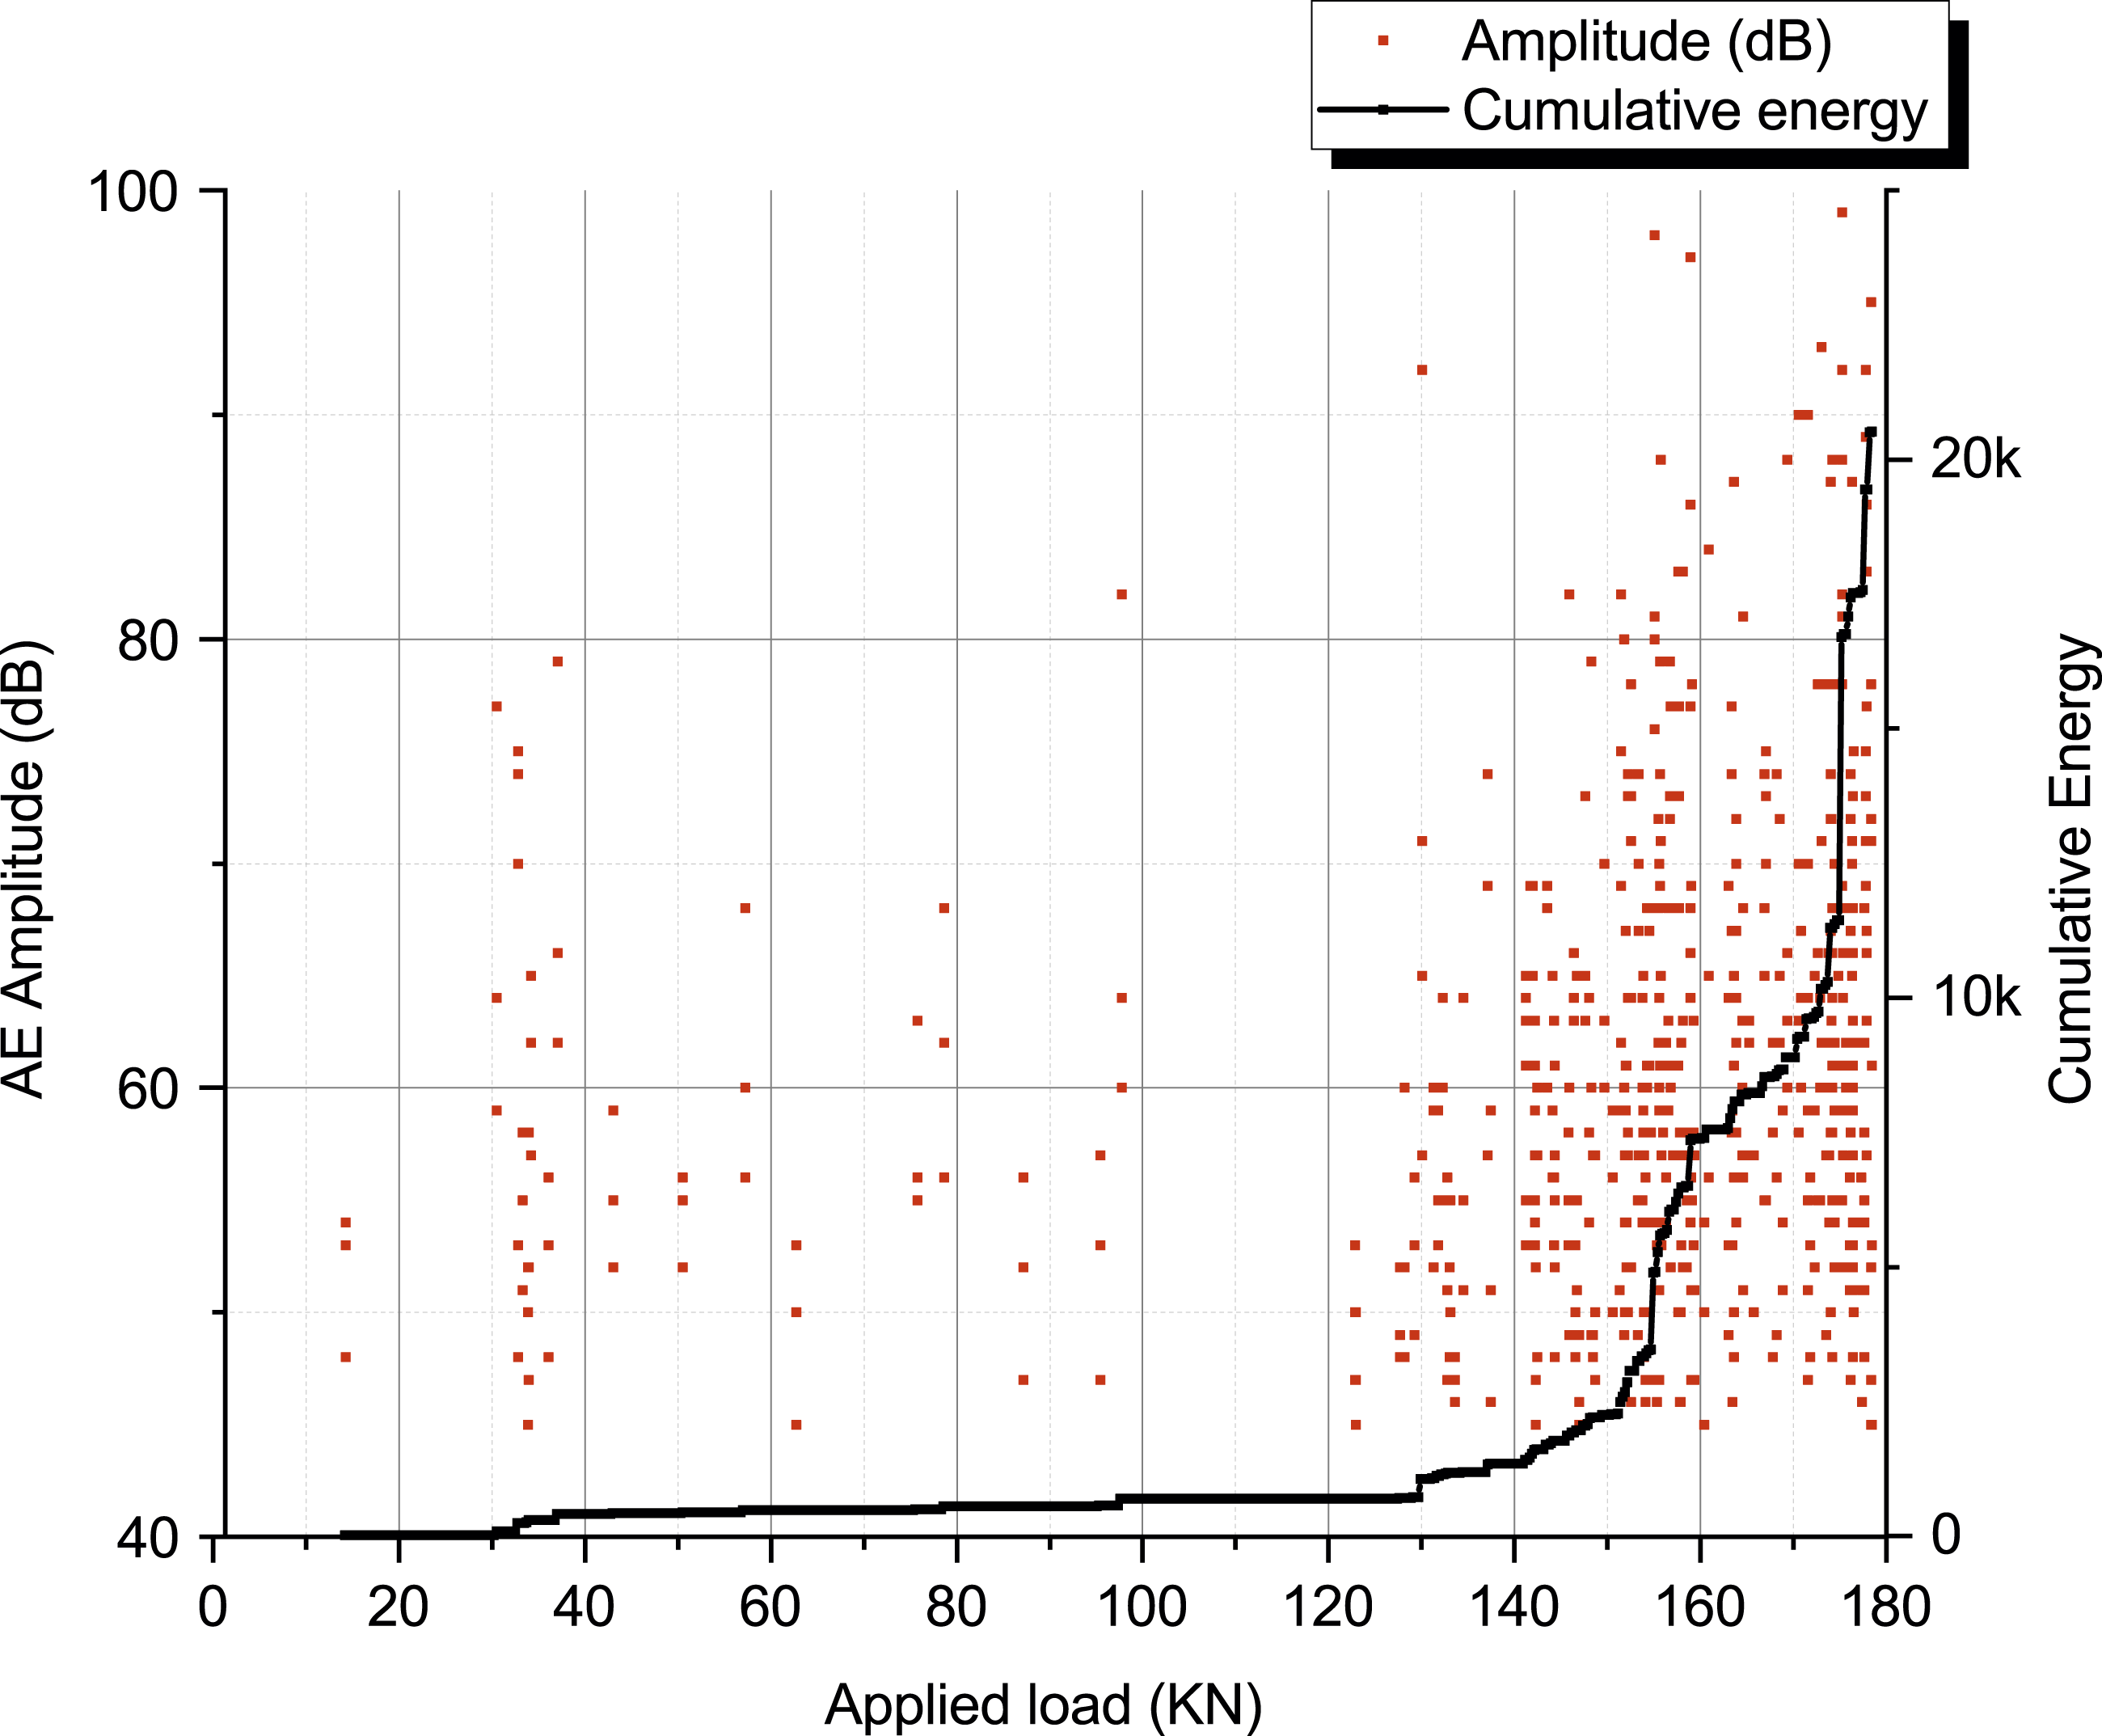
As a result of this analysis, it can be seen that the amount of damage measured by EA for each run is strongly linked to the stiffness degradation of the panel determined previously. It is also notable that during all the reloading phase, there is almost no detectable signal until the load reaches and exceeds the level of the previous maximum load. This behavior is well known as the Kaiser effect. 43
The spatial locations of AE damage sources are plotted in Figure 8 for three loading levels defined as follows: immediately after buckling (43 kN), at 150 kN, and at the end of test. Monitoring map show that the first localized signals are mainly emitted from the stringer’s foot and adjacent areas (Figure 8(a)). As the load reaches 125 kN, a concentrated and sustainable AE activity was detected from the top-right corner of the bay (Figure 8(b)). By increasing the applied load, this activity gets stronger and spreads over a larger zone between the two stingers. The AE damage map obtained at the end of the test (Figure 8(c)) show consistent result with the position of failure scenario (Figure 5). AE event locations at (a) 43 kN, (b) 150 kN, and (c) failure.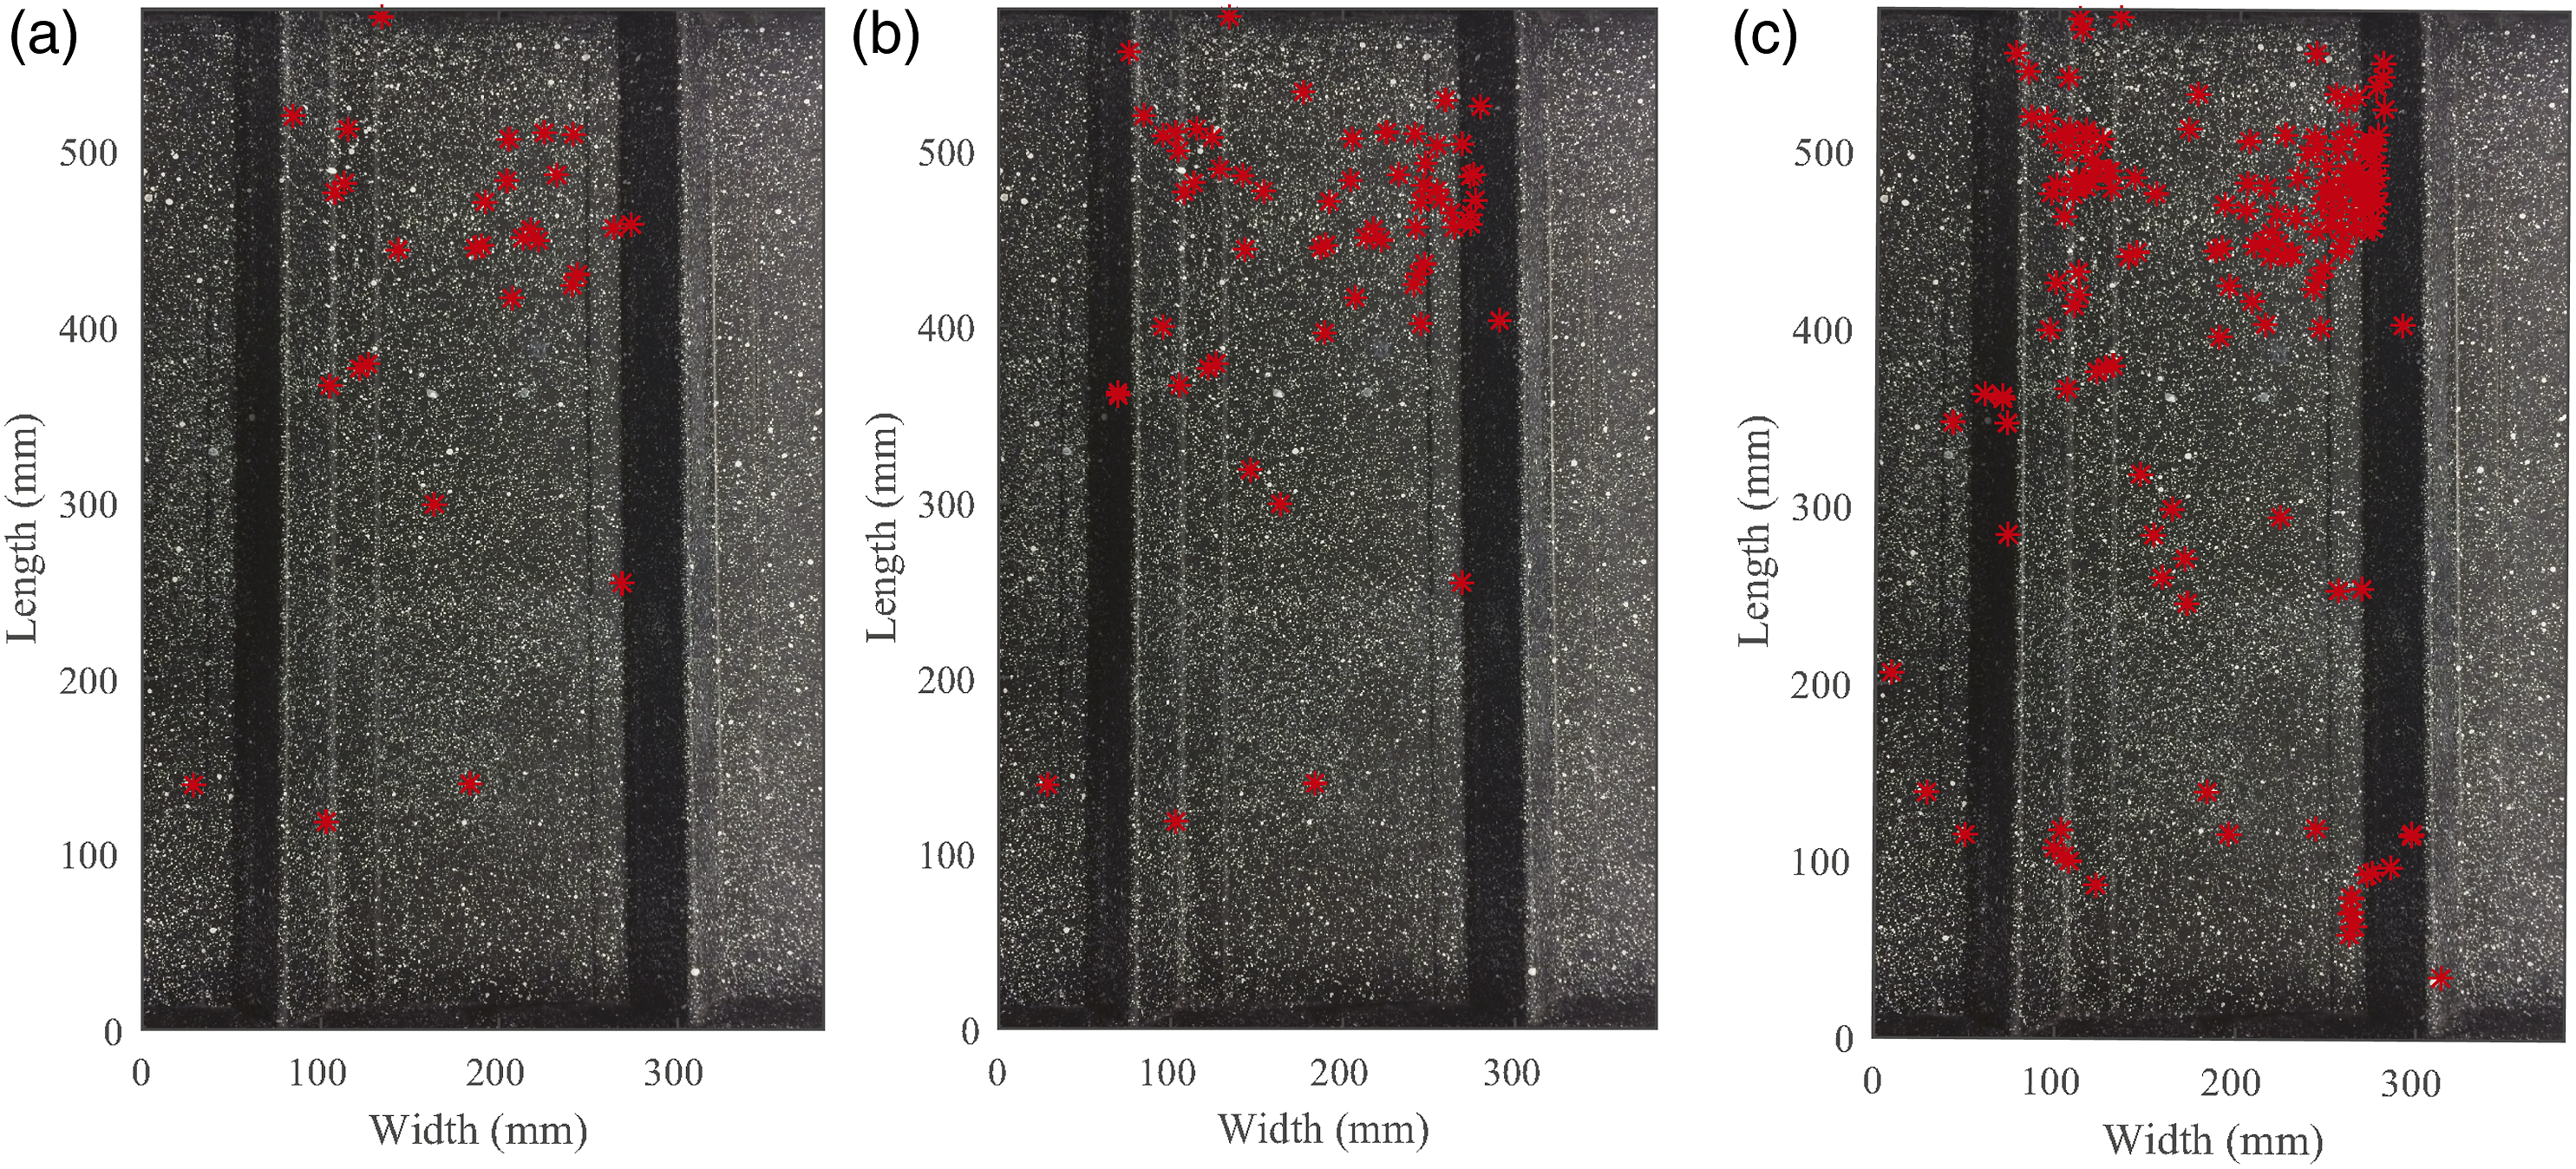
Further analysis of the recorded AE activity involved a classification of the AE signals by using unsupervised pattern recognition UPR technique with Noesis software.
44
For this aim, k-means algorithm with five AE features, namely, counts, amplitude, duration energy and peak frequency, is employed for the pattern vectors. The features are normalized, and the number of classes is determined by minimizing the coefficient Rij’s criteria
45
which yields the case of two classes with a correlation level equal to 1.12. The statistics for the classes resulting from the application of the pattern recognition algorithm are: class 1: 206 patterns (40%), class 2: 308 patterns (60%). The evolution of these classes versus the applied load is reported in Figure 9(a) while in Figure 9(b) the distribution of the rise time versus the pick frequency is presented. AE clustering results: (a) cumulate AE counts, (b) rise-time versus peak frequency.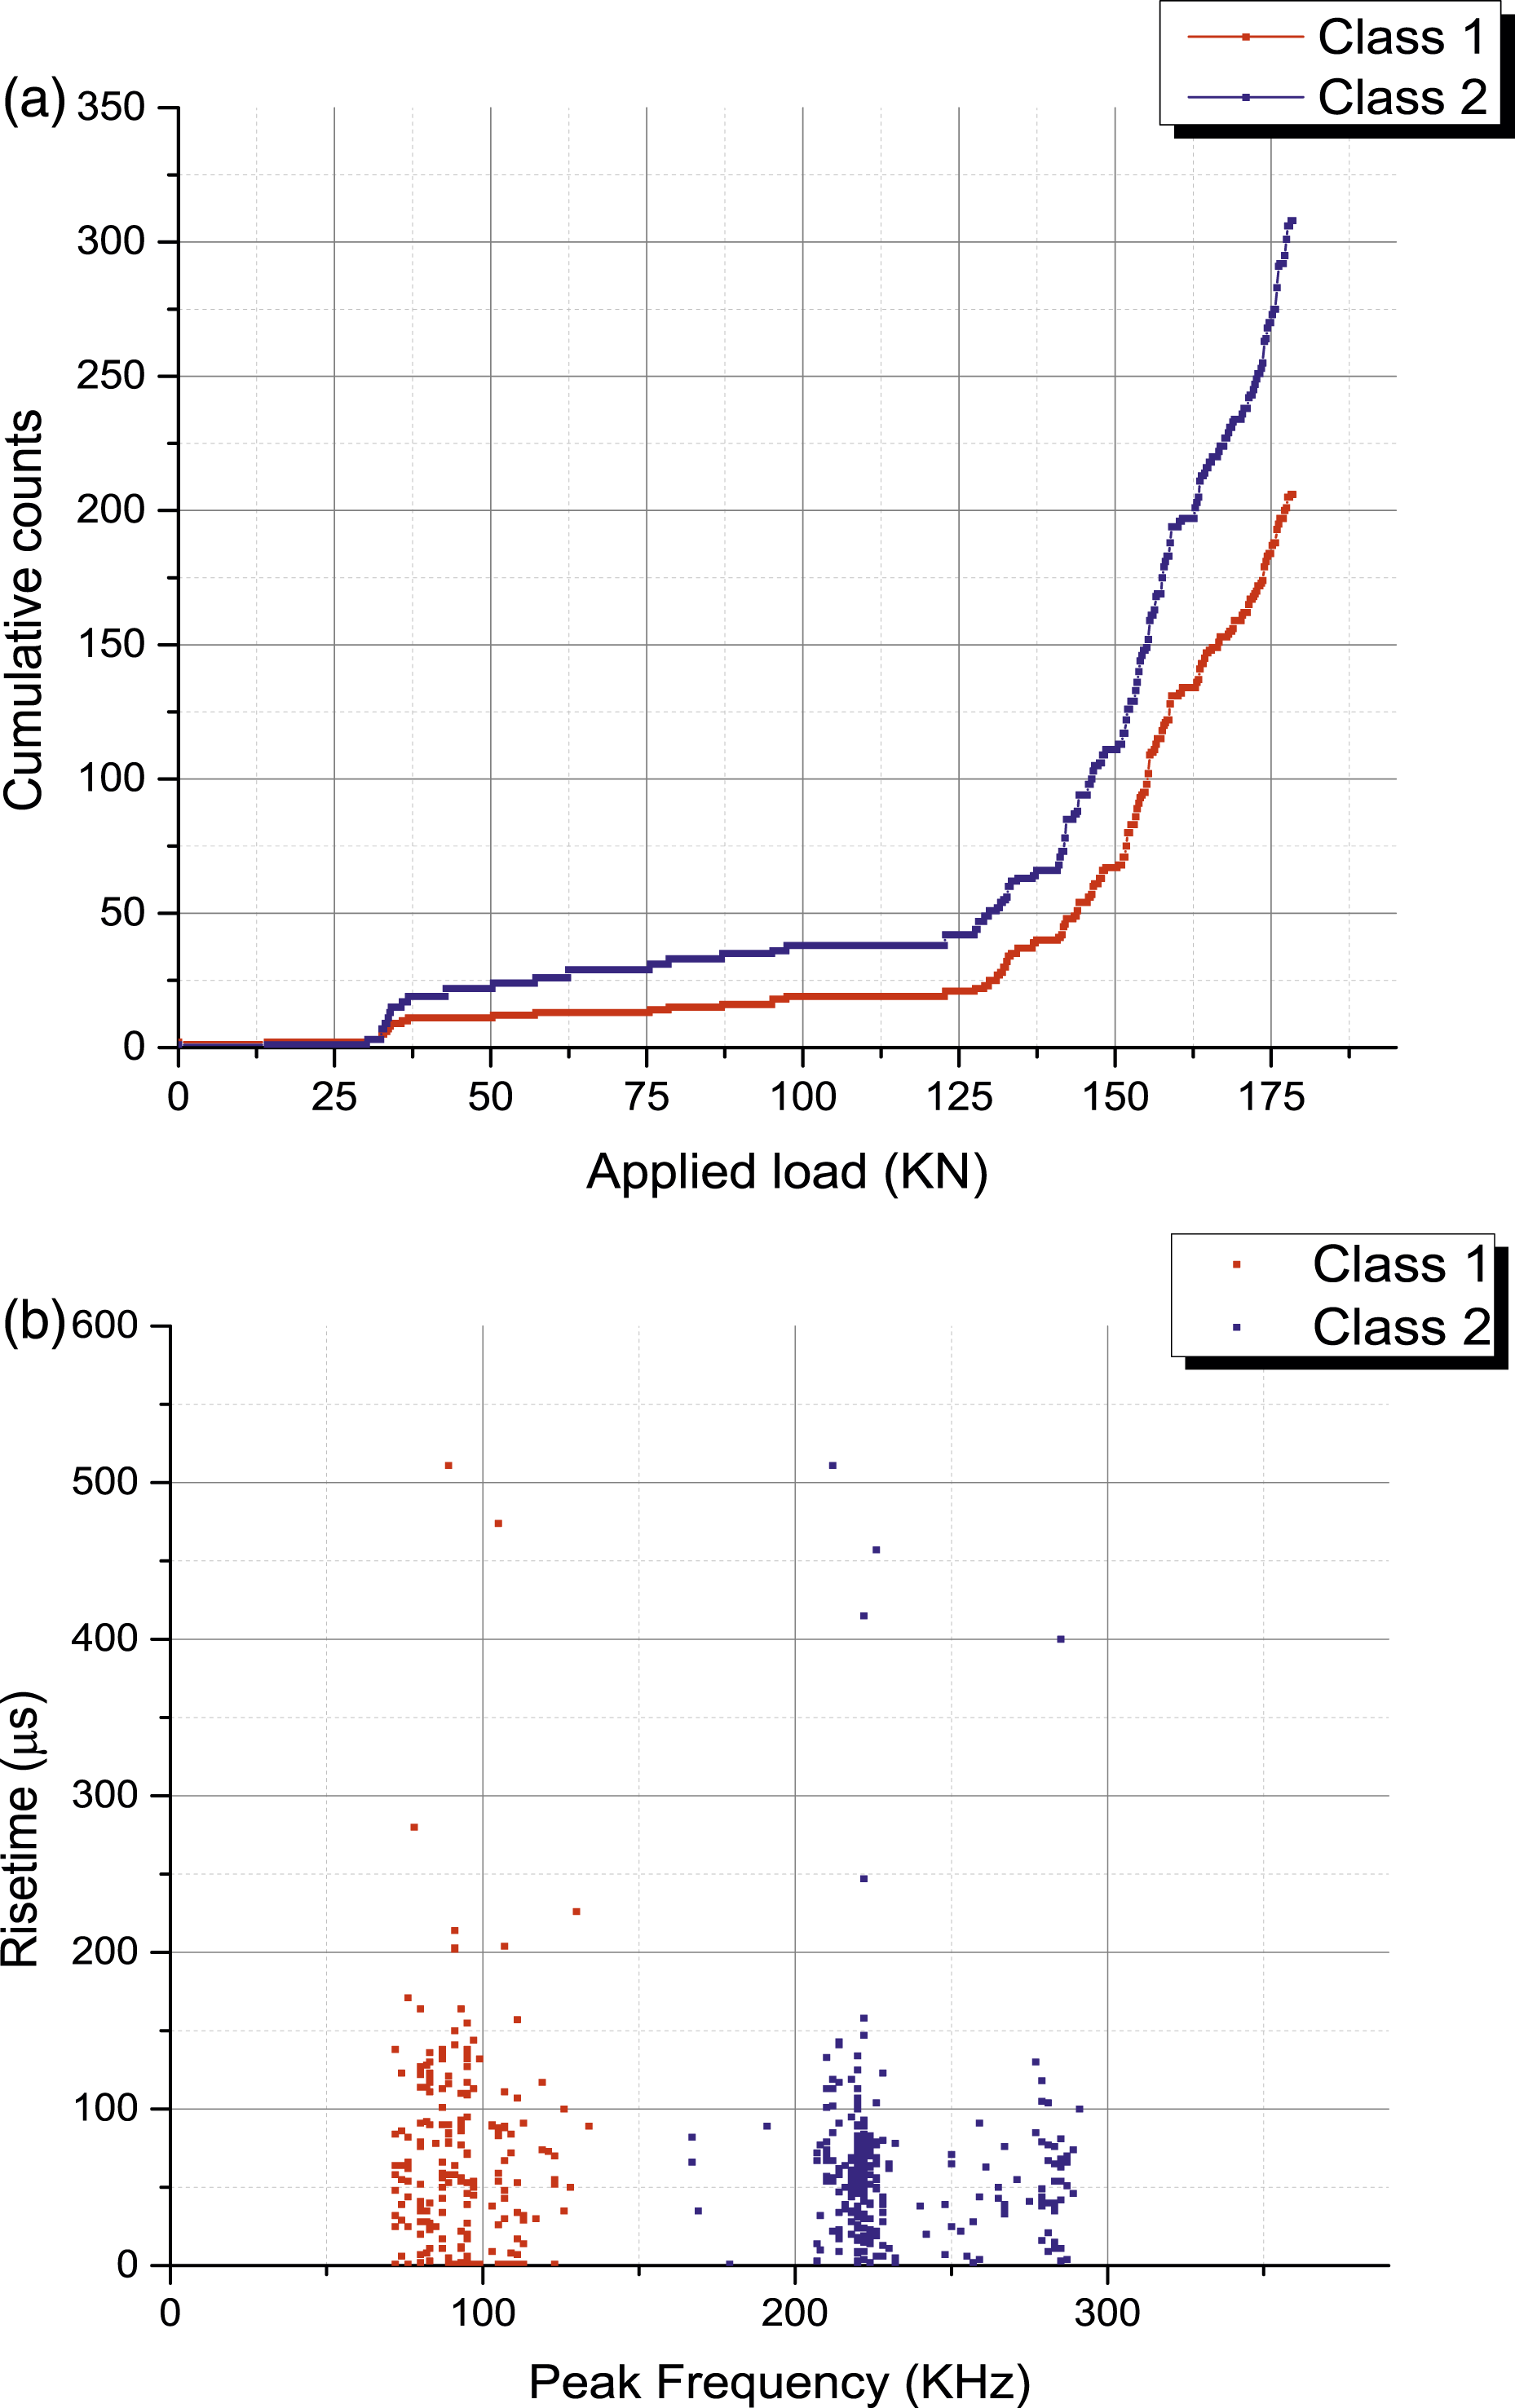
Class 1 starts to increase prior buckling, then raises moderately until approximately 125 kN. From this level, the activity becomes more sustainable and accelerates as it approached the end of the test. This cluster is characterized by the lower frequency range [70–140 kHz] and can be associated to matrix cracking and fiber-matrix decohesion phenomena. The second class (Class 2) has higher overall level of activity with 60% of the AE hits. It follows comparable evolution profile as the first class with significant leap prior the final failure. The corresponding range of frequencies is between [200–290 kHz] which is attributed to interfacial phenomena,46,47 and more specifically to the delamination between skin-stringer interfaces, as this was the principal damage mode observed.
Finite element modeling
Progressive damage methodology and failure criteria definition
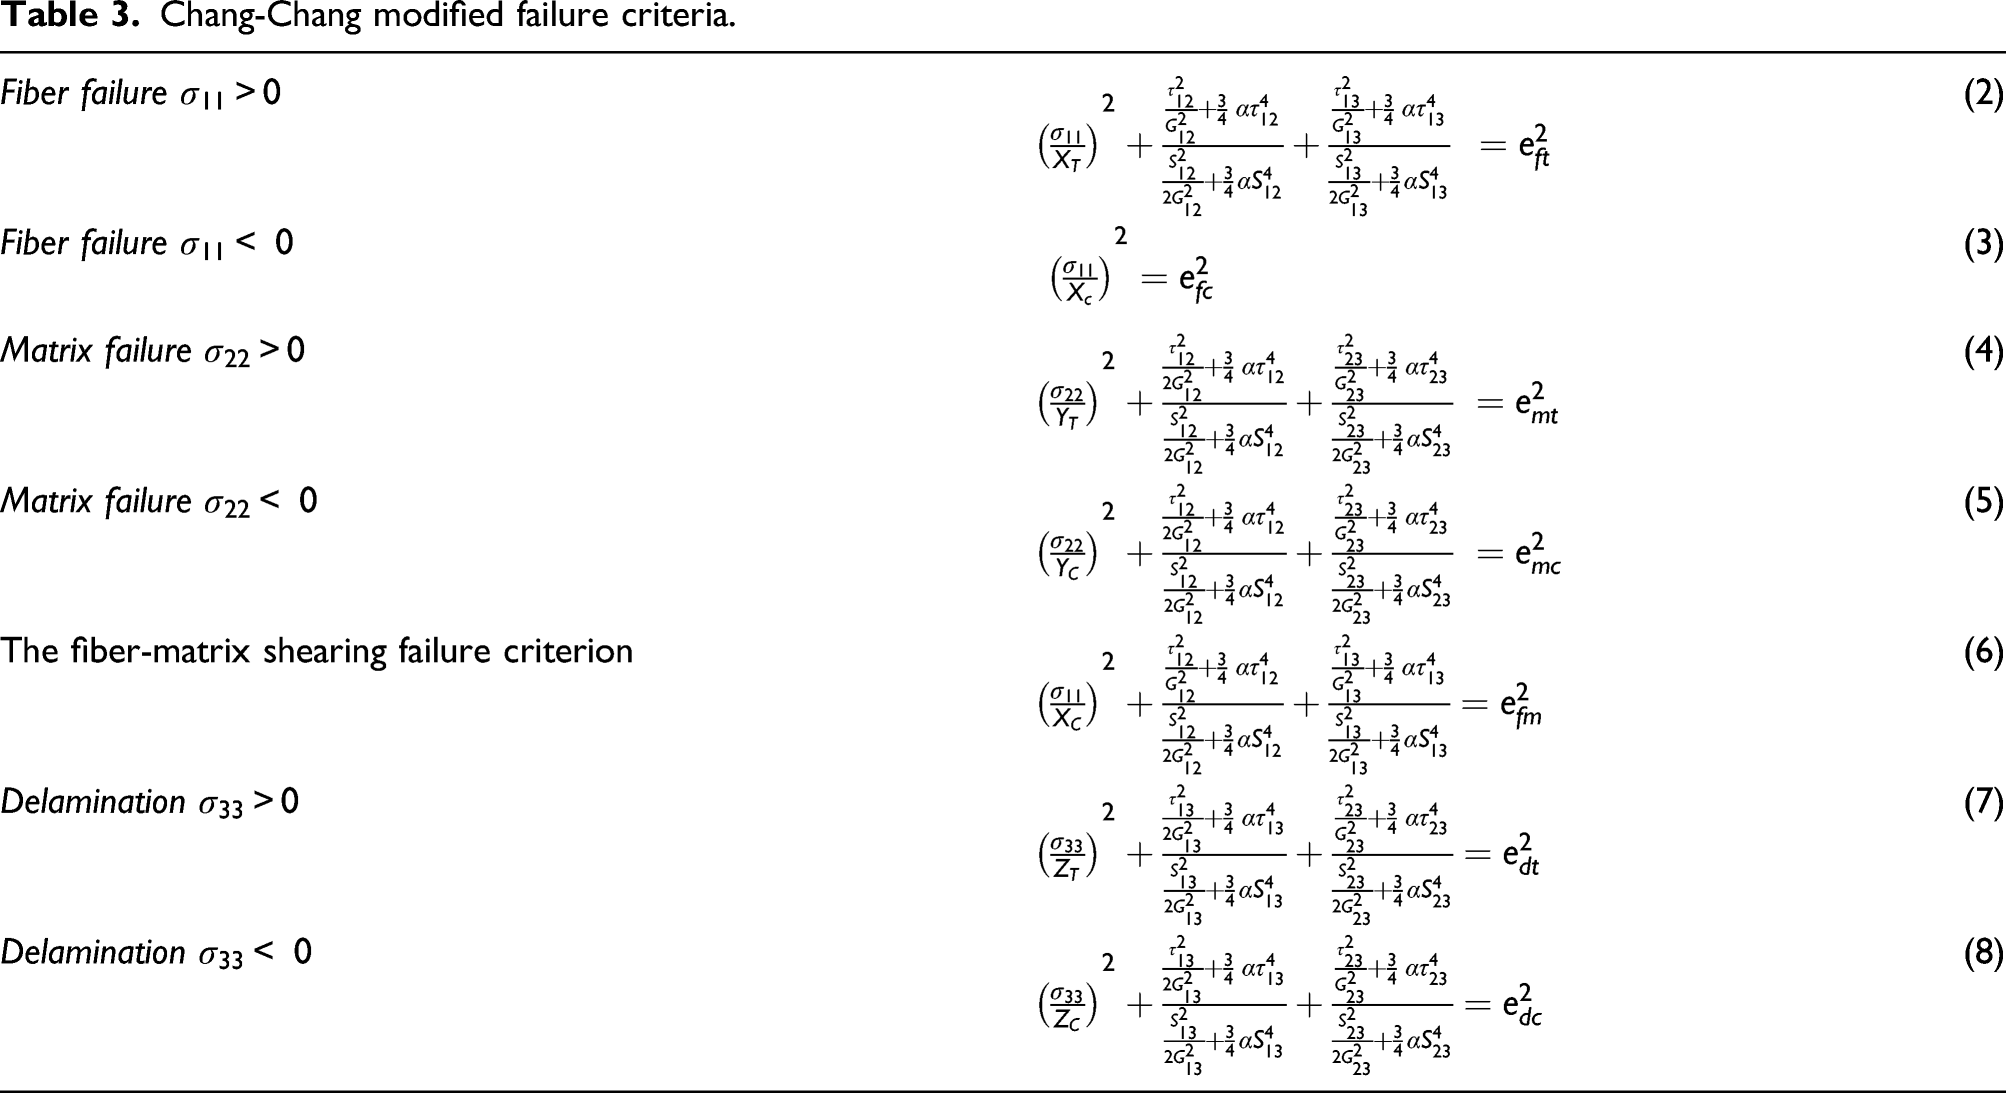
Chang-Chang modified failure criteria.
Degradation rules for the different failure modes. 50
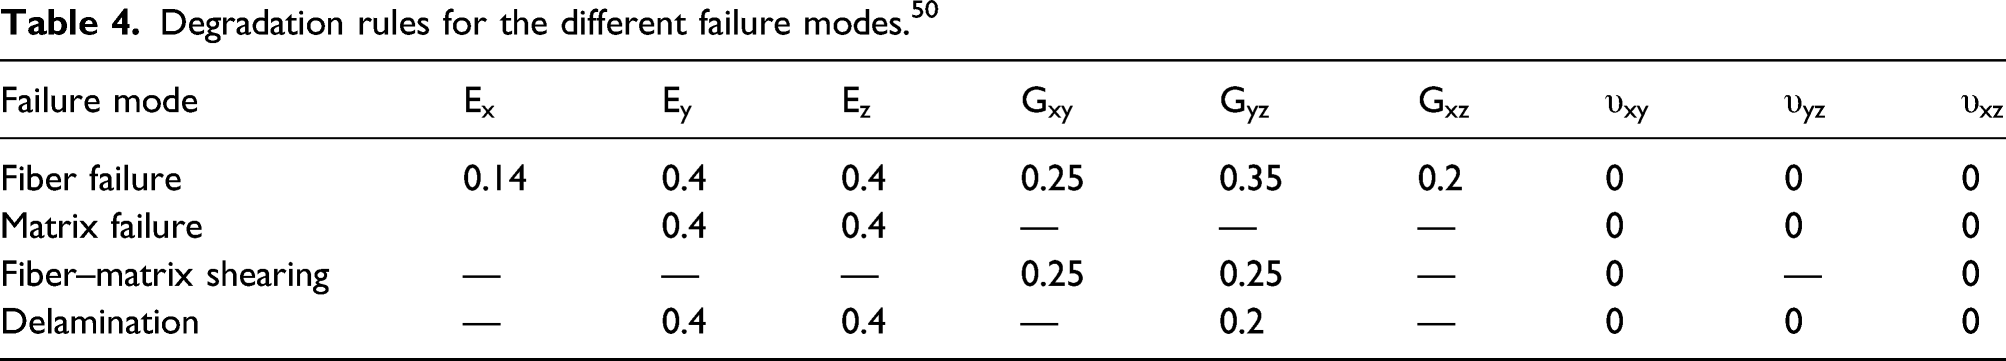
In this study, failure criteria proposed by Olmedo,
50
and based on development by Chang-Chang
51
are employed. These criteria combine both the contribution of out-of-plane stress and the nonlinear shear stress-strain relationship, which is expressed by equation (1).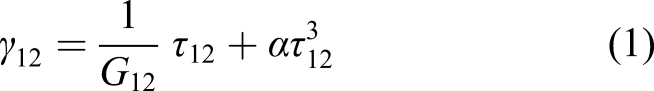
Finite element model
The FEM of the stiffened panel is developed using a 3D layered SOLID-186 element, which offers better assessment of interlaminar stress. The panel is discretized with a mesh size of 5 mm and the resulting total number of nodes and elements are 113,333 and 17,168, respectively. The boundary conditions are set to be consistent with the test settings. Thus, an axial displacement is applied to the nodes located at the top edge of the panel while the bottom side is completely constrained. In addition, a mesh sensitivity study is achieved to ensure the convergence of models based on buckling eigenvalues. The FEM and the boundary conditions can be seen in Figure 10. The mechanical properties and material strength are introduced according to Table 1 and the model is solved using a non-linear analysis with Newton-Raphson algorithm.
53
In order to account for the different sources of model imperfection, the initial panel geometry was edited by modifying its shape through node positions by adding a linear combination of the first 10 eigenvectors obtained from the buckling analysis. Indeed, according to Mo et al.,
4
the accuracy of the FEM results compared to the experimental ones depends on the number and weighting factors of the selected buckling modes. In the current study, the weight coefficients for the first 10 modes are defined respectively [0.01, 0.01, 0.01, 0.01, 0.1, 0.01, 0.05, 0.05, 0.01, 0.01]. The combination these perturbation modes has a cumulative maximum magnitude less than 10% of the skin thickness.
54
Mesh and boundary conditions in the finite element model.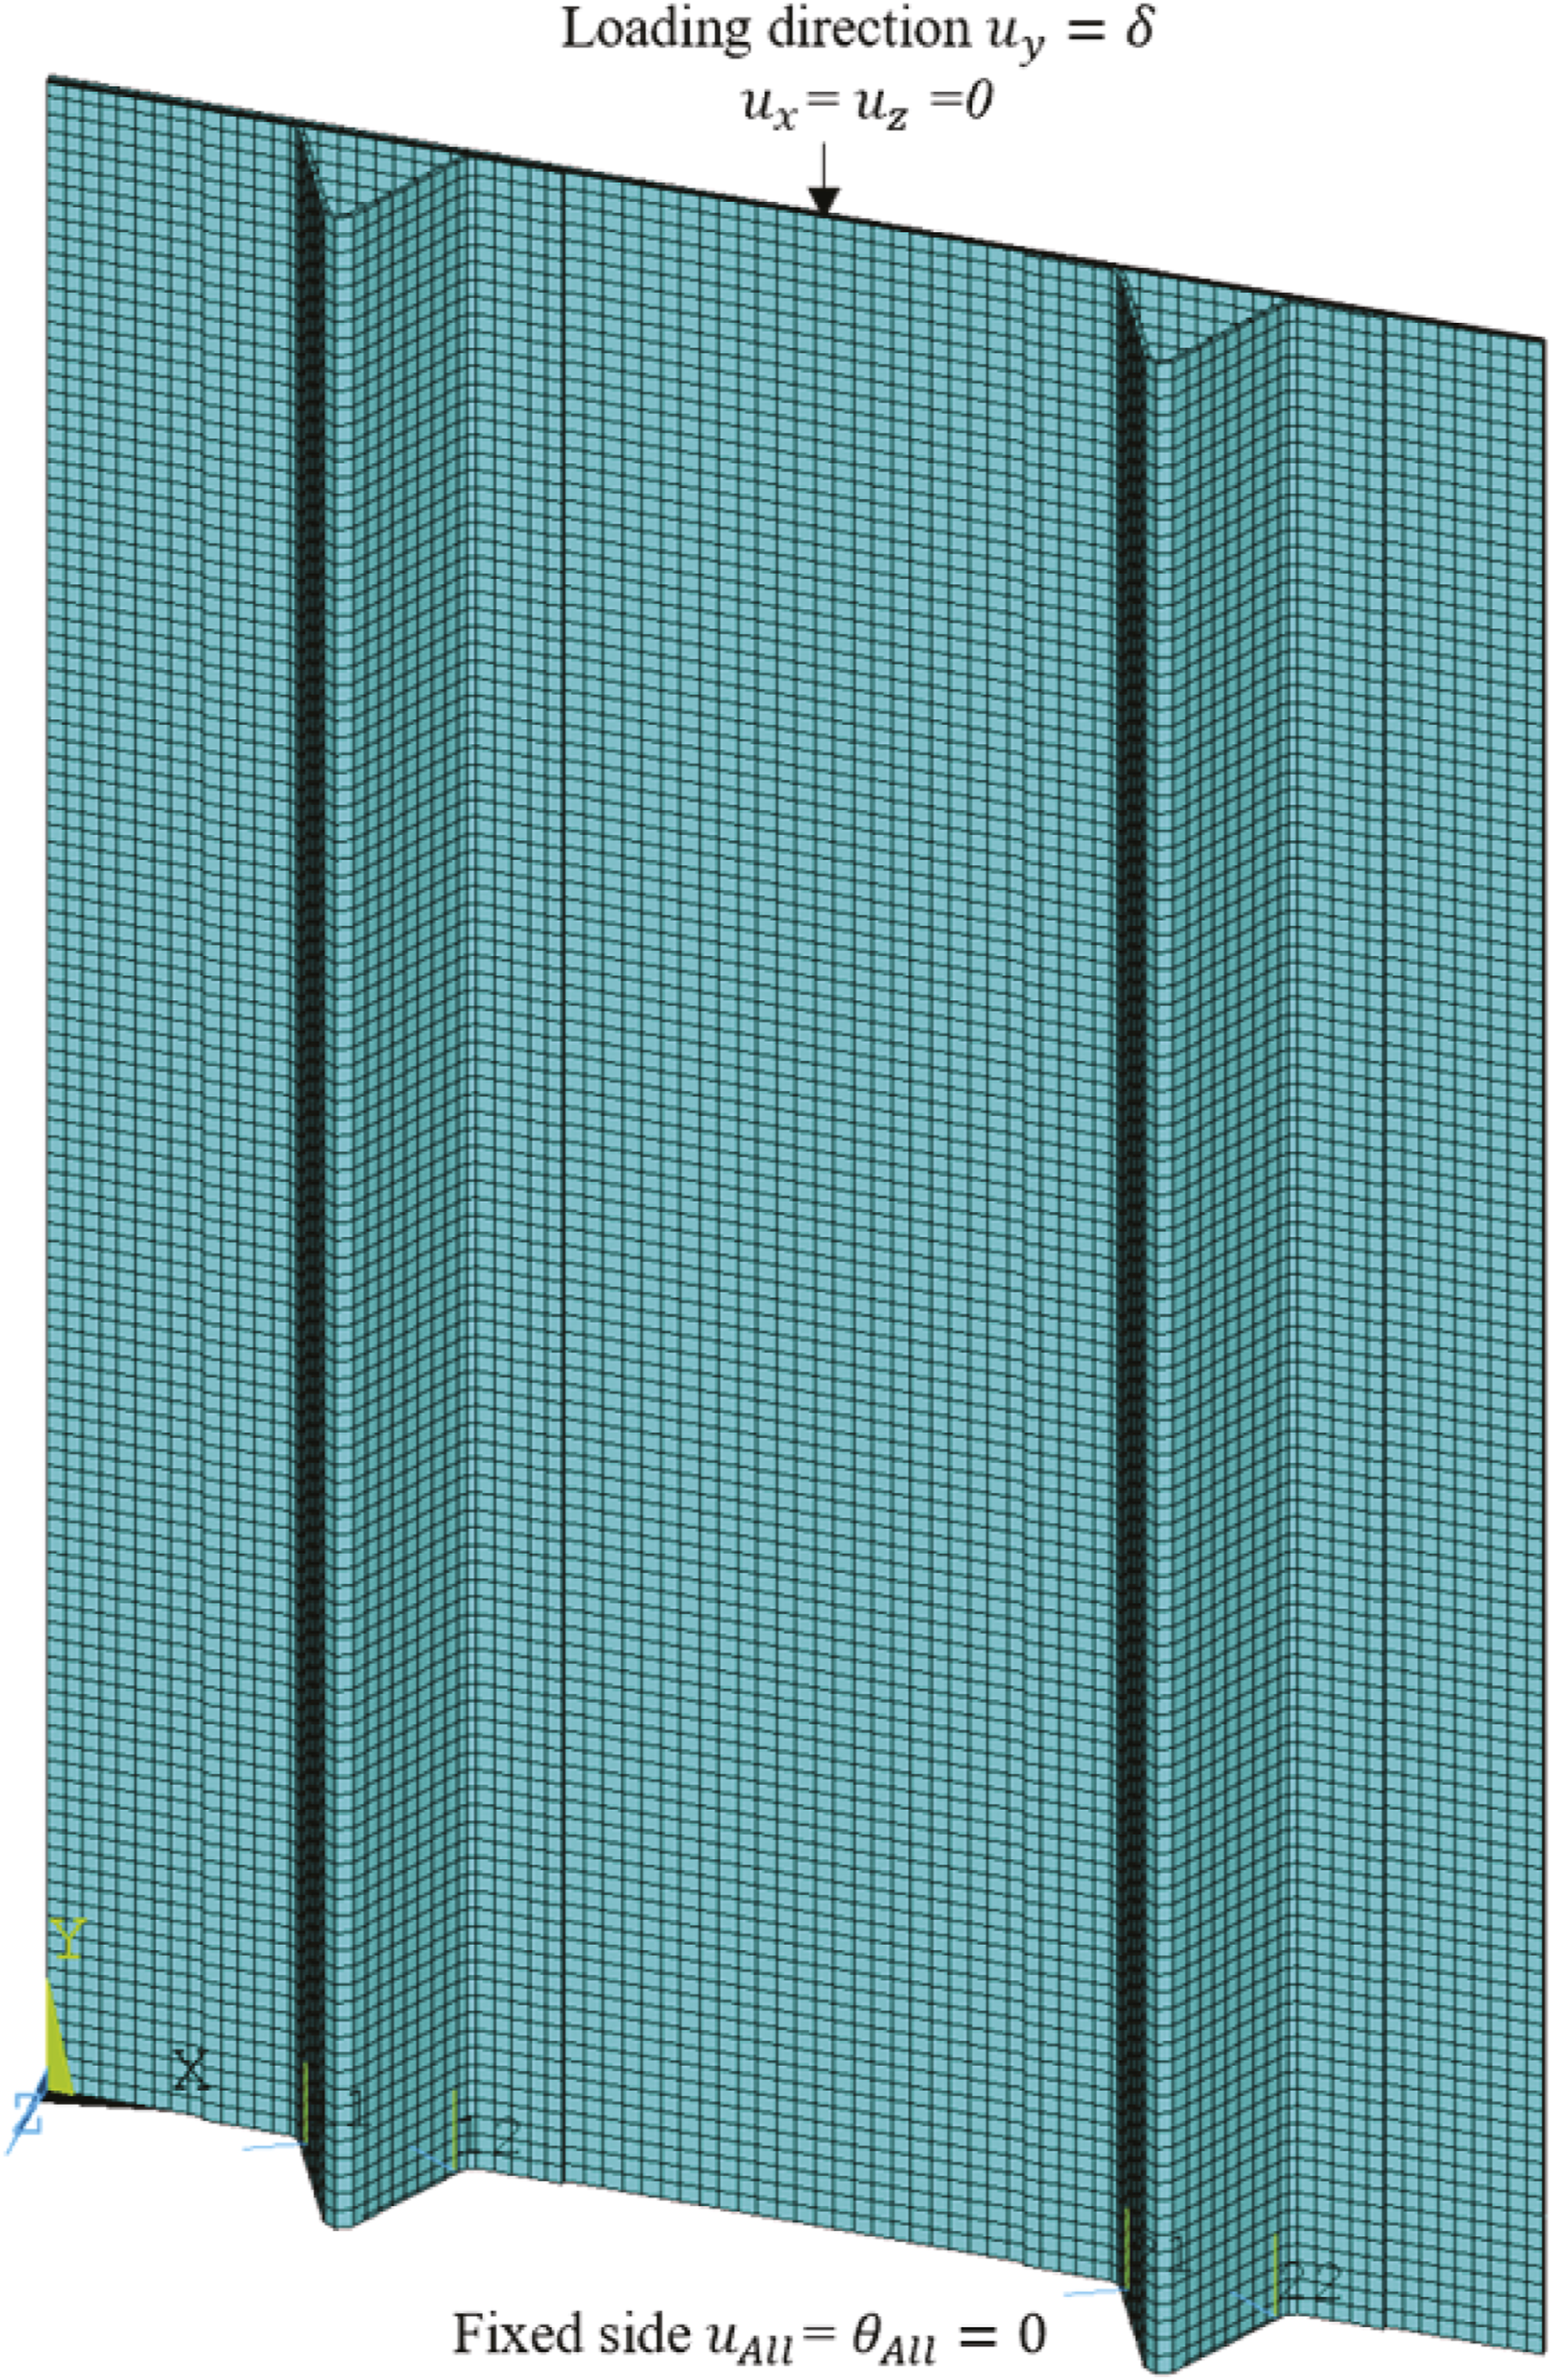
The numerical procedure followed for carrying out the post-buckling analysis is shown in the flow chart in Figure 11. Flaw chart of the proposed PDA.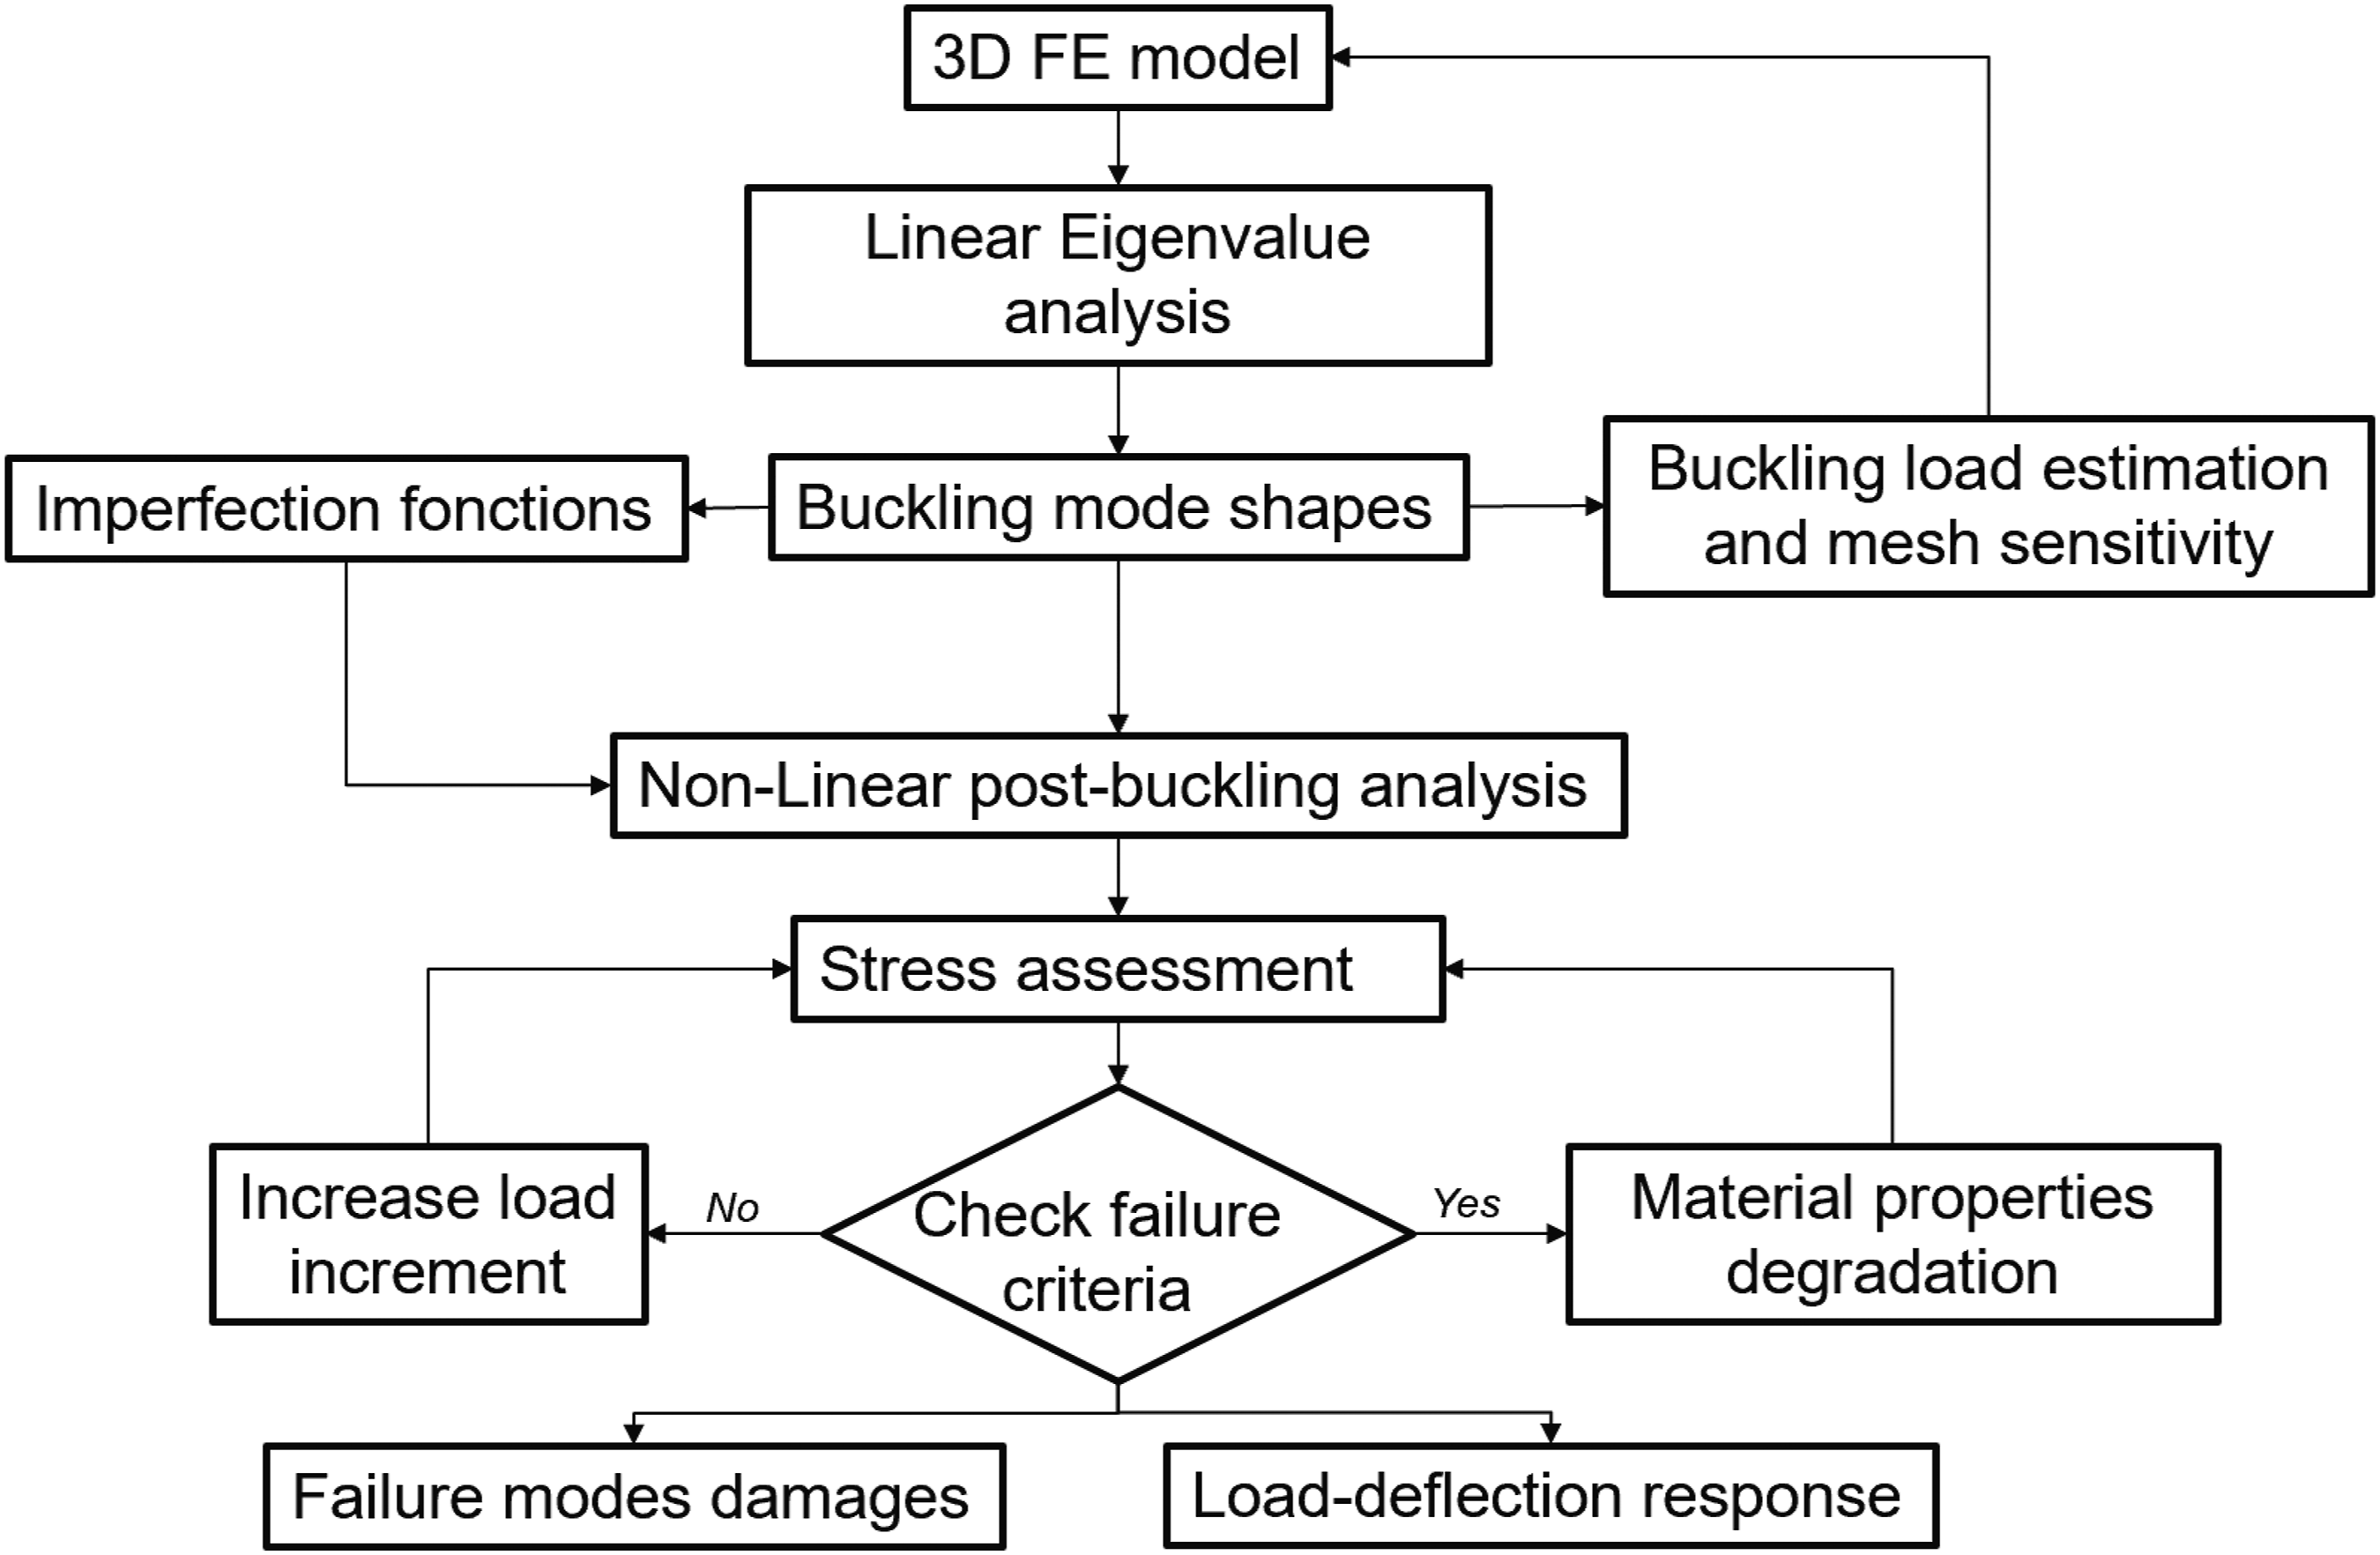
Experimental and numerical validation of the buckling and post-buckling behavior
Global field comparison
The load-displacement curve obtained from the FEM analysis is presented in Figure 12 together with the experimental responses. The comparison between the two results should take in consideration the accumulated damage during the successive runs. Thus, by comparing the FEM elastic phase to the first run, it is possible to observe comparable behaviour, with small shift between the two curves attributed to the sliding in the tabs. In the post-buckling phase, the numerical results exhibit higher stiffness than the experimental measurements which is expected due to the degradation of the material and other factors related to the fidelity of the FEM geometry. Regarding the characteristic loads, excellent matching is obtained for the buckling load. The predicted peak load for this panel is also well estimated at 170 kN, which is 4.5% lower than the 178 kN load obtained experimentally. Comparison of load versus displacement between finite element model and experimental results.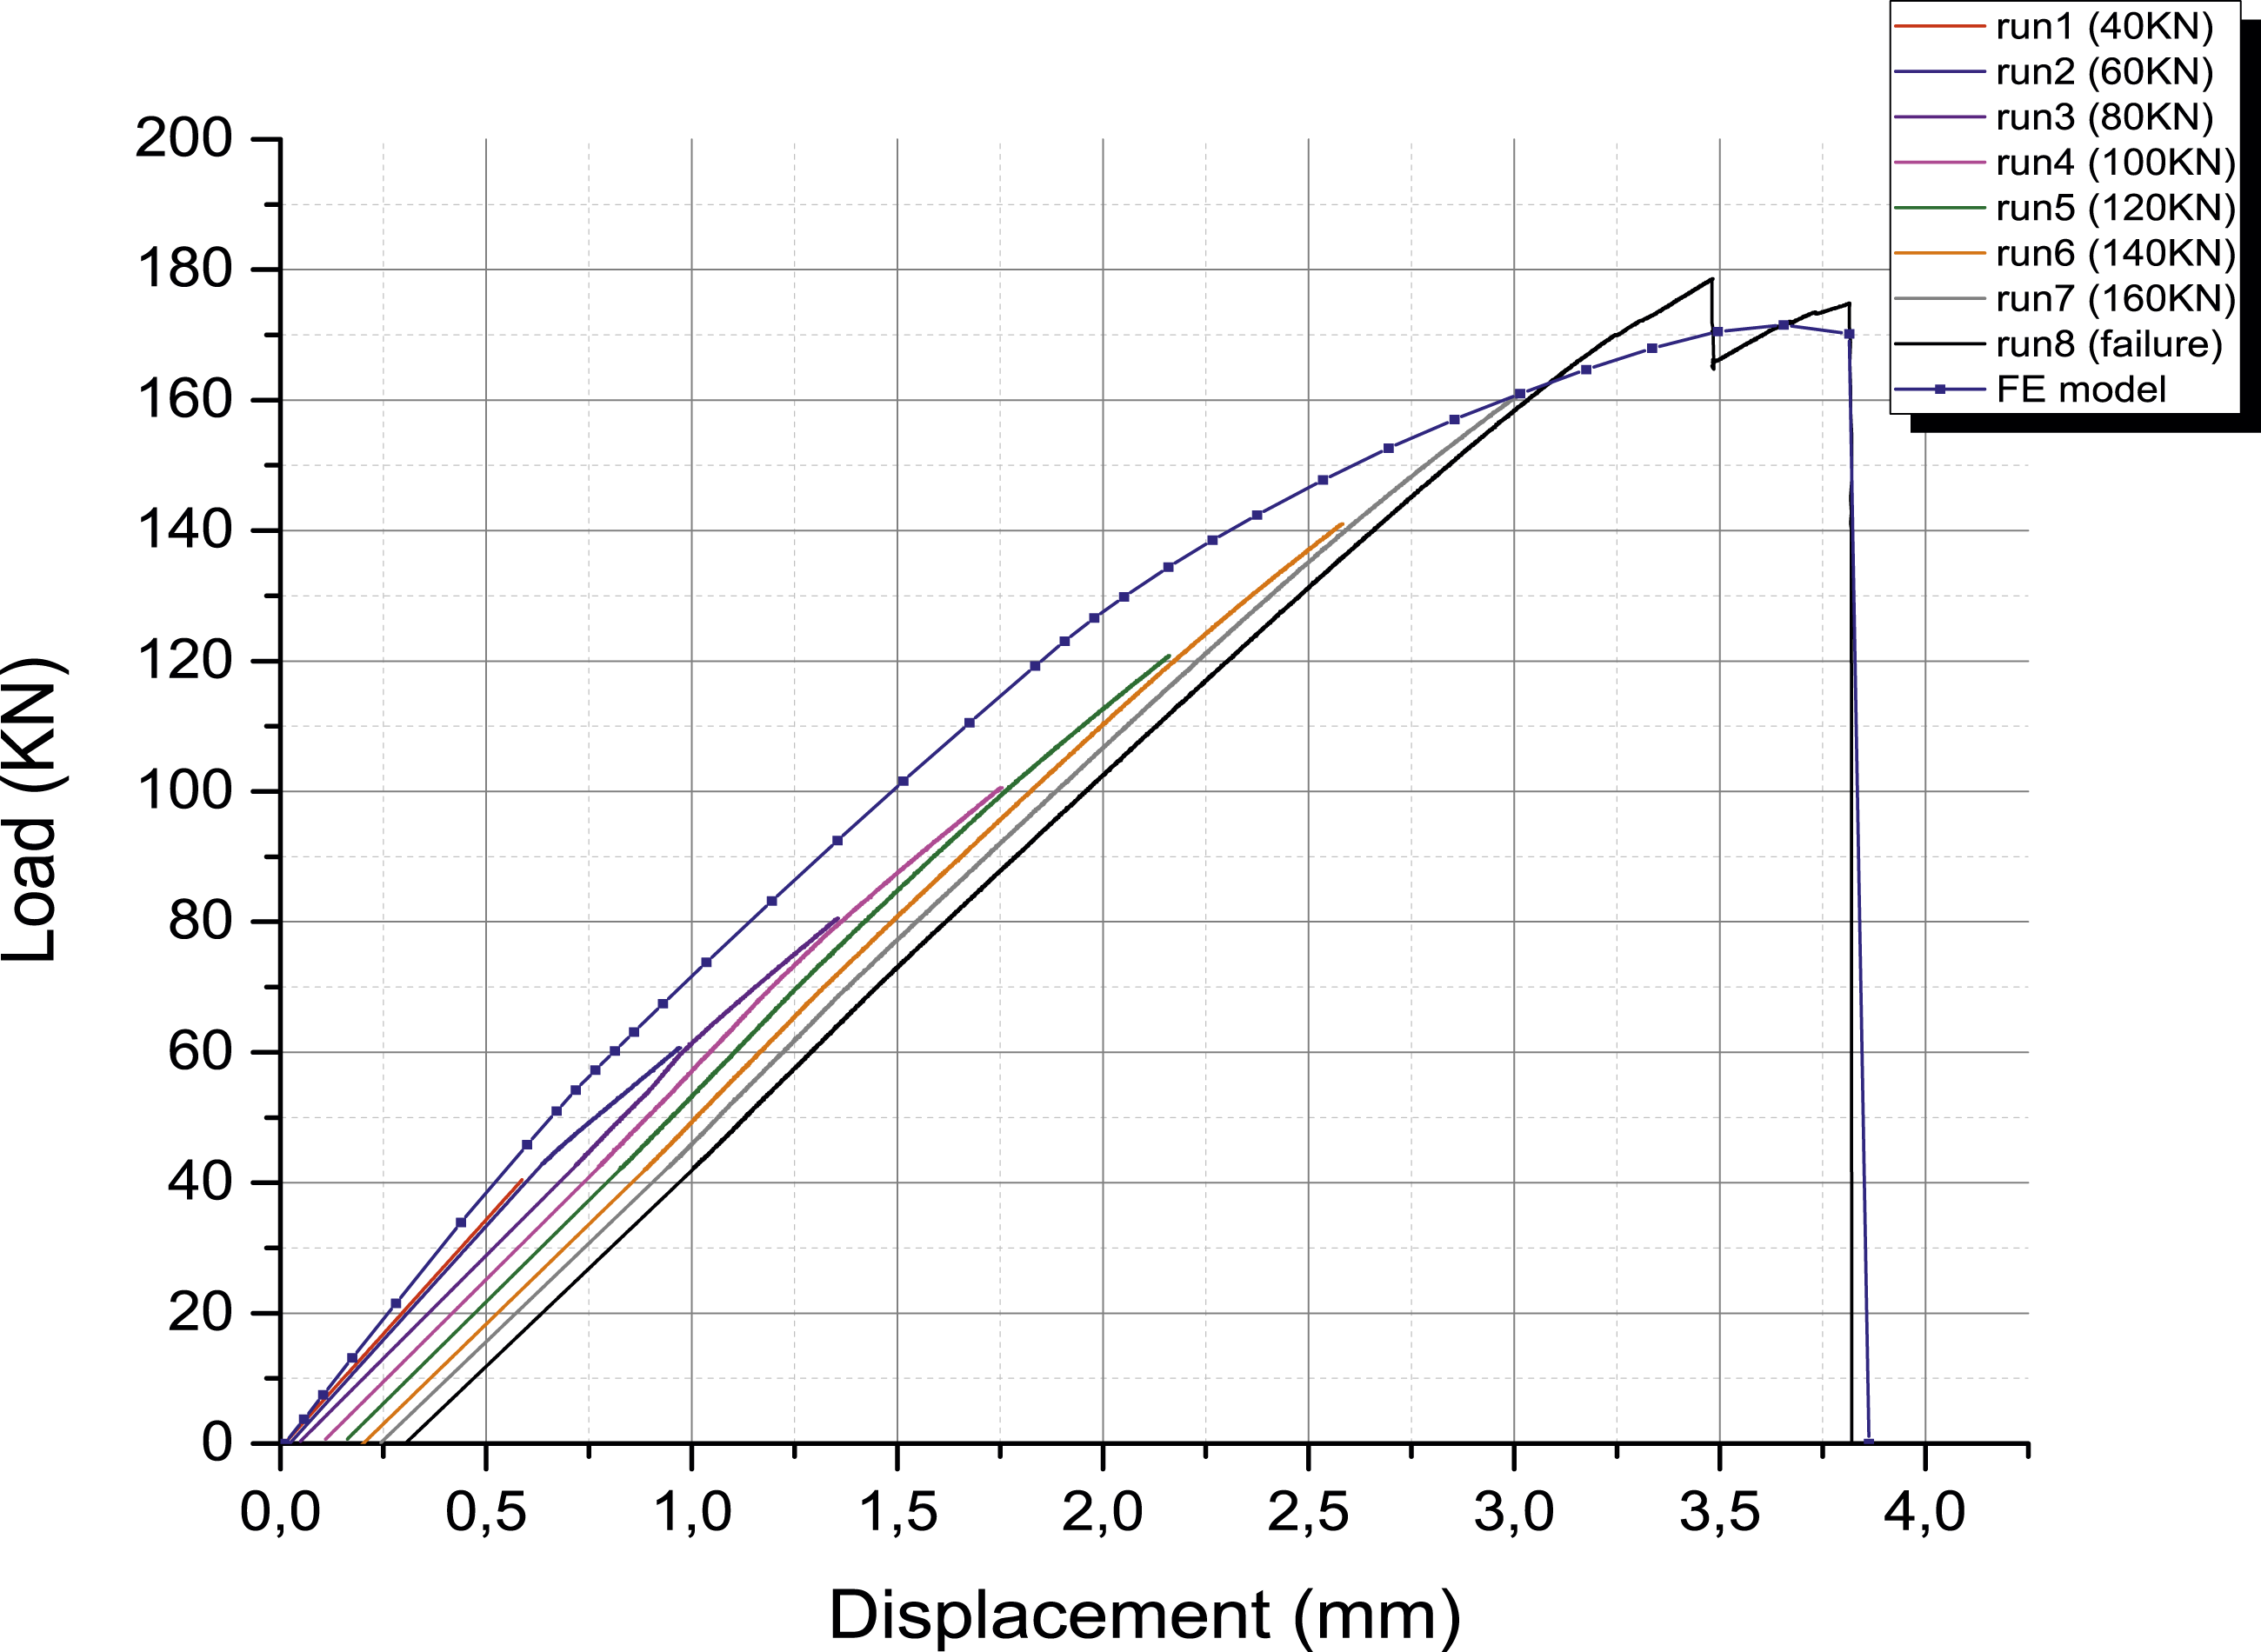
The different phases of the panel deflection, measured by the DIC from the last run, are compared with the corresponding FEM results. Consistent findings are observed, with qualitatively satisfactory matching throughout all the test, except some differences in the last stage prior the collapse. Indeed, as illustrated in Figure 13, it can be seen that the predicted buckling mode agrees well in terms of the number of half-waves and amplitude. Almost the same range of out-of-plane displacement is obtained by the FEM for the selected loading levels. The elastic step illustrated in the pattern in Figure 13(a) shows that the panel displays compression which remains in the plane until the load reaches the value of 43 kN. From this point onward, the panel starts to buckle following seven half-waves that affect the skin area between two stringers before spreading to the free edges (Figure 13(b)). When the load reaches the value of 150 kN, the FEM displays the first buckling signs affecting the stringers (Figure 13(c)). Despite this deformation, the stringers remain stable and continue to carry higher loads up to 170 kN before failing. The fact that the model does not consider the skin-stringer debonding is behind the deviation from the experimental profiles (Figure 13(d)). Experimental and numerical out-of-plane displacement field.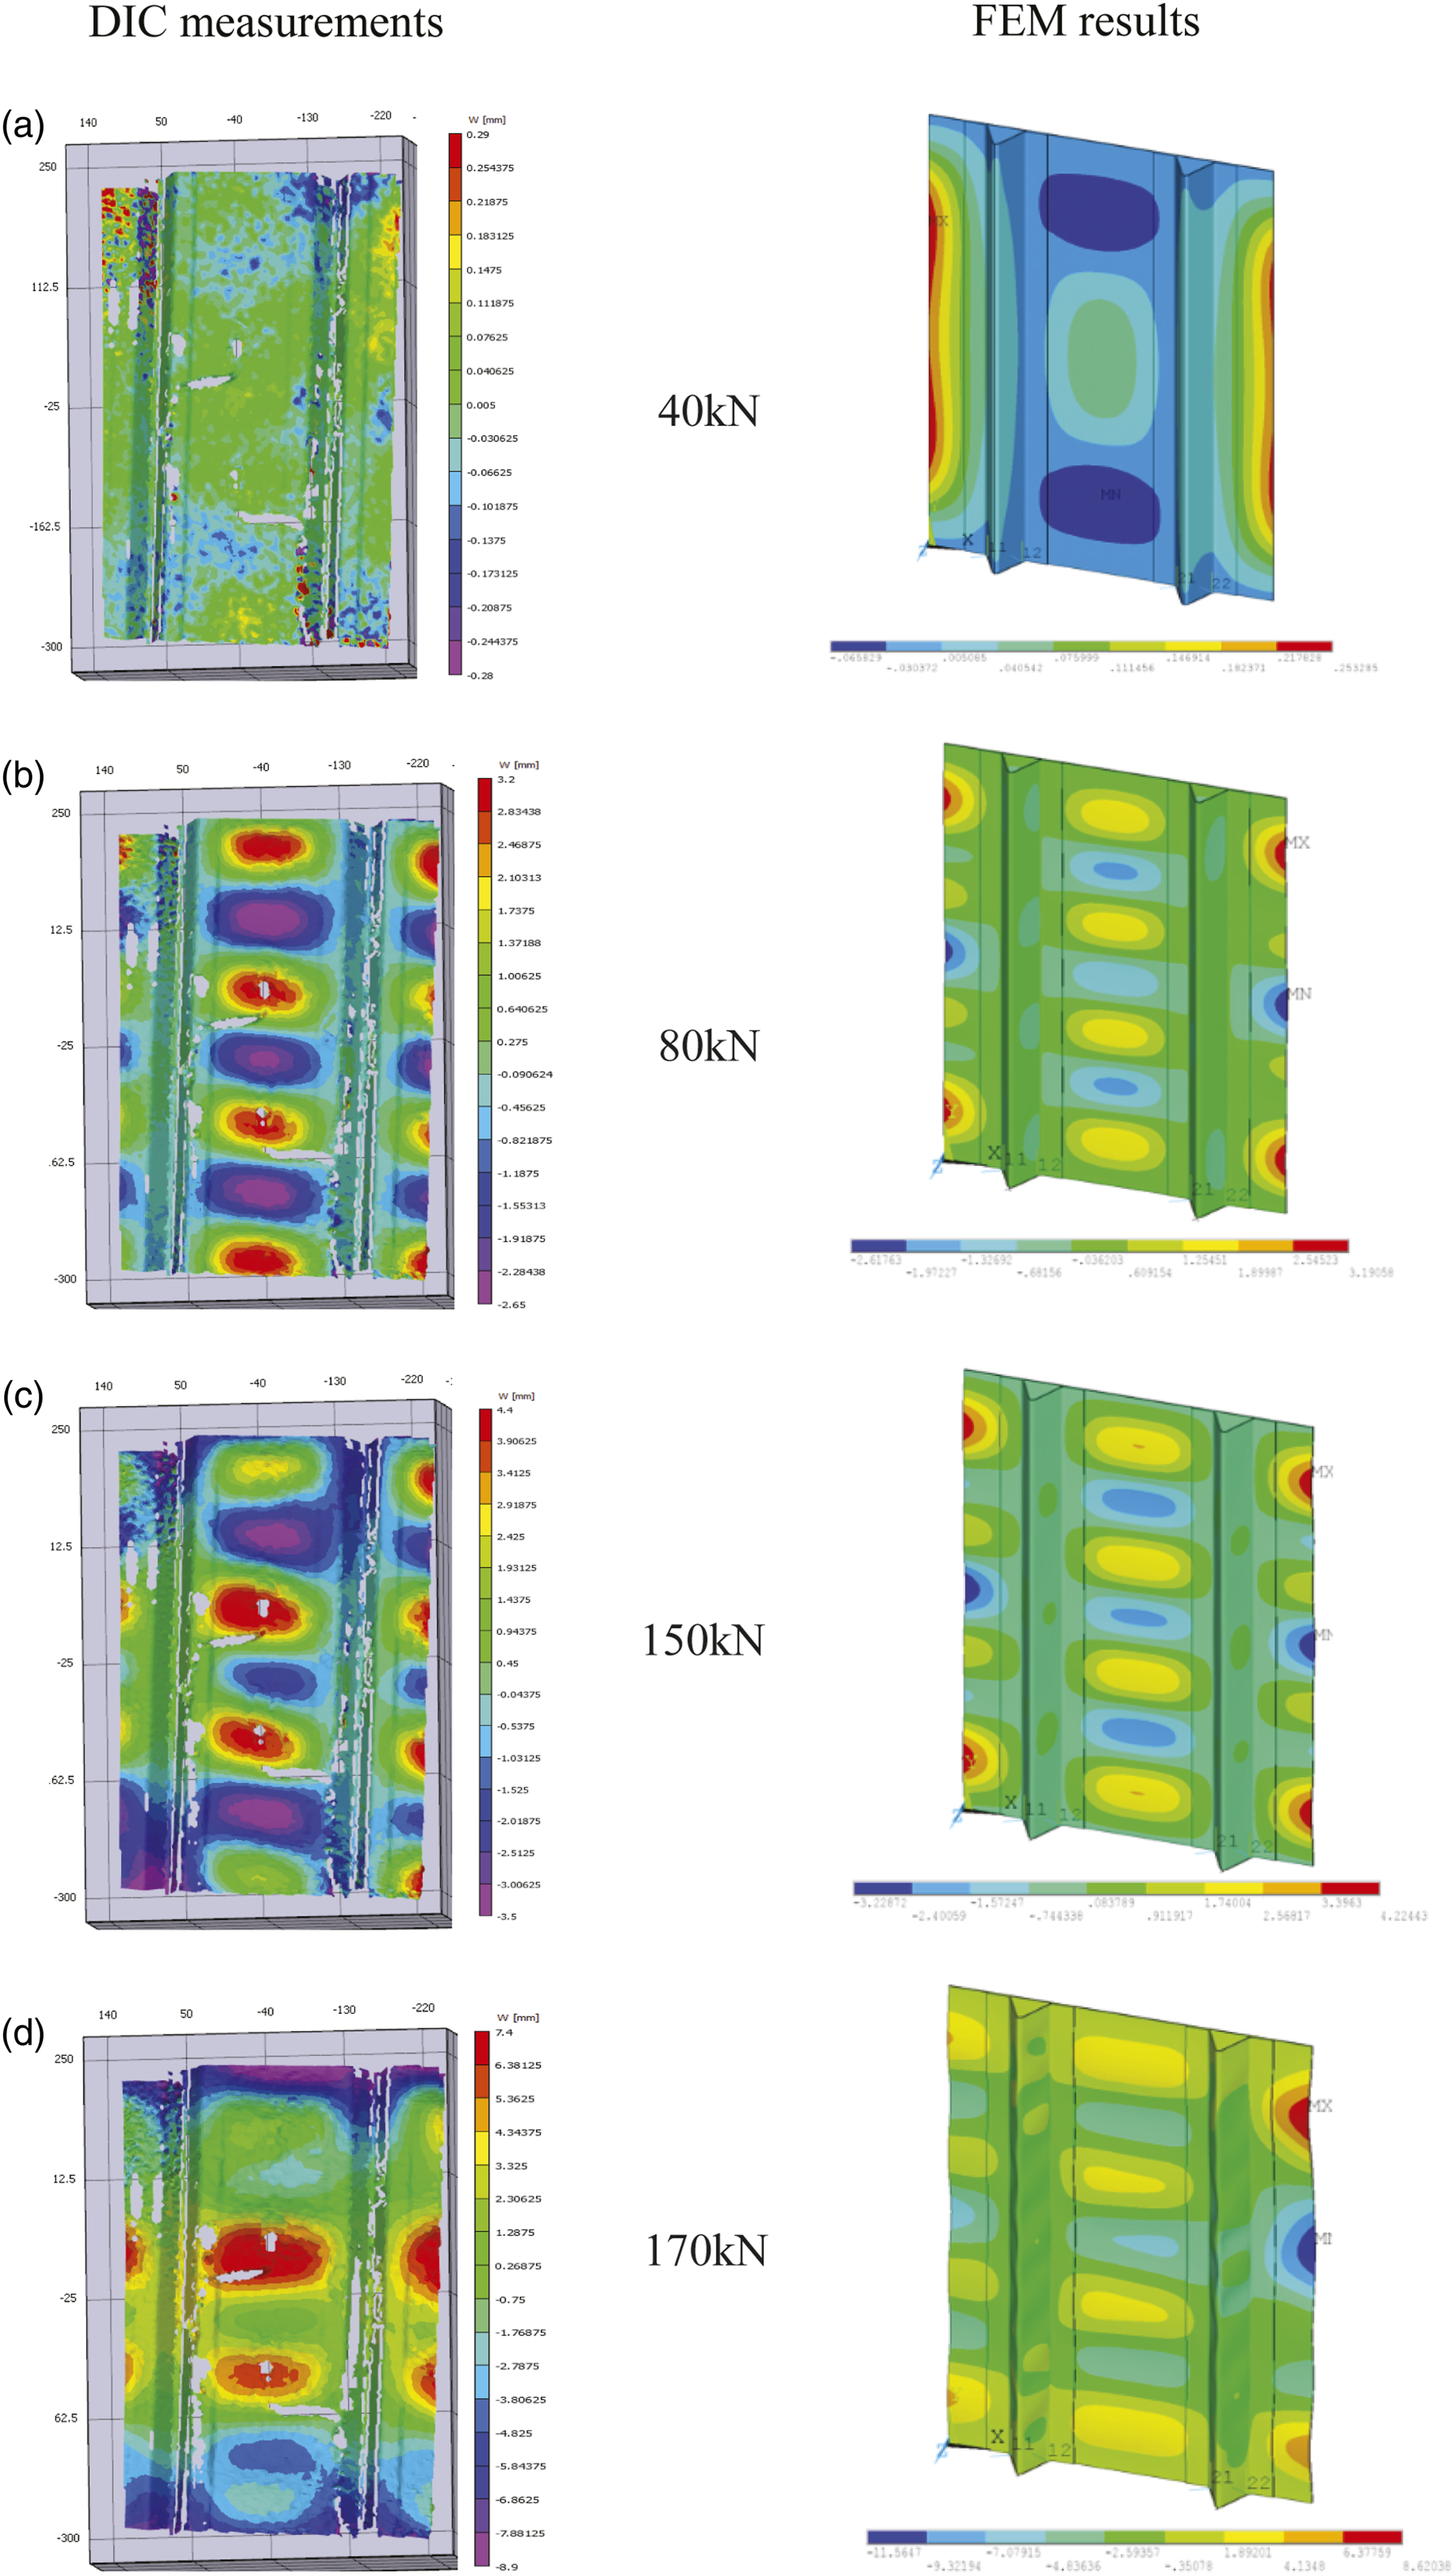
Local field comparison
In this section, the profiles of axial strain versus applied load registered during the last run are discussed and compared to the corresponding FEM results obtained from the same positions. In Figure 14(a), the two couples of strain gauges (SG2/SG7) and (SG5/SG8) placed back-to-back in the skin are displayed. Both strain gages show straight increase up to −700 με (43 kN) characterizing the elastic behavior of the panel before bifurcating during the buckling which affects the skin bay between the two stringers. These experimental measurements are in excellent agreement with the strain profiles determined from the FEM (solid dots). Load versus strain curves from computed and experimental: (a) in the skin, (b) in the flange, (c) in the web.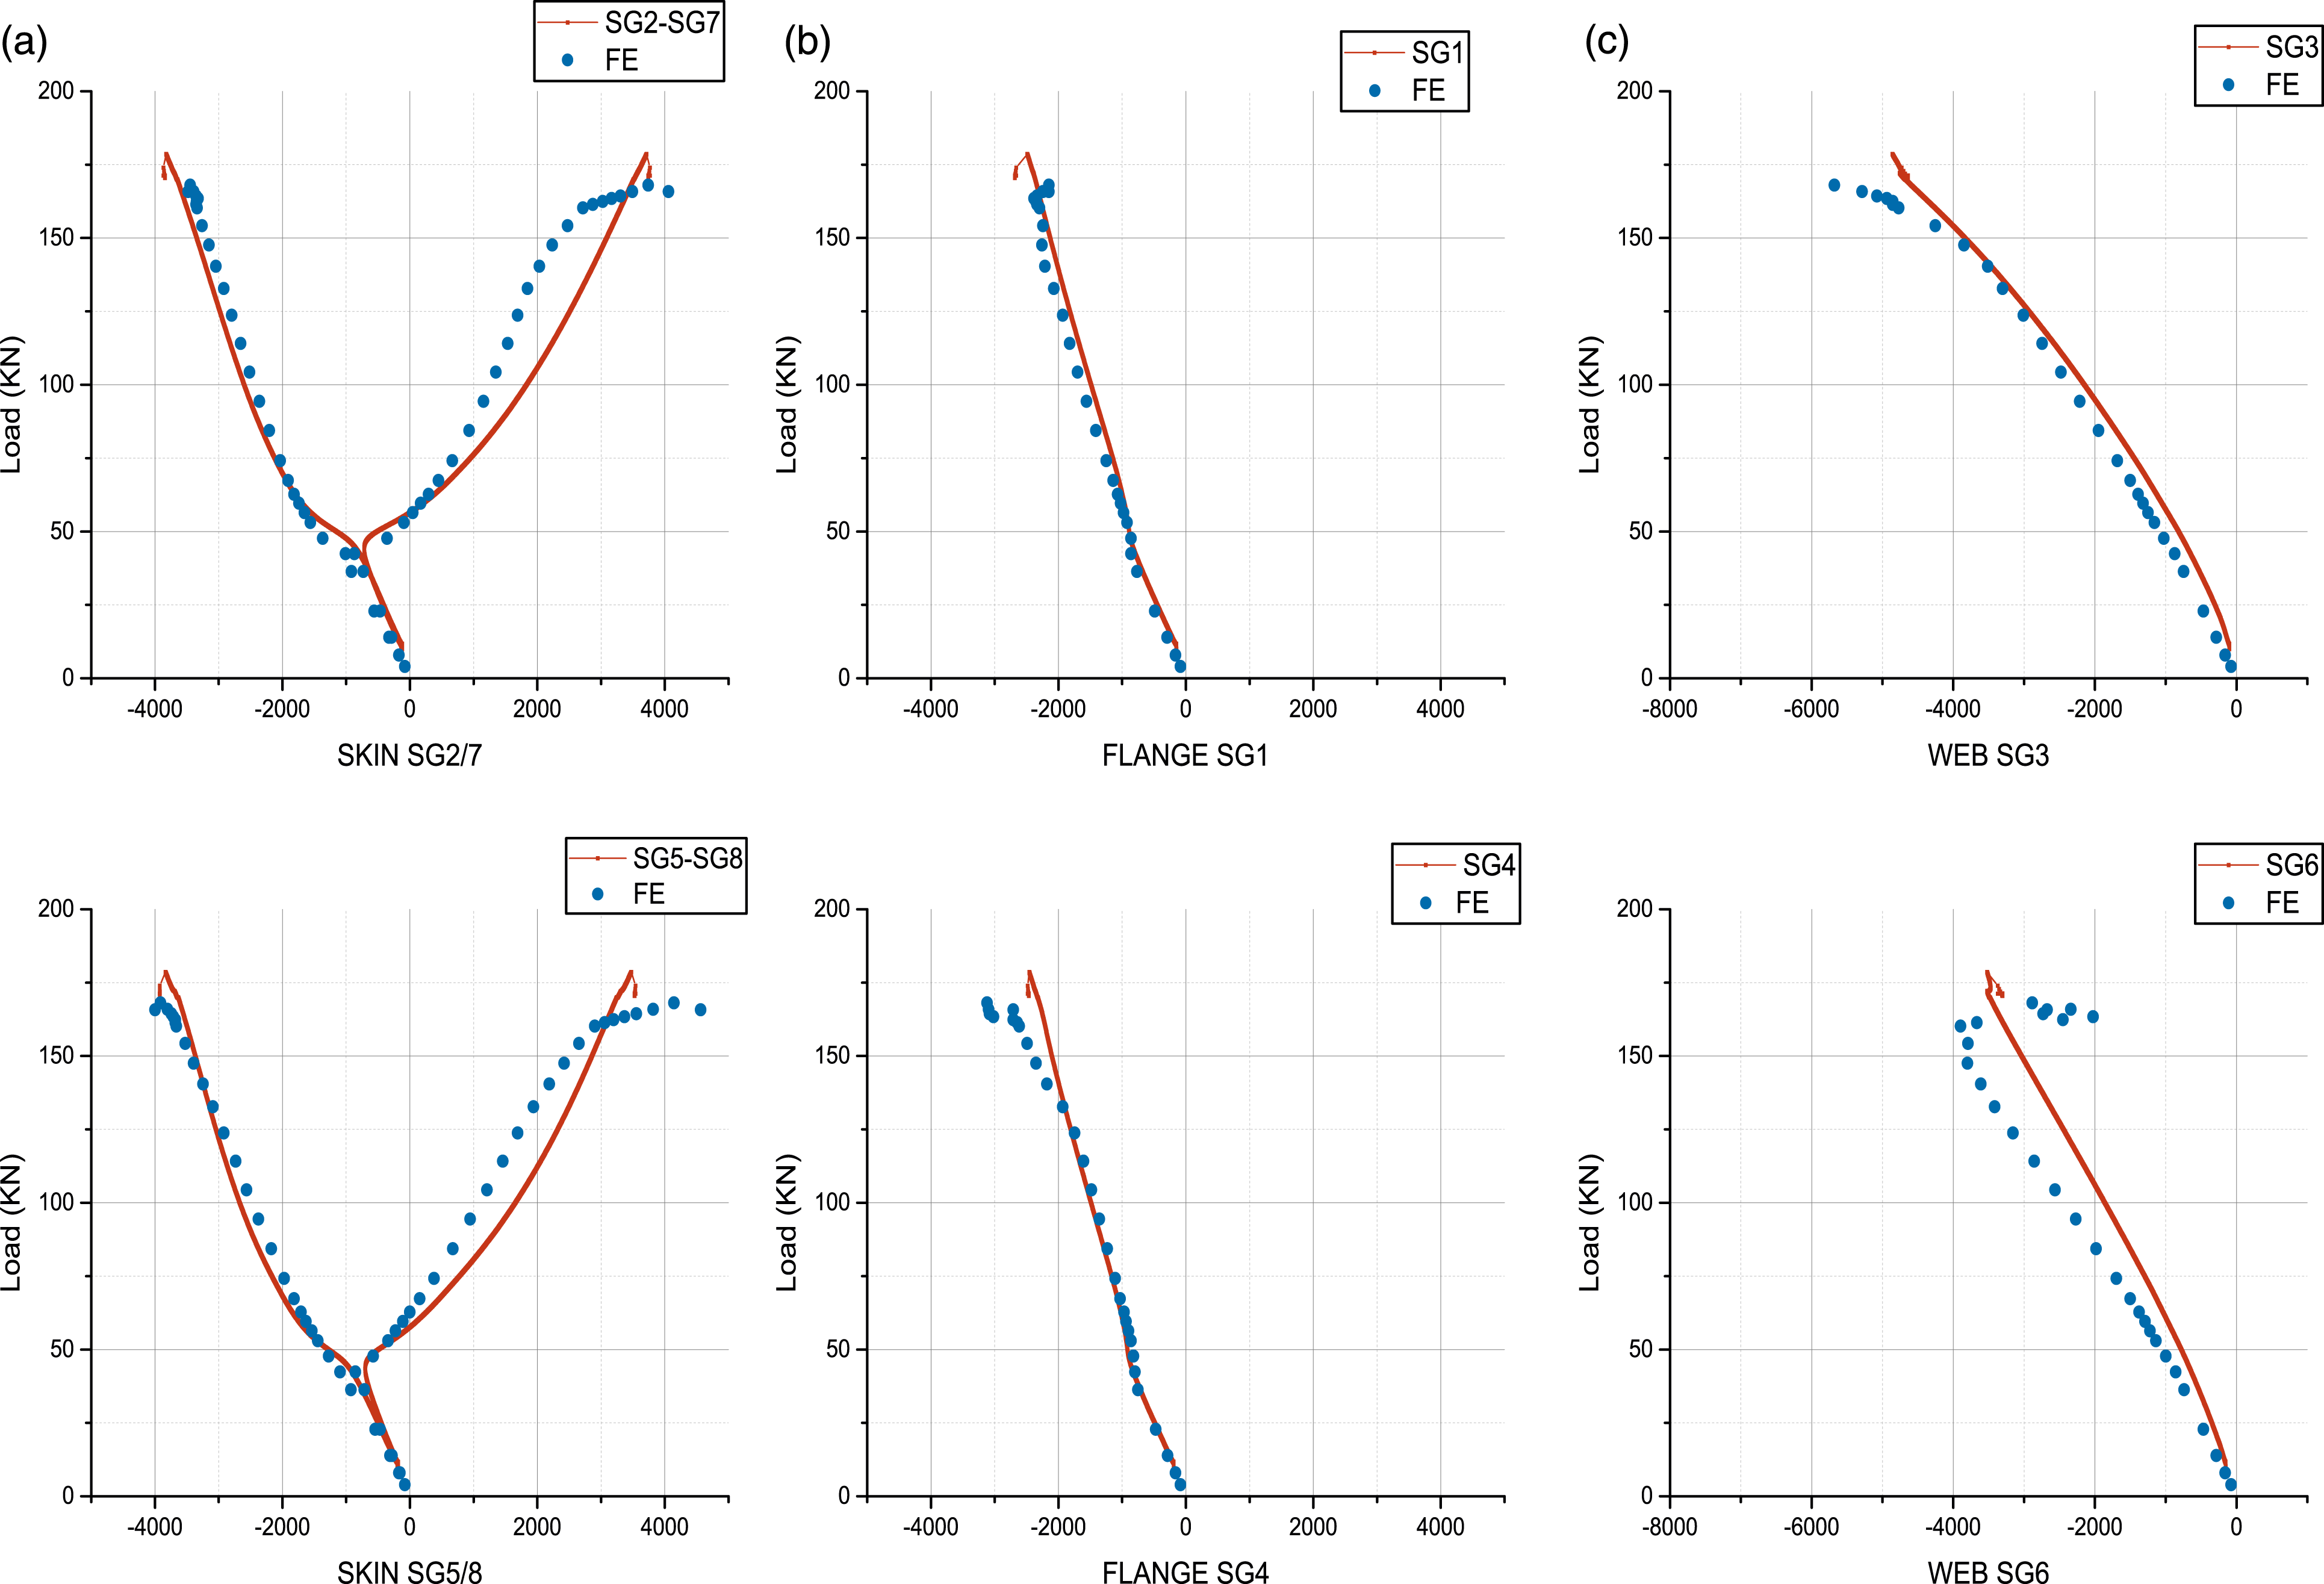
The strain profiles registered from the stringer flanges SG1 and SG4 presented in Figure 14(b), show a quasi-linear raise during all the loading process without the presence of any major deviation or bifurcation. Similar behavior is observed for the strain profiles determined in the stiffener’s webs by SG3 and SG6 (Figure 14(c)). These two finding suggest the absence of buckling phenomena affecting the two stringers.
In comparison, the numerical data show a good fit for the major load steps except the last stage marked by a deviation related to stringer buckling as explained previously. The mismatch in prediction the failing mode is primarily attributed to the non-consideration of skin stiffeners separation, other parameters like fabrication defect, imbalance load application may also promote specific mode over another. Thus, further tests can confirm the most likely scenario.
Progressive failure analysis
The results of the PFA are represented, for each integration point, by a scalar damage set of values that range from d = 0 for the undamaged state to d = 1 when the corresponding damage criterion is fulfilled (Table 3). The damage maps for matrix cracking, delamination, and fiber failure prior to the panel collapse are shown independently in Figure 15. FE post-buckling progressive failure map prior failure: (a) matrix cracking, (b) delamination and (c) fiber breakage.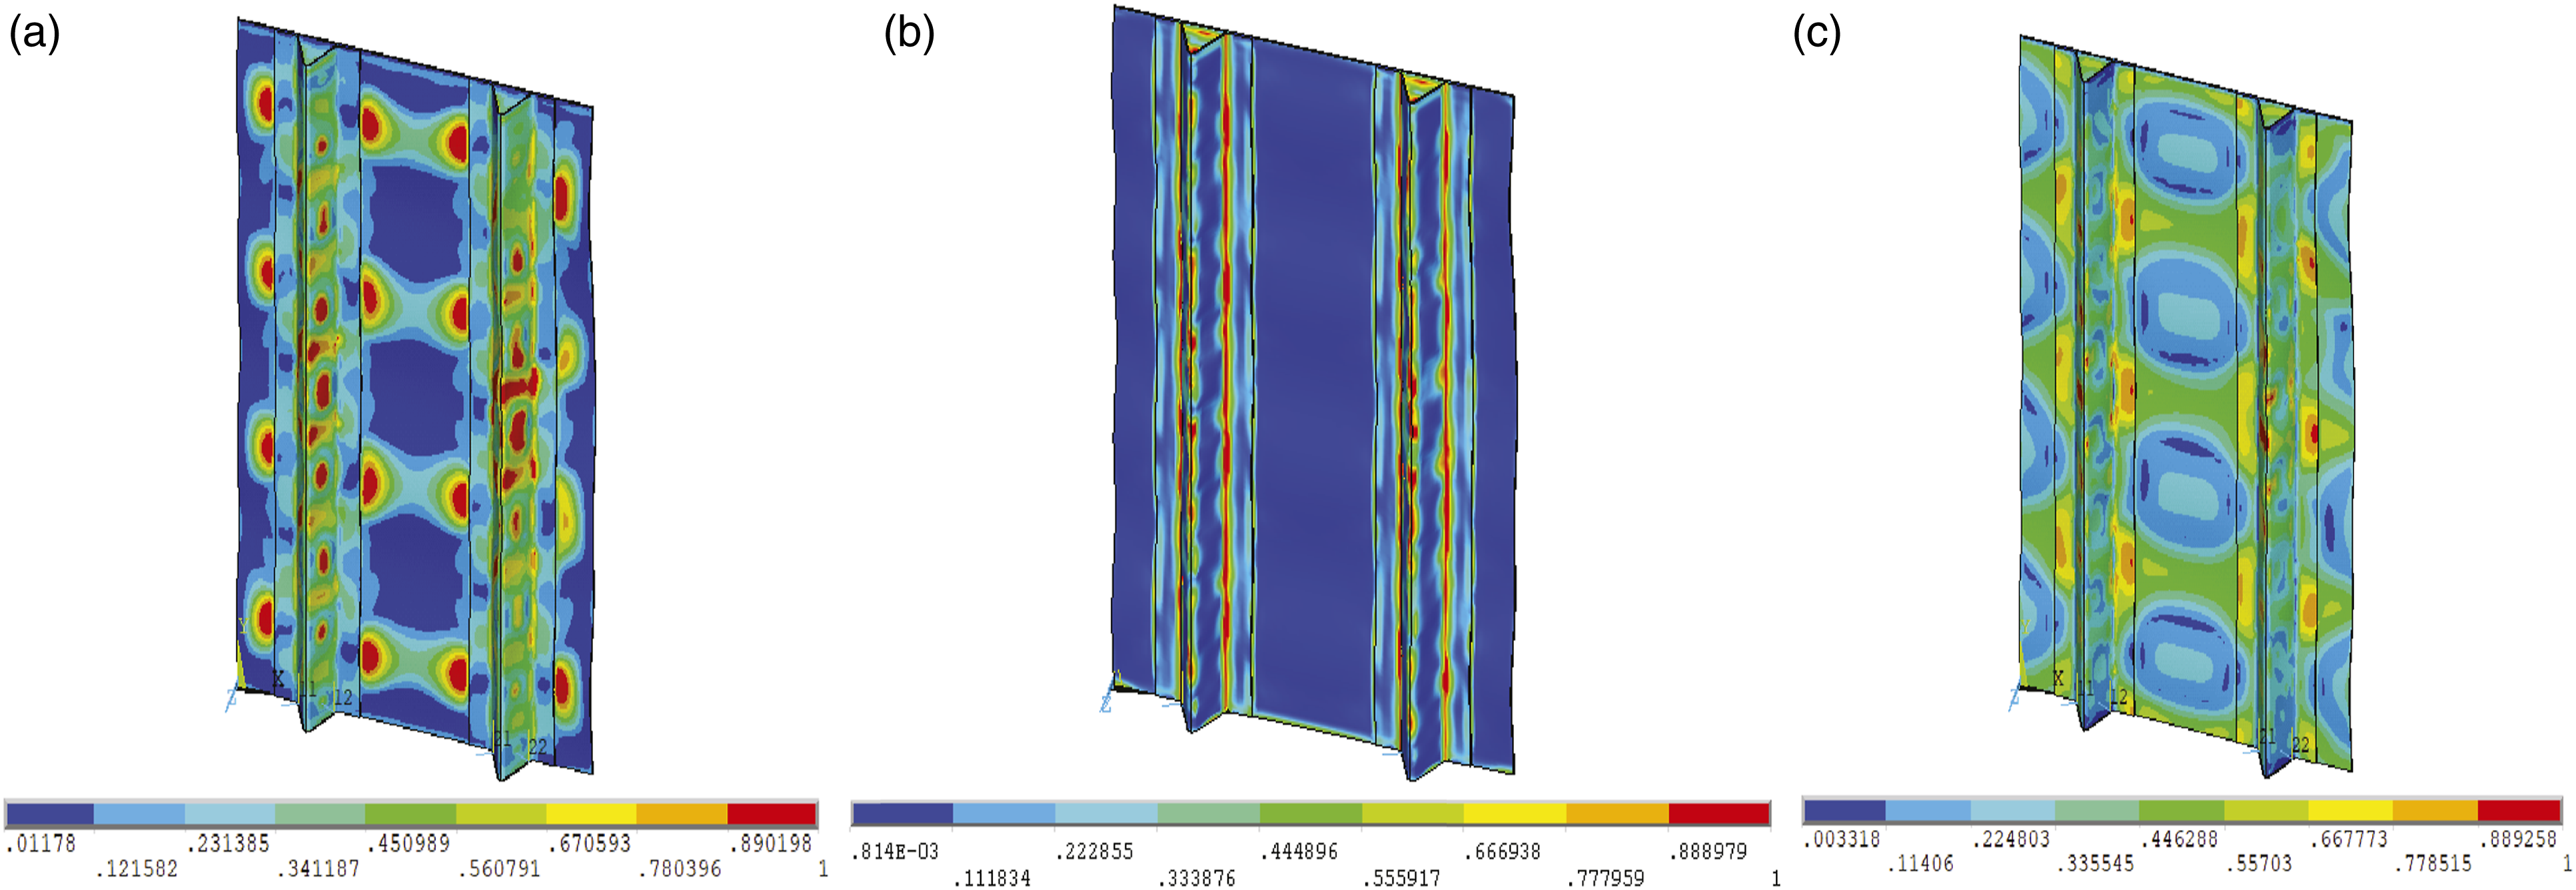
By analysing the damage index sequences versus applied load, the following damage sequences emerge. Firstly, matrix cracks appear at approximately 54 kN at the skin close to the edge of stringer foot. Thereafter, by increasing the loading, matrix damage spreads and affects larger area, especially the skin bay with large-deflection (Figure 15(a)). The delamination criterion was verified principally in the zones localized along the skin-stiffener boards and in the stringer’s corners (Figure 15(b)). These constatations agree with damage localization obtained in Experimental Results section by acoustic emission monitoring. At 150 kN and after the first sign of stringer’s buckling, the initial fiber failures are observed. Fiber breakage spots remains minimal but concentrated in specific web zones, which subsequently will generate the final collapse of the panel (Figure 15(c)).
Conclusion
In this study, experimental and numerical investigations were conducted to characterize the post-buckling damage developed in two stringers panel made by CFRP. The structure was tested under incremental compression loading, where the buckling response was evaluated using DIC and strain gages measurements. The continuous monitoring approach deployed with four AE sensors has allowed to identify the damage initiation and quantify its accumulation for each loading run. The evolution of cumulative counts has shown to be closely associated with the amount stiffness decreases obtained by the panel response. The localization of the sources has emphasised the sequence of damage spread and vulnerable spot according to applied load. Main EA events were found to be initiated along the stringers edges before becoming concentrated in the bay where skin-stiffener debonding occurred in the experimental test. The application of AE unsupervised clustered strategy yielded two classes: the first class is correlated to micro and matrix cracks, while the second one, with the dominant population, is attributed to interlaminar delamination.
Moreover, the FE model developed based on PFA and using an in-core subroutine has shown excellent capability in predicting panel strength and characteristic loads. The deflection shape and out of plane displacements are also in good agreement with experimental results for most of the loading range. This model could be enhanced by considering interface model and by characterizing the interlaminar toughness. Additional tests are also suggested to verify whether these mechanisms are generic.
Footnotes
Declaration of conflicting interests
The author(s) declared no potential conflicts of interest with respect to the research, authorship, and/or publication of this article.
Funding
The author(s) disclosed receipt of the following financial support for the research, authorship, and/or publication of this article: This research was supported by the Natural Sciences and Engineering Research Council of Canada (NSERC) through the framework of the Consortium for Research and Innovation in Aerospace in Québec (CRIAQ).