
Abstract
The morphology, crystallinity, and electrical conductivity (σ′ and σ″) as a function of frequency of polypropylene (PP) melt-extruded with different amounts of as-grown carbon nanofibers (CNFs) from 0 to 1.4 vol. % are examined. The PP/CNF composites present CNF aggregates randomly distributed within the PP and an insulator–conductor transition at CNF contents near 0.9 vol. %. The degree of crystallinity of PP/CNF composites with loadings of 1.4 vol. % increases ∼15% with respect to the neat PP (∼34%), with σ´ ∼ 8.6 × 10⁻⁵ S m−1 (σ″ ∼ 8.3 × 10⁻⁴ S m−1) at 2 MHz. In addition, the values of the electrical conductivity σint´ ∼2.9 × 10⁻⁶ S m−1 (σint″∼3.7 × 10⁻⁴ S m−1) at 2 MHz, as a result of the interphase (ϕint ∼0.05 vol. %) of the 1.4 vol. % PP/CNF composites, are estimated by the use of a modified generalized effective medium model (GEM). The analysis gathered in here indicates that the interphase between the polymer and the conducting particle may have a quantifiable effect on the electrical properties of carbon-based polymer composites, and this fact should not be neglected in the production of conducting polymer composites (CPCs) with enhanced electrical properties.
Keywords
Introduction
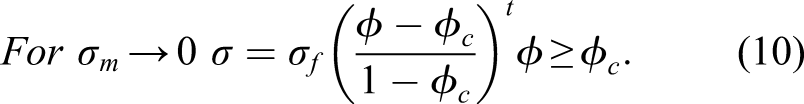
The investigation of insulating polymers filled with carbonaceous conductive materials such as carbon black (CB), 1 carbon nanotubes (CNTs), 2 graphene derivatives, 3 etc., have attracted much attention due to their numerous applications, which include from sensors, 4 energy harvesting, 5 energy storage 6 to high DC voltage cables 7 and electromagnetic radiation shielding, and interference (EMI) materials. 8 Among carbonaceous conductive particles, vapor-grown carbon nanofibers (CNFs), produced by chemical vapor deposition (CVD) of catalyst nanoparticles under a mixture of gaseous hydrocarbons, are an interesting choice due to their high aspect ratio combined with low density, chemical and thermal stability, and ease of production in large quantities, which significantly reduce their costs. 9 This type of carbon structures have shown diameters in the range of 50–200 nm, hollow cores of 30–90 nm, and lengths of 50–100 μm. 10 It is well known by the percolation theory that the conducting polymer composites (CPCs) display a sudden jump in the electrical conductivity (σ) as the content of carbon fillers exceeds a certain critical value, known as the electrical percolation threshold (ϕc). 11 Thus, the dependence of σ on the content of the carbon filler (ϕ) is expressed as σ α (ϕ − ϕc)t for ϕ > ϕc, where t is a critical exponent, which is assumed to be universal, and it depends on the dimensionality of the system. 12 Despite this simplified model estimates quite well the σ of CPCs based on carbon nanostructures, 2 the accurate analysis of the electrical conductivity in such type of polymer composites is not completely achieved yet. 13 For instance, the above approach does not take also into account some important particularities such as the processing method, the carbon filler shape, the polymer–filler interaction, and the resistance contact between carbon fillers, which cause that the exponent t is not universal as expected by that model. 14 Accordingly, other models have been proposed to explain the electrical properties of conducting composite materials such as the models based on the effective medium theories (EMT). 15 However, the models derived by the EMT often fail when, for instance, the CPCs achieve high values of σ. 16 Thus, several attempts such as the generalized effective medium model (GEM) developed by McLachlan, which is a direct combination of the EMT with the percolation theory, were proposed to overcome some of the above-described shortcomings. 17 Moreover, despite the good agreement with experimental data, the physical parameters provided by the GEM normally results also dependent on the particular type of CPCs analyzed. 18 It is in this context that we have undertaken this study, which complements a former study focused on the dielectric spectroscopy analysis at room temperature of melt-extruded polypropylene (PP) with as-grown CNFs by the universal power laws (UPLs). 19 In the present work, the AC electrical conductivity at room temperature of the same type of PP/CNF composites is used to test the validity of the GEM model. Moreover, the potential of a modified GEM 20 that takes into consideration the effect of the interphase between the CNFs and the PP is also examined. It is observed that the modified GEM presents a good agreement with the experimental measurements, from which the values of the volume concentration and complex electrical conductivity corresponding to the interphase of the PP/CNF composites could be estimated over the range of frequency analyzed.
Experimental details
Materials
The constituent materials were polypropylene (Borealis EE002AE) and PR 25 AG carbon nanofibers in the form of powder (Applied Sciences, Inc.). The CNFs, grown catalytically from gaseous hydrocarbons using metallic catalyst particles, 21 were used as received without any further chemical modification. They are characterized by presenting a structure composed of a graphitic tubular core surrounded by a stacked-cup inner layer followed by a pyrolytic hydrocarbon outer layer. 22 It is noted that this particular CNF grade is synthesized in as-grown condition without the utilization of any postprocessing method. Morphologically, the CNFs show hollow core diameters in the range of 30–90 nm, total diameters of 100–200 nm, and lengths of 30–100 μm,22,23 with conductivities of 103 S m−1. 23
Processing method
The PP/CNF composites with six CNF volume concentrations from pristine melt-extruded PP to 1.4 vol. % were prepared on a modular laboratory-scale intermeshing mini, co-rotating twin-screw extruder, with a screw diameter of 13 mm, barrel length of 31 cm, and an approximate L/D ratio of 26, coupled to a cylindrical rod dye of approximately 2.85 mm of diameter. A detailed description of the melt extrusion conditions has been previously published. 24 After extrusion, the PP/CNF composites were compression-molded into specimens with the appropriate geometries for the specific characterization. In particular, squared films of dimensions 10 × 10 mm2 and thickness of 0.5 mm with Au electrodes deposited on both sides by thermal evaporation were used for the AC electrical testing.
Characterization
An Olympus BH2 transmittance light microscope was used to observe first the microstructure of the PP/CNF composites. The analyzed samples were cut into rectangles of 4 × 2 mm and 10 μm in thickness using a sliding Leitz 1300 microtome equipped with a glass slicing knife. The samples were placed between the microscope glass slide and a cover glass. Canada balsam glue (Alfa Aesar, CAS#8007–47-4) was used to prevent curling up or corrugating. All samples were cured under convenient pressure prior to analysis. The morphological characterization and the CNF dispersion within the PP were examined in high vacuum mode (<10−5 mbar) by using a FEI Quanta 400 W scanning electron microscope (SEM) at an accelerating voltage of 30 kV with an extra 25–30° tilt. The cross sections of the composites were cryo-fractured in liquid nitrogen. The surfaces were sputter-coated with 3 nm of gold prior to the analysis. The X-ray diffraction (XRD) data were collected at room temperature by a PANalytical X’Pert Pro diffractometer, equipped with X’Celerator detector and secondary monochromator in θ/2θ Bragg-Brentano geometry. The measurements were carried out using a Cu–Kα radiation (λα1 =1.54,060 Å and λα2 = 1.54,443 Å) 40 kV and 30 mA, at a resolution of 0.017° per step, with a 100-s integration per step, over the range 2θ=10–60°. Differential scanning calorimetry (DSC) tests were performed using a Mettler–Toledo DSC822 instrument (Giessen, Germany) in a nitrogen atmosphere. In the nonisothermal experiments, the specimens were heated from 25°C to 190°C at a rate of 10°C min−1 to eliminate any previous thermal history and then cooled down to 25°C at a rate of 10°C min−1. Following this, the samples were heated to 190°C at the same rate of 10°C min−1.
The direct current conductivity σDC at room temperature was performed using an experimental setup composed by a picoammeter Keitheley model 6487 and a digital control DC power supply TENMA model 72–10,495 as described in a previous work
19
. The capacitance (C) and dielectric losses tan δ (w) at room temperature were measured by using a Quadtech 1929 LCR precision meter at frequencies (f) between 430 Hz and 2 MHz, with an applied signal of 0.5 V. The real ε′(w) and the imaginary ε″(w) parts of the complex dielectric permittivity ε(w) were calculated by the equations
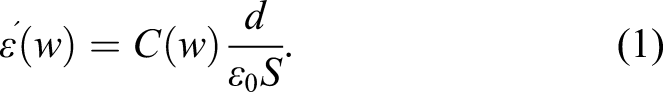

The parameters d and S are the thickness and the surface area of the squared films, respectively,


Results and discussions
Morphologic, X-ray diffraction and Differential scanning calorimetry analysis
The micrographs corresponding to the transmittance light microscope of the PP/CNF composites with 0.2, 0.5, 0.9, and 1.4 vol. % of CNFs are illustrated in Figure 1. The emergence of agglomerate results is evident from the first lowest CNF loadings of 0.2 and 0.5 vol. % (Figures 1(a) and (b)), though the biggest aggregate with a length of more than 50 μm is observed for samples with CNF loadings of 0.9 vol. % (Figure 1(c)). Interestingly, the presence of higher number of agglomerates in the sample with the highest content of CNFs 1.4 vol. % (Figure 1(d)) could promote the formation of the necessary paths for electric conduction. Optical transmission micrographs of PP/CNF composites with 0.2 vol. % (a), 0.5 vol. % (b), 0.9 vol. % (c), and 1.4 vol. % (d) of CNFs.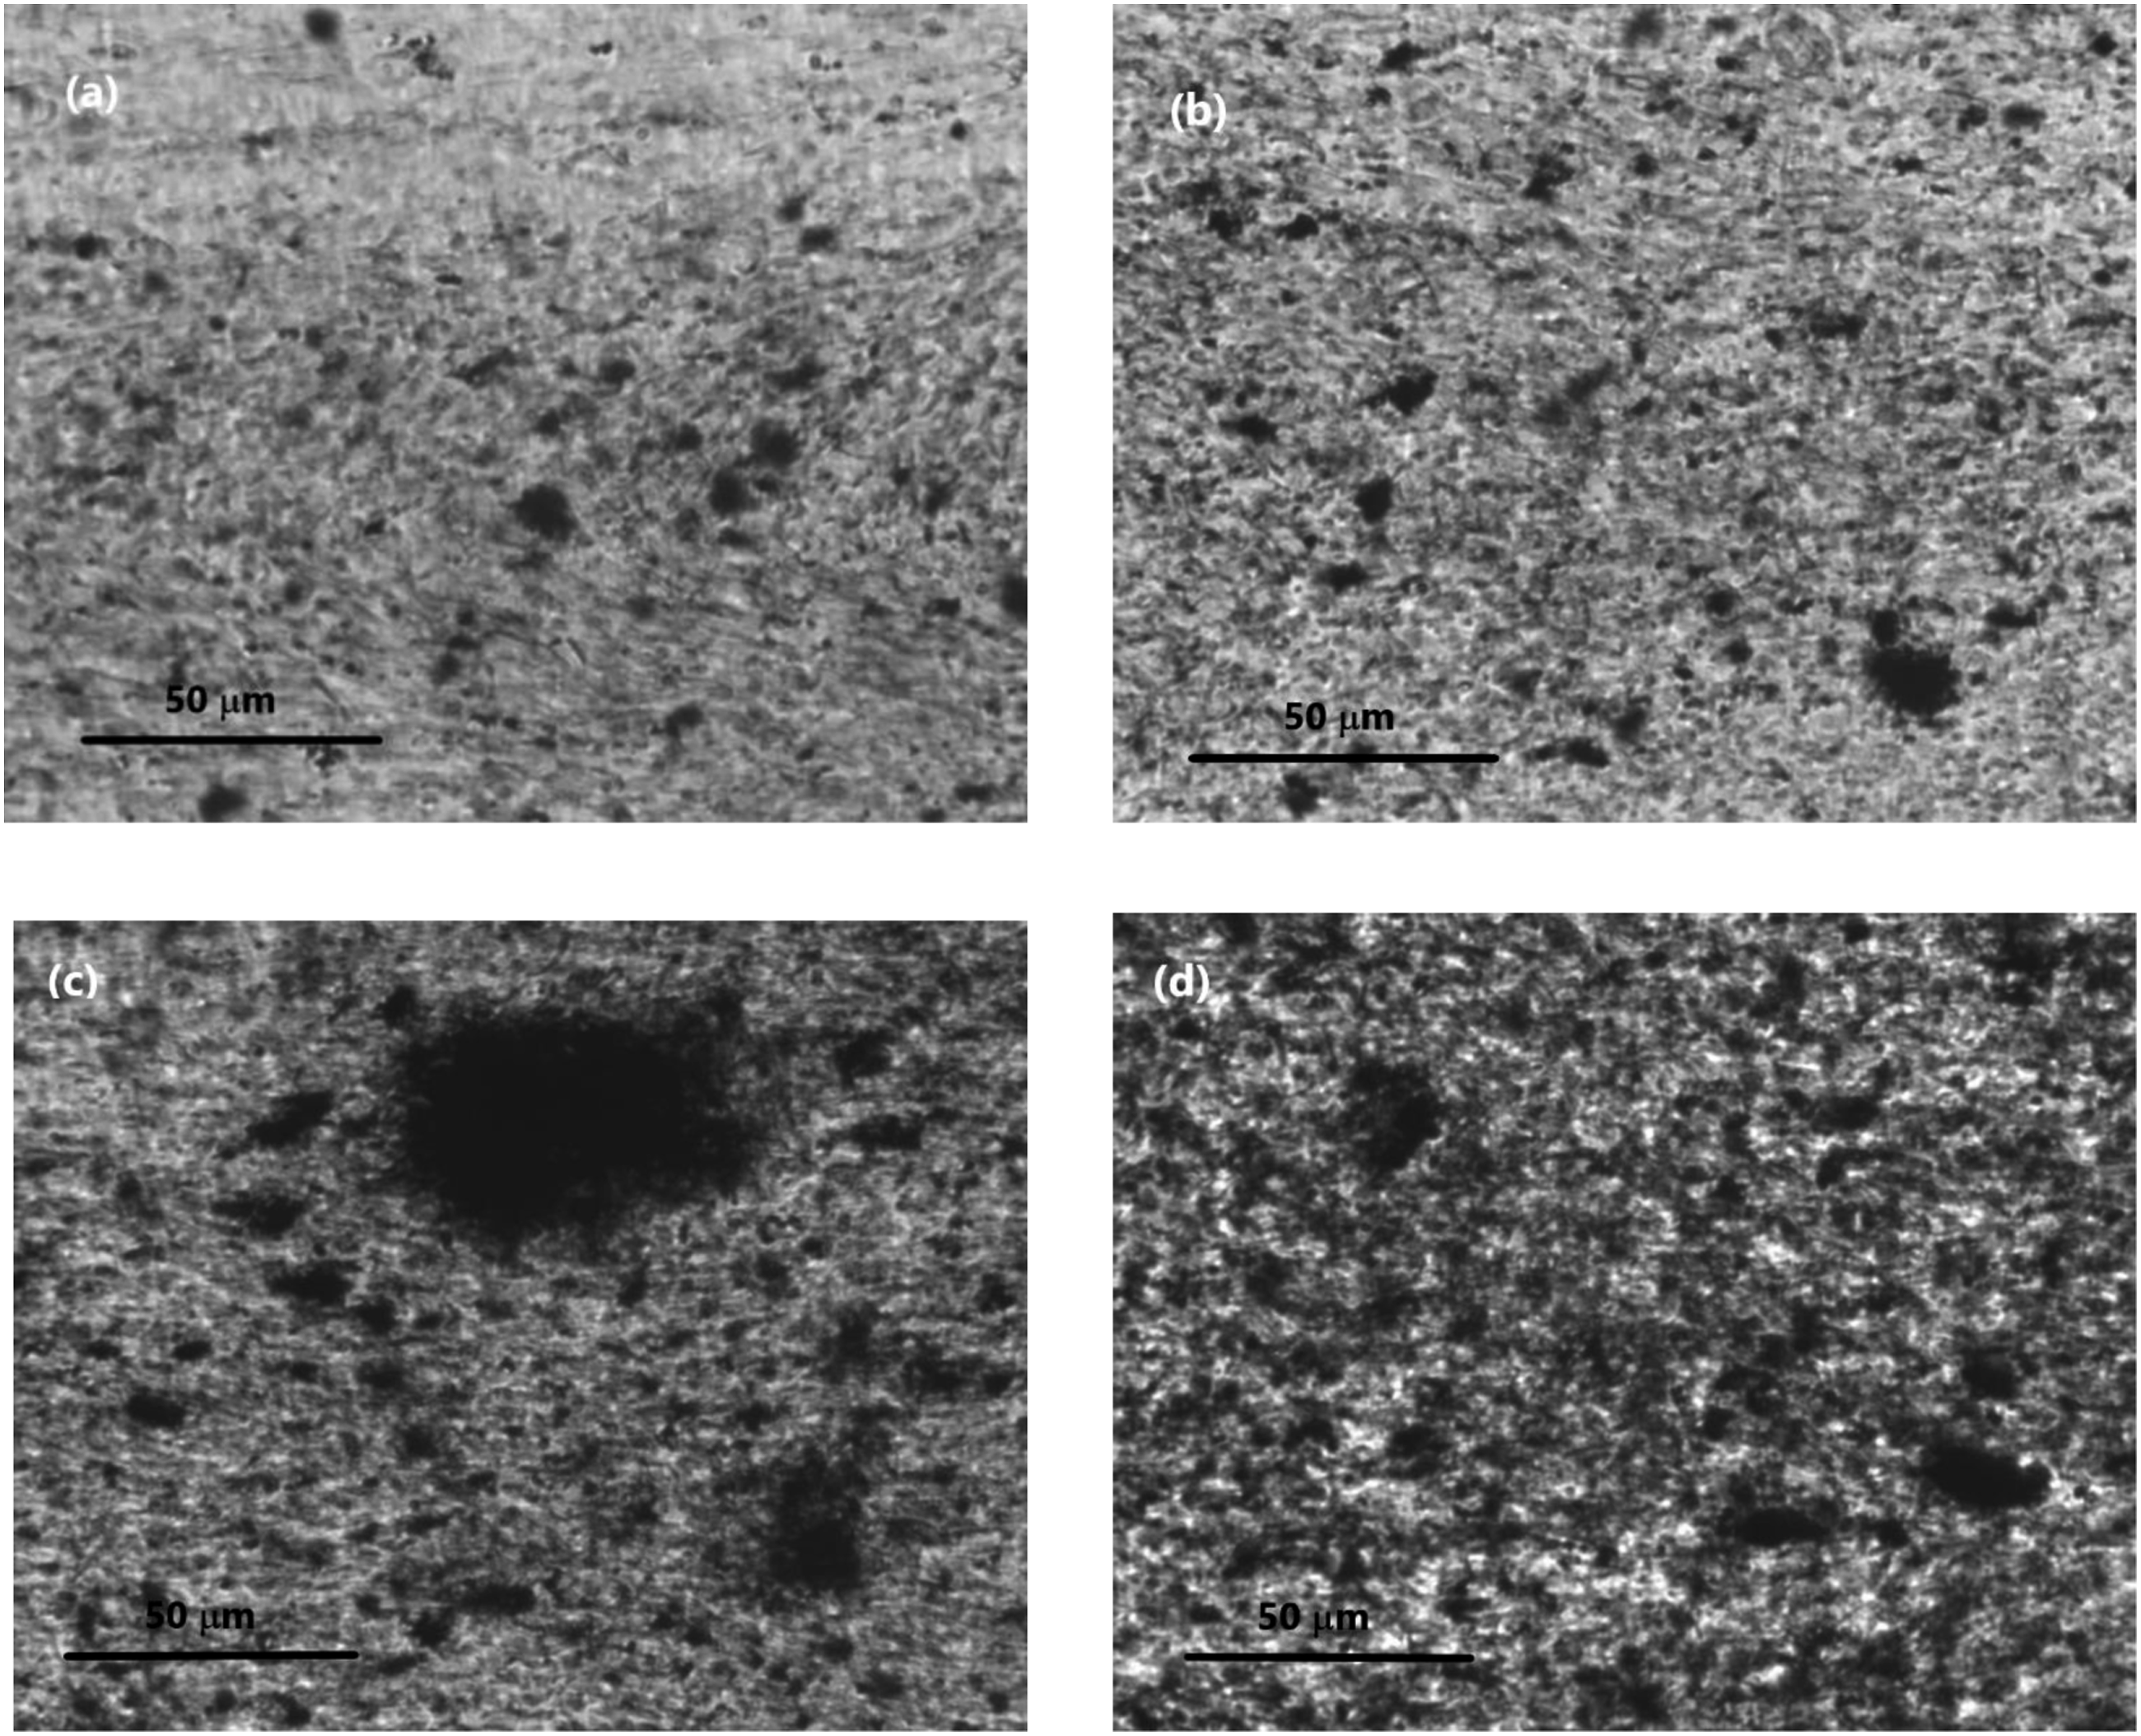
The representative SEM micrographs at different magnifications of the PP/CNF composites with 1.4 vol. % of CNFs (Figure 2) show how the individual CNFs are distributed within the aggregates. It is reminded that the as-received PR 25 AG grade used is not treated with any debulking method after its production. This is important to note because the debulking post-treatment allows requiring much less energy for the CNF dispersion in the melted polymer,
24
and consequently, it makes more difficult their processing by melt extrusion. Therefore, only PP/CNF composites with CNF loadings up to 1.4 vol. % were produced under the processing conditions presented in this work. Thus, it is expected that the PR 25 AG grade provides low levels of dispersion and low electrical conductivity values, even for the PP/CNF composites with the highest loading of CNFs (1.4 vol. %). In addition, Figure 2(b) clearly shows how the CNFs protruded far from the polypropylene, which is a signal of poor wetting. Representative SEM micrographs of PP/CNF composites with 1.4 vol. % of CNFs at different magnifications 10 μm (a) and 2 μm (b).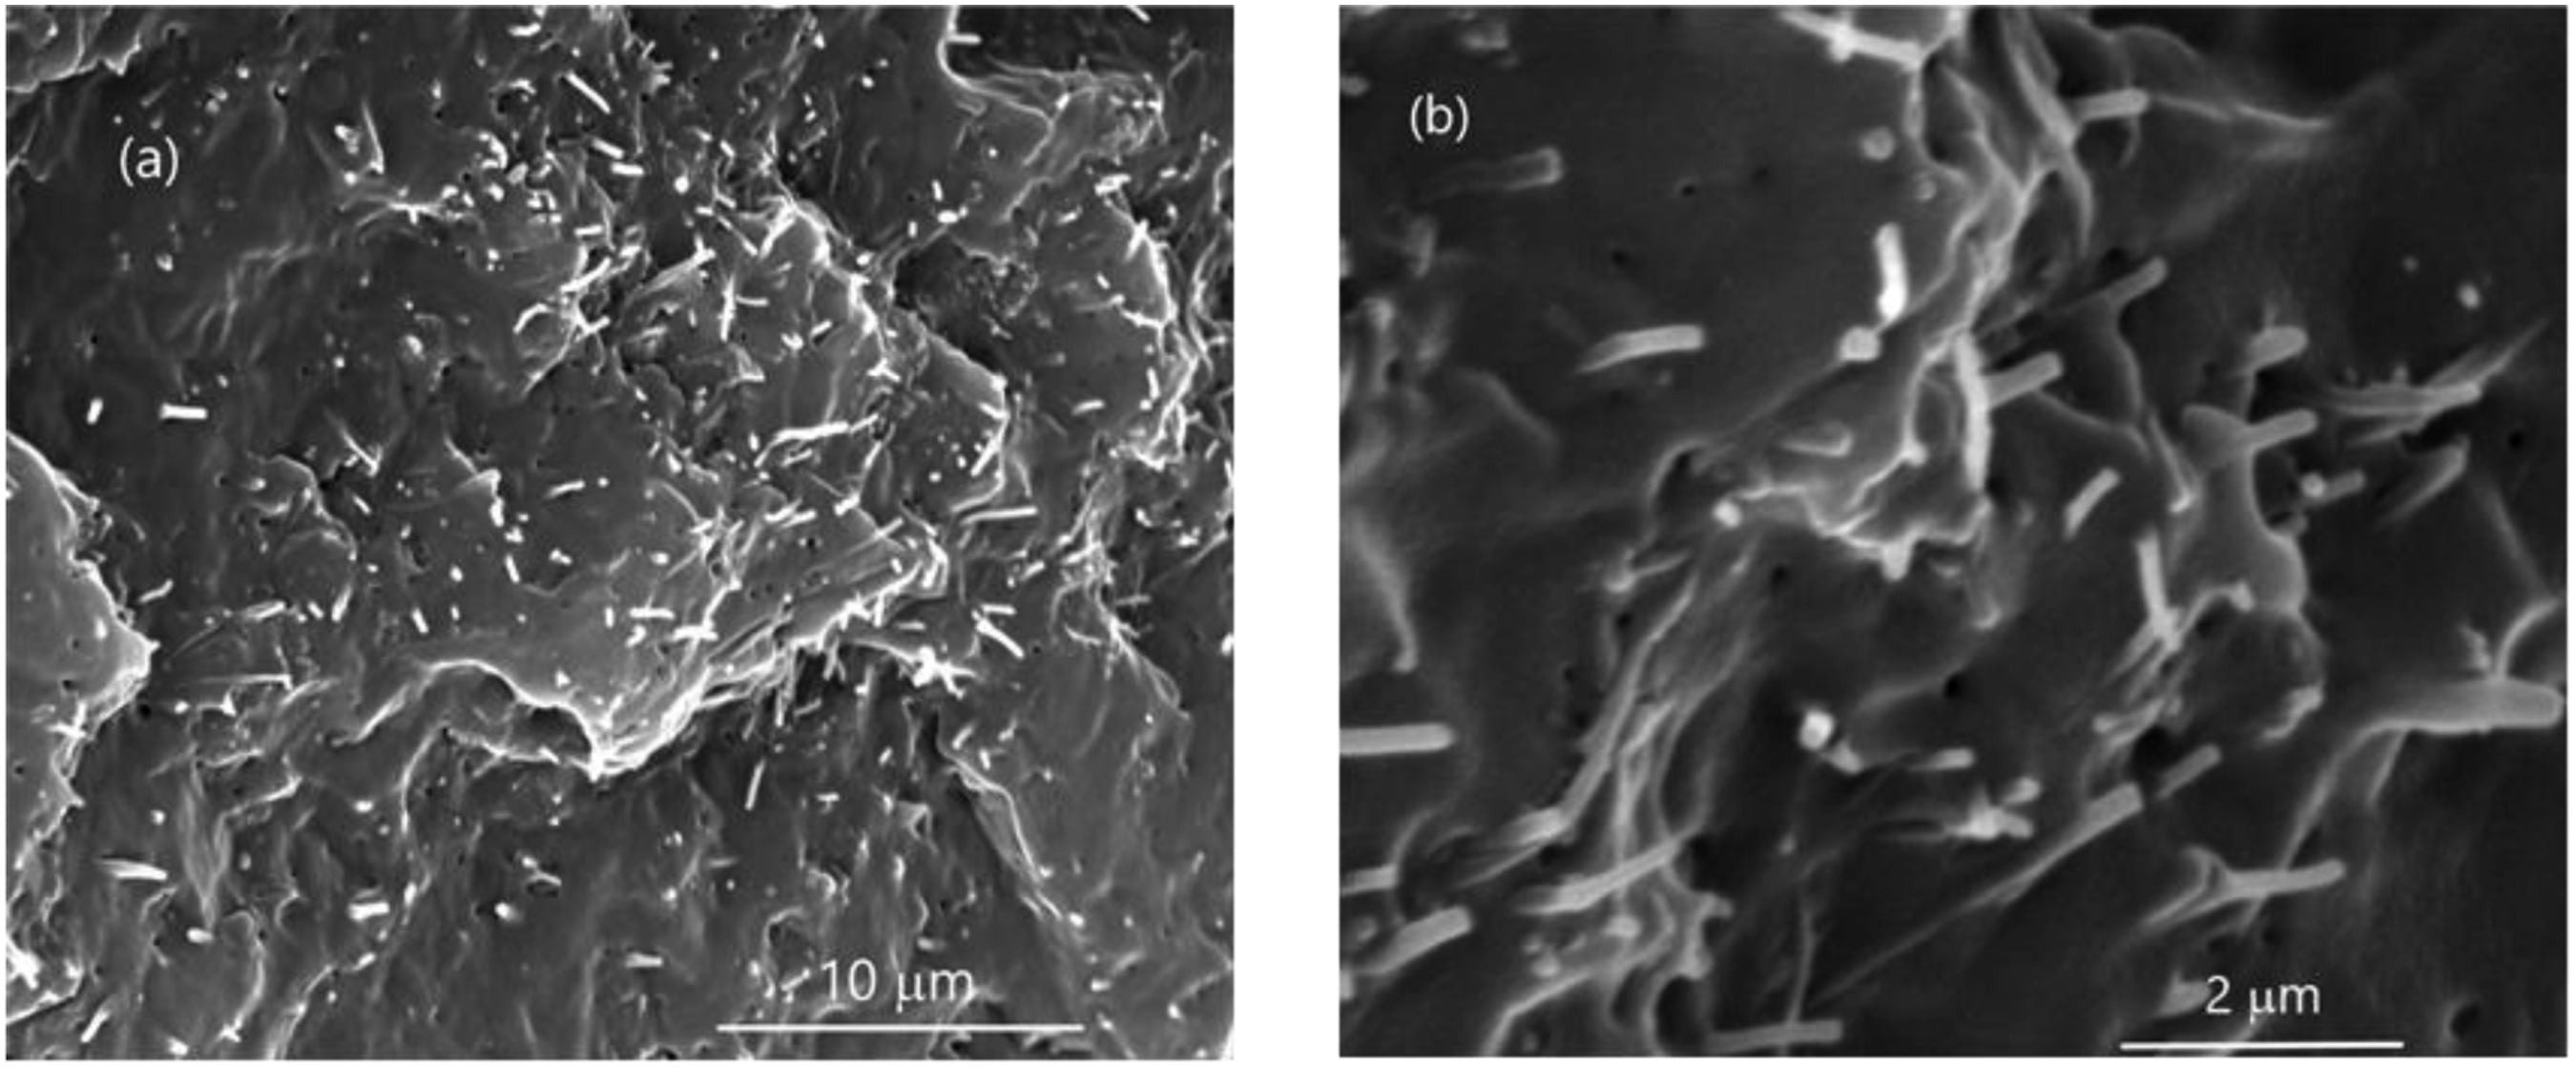
The XRD patterns of the neat extruded PP samples and PP with 0.4, 0.9, and 1.4 vol. % CNF loadings are shown in Figure 3. The extruded PP showed a single-phase α with peaks at approximately 14.2° (110), 17.0° (040), 18.6° (130), 21.3° (111), and 22.0° (041),
25
whereas the other two lower peaks at ∼ 25.6° and 28.9° are assigned to the (060) and (220) planes of the same phase α, respectively.
26
On the other hand, the PP/CNF composites did not show significant differences with respect to the XRD pattern of PP, which indicates that the PP/CNF composites do not promote the presence of different polypropylene phases. Likewise, the XRD peak located at about 22° has also been associated with the diffraction line of the CNFs.
26
Moreover, other works have related the peaks at ∼ 25.6° (060) with the hexagonal crystal structure of the graphite in CNTs.
27
XRD patterns and assignment of the most important lines due to the phase α of PP and PP/CNF composites. Dotted lines are guides for the eyes.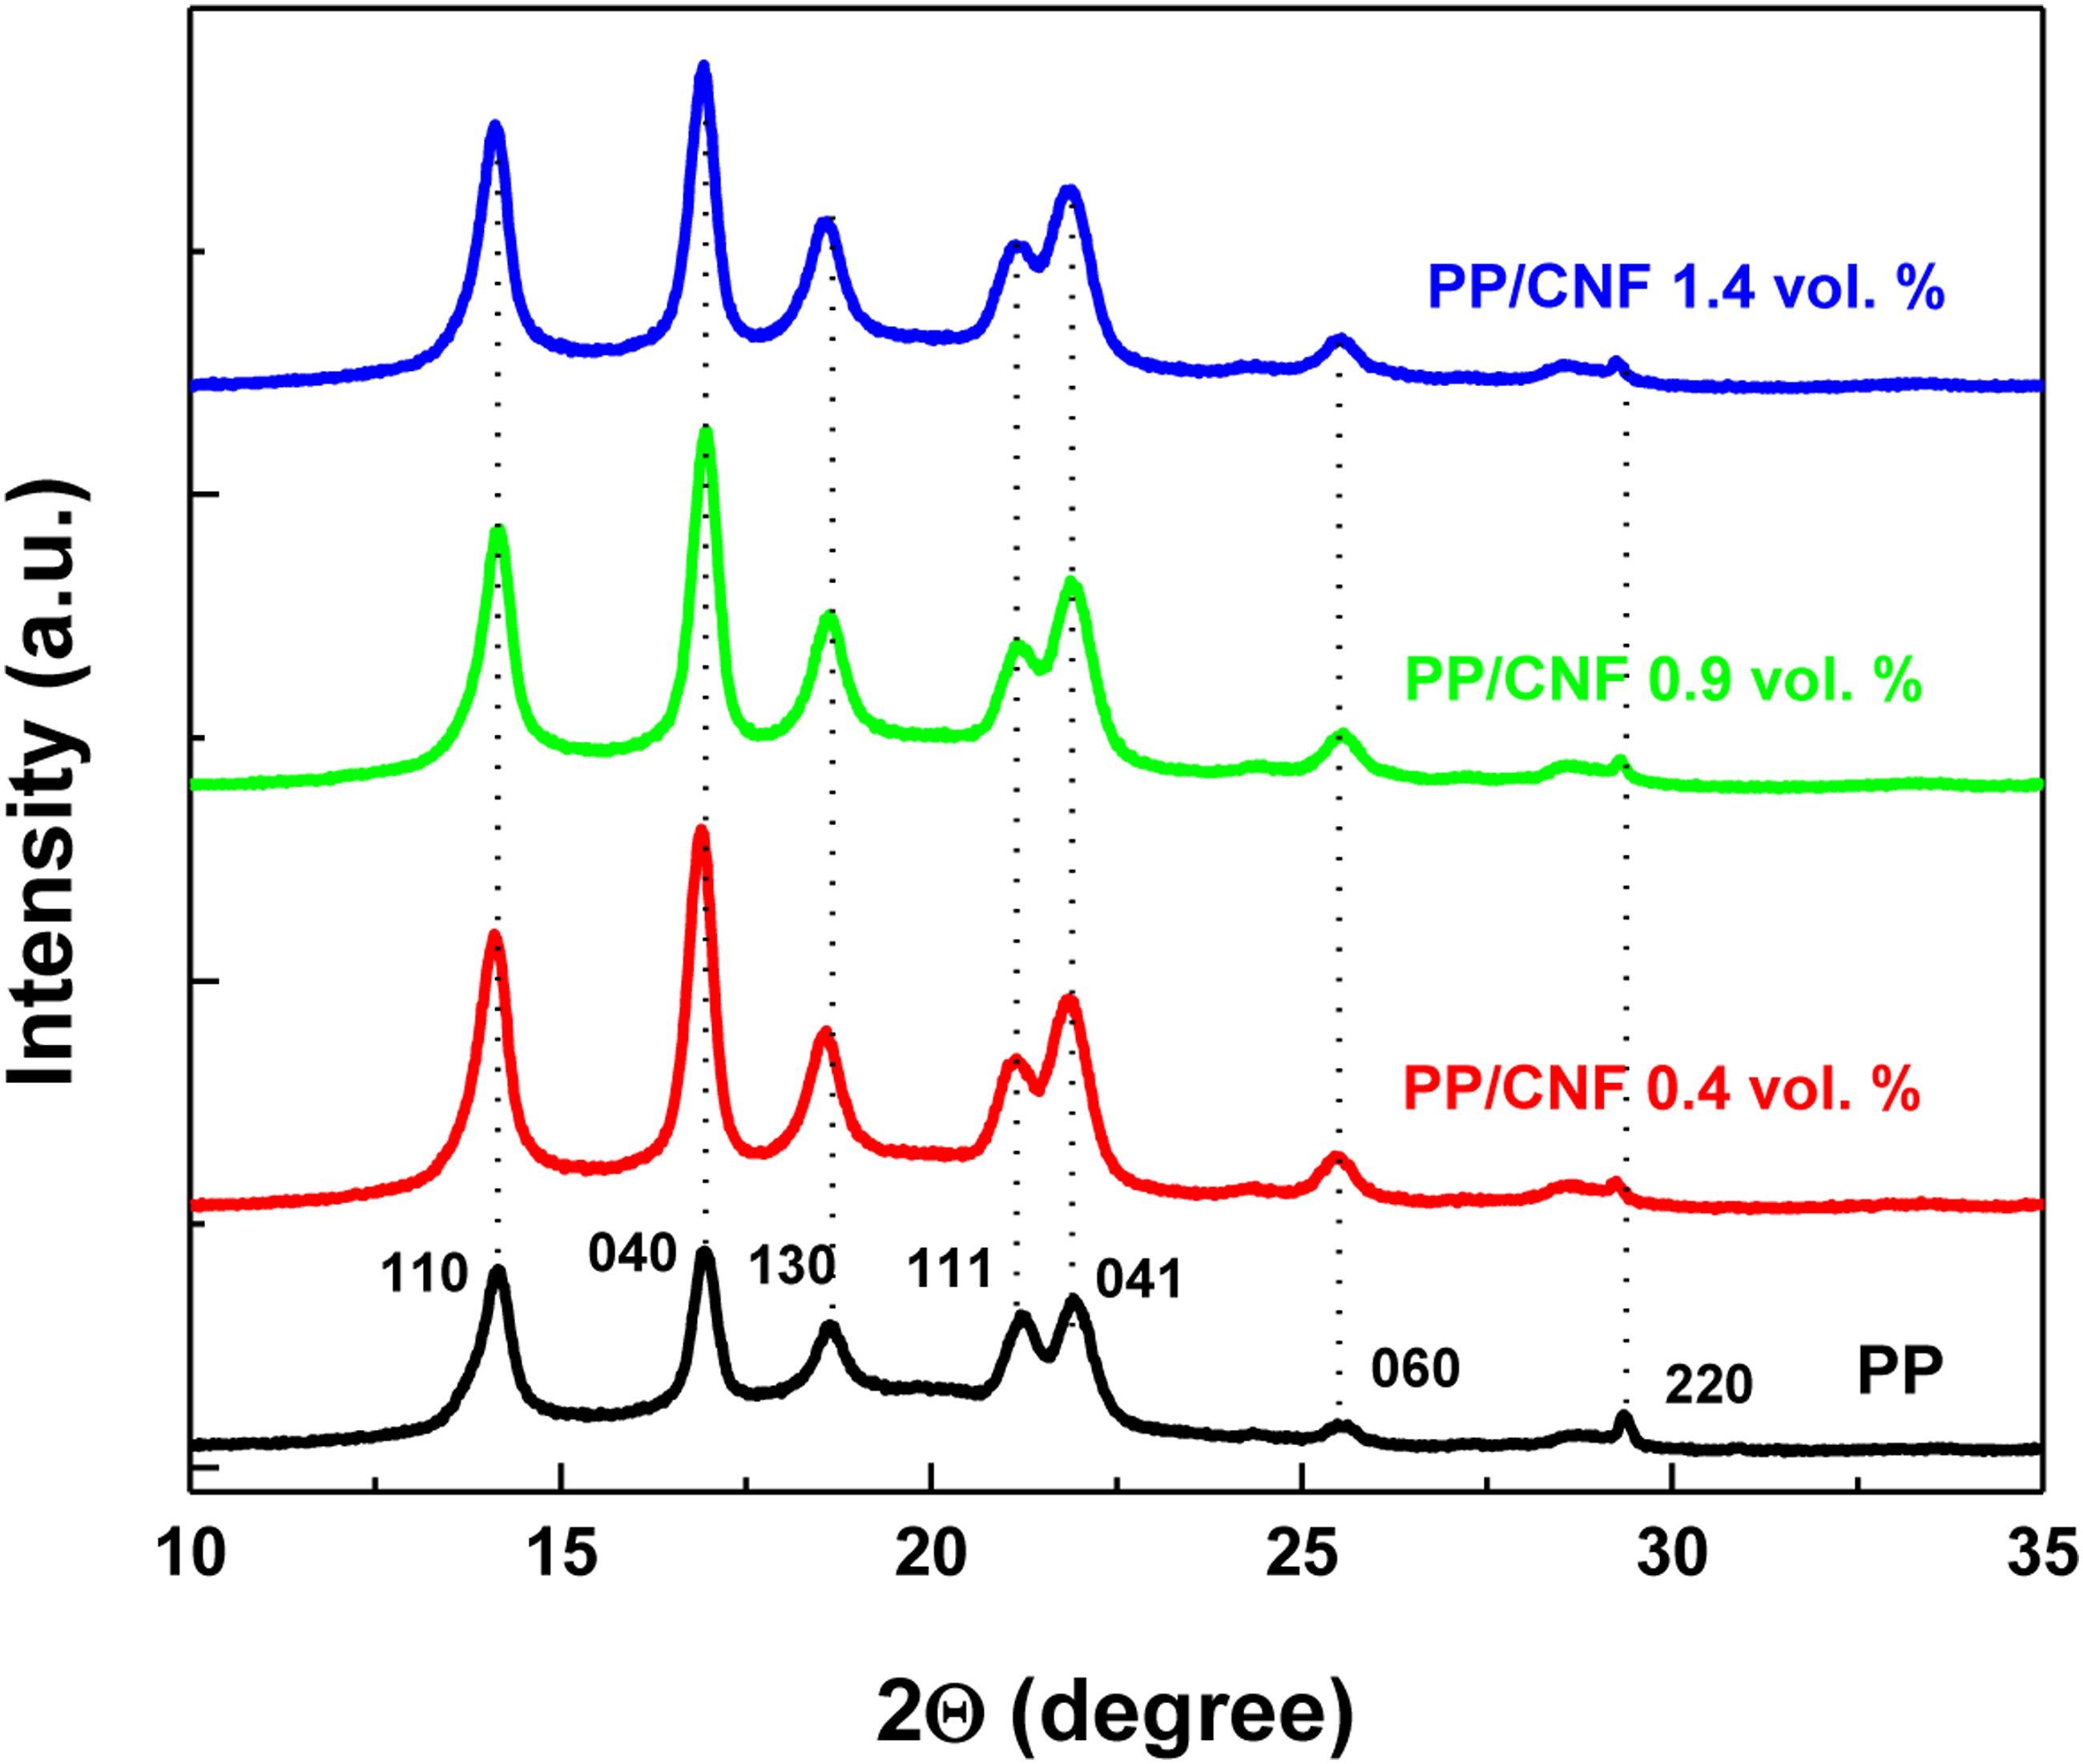
The DSC analyses shown in Figure 4(a) were performed to obtain further information about the influence of CNFs on the crystallization behavior of PP, which is expected to affect the electrical properties of the PP/CNF composites. In particular, the melting temperature (Tm) and degree of crystallinity (ΔXc) in % of PP and PP/CNF composites corresponding to the second heating scans are shown in Figure 4(b), where the ΔXc of the neat melt-extruded PP and PP/CNF composites was calculated by DSC thermographs (a) and Tm and ΔXc (b) of PP and PP/CNF composites. Dotted lines are guides for the eyes.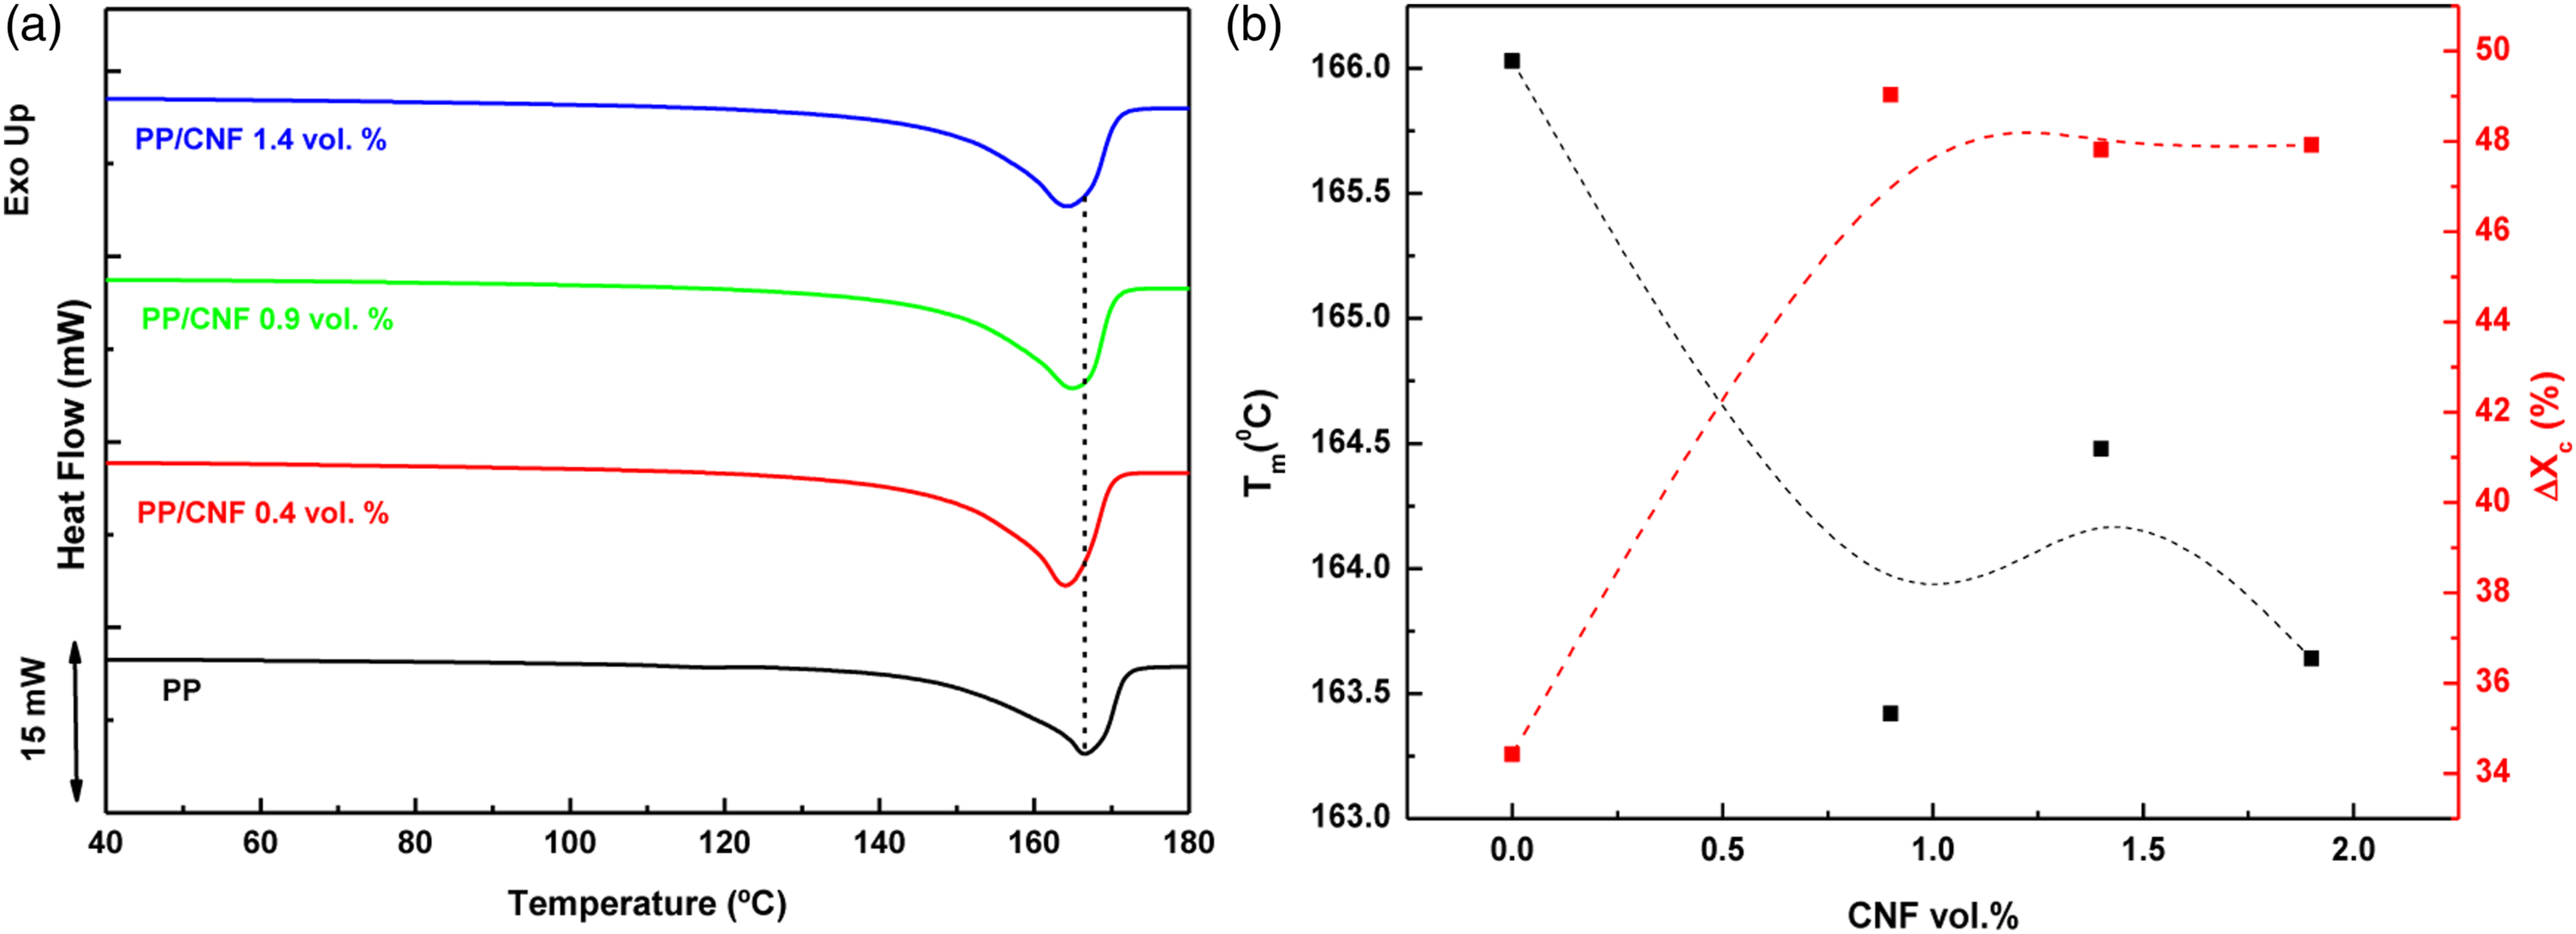
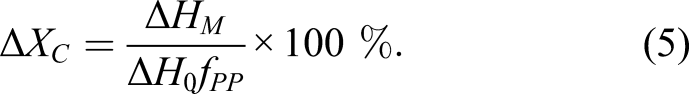
ΔHm is the sample melting enthalpy and ΔH0fPP is the melting enthalpy of the 100% crystalline PP (207 J g−1). 28 The PP showed a single melting peak at ∼ 166°C in accordance with other works that report melt-compounding PP-based composites , 23 whereas a slight decrease in the melting temperature is noticed for the PP/CNF composites in Figure 4(b). Notably, the results in Figure 4(b) show a clear increase of ΔXc ∼ 15% with respect to the PP (∼34%) for PP/CNF composites with 1.4 vol. %. The latter result has been associated to the degree of stretching rise of the macromolecular polymer chains caused by the loading with the nanoparticles. 23
AC conductivity analysis by the universal power laws
The DC electrical conductivities at room temperature of the PP/CNF composites as a function of CNF concentration are represented in Figure 5. A clear increase is observed for PP/CNF composites with loadings of 1.4 vol. % (∼8 × 10⁻⁶ S m−1). According to the percolation theory, the σDC can be expressed by the power law relationship (ϕ - ϕc)t, which relates the experimental σDC with the filler concentration ϕ, where ϕc is the percolation threshold and t is the critical exponent associated with the dimensional character of the network.11,12 Although Figure 5 evidences an insulator–conductor transition between 0.9 and 1.4 vol. %, the values of σDC could not be fitted by that power law because the impossibility of producing PP/CNF composites with higher CNF contents under the processing conditions presented in this work. DC electrical conductivity as a function of CNF contents in PP/CNF composites (the dash-dot lines are to guide the eyes).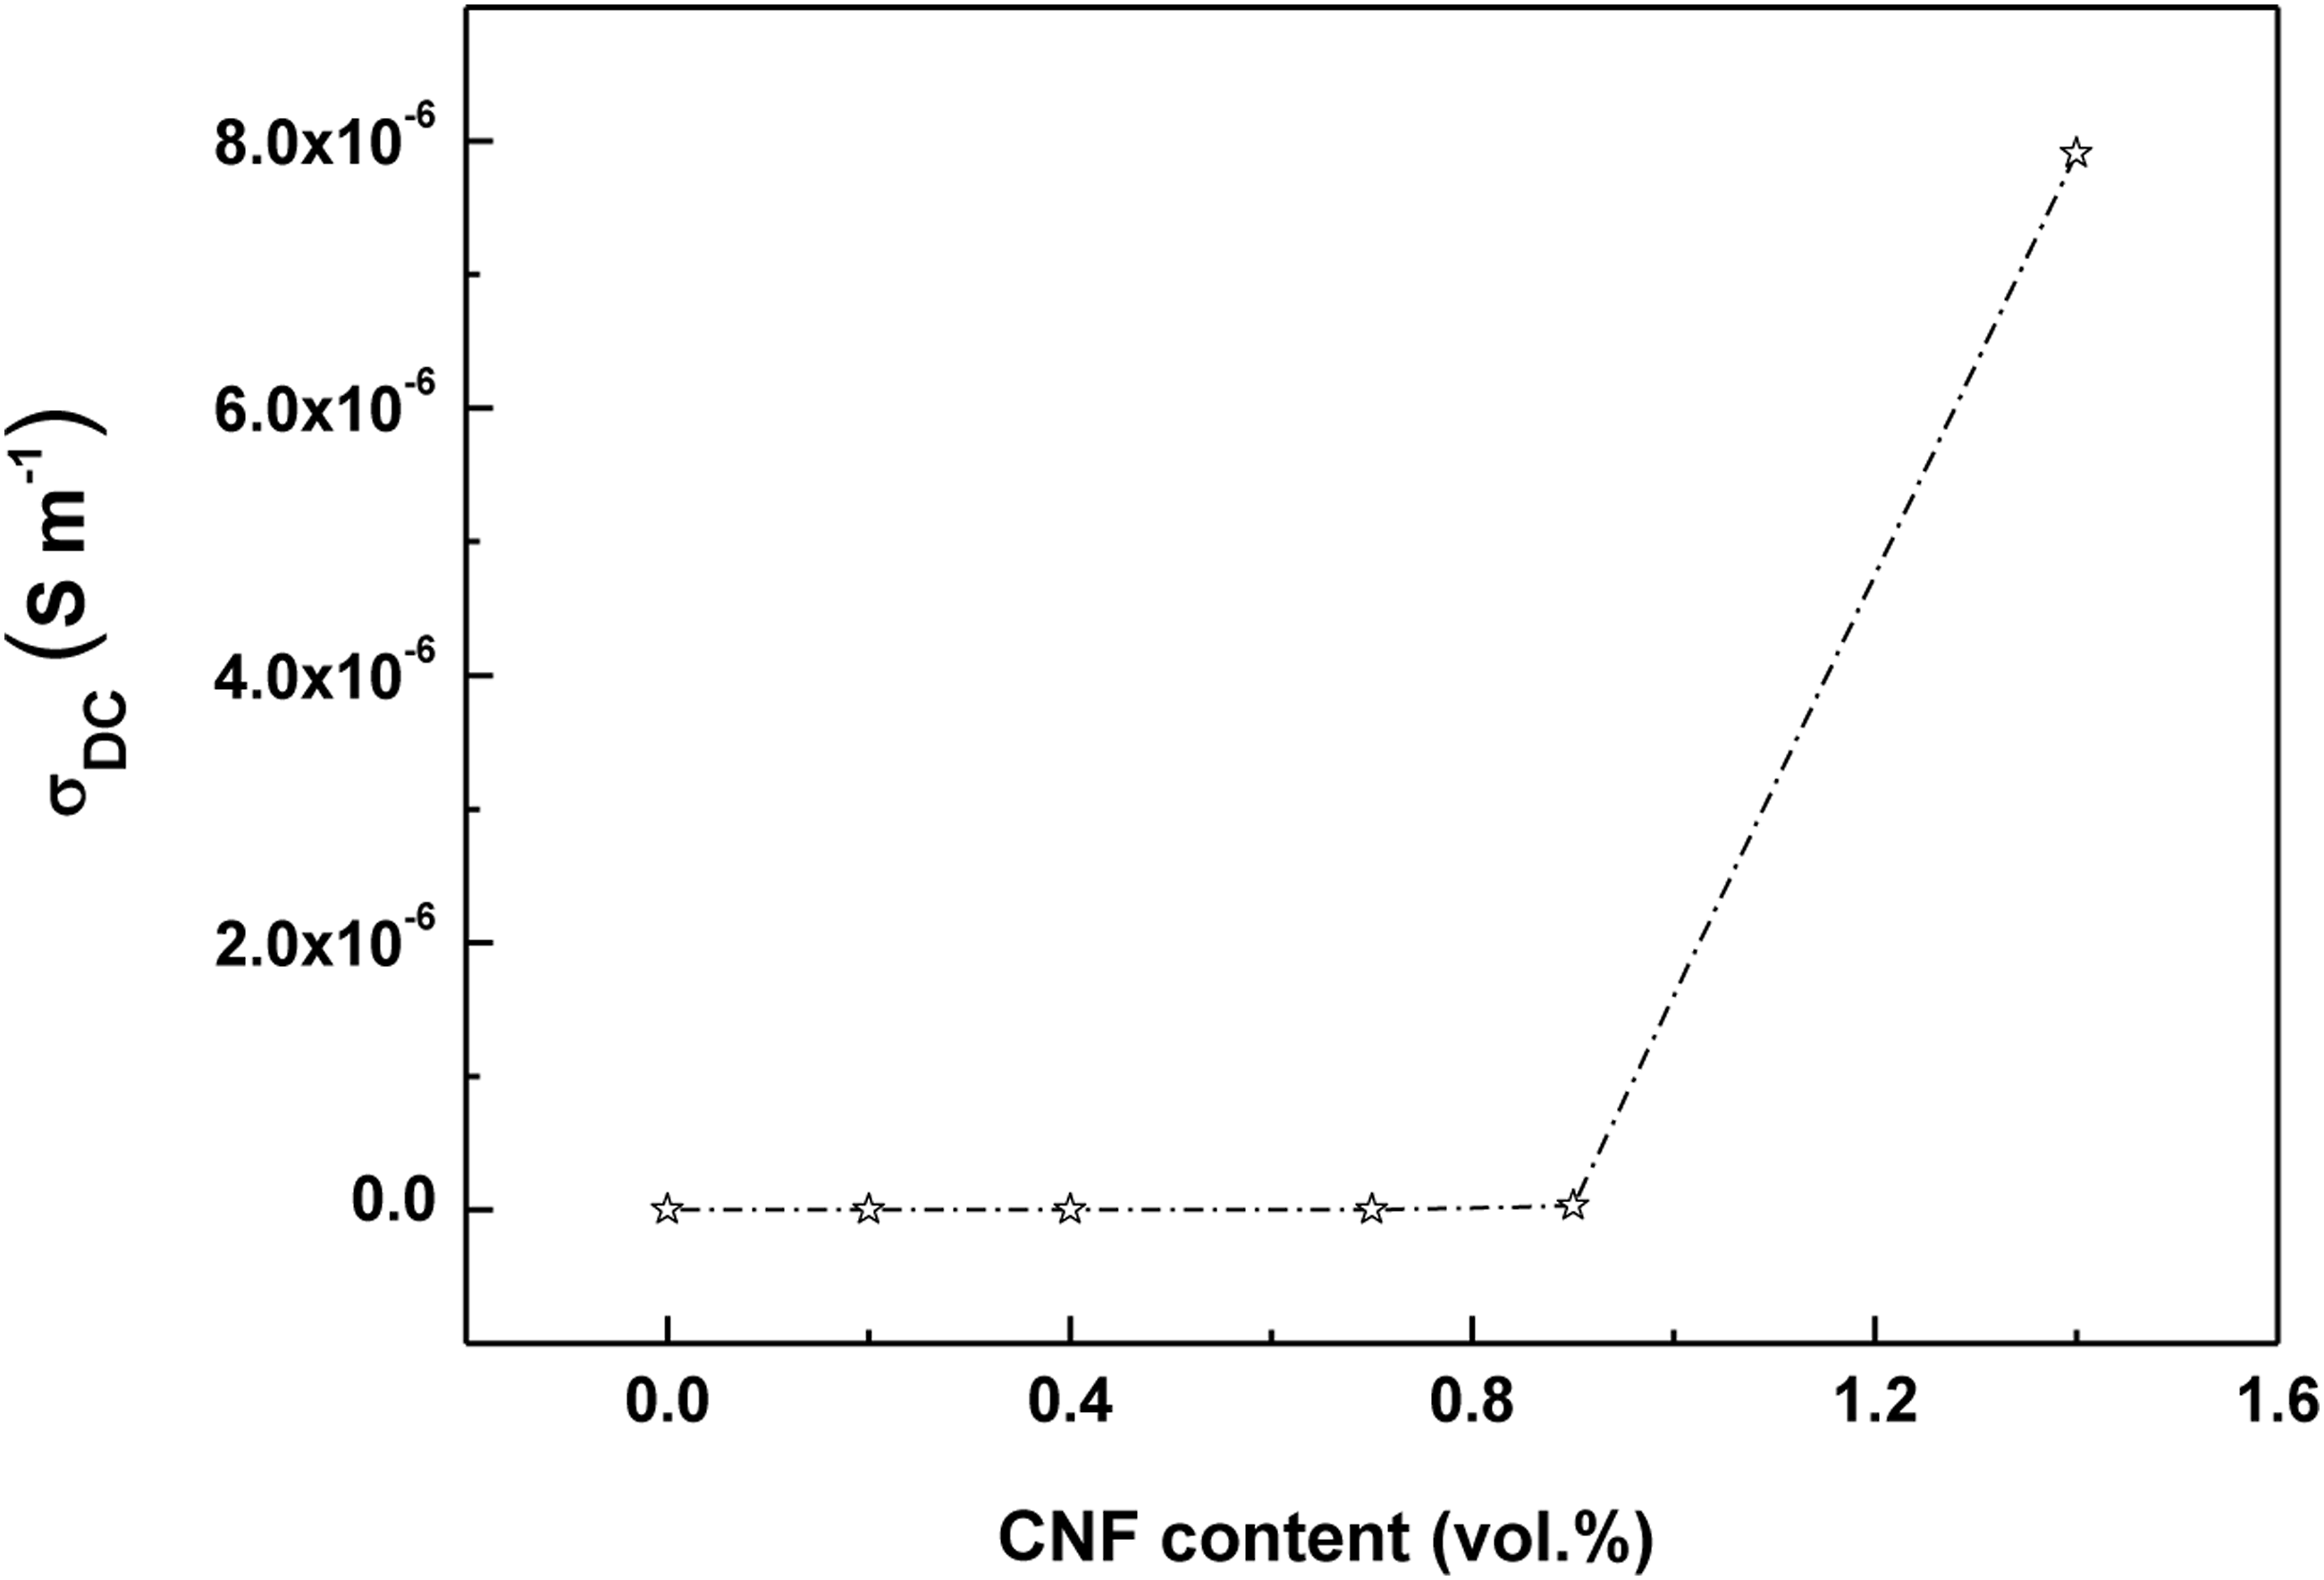
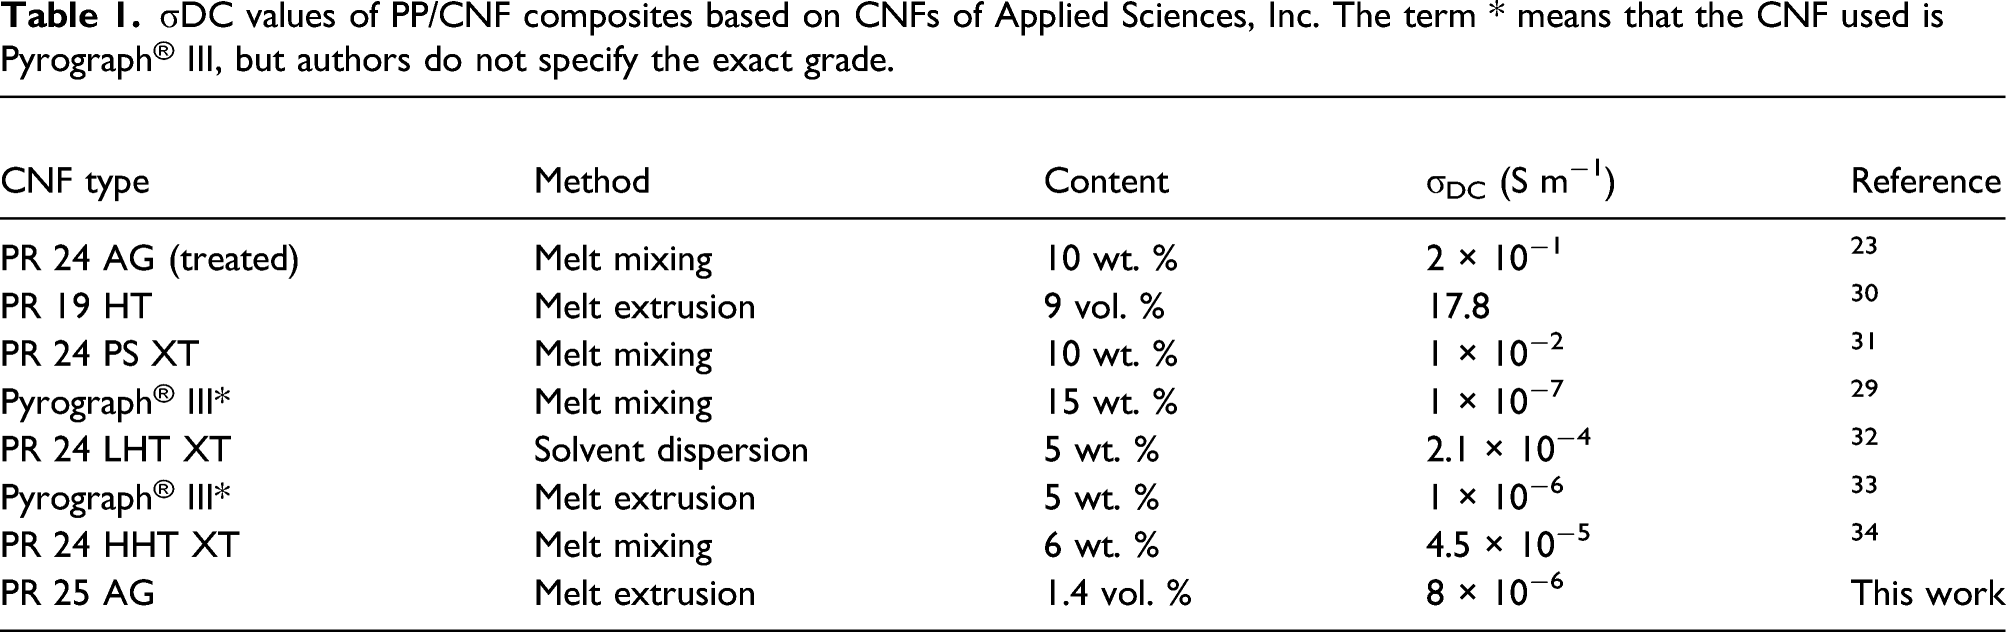
σDC values of PP/CNF composites based on CNFs of Applied Sciences, Inc. The term * means that the CNF used is Pyrograph® III, but authors do not specify the exact grade.
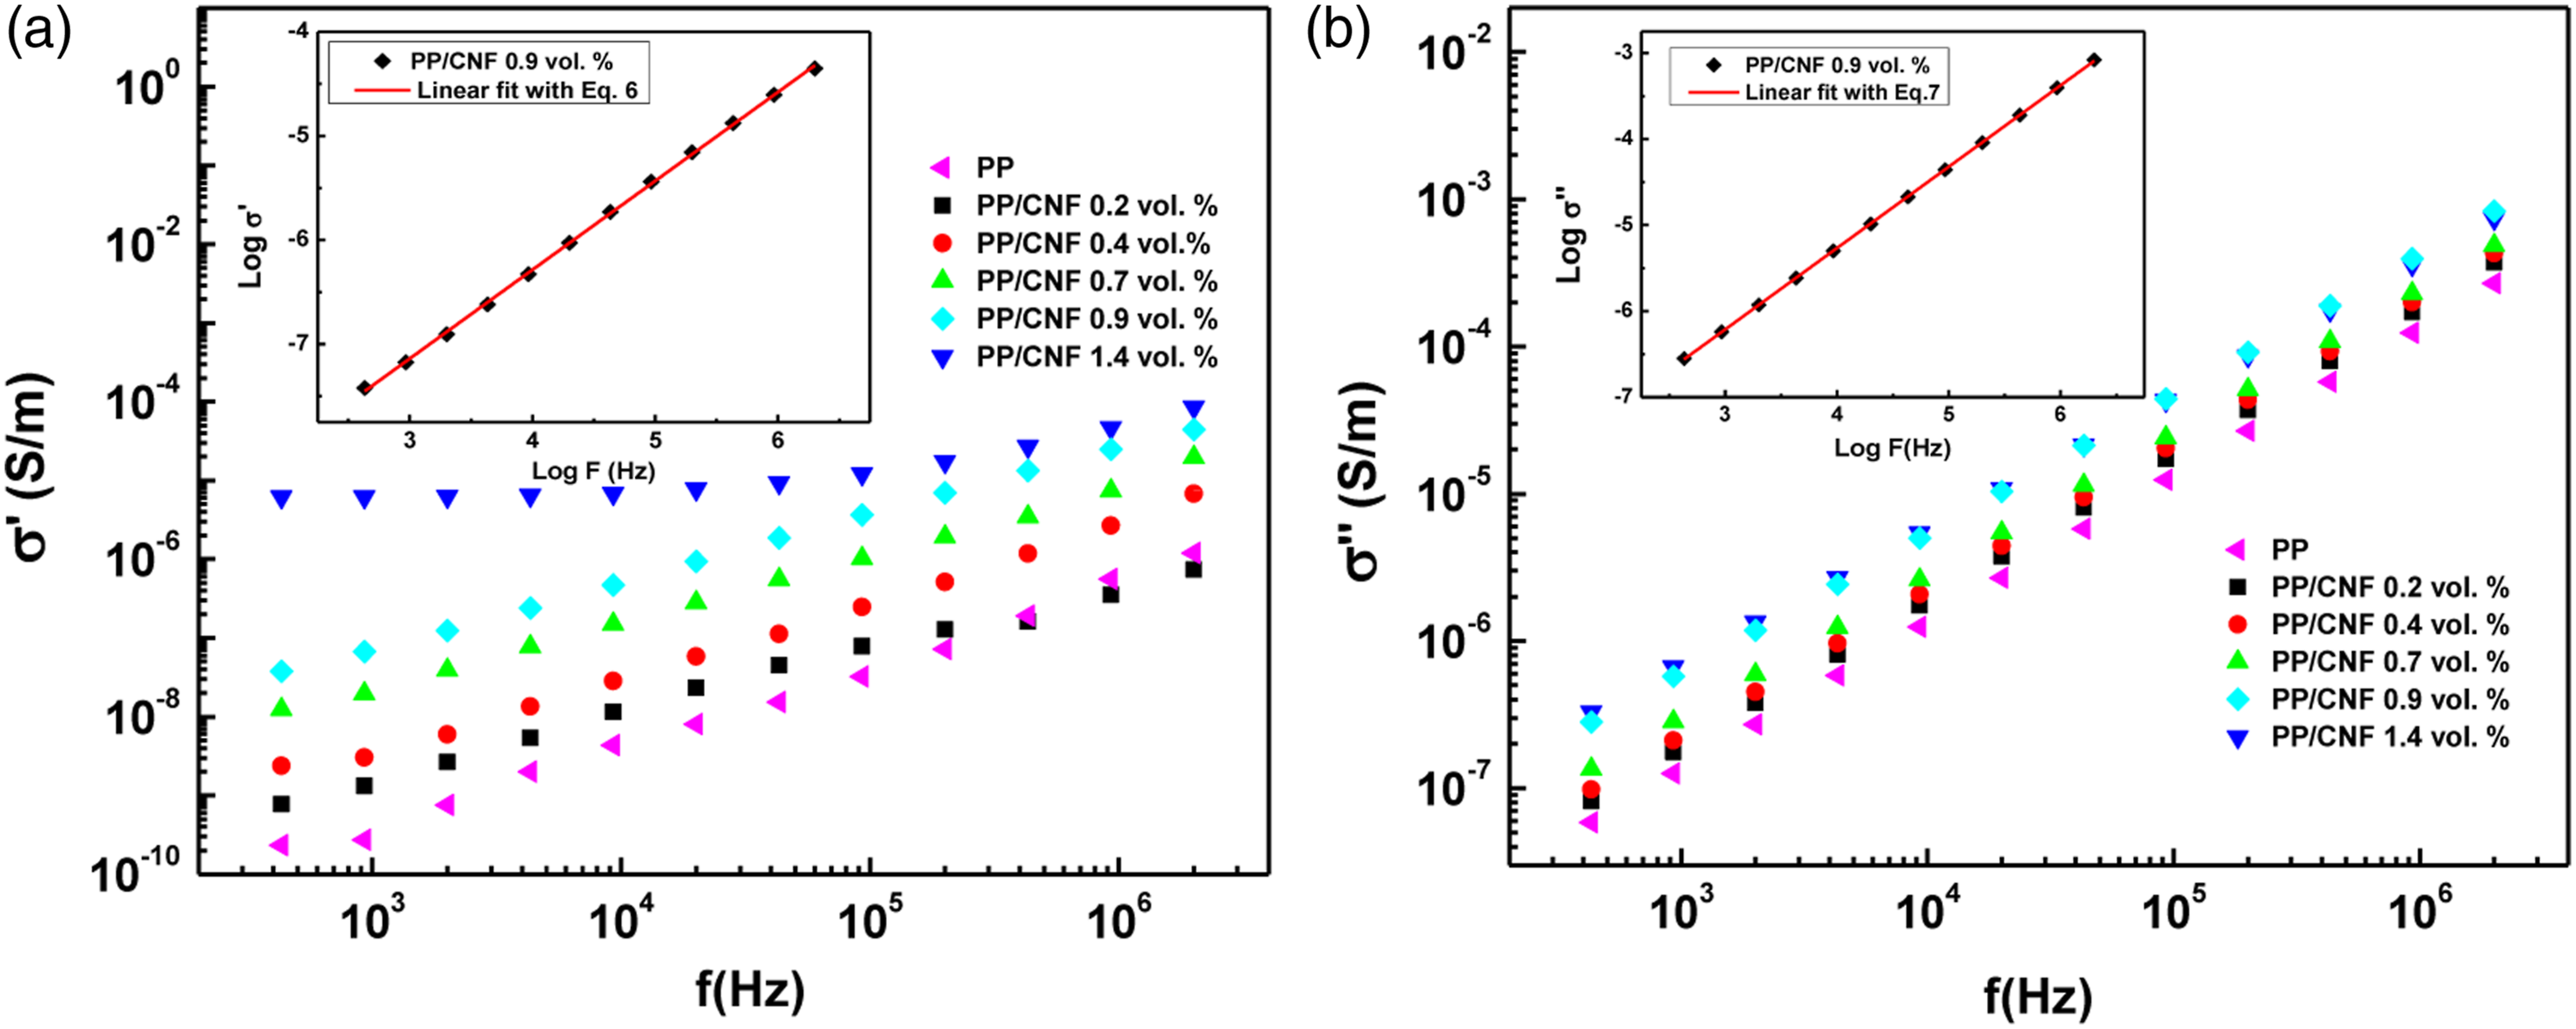
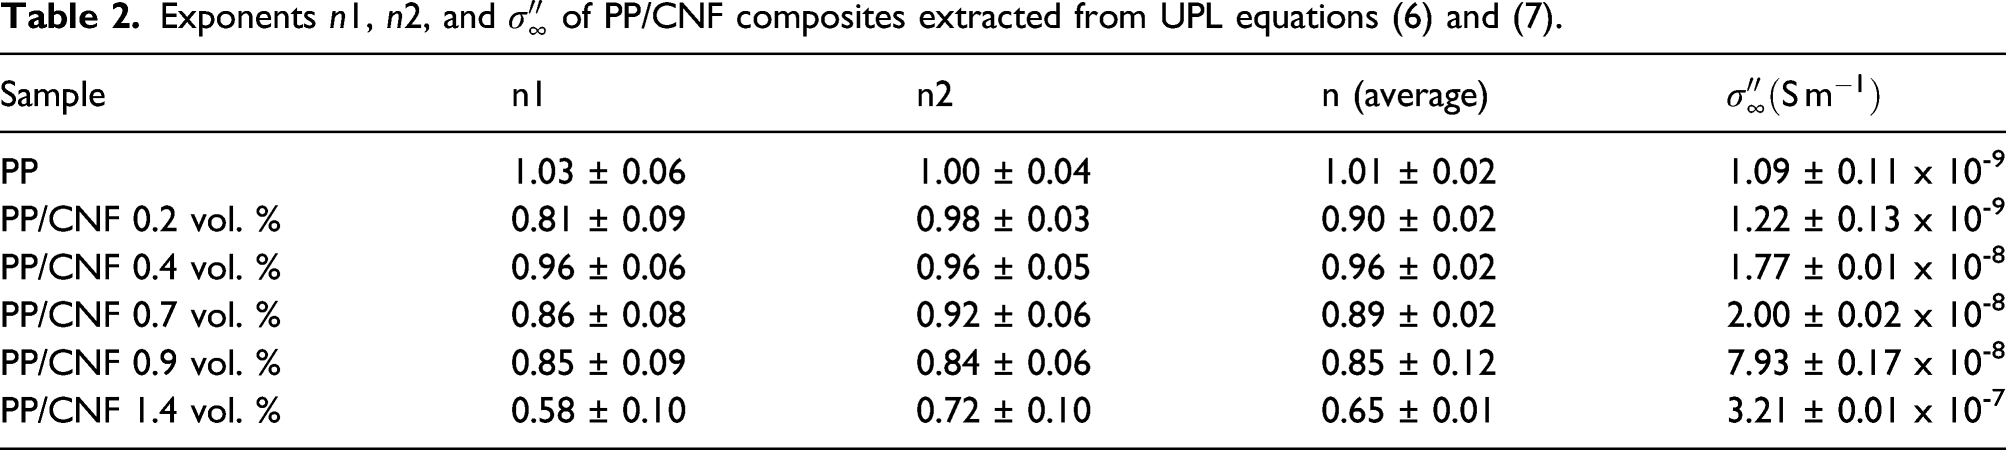
The electric responses of polymer composites containing conductive fillers can be accurately described by the universal power laws (UPLs), which were experimentally and theoretically obtained by Jonscher35,36 and Dissado and Hill37,38

AC conductivity analysis by the generalized effective medium model
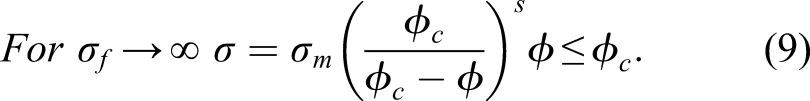
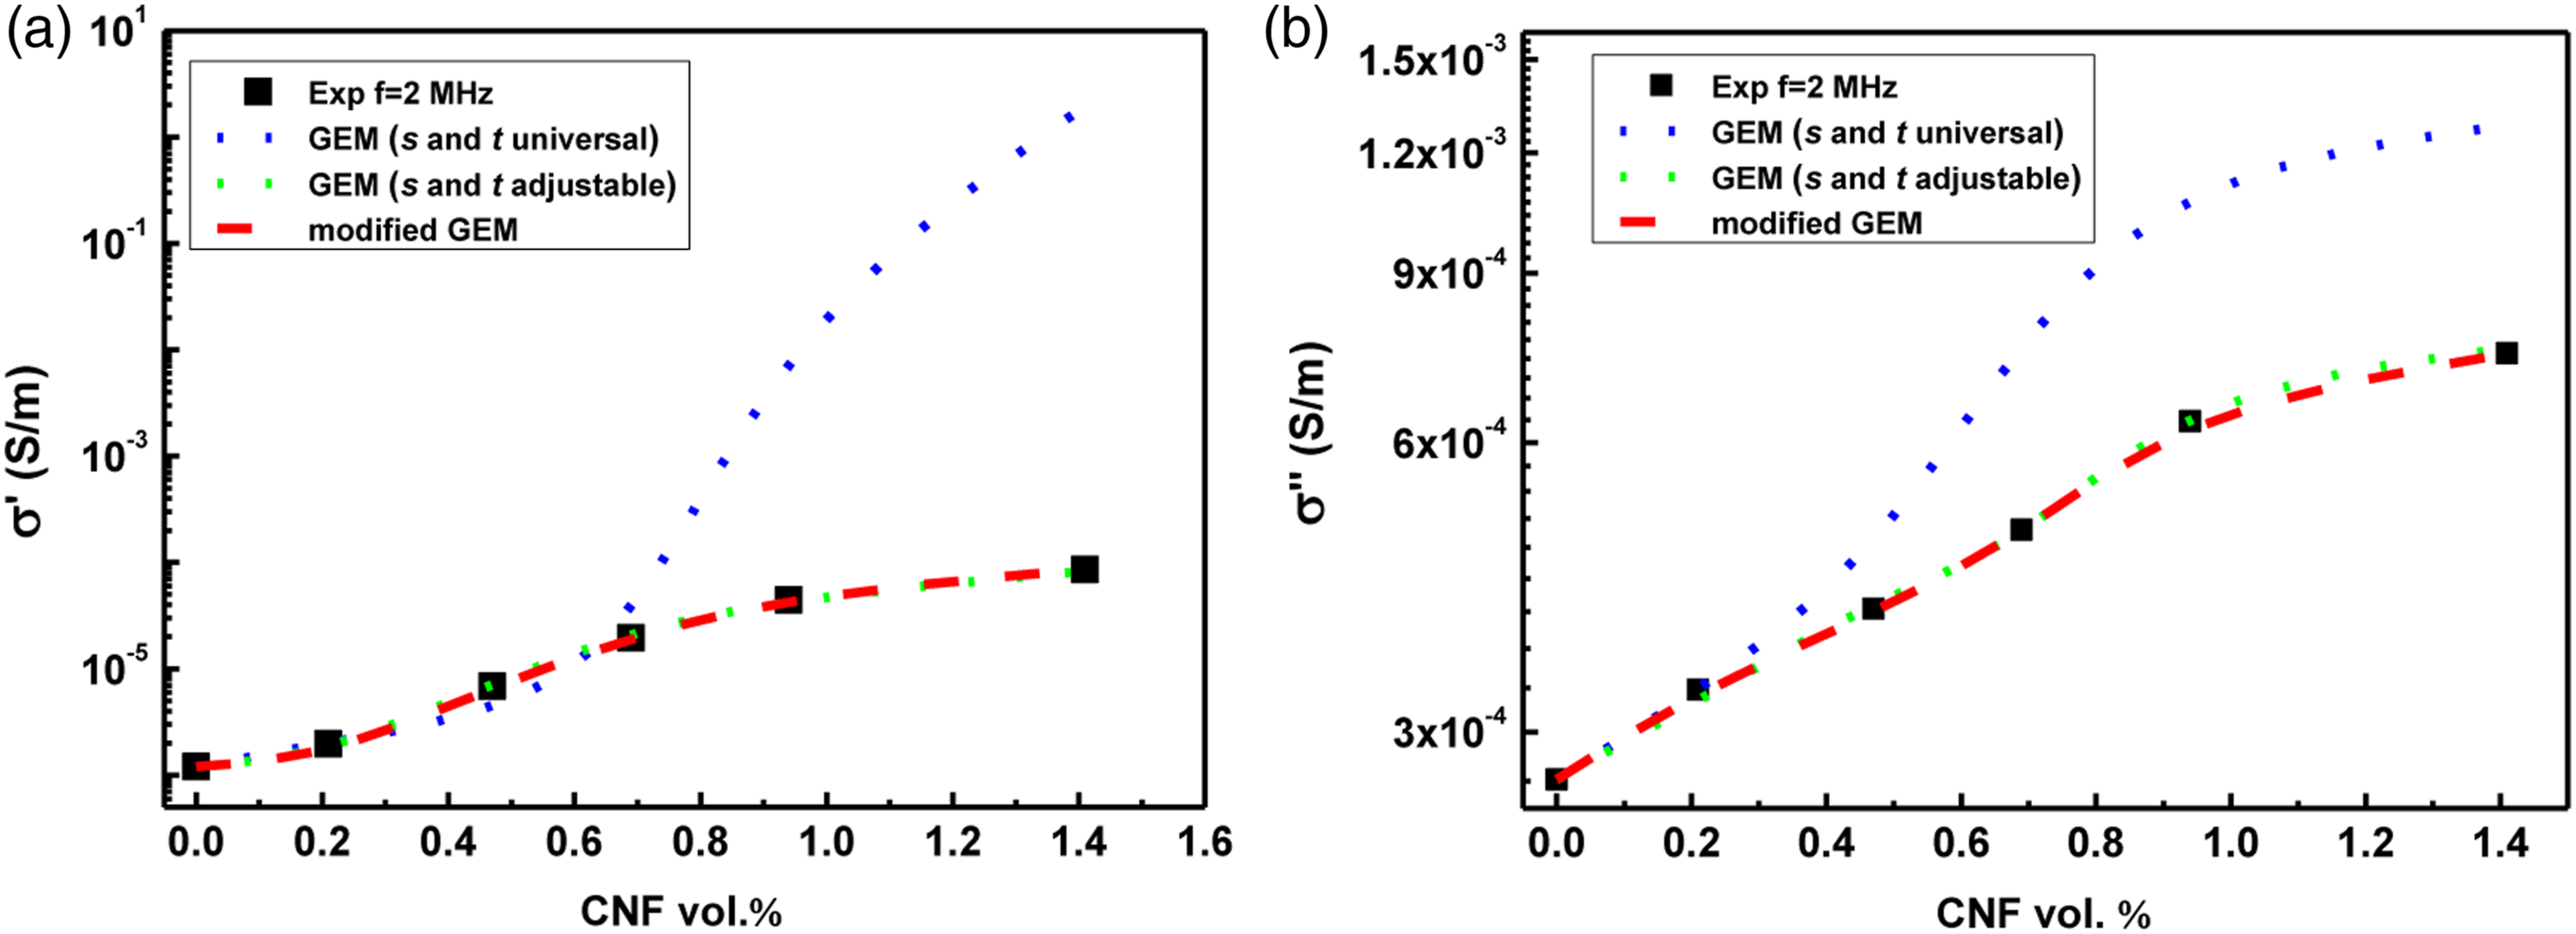
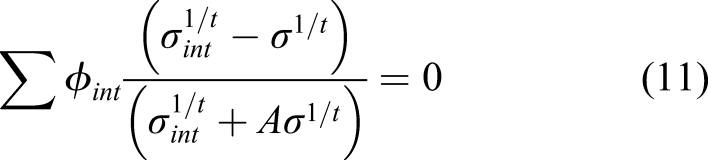
The generalized effective medium model (GEM) is used to examine the complex conductivity of the PP/CNF composites as a function of the CNF content.42,43 The PP/CNF composites are assumed as binary and homogenous systems, where the electrical contact between the PP and CNFs is considered negligible, and the CNFs are supposed to be in contact with each other. In particular, the GEM can be expressed by the “two-exponent phenomenological percolation equation” (TEPPE)2,44,45 Experimental (full symbols) and fittings (dashed line curves) by the GEM and modified GEM of σ´ (a) and σ´´ (b) at 2 MHz in PP/CNF composites.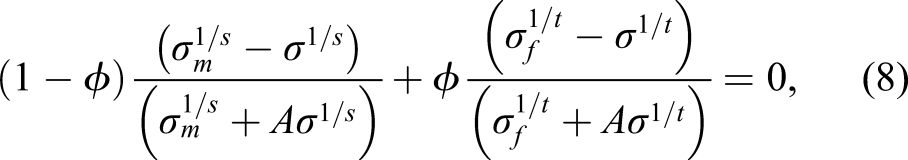
Adjustable s and t exponents obtained by TEPPE equation and k, σint´, and σint´´ obtained by the modified GEM at different frequencies of PP/CNF composites.
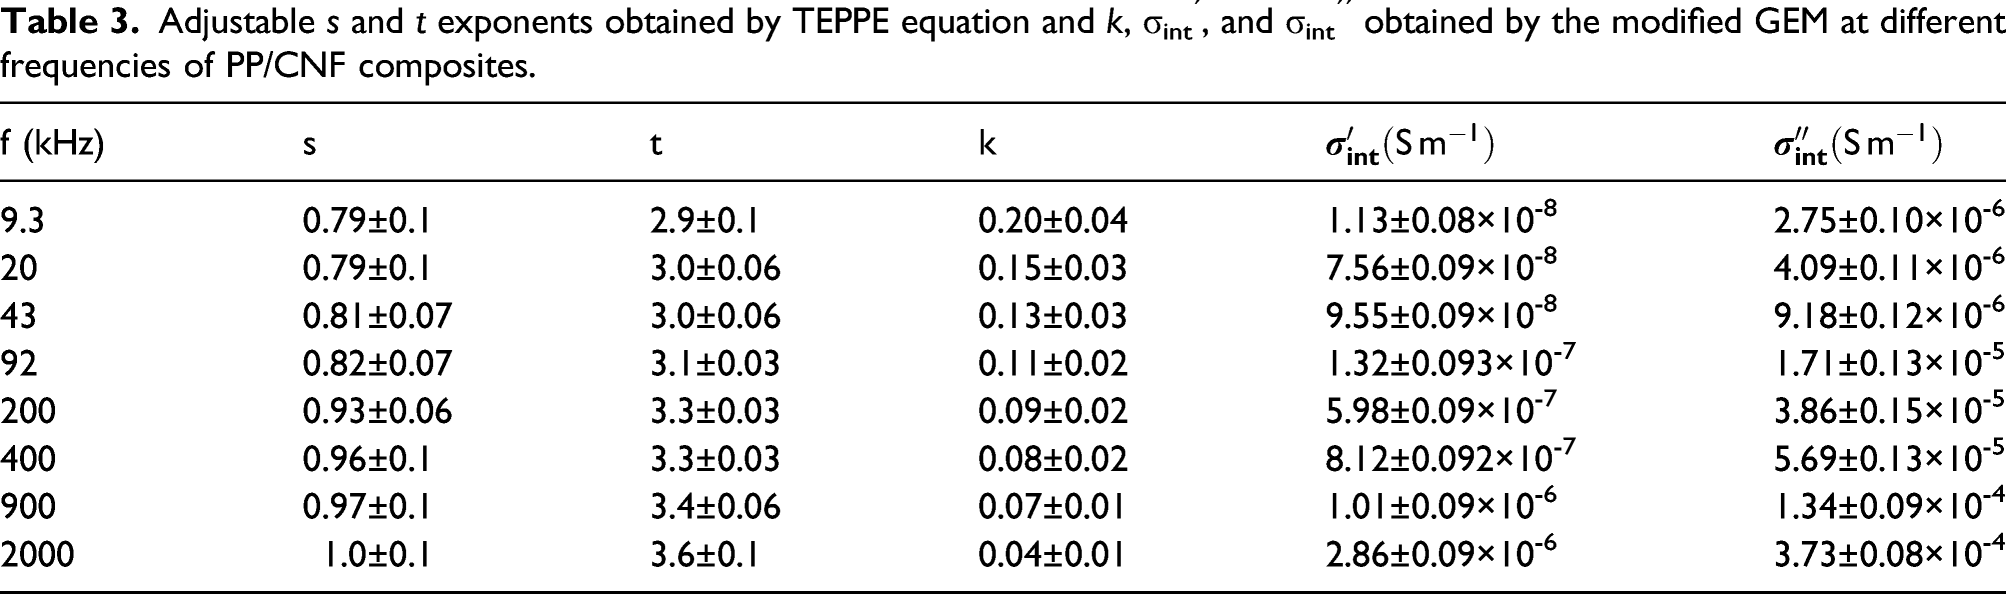
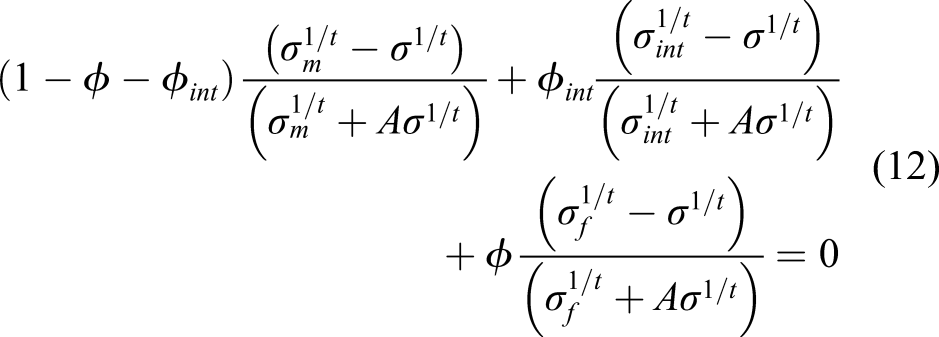
Consequently, the σ´ and σ″ at 2 MHz provided by the modified GEM of the PP/CNF composites as a function of the CNF vol. % are represented as dashed red lines in Figure 7(a) and Figure 7(b), respectively. Specifically, the results were obtained by solving numerically the equation (12) through an interactive procedure, where k, σint´, and σint″ are adjustable parameters and the universal value t ∼ 2 is used. Figures 7(a) and (b) show clearly that the modified GEM fits correctly with the experimental data. In particular, the best fit for PP/CNF composites at 2 MHz is obtained for σint´= 2.86 ± 0.09 × 10⁻⁶ S⋅m−1, σint″ = 3.73 ± 0.08 × 10⁻⁴ S⋅m−1, and k = 0.04 ± 0.01. Similarly, the k, σint´, and σint″ for the PP/CNF composites at the rest of frequencies are presented in Table 3. As it can be seen there, the increase of frequency causes the decrease of the critical parameter k, which means that the effect of the interphase becomes weaker as the frequency raises. On the contrary, an increase of the σint´ and σint″ with the higher frequency values is observed, which is consistent with the increment of σ´ and σ″ with frequency presented in Figure 6.
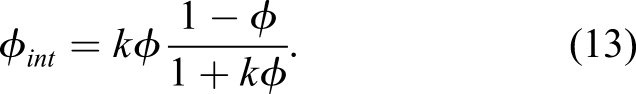
Figure 8 represents the variation of ϕint of PP/CNF composites as a function of the CNF volume fraction calculated by the equation (13) at different frequencies. It is worth noting that ϕint increases linearly with the increment of the CNF volume fraction for all the frequencies. This is an expectable result since the large amount of CNFs should cause an increase of the interphase area between the CNFs and the polypropylene. About this, a previous work has proposed the existence of an interphase composed by two layers on melt-mixed PP/CNF composites produced with a similar type of CNFs (PR 24 AG). That work estimates that the outer layer of that interphase must have a thickness of 102 nm comparable to the radius of gyration of the polymer, whereas the inner layer must have a thickness of the order of 10° nm.
51
Moreover, similarly to k, the increase of frequency causes the decrease of ϕint, which evidences that the interphase contribution to the complex conductivity becomes lower as the frequency increases.
54
In this regard, comparable behaviors of ϕint and k with frequency, calculated by this modified GEM, were reported for carbon black–loaded epoxy composites.
20
Interphase vol. % as a function of CNF vol. % at different frequencies in PP/CNF composites.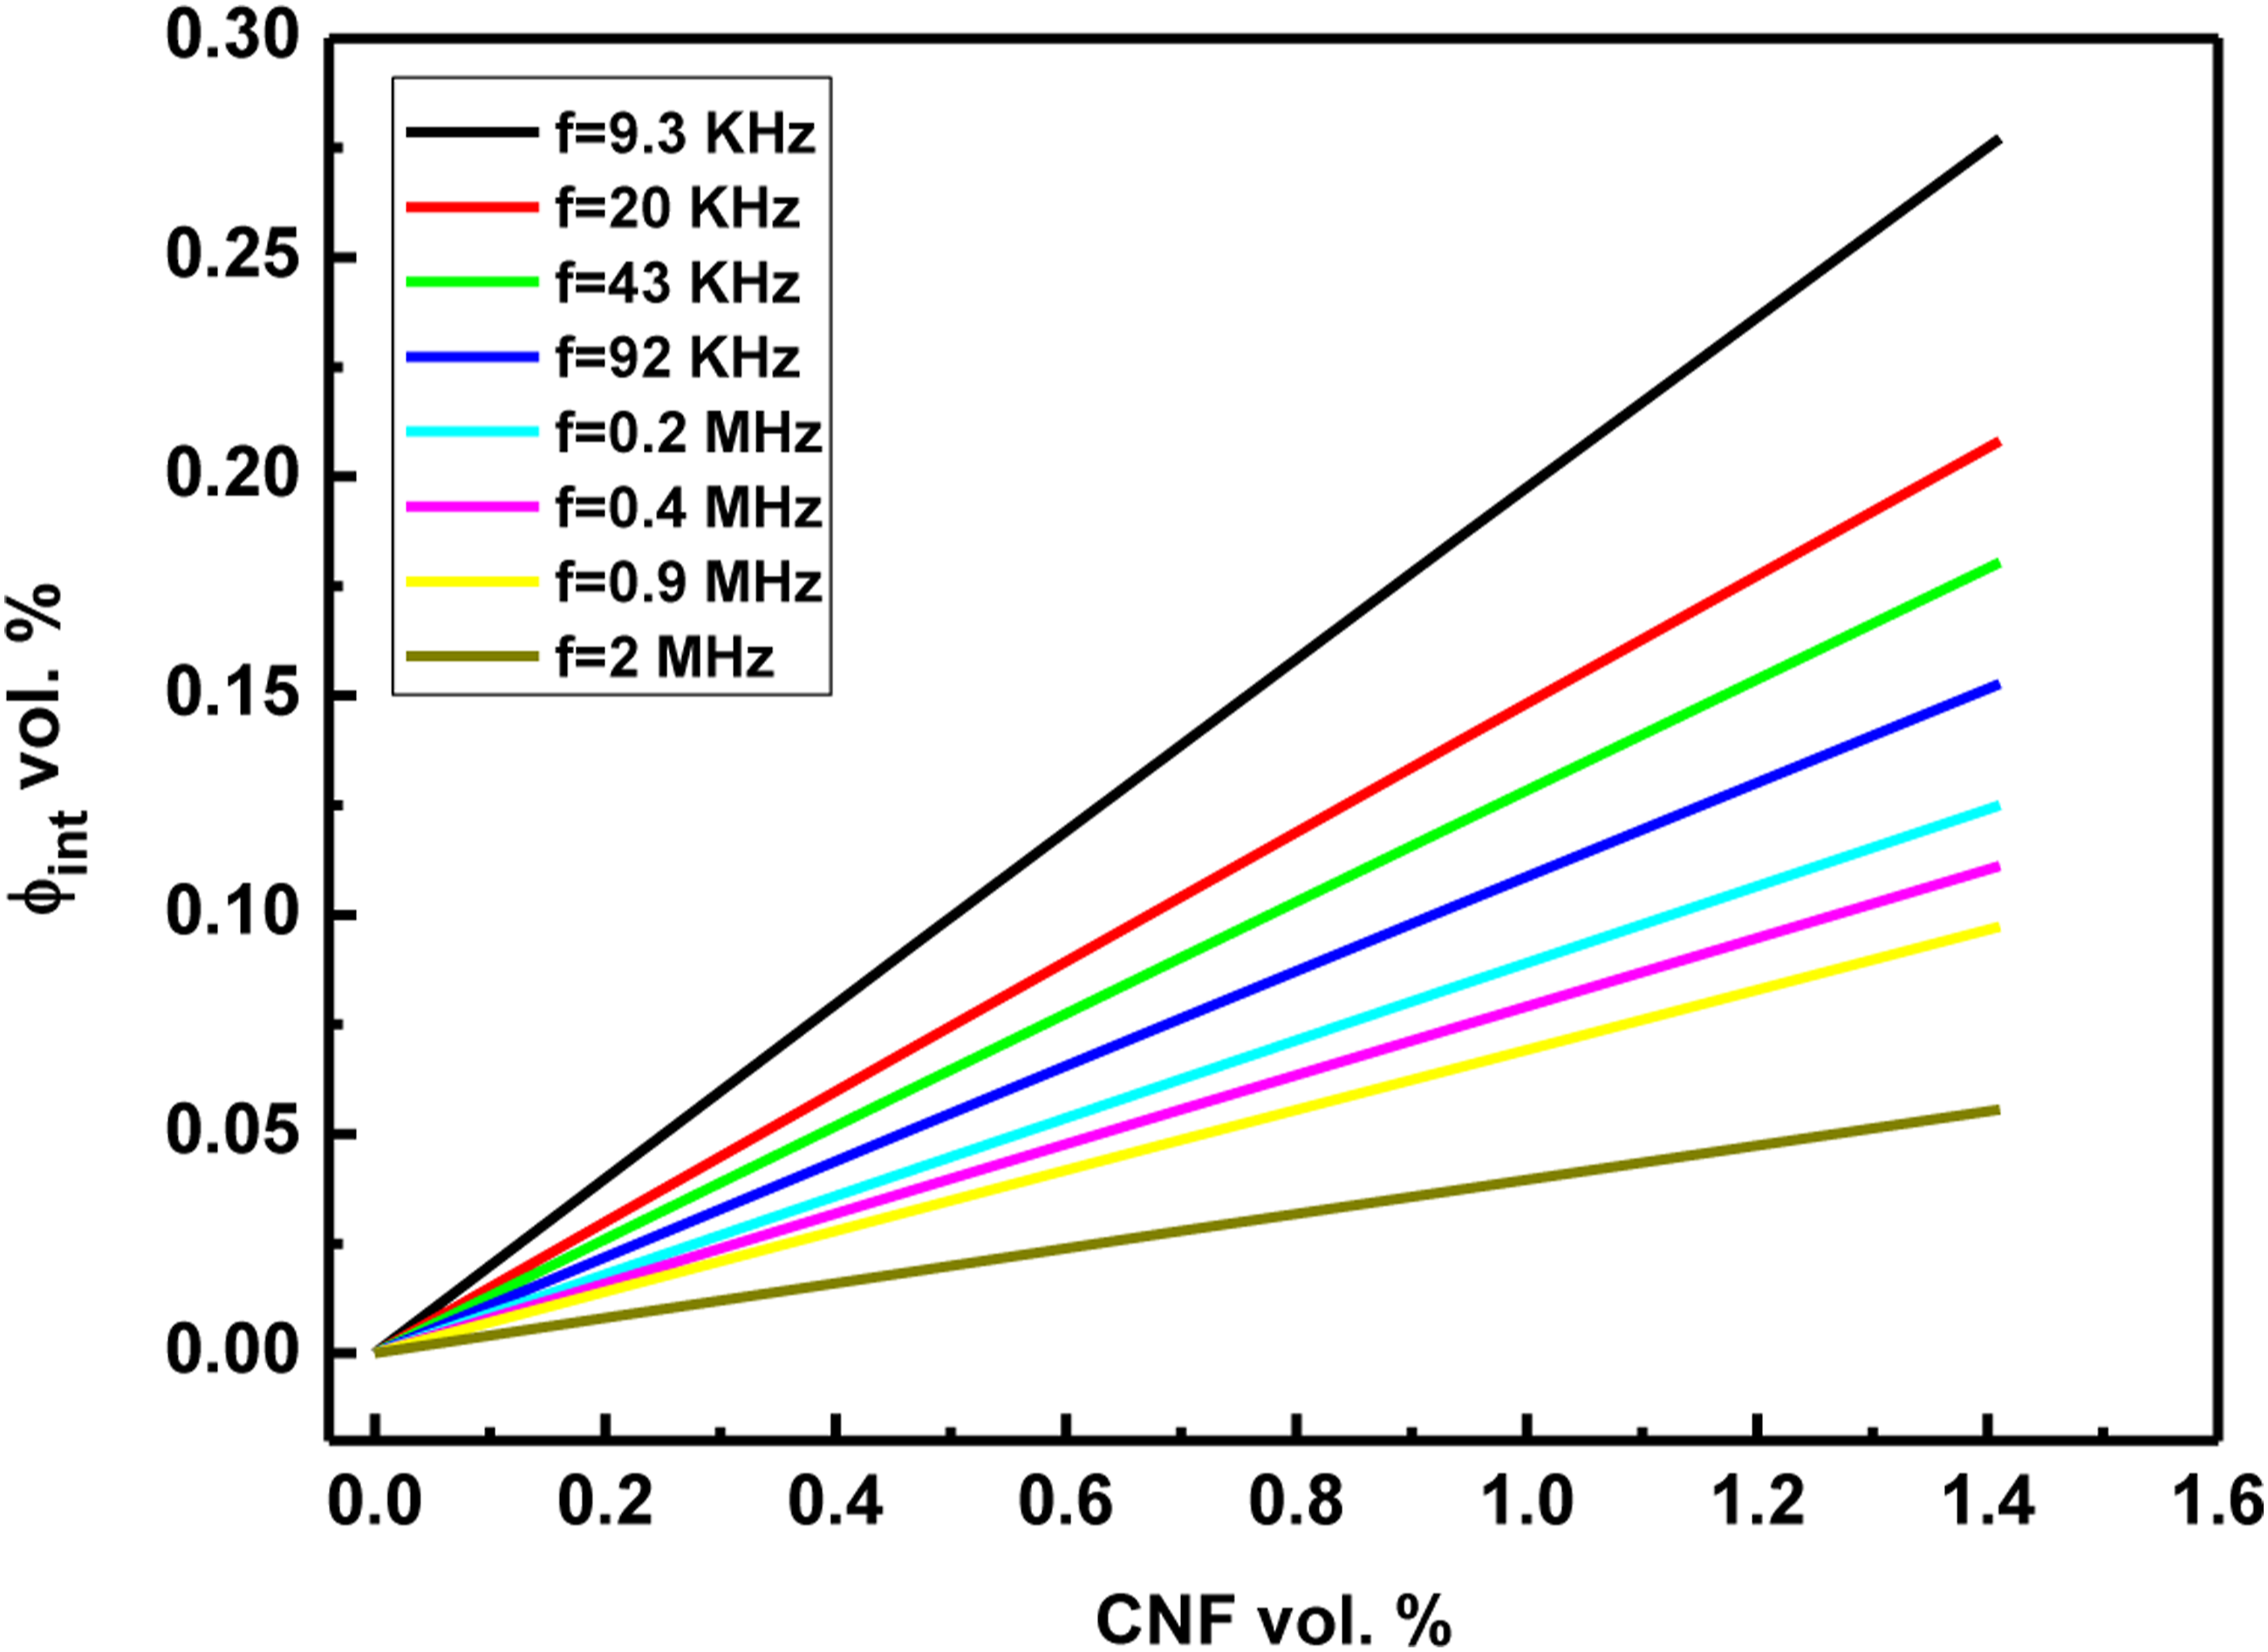
Conclusions
The AC electrical conductivity of melt-extruded low-conducting polypropylene composites with different volume concentrations of CNFs from 0 to 1.4 vol. % at room temperature is reported. The morphologic and structural properties showed that the CNFs formed aggregates randomly distributed within the PP, whereas the degree of crystallinity of the PP was increased in the PP/CNF composites. An insulating–conducting transition was detected near 0.9 vol. % of CNFs. As expected, the highest loaded PP/CNF composites (1.4 vol. %) showed the highest conductivities (σ´ ∼ 8.6 × 10⁻⁵ and σ″ ∼ 8.3 × 10⁻⁴ S m−1) at 2 MHz with respect to the PP (σ´ ∼ 1.2 × 10⁻⁶ and σ″ ∼ 2.7 × 10⁻⁴ S m−1). In addition, the AC electrical conductivity was systematically analyzed by the universal power laws (UPLs), the generalized effective medium model (GEM), and a modified GEM, which takes into consideration the effect of the interphase between the CNFs and the PP. The GEM showed limited applicability for CNF contents above 0.9 vol. %, whereas the values of σ´ (w) and σ″(w) were fitted accurately by the modified GEM, from which the interphase (in vol. %) and conductivity corresponding to that interphase of the PP/CNF composites could be extracted. This study indicates that the interphase between the polymer and the conducting particles may have a quantifiable effect on the electrical properties of carbon-based polymer composites, and this fact should not be neglected in the production of CPCs with the desired electrical properties.
ORCID iDs
A. J. Paleo https://orcid.org/0000-0002-4688-5794
M. E. Achour https://orcid.org/0000-0002-7786-0645
Footnotes
Declaration of conflicting interests
The author(s) declared no potential conflicts of interest with respect to the research, authorship, and/or publication of this article.
Funding
This study was funded by FCT-Foundation for Science and Technology: “Plurianual” 2020–2023 Project UIDB/00264/2020.