
Abstract
This research work aimed to develop smart multifunctional composites via a process for uniformly dispersing carbon nanotubes (CNT) on an orthogonal three-dimensional (3D) woven glass fabric with minimised filtering effect. These smart composites could detect strain under tensile and flexural loading by the piezoresistive response of the infused CNT network. Conventional vacuum assisted resin transfer moulding was modified to control the infusion of 0.25 wt% CNT on the 3D woven glass fabric by varying the vacuum pressure. Results showed that at 101.3 kPa vacuum pressure, the CNT percolated through the thickness of the orthogonal 3D woven glass fabric while being marginally filtered by the fibres and were suitable for sensing tensile strain, whereas at 30.4 kPa, the CNT were deposited only on the surface of the fabric preform without getting filtered and were suitable for sensing flexural strain.
Introduction
Recent advances in material engineering have led researchers to develop novel composite materials with functional properties such as high electrical and thermal conductivity, electromagnetic interference shielding and high capacitance. These composites find application in automotive and aerospace as smart materials capable of having multiple functions such as sensor or energy storage devices, apart from being used as a structural element. Three dimensional (3D) woven fabrics are becoming a preferred choice for manufacturing such composite materials. They have several advantages over two dimensional (2D) laminated composites, such as higher delamination resistance, higher impact strength, resistance to crack propagation and dimensional stability.1,2 The manufacturing of 3D woven preform allows controlling the shape of fabric as well as quantity and material of fibres used, achieving near-net fabric structure and reducing the stress on fibres for complex geometries.3,4 The manufacturing method of 3D weaving also allows incorporating fibres in more than three directions, increasing the load-bearing capacity of composites.5,6 The orthogonal weave is a type of 3D fabric structure with no crimp in the X and Y directional yarns while having marginal crimp in Z direction yarns.
Detection of damage in the composite material is another essential aspect of the product’s quality control. For small parts with simple geometries produced in bulk quantities, damage detection can be done by visual inspection and destructive testing of a sample. However, for complex geometries and expensive parts, more sophisticated non-destructive techniques such as ultrasonic testing, radiography, 7 thermographic testing,8,9 acoustic testing10,11 and shearography testing 12 are being utilised. In all these methods, different types of waves (ultrasonic, infrared, radio, sound, light, etc.) are made incident on the test material and the difference in reflected waves are analysed to detect damage. Apart from being expensive, these techniques are not efficient for monitoring the health of composite material during its actual usage.
A favourable approach is integrating sensors in the composite materials during its manufacturing process, enabling continuous online monitoring. The most straightforward technique is to incorporate optical fibres,13,14 metallic yarns (copper, aluminium, steel, etc.), piezoelectric materials,15,16 yarns coated with conductive dyes,17,18 microcapsules, 19 etc. in the fabric during the weaving process or integrating the sensors directly in the composite structure. 20 Changes in the composite structure due to mechanical load directly affect the optical properties (in case of optical fibres) or the electrical resistance (for conductive elements), which is utilised to measure the stress-strain values and hence monitor the structural health of the material. However, during the weaving process, damage to the sensing elements is severe and often results in the sensor’s improper functioning. As an alternative, conductive nanoparticles are either dispersed in the matrix 21 or applied as a conductive coating on the surface of the composite material, and changes in electrical resistance proportional to the applied load are measured.22-24
The theoretical and experimental investigation has proved that carbon nanotubes (CNT) in epoxy resin conduct electricity by virtue of quantum tunnelling and contact resistance.25,26 Quantum tunnelling is the phenomenon where the electrons can transfer between nanotube structures, which has a gap in the order of magnitude 1 nm. 27 Contact resistance is due to the overlapping of CNT over each other, thus providing a continuous path for electrical conductivity.28,29 The change in electrical resistance of the CNT network corresponding to the change in dimensions of the composite can be attributed to the following mechanisms: a) Change in dimension of the composite sample, b) piezoresistance of individual CNT in response to the external applied strain, 30 c) damage accumulation in the sample 31 and d) change in tunnelling and contact resistance. This technique is used for structural health monitoring (SHM) of composite materials.32,33 Studies also show that to achieve higher strain sensitivity, the content of CNT in the matrix should be close to percolation threshold, 34 however, at low content, the resistance of the CNT network is large, which requires sensitive instruments to measure resistance. Therefore, the filler content is optimised to achieve strain sensitivity and maintain electrical resistance values that commonly available electrical resistance measurement devices can measure.
Methods like chemical vapour deposition (CVD)35,36,37 and vacuum-assisted resin transfer moulding (VARTM) 38 are extensively used for dispersing CNT on fibres or composite substrate. By controlling the growth and dispersion of CNT on the fabric substrate using CVD, the mechanical properties of the composites are enhanced significantly. 39 While the growth of CNT via CVD is a costly process, VARTM provides a low-cost solution. However, during the VARTM process, the CNT are filtered by the fibres due to the difference in flow properties of nanotubes and resin, which leads to a high agglomeration of CNT particles. 40
The filtration of CNT can be minimised by depositing them temporarily on a sticky media and then transferring them on the fibres substrate 41 or spray coating the CNT. 34 As dry fibres are generally non-adhesive, the sticky media tends to pull out the fibres rather than depositing the CNT, so this method is limited to prepregs. The spray-coated CNT on fibres are usually covered by nonconducting resin after the infusion process. In order to access the conductive CNT, a thin layer of resin needs to be removed, leading to the formation of a defect in the composite. Other techniques to reduce filtration is to direct the flow of resin perpendicular to the fibre layup. This can be achieved by placing a porous media (sponge) impregnated with resin directly on the fibre surface and applying pressure. The sponge serves as flow media and reservoir simultaneously. 42 However, this method is still not explored for percolation of nanoparticles and resin mixture on 3D woven fabric preform. The air bubbles entrapped between the sponge and fibres leave dry spots in the composite, rendering it unfit for a successful resin infusion process.
Unlike 2D laminates, 3D woven preforms have only outer surface area to incorporate matrix and filler particles; thus, a research gap was detected in localised infusion methods of CNT on 3D woven fabric substrates for SHM application. This work aims to develop multifunctional composites by locally infusing CNT in a designated area, such that filtering by the fibres is minimised. The smart nanocomposite thus prepared can function as a strain sensor and detect early damage of the fibre and matrix while being cost-effective and easy to manufacture. To make the nanocomposites effective for sensing tensile strain, 0.25 wt% CNT were initially deposited on an absorbent knitted fabric material, which was later placed on a specific area on the surface of fibre reinforcement and 101.3 kPa vacuum pressure was applied to transfer the CNT through the thickness of fibre substrate. In the next step, pure epoxy was infused to manufacture 3D woven composite. To make the nanocomposites effective for sensing flexural loading, the same porous media technique was used at 30.4 kPa vacuum pressure to transfer the CNT on the surface of the orthogonal 3D fabric. The change in electrical resistance of the CNT network corresponding to the tensile and bending strain was monitored and logged. To distinguish the piezoresistance signals obtained during tensile loading of the nanocomposite, specimens of 0.25 wt% CNT cast on the surface of the pure epoxy 3D woven composite substrate were manufactured and subjected to tensile loading. The orthogonal 3D woven fabric was infused with CNT modified matrix using the conventional VARTM technique to compare the filtration effect and agglomeration of nanoparticles. The resultant composites were studied under an optical microscope and scanning electron microscope (SEM) to observe the percolation of CNT, their adhesion to interior fibres and compare the uniformity of CNT distribution by vacuum transfer method. The results of tensile testing were analysed with a correlation of resistance with the strain, whereas the results of flexural testing were analysed and compared with previous research works.17, 20, 34
Materials and methods
CNT-epoxy masterbatch preparation
NC 7000™ multi-walled CNT with an average diameter of 10 nm were procured in powder form from Nanocyl® (Belgium). Biresin™ CR-122 Bisphenol F epoxy resin and amine hardener were supplied by Sika GmBH® (Germany). 0.13 g of CNT were added to 100 mL hexane and uniformly dispersed using 5 min sonication. 6.37 g of epoxy resin was added to the solution and mechanically stirred until the hexane solution was again transparent. Epoxy-CNT sediment was collected from a solution and was degassed in a vacuum (50°C) for 1 h. Thus, a mixture of epoxy with uniformly dispersed 2 wt% CNT particles was obtained.
Sample preparation
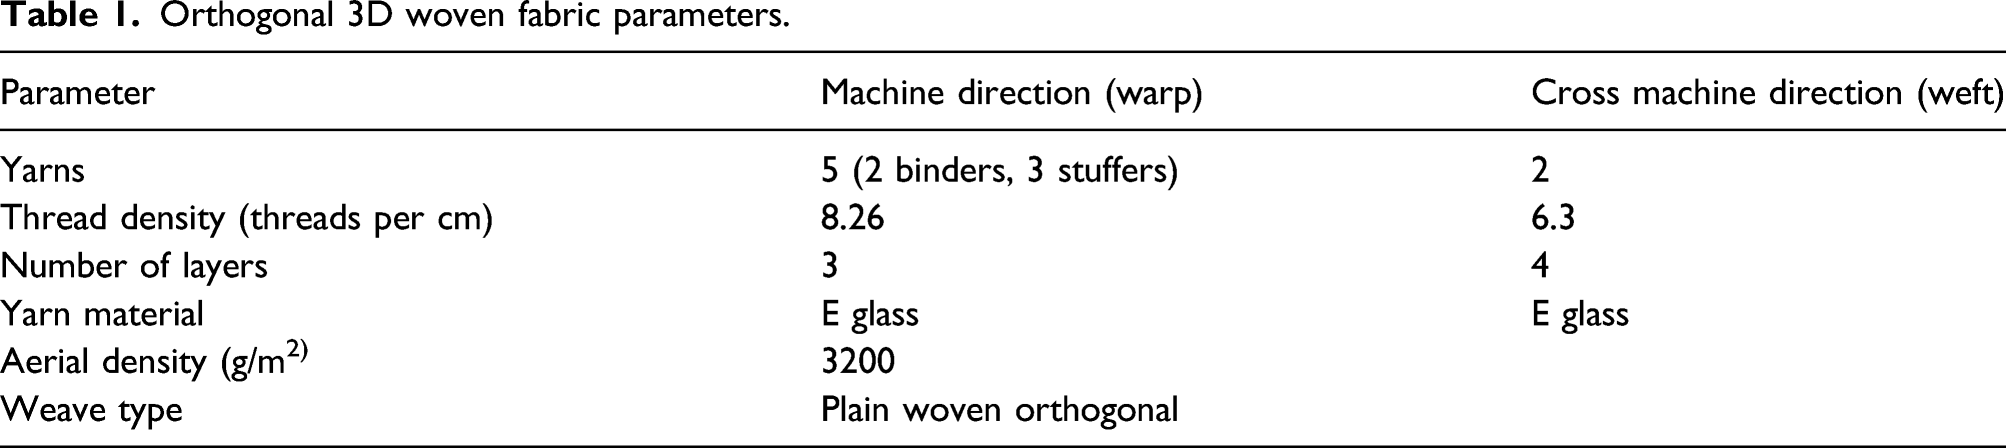
The orthogonal E glass fabric, as shown in Figure 1 supplied by TexTech Industries® (USA), was used as reinforcement. The fabric parameters from the supplier’s datasheet are shown in Table 1. The overall fibre content was 51 vol% with 49 wt% X fibres, 48 wt% Y fibres, 3 wt% Z fibres and 2.2 mm total thickness. Bisphenol F resin with amine hardener was used as a matrix. Texgen® model of orthogonal 3D woven fabric unit cell. Orthogonal 3D woven fabric parameters.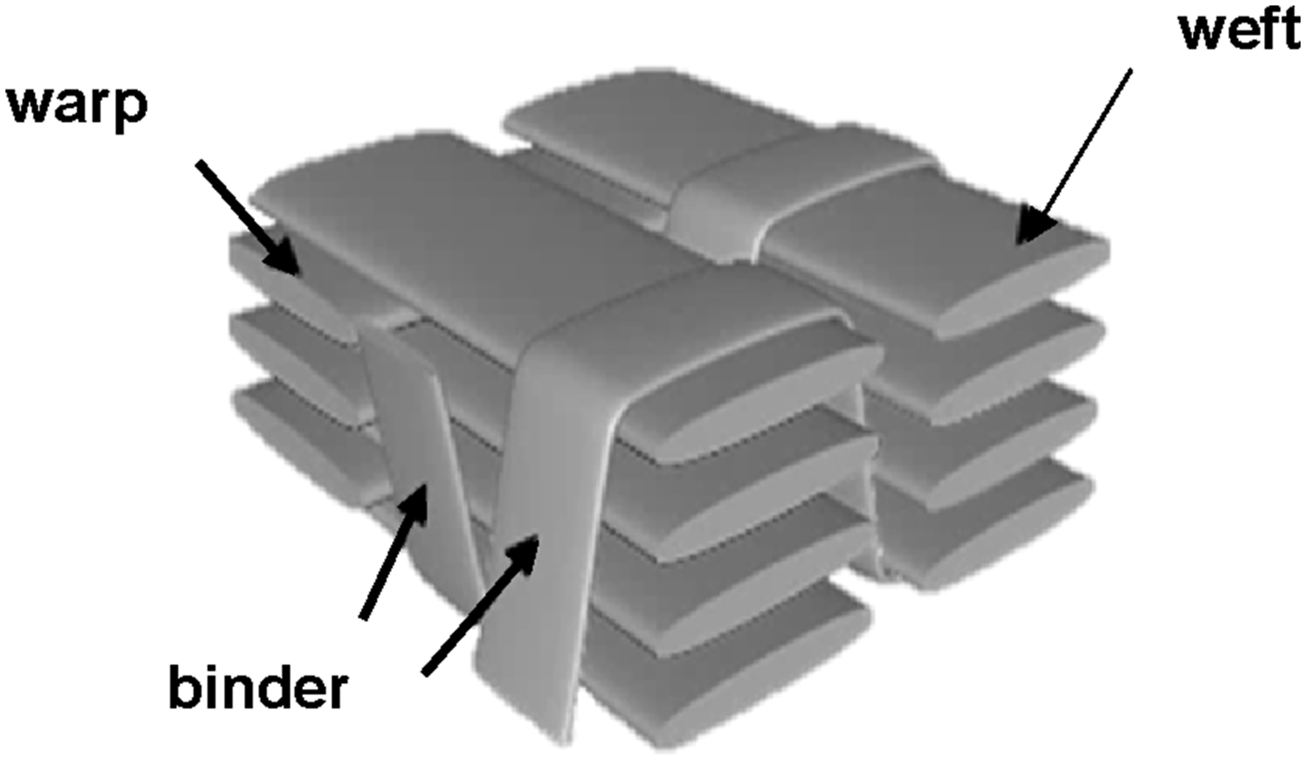
Sample codes and manufacturing methods.
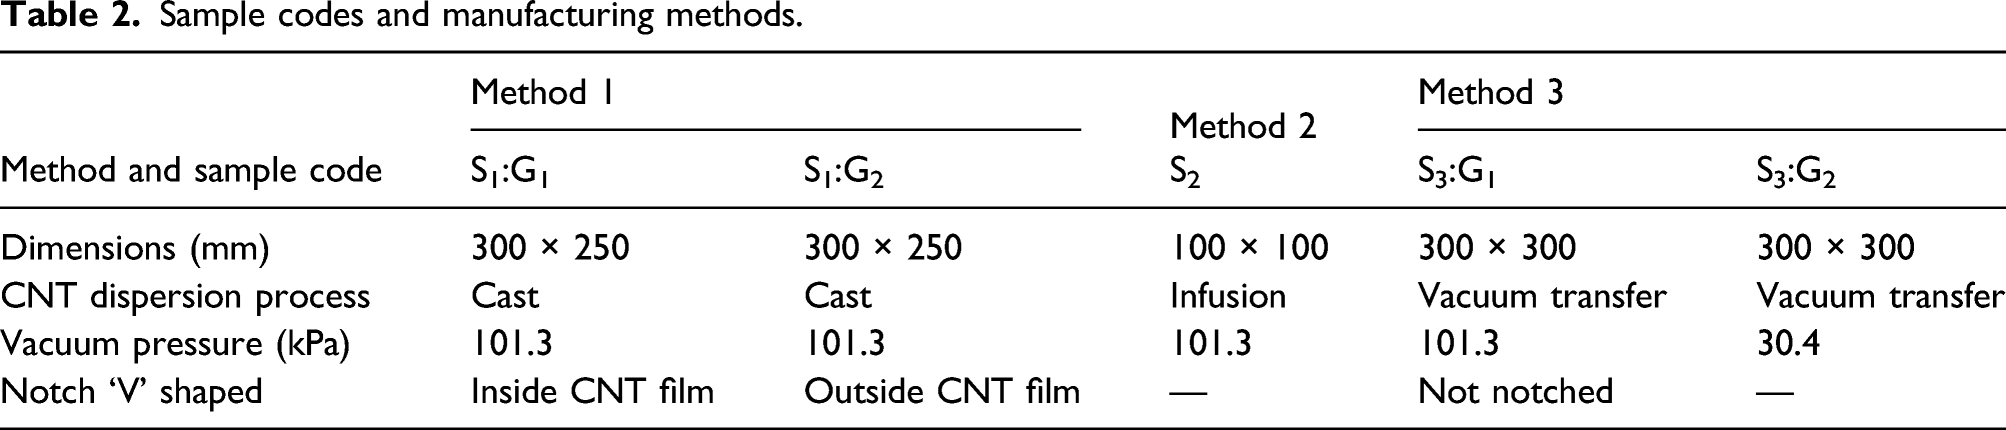
In Method 1, the 3D woven fabric was infused with pure epoxy by conventional VARTM process and cured at room temperature for 12 h. In the next step, 0.25 wt% CNT in epoxy resin was cast as a film on the 3D woven composite by a doctor blade. The CNT mixtures in epoxy were prepared by diluting the 2 wt% CNT masterbatch with epoxy resin for 0.25 wt% to achieve electrical resistance in the order of 103 Ω. The length of the cast was 50 mm and thickness was 100 μm. The castings were left to harden at room temperature for 12 h and then post-cured in an oven at 80°C for 5 h.
In Method 2, 3D woven fabric was infused with a mixture of pure epoxy and 0.25 wt% CNT filler using the VARTM process. The composites were cured for 12 h at room temperature and post cured at 80°C for 5 h. In Method 3, the CNT were impregnated directly on the fibres in a perpendicular direction, as shown in Figure 2a. Porous nylon knitted spacer fabric was used to absorb the mixture of 0.25 wt% CNT and epoxy. The porous media functioned as a reservoir and distribution channel for CNT. Three strips, each of 250 mm × 25 mm were used to absorb 0.25 wt% CNT and were placed on the orthogonal 3D woven fabric preform, separated by peel ply. The vacuum pressure was applied to the entire layup to transfer the CNT on the fibre surface and cured for 12 h. To control the infusion of CNT, sample S3:G1 was given 101.3 kPa and sample S3:G2 was given 30.4 kPa vacuum pressure. After CNT curing for 12 h, the resin was infused in the orthogonal 3D woven fibre reinforcement by conventional VARTM method as shown in Figure 2b and cured for another 12 h before post-curing the final composite at 80°C for 5 h. The filtration of CNT by peel ply was found to be 1.12 g, by taking the difference between dry and impregnated peel ply sheet. Modified VARTM processes: (a) stacking sequence in layup; (b) schematic of the process.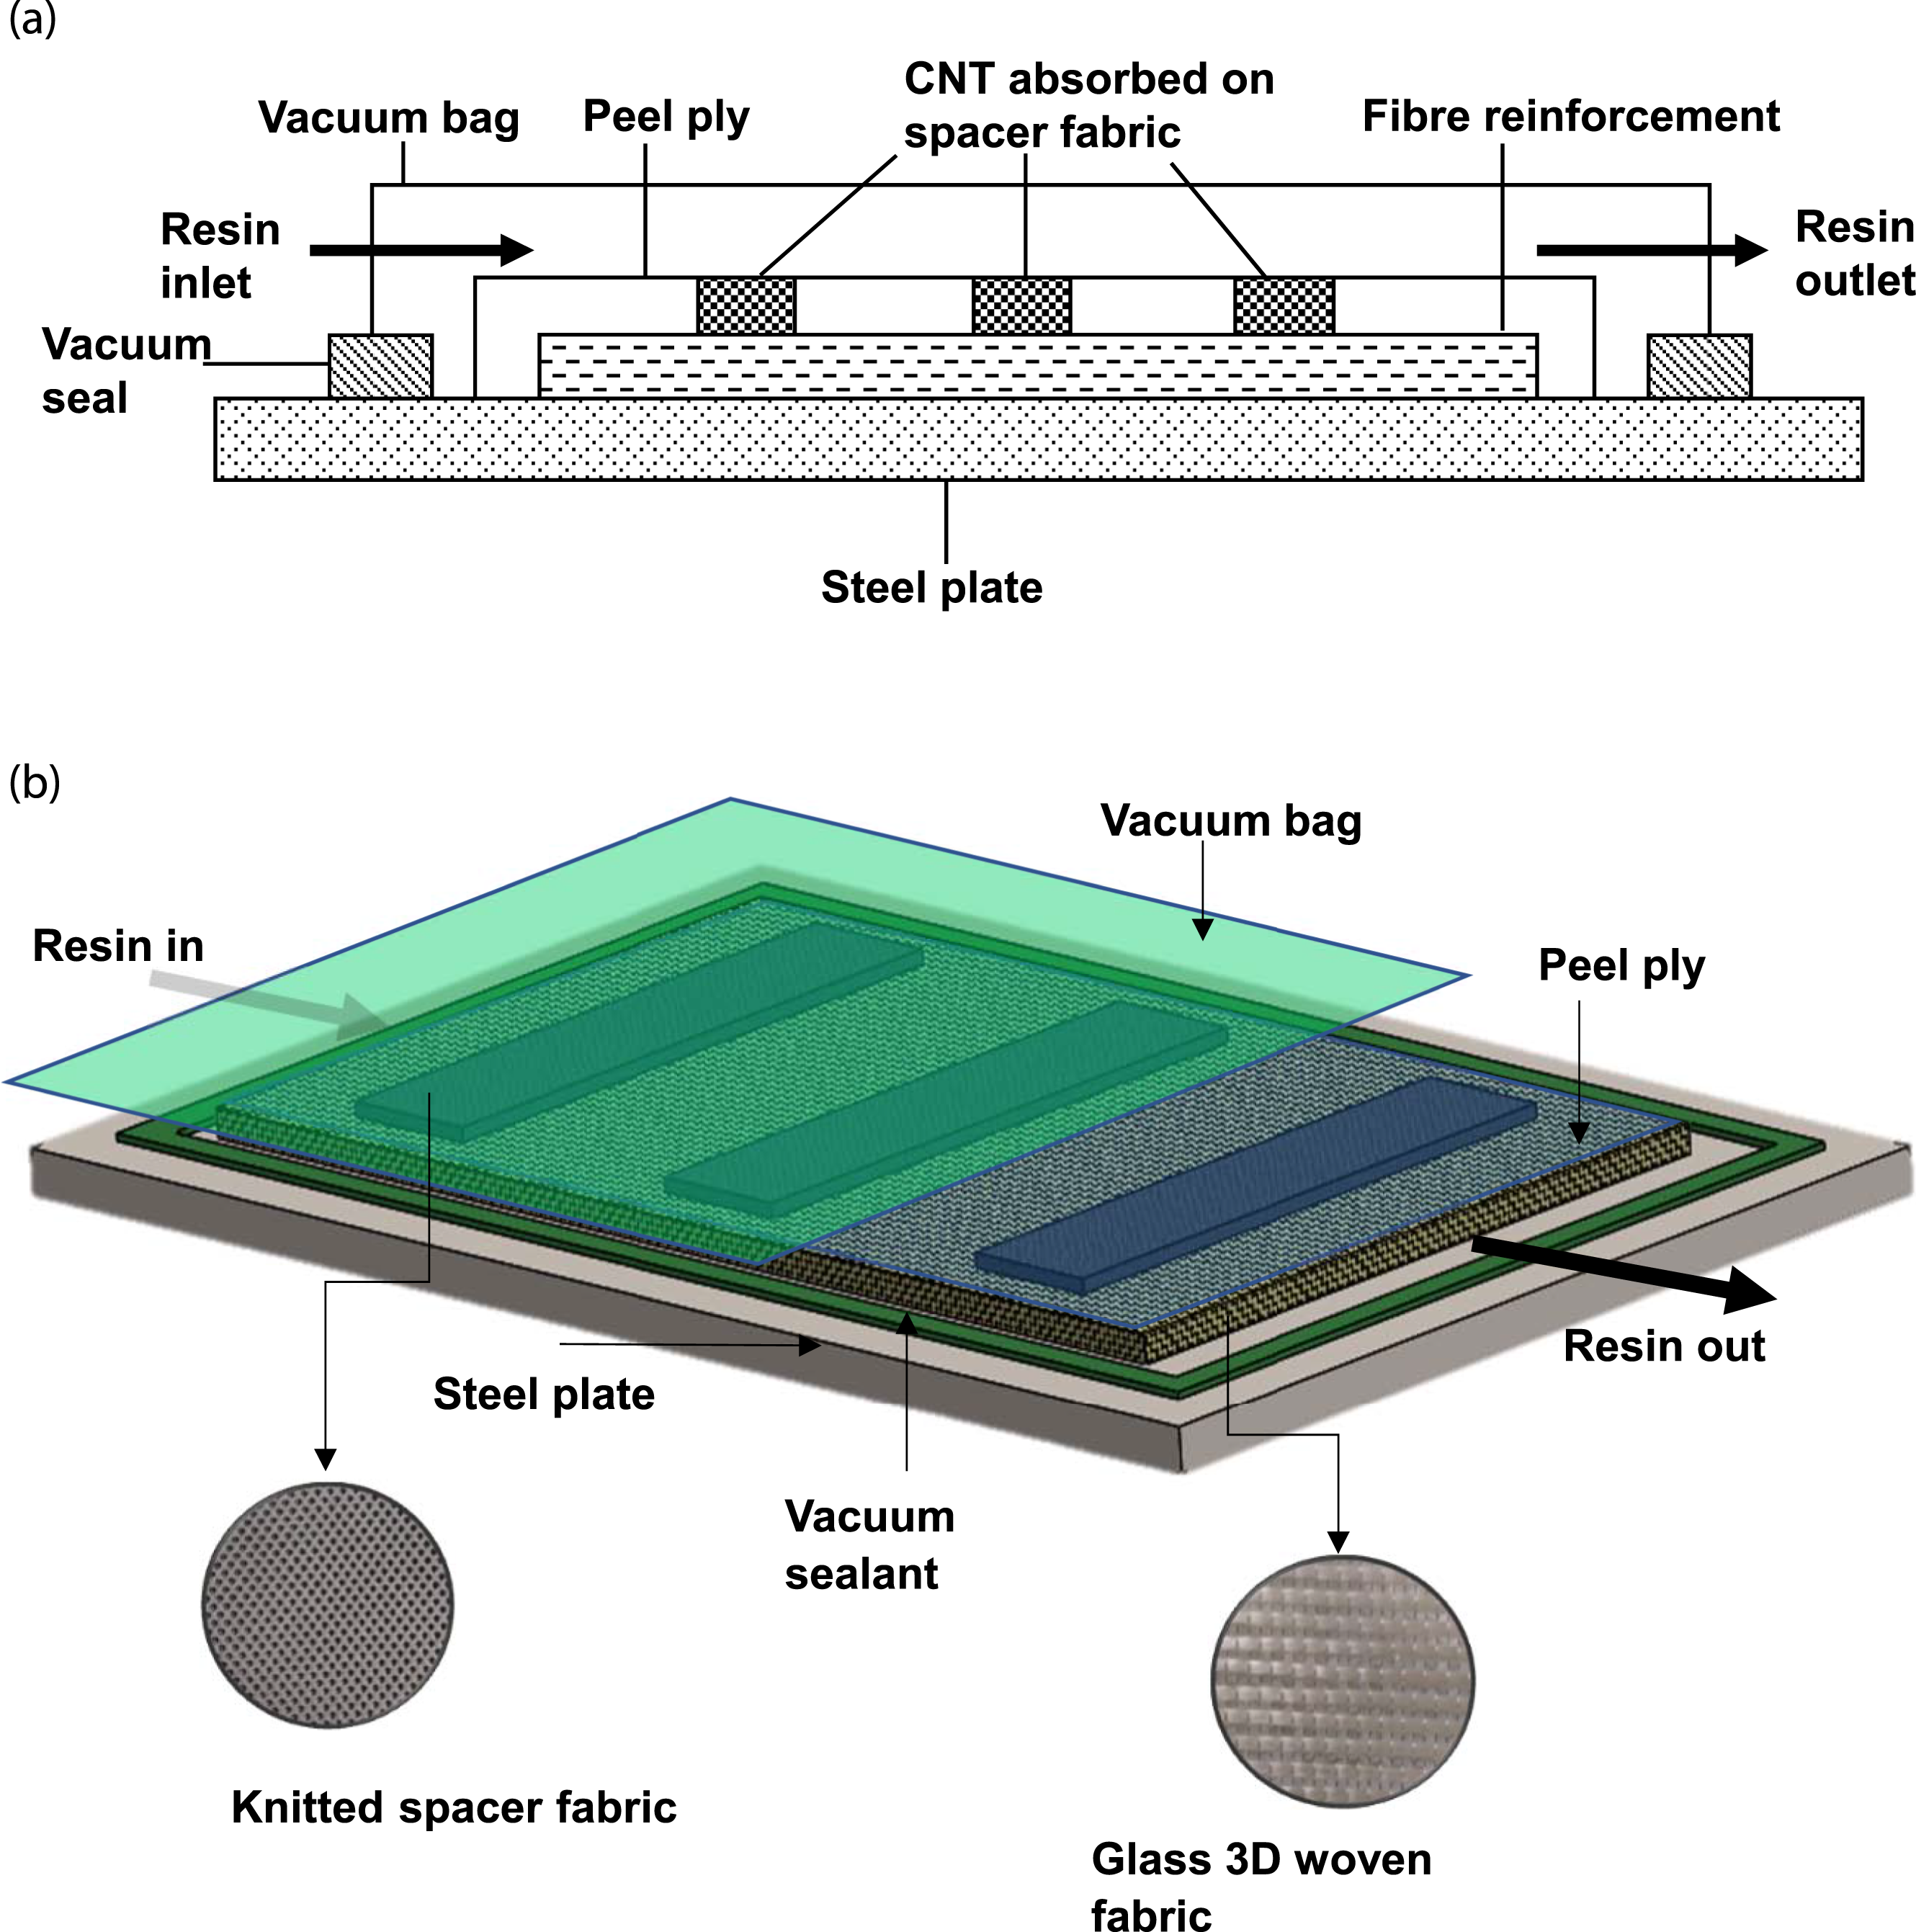
Microscope characterisation
Composite panels of S2 and S3:G2 were cut in 15 mm × 30 mm to study under the optical microscope. The samples were placed on a sodium lamp backlight such that the glass fibres infused with epoxy were transparent to the wavelength of sodium light, whereas the CNT were opaque. The CNT distribution could be identified as dark spots against the transparent composite at 80× and 800× magnification. The samples of S3:G1 were cut 5 mm × 5 mm in warp direction for SEM characterisation by FEI Quanta 200™ FEG.
Tensile test
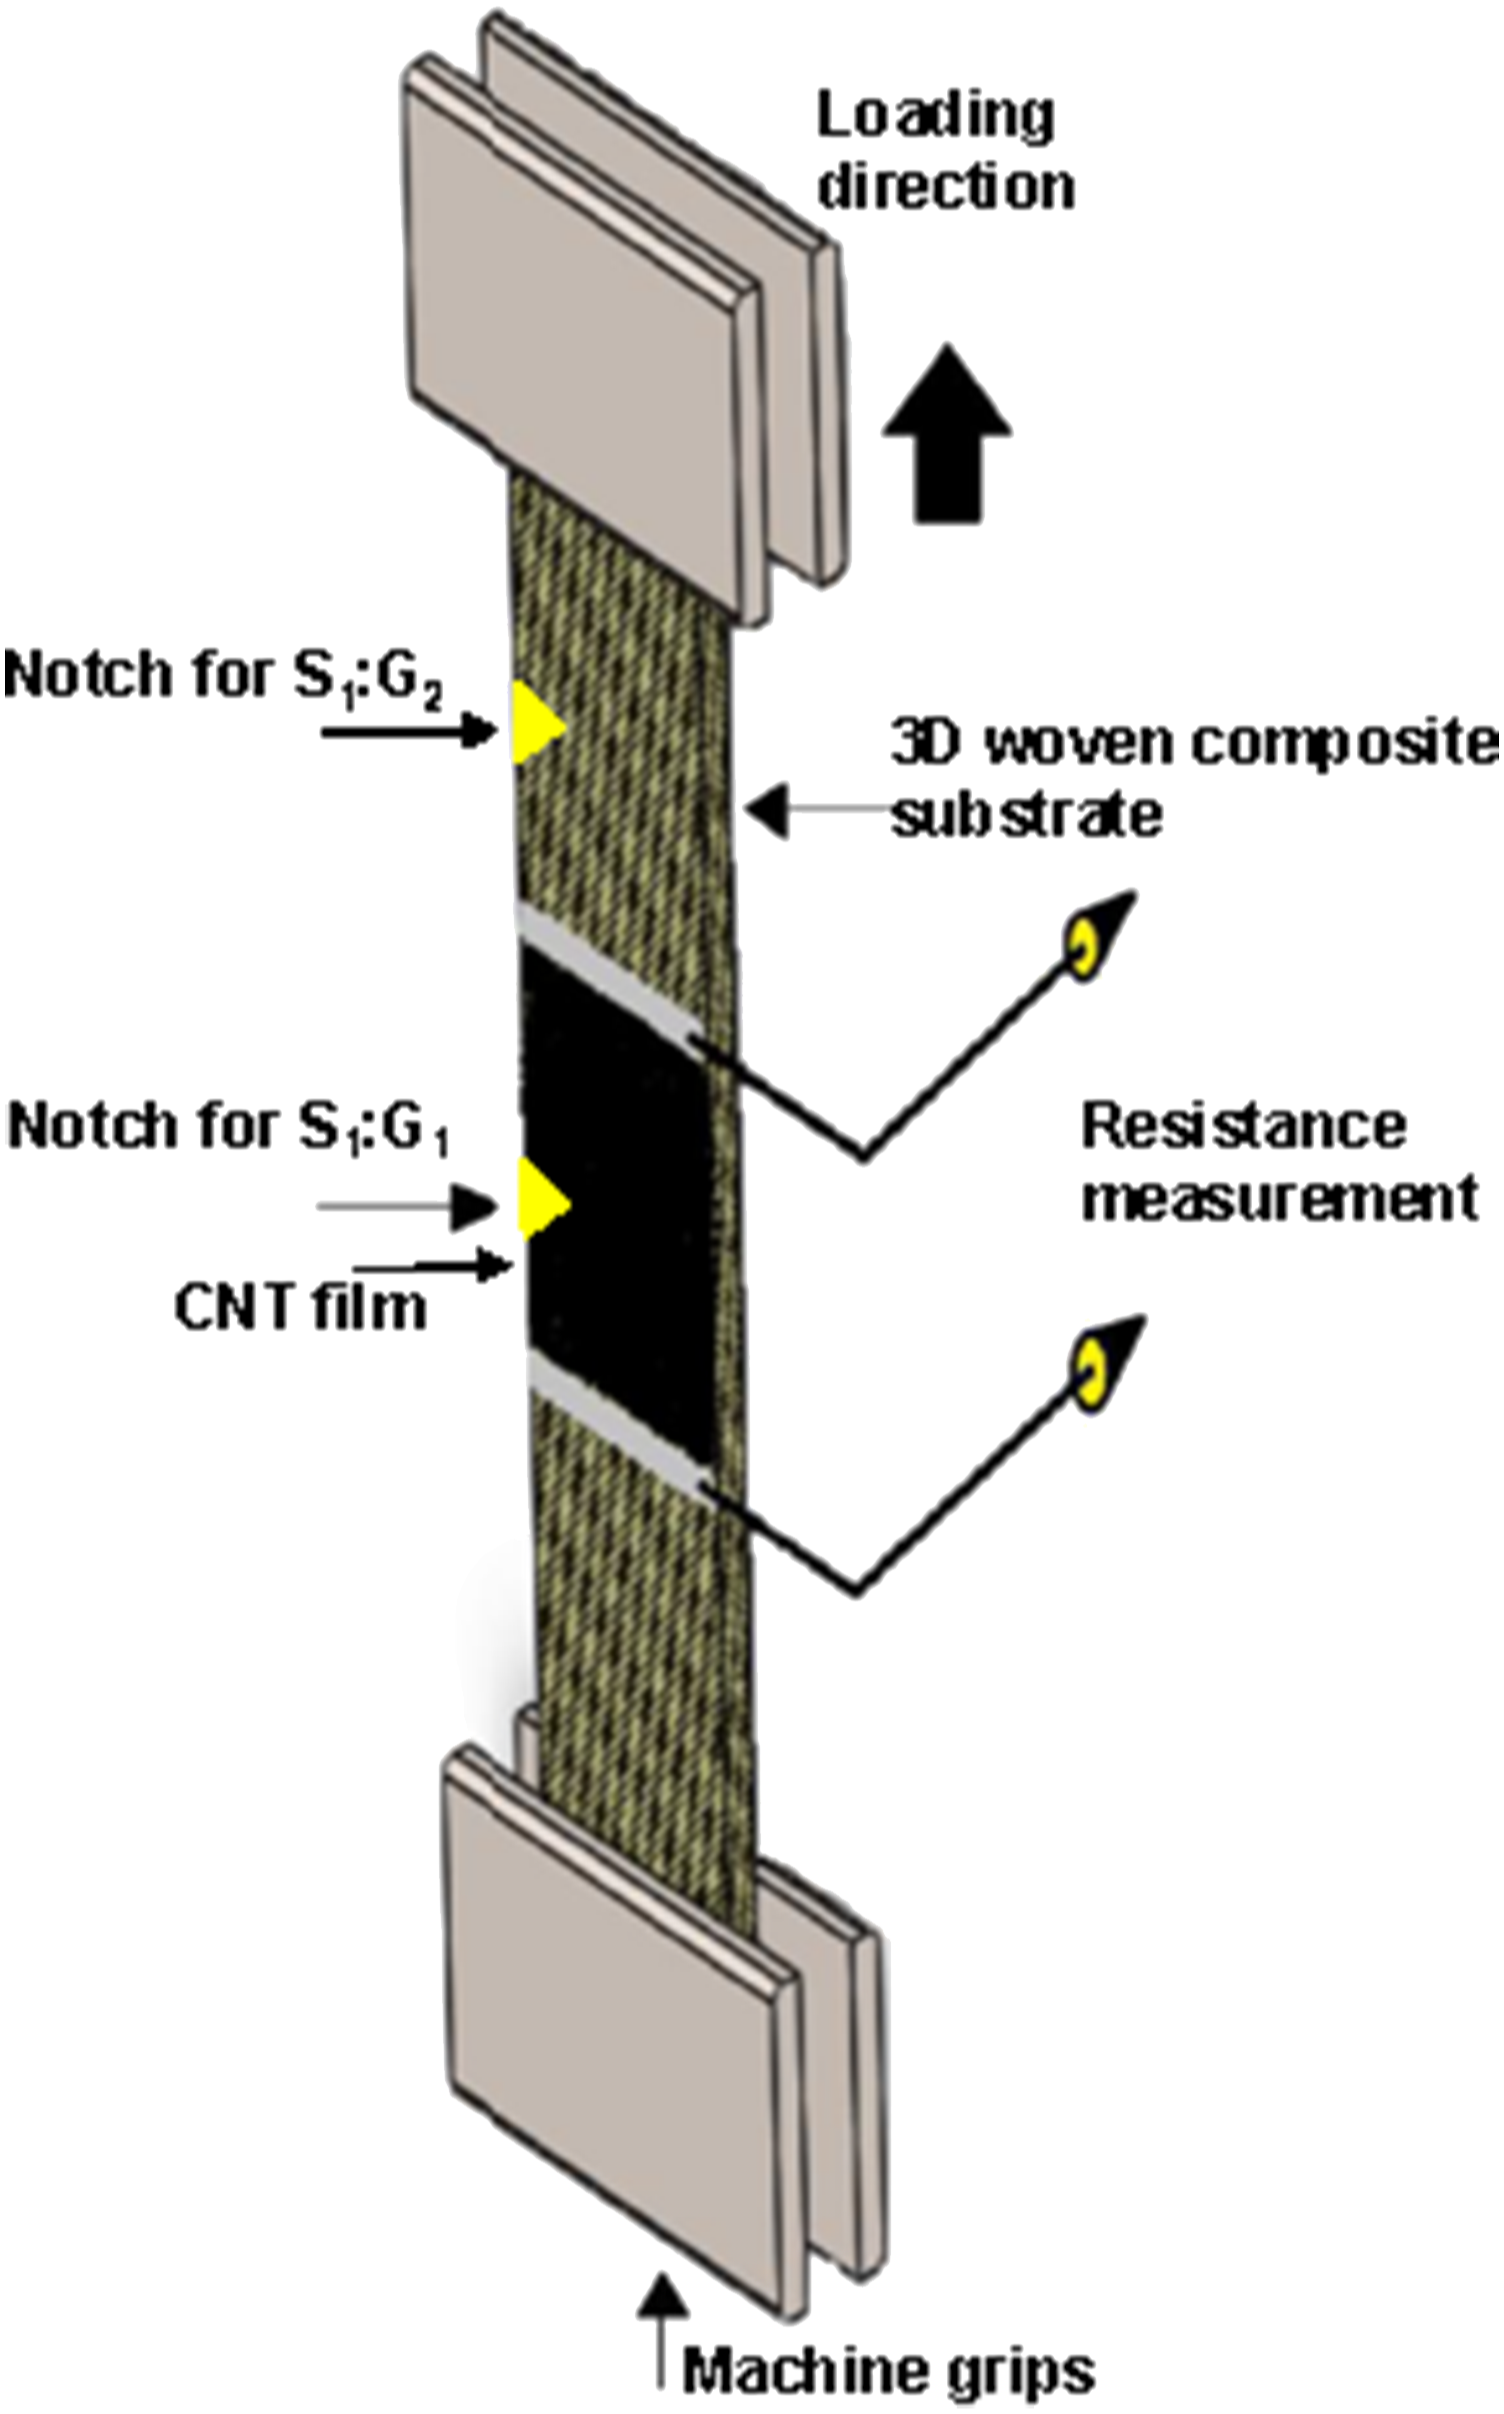
The specimens of method 1 were cut in 250 mm × 25 mm by waterjet cutting machine and divided in two groups S1:G1 and S1:G2, respectively, to study the nature of CNT sensor signal during the event of fracture energy absorption. It was found from initial experimental comparison between unnotched and notched samples that the presence of notch does not affect the tensile and electrical properties of the samples. The sensor consists of network of individual CNT and small damage does not disturb its structural integrity unlike that of a bulk material. Thus, a ‘V’ shaped notch of 1 mm was made at the edge of the samples in S1:G1 to act as a damage initiation point inside CNT film, as shown in Figure 3. A similar notch was made on S1:G2 at the edge, such that damage would initiate outside the CNT film. Specimens of S3:G1 were not notched. Five specimens of S1:G1, S1:G2 and S3:G1 each were prepared for testing in order to achieve reproducibility of results. Copper wires were soldered on CNT castings and silver paste was applied at the electrodes to decrease the contact resistance. The composite samples were tested on the Zwick Roell Z050 UTM machine with a load cell capacity of 50 kN according to ASTM D 3039 at the crosshead speed of 2 mm/min with external extensometer of 50 mm gauge length. The tips of the extensometer were mounted with special insulating clip to avoid electrical contact with the CNT sensor. The specimens were not tabbed and directly gripped by machine grips with insulating sandpaper layers to avoid electrical contact. Fluke 287 RMS multimeter with IR 3000 Bluetooth data acquisition system was used to continuously monitor the electrical resistance of the CNT network by two probe method during tensile loading. The contact resistance of the lead wires was constant 0.8 Ω, calculated by taking the difference between measurement values of 2-probe and 4-probe resistance method of the samples. To establish a relation between applied strain and resistance, statistical correlation coefficient and gauge factor (GF) were calculated. Gauge factor is defined as a ratio of the relative change of absolute resistance to strain in the composite Tensile testing of 3D woven composites with CNT film.
Flexural test
Composite samples S3:G1 and S3:G2 were tested under flexural loading using the 3-point bending test according to ISO-14125 on Tinius Olsen with load cell capacity of 10 kN. The samples were cut in 80 mm × 15 mm strips and placed like a beam on two bottom rollers of diameter 10 mm with a span length of 64 mm. At the exact centre of the span length, the bending force was applied by a top roller with a 10 mm diameter at the speed of 1 mm/min. All the rollers were covered with insulating tape of rough surface to avoid electrical contact and mechanical slippage with the specimen. Five samples of S3:G1 and S3:G2 each were tested to achieve reproducibility of the results. Copper wires were soldered on CNT castings and silver paste was applied at the electrodes to decrease the contact resistance. The Fluke 287 RMS multimeter with IR 3000 Bluetooth data acquisition system was used to measure and log the resistance values by two probe method, as shown in Figure 4. Composite samples flexural loading and resistance measurement schematics: (a) through-thickness; (b) single surface.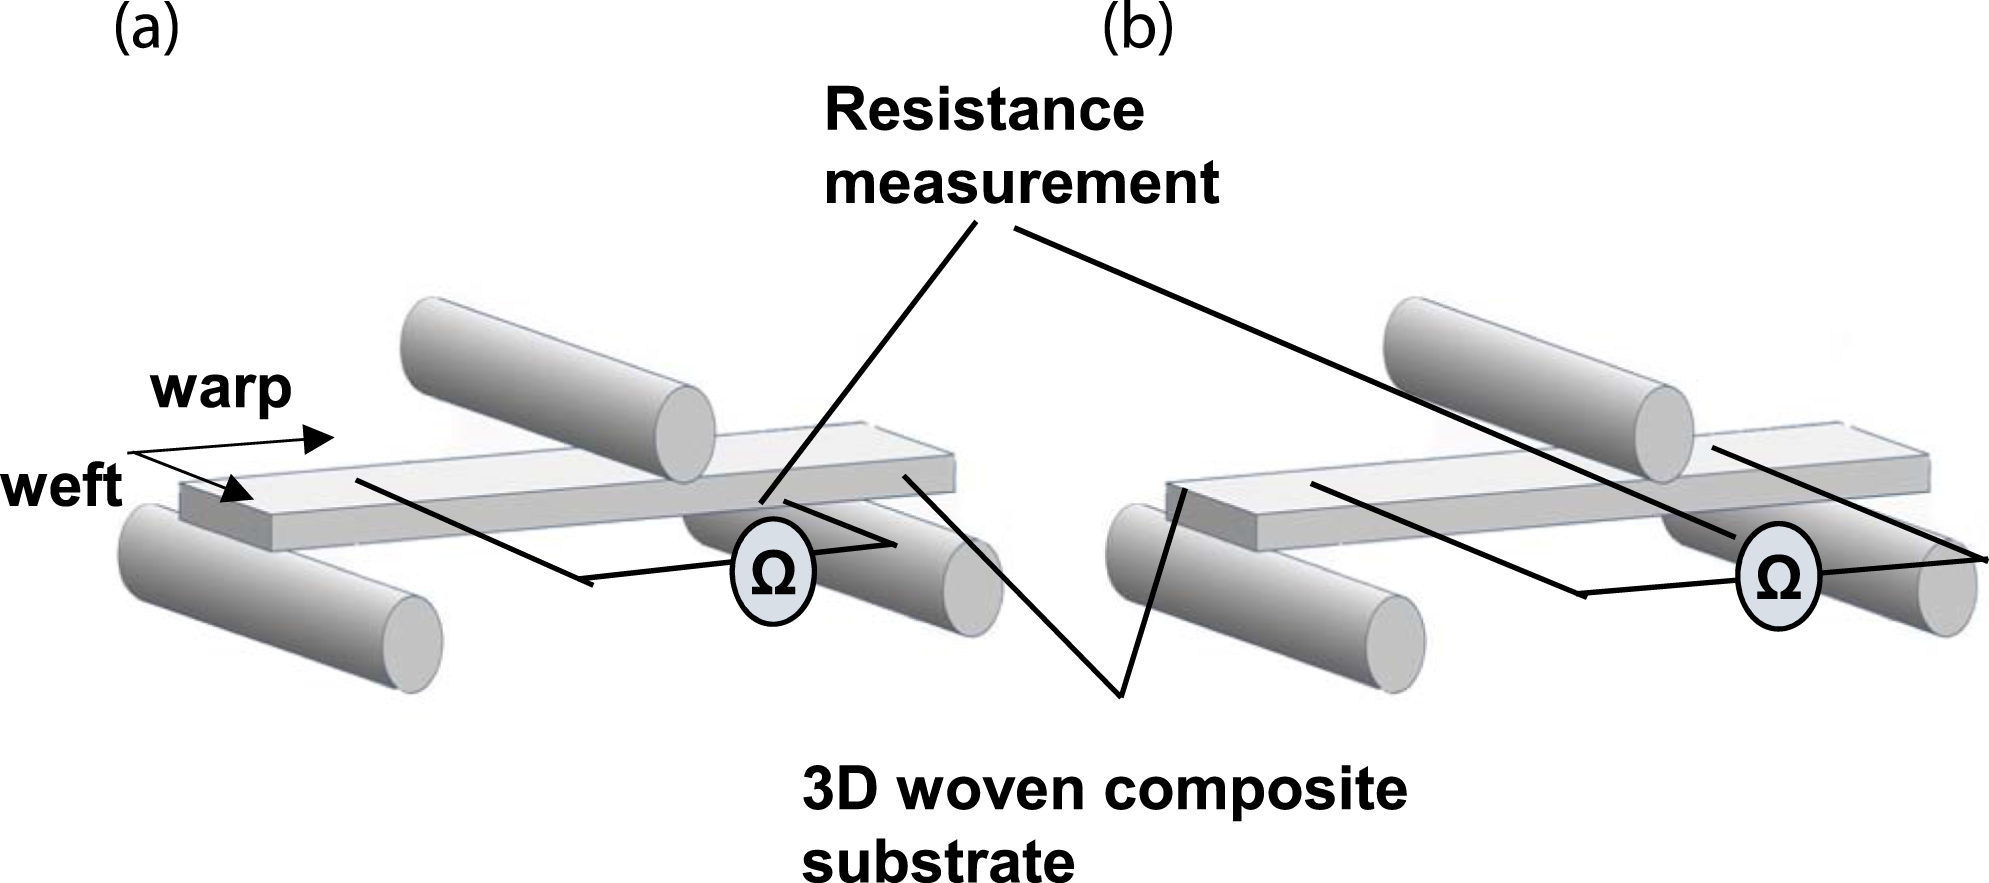
The electrodes were placed across the sample’s thickness for S3:G1 and along the same surface for S3:G2, as shown in Figures 4(a) and (b), respectively. The conductive CNT network of sample S3:G2 was subjected to tensile and compressive stress in an individual flexural test. The samples’ stress σ
f
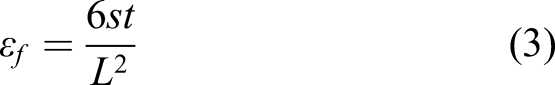
in MPa and strain ε
f
in mm/mm were calculated by equations (2) and (3)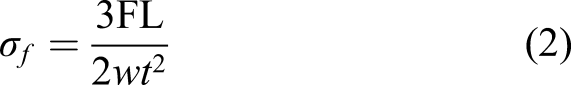
Results and discussion
Investigation of CNT infusion
The dispersion of CNT was studied in composite samples. Figures 5(a) to (c) shows sample S2, while Figures 5(d) to (f) shows sample S3:G2 in successive magnifications. CNT infusion by conventional VARTM process (a)–(c). CNT infusion by vacuum transfer process (d)–(f).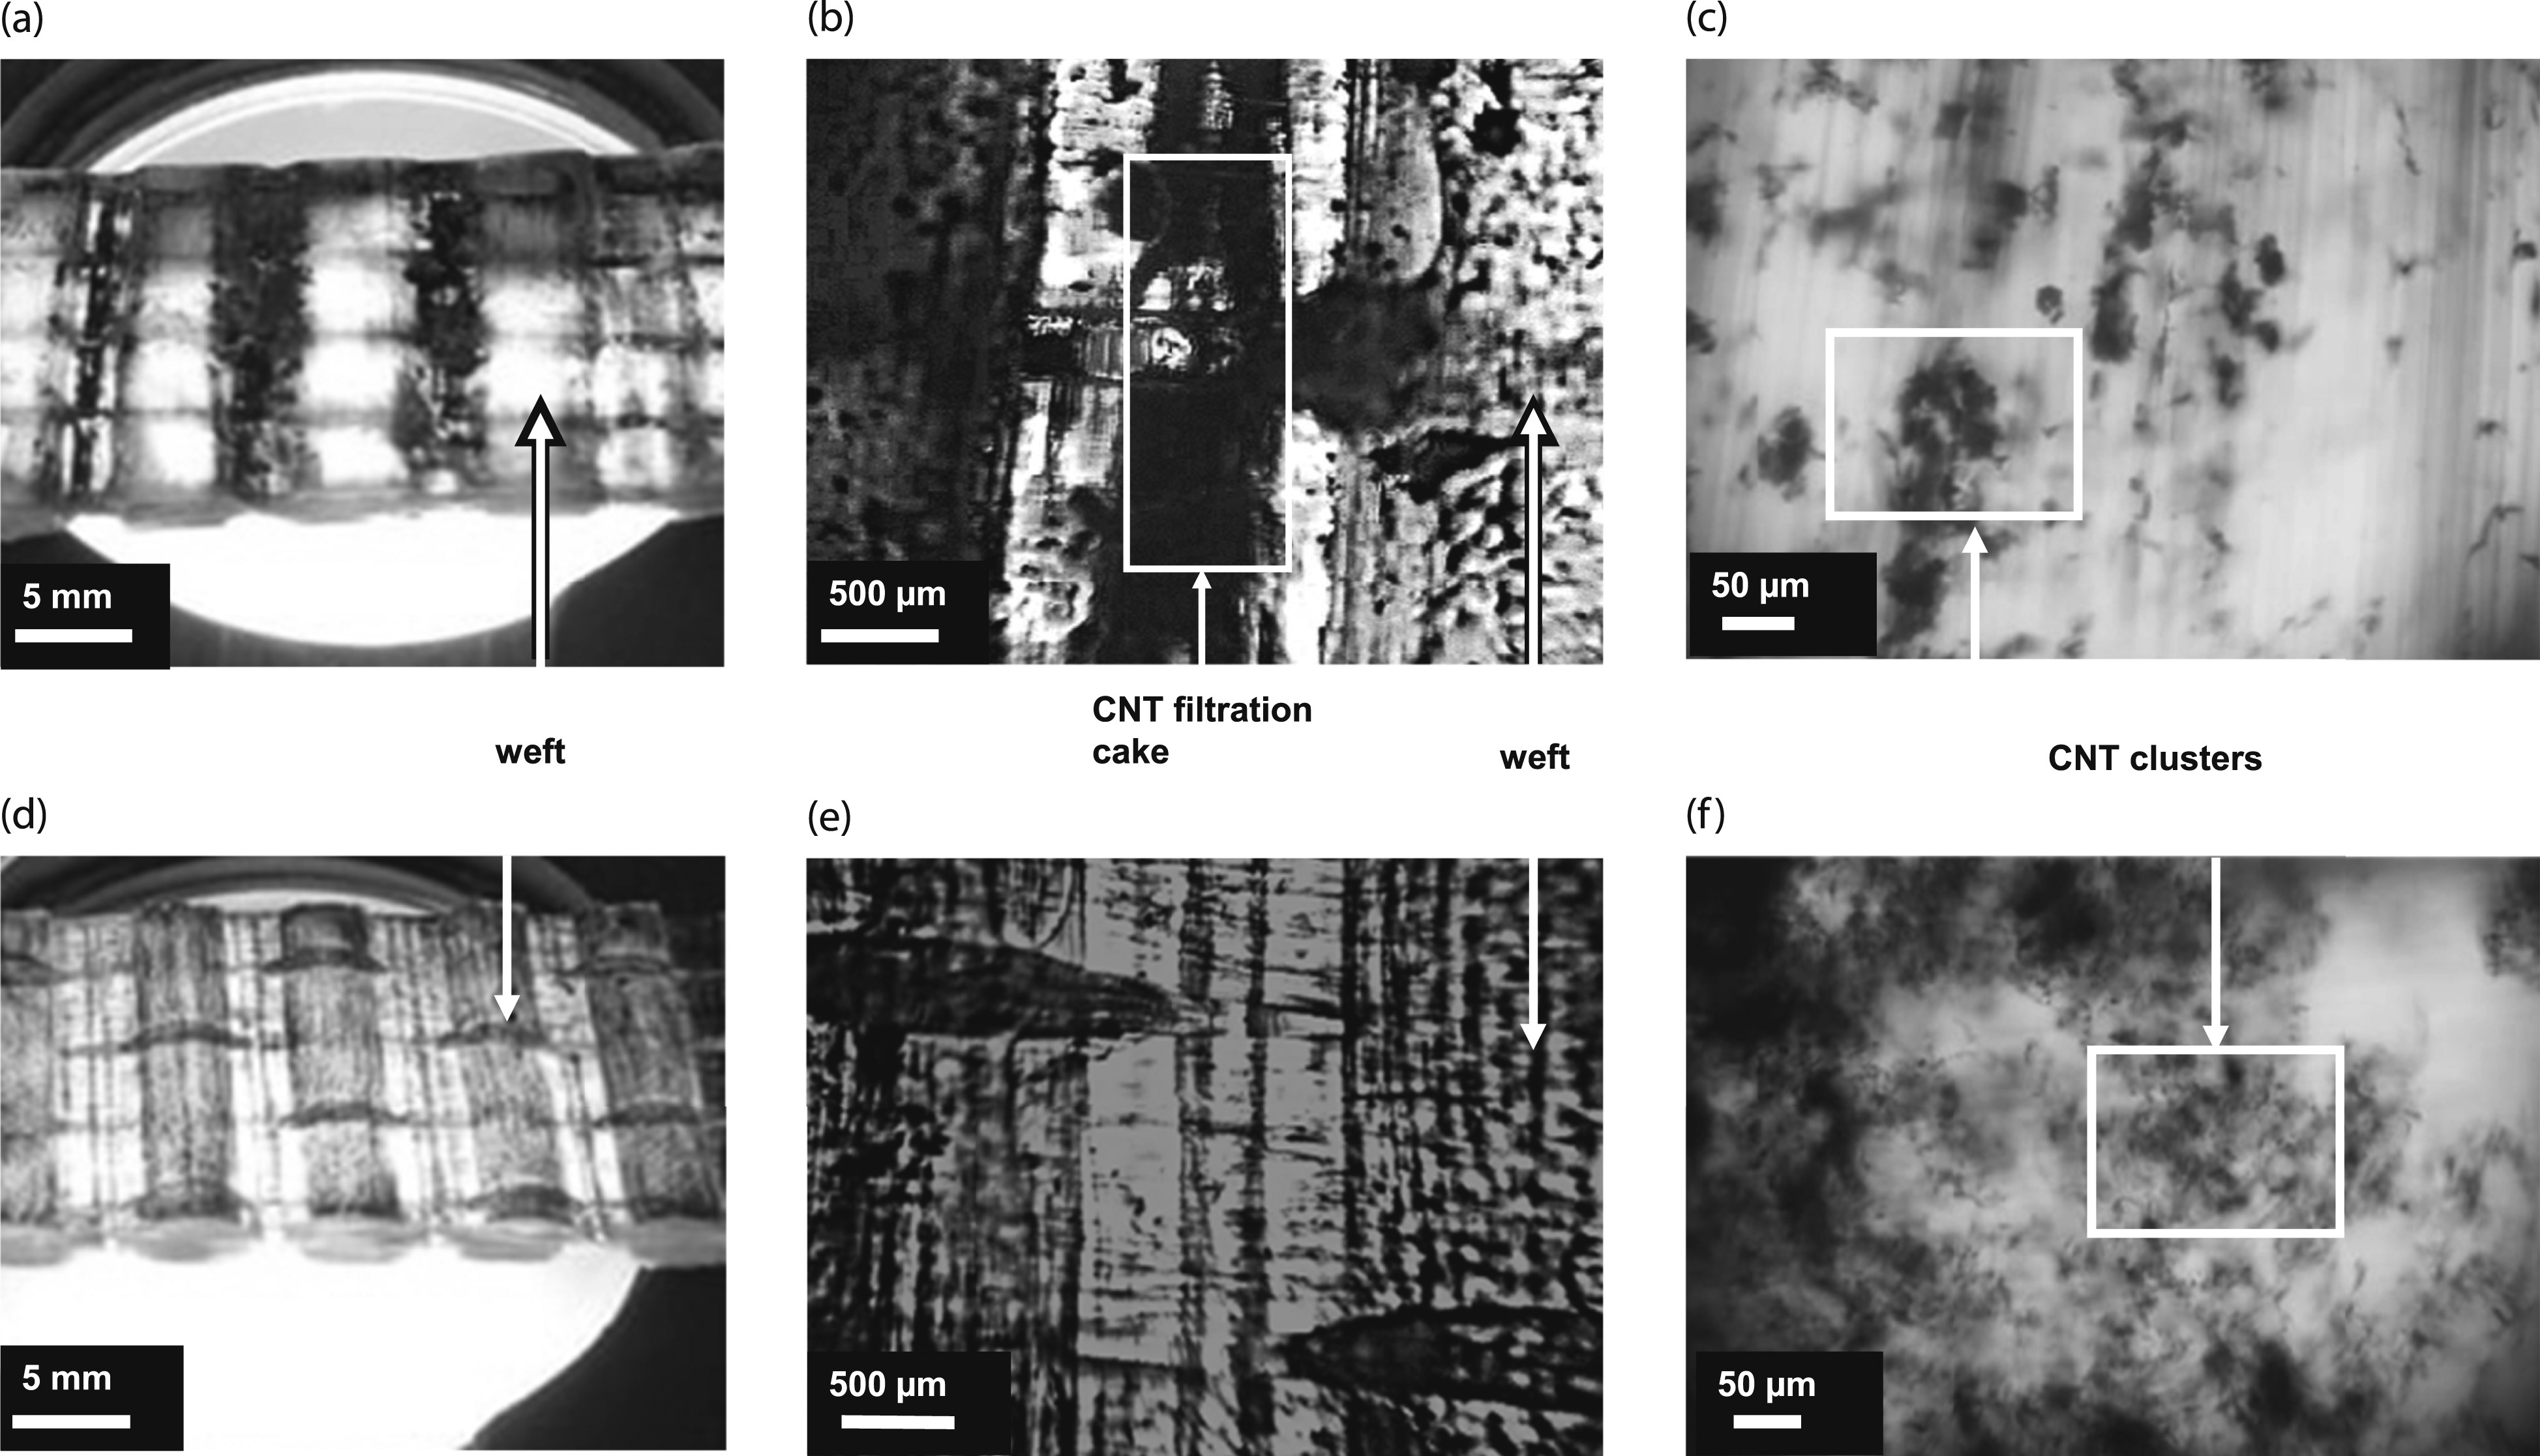
An 80× magnification in Figure 5b of the S2 sample shows the ‘macroscopic cake filtration’ formed due filtering of large CNT agglomerates by glass fibres while the 800× in Figure 5c shows microscopic filter cake of CNT particle agglomerations with traces of ‘deep bed filtration’ in the same sample. 43 These CNT agglomerations were highly concentrated in the gap between weft yarns. The magnification of 80× of S3:G2 sample in Figure 5e showed that filter cake was not formed as the particles were directly impregnated on fibres rather than flowing through them. The magnification at 800× of S3:G2 sample, in Figure 5f showed that CNT were uniformly distributed and formed a wider network as compared to S2. The optical micrographs confirm that CNT were uniformly dispersed as compared to conventional vacuum infusion, with minimum filtering by the fibres.
The SEM characterisation of S3:G1 samples at 10 kV electron beam shows that the CNT particles percolate through the thickness of the 3D woven glass fabric and adhere to the glass filaments. The CNT at 100000× are in the form of microclusters as shown in Figure 6a. The presence of CNT in the composite can be categorised into three major areas: 1) resin-rich area without fibres at 10000× as shown in Figure 6b; 2) matrix with warp fibres, as shown. 6(c) at 500×; 3) matrix with weft fibres as shown in Figure 6d at 100×. It can also be observed from Figure 6d that macro clusters or filter cake were not formed in the cross-section of the warp and weft fibrils. The SEM studies confirm that CNT had percolated and adhered to the core fibre and matrix with marginal filtering by fibres at micro level. Each CNT cluster acts as an individual sensor for fibre and matrix, thus facilitating the strain and damage measurement. SEM characterisation of S3:G1 sample: (a) micro cluster of CNT; (b) CNT in resin-rich area as micro clusters (white marking); (c) cross-section of warp fibrils in matrix; (d) cross section of weft and warp fibrils.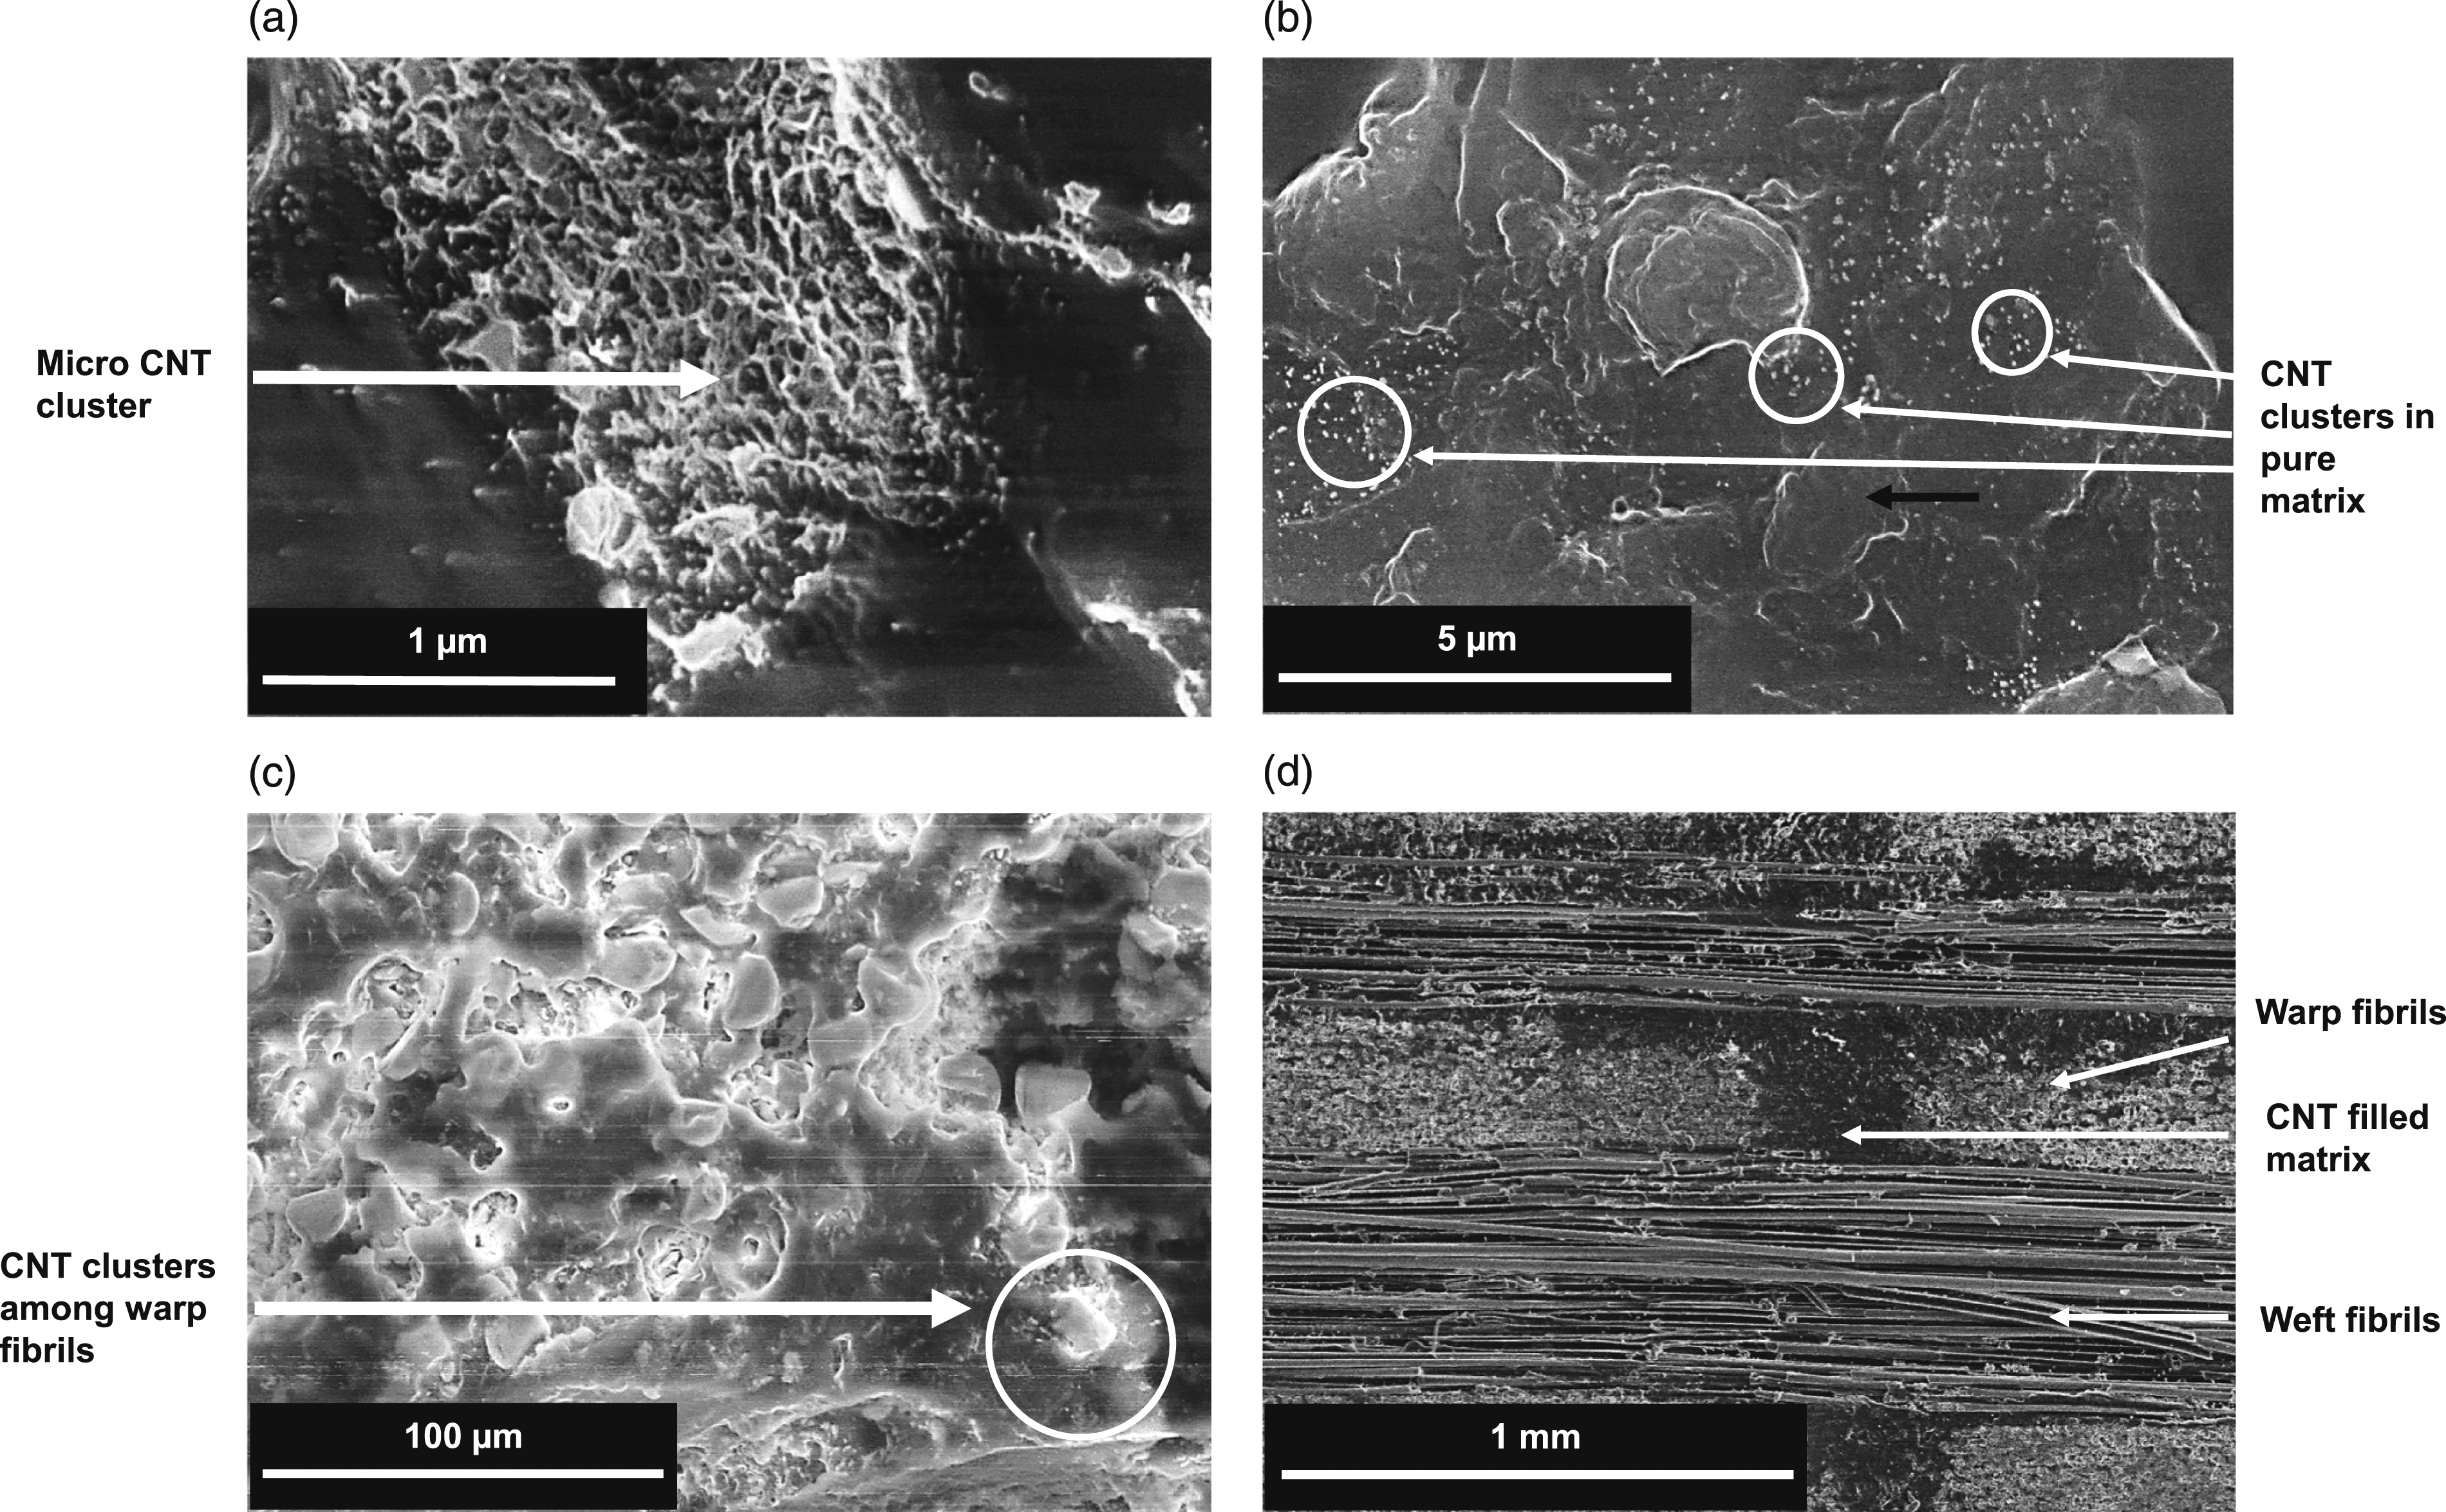
Tensile test and electromechanical response of CNT
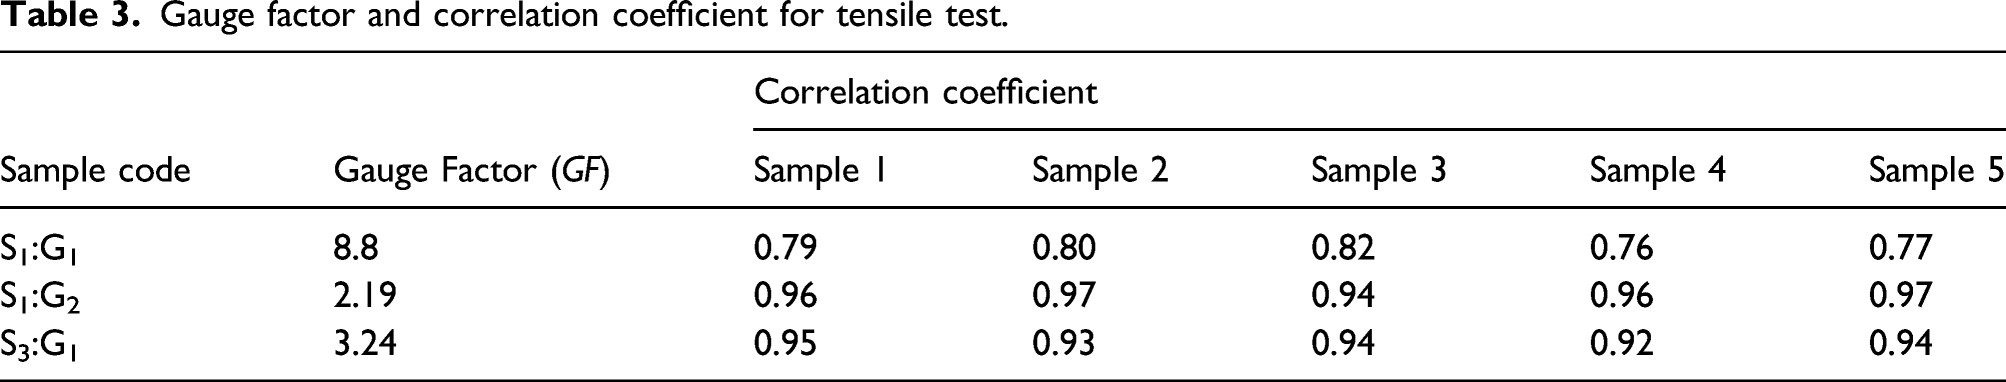
The graphs of ΔR/R0 versus tensile strain were plotted for S1:G1, S1:G2 and S3:G1 composite samples as shown in Figure 7. As the graphs show a statistically monotonic relationship between stress and resistance, the Spearman’s correlation coefficient between resistance and stress data was calculated for each of the five samples along with its GF to measure the efficiency of CNT’s piezoresistivity. The correlation coefficient, which ranges from −1 to 1, is calculated by taking the difference of weighted average of all datapoints of stress and absolute resistance values. As shown in Table 3, correlation coefficients with their respective GF are compared. As all the samples in their respective groups showed similar trends, the graph of one representative sample is presented for each group. Real time damage sensing during tensile loading: a) S1:G1; b) S1:G2; c) S3:G1. Gauge factor and correlation coefficient for tensile test.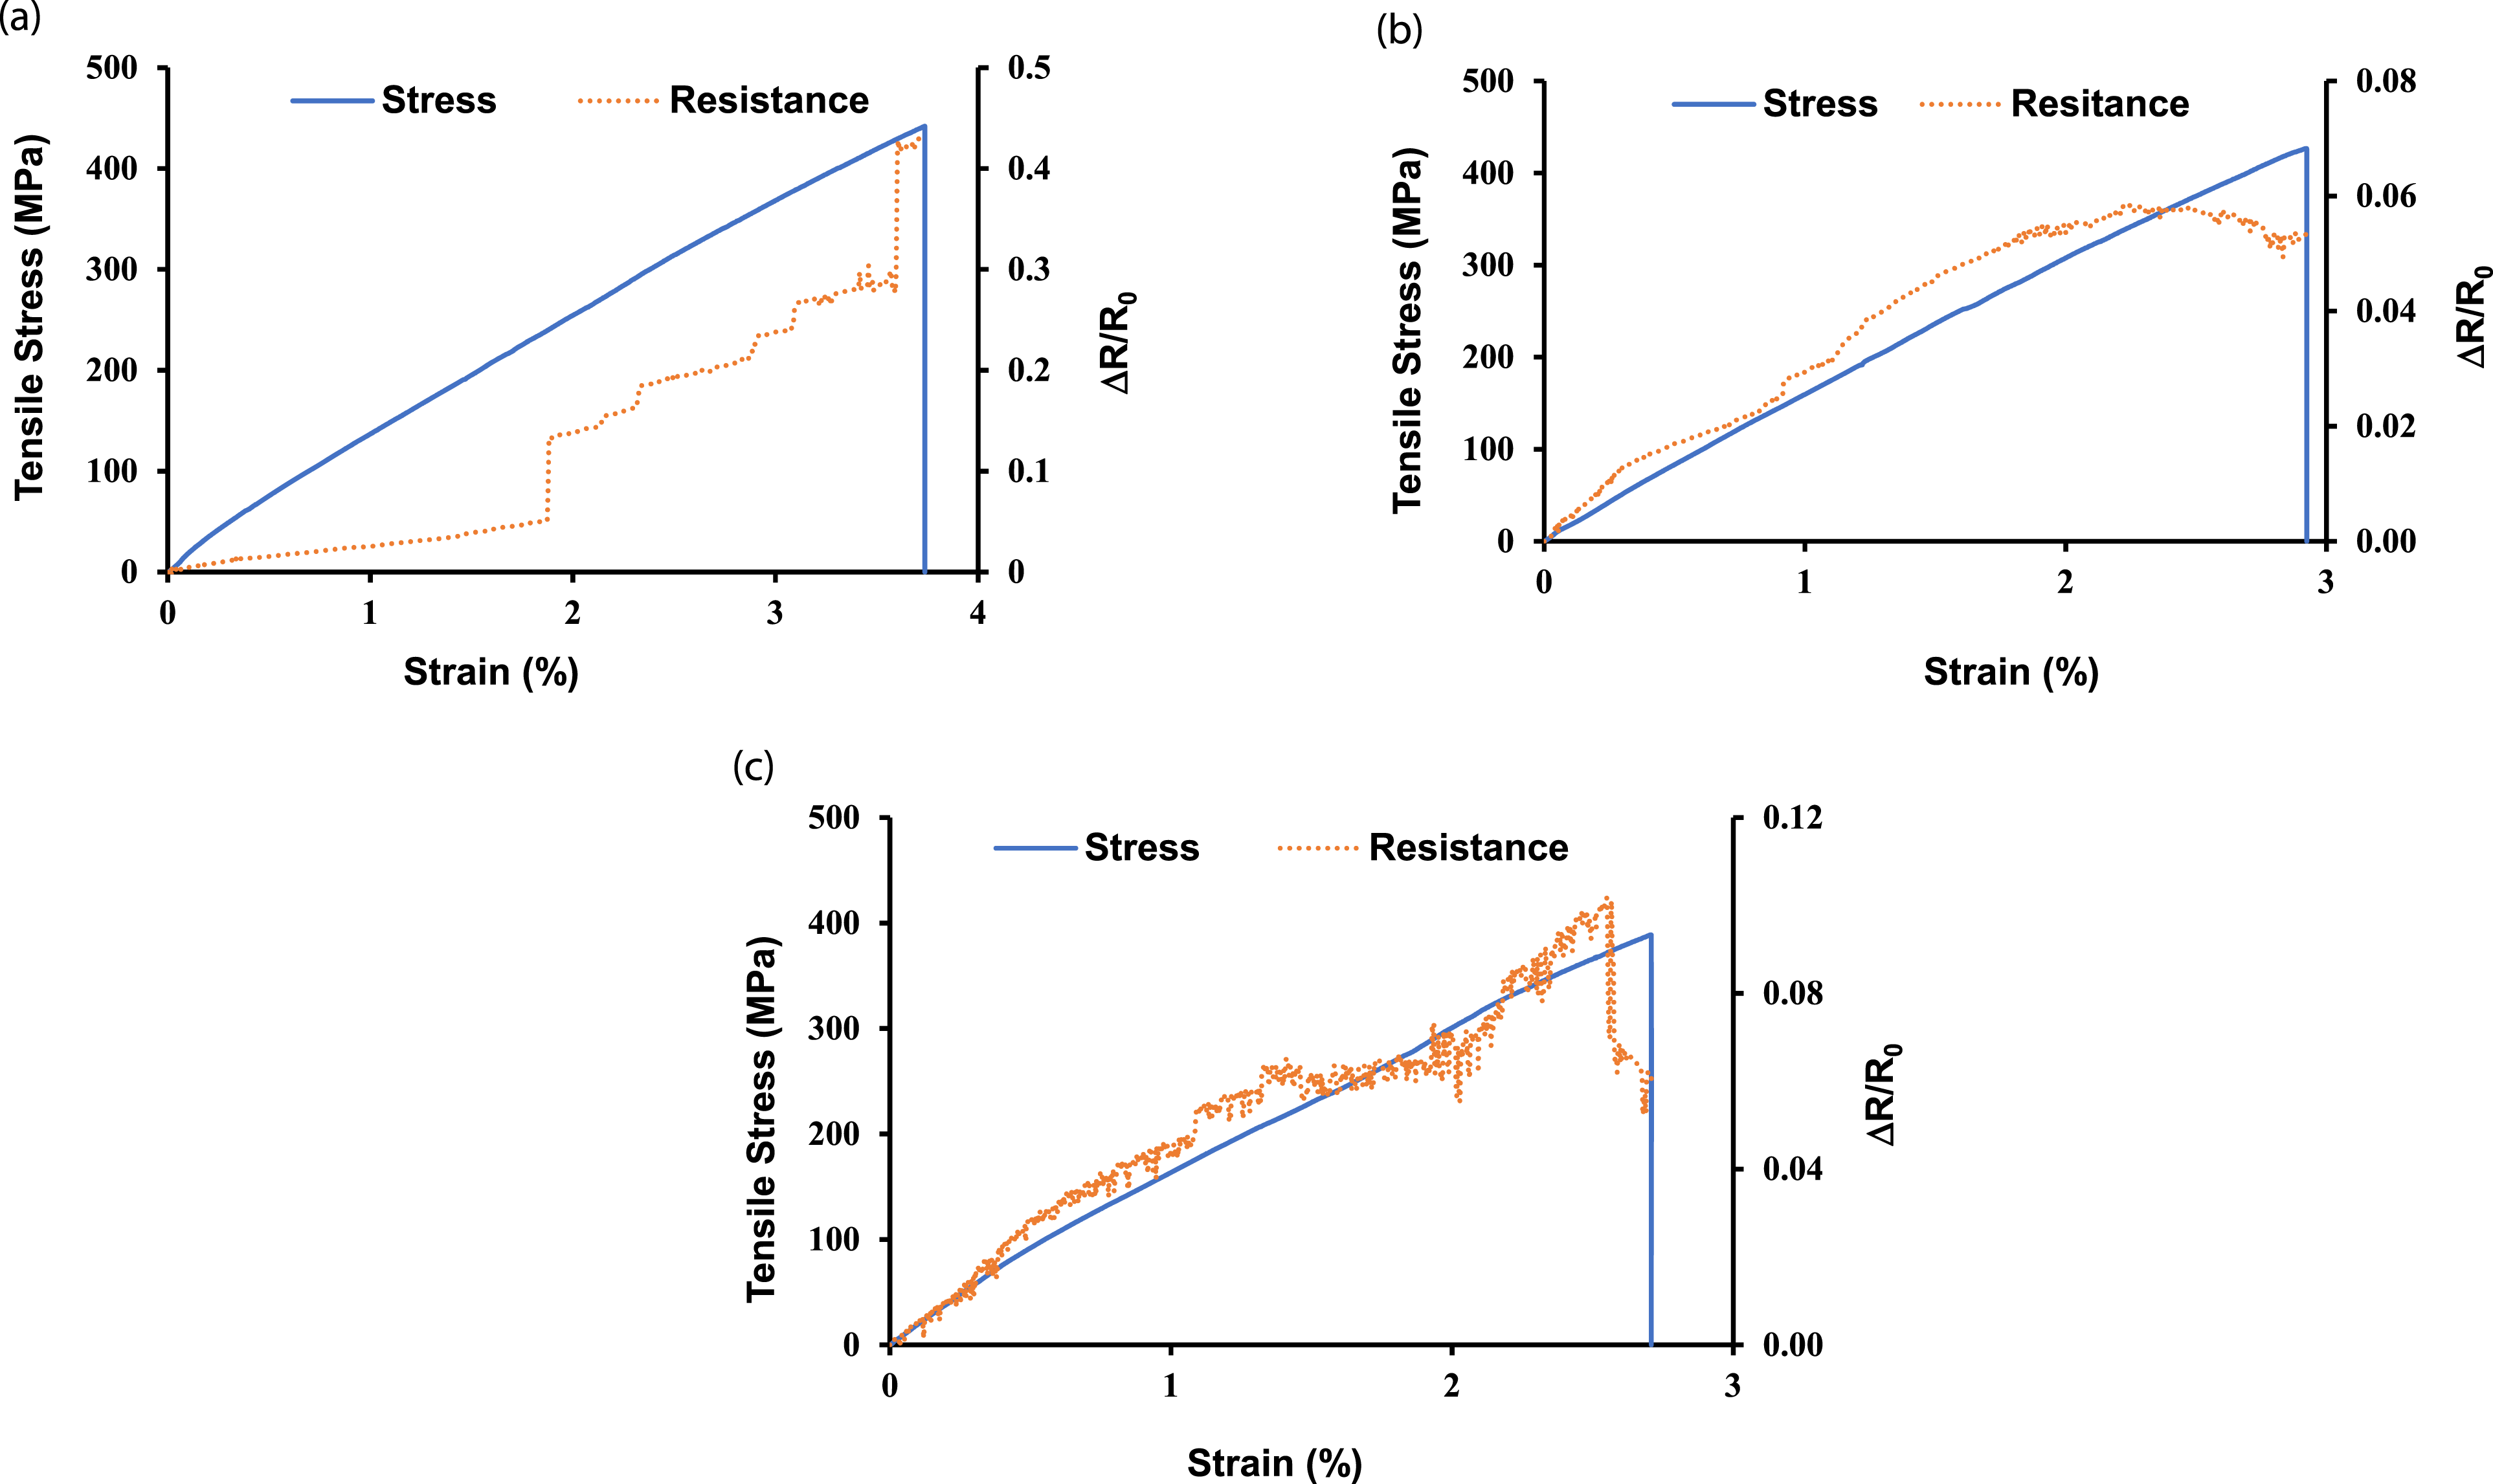
During tensile loading of S1:G1, the crack formation started from the notch and progressed through the sample’s width in the CNT film area. The CNT film, which elongated in response to composite specimen deformation, also started to damage due to the absorption of fracture energy, increasing the overall resistance of the CNT network by short spikes in resistance values. This can be observed on overall strain in Figure 7a. The continual damage of the CNT network makes it inefficient to map the strain, which is confirmed by a lower correlation coefficient. The ultimate fracture of the sample occurred inside the CNT film area, thereby completely damaging the sensor and composite specimen.
The resistance of the CNT network of S1:G2 changed corresponding to the strain of composite substrate without absorbing the fracture energy of the composite substrate. As the matrix crack started forming outside the CNT film at the notch, the fracture energy was not transferred to the CNT film, so the change in resistance of the CNT network, as shown in Figure 7b, can be attributed to the following mechanisms. At macro level, the change in dimensions of composite substrate causes the CNT sensor to change its geometry and in turn the resistance, similar to traditional strain gauge. The CNT sensor consists of network of individual CNT which elongate corresponding to substrate’s strain thus increasing the resistance value. However, at ultimate stress, due to substantial Poisson’s contraction, reduction in electrical resistance value of the CNT sensor is observed, 44 which can be identified between 2–3% strain. At micro level, the applied strain causes the nanotubes to drift apart, thus increase the tunnelling and the contact resistance. It also causes intrinsic piezoresistivity of CNT to come in effect and contributes to overall resistance change of the sensor.
The electromechanical response of the CNT network in S3:G1 under tensile loading, as shown in Figure 7c, indicates that the piezoresistive signal generated by the CNT network is a mixture of some CNT absorbing fracture energy of fibres and matrix, similar to sample S1:G1 while the rest of the CNT elongate with strain without absorbing fracture energy, similar to sample S1:G2. The microfractures of fibre and matrix are detected as short spikes in the signal while the overall signal correlates closely with the strain. This is indicated by the correlation coefficient. Similar to sample S1:G2, the CNT impregnated in S3:G1 shows decrease in resistance between 2–3% strain, that is, near the breaking point of the sample due to contraction in width.
The graph of resistance change versus strain is not linear for sample S1:G1 and S3:G1, thus a linear regression model was developed and GF was calculated as slope of the line best fitting the curve. For 0.3–0.05% CNT concentration in pure matrix with fibre reinforcement, the GF ranged from 2.2 to 2.4 in linear and 2.5 to 3.7 in non-linear region. 44 The GF of S1:G2 agrees well with this study. However, for S1:G1, the damage accumulation and absorption of fracture energy leads to abrupt and large changes in the resistance over small strain, thus indicating higher GF. However, it does not guarantee the efficiency to map the strain which is indicated by lower correlation coefficient. The sample S3:G2 exhibit highest GF in comparison to the other samples as the resistance change is mixture linear and non-linear behaviour.
CNT senses the strain by virtue of tunnelling resistance and overlapping of nanotubes over each other. With the decrease in the filler wt%, the strain sensitivity of the CNT sensor increases. 41 Under tensile loading, the distance between adjacent CNT can increase up to infinity, but under compressive stress, the ability of CNT to map strain is limited as the tunnelling gap gets shortened and CNT overlapping increases. This leads to a decrease in resistance which gets saturated after a threshold strain level is reached. Thus, to map the entire flexural loading, the CNT networks should sense tensile and compressive loads independently.
Bending test
To compare the flexural load mapping efficiency of fully infused CNT with partial infused ones, five samples of S3:G1 and S3:G2 each were subjected to flexural loading and piezoresistive response of CNT network was plotted as ΔR/R
0
against strain values calculated from equation (3). The graph of one of the representative samples of each group are shown in Figure 8. The results are in acceptable agreement with previous research on electromechanical response of CNT spray-coated on glass fibres,
34
silver-coated sensors embedded in glass composites,
20
and carbon black coated sensor wire embedded in 3D woven angle interlock composite.
17
Real time damage sensing during flexural testing: (a) S3:G1; (b) S3:G2 surface subjected to tensile stress; (c) S3:G2 surface subjected to bending stress.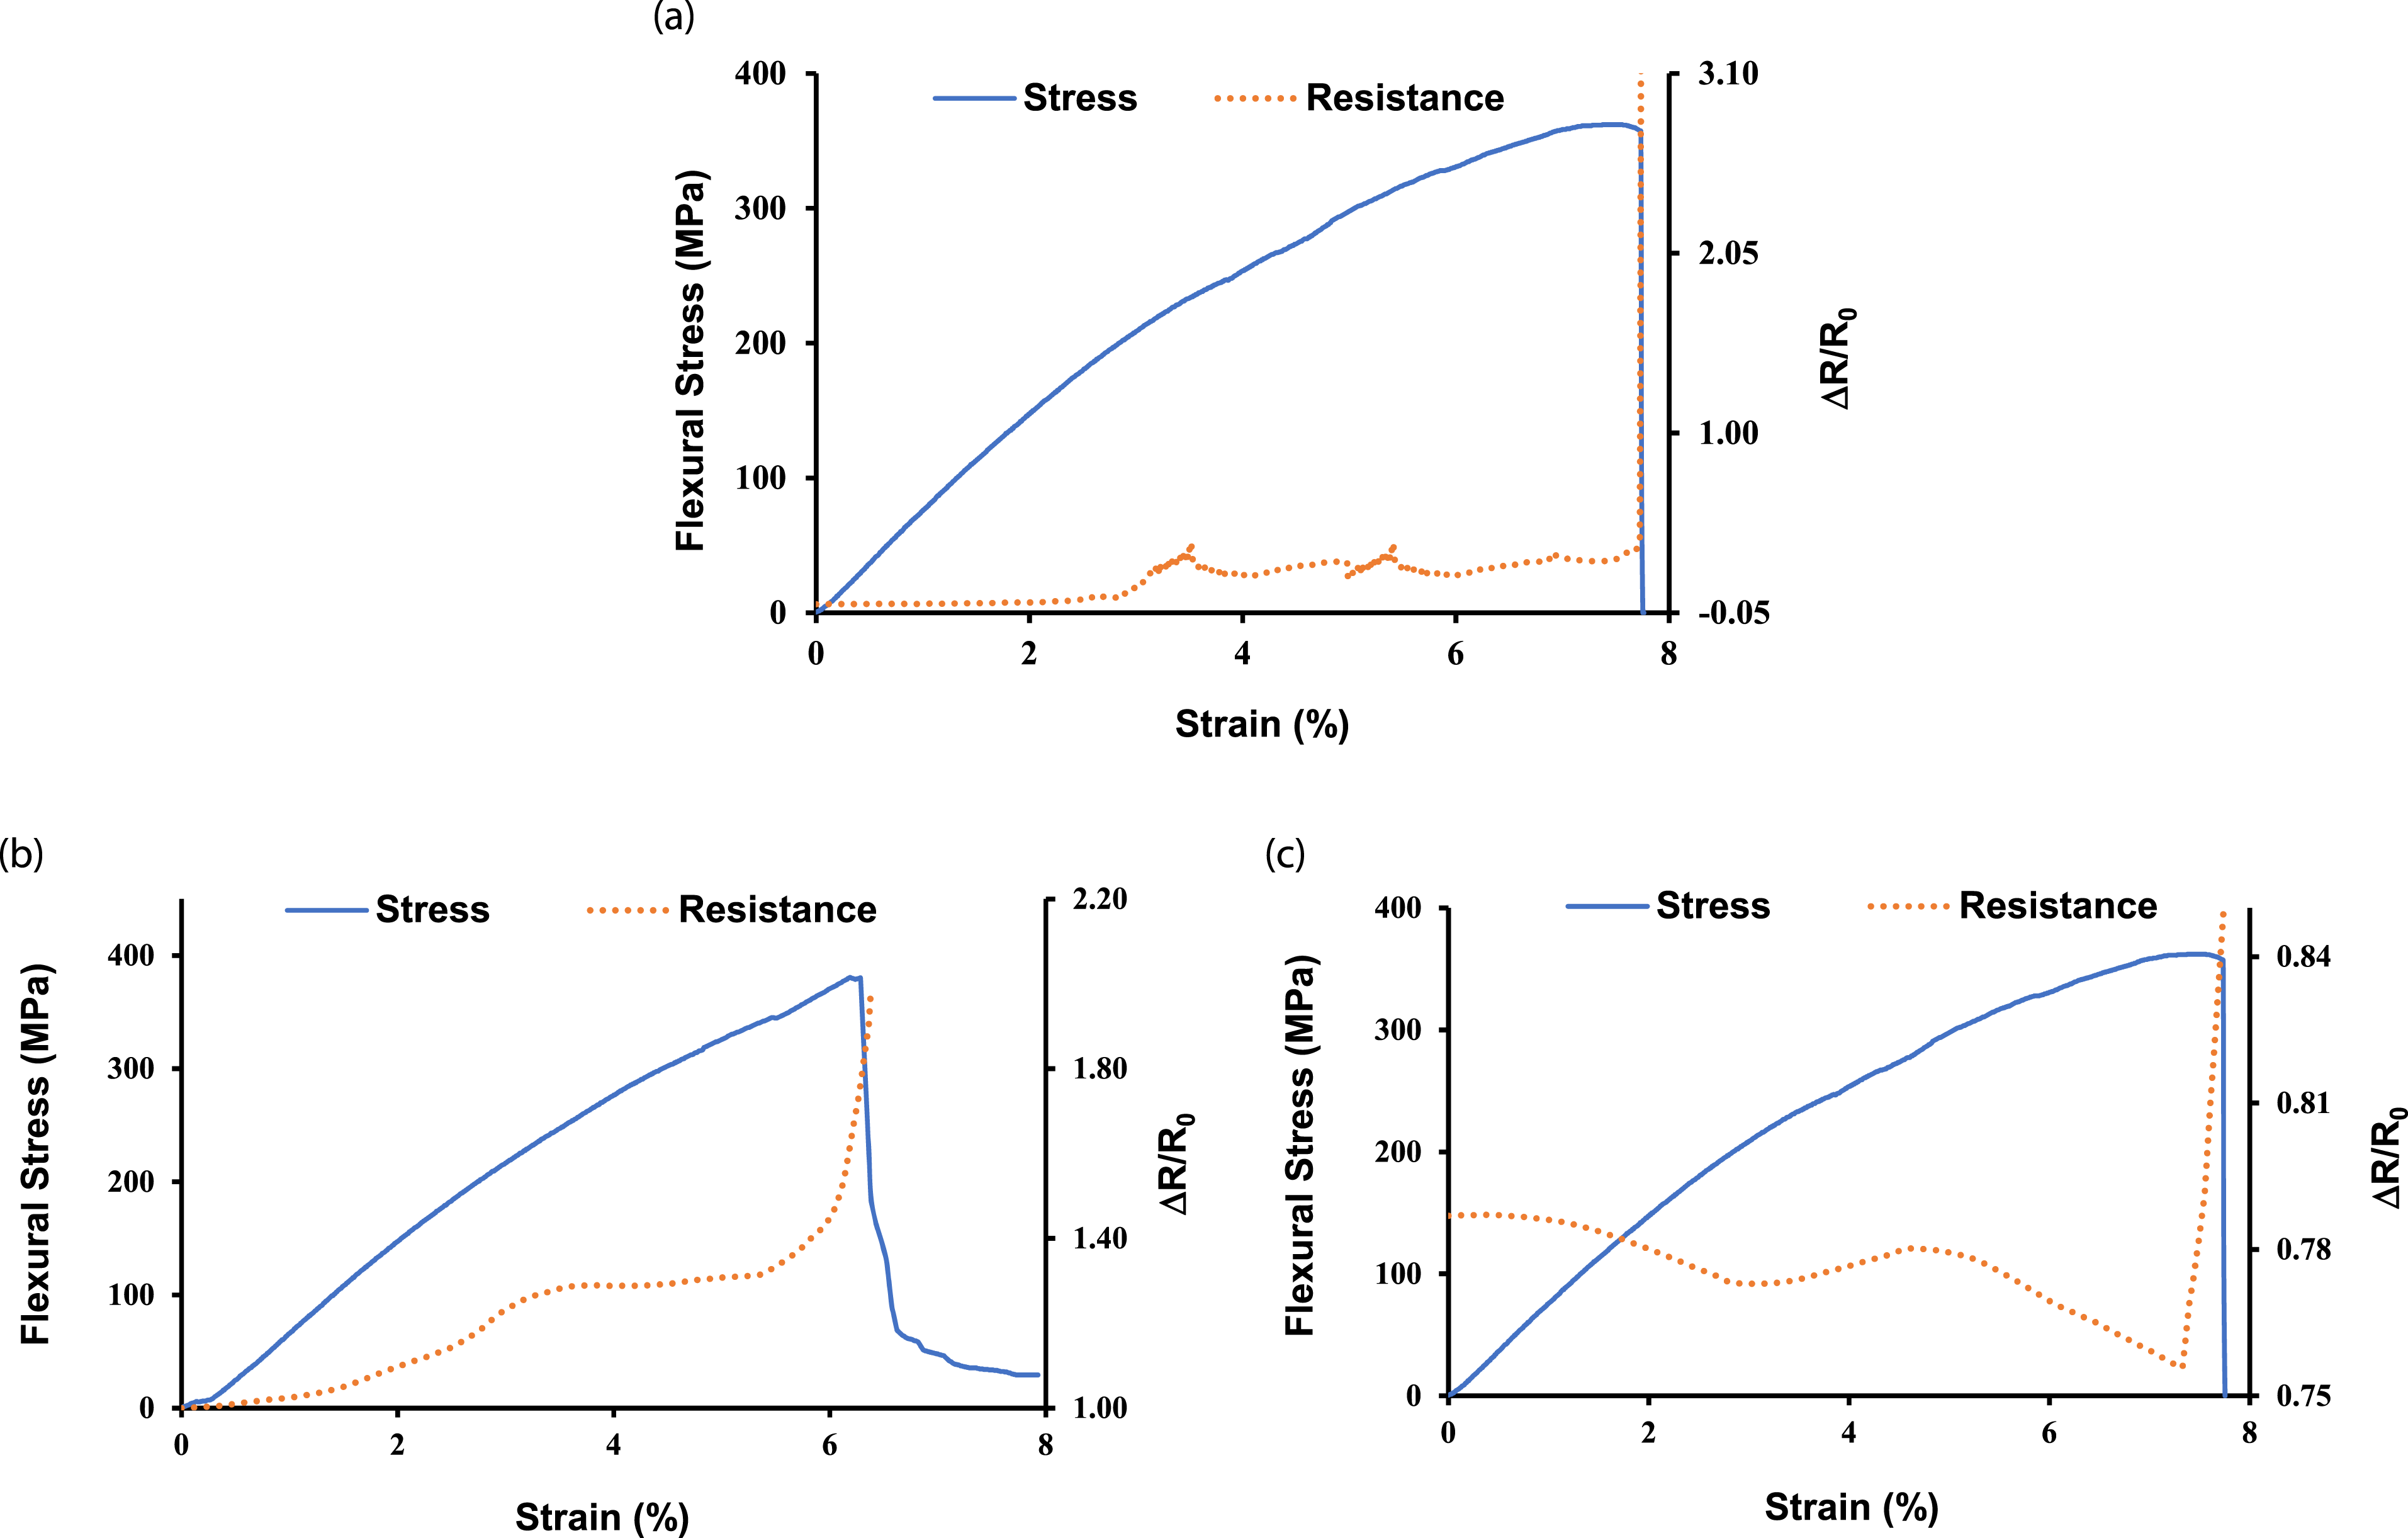
When bending stress was applied to S3:G1, the crack formation started at the point where weft yarns were absent. As the matrix material is brittle and exhibits lower tensile strength compared to its compressive strength, the damage initiation in the composite started at the surface undergoing tension and progressed towards the compression side. In the bottom part, the distance between adjacent CNT increased, thus increasing the resistance, whereas in the compression section, the distance between adjacent CNT decreased, resulting in decreased resistance. As shown in Figure 8a, till 3% strain where crack has not been formed, the sum of increase and decrease in resistance tends to keep the values constant. With increase in the strain beyond 3%, the crack propagates and gradually breaks the CNT network, thus leading to an increase followed by a sharp spike in the resistance value at the ultimate failure of the sample. Similar behaviour of the change in resistance values has been studied in previous research.45, 20
The specimens of S3:G2 showed conductivity only along a single surface and not through the thickness, which suggested that the CNT network was present between fibre and matrix and did not percolate through the thickness. The electromechanical response of the CNT network was distinct for tensile and compressive stress during the bending test, as shown in Figures 8b and 8c, respectively. When the conductive bottom surface of S3:G2 was subjected to tension during the bending test, the increase in distance between overlapping CNT and tunnelling resistance increased the overall resistance in response to the applied strain. The formation of microcracks in the composite lead to an increase in resistance values due to the breaking of CNT networks, which can be observed between 2–6% strain. At ultimate stress, the matrix and fibres broke, leading to the CNT network’s catastrophic failure, which can be identified as a steep increase in resistance at 6.2% strain.
When the conductive top surface of S3:G2 was subjected to compression stress during bending, as shown in Figure 8c, the resistance started decreasing as the gaps between adjacent CNT decreased. The ultimate fracture of composite lead to permanent damage in the CNT network, which could be observed as a steep increase in resistance at 7.5% strain.
Conclusion
In this research work, smart composites were manufactured by locally infusing CNT with porous media on the 3D woven fabric preform with marginal microscopic filtration by fibres. The smart composites thus developed were able to function as a real-time strain and damage sensor. The composites were subjected to tensile and flexural loading for studying the piezoresistive response of the CNT network. To compare the functionality of developed sensors with conventional methods, CNT were also cast on the surface of pure epoxy infused 3D woven composite substrates and subjected to tensile loading. The change in the resistance values in response to applied flexural and tensile strain was measured and plotted in graphs. The following conclusions are derived from this study. • The concept of localised infusion of CNT via porous media is feasible for real-time strain monitoring and damage sensing in orthogonal 3D woven composites. • The CNT were uniformly dispersed in the composite with marginal microscopic filtration by sponge infusion compared to the conventional vacuum infused composites where macroscopic cake filtration and agglomeration of CNT was observed. • At 101.3 kPa vacuum pressure, the CNT infused through the thickness of the fabric, whereas pressure of 30.4 kPa infused the CNT only in the outer layer fibres. This was confirmed by measuring the resistance of the composite across the thickness, SEM and optical imaging. Through thickness infused CNT were efficient to measure the tensile strain and damage of fibre as well as matrix. The partially infused CNT were efficient to monitor flexural load under tensile and bending stress, similar to other strain sensing techniques. Thus, based on the requirement and area of sensing, the CNT can be infused through the thickness or deposited only on the fibre surface. • The smart composites were manufactured by using minimum amount of CNT, without any sophisticated tools for dispersion and utilising only one additional component in the manufacturing process. This makes the smart composites manufacturing method cost-efficient and simple.
Footnotes
Acknowledgements
The authors would like to acknowledge Textech® Industries Inc. (USA) for supplying the orthogonal 3D woven fabric sample.
Declaration of conflicting interests
The author(s) declared no potential conflicts of interest with respect to the research, authorship, and/or publication of this article.
Funding
This work was supported by European Union’s Horizon 2020 research and innovation program under the Marie Skłodowska-Curie grant agreement No 777810.