
Abstract
The standard experimental procedures for determining the interlaminar fracture toughness are designed for delamination propagation in unidirectional specimens. However, in aerospace structural components, delamination usually occurs between plies at different orientations resulting in different damage mechanisms which can increase the value of the fracture toughness as the delamination propagates. Generally, numerical analyses employ the value measured at the delamination onset, leading to conservative results since the increase resistance of the delamination is neglected. In this paper, the fracture toughness and the R-curves of carbon/epoxy IM7/8552 are experimentally evaluated in coupons with delamination positioned at 0°/0° and 45°/−45° interfaces using Double Cantilever Beam (DCB) and Mixed-Mode Bending (MMB) tests. A simplified numerical approach based on the Virtual Crack Closure Technique (VCCT) is developed to simulate variable fracture toughness with the delamination length within a Finite Element code using a predefined field variable. The results of the numerical analyses compared with the experimental data in terms of load-displacement curves demonstrate the effectiveness of the proposed technique in simulating the increase resistance in delamination positioned between plies at 45°/−45° interface.
Keywords
Introduction
In the aerospace industry, tests are extensively performed throughout all the phases of the development and certification process of a new component, from material coupons to the full-scale structure. This requires high costs in terms of resources and time for the manufacturing and the execution of the tests. The reduction of the number of tests through replacement with numerical simulations can result into a drastically reduction of costs and time required for development and certification of novel composite structures. 1 However, accurate numerical simulations of complex material behavior, such as delamination propagation, present several challenges. 2
The standard experimental procedures for the determination of the fracture toughness, which represents the energy required to propagate an existing delamination in a composite laminate, are designed for delamination propagation in unidirectional specimens.3,4 In aerospace structural components, delamination usually occurs between plies at different orientations resulting in different damage mechanisms, such as fiber bridging and delamination migration, which can increase the value of the fracture toughness as the delamination propagates.5–8 Numerical simulations usually employ the value measured at the onset of the delamination leading to conservative results because the increase resistance of the delamination, the R-curve effect, is neglected.7–9
A few researchers have studied fracture toughness in coupons with interface plies at different orientation using Double Cantilever Beam (DCB) specimens. Blondeau et al. 10 tested several DCB specimens with anti-symmetric interfaces (θ/-θ), comparing the results to unidirectional specimens and obtaining a similar onset value of the fracture toughness for all lay-ups, while the R-curves differ with higher values of the fracture toughness found in the specimens with anti-symmetric interfaces. Yao et al. 11 also observed a similar onset value followed by a higher R-curve effect when comparing 0°/0° and 45°/45° DCB specimens. Sebaey et al. 12 performed a numerical and experimental study on DCB specimens with different lay-ups trying to predict the likelihood of delamination migration. 13 Similar values of the onset fracture toughness have been obtained for all lay-ups, while a much larger variability in the plateau values of the R-curve has been observed. Most of the research has focused on the mode I fracture toughness due to the relative simplicity of performing DCB tests compared to End-Notched Flexure (ENF) and Mixed-Mode Bending (MMB) tests. For MMB specimens, the amount of research is limited, but there are a few examples where specimens with different interface plies orientation have been employed. Gong et al. 14 experimentally studied DCB, ENF and MMB specimens with 0°/0° and 22.5°/-22.5° interfaces finding a lower stiffness and failure load with a larger onset and plateau fracture toughness for the specimens with different oriented plies. Kim and Mayer 15 performed a widespread MMB campaign, testing specimens at different interfaces with five different mode mixities. They observed how the onset fracture toughness decreases with the mismatch angle, especially for higher mode-mixities, but no information on the R-curves has been reported. Naghipour et al. 16 reported higher onset fracture toughness values for MMB specimens with 22.5°/-22.5° and −45°/45 interfaces compared to the unidirectional specimens.
In general, the propagation of delamination can be numerically simulated using two approaches: Cohesive Zone Modelling (CZM) and Virtual Crack Closure Technique (VCCT). Researchers have demonstrated that using the CZM approach it is possible to appropriately modify the shape of the cohesive law to take into account the R-curve effect. Airoldi and Dávila 17 described two approaches to obtain the parameters of a tri-linear cohesive law resulting from a superposition of two bi-linear cohesive laws to simulate the increase of fracture toughness with the delamination length. This approach has been adopted with some modifications by other authors.18,19 Cameselle-Molares et al. 20 employed the superposition of cohesive laws to model a laminated plate with a circular pre-crack. Nevertheless, when using the R-curve obtained from DCB specimens in the simulation of the plate, the failure load is underestimated. Their work points out the difficulties in directly using the values obtained in coupons to model delamination in larger-scale structures, but also highlights the importance of accounting for the R-curve effect. As indicated by Rose et al., 2 the main disadvantage of the superposition of cohesive laws is the lack of methods to calibrate the parameters of the cohesive laws.
Zhao et al. 21 suggested to modify the value of the fracture toughness used in the propagation criteria in the simulation of the delamination growth. During the analysis, the delamination length is measured, and the fracture toughness value is modified according to the experimental R-curve. The same method has been applied by the same researchers for mixed-mode propagation using a power law and B-K criteria. The R-curves obtained from DCB specimens have been used to improve the simulation of both DCB and MMB specimens. Riccio et al.22,23 adopted the same approach using the VCCT. The R-curve obtained from DCB specimens has been used to simulate delamination propagation in a skin/doubler specimens subjected to a three-point bending test, obtaining a significant improvement with respect to the use of a constant onset value for the fracture toughness. The use of the variable fracture toughness provides a simpler approach to model the R-curve compared to the superposition of cohesive laws, but it is limited to cases where the position of the initial delamination tip and the propagation direction are known.
In this work, the fracture toughness and the R-curves of carbon/epoxy IM7/8552 are experimentally evaluated in coupons with delamination between 0°/0° and +45°/−45°, using DCB and MMB tests for 20% and 50% mode-mixities. A simplified numerical approach based on Finite Element (FE) method and VCCT is proposed to simulate the increase in fracture toughness with the delamination length. The aim is to provide a simplified methodology to take into account the effect of the interface ply orientation within a numerical model using the experimental data.
In ‘Specimen description’ section, the characteristics of the specimens in terms of geometry, material and stacking sequence are described. In ‘Preliminary analysis’ section, the results of preliminary numerical analyses performed in preparation of the experimental tests are presented and compared with an analytical solution. In ‘Experimental tests’ section, the experimental set-ups are described together with the equations adopted to obtain the fracture toughness with the delamination length, while in ‘Experimental results’ section, the experimental results are presented for each test and lay-up in terms of load-displacement curves, R-curves and images of the fracture surfaces. Finally, in ‘Numerical methodology’ section, the proposed simplified numerical approach for simulating the R-curve effect is described and implemented using the data obtained from the performed experimental tests.
Specimen description
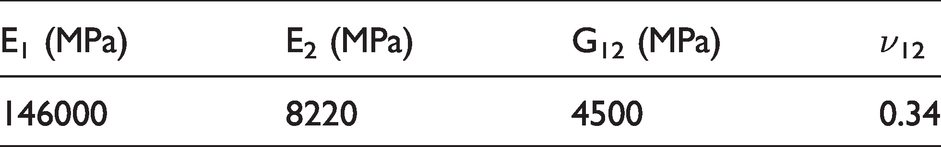
In this work, specimens with two different stacking sequences are investigated: a unidirectional lay-up employed in the standard tests used as a reference, [012//012], and a lay-up in which all the plies are oriented in the 0° direction, except for the plies at the interface, [011, 45//−45,011], where the symbol “//” indicates the position of the initial delamination. The aim is to investigate only the effect of the ply angles at the delamination interface without considering the influence of the overall lay-up. According to the ASTM standards,3,4 all the specimens are manufactured with the same nominal dimensions with a length of 147 mm, a width of 25 mm and a thickness of 3 mm. The material is IM7/8552 carbon/epoxy. The elastic material properties are determined with a previous experimental campaign of material characterization and are reported in Table 1. 24
Material properties of IM7/8552.
The initial delamination is created by introducing during the manufacturing a Polytetrafluoroethylene (PTFE) release film, WL5200, with a thickness of 15 μm in the middle plane of the specimens. The nominal initial delamination length is 25 mm for all the specimens, while the length of the loading blocks employed in both tests is 20 mm. The geometry of the specimen with the loading blocks is reported in Figure 1. Three different tests are performed: DCB, MMB at 20% and 50% mode-mixity. For each stacking sequence and type of test, three specimens are tested.
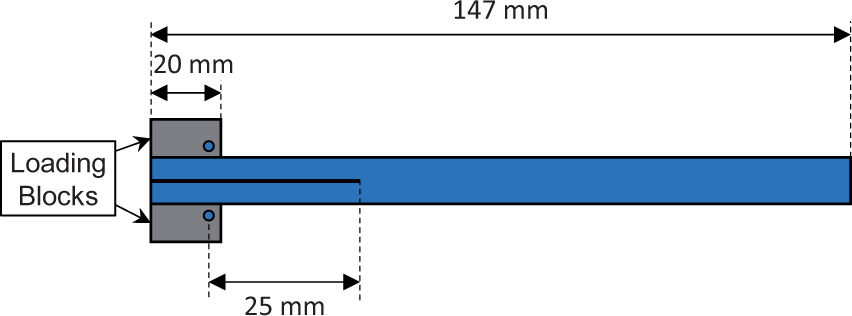
Specimen geometry.
Preliminary analysis
At first, preliminary FE analyses are performed considering interface properties taken from literature. The results are compared with an analytical solution. The objective of these preliminary analyses is to offer an initial evaluation of the proposed lay-ups in terms of maximum load and displacement in preparation of the experiments.
Finite element models
The numerical models are realized using the FE code ABAQUS. 25 The DCB specimen is modelled with 3 D continuum shell elements (SC8R). Thirty elements are defined along the width of the specimen and only one element through the thickness of each arm. In the propagation area a uniform mesh with an approximate size of 0.4 mm along the length is adopted, while outside this region the element length is gradually increased to 2 mm. The total number of elements for the DCB model is around 15000. The DCB test is simulated by constraining all the degrees of freedom on one end of the specimen, while an opening displacement is applied on the tip of the two arms on the opposite end. The FE model of the DCB test together with the boundary conditions is shown in Figure 2.
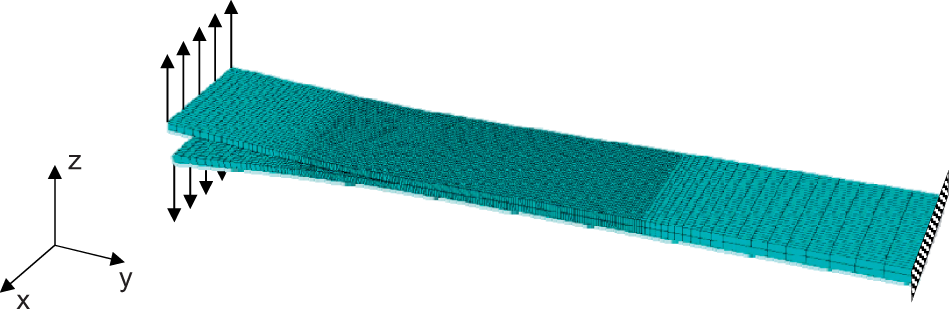
DCB FE model.
For the MMB specimen, the same discretization is adopted along the width and the thickness while an element length of 0.25 mm is selected in the propagation area. The total number of elements for the MMB model is around 26000. The fixture is discretized using 3 D rigid elements (R3D4) and is connected with the specimen through linear constraint equations. A vertical displacement is applied on the reference node of the lever to simulate the test.
The FE model of the MMB test, according to the ASTM standard, 4 and the boundary conditions are shown in Figure 3.
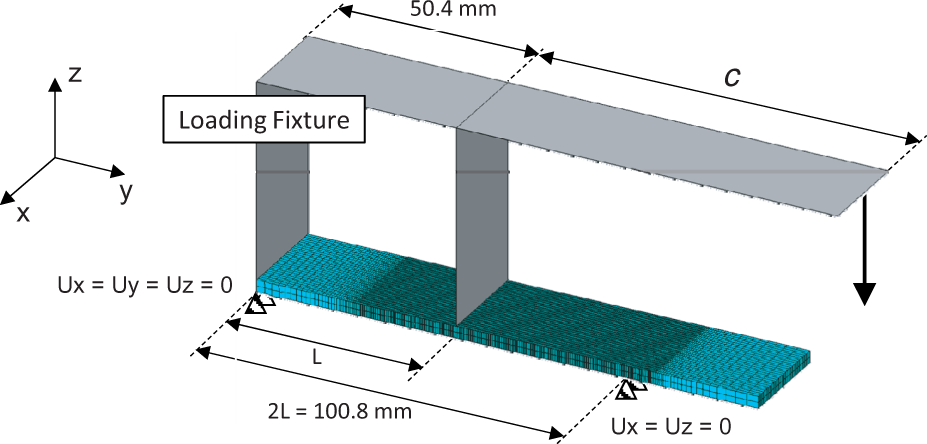
MMB FE model.
The mode-mixity applied to the specimen is defined by the length of the loading arm, c. The lengths adopted in the numerical analyses and experimental tests are 96.24 mm and 41.76 mm for a mode-mixity of 20% and 50%, respectively. These values are taken from literature for the same specimen, material and geometry.26,27
The delamination propagation is simulated in this work using the VCCT approach available in the FE code ABAQUS. The nodes on the delamination front are released when the energy release rate is higher than the critical fracture toughness evaluated according to the criterion proposed by Benzeggangh and Kenane,
28
reported in equation (1).
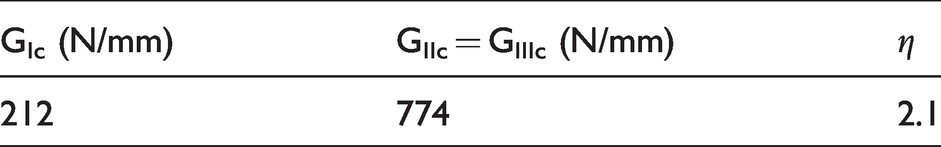
Fracture toughness values of IM7/8552 used for the preliminary analysis. 27
Analytical solution
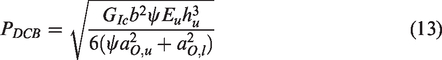
The results obtained from the numerical simulations are compared with an analytical solution. The ASTM standards suggest the Corrected Beam Theory (CBT) to analytically evaluate the load-displacement curves of DCB and MMB specimens, however, this theory does not take into account that multidirectional and/or non-symmetric specimens could be employed to calculate the fracture toughness. For this reason, in this work a modified version of the CBT taken from literature is adopted.10,29,30 The following expressions is used for the evaluation of the energy release rate in DCB and ENF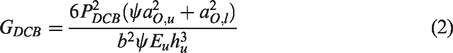
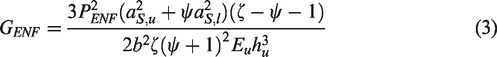
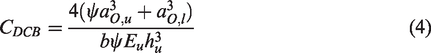

In the previous equations, PDCB and PENF are the loads applied to DCB and ENF specimens, L is the half-span length of the MMB fixture (Figure 3), b is the width of the specimen, aO,i and aS,i represent the crack length for each arm in the DCB and ENF tests, respectively, each corrected with their respective mode I and mode II parameters, as shown in equation (6) and equation (7)

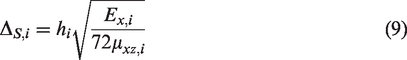
The correction factor, ΔO,i and ΔS,i, can be calculated as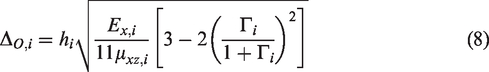
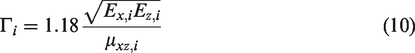
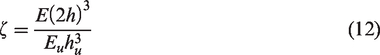
The parameters ψ and ζ are introduced in this theory to take into account the different properties in terms of thickness and stiffness between the upper and lower arms of specimens with multidirectional plies at the interface and are defined as follow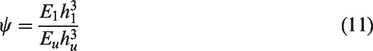
Pereira et al.
29
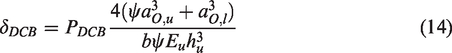
do not provide a direct formula for the load and the displacement in the MMB test, however it is indicated how the energy release rate can be evaluated, considering a superposition of DCB and ENF tests, as shown in equation (15).
The load in MMB can be so obtained from equation (15) using the mixed mode propagation criterion reported in equation (1) for the calculation of the fracture toughness, Gc.
Once the load is obtained the displacement results from the product of the load and the superposition of the compliances of DCB and ENF, as follow
Preliminary results and comparisons
The comparisons between the load-displacement curves obtained from the preliminary FE analysis of the two considered lay-ups with the analytical solutions for DCB, MMB 20% and MMB 50% are reported in Figure 4. In all these preliminary analyses, the fracture toughness is assumed to be equal for the two lay-ups and not to vary with the delamination length.
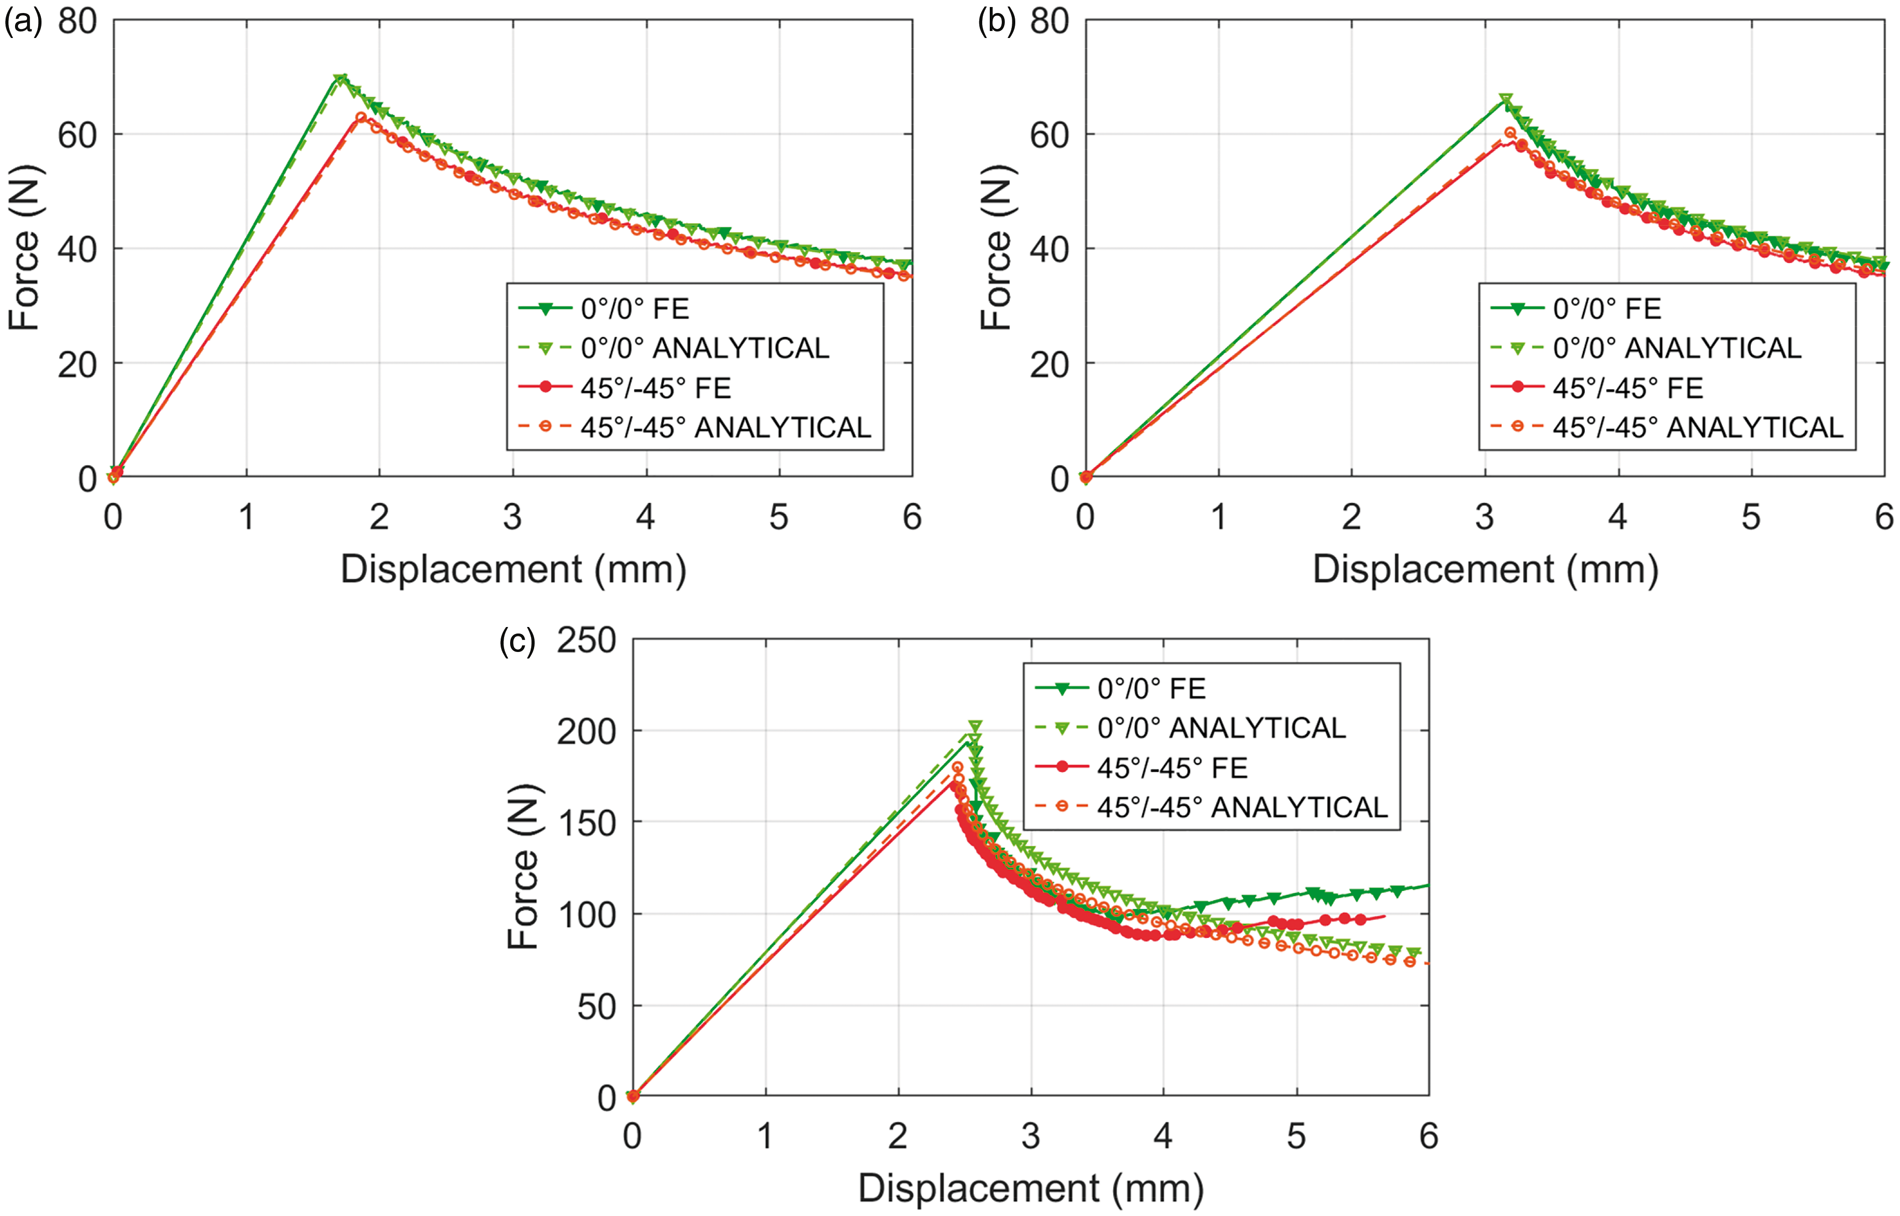
Numerical/analytical load-displacement curves for: (a) DCB; (b) MMB 20%; (c) MMB 50%.
The excellent agreement between the numerical analysis and the analytical solution indicates the effectiveness of both the analytical and FE model. It is possible to appreciate how, for the three considered cases, the stiffness of the specimens with 45°/−45° interface decreases, as expected, due to a lower number of 0° plies leading to a reduction of the delamination onset load. It would not have been possible to capture this behavior without using the analytical model described in the previous section which is able to take into account different properties between the upper and lower arms of the specimen.
In calculating the analytical solution, it has been assumed that the mode-mixity is 0, 0.2 and 0.5 for the DCB, MMB20% and MMB50%, respectively. However, the actual values of the mode-mixity may be different for the specimen with different oriented plies at the interface due to the different behaviors of each arm. To verify the assumptions made on the mode-mixity, the three components of the energy release rate are reported in Table 3 together with the resulting mode-mixity averaged along the width of the specimen evaluated from the numerical analysis at the onset of the delamination.
Energy release rate components and mode-mixities at delamination onset.
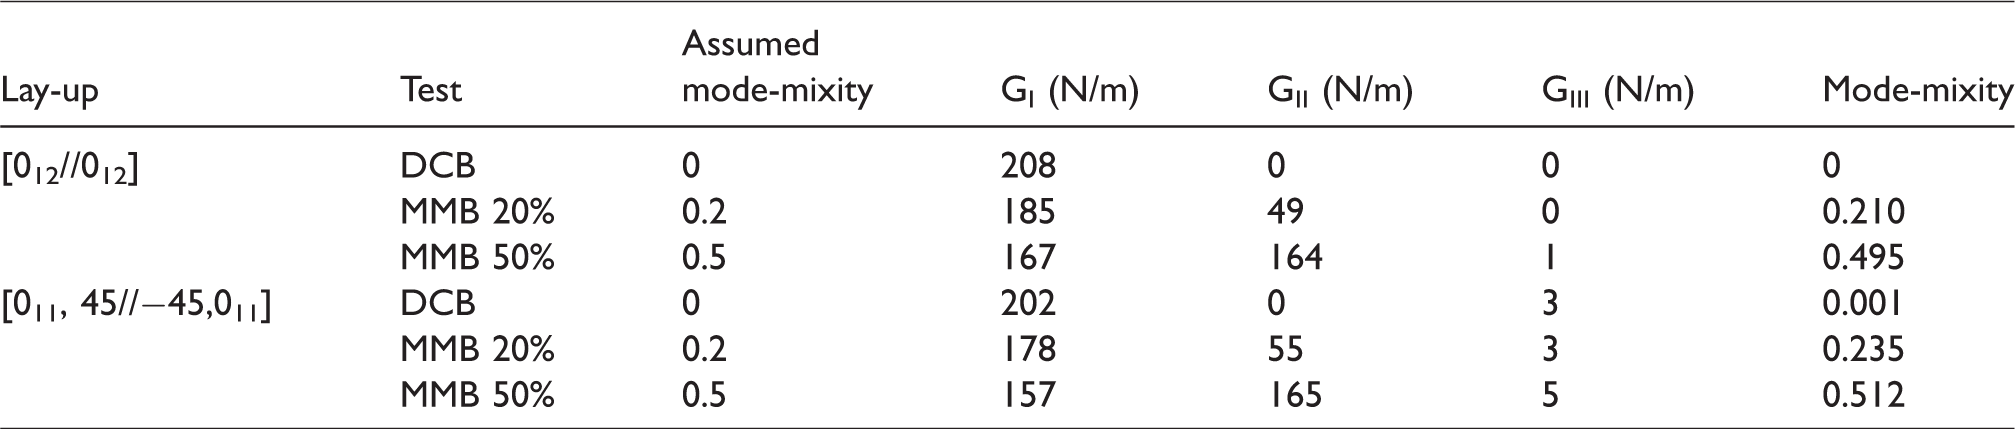
The difference between the assumed mode-mixities and the values obtained from the numerical analysis is small for both the lay-ups, indicating that the assumptions made in the calculation of the analytical solution are correct. However, it must be considered that these mode-mixities are calculated at the onset of the delamination and may vary during the propagation.
Experimental tests
An overview of the test set-up adopted in the experimental campaign is illustrated in this section together with the description of the DCB and MMB fixtures employed and the specific procedures followed for each test. Then, the equations adopted to calculate the fracture toughness from the experimental data in terms of load, displacement and delamination length are reported.
Test set-up
A Zwick tension/compression testing machine with a load cell of 10 kN is employed for all the tests. The set-up used for both DCB and MMB testing is shown in Figure 5.
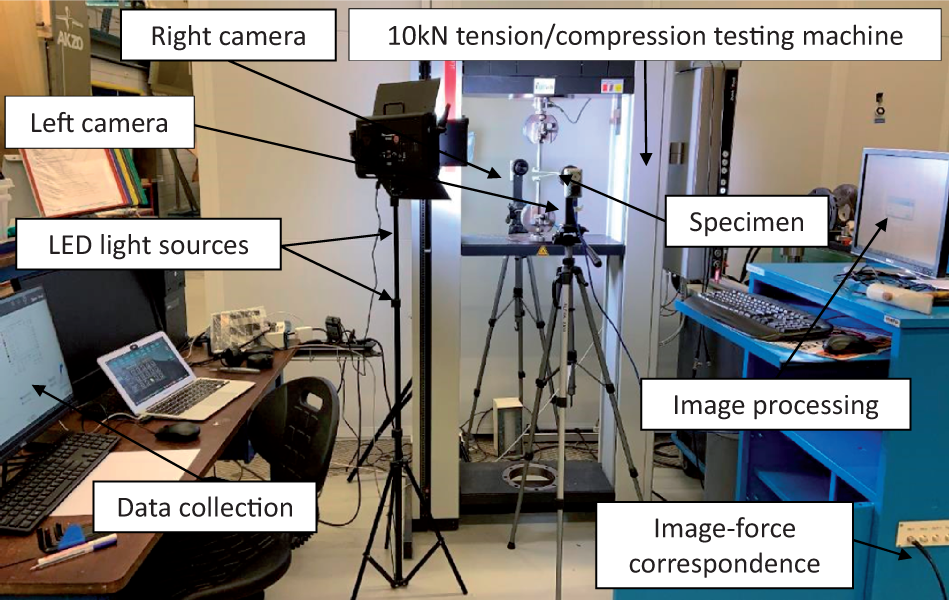
Test set-up.
The tests are displacement-controlled and the data collection software testXpert III is employed to record the load and the displacement from the machine. Two Optomotive high performance cameras, indicated as left and right camera in Figure 5, are situated in the front and back of the testing machine, respectively. The two cameras point the specimens from opposite sides so to measure the delamination length during the propagation from both sides and to identify any possible misalignment caused by the testing equipment or by the non-uniform delamination propagation in multidirectional specimens.
To enable visual observation of the delamination length during the tests, two LED light sources are used and both sides of the specimens are painted with white liquid corrector, on top of which small marks are created. As indicated by the ASTM standard,3,4 the first mark is made at the location of the initial delamination length, followed by five marks every 1 mm, and then every 5 mm for the next 25 mm.
DCB tests
The DCB fixture consists of two thick metallic plates clamped at the top and bottom of the testing machine and connected to the loading blocks of the specimen with a pin. The opening of the specimen is achieved by moving the bottom part of the fixture down, applying thus a tensile load on the specimen, perpendicular to the plane where the delamination propagates. A photo of a DCB test is shown in Figure 6.
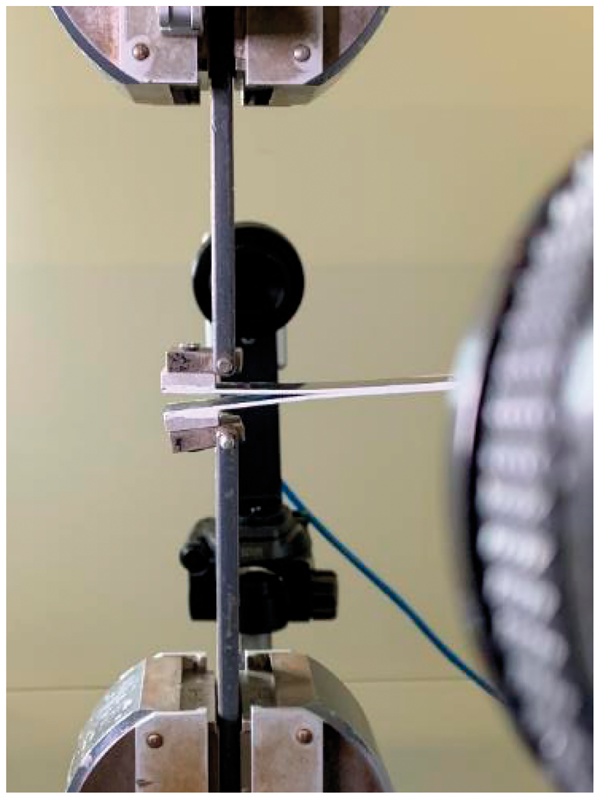
DCB test.
The displacement rate of the machine is set at 0.5 mm/min, while the cameras takes images every 0.5 seconds. Following the ASTM standard, at first, the specimens are pre-cracked allowing the delamination to propagate a few millimeters. In presence of large-scale bridging, pre-cracking can be problematic due to the fact that the fiber bridging may be already high enough to alter the onset value of the fracture toughness especially for the specimens with different oriented plies at the interface. Nevertheless, following the procedure suggested by the standard, both the lay-ups are pre-cracked before the test.
MMB tests
The MMB fixture consists of two parts: the bottom part is in contact with the specimen through a roller and through a pin at the loading blocks while the top part, the lever, is in contact with the specimen through a roller in the middle of the specimen and through the loading blocks. During testing, the bottom part of the machine moves up, causing the lever to rotate, creating an opening fracture mode at the loading blocks and a sliding fracture mode as the roller pushes the specimen, achieving a mixed-mode I/II fracture behavior. A photo of a MMB test is shown in Figure 7.
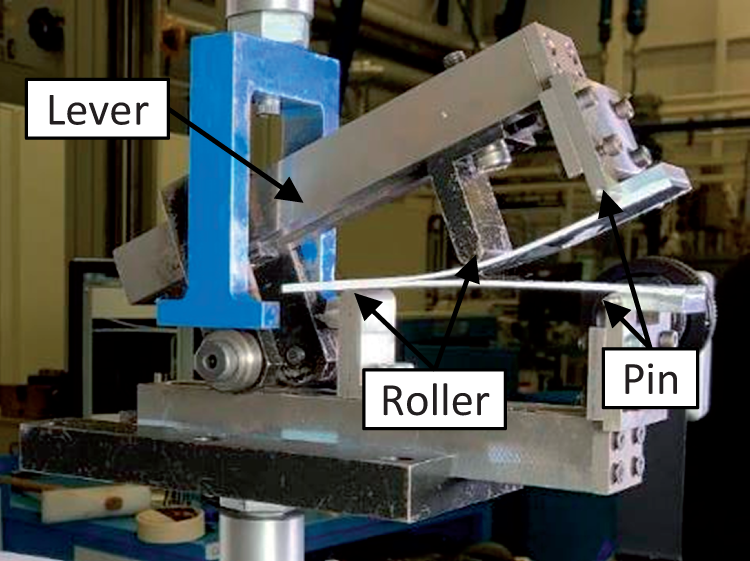
MMB test.
The displacement rate is set at 0.5 mm/min, while the cameras take images every second. For the MMB test, the ASTM standard does not recommend the use of pre-cracking and it has been decided not to perform it to be able to compare the results with literature data in which no pre-crack is usually adopted.
Evaluation of fracture toughness
In this work, the analytical solution described in ‘Preliminary analysis’ section is employed to calculate the fracture toughness from the load, displacement and delamination length measured during the tests. Equation (2) and equation (15) are adopted to evaluate the fracture toughness from the experimental data of the DCB and MMB, respectively.
However, equation (15) does not take into account the weight of the lever of the MMB fixture. Indeed, as indicated in the ASTM standard, corrections must be introduced if this weight is more than 3% of the applied load. The lever and the MMB loading apparatus adopted in this work weigh 1.793 kg, which results in an additional force of 17.6 N. From the results of the preliminary analyses, this value represents a significant percentage of the expected load, then its effect on the calculation of the energy release rate needs to be considered.
The load due to the weight of the lever, Pg, represents an additional load applied in the center of gravity of the fixture which is located at a distance cg from the central roller. The distribution of forces on the lever is described in Figure 8.
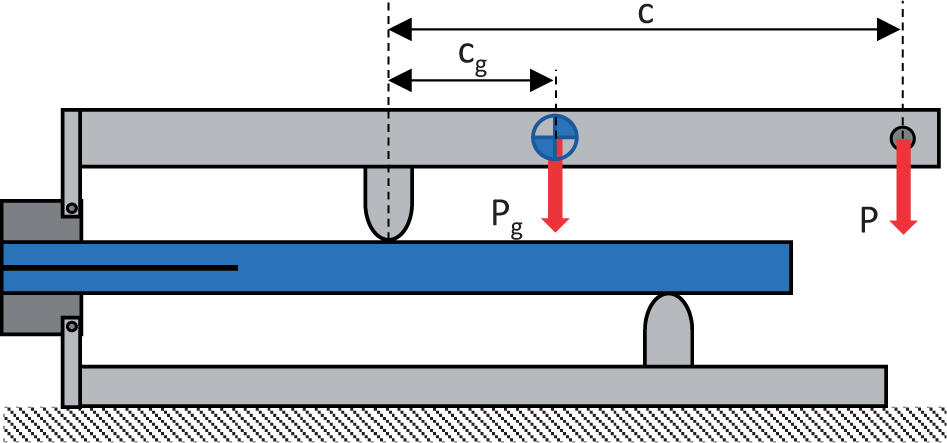
Distribution of the forces on the lever in MMB tests.
The value of cg depends on the configuration of the fixture: 60 mm for a mode-mixity of 20% and 43.5 mm for a mode-mixity of 50%. Equation (15), for the calculation of the energy release rate during the MMB test can be easily modified considering the weight of the lever as an additional force applied to the fixture, as shown in equation (18)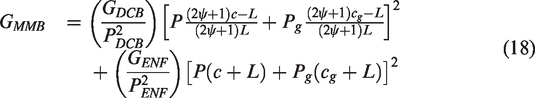
Experimental results
In this section, the results in terms of load-displacement curves and fracture toughness for the DCB, MMB 20% and MMB 50% tests performed on the specimens described in ‘Specimen description’ section, are shown. Experimental data from literature are used for comparison.
DCB results
The load-displacement curves measured for the DCB specimens with [012//012] and [011, 45//−45,011] lay-ups are shown in Figure 9.
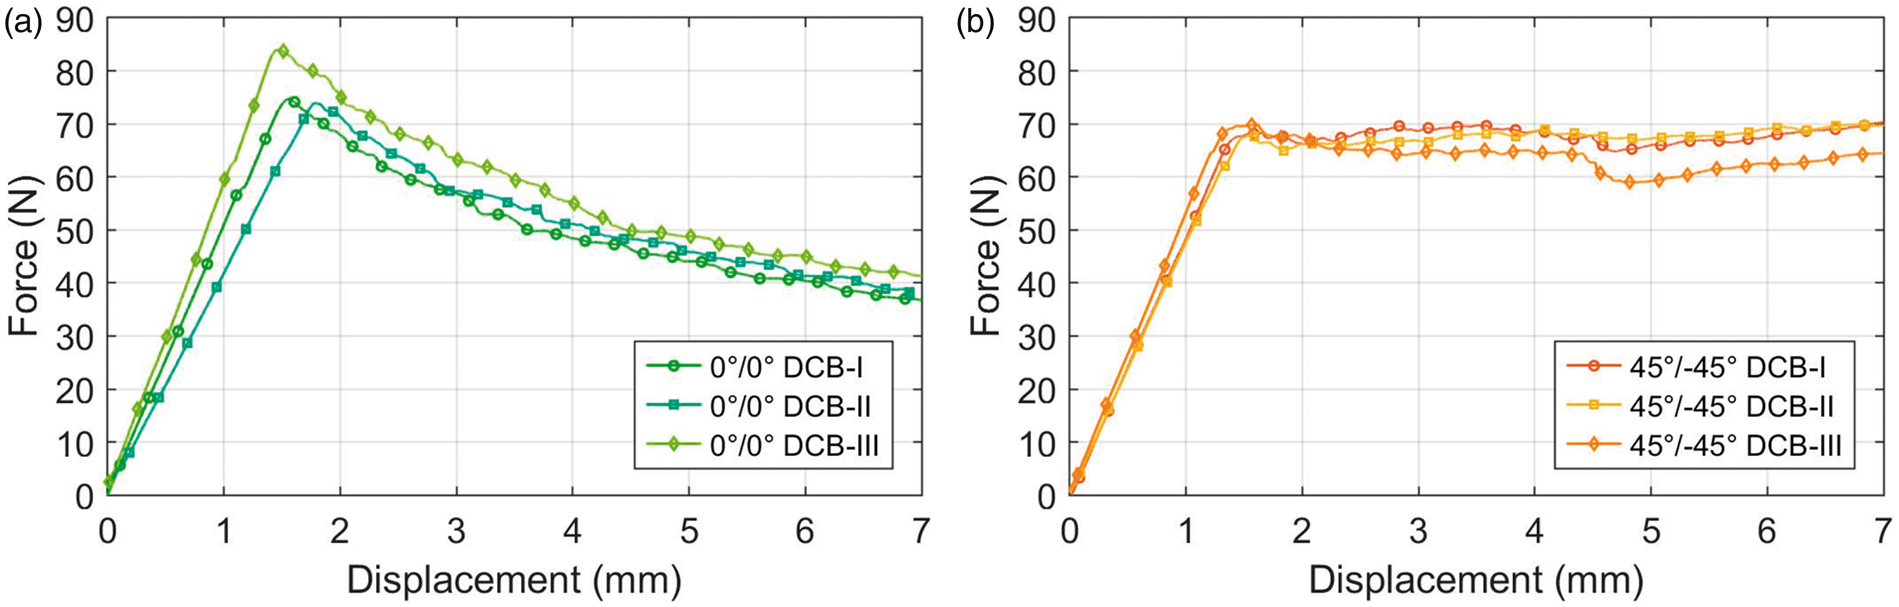
Load-displacement curves of the DCB specimens: (a) 0°/0° interface; (b) 45°/−45° interface.
The difference between the curves in Figure 9(a) can be explained by the different initial delamination length due to the pre-cracking and by a small thickness variability. Each specimen with 0°/0° interface presents a peak load at the delamination onset point followed by a gradual reduction of the load, indicating a null or small R-curve effect. On the other hand, the specimens with 45°/−45° interface in Figure 9(b) show a completely different behavior with a constant load after the delamination onset, which suggests the presence of an R-curve effect due to fiber bridging and delamination migration to adjacent plies. These phenomena can be appreciated in Figure 10 where an image taken during the test of a specimen with 45°/−45° interface is reported.
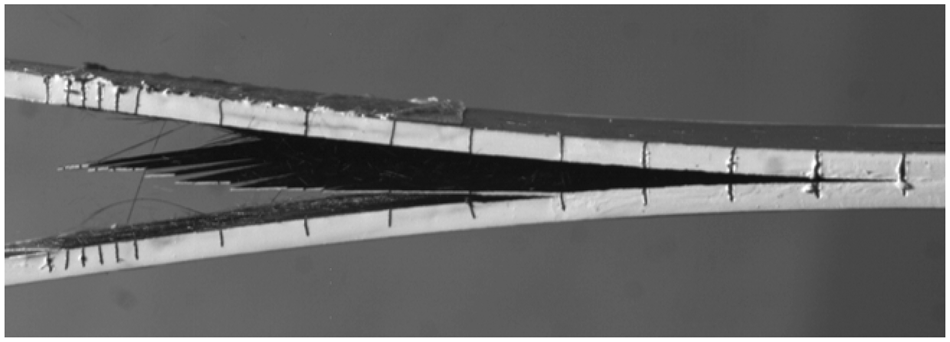
Fiber bridging and delamination migration in testing DCB specimen with 45°/−45° interface.
In Figure 11, the R-curves obtained by using the equation (2) and calculated from the visual propagation of the delamination of both cameras are reported. Only the specimens “0°/0° DCB-II” and “45°/−45° DCB-II” are presented as representative of the behavior of the two lay-ups.
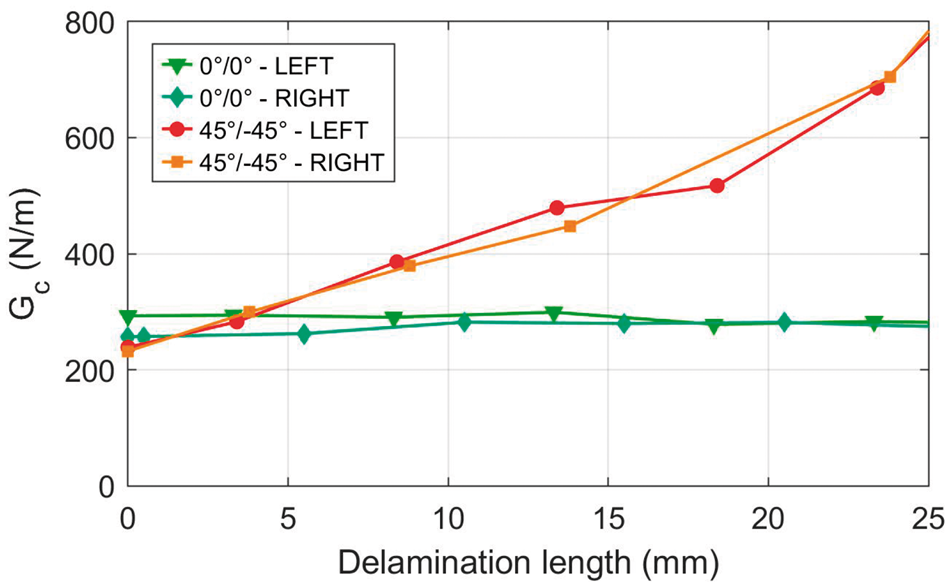
R-curves comparison between left and right camera for DCB specimens.
It is possible to appreciate how the propagation of the delamination is approximately equal on both sides of the specimens for both the configurations.
The R-curves obtained for all the performed tests are reported and compared with literature data of unidirectional specimens with the same material in Figure 12. Only the values calculated from the visual propagation of the delamination observed from the images of the left camera are reported.
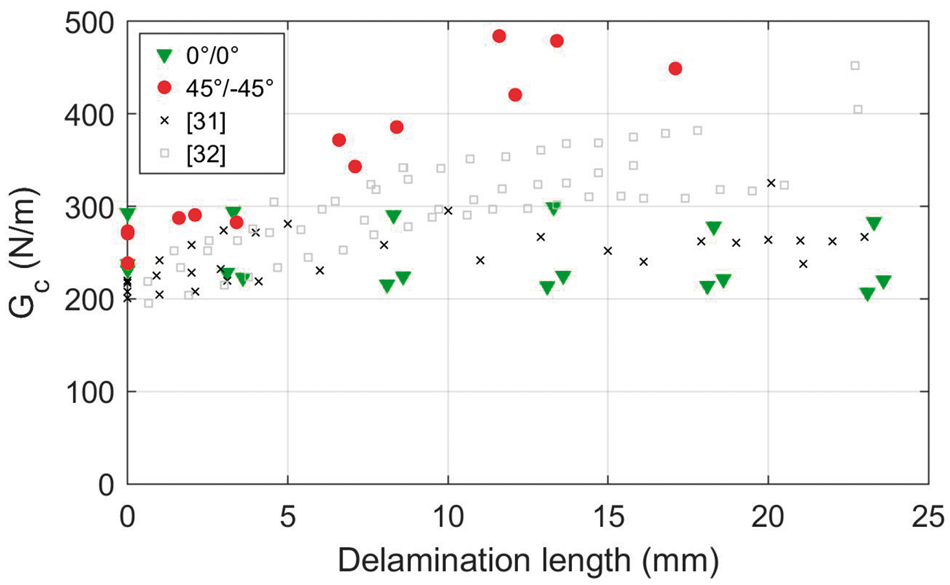
R-curve of DCB specimens.
The R-curve obtained for the specimens with 0°/0° interface follows the same trend of the one reported by Hansen and Martin, 31 showing no R-curve effect, which is instead present in the results shown by Murri. 32 The reason for these differences could be explained by a possible different thickness of the specimens, which influences the R-curve effect. In particular, the specimens tested by Murri 32 are 4.5 mm thick respect to the 3 mm specimens tested in this work. As expected, for the specimens with 45°/−45° interface a higher R-curve effect is observed, while the onset value of the fracture toughness is very similar for both specimen configurations.
It should be mentioned that, in general, it is still an open question whether the R-curve can be considered a material property or rather a structural characteristic. In the specimens with 45°/−45° plies investigated in this work, the R-curve cannot be considered a property of this particular interface because the evolution of the damage depends on the overall laminate stacking sequence.
The fracture surfaces of the DCB specimens after the tests can be observed in Figure 13. Only one specimen with 0°/0° interface is shown, as the fracture surface is identical for all of them. The direction of propagation is indicated by the black arrow, while the dashed white lines indicate the position of the delamination when the test is stopped.
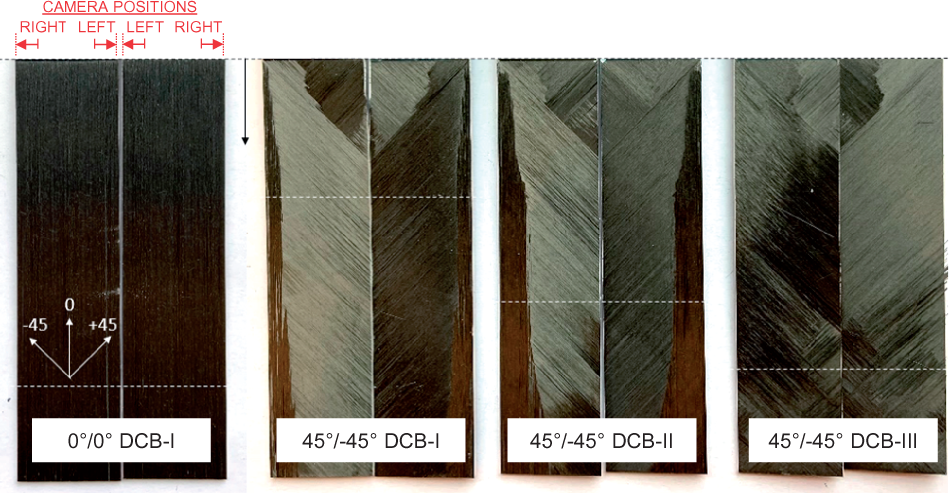
Fracture surfaces of DCB specimens.
The specimen with 0°/0° interface presents a smooth fracture surface, with all the fibers oriented according to the 0° direction and no signs of large-scale fiber bridging. In the specimens with 45°/−45° interface, on the other hand, the fracture surface is not smooth as a result of delamination migrating in the neighboring plies. The delamination propagates inside the −45° ply and in two of the specimens partially migrates to the 0° ply on one side. The differences in the fracture surfaces of specimens with 45°/−45° interface can be related to their force-displacement curves in Figure 9(b), where it can be observed how for the specimen “45°/−45° DCB-III” the load is slightly lower than the other two specimens indicating a smoother propagation of the delamination.
MMB 20% results
The load-displacement curves measured for the MMB 20% mode-mixity specimens with [012//012] and [011, 45//−45,011] lay-ups are shown in Figure 14.
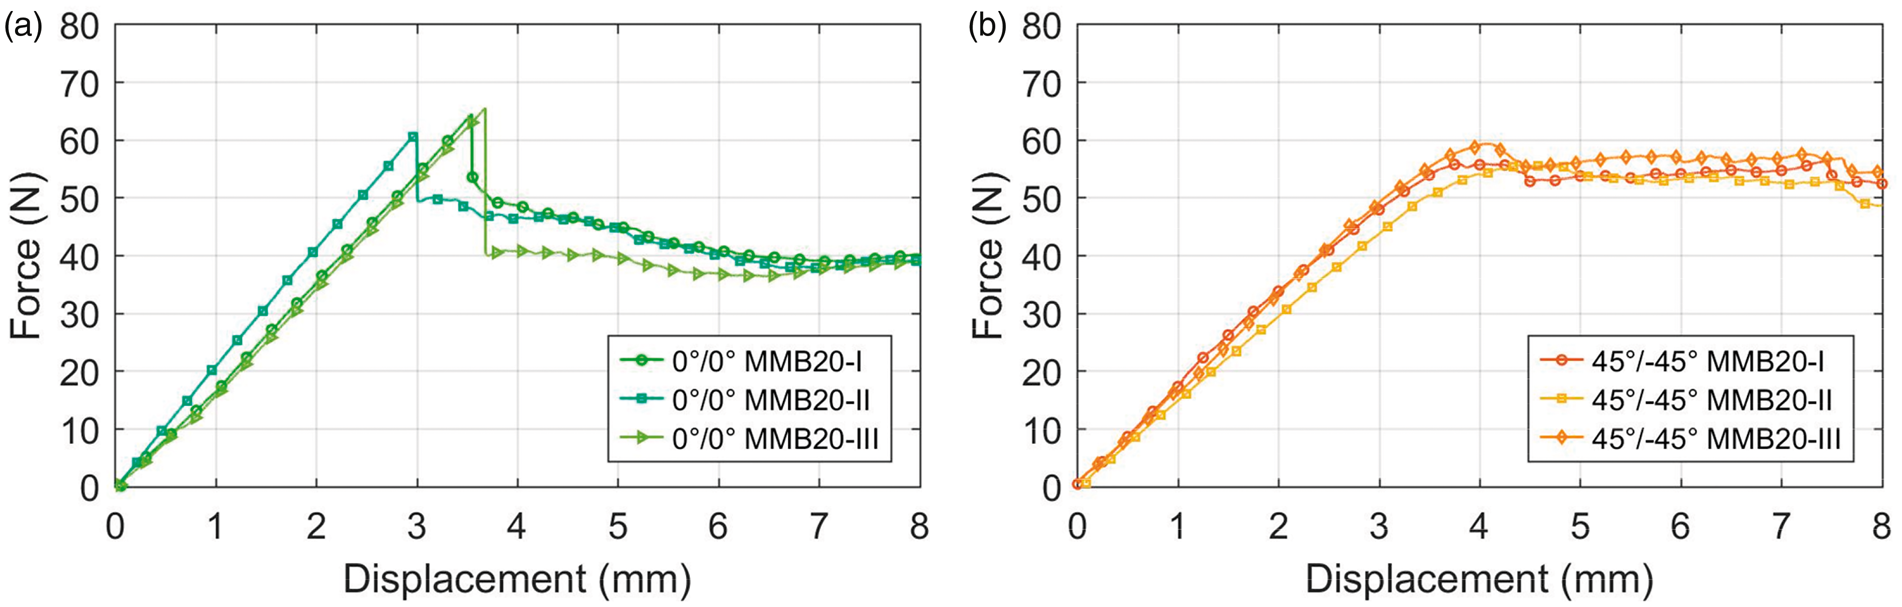
Load-displacement curves of MMB 20% specimens: (a) 0°/0° interface; (b) 45°/−45° interface.
Similar to the DCB force-displacement curves, a larger variability is observed in the MMB specimens with 0°/0° interface. The difference in stiffness can be explained by a slightly misalignment of the loading block, which changes the loading line a few millimeters for some of the specimens resulting in an increase of the actual delamination length. In Figure 14(a), a load drop caused by an unstable propagation of the delamination can be observed. This drop, not predicted by the analytical and preliminary numerical analyses, is mainly due to the absence of pre-cracking and to the adoption of an insert slightly thicker than recommended. The load drop is not present in the specimens with 45°/−45° interface because the delamination starts propagating sooner on one side of the specimen than in the other, causing the non linear behavior in the load-displacement curve before the peak load, when the delamination starts propagating from both sides. Compared to the DCB tests, the MMB specimens with 0°/0° interface exhibit a constant load region after the peak which anticipates the presence of an R-curve effect. In the specimens with 45°/−45° interface the load remains mostly constant after the peak while the displacement, and thus the delamination length, increases, indicating a larger increase of the fracture toughness respect to the unidirectional specimens.
In Figure 15, the R-curves obtained from the visual propagation of the delamination of both cameras are reported for the specimens “0°/0° MMB20-I” and “45°/−45° MMB20-II”, as representative of the behavior of the two lay-ups.
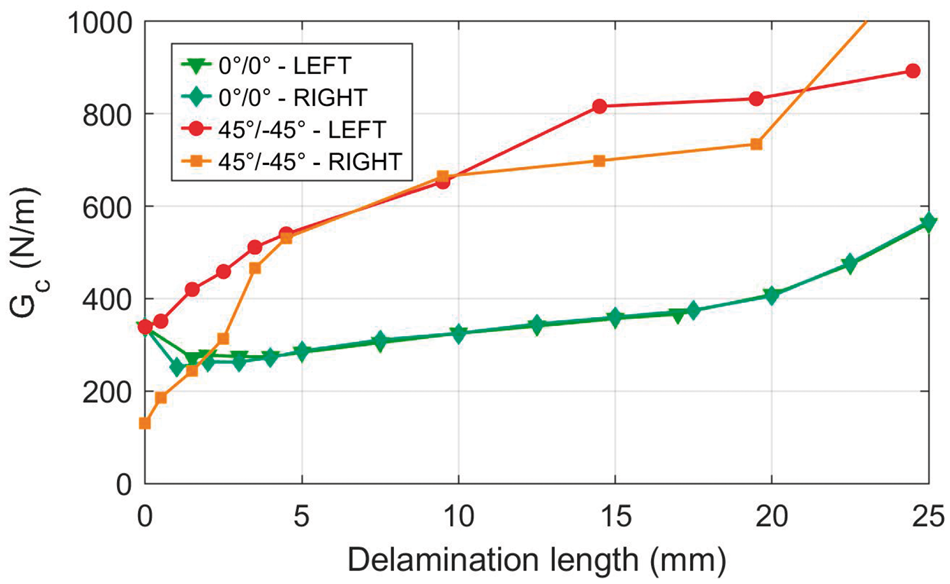
R-curves comparison between left and right camera for MMB 20% specimens.
It is possible to appreciate how in the specimens with 45°/−45° interface the delamination propagates first from the right side of the specimen and after almost 5 mm of propagation the values recorded from the two sides of the specimen converge when the propagation of the delamination stabilizes. For the unidirectional specimens the difference between the two sides is negligible.
The obtained R-curves for all the performed tests are reported and compared with literature data 33 for unidirectional specimens with the same material in Figure 16.
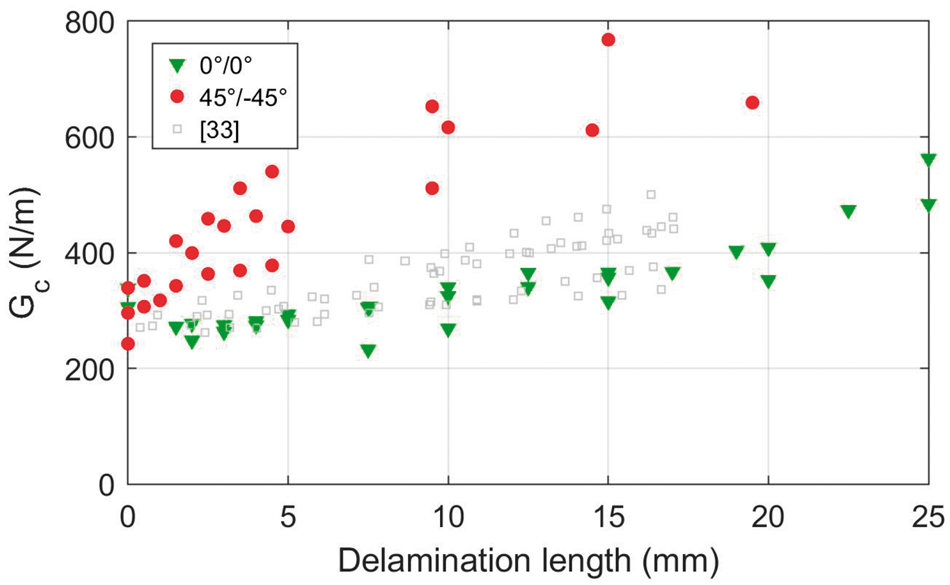
R-curve of MMB 20% specimens.
It must be pointed out that after 20 mm of propagation the delamination tip is close to the roller of the lever which can be expected to make the results non-representative. As already observed from the force-displacement curves, the specimens with 0°/0° interface show a small R-curve effect in accordance with the literature data, while the specimens 45°/−45° interface exhibit a larger increase of the fracture toughness with the delamination length.
The fracture surfaces of the MMB 20% specimens after the tests can be observed in Figure 17.
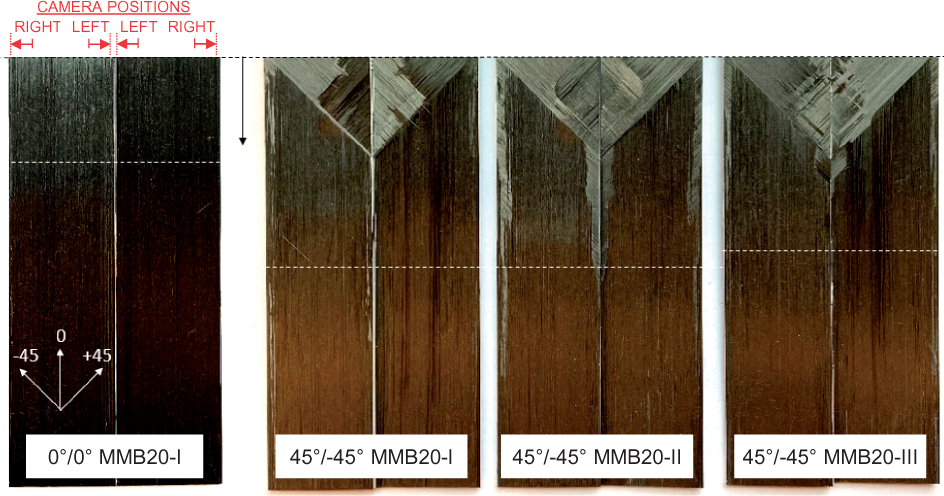
Fracture surfaces of MMB 20% specimens.
The specimen with 0°/0° interface presents a smooth fracture surface, with all fibres oriented according to the 0° orientation and no signs of fibre bridging. Compared to DCB tests, the specimens with 45°/−45° interface show a much more consistent behavior. For all the specimens the delamination migrates reaching entirely the 0° ply.
MMB 50% results
The load-displacement curves measured for the MMB 50% mode-mixity specimens with [012//012] and [011, 45//−45,011] lay-ups are shown in Figure 18.
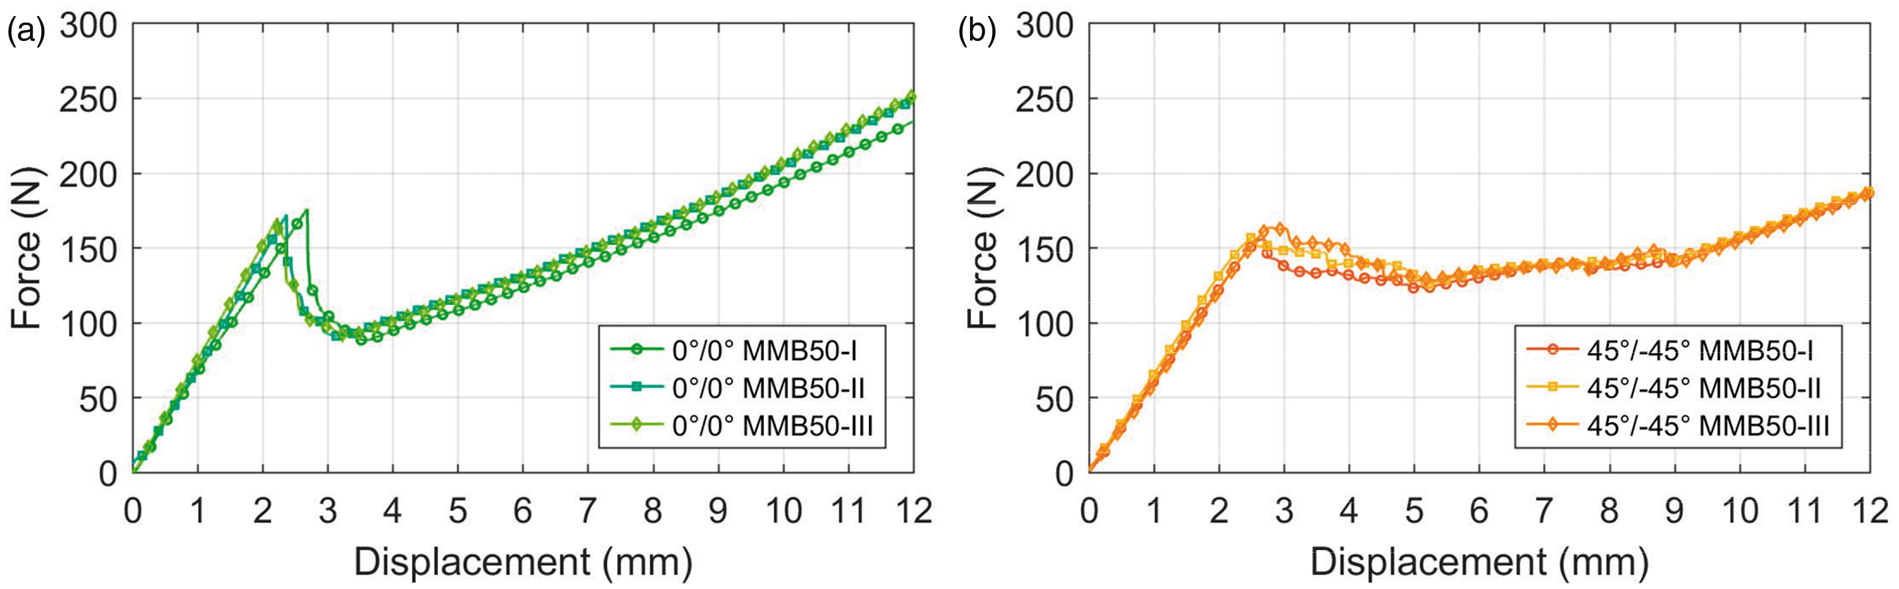
Load-displacement curves of MMB 50% specimens: (a) 0°/0° interface; (b) 45°/−45° interface.
For the MMB specimens at mode-mixity 50%, the load-displacement curves show less variability respect to the previous experimental results. The specimens with 0°/0° interface follow very closely the behavior observed in the preliminary analyses, while also in this case the specimens with 45°/−45° interface exhibit a higher R-curve effect.
In Figure 19, the R-curves obtained from the visual propagation of the delamination of both cameras are reported for the specimens “0°/0° MMB50-II” and “45°/−45° MMB50-I”, as representative of the behavior of the two lay-ups.
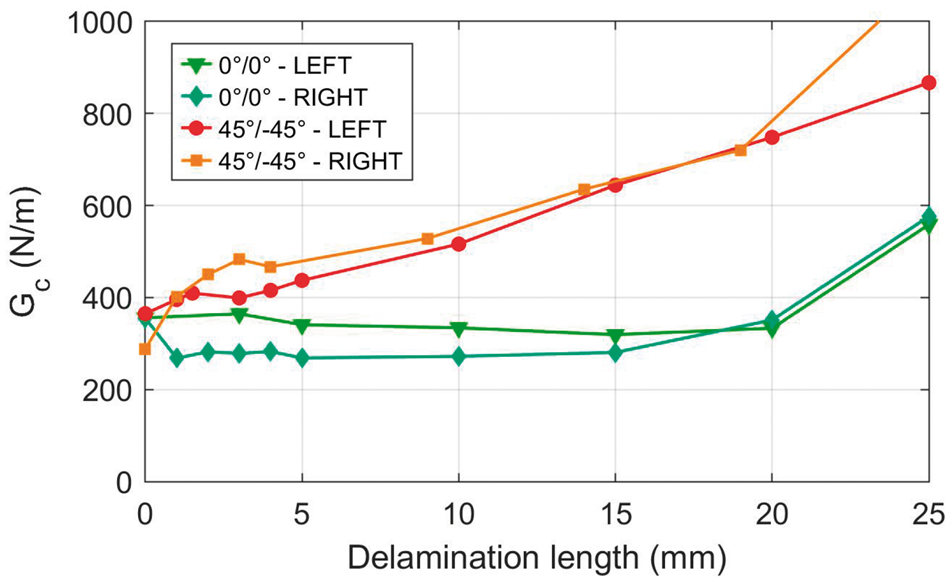
R-curves comparison between left and right camera for MMB 50% specimens.
In this case, a difference between both sides of the specimens can be observed for both configurations indicating that at the beginning of the propagation the delamination is not growing symmetrically respect to the longitudinal axis of the specimen, which could be due to a not perfectly symmetric application of the load.
The R-curves obtained for all the performed tests are reported and compared with literature data 33 of unidirectional specimens with the same material in Figure 20.
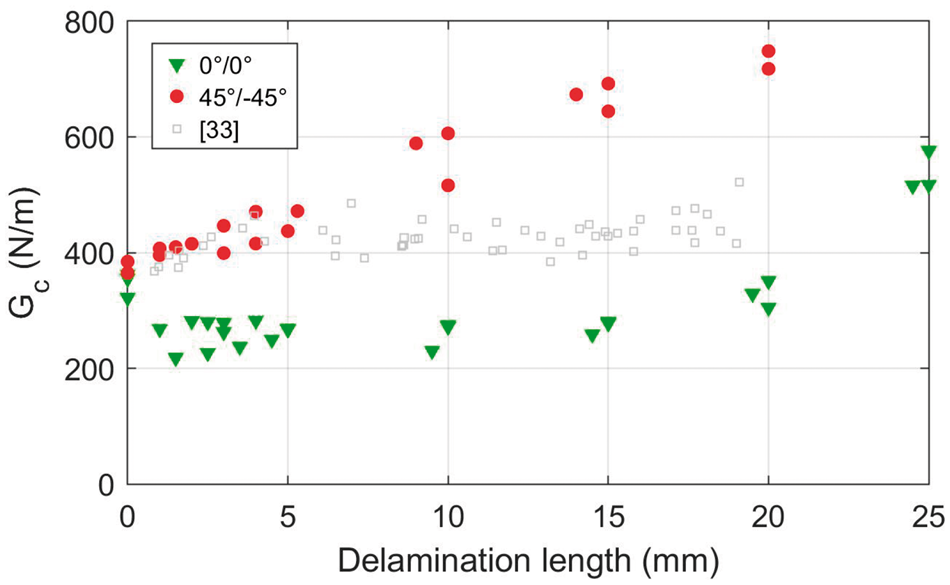
R-curve of MMB 50% specimens.
As expected, the unidirectional specimens do not show a relevant R-curve effect, while in the specimens with 45°/−45° interface the fracture toughness increases significantly with the delamination length.
The fracture surfaces of the MMB 50% specimens after the tests can be observed in Figure 21.
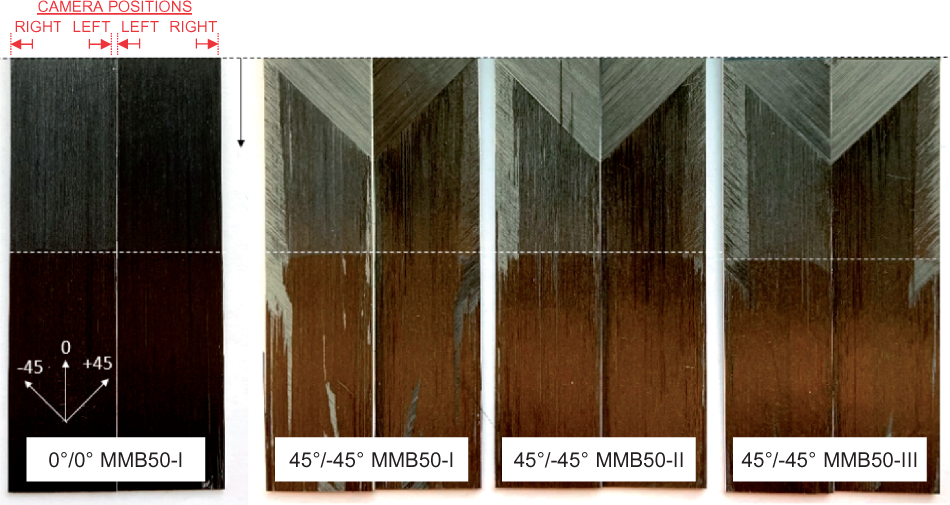
Fracture surfaces of MMB 50% specimens.
The fracture surface of the unidirectional specimen is identical to those observed in the DCB and MMB 20% tests. In the specimens with 45°/−45° interface, a quite consistent behavior is observed in all the three specimens: the migration to the 0° ply takes place on one side of the specimen, while it propagates in the −45° ply in the opposite side.
The larger variability of all the specimens with 0°/0° interfaces compared to the specimens with 45°/−45° interfaces is related to the propagation stability of the delamination. In all the load-displacement curves of the specimens with 45°/−45° interfaces there is a clear non-linear behavior prior to the maximum load and there is no load drop, especially in the MMB tests. This is the results of a gradual and stable propagation in contrast of what can be observed in the specimens with 0°/0° interfaces where the onset of the delamination is unstable.
Fracture toughness vs mode-mixity
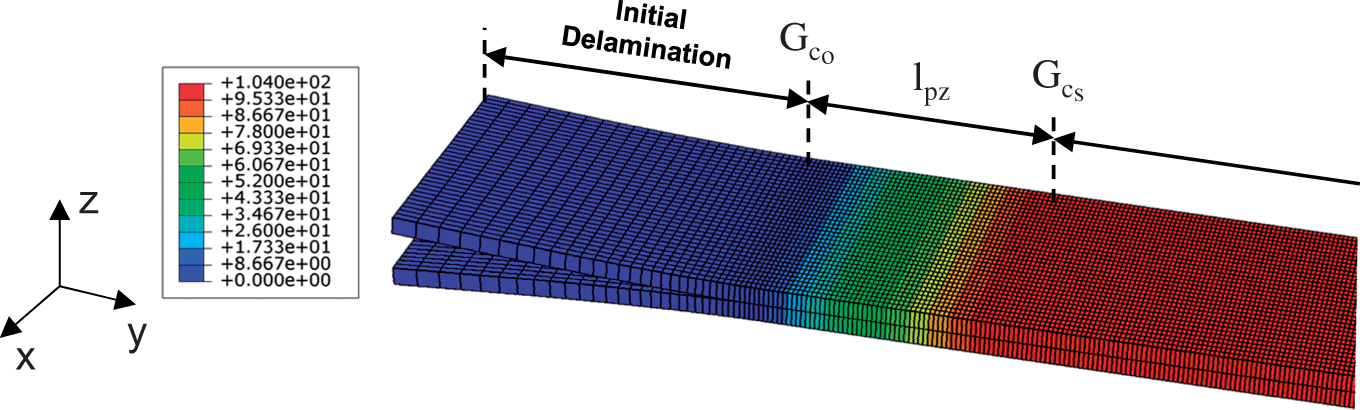
For each test, the values of the fracture toughness at the onset (Gco) and the steady-state fracture toughness (Gcs) are measured together with the steady-state fracture process zone length (lpz), meaning the crack length where the value of the fracture toughness stabilize, which characterizes the R-curve. The values are summarized in Table 4, for each test and lay-up configuration averaging the data of all the tested specimens. For the MMB tests of the specimens with 45°/−45° interface the lpz is assumed to be 20 mm since, as already remarked, this is the location where the delamination reaches the roller of the upper fixture which influences the propagation and invalidates the results after this point.
R-curve parameters for each specimen lay-up and mode-mixity.
From Table 4, it can be observed that during the propagation due to the fiber bridging and delamination migrating to adjacent plies, the fracture toughness increases up to 520%, 119% and 103% for mode mixtures 0%, 20% and 50% in the specimens with 45°/−45° interface.
Using the results for the three available mode-mixities, it is possible to calculate the curve of the fracture toughness vs the mode-mixity for the two considered lay-ups adopting the BK law reported in equation (1). The value of the fracture toughness in pure mode II is taken from literature since no mode II test has been carried out.
In Figure 22, the curves obtained fitting with the least squares method the experimental data in terms of onset fracture toughness for the two lay-up configurations are reported together with the average of the experimental data of Table 4.
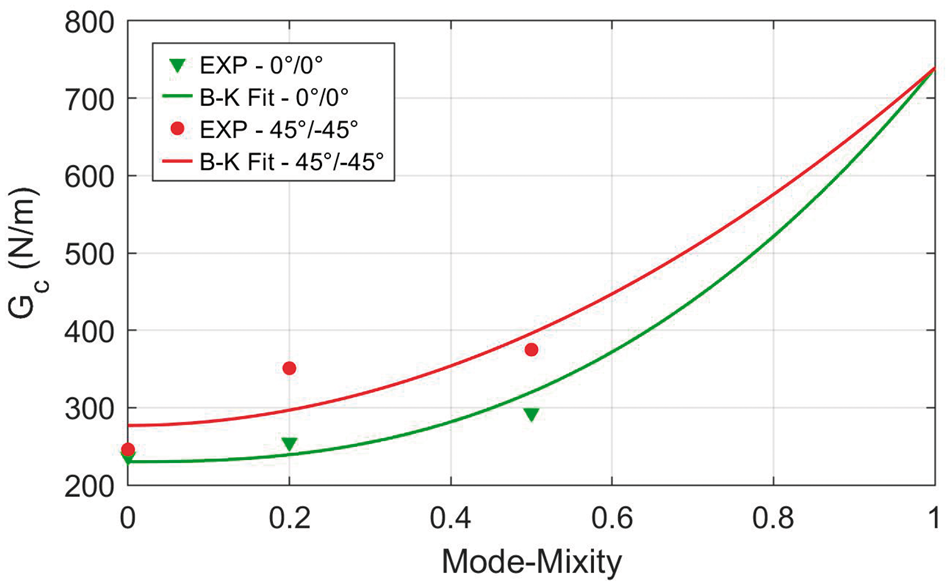
Comparison of fracture toughness vs mode-mixity curves between specimens with 0°/0° and 45°/−45° interface.
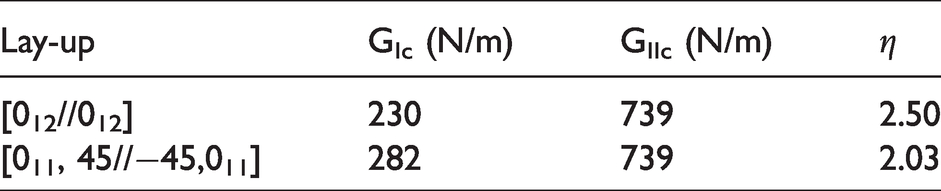
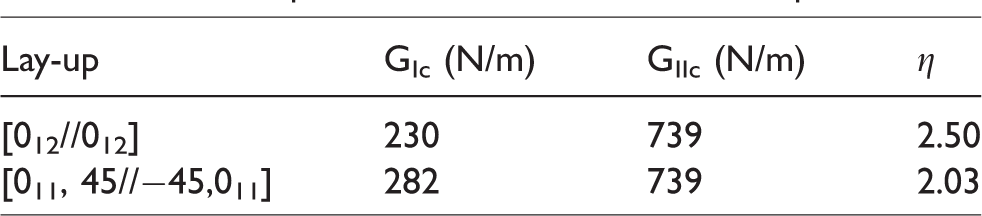
The values of the parameters for the B-K laws resulting from the fitting are summarized in Table 5.
B-K law parameters fitted for IM7/8552 specimens.
Numerical methodology
In this section, the proposed numerical methodology for simulating the R-curve effect is described and implemented using the data obtained from the performed experimental tests. The FE analyses conducted taking into account the R-curve effect are described together with the procedure adopted to fit the R-curve at different mode-mixities. The results are presented in terms of load-displacement curves, compared with the experimental data, the analytical solution and the FE analysis without considering the R-curve effect.
R-curve modelling
The R-curve effect is numerically simulated by modifying the value of the fracture toughness with the delamination length. This approach is adopted in this work since it is easy to implement with the VCCT and, for the specimens and type of tests investigated, the initial delamination front and the propagation direction of the delamination are known in advance.
Several researchers have adopted the same technique using a user material subroutine, however, to further simplify the approach, a predefined field variable is here employed. The FE ABAQUS allows to define a field variable in all nodes of the model from which the values of the material properties depend. The field variable is dimensionless and has no direct physical meaning. A field variable is so defined for each node and associated to the values of the fracture toughness for the three opening modes and the mixed mode parameter, according to the position of the node respect to the initial delamination front.
The procedure is implemented using a Python script, which modifies the input file of the FE model using the R-curve obtained from the experimental tests. The operations performed in the Python script are schematically described in Figure 23.
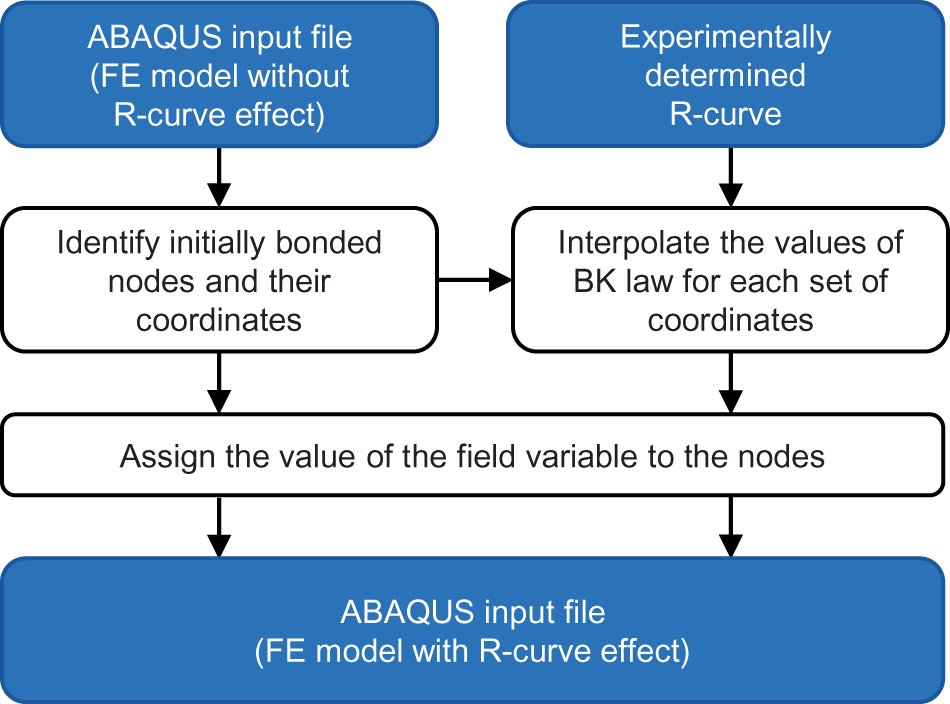
Flowchart of the Python script used to model the R-curve effect.
The starting point is the FE model of the specimen and the experimentally determined R-curves for each opening mode. Within the script, the nodes initially bonded are identified and the values of the fracture toughness and mixed-mode parameter are interpolated according to the distance of the node respect to the initial delamination front. A value of the field variable is assigned to each node and a new input file is generated. The correspondence between the field variable and the material properties is specified within the material table.
In Figure 24, the field variable for a DCB specimen is plotted, as an example of the implemented numerical procedure.
Field variable contour plot on DCB specimen for the modelling of the R-curve effect.
The field variable is zero in all the nodes initially delaminated, then, its value increases starting from the delamination tip up to the length of steady-state process zone. After this point, the value of the field variable is kept constant.
The R-curves reported in the previous section in Table 4 are extrapolated fitting for each delamination length the values of the fracture toughness according to the BK law shown in equation (1). The procedure is graphically explained in Figure 25.
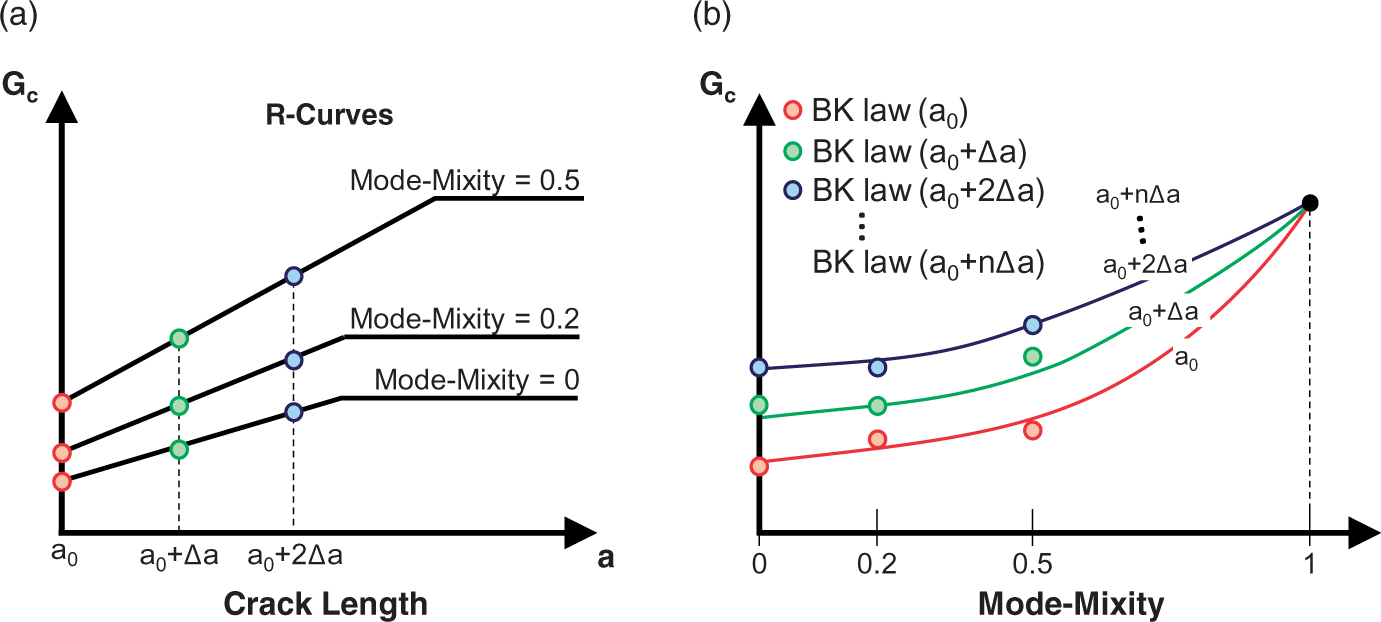
Extrapolation procedure of fracture toughness vs mode-mixity curves for increasing delamination length: (a) fracture toughness vs. crack length; (b) fracture toughness vs. mode-mixity.
Starting from the nodes located at the crack tip (a = a0) the fracture toughness for the three different tested mode-mixities are obtained from the R-curves defined in Table 4 (Figure 25(a)). The three values together with the fracture toughness for pure mode II are fitted using the least squares’ method according to the BK law in equation (1) to obtain the curve of the fracture toughness vs. the mode-mixity for a crack length a0. The same operations are repeated considering an increment in the crack length Δa equal to the distance from two consecutive nodes along the propagation direction of the delamination. Repeating this process up to the total length of the specimen, a different BK law is obtained for each node according to its distance from the crack tip (Figure 25(b)). For all the nodes located at a distance larger than the length of steady-state process zone, the fracture toughness is considered constant. The resulting curves of fracture toughness vs mode-mixity are plotted in Figure 26 and Figure 27 for increasing delamination lengths of 2 mm together with the data extrapolated as shown in Figure 25(a) for the specimens with 0°/0° and 45°/−45° interfaces, respectively. The number of points for each mode-mixity in Figure 26 and Figure 27 depend on the length of the steady-state fracture process zone, which is different for each mode-mixity and lay-up configuration. When the delamination length reaches the length of the steady-state fracture process zone, the fracture toughness is constant, as shown in Figure 25(a).
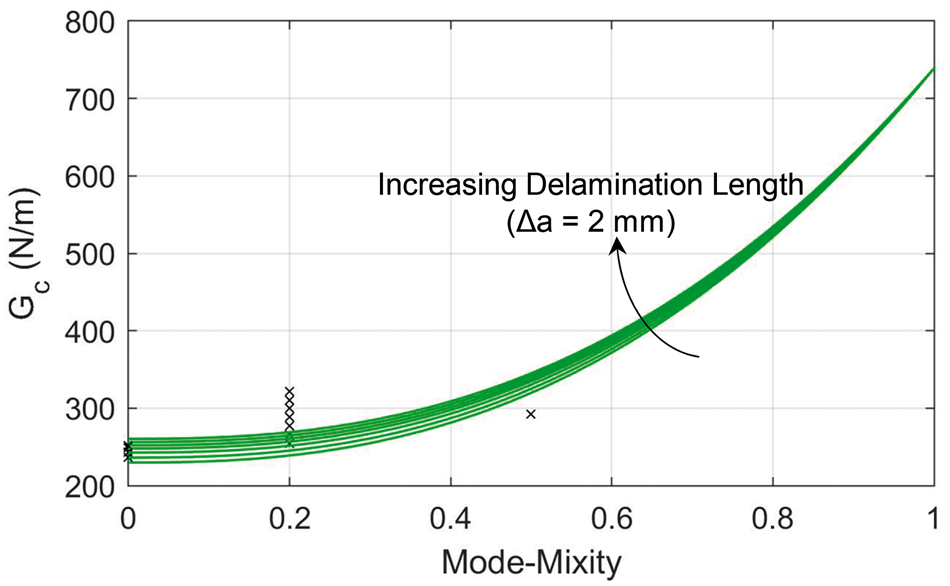
Fracture toughness vs mode-mixity for increasing delamination length fitted with the B-K criterion for specimens with 0°/0° interface.
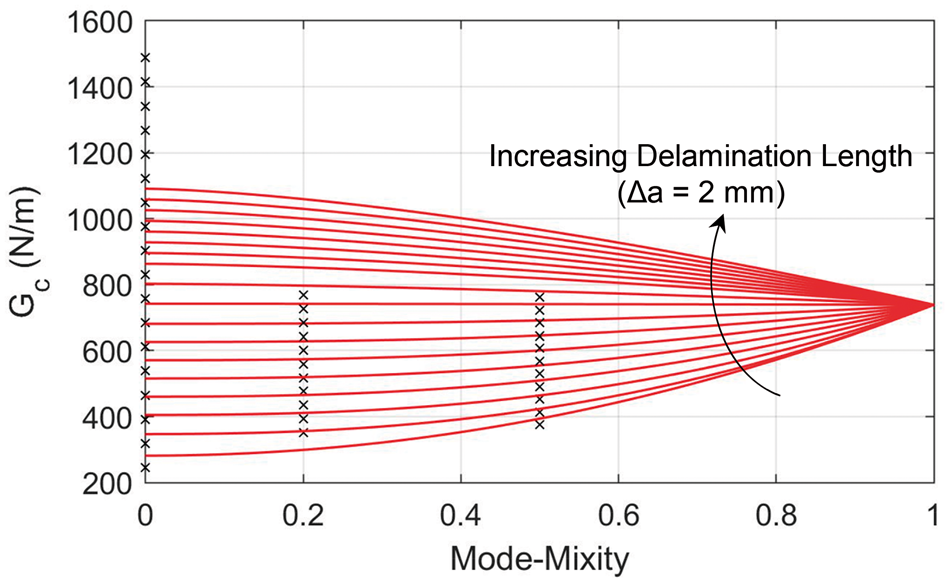
Fracture toughness vs mode-mixity for increasing delamination length fitted with the B-K criterion for specimens with 45°/−45° interface.
In Figure 26, it can be observed how for the unidirectional specimens the R-curve effect is quite limited for most mode mixities. Because of the adopted fitting procedure, the R-curve effect at mode-mixity of 20% is underestimated while it is slightly overestimated at a mode-mixity of 50%. This is due to the assumption that the fracture toughness for pure mode II is constant with the delamination length, since no experimental data are available. However, several researchers have observed R-curve effect in pure mode II, such that in reality this value should not be expected to remain constant.
In Figure 27, for specimens with 45°/−45° interface a much larger R-curve effect is observed. As the delamination length increases, the fitting leads to higher values of mode I fracture toughness respect to the other mode mixities. As reported in Table 4, the R-curve for the DCB specimens reaches values larger than 1500 N/m and extends for a steady-state fracture process zone length of 35 mm, while the R-curves for the MMB specimens only extend to 20 mm, even if no plateau is observed, because of the roller interaction in the fracture toughness measurements. For this reason, the R-curve for all mode-mixities is defined up to a distance of 20 mm from the initial delamination tip. After this point the fracture toughness does not change with the delamination length.
It must be pointed out that the numerical model adopted in this work is not able to reproduce all the local damage mechanisms occurring during the propagation of the delamination, especially for the case of delamination between plies at different orientation where migrations are neglected and the two arms of the specimen have constant thickness during the analysis. Furthermore, the effects of possible residual thermal stresses which could arise in specimens with membrane/bending coupling are not investigated. Although the use of a detailed numerical model would have provided more accurate results, it would also have drastically increased computational times.
Analyses with R-curve effect and discussion
For each specimen configuration, two different FE analyses are performed: one considering only the onset value of the fracture toughness using the standard VCCT approach, while the other simulating the R-curve effect using the approach described in the ‘DCB results’ section. For all the analyses, the envelope of the experimental data and the analytical solutions described in ‘Specimen description’ section are used as comparison.
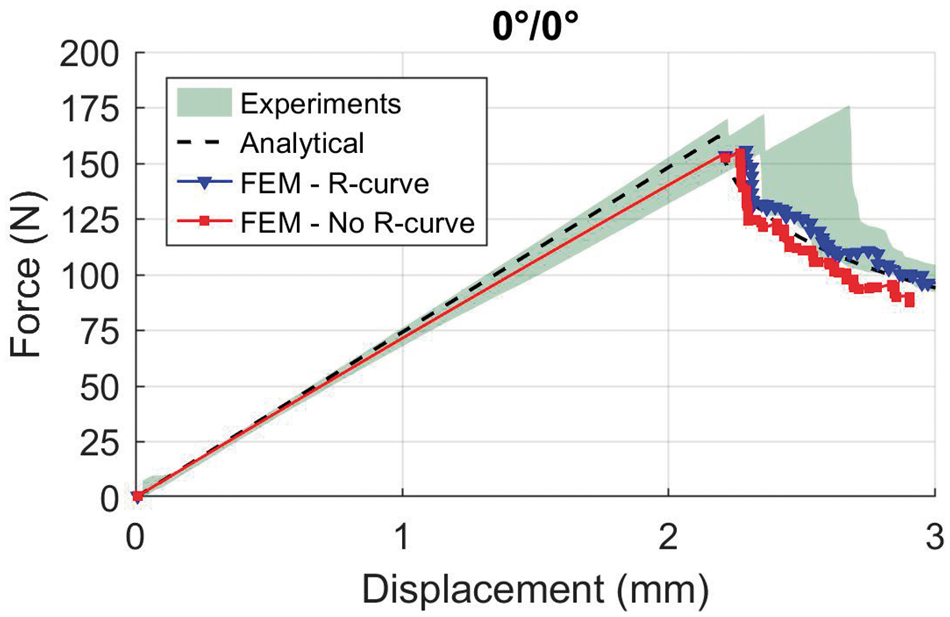
The force-displacement curves for the specimens with 0°/0° and 45°/−45° interface obtained from the DCB analysis are reported in Figure 28 and Figure 29, respectively.
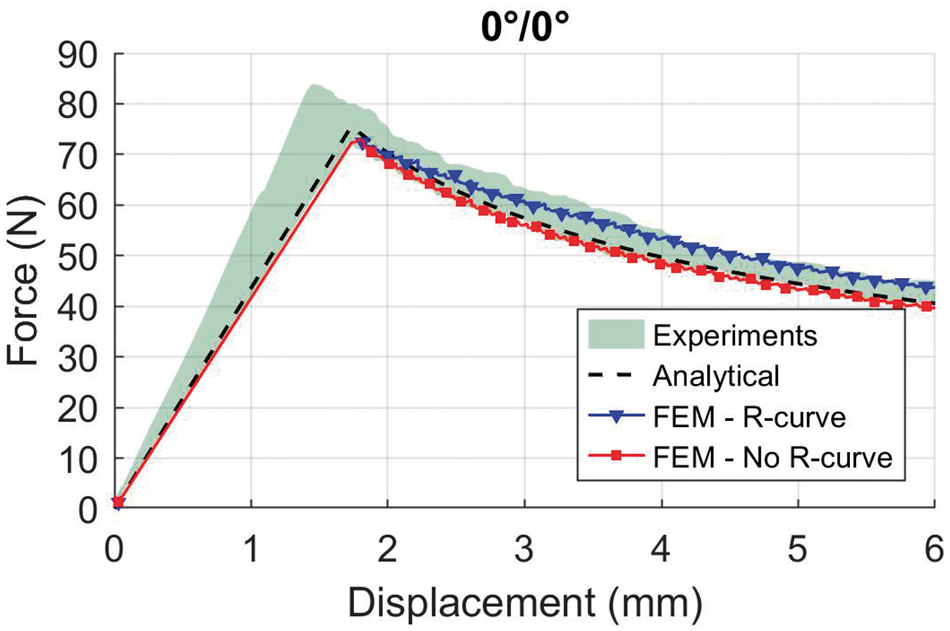
Comparison of force-displacement curves of DCB specimen with 0°/0° interface.
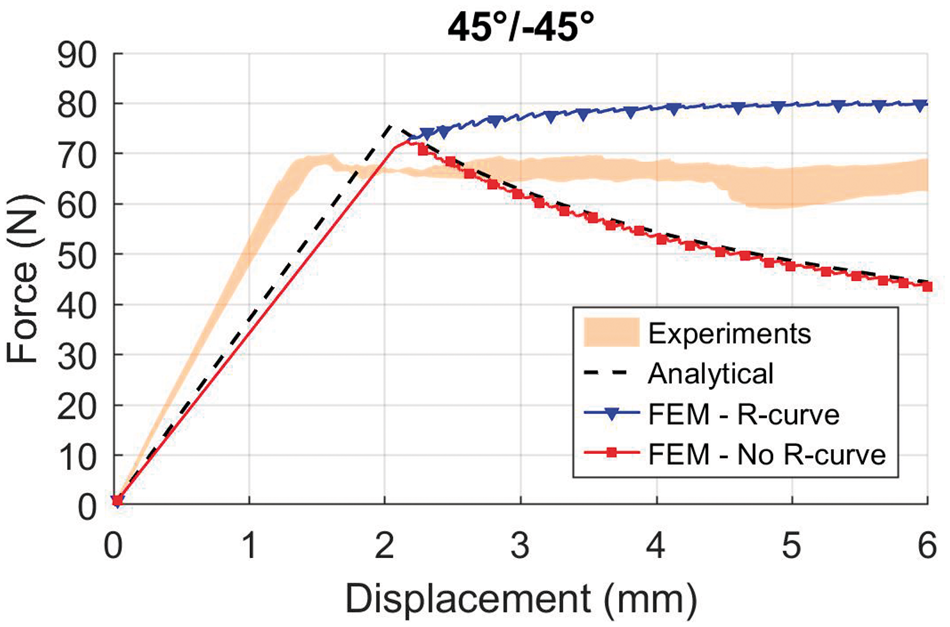
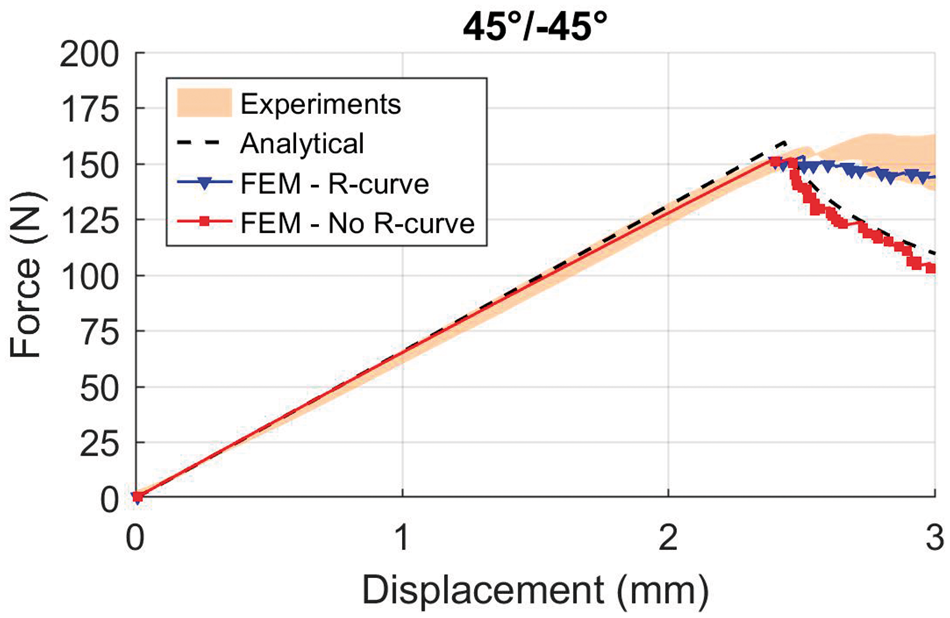
Comparison of force-displacement curves of DCB specimen with 45°/−45° interface.
For the unidirectional specimens, the agreement between both the numerical and analytical solutions and experimental data is excellent. As expected from the experimental data, the introduction of the R-curve effect does not have much influence on the numerical solution.
Regarding the specimens with 45°/−45° interface, the differences in terms of stiffness and maximum load between the experimental data and the other curves can be explained by a combination of different factors. These specimens have a slightly larger thickness, on average 3.1 mm while the nominal value is 3 mm, and therefore higher stiffness. As it can be observed in Figure 6, the pins connecting the loading fixture to the specimens are slightly shifted from the loading blocks and this reduces the effective crack length and increases the stiffness. The higher stiffness in the DCB tests can also be observed for the unidirectional specimens shown in Figure 28, although here the difference is less pronounced. The higher maximum load predicted by the numerical analysis can be explained by the overestimation of the initial fracture toughness used in the numerical model due to the fitting employed and shown in Figure 27. It would have been possible to perform numerical analyses using the values of the fracture toughness obtained experimentally in the DCB test without the fitting, however the idea of this work is to adopt in the FE model a single set of material interface properties applicable to any values of the mode-mixity. Despite these aspects, it is evident that the introduction of the R-curve effect in the numerical model significantly affects the force-displacement curve, resulting in a constant load behavior similar to the one observed in the experimental tests.
The force-displacement curves for the specimens with 0°/0° and 45°/−45° interface obtained from the MMB 20% analysis are reported in Figure 30 and Figure 31, respectively. The FE model of the MMB specimen adopted in the preliminary analyses is modified here to account for the weight of the lever by introducing an equivalent force and moment to the reference point.
Comparison of force-displacement curves of MMB 20% specimen with 0°/0° interface.
Comparison of force-displacement curves of MMB 20% specimen with 45°/−45° interface.
In Figure 30, the stiffness predicted by the numerical models matches the one obtained experimentally, while the load at damage onset and propagation is slightly underestimated. The onset point is expected not to coincide with the numerical solution since the numerical model does not take into account the artificially initial high fracture toughness due to the absence of pre-cracking. In the propagation region, the underestimation of the load predicted by the numerical solutions is due to the fitting obtained with the B-K criterion as it can be observed in Figure 26. The analytical solution perfectly overlaps the numerical solution without taking into account the R-curve effect. As expected, also in this case, the introduction of the R-curve does not have a great impact in the numerical solution, however the curve tends to better approximate the experimental data.
The load-displacement curves for the specimen with 45°/−45° interface shows an excellent agreement between the numerical solution obtained taking into account the R-curve effect and the experimental data in terms of stiffness, peak load and propagation. Considering the increase in the fracture toughness with the delamination length observed in the experimental tests, the FE solution obtained using only the initial value of the fracture toughness overlaps with the analytical solution but strongly underestimates the load after the propagation onset.
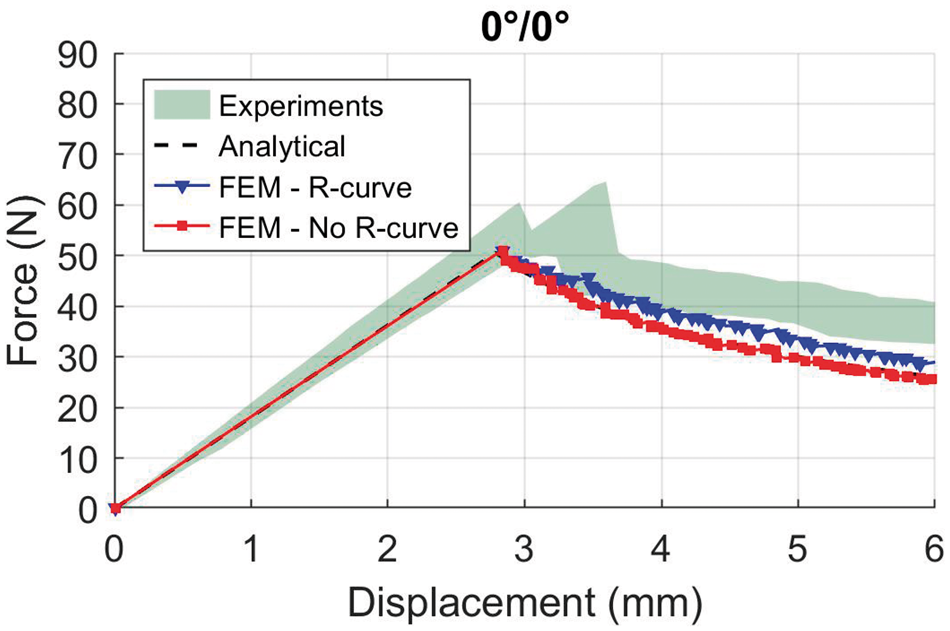
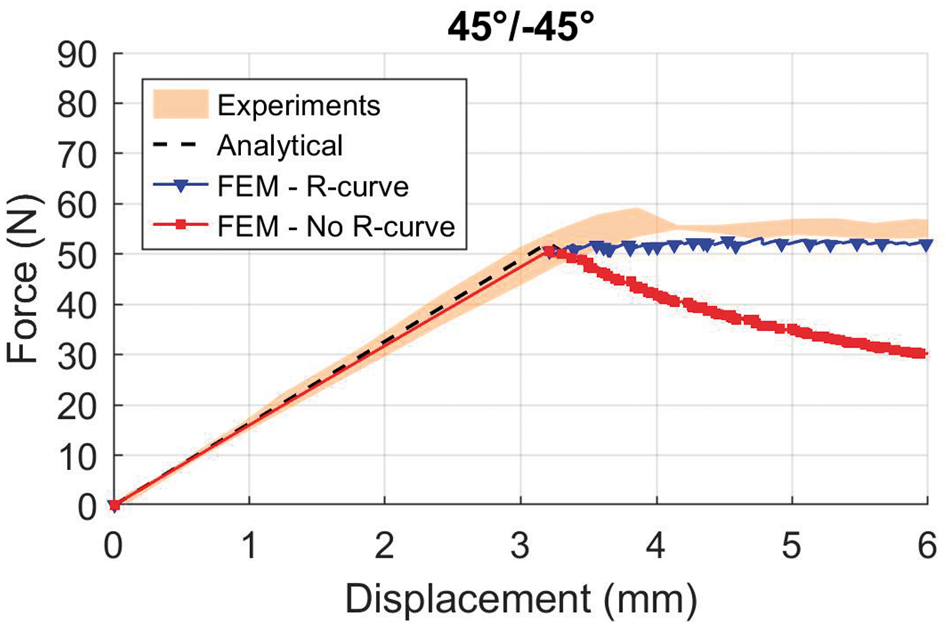
The force-displacement curves for the specimens with 0°/0° and 45°/−45° interface obtained from the MMB 50% analysis are reported in Figure 32 and Figure 33, respectively.
Comparison of force-displacement curves of MMB 50% specimen with 0°/0° interface.
Comparison of force-displacement curves of MMB 50% specimen with 45°/−45° interface.
In Figure 32, due to the almost lack of R-curve effect in the experimental tests of the unidirectional specimens, both the numerical curves and the analytical solution well agree with the experimental load-displacement curves. A slightly underestimation of the peak load can be observed because of the absence of pre-cracking before the experimental tests. Once again, the load-displacement curves for the specimens with 45°/−45° interface reported in Figure 33 show that only by numerically modelling the R-curve it is possible to achieve the almost constant load observed in the experiments after the onset of the delamination.
The comparisons of numerical results with the experimental data have demonstrated the capabilities of the proposed simplified numerical procedure to take into account the R-curve in the analysis of delamination propagation.
Even if the predictive capabilities of the proposed numerical approach have not been demonstrated in this paper, the proposed methodology has the potential to be applied to more complex structures. The idea is to use this approach to model a specimen at the component level with the same material, stacking sequence and position of delamination through the thickness. This would allow to numerically simulate the propagation of the delamination with a low computational cost.
Conclusions
An experimental investigation on the effect of interface plies orientation on the fracture toughness and R-curve effect has been carried out. Two different DCB and MMB specimen configurations have been analyzed: one with all unidirectional plies oriented along the 0° direction, while the other with all 0° plies except for the plies at the interface oriented at 45°/−45°. Preliminary FE analysis have been performed to estimate the load and displacement expected during the experimental tests. A modified version of the Corrected Beam Theory (CBT) has been considered to calculate the analytical solution and validate the numerical model. The specimens have been tested in DCB and MMB for mode-mixites of 20% and 50%, and the variations of the fracture toughness with the delamination length have been measured. The results have demonstrated an increase of the fracture toughness during the propagation for the specimens with different oriented plies up to 520%, 119% and 103% for mode mixtures 0%, 20% and 50%, respectively, due to the fiber bridging and delamination migrating to adjacent plies.
A numerical procedure has been developed to include the measured R-curves inside the standard VCCT approach by assigning a different value of the fracture toughness to the nodes according to their position respect to the initial delamination front. The numerical analyses have been able to predict the increased load carrying capability of the specimens with 45°/−45° orientation at the interface respect to the unidirectional coupons after the delamination onset. However, the lack of experimental data for pure mode II both in terms of fracture toughness and R-curve resulted in a not precise interpolation of the fracture toughness with the mode-mixities. Clearly, for a more comprehensive study, the experimental results of ENF for delamination propagation in pure mode II are needed. Furthermore, the number of specimens tested for each configuration and type of test should be increased to ensure the statistical validity of the experimental results and the effect of the overall specimen lay-up needs to be considered. Despite these limitations, the experimental and numerical results obtained in this paper emphasize the need to account for the effect of the lay-up and delamination growth length on the fracture toughness in conducting delamination propagation analysis in composite structures.
Footnotes
Acknowledgments
The authors would like to thank Dr. Carlos Dávila from NASA Langley Research Center for his invaluable suggestions. The views and conclusions contained herein are those of the authors only and should not be interpreted as representing those of ONR, the U.S. Navy or the U.S. Government.
Declaration of Conflicting Interests
The author(s) declared no potential conflicts of interest with respect to the research, authorship, and/or publication of this article.
Funding
The author(s) disclosed receipt of the following financial support for the research, authorship, and/or publication of this article: The first author has received funding from the European Union’s Horizon 2020 research and innovation programme under the Marie Skłodowska-Curie grant agreement No 707404. This work is partially sponsored by the Office of Naval Research (ONR), under grant award number N62909-17-1-2129.