
Abstract
In continuous fiber-reinforced thermoplastics, the macroscopic failure mode in transverse long-term failure is dominated by a brittle crack-growth mechanism. Neat thermoplastic matrices, on the other hand, generally display also a plasticity-controlled mechanism in long-term loading at elevated stress levels and/or temperature. This failure mechanism requires a different approach to lifetime prediction than crack growth; hence, it is important to identify it in the long-term performance of composites.
In this study, we demonstrate the presence of the plasticity-controlled failure mechanism in long-term failure of transversely loaded unidirectional (UD) thermoplastic composites made of glass/iPP, carbon/PEEK and carbon/PEKK. The main method used is to compare the lifetime in cyclic loading to that in static loading at the same level of maximum stress, where an increase in lifetime is characteristic for plasticity controlled failure, and, vice versa, a decrease is indicative for fatigue crack growth. In addition, the applicability of a lifetime prediction method common to plasticity-controlled failure of neat thermoplastics is evaluated for the composites investigated.
The results of this study indicate that the plasticity-controlled failure was present in composites, although the extent to which the effects are present varied depending on the materials investigated. Glass/iPP showed the most explicit evidence of the plasticity-controlled failure over the entire load range experimentally covered. Its long-term failure was delayed with a decrease in the stress ratio and lifetime was predicted well using the principles of plasticity-controlled failure.
Introduction
Thermoplastic composites are often used in engineering applications where they need to satisfy long lifetime requirements under creep and fatigue loading. Typical lifespans for current or potential applications might range from 15–20 years in the automotive industry to 20–25 years for aircraft and wind turbines.1,2 Since real-time testing for such long durations is time-consuming and impractical, the need for lifetime prediction models making use of accelerated testing methodologies is vital.
For composites under off-axis creep loading, where the failure is matrix-dominated, the time-dependent failure clearly finds its origin in the time-dependent nature of the polymer matrix. Consequently, lifetime prediction methods can be used that are based on time-temperature superposition, time-stress superposition, and rate theory, where temperature and/or stress are used to accelerate the failure.3–5 In long-term cyclic loading, the estimation of the lifetime of composite laminates is a little more challenging. Lifetime predictions are commonly based on S-N curves of UD-laminates in several loading angles, which serve as an input to predict multiaxial fatigue failure, as proposed by Hashin and Rotem. 6 In general, however, S-N curves show a strong dependence on the stress ratio R, and the performance needs to be assessed at several stress ratios. At this point, Constant Life Diagrams (CLD) serve as a practical means to predict fatigue lifetime.7–9 Using CLDs, fatigue performance at one stress ratio can be predicted by interpolation/extrapolation of data obtained at other stress ratios. Consequently, accurate identification of the fatigue lifetime at a specific R-value will have a significant effect on lifetime prediction at other values.
One way to specify a cyclic, sinusoidal load is by using the maximum stress
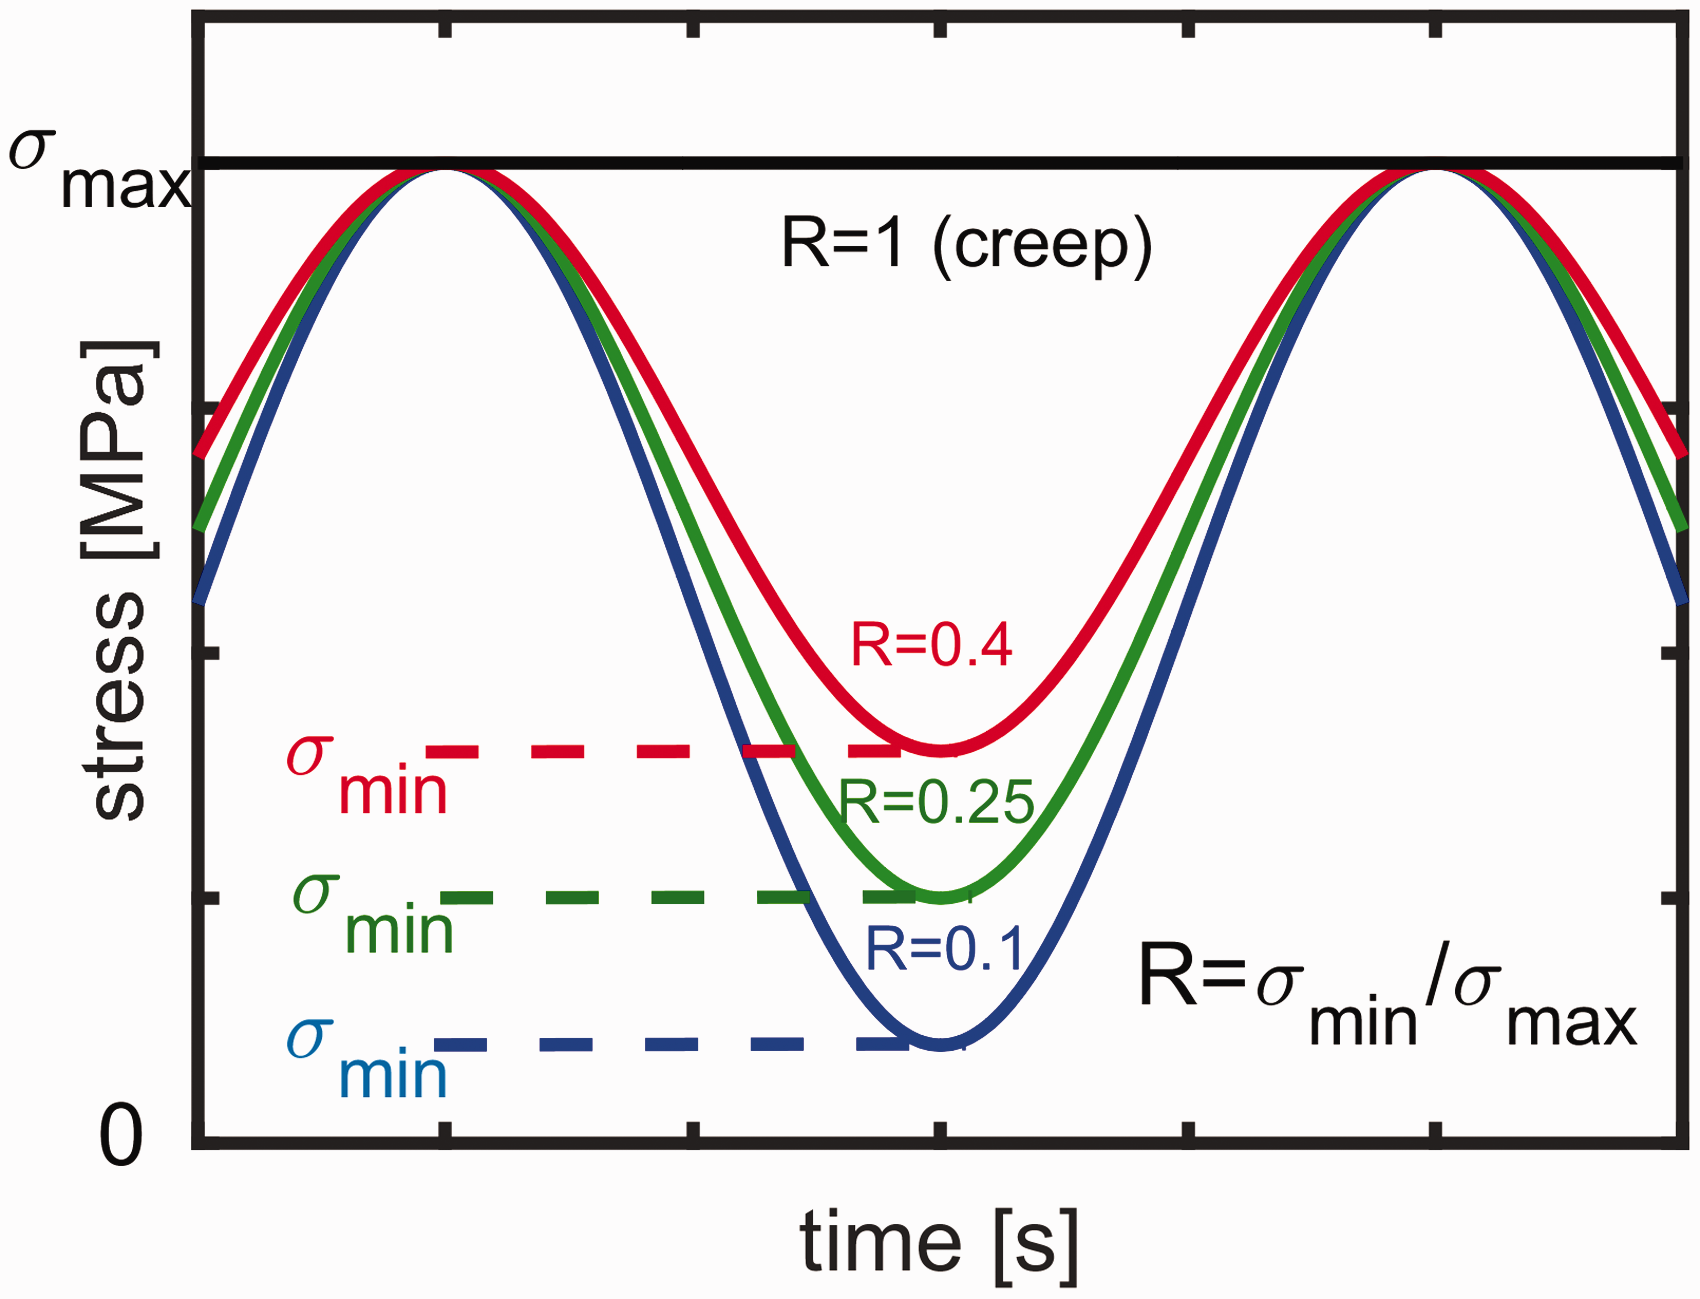
Stress vs. time for various stress ratios (R).
Remarkably, however, the “typical response” is not always observed. While some woven and transversely loaded UD epoxy composites display the typical response at temperatures far below the glass transition temperature (Tg), the trend changes at temperatures close to Tg.21,22 This phenomenon is shown in Figure 2, comparing the responses in cyclic (R = 0.05) and static loading (R = 1) for a transversely loaded UD laminate. 21 At low temperature, lifetime clearly decreases with decreasing stress ratio, whereas at high temperature the opposite trend is observed. Such an “atypical” response was seen in carbon/PEEK composites not only around Tg 22 but also at low temperatures far below Tg 15 under transverse loading. In this study, 15 cyclic loading with high R values led to longer lifetimes compared to creep loading. In all cases, the “atypical” response was assigned to a failure mechanism controlled by the mean stress. 21
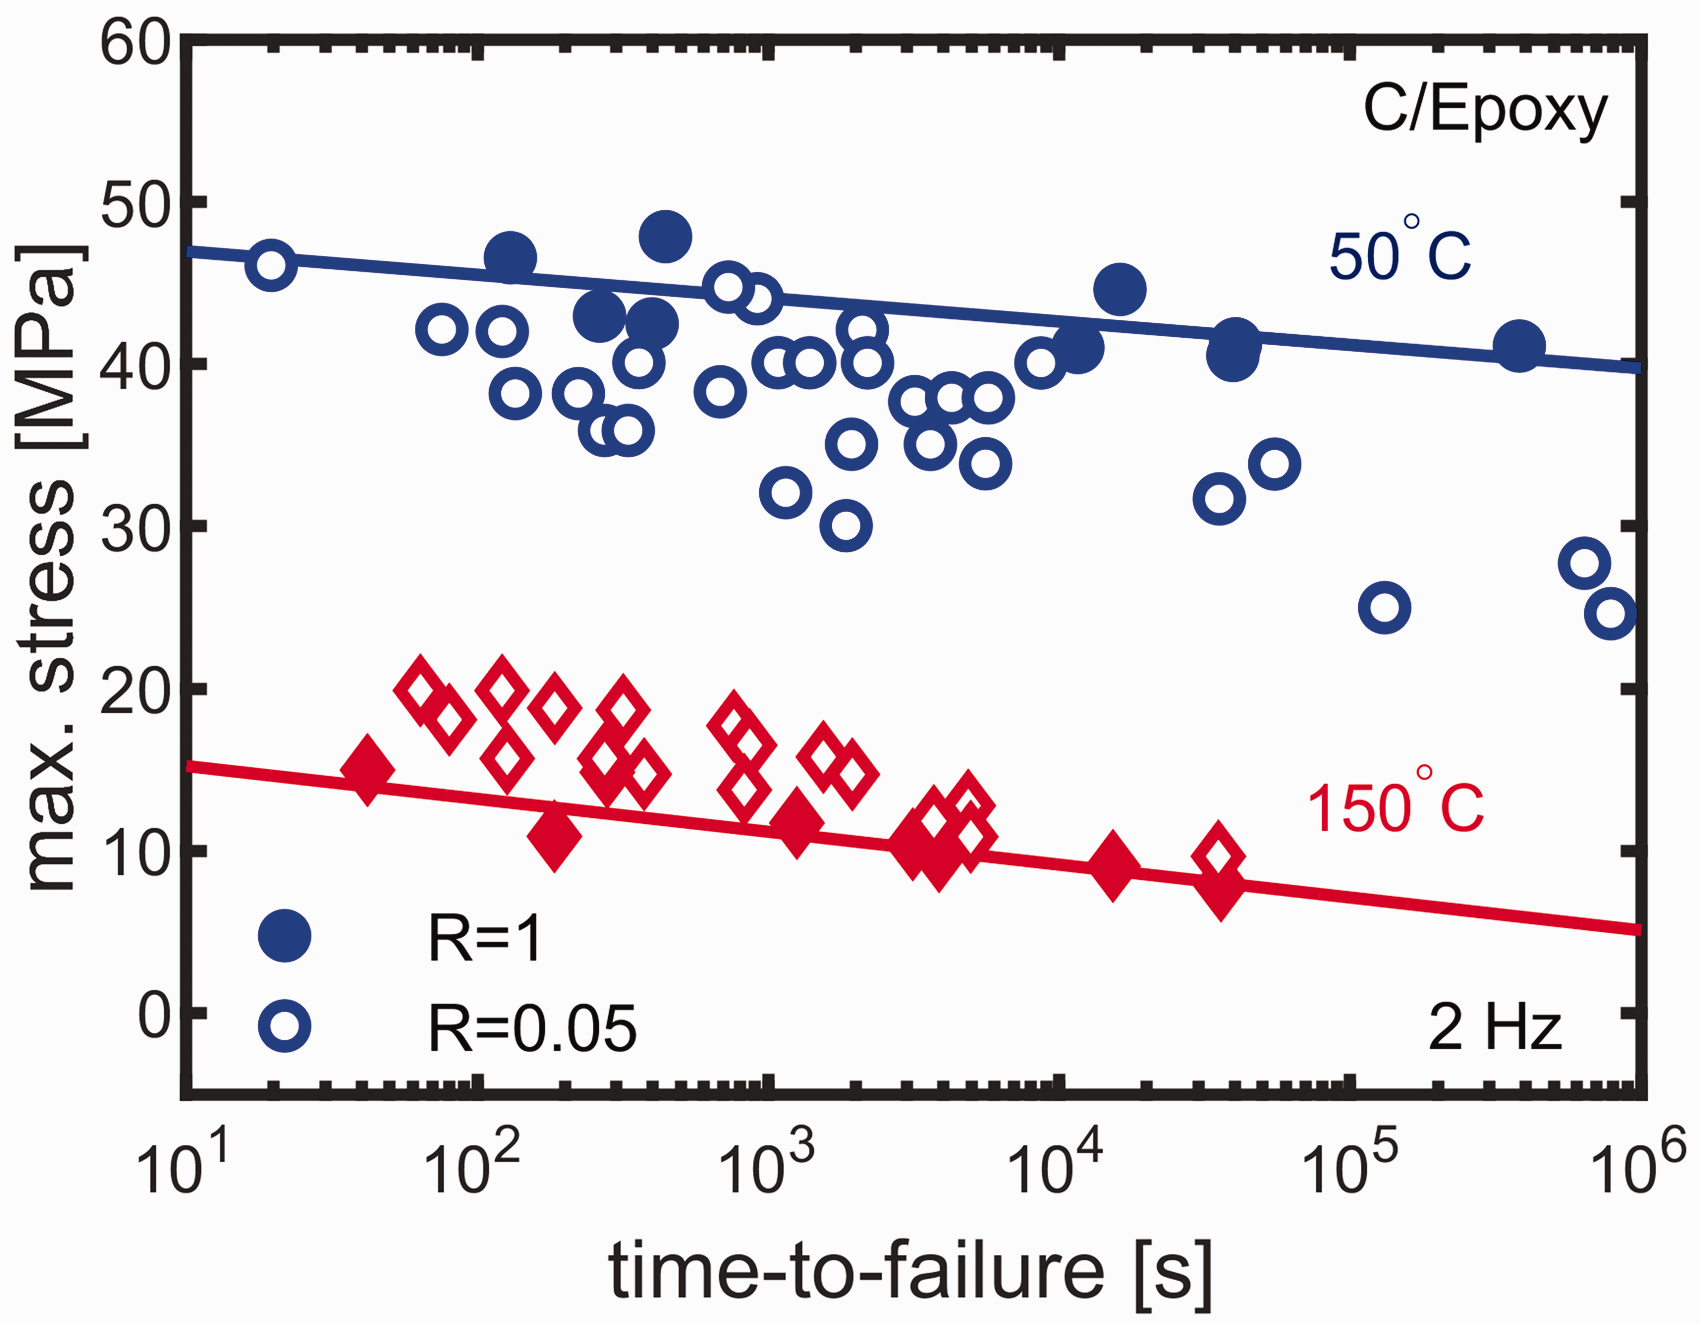
Maximum stress vs. time curves for transversely loaded UD carbon/Epoxy composite below and near the glass-transition temperature. Closed and open markers represent creep and fatigue data, respectively. Lines are the least square fit to creep (R = 1) experimental data. Reproduced from Miyano et al. 21
Although the observed behavior may be “atypical” for composites, it is quite common in neat thermoplastic polymers,23–25 as well as in short-fiber reinforced thermoplastic composites,24,26 synthetic fibers and ropes.27–30
Since the time-dependent behavior of the matrix has a significant influence on that of composites, we believe that a discussion on the long-term behavior of thermoplastics will be helpful in understanding the origin of the “atypical response” observed in some composites.
The long-term behavior of thermoplastic polymers is governed by two major failure mechanisms that act simultaneously;24,31,32 (i) plasticity-controlled failure, which dominates at high stress levels, (ii) slow crack growth, which manifests itself at lower stress levels. In some cases, there is also a third mechanism, degradation-controlled failure, which is typically stress-independent and controls the lifetime at extremely low stress levels.31,32 Since we will be focusing on the stress-dependence of failure, degradation will be excluded for now.
Since both failure mechanisms, plasticity and crack growth, typically possess quite different kinetics, the transition between the two is generally visible as a change in the slope of the stress-dependence of the lifetime, as shown in Figure 3(b) for neat and short fiber-reinforced thermoplastics. But that is not the only distinction between the two; there is also a marked difference in their response upon a variation in the stress ratio at a constant value of the maximum stress. In the crack-growth-controlled regime, the lifetime is dominated by the steady growth of the cracks that initiate at imperfections in the material. Failure takes place when the crack reaches a critical length, dictated either by geometry (e.g. wall thickness) or the critical stress intensity factor, and becomes unstable. In this regime, cyclic loading induces an accelerated crack propagation rate, resulting in a marked decrease of the lifetime compared to creep loading; the “typical response” as observed in composites. The accelerated growth in cyclic loading can be explained by damage accumulation in the fibrils of the craze at the crack-tip, as a result of bending or even crushing of fibrils, formed in the craze at the crack-tip, during the unloading phase of a cycle (crack closure). 33
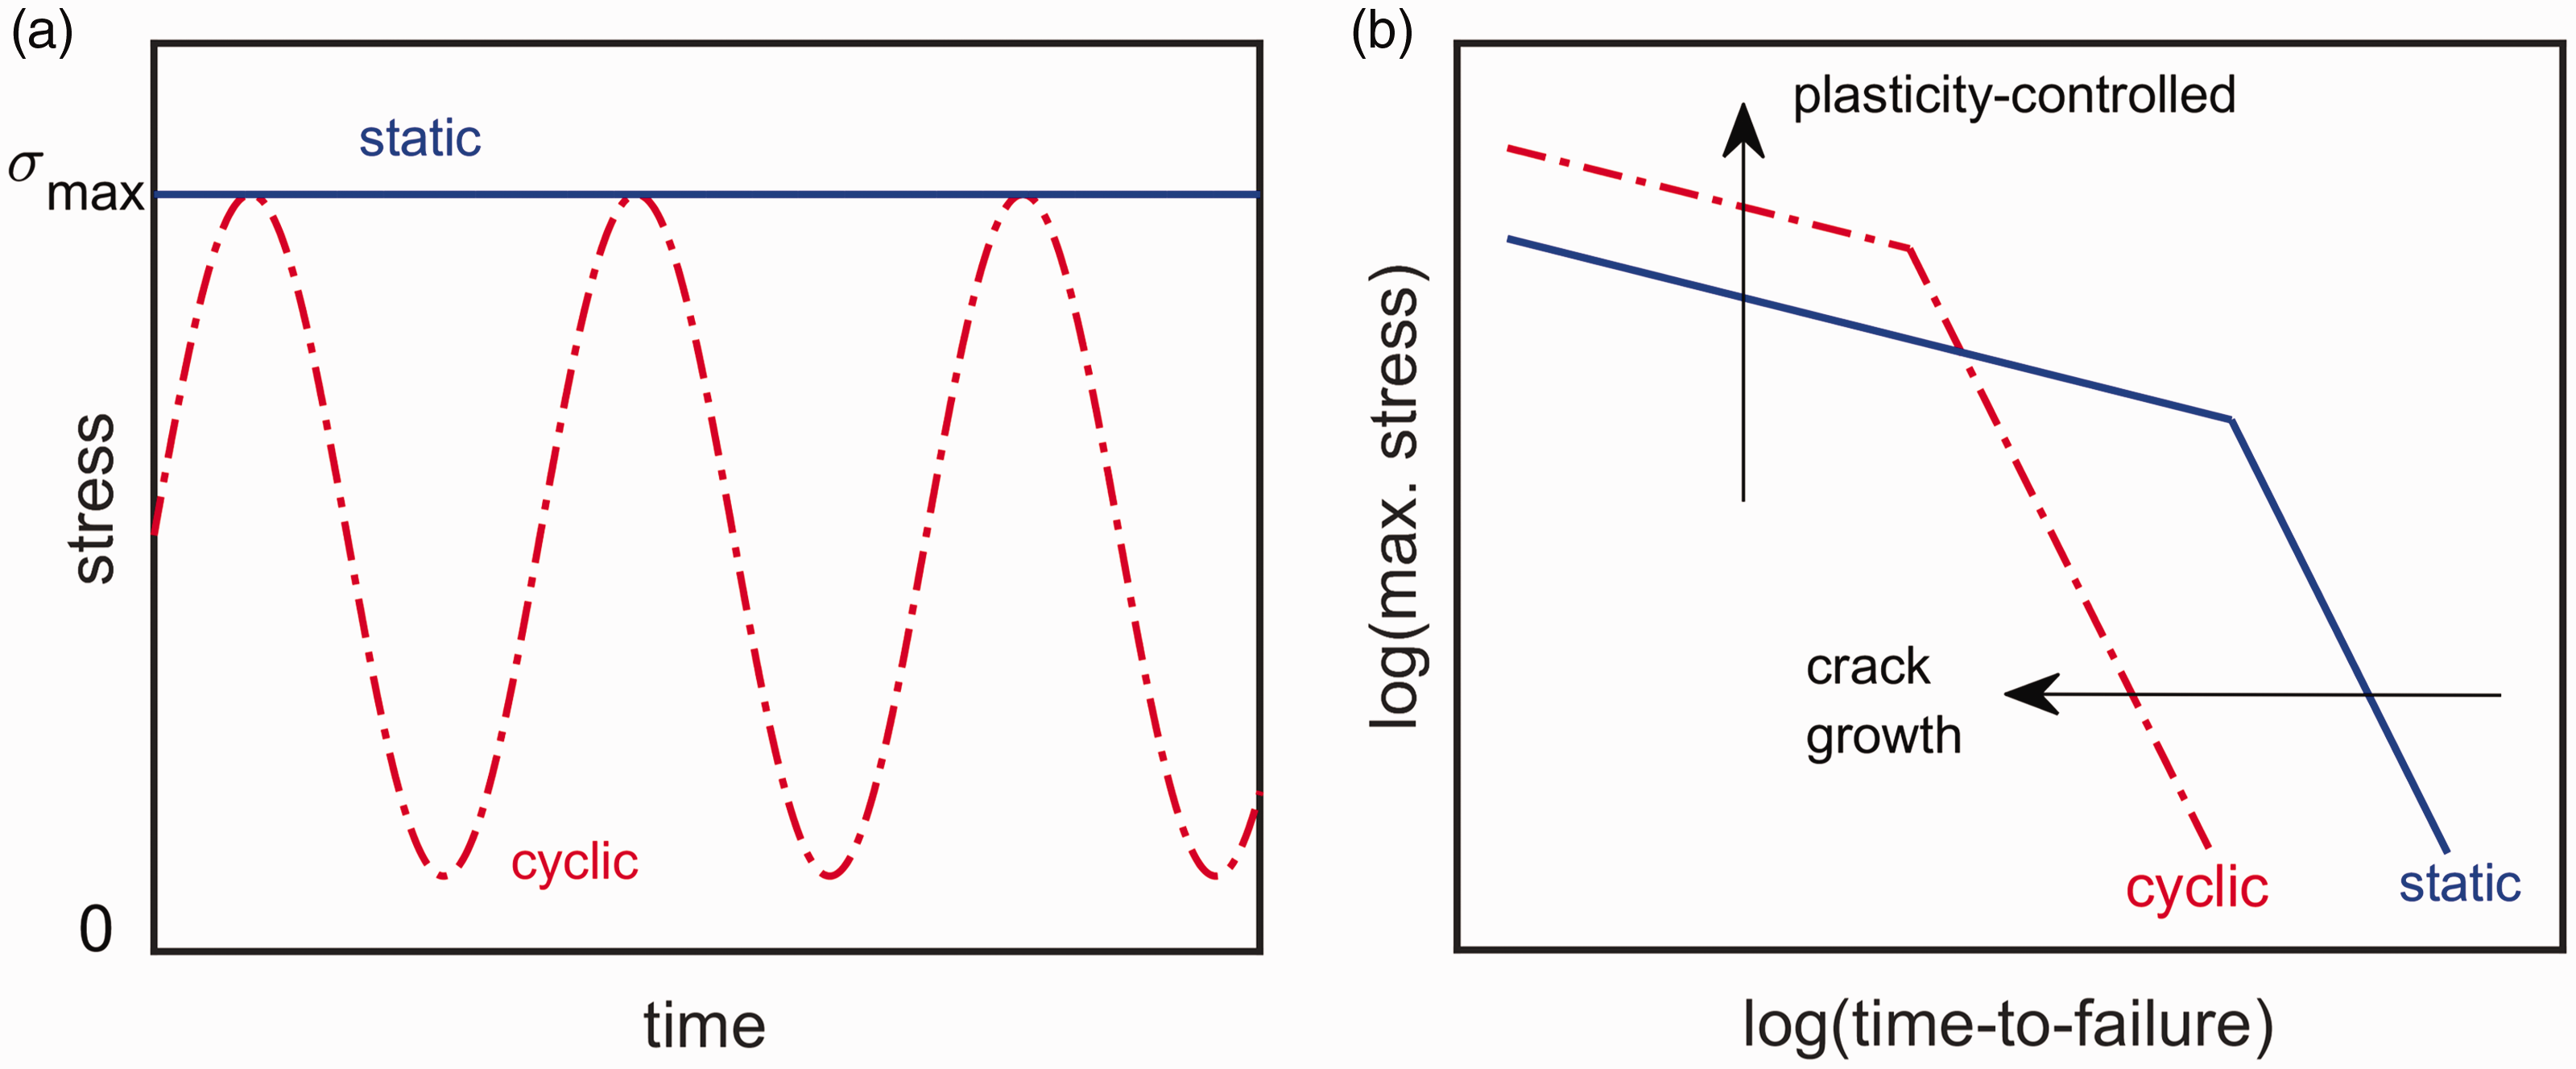
Schematic illustration of (a) static and cyclic load vs. time and (b) plasticity- and crack growth-controlled regimes under these loads typical for neat and short fiber-reinforced thermoplastics. Figures are drawn based on the findings in Kanters et al. 24
In plasticity-controlled failure, applied stress causes plastic flow that leads to a gradual accumulation of plastic strain. When the level of accumulated plastic strain exceeds a critical level, strain localization is triggered and failure occurs. In cyclic loading, at the same maximum stress, the average stress level is lower than in creep loading, resulting in a slower accumulation of plastic strain, and, hence, an increase in lifetime; 24 the “atypical response”. Consequently, the response in the plasticity-controlled regime is opposite to that observed in the crack-growth regime. This is illustrated in Figure 3, where the stress dependence of the lifetime is presented for two load cases: static and cyclic loading. In both cases, we observe both failure mechanisms; the transition between them visible by the change in slope over the two regimes. Upon cyclic loading, at the same maximum stress, the lifetime is observed to increase in the plasticity controlled regime, and decrease in the crack growth regime. 26 This marked difference in the response of both failure mechanisms makes the comparison of lifetime in static and in cyclic loading, at the same level of the maximum stress, an effective method to identify the underlying failure mechanism. Identification of the failure mechanisms is important since lifetime prediction methods are based on different principles for each failure mechanism.23,24,26,34–36 Proper identification also aids in proposing the right steps to improve the lifetime of the material, since a method that improves performance in one failure regime, may be detrimental for the other regime.23,37 Well-known examples are the effect of annealing, which improves the performance in the plasticity-controlled regime, but is ineffective/detrimental for crack growth;23,37–39 and the effect of an increase in molecular weight, which strongly favors crack growth,40,41 but is ineffective in the plasticity regime.
Although the aforementioned plasticity-controlled failure mechanism was revealed to be present in the long-term behavior of short fiber-reinforced composites,24,26 its role in that of continuous fiber-reinforced composites has not yet been studied. Hence, the aim of this study is to investigate if the plasticity-controlled failure mechanism, which we think might be linked to the aforementioned “atypical response”, plays a role also in the long-term behavior of thermoplastic composites. Since this matrix-related phenomenon is expected to be critical especially in the transverse direction, transversely loaded UD laminates will be used for the investigation.
One might argue that transversely loaded UD laminates are not used in practice and their failure mechanisms are different than those observed in multidirectional laminates. This is correct; however, it is very straightforward to study matrix-dominated failure kinetics in UD laminates since failure takes place by the evolution of a single crack spanning the cross-section. In cross-ply laminates, multiple cracks initiate in the transverse layers, which grow, increase in number and eventually initiate other types of damage such as delamination, leading to ultimate failure.42–44 This makes it more complex to observe matrix-dominated failure kinetics by studying cross-ply laminates. Besides, since the time-dependent failure of transverse layers affects the lifetime of the whole laminate,42–44 studying the failure kinetics of the transversely loaded UD laminates gives a valuable insight into the long-term behavior of multi-directional laminates.
In the scope of this research, the creep responses of various transversely loaded UD composites, glass/iPP, carbon/PEEK and carbon/PEKK, are determined at room temperature. Cyclic loading, which has different effects on the lifetime in the plasticity- and crack-growth-controlled failure regimes, is applied to identify the dominant failure mechanism. To investigate the extent to which the principles of plasticity-controlled failure apply, a lifetime prediction method based on the plasticity-controlled failure of thermoplastics is employed.24,34
It should be noted that the long-term performance of composites may be affected by the microstructure of the semi-crystalline matrix,45,46 which itself depends on the processing conditions. 47 Hence, for each material studied, the long-term behavior reported in this paper should be considered as a consequence of a certain microstructure.
In the remaining part of this paper, the next section elaborates on the plasticity- and crack-growth-controlled long-term failure mechanisms of thermoplastic polymers and their lifetime prediction methods. Furthermore, the effect of stress ratio and frequency on the lifetime in each failure mechanism will be discussed here, which will help to identify the dominant failure mechanism. Then, the experimental methodology will be introduced. The penultimate section includes both the results and a discussion of how plasticity-controlled failure manifests itself in the materials studied. The final section concludes the study.
Background
In this section, plasticity- and crack-growth-controlled failure mechanisms of thermoplastic polymers and their lifetime prediction methods will be introduced.
Plasticity-controlled failure
Plastic deformation in polymers is related to stress-induced chain mobility; the application of stress induces an enhanced state of main-chain segmental mobility, which induces a continuous and dynamic change of chain conformation, resulting in plastic flow. 48
In a creep test under constant load, three stages of deformation are present, which are named as the primary, secondary, and tertiary creep. Primary creep is the viscoelastic region where strain rate decreases with time and strain. During secondary creep, the strain rate reaches a constant steady rate of plastic flow, which subsequently gradually accelerates (tertiary creep), eventually leading to strain localization and failure.
In the secondary creep stage, the polymer behaves as a fluid; it deforms at a constant (plastic) flow rate under a constant stress. Another situation where such a steady flow is observed is at the yield point in a tensile test, where there is a small region where stress is constant under a constant rate of strain. Bauwens-Crowet et al. 49 were the first to demonstrate that the state of deformation in both conditions is equivalent. Their results are summarized in Figure 4, which shows that the stress-dependence of the flow rate during secondary creep follows the same trend as the strain rate dependence of the yield stress observed in tensile tests. It is clear that the flow kinetics are equivalent for both load cases. This equivalency implies that the stress-dependence of the flow rate during secondary creep can be estimated from tensile tests at different strain rates.
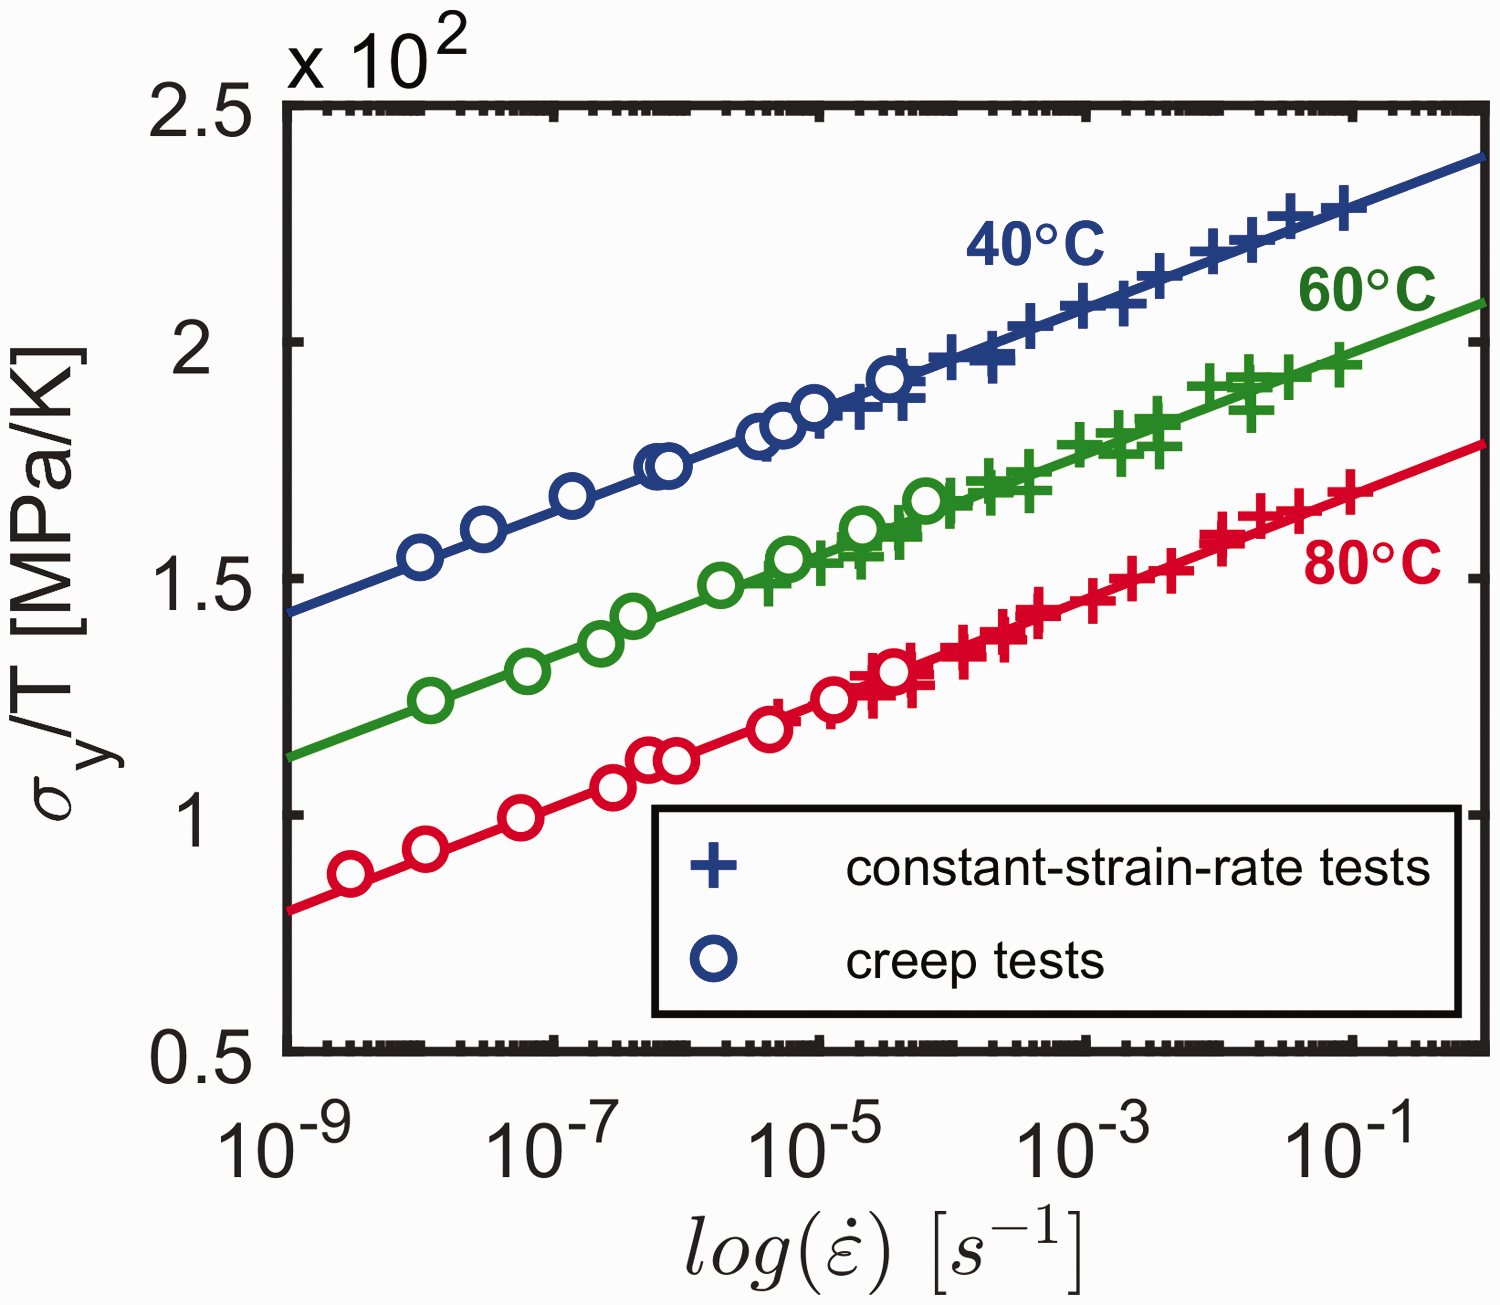
Ratio of the engineering yield stress to temperature vs logarithm of the strain-rate at yield in creep and constant-strain-rate tests. Reproduced from Bauwens-Crowet et al. 49
The flow or deformation kinetics of polymers can be described by Eyring’s activated flow theory,
50
where, in the case of uniaxial loading, the relationship between the plastic flow rate

Equation (1) accounts for multiple factors that affect the development of the plastic flow rate. The rate factor
Under isothermal conditions, the terms
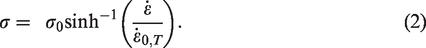
For
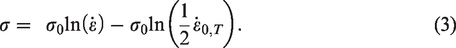
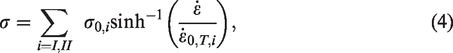
In some cases, the polymer’s yield response contains contributions of two processes,51–53 and the yield stress can be described by:
The rate expression mentioned above can be used effectively to estimate the resulting plastic flow rate for arbitrary values of the applied stress and temperature. To extend this to an effective lifetime prediction, we make use of an experimental observation. For many neat and short fiber-reinforced thermoplastics it was demonstrated that the product of the plastic flow rate (

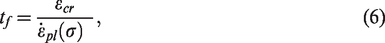
For situations where the stress varies in time, equation (6) is no longer applicable and the accumulation of plastic strain has to be monitored over time. In the case of cyclic loading, the plastic strain accumulated in a single cycle is:

Lifetime under cyclic loading is calculated from the number of cycles required to attain the critical strain:

Considering the effect of the frequency, it was demonstrated by Janssen et al. 35 and Visser et al. 23 that time-to-failure under cyclic loading is frequency-independent in the plasticity-controlled failure regime. Hence, both creep and cyclic failure in this regime depend on time rather than the number of cycles. This trend can be explained by an equal level of accumulated plastic strain at different frequencies in a certain time period, which can be calculated using equation (7). Janssen et al. 35 mentioned also that the frequency effects can be observed at high frequencies and stress amplitudes, which may favor self-heating.
Crack-growth controlled failure
For neat polymers, this failure mechanism takes place at relatively lower loads compared to the plasticity-controlled failure and is dominated by the slow growth of individual cracks. Cracks may either form during service due to loads at locations of stress concentration such as internal defects59,60 or pre-exist due to processing and/or handling of the product. Especially for fiber-filled systems, cracks can be assumed to already exist in the material. After the crack has formed, it will grow slowly and steadily until it reaches a critical length, dictated either by geometry or the critical stress intensity factor, leading to unstable growth and, eventually, to final fracture. According to Linear Elastic Fracture Mechanics, the stress intensity factor under mode I loading for materials subjected to (remote) applied stress

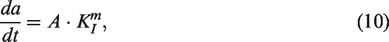
For creep loading, the gradual growth of the crack can be estimated using Paris’ Law
61
which relates the crack propagation rate
It should be noted that even though the total lifetime is dominated by crack growth, both plasticity- and crack growth-controlled failure mechanisms may take place during service until the failure. After all, the formation of crazes that lead to cracks is a plasticity-controlled phenomenon. 63 However, since the lifetime is dominated by crack growth, the time for a crack to grow critical has to be substantially longer than the time to initiate a crack. 63
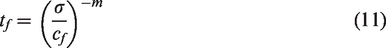
In the case of cyclic loading, the crack propagation rate at a specific maximum-stress-intensity-factor increases with the stress ratio, which decreases the lifetime (acceleration of failure).23,24,39,64 An illustrative example of this response is shown in Figure 5 where the crack propagation kinetics of a polyethylene pipe grade is presented for various values of the stress ratio
Crack propagation rate of PE versus the maximum stress intensity factor for various stress ratios R. Markers represent experimental measurements and the lines are guides-to-the-eye. Reproduced from Zhou et al. 64
To predict lifetime under cyclic loading, the crack propagation rate in equation (10) can be expressed in terms of the maximum-stress-intensity-factor
In addition to the stress ratio, the frequency can also be varied in cyclic loading. At a fixed stress ratio, an increase in the frequency was observed to result in lower
Considering the effect of frequency on lifetime of polymers, in many cases, an increase in frequency was found to lead to the same or a lower cyclic crack propagation rate (da/dN), 66 which meant that cycles-to-failure either remained constant or increased. 33 This implied that time-to-failure decreased with frequency; however, with increasing contribution of purely creep (plastic) damage, for instance, at high stresses, time-to-failure tended to be frequency-independent. 33 Relating the plastic damage with the creep of the fibrils at the crack tip and the crack growth controlled brittle damage with the bending and crushing of the fibrils, 33 a decrease in time-to-failure with increasing frequency can be explained by more bending and crushing events in a certain duration of loading. Another effect of an increase in frequency is the heating of the sample, which may have contradicting consequences on lifetime. Depending on the geometry, heating might enhance the crack propagation rate or lead to crack blunting improving the resistance to crack growth.66,67
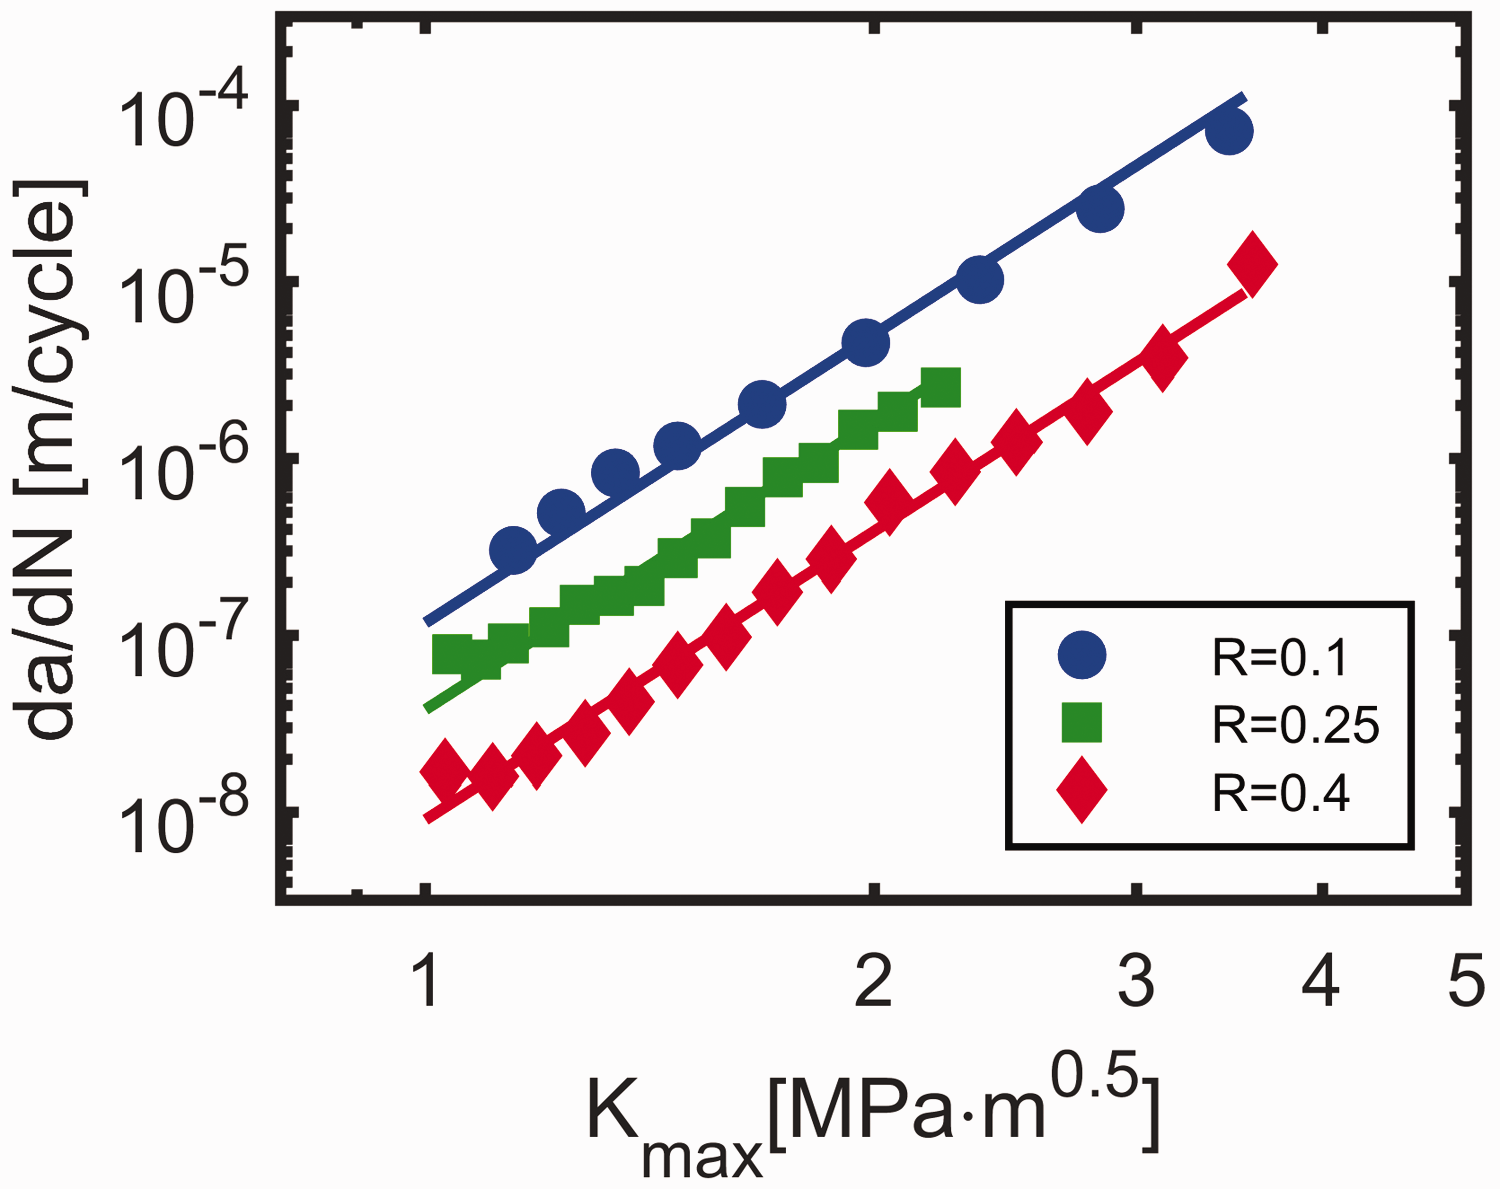
To summarize the effect of frequency and stress ratio on time-to-failure in plasticity and crack growth controlled failure regimes (in isothermal conditions), a schematic drawing is provided in Figure 6.
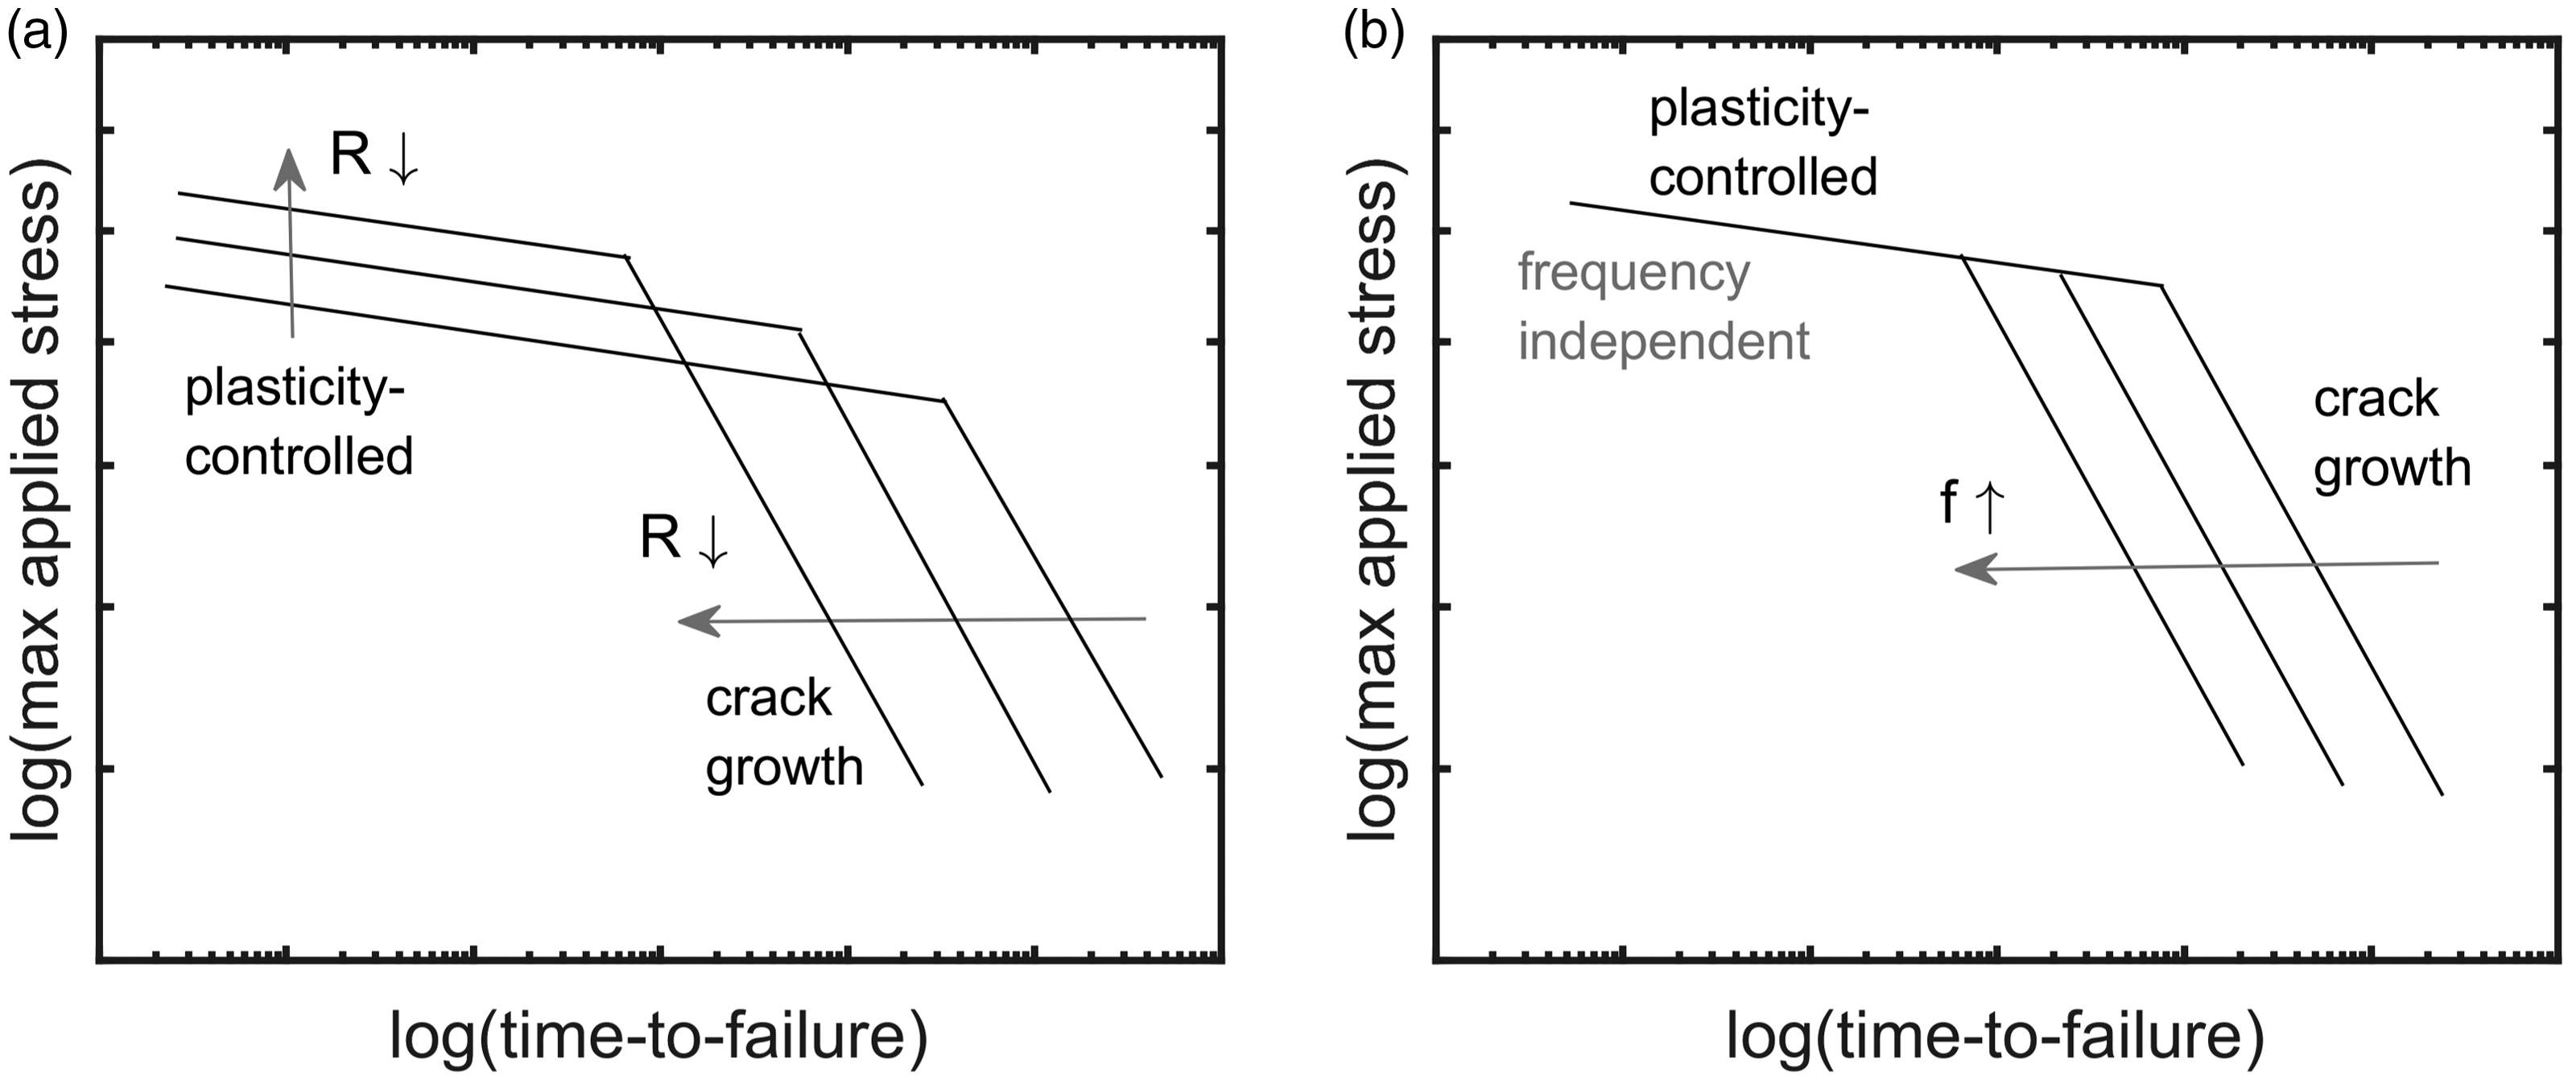
The influence of (a) stress ratio (R) and (b) frequency (f) on time-to-failure in plasticity and crack growth controlled failure regimes.
Experiments
Materials
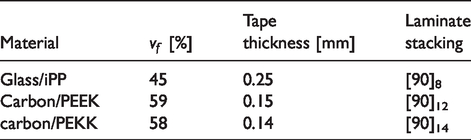
Three different materials were utilized in this study. Glass reinforced UD tape with a polypropylene matrix with a weight averaged molecular weight of
Manufacturing and sample preparation
Glass/iPP and carbon/PEEK laminates were manufactured using compression molding, while Carbon/PEKK laminates were manufactured at Fokker Aerostructures by vacuum bagging in an autoclave. The reader is referred to the datasheet of the tape 69 for the processing parameters of carbon/PEKK. The following discussion about the manufacturing of the laminates will concern only glass/iPP and carbon/PEEK laminates.
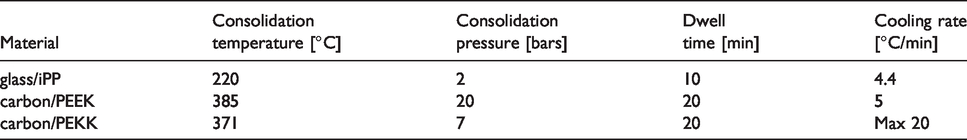
Initially, tapes are cut in required dimensions according to the size of the picture frame mold utilized. The picture frame was placed in a press and heated up to the consolidation pressure. In the meantime, a small pressure of about 1 bar was applied to ensure the contact and heat transfer between the plates of the press and the mold. Once the consolidation temperature was reached, the pressure was increased to the consolidation pressure and kept at that level until the end of the pressing cycle. Cooling started after a dwell at the consolidation pressure and temperature. Approximate cooling rates applied, which are dictated by water cooling, consolidation temperatures and pressures, and dwell times for each material are listed in Table 2.
Processing parameters of the laminates. Values for carbon/PEKK are taken from literature. 69
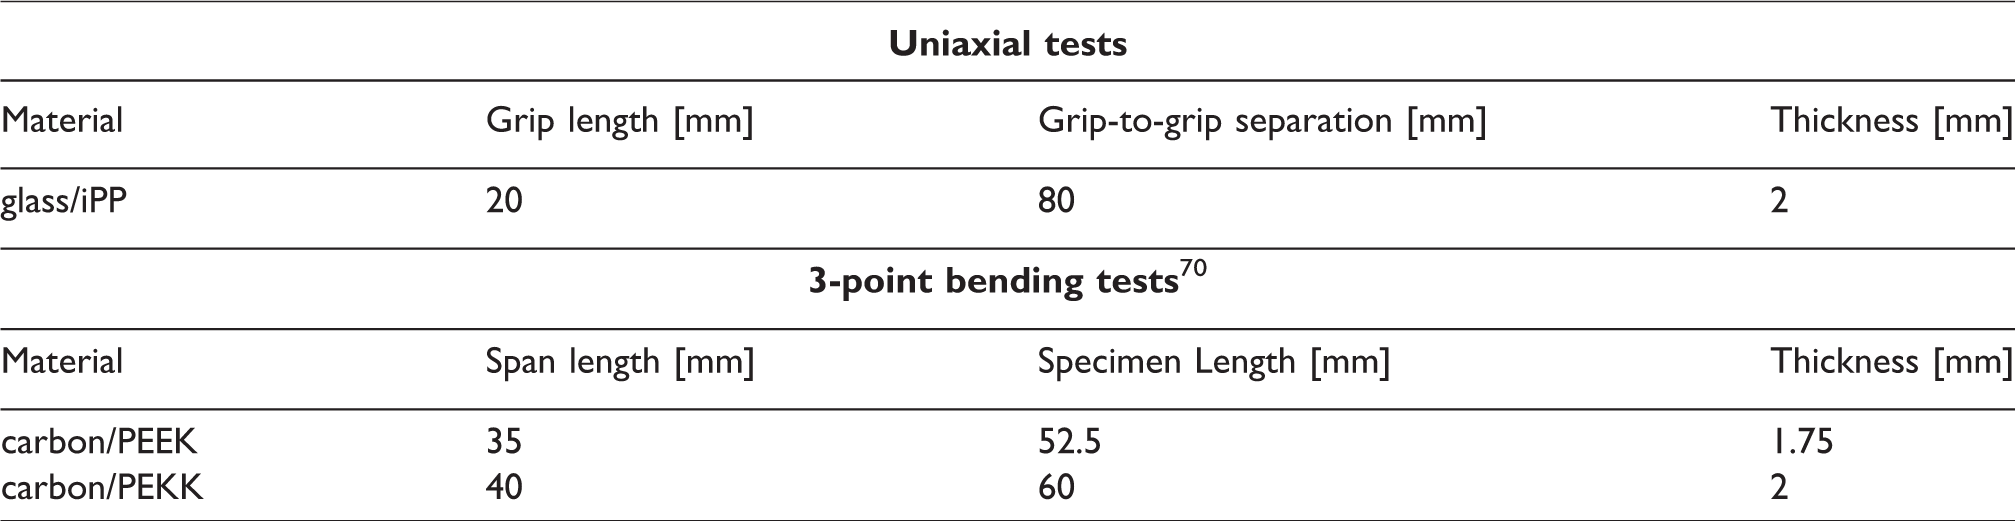
The specimens were cut from the laminates by using a diamond saw with the help of cutting water to prevent over-heating. While glass/iPP was tested in uniaxial tension, carbon/PEEK and carbon/PEKK were tested under 3-point bending due to a large number of specimens failing at or close to clamps in uniaxial testing of these material systems. For both uniaxial and 3-point bending testing, rectangular specimens were used. Dimensions of specimens are listed in Table 3, and Figure 7 shows the schematic drawing of the specimens.
Specimen dimensions.
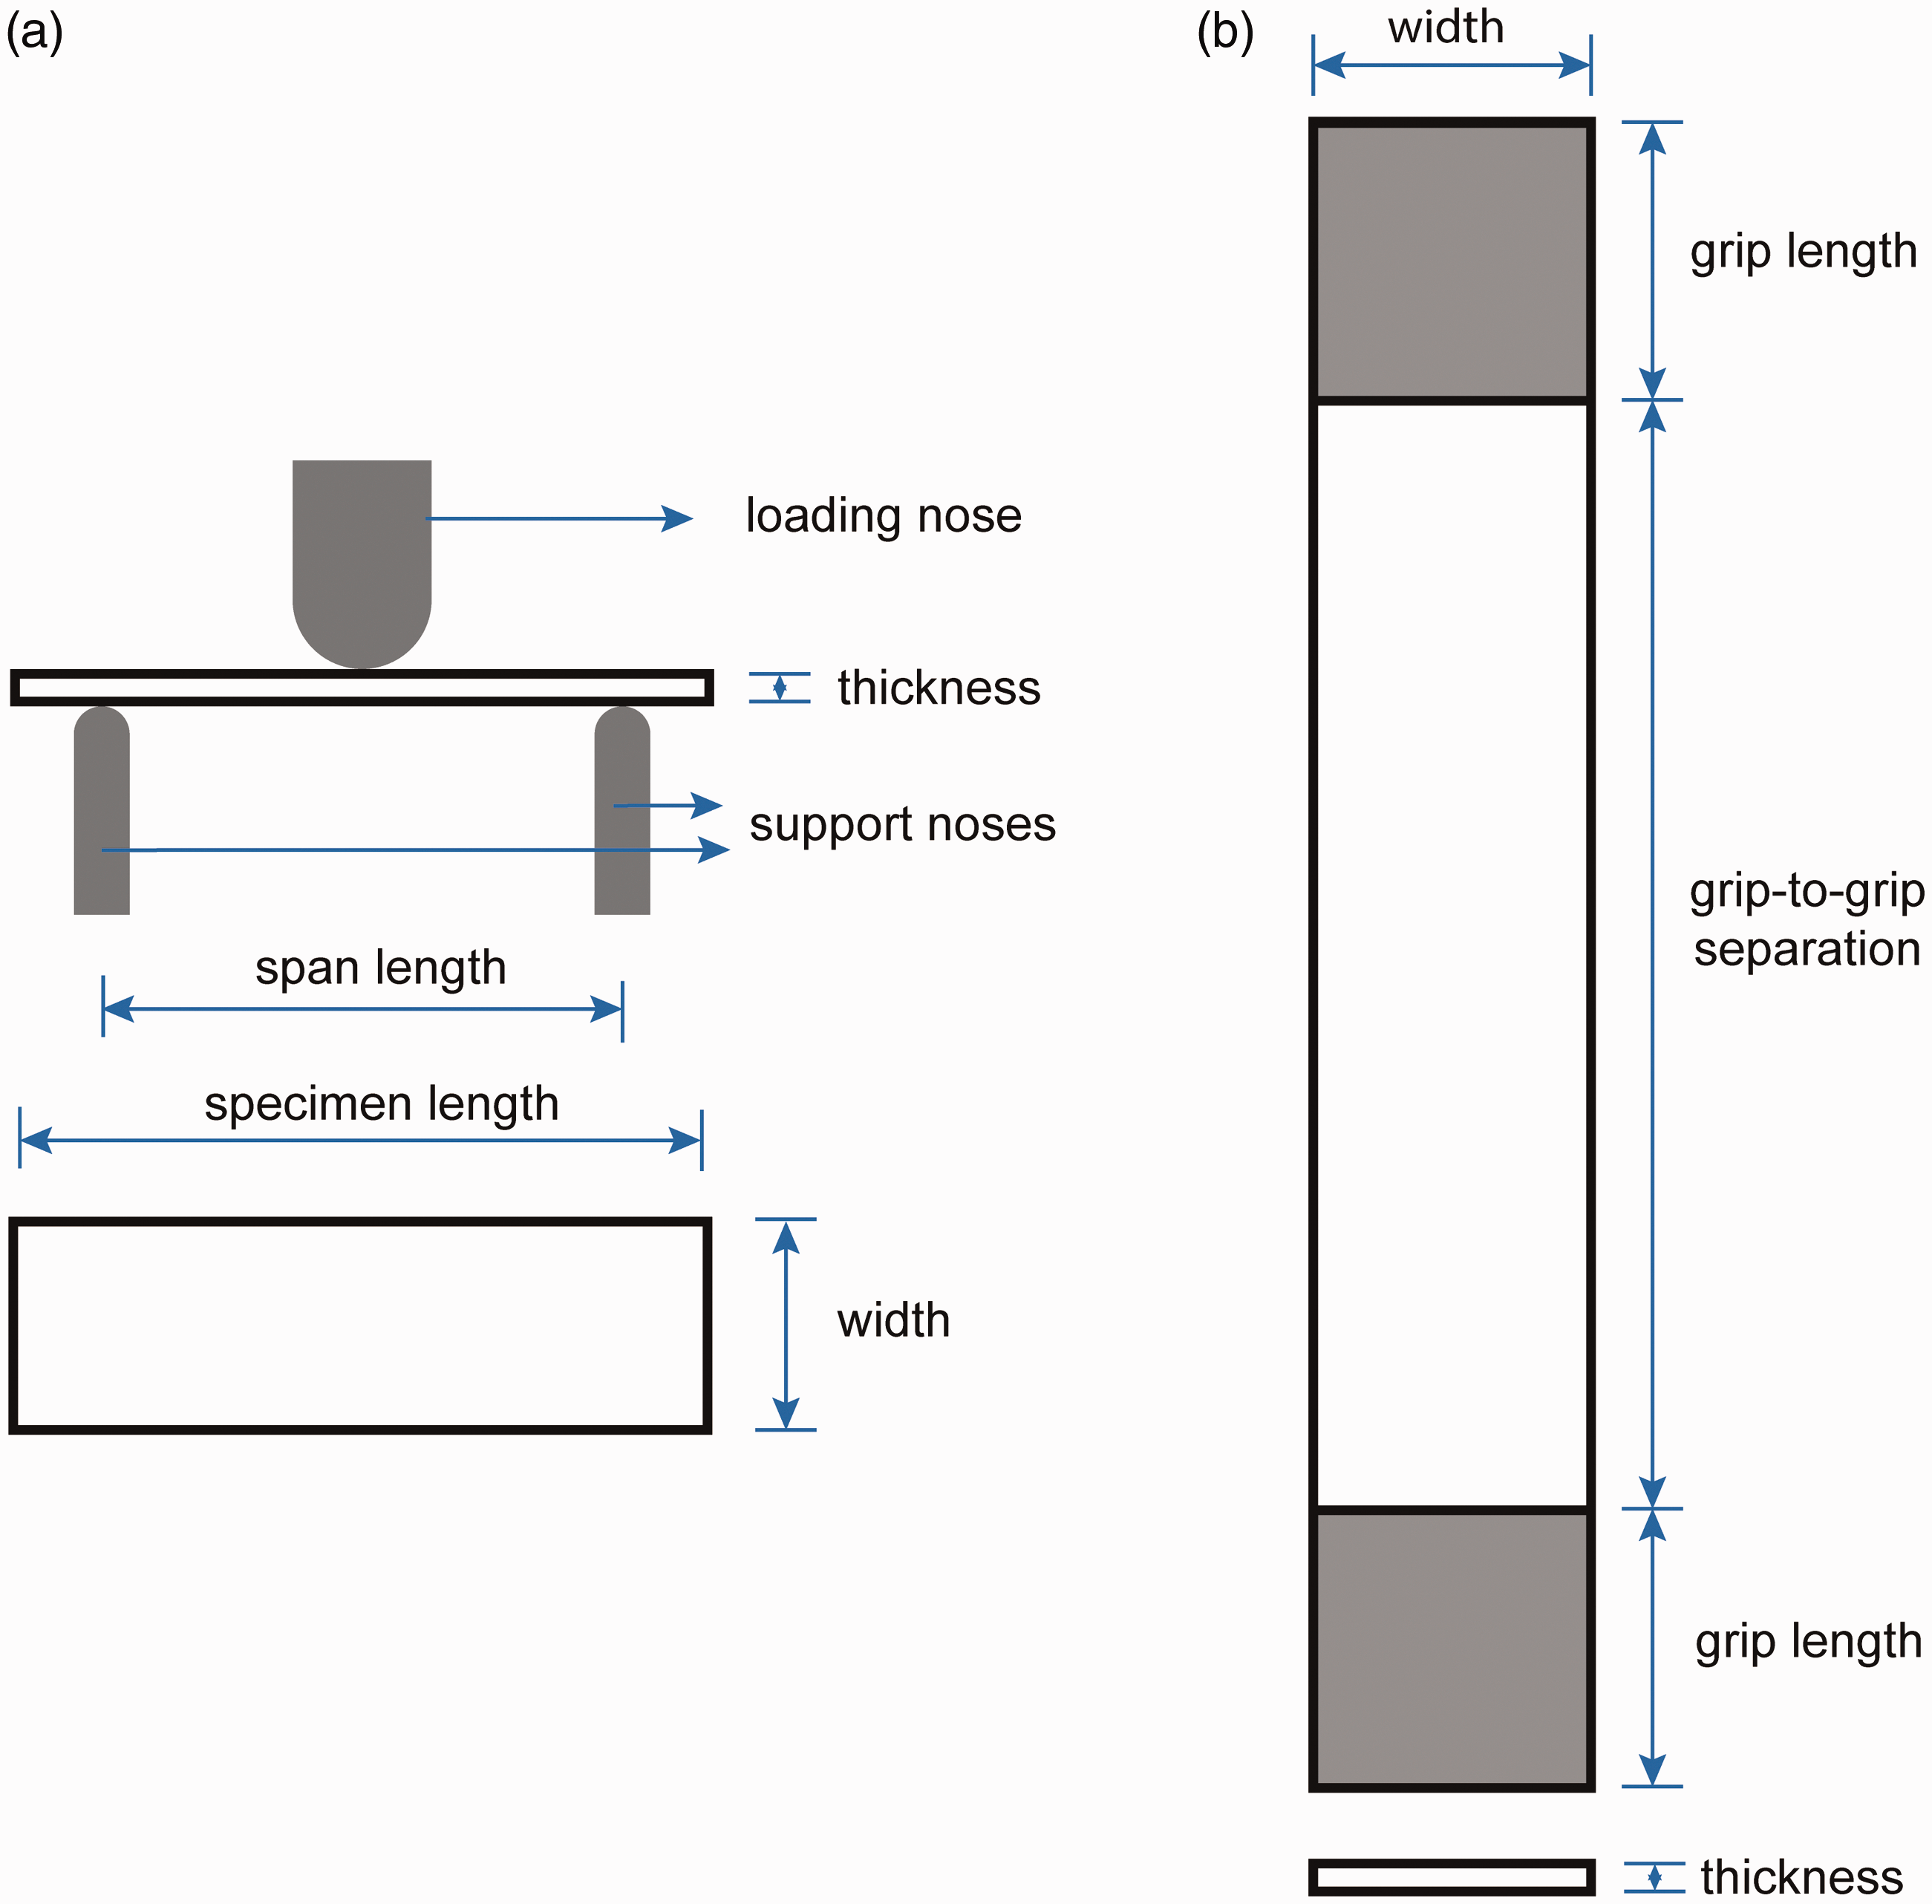
Schematic drawing of (a) 3-point bending and (b) uniaxial test specimens. The drawings at the top and bottom part of the figure correspond to the front and top views, respectively.
Mechanical tests
In this study, three types of mechanical tests are conducted, which are constant-strain-rate, creep and fatigue tests. In all cases, engineering stress and strain values are used for the calculations and theory presented in the “Background” section.
As mentioned before, glass/iPP was tested in uniaxial tension, while carbon/PEEK and carbon/PEKK were tested under 3-point bending to avoid failure at the clamps. All the tests except some of the constant-strain-rate tests of carbon/PEKK were carried out at room temperature. Constant-strain-rate, creep and fatigue tests (with a frequency (f) of 0.06 Hz) were conducted using Zwick/Roell Z005 and Z5.0 universal tensile testers equipped with load cells with capacities of
Constant-strain-rate tests were conducted at constant crosshead speeds that correspond to strain rates from
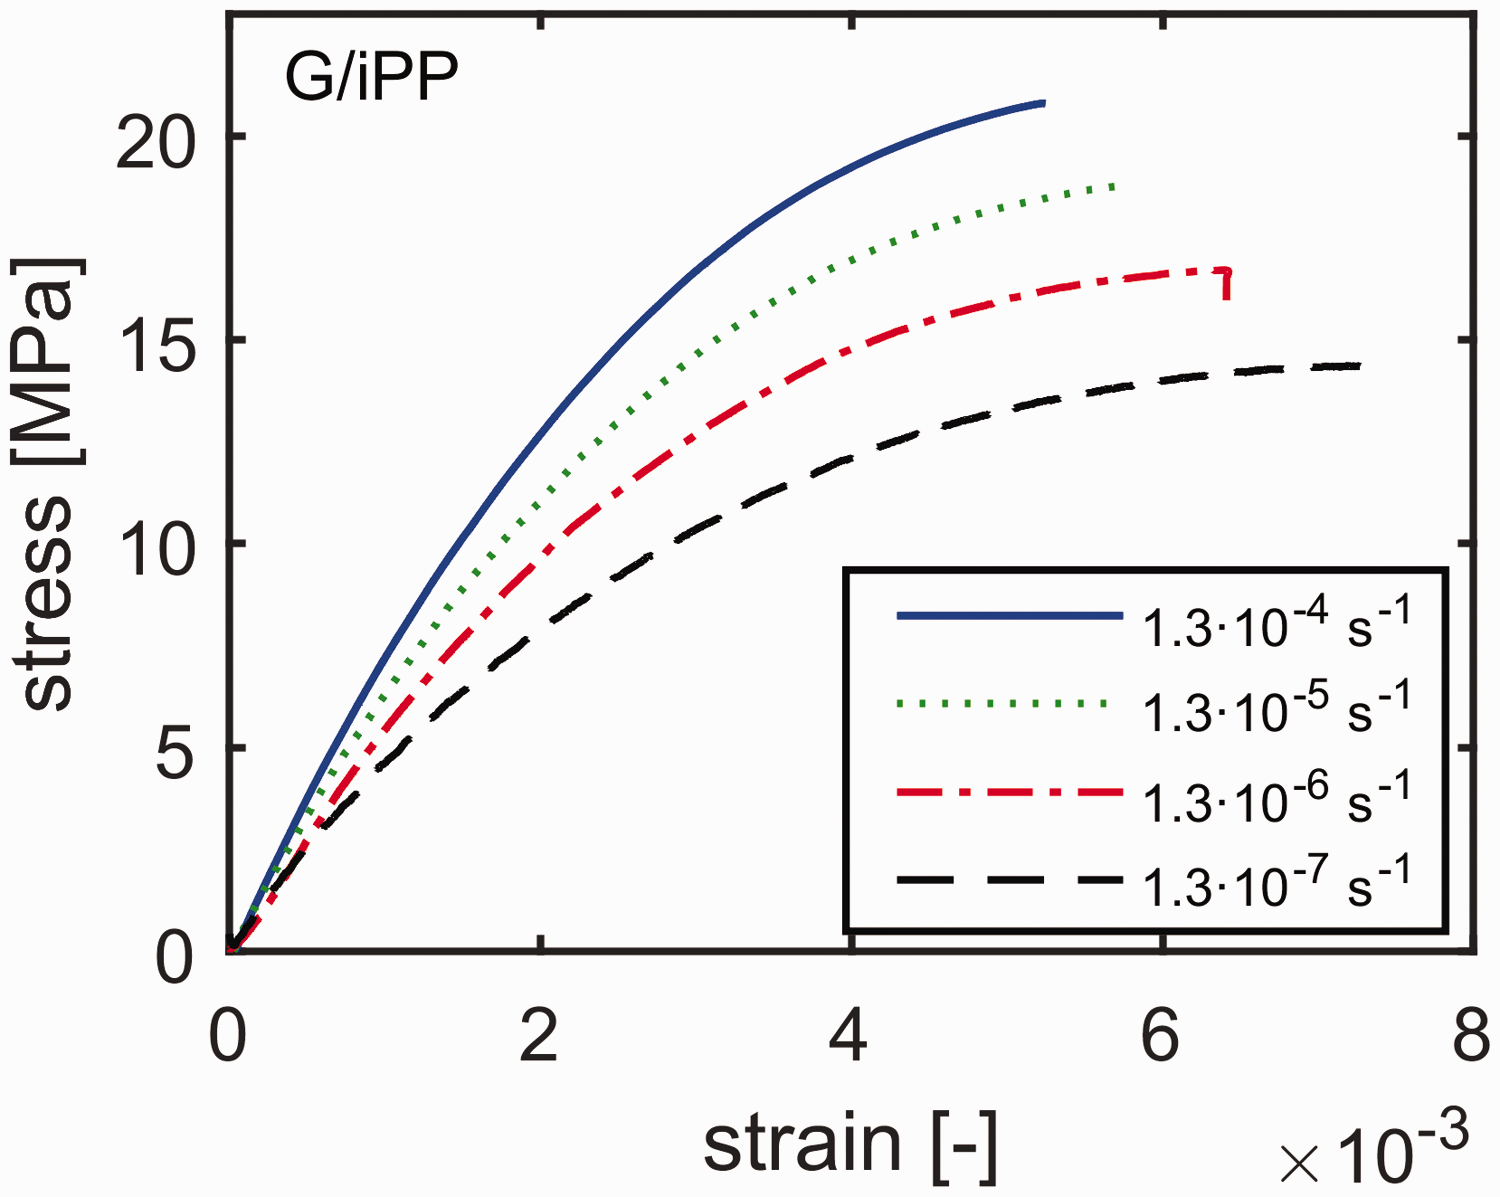
Stress-strain behavior of glass/iPP measured by constant-strain-rate tests.
Frequencies and stress ratios utilized in the fatigue tests performed.
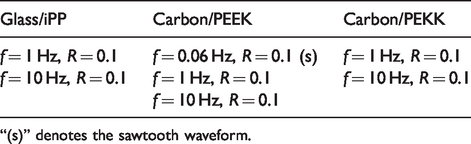
“(s)” denotes the sawtooth waveform.
Results and discussion
In this section, first, the applicability of the lifetime prediction method for the plasticity-controlled failure of neat thermoplastics to the composites will be discussed. This will require a comparison of the short- and long-term (creep and fatigue) behavior of the composites. Subsequently, the effect of stress ratio and frequency on the lifetime will be investigated to identify the plasticity- and crack-growth-controlled failure mechanisms in the long-term behavior of the composites. It is known that transverse failure of composites involves not only matrix failure but also the failure of fiber-matrix interface. While referring to the failure mechanisms, the collective effects of matrix and interface failure are lumped into “plasticity” and “crack-growth” failure mechanisms; hence, the interface failure is not addressed separately. Results of glass/iPP will be reported first, which will be followed by carbon/PEEK and carbon/PEKK.
Glass/iPP
In the “Background” section, we introduced a lifetime prediction methodology for plasticity-controlled failure which was based on identical yield conditions in constant-strain-rate and creep tests. In this method, the yield was taken as the moment when stress attains a maximum constant value in a constant-strain-rate test and the strain rate reaches a minimum constant value in a creep test. To investigate whether these conditions hold also for composites, we will discuss constant-strain rate and creep behavior in more detail.
Figure 8 presents the stress-strain curves obtained from constant-strain-rate tests at various strain rates. It demonstrates that while glass/iPP tends to display macroscopic yielding (a maximum in the stress-strain curve) at low strain rates, it shows pre-yield failure at higher strain rates. Strength increases considerably with strain rate, while the opposite is valid for strain-to-failure. In the linear, low-stress range it can be observed that the modulus also increases considerably with strain rate. Figure 9(a) shows the evolution of strain with time during creep (note that the creep load is applied in the first 10 seconds, which is subtracted from the time-to-failure). Upon an increase in the creep stress, initial strain levels and creep rates increase and time-to-failure decreases. The data in Figure 9(a) can be used to plot the evolution of the creep rate as a function of strain, a so-called Sherby-Dorn plot, 58 which is given in Figure 9(b). It is seen in the Sherby-Dorn plot that the strain rate decreases continuously in the primary creep regime. At high loads, failure tends to take place before the secondary creep regime is reached. At lower loads, secondary creep, and therefore macroscopic plastic flow, is observed.
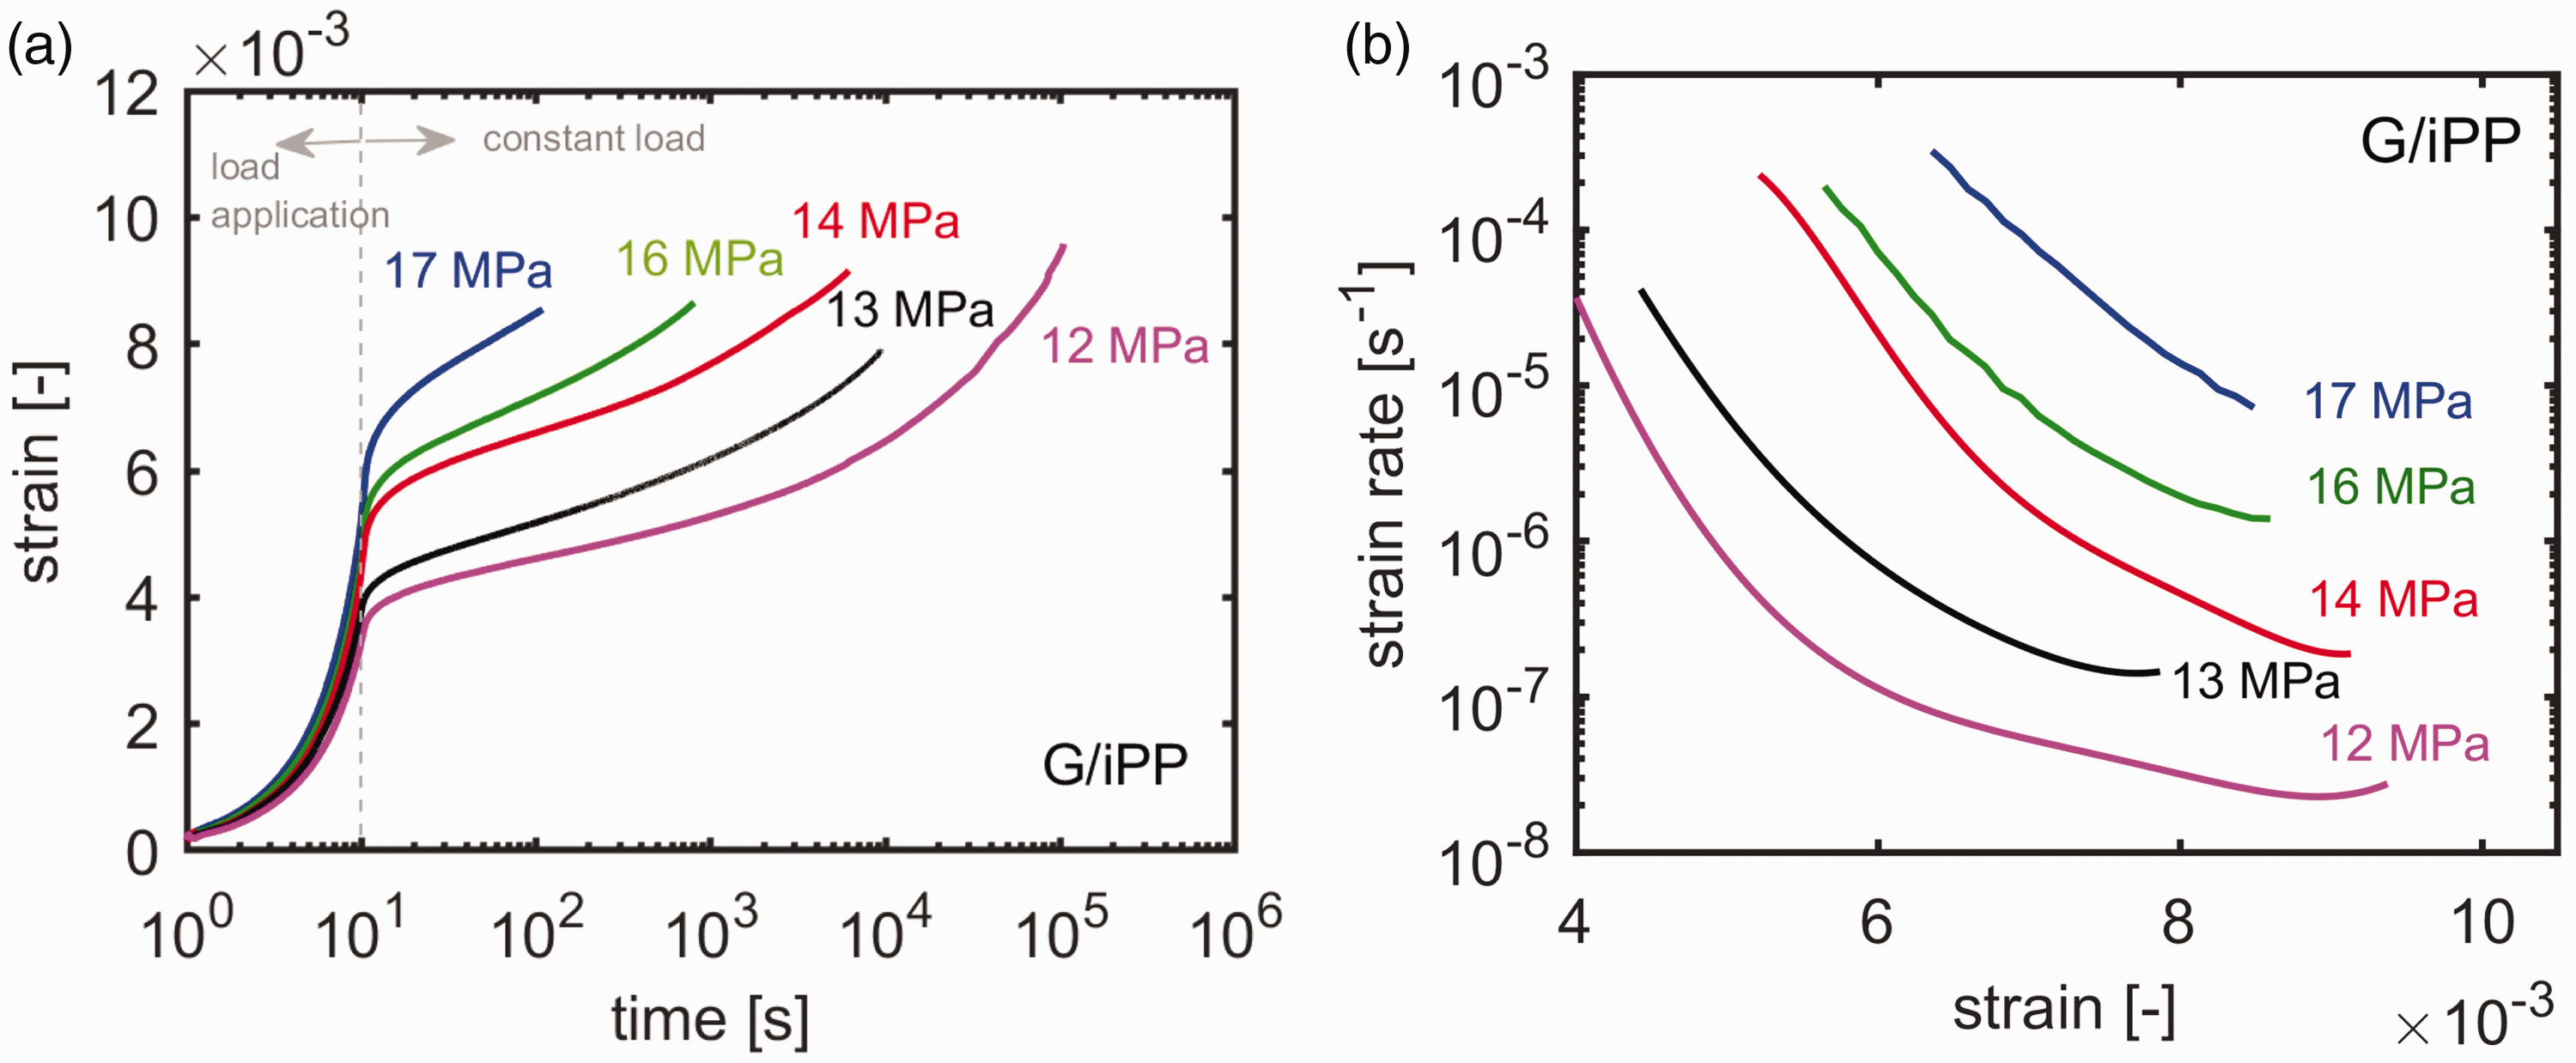
(a) Strain vs. time and (b) Sherby-Dorn plots from creep tests of glass/iPP.
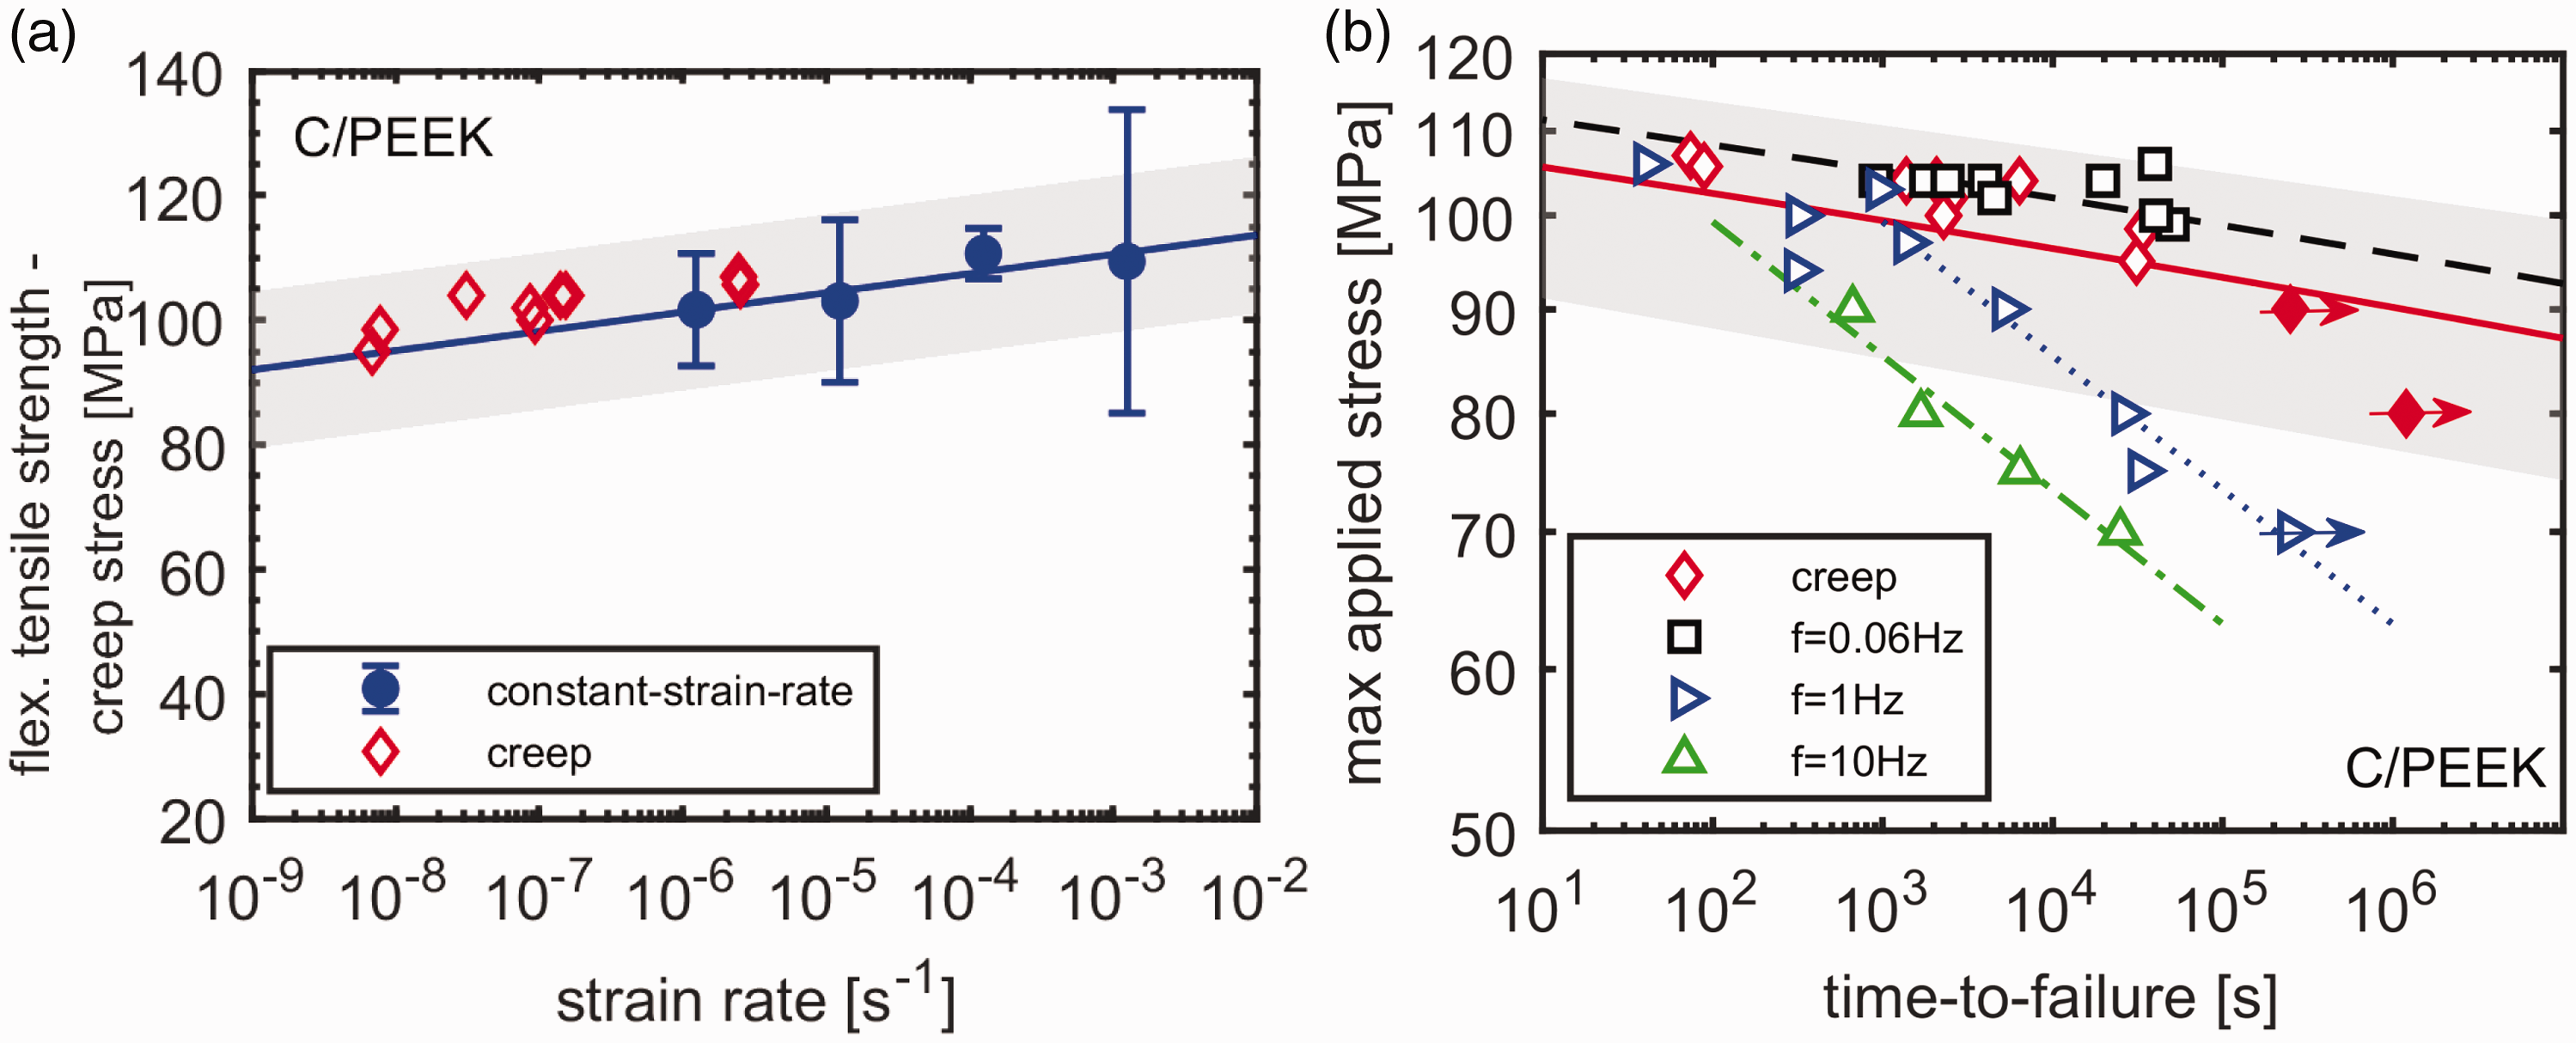
Since macroscopic yield is not reached at every test, the maximum stress attained, which is the “tensile strength”, will be considered when we discuss the strain-rate dependence of the short-term strength. Likewise, regardless of the presence of macroscopic yield in creep, which is termed also as “plastic flow”, the minimum creep rate is taken into account to analyze its dependence on creep stress. In Figure 10(a), the strain-rate dependence of the tensile strength is presented at various strain rates, indicated by circular markers. It can be recognized that the transverse strength of glass/iPP has a linear relationship with the logarithm of the applied strain rate, similar to that observed in neat polymers. This is not surprising since the matrix is the load-bearing constituent in the transverse loading of composites, driving the overall response of the composite. The full line in Figure 10(a) is a line of best fit with equation (3), resulting in the parameters provided in Table 5.
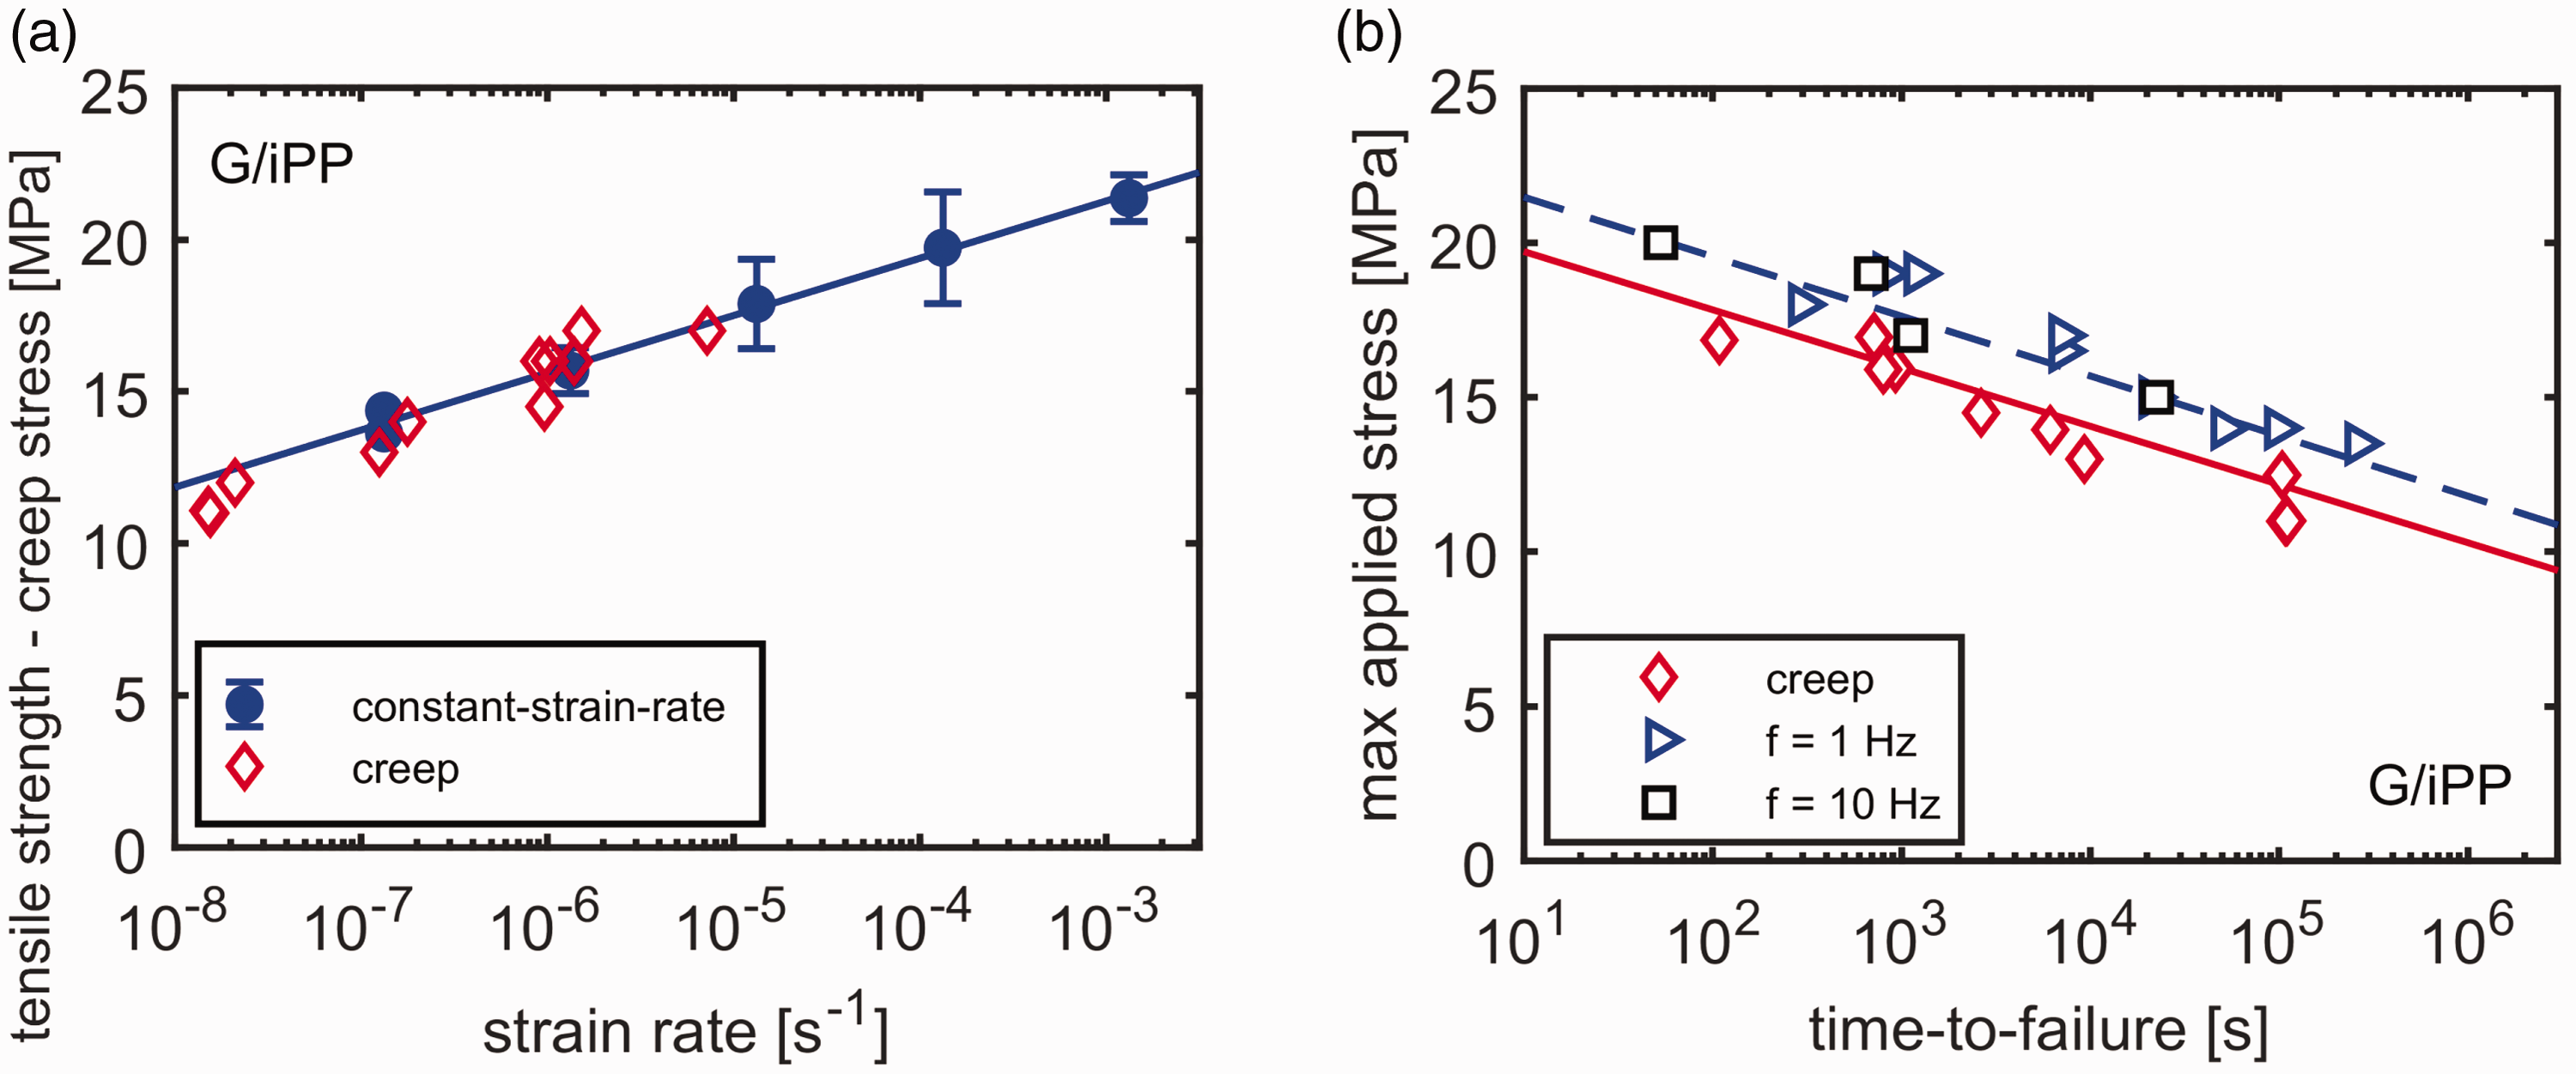
(a) Strain rate dependence of the tensile strength and creep stress dependence of the minimum creep rate. (b) Creep and fatigue (R = 0.1) behavior of glass/iPP. Line in (a) is described by equation (3). Lines in (b) are predictions according to equations (6) and (8). Error bars represent two times the standard deviation.
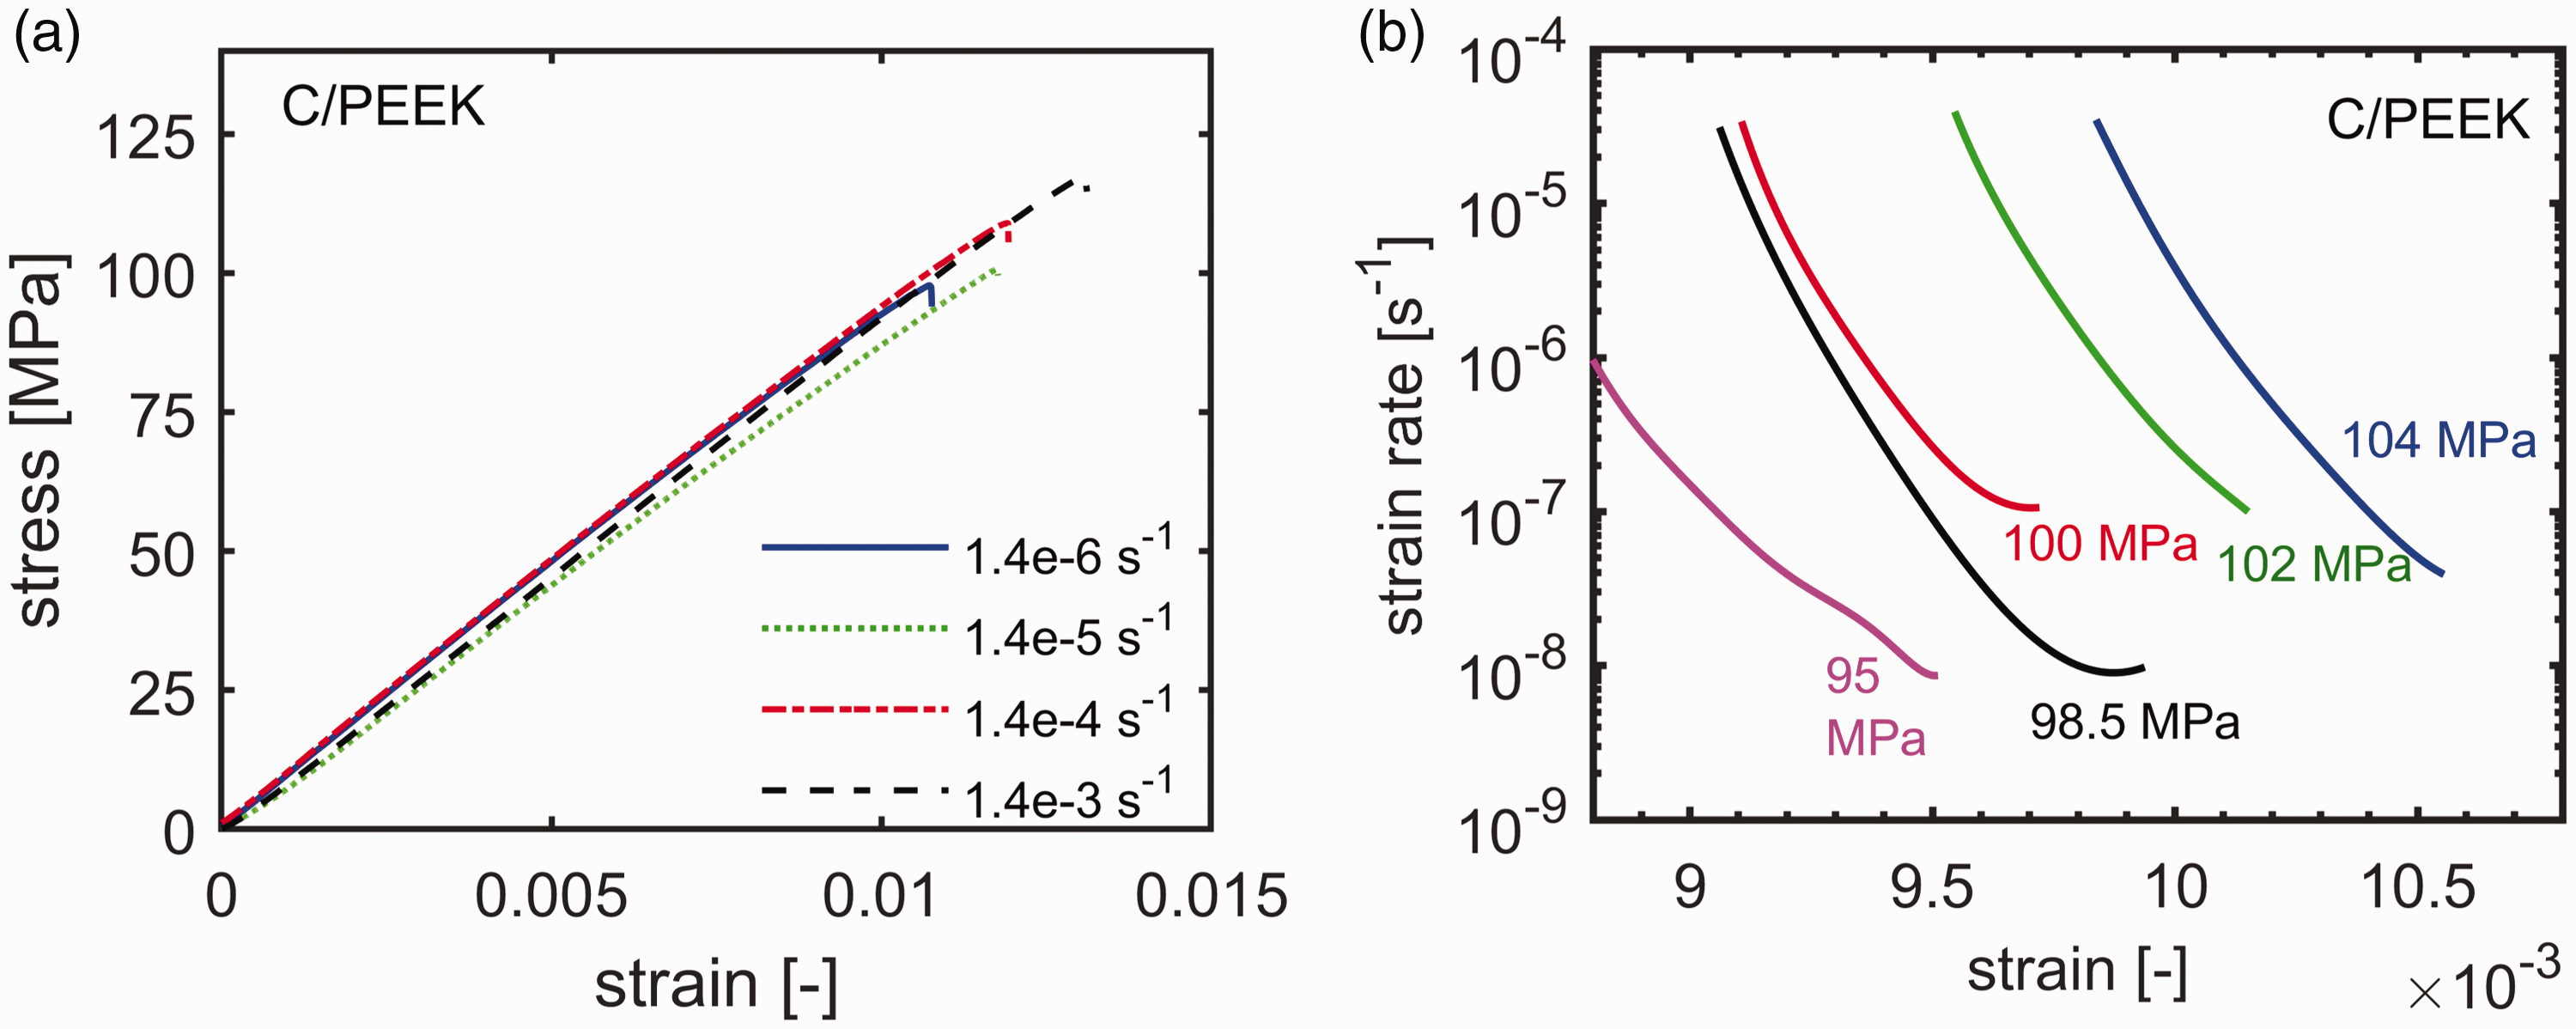
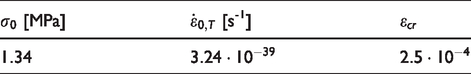
Fit parameters for glass/iPP.
To analyze the equivalence between the failure observed in constant-strain-rate and creep tests, the minimum creep rates obtained from Figure 9(b) are also plotted in Figure 10(a) (diamond markers), showing excellent agreement. Despite the fact that pre-yield failure was observed in some tensile and creep tests, the stress-dependence of the minimum creep rate is, similar to the case of plastic flow kinetics (Figure 4), equivalent to that observed in constant-strain-rate experiments. The long-term performance, measured in static (creep) as well as in cyclic loading, is presented in Figure 10(b), which shows maximum applied stress versus the time-to-failure for glass/iPP under creep and fatigue loading.
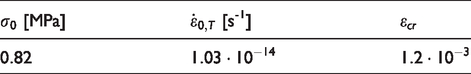
The lifetimes measured in creep are plotted versus the corresponding minimum creep rate in Figure 11, in a double logarithmic presentation. The data shows a trend that corresponds well with a slope of -1 that is expected for plasticity controlled failure,
71
and the drawn line is a fit with equation (5), yielding the critical strain,
Minimum creep rate versus time-to-failure for glass/iPP. Markers represent experimental data and the line represents the fit with equation (5).
A strong confirmation of the role of plasticity is found in the response of long-term cyclic loading. Figure 10(b) also presents the lifetime measured in cyclic loading at frequencies of 1 and 10 Hz, which show a marked increase of lifetime compared to that in static loading. Additionally, it is observed that the stress-dependence of the lifetime is very comparable for both frequencies experimentally covered. Both observations give evidence that failure in this regime is plasticity-controlled.23,24,35 Further support is found in applying the framework for the prediction of plasticity-controlled failure (represented by equations (7) and (8)) to predict the lifetime in cyclic loading using the parameters listed in Table 5, which are determined from the strain rate dependence of the tensile strength (parameters
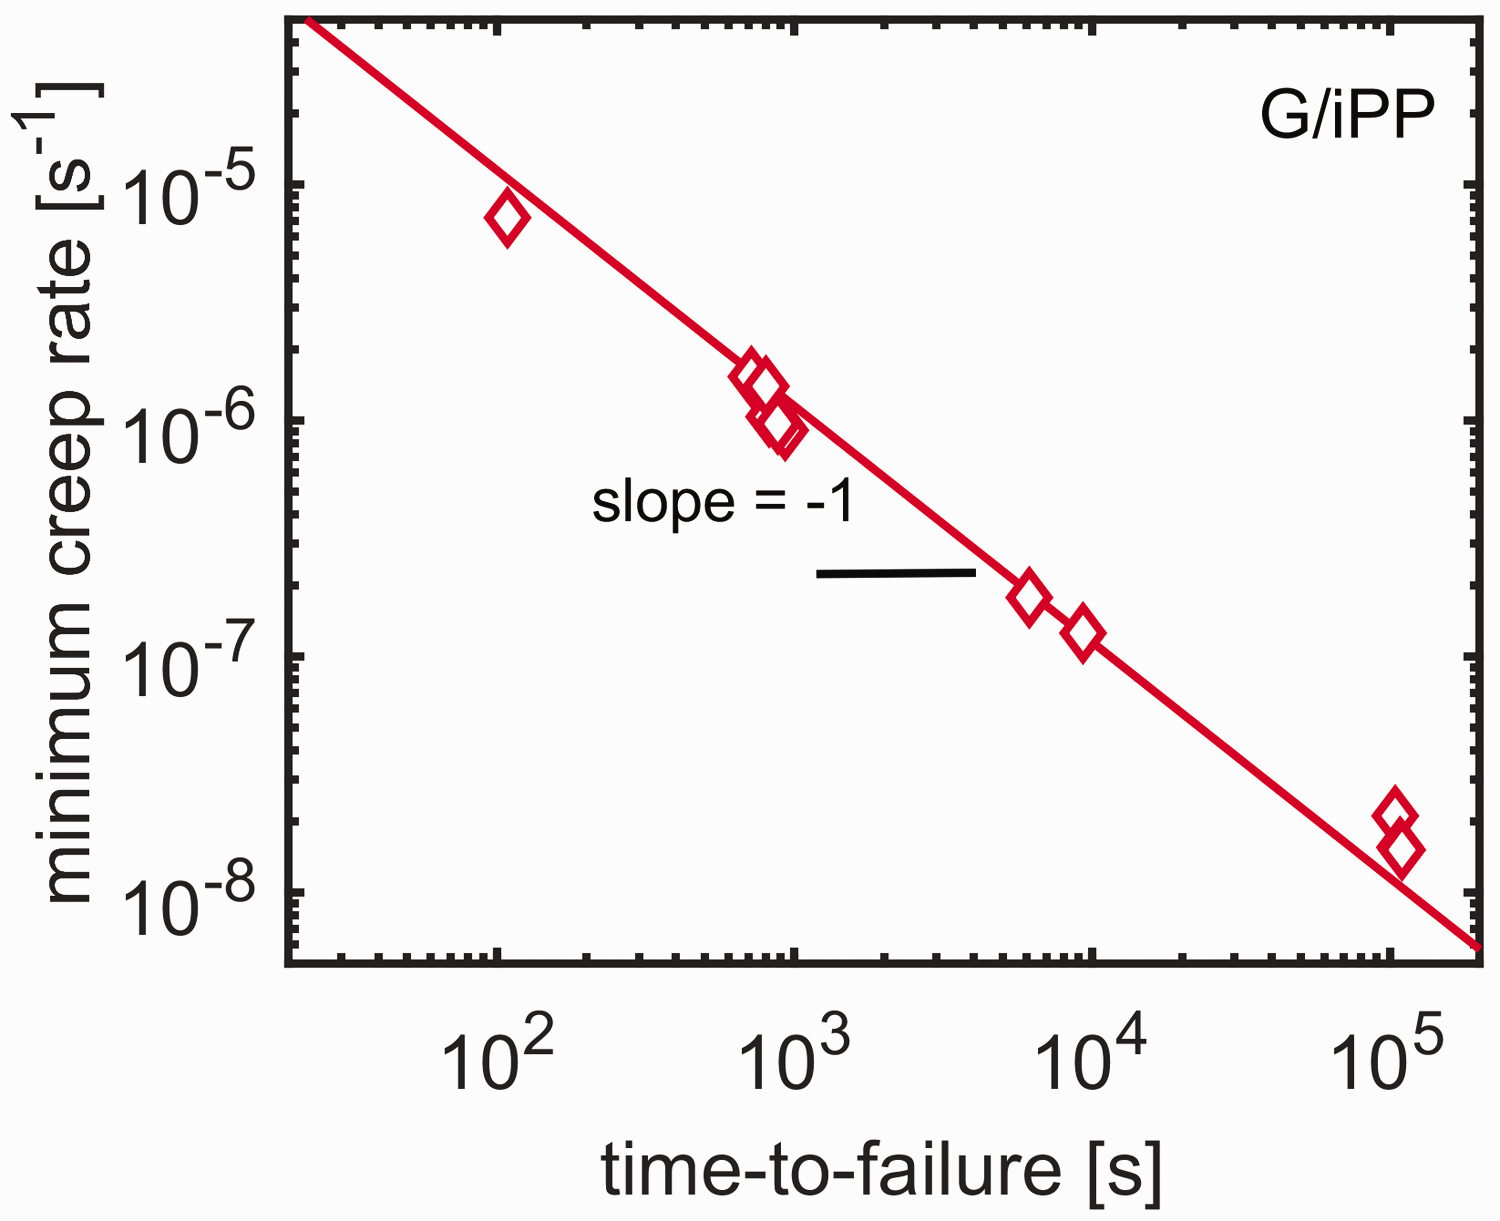
The resulting prediction of the lifetime in cyclic loading, represented by the dashed line in Figure 10(b), agrees excellently with the data experimentally obtained. The method yields the same predictions for f = 1 Hz and f = 10 Hz, which is clarified in Figure 12 where the accumulation of plastic strain is presented as a function of time. In static loading, the accumulation of plastic strain evolves at a constant, high rate, evidenced by the steep slope of the line. In cyclic loading, such a high rate is observed only at the high stress levels of the load cycles, followed by an almost inactive region in the low-stress region. As a result, the average rate is far lower compared to that of static loading, leading to longer failure times. The shift in the lifetime resulting from the delayed accumulation of plastic strain is almost 1 decade, which is significant.
Accumulation of plastic strain as a function of time for glass/iPP under static and cyclic loading at the same value of the maximum stress. A representative stress profile for static and cyclic loading is given in Figure 3.
All these observations give evidence that the long-term behavior of glass/iPP is plasticity-controlled over the entire load range experimentally covered, although the deformation was significantly localized due to the fiber reinforcement.
Carbon/PEEK
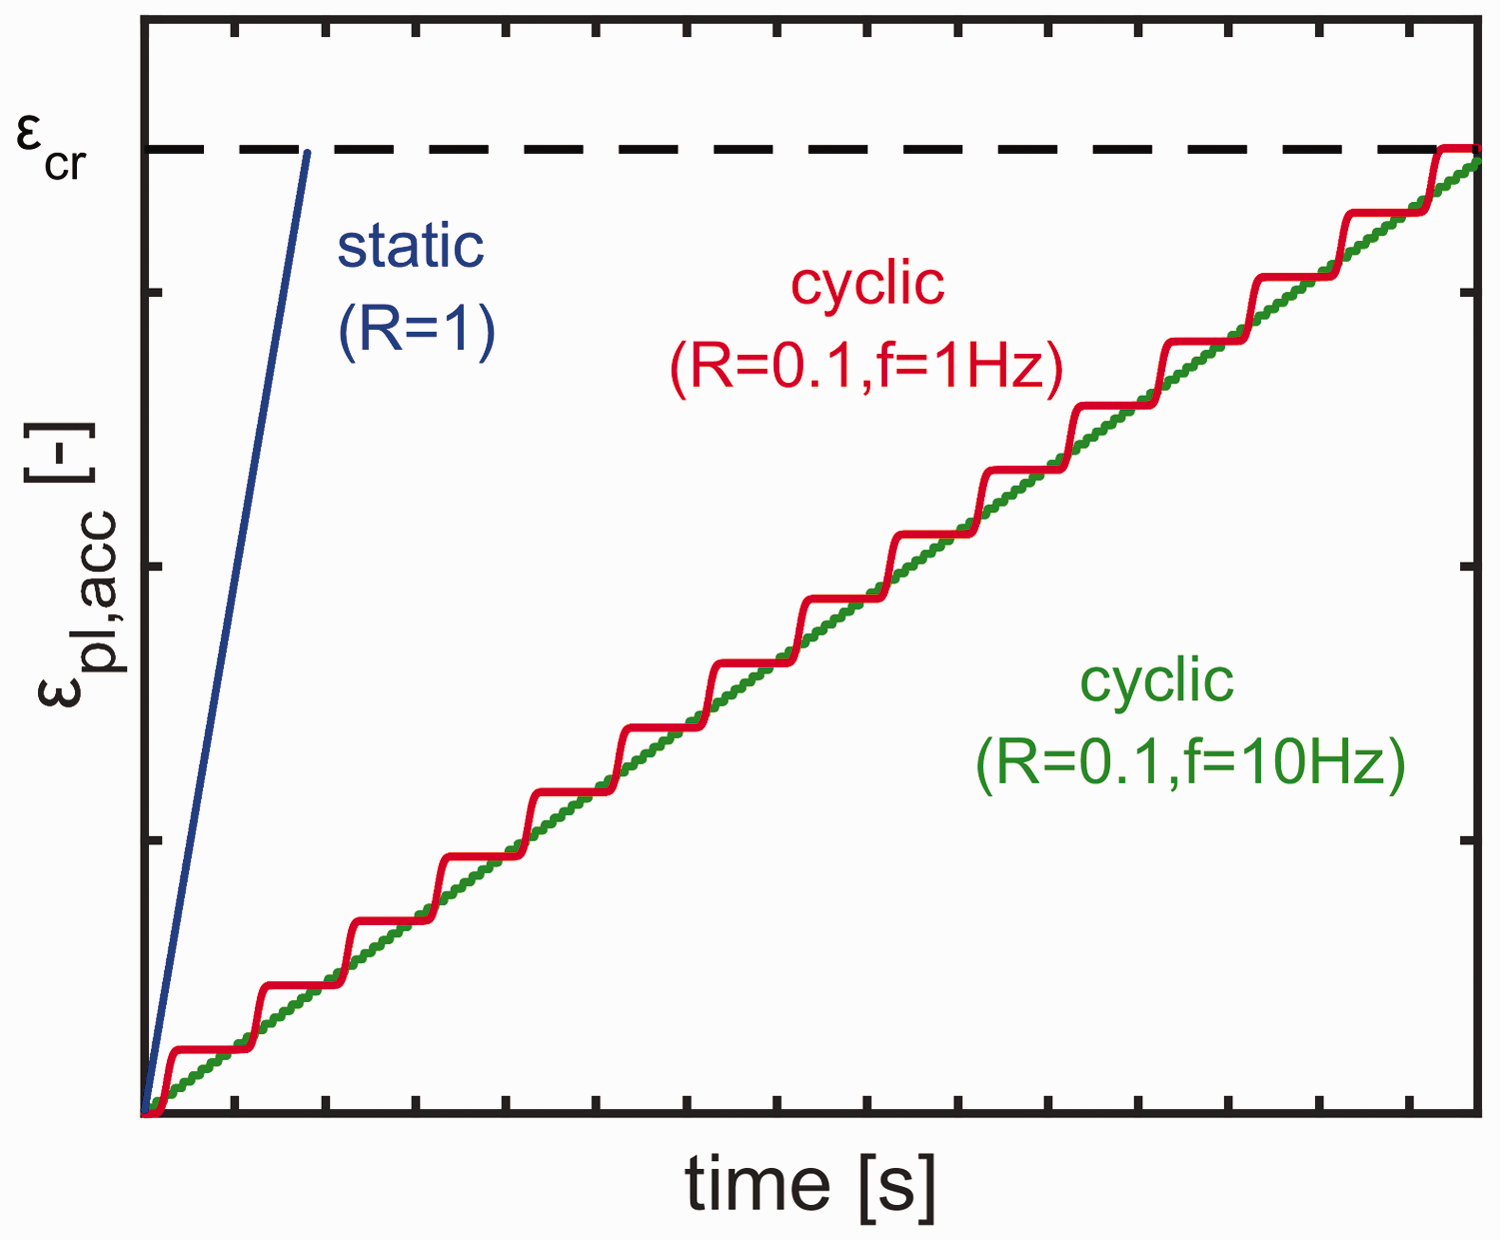
Figure 13(a) shows the stress-strain curves for carbon/PEEK laminates loaded transversely at different strain rates. In contrast to the stress-strain response of glass/iPP, macroscopic yield is never observed and the modulus is almost insensitive to the applied strain rate. Sherby-Dorn plots for various creep loads, presented in Figure 13(b), only show signs of macroscopic plastic flow in some tests. A thing to note is the large amount of scatter in the data; in Figure 13(b) different creep stresses result in flow rates that are close to each other. In addition to the scatter in creep, the material also exhibits considerable scatter in its transverse strength measured under constant-strain-rate, presented in Figure 14(a), where the dependence of minimum creep rate on the creep stress is also presented. The scatter (variability) in the rate-dependent tensile strength is represented in Figure 14(a) with bars which indicate two times the standard deviation. The height of the gray-colored band in Figure 14(a) is the average of the scatter at different strain rates, which is 11.4% of the mean strength at
(a) Transverse stress-strain response of carbon/PEEK at various strain rates and (b) Sherby-Dorn plots of carbon/PEEK from creep tests at various stress levels.
(a) Strain rate dependence of the tensile strength and creep stress dependence of the minimum creep rate. (b) Creep and fatigue (R = 0.1) behavior of carbon/PEEK. The line in (a) is described by equation (3) and the gray band indicates the average scatter (2 times the standard deviation) in the rate-dependent strength. In (b), the full line and the gray band are predictions for creep according to equation (6) considering the scatter in (a), and the dashed line is the prediction for f = 0.06 Hz (equation (8)), while other lines are guides-to-the-eye. Fit parameters for the full lines are given in Table 6.
Despite the large scatter, the minimum creep rate data in Figure 14(a), represented by the diamond markers, follow the general trend and are well within the error band. The full line in Figure 14(a) is a fit with equation (3), using the parameters provided in Table 6. The long-term performance of carbon/PEEK is presented in Figure 14(b), where the maximum applied stress is plotted versus the time-to-failure for both static (creep) as well as and cyclic (fatigue) loading. Similar to the procedure for glass/iPP, a double logarithmic plot of the minimum creep rate versus the corresponding time-to-failure is constructed; represented in Figure 15. The data shows a clear trend with a slope of −1 and is well described by equation (5), yielding the value of the critical strain
Fit parameters for carbon/PEEK.
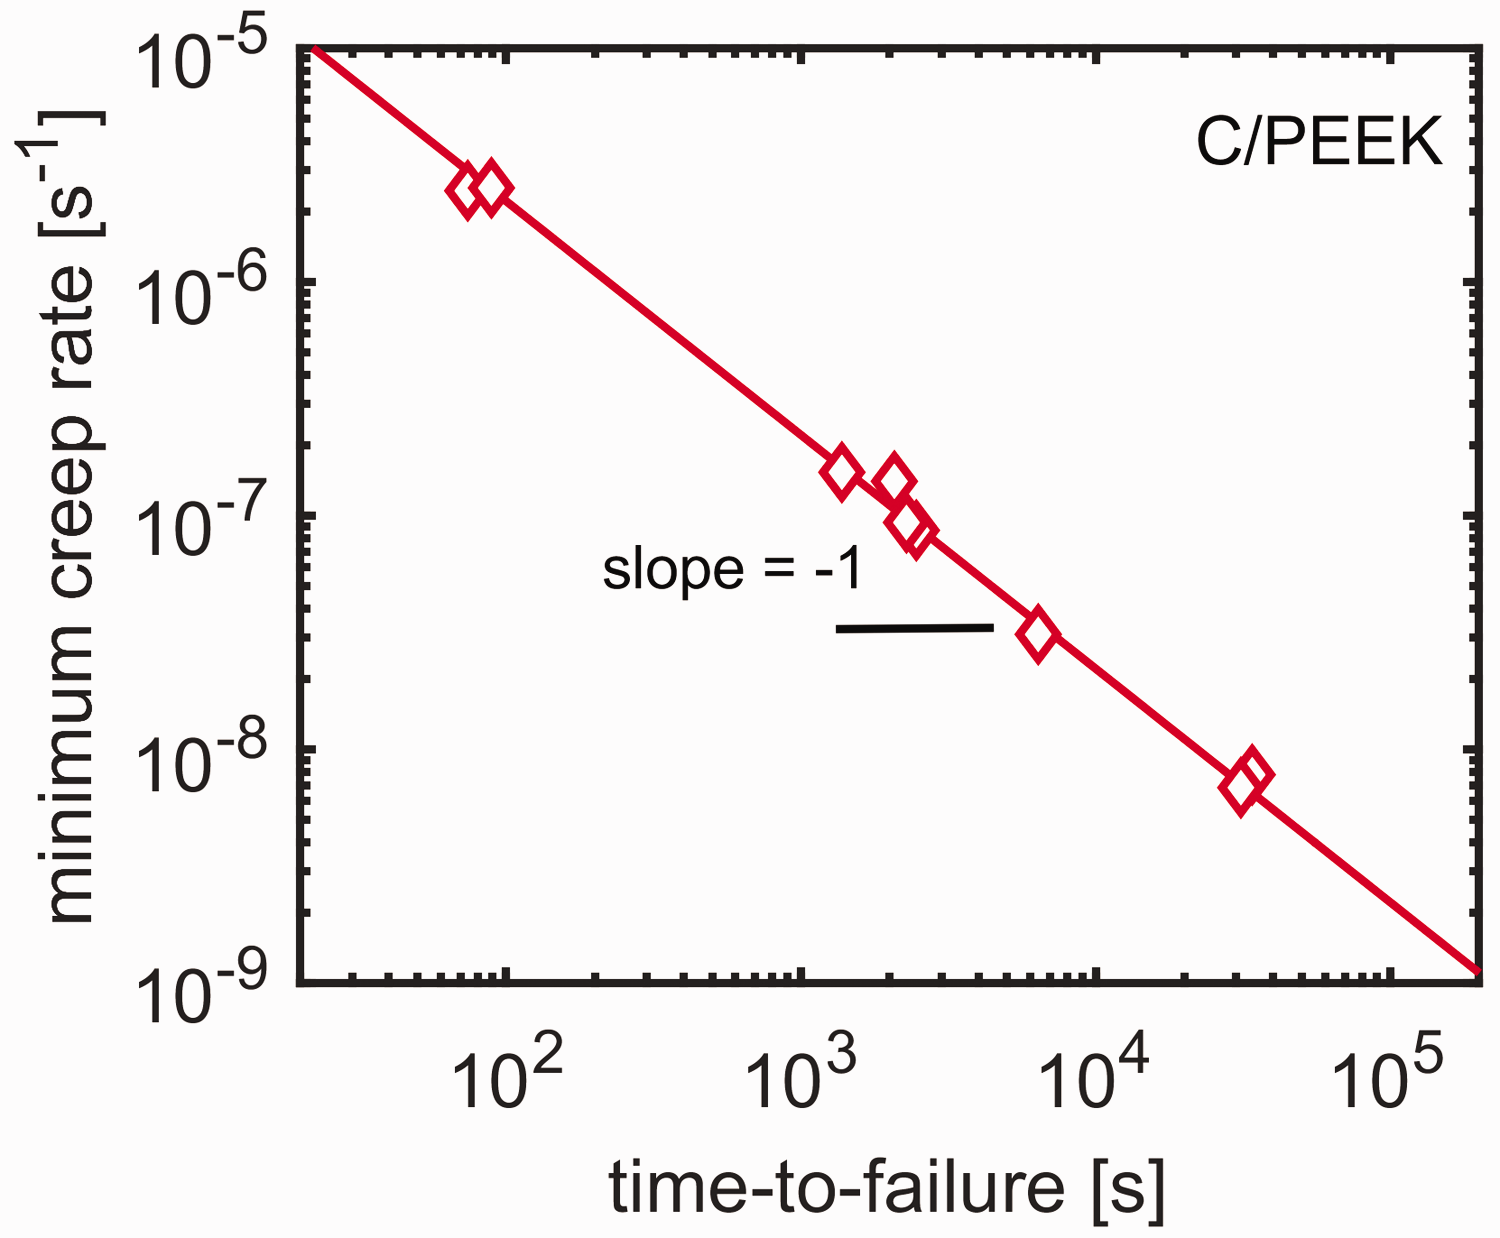
Minimum creep rate versus time-to-failure for carbon/PEEK. Markers represent experimental data and the line represents the fit with equation (5).
Next, the fatigue behavior of carbon/PEEK will be discussed. Cyclic testing of this material is carried out at frequencies of 0.06 Hz, 1 Hz, and 10 Hz. It can be seen in Figure 14(b) that cyclic loading with a frequency of 0.06 Hz and a stress ratio of 0.1, represented by the black square markers, follow a trend that is similar to the creep data. This would be expected in the case of plasticity-controlled failure, shown by the cyclic lifetime prediction according to equation (8), using the parameters from Table 6, represented by the dashed line in Figure 14(b). However, the increase in lifetime is not very clearly observed in the experimental data. This is thought to be related to the scatter in the time-dependent strength. Upon an increase in frequency to 1 Hz, the failure kinetics change, indicated by a strong change in slope that is characteristic for the onset of crack-growth controlled failure. This is confirmed by the experimental results at 10 Hz, represented by the green triangular markers, where the time-to-failure is clearly reduced compared to the 1 Hz data, whereas the kinetics of both (slope) compare well. Our observations concerning the change in failure kinetics from creep to fatigue (f = 1, 10 Hz) agree well with the findings of Nakada et al. 15 on the long-term behavior of transversely loaded carbon/PEEK, where cyclic data with f = 2 Hz and R = 0.05 and creep data have a pronounced difference in the slopes of stress vs time-to-failure curves. Moreover, when we plot the fatigue data versus cycles-to-failure, see Figure 16, the 1 Hz and 10 Hz data collapse, indicating that the lifetime for these frequencies is controlled by the number of cycles-to-failure. However, this is not the case for the high-stress region where the f = 0.06 Hz data is located. At high stresses, we enter the plasticity-dominated region and the slope of the data becomes lower. Lin et al. 73 reported a similar trend for the cyclic behavior of an angle-ply carbon/PEEK laminate, whose behavior is also matrix dominated. Overall, these results suggest that failure mechanisms of carbon/PEEK under cyclic loading depends on the load level: while at higher loads the contribution of plasticity is recognizable, at lower loads crack-growth-controlled failure dominates.
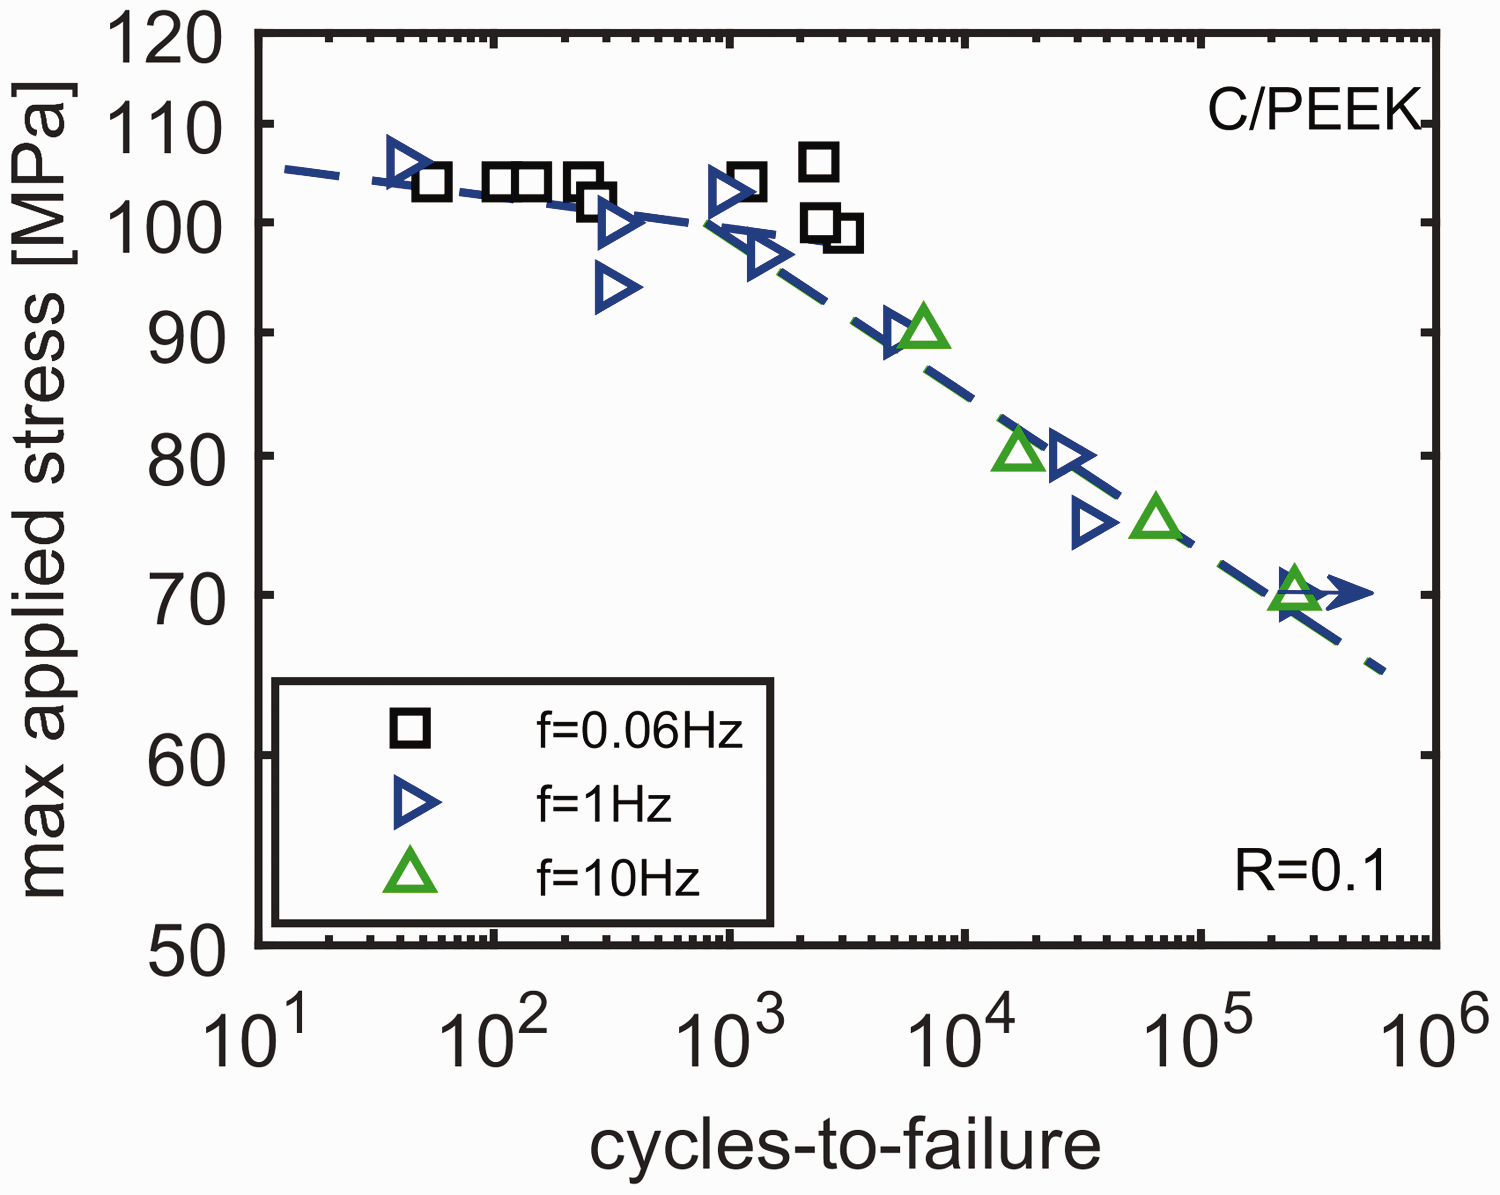
Influence of frequency on the cycles-to-failure for carbon/PEEK. Lines are guides-to-the-eye.
Carbon/PEKK
Figure 17(a) shows the stress-strain curves for carbon/PEKK laminates loaded transversely at different strain rates. Similar to carbon/PEEK, there is no sign of macroscopic yield, the modulus is also insensitive to the applied strain rate. Sherby-Dorn plots for various creep loads, presented in Figure 17(b), show the predominance of pre-yield failure. Similar to Carbon/PEEK, there is also substantial scatter in the performance. This is clearly observed in Figure 18(a), where the transverse strength measured under constant-strain-rate is presented including the minimum creep rate data. The average standard deviation in the strength of carbon/PEKK, indicated by the height of the gray-colored band in Figure 18(a), is 13.6% of the mean strength at
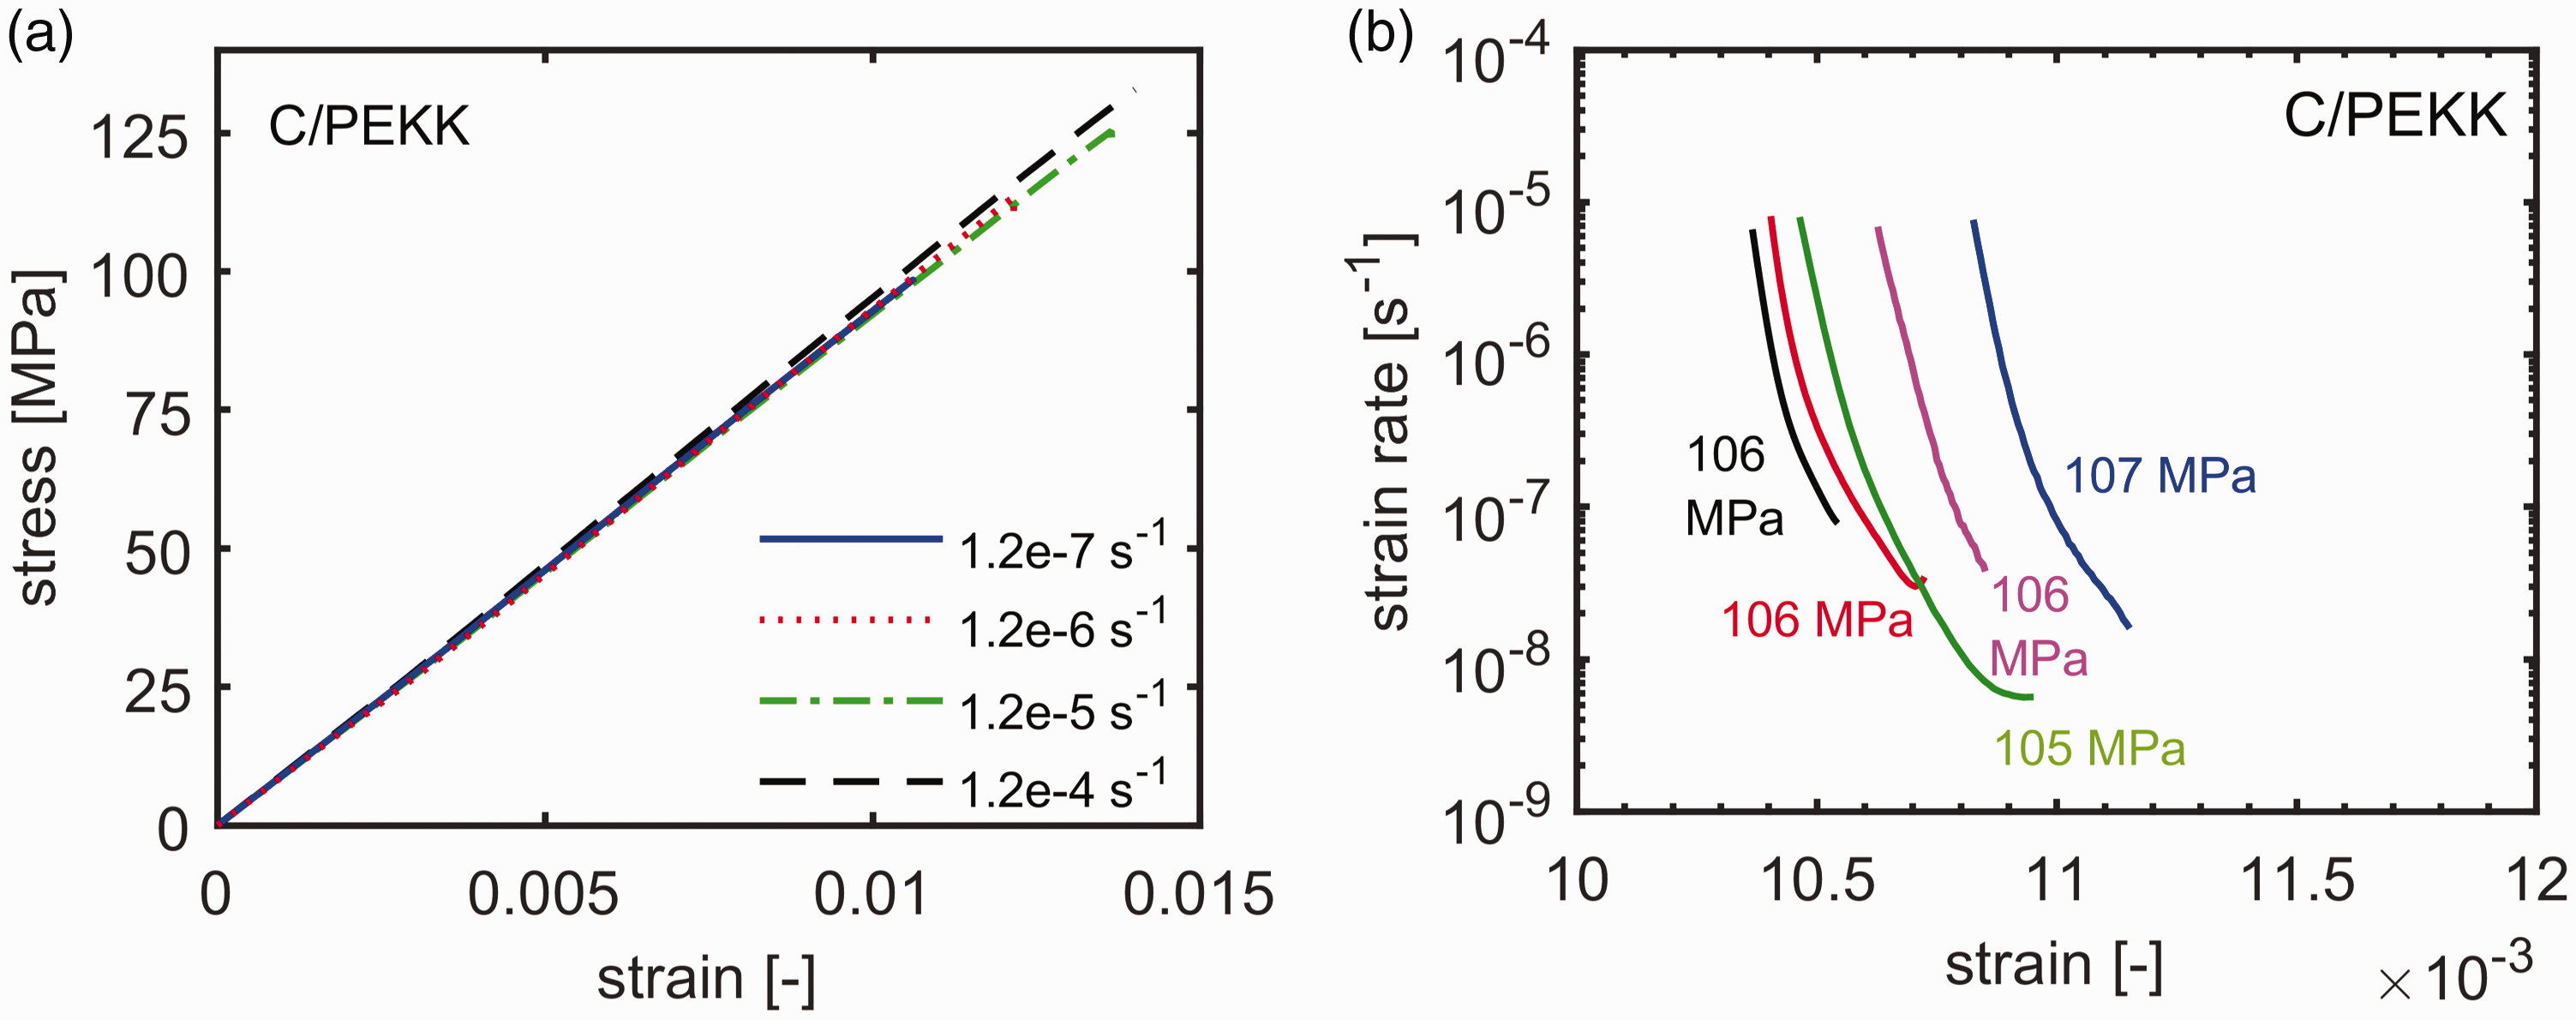
(a) Transverse stress-strain response of carbon/PEKK at various strain rates, and (b) Sherby-Dorn plots of carbon/PEEK from creep tests at various stress levels.
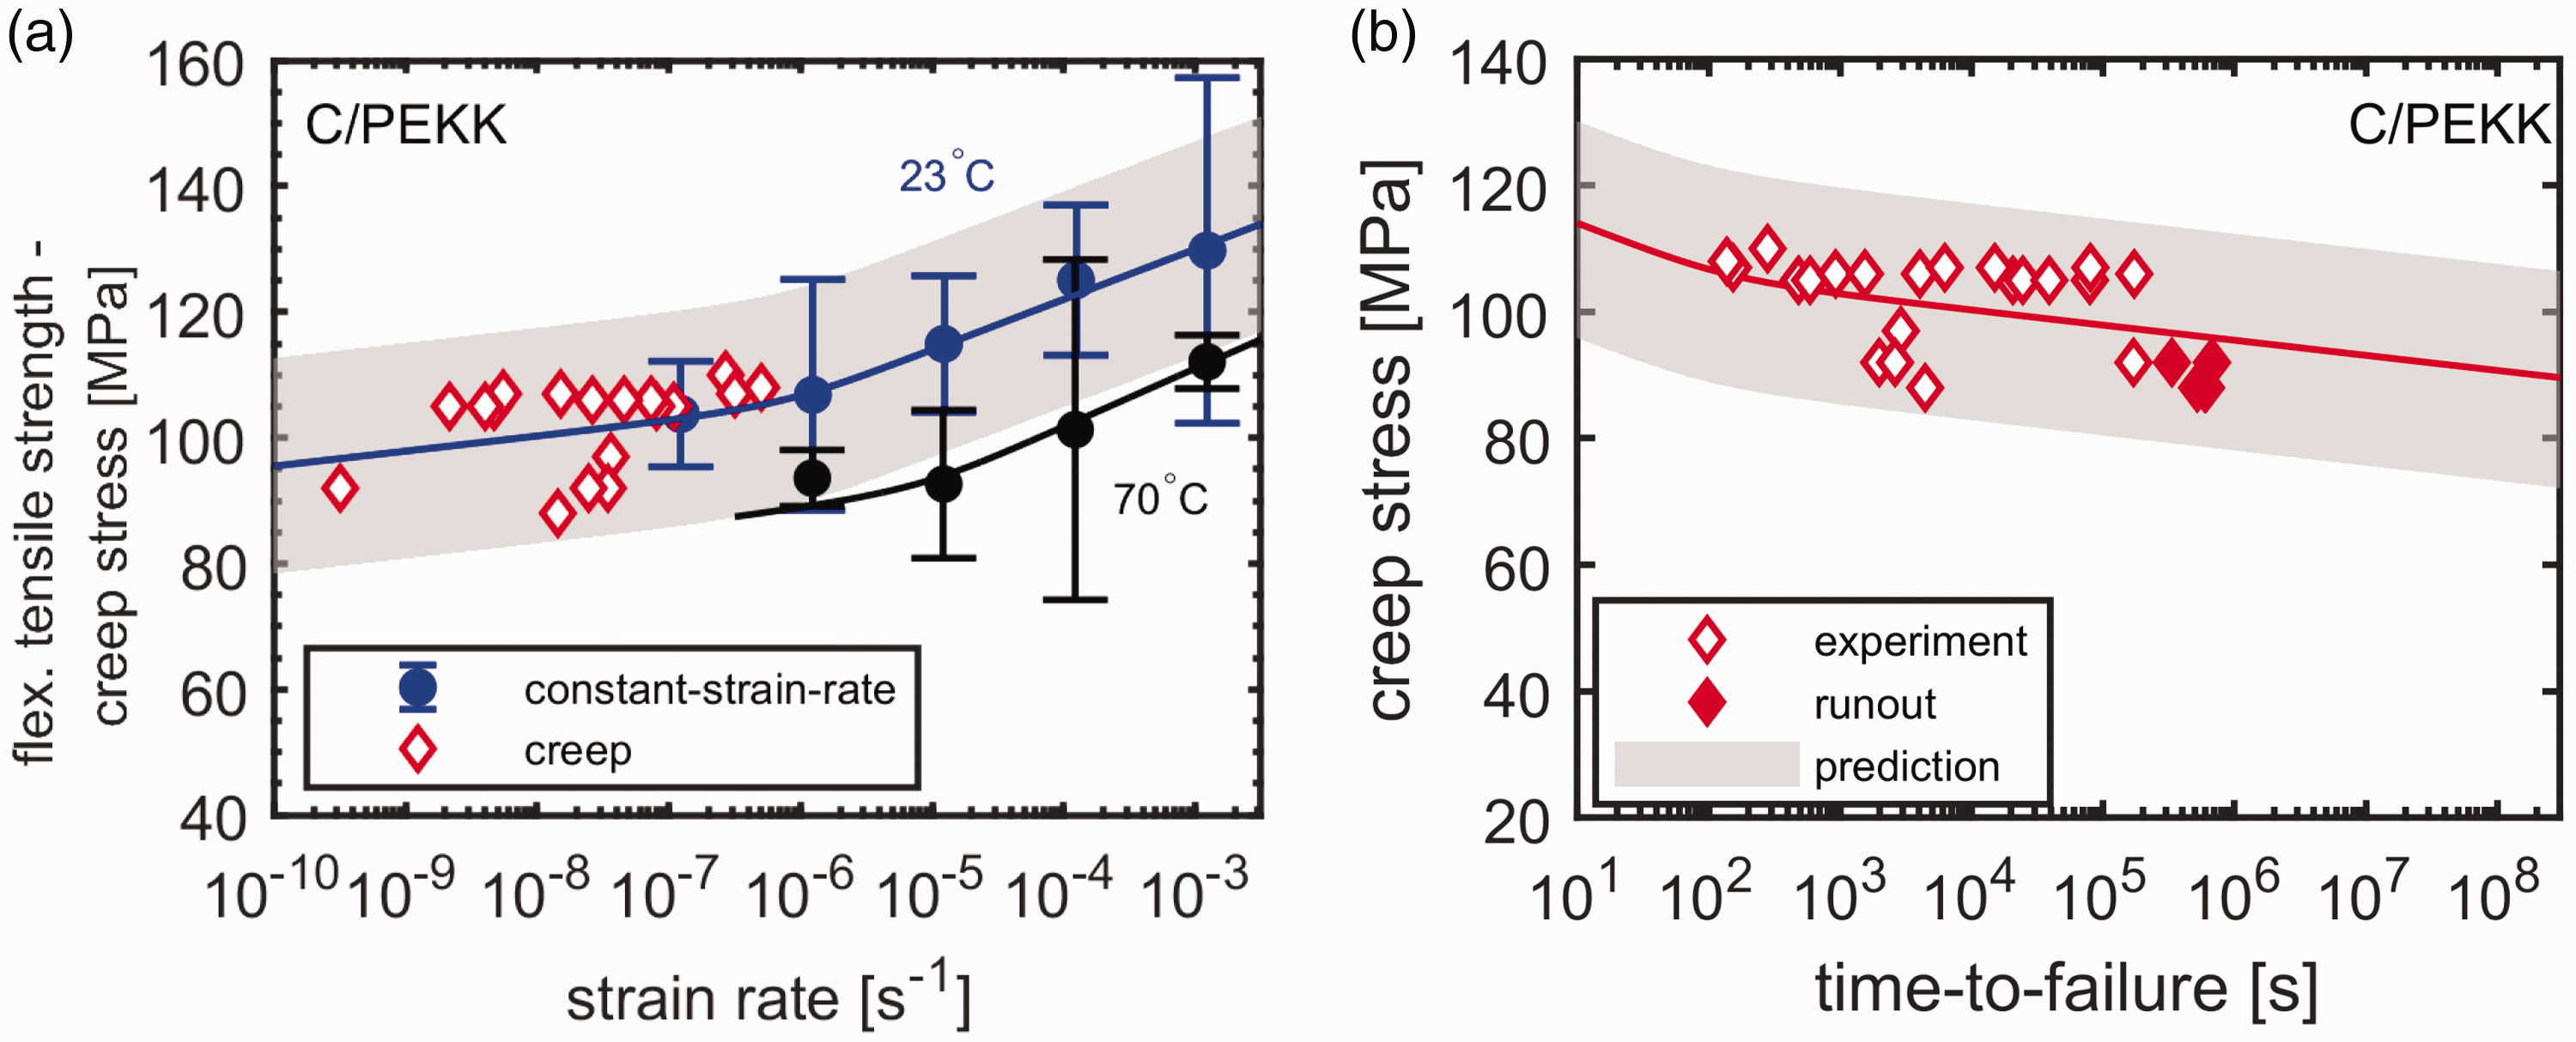
(a) Strain rate dependence of the tensile strength and creep stress dependence of the minimum creep rate. (b) Creep behavior of carbon/PEKK. Note that the minimum creep rates plotted are all from completed creep tests, i.e., they do not belong to run-out tests. The lines in (a) and (b) are described by equations (4) and (6), respectively. Gray band in (a) indicates the average scatter (two times the standard deviation) in the rate-dependent strength and the band in (b) represents the lifetime prediction considering the scatter in (a).
The minimum creep rate data suggests a change in slope with decreasing strain rate. Such behavior is quite common in unfilled thermoplastics and may be related to:
Multiple deformation processes contributing to the stress
The stress contributions of two individual deformation processes with different deformation kinetics;51–55,71,74 these stress contributions act additively (equation (4)), and the change of slope is related to the onset of the stress contribution of the second process.
(ii) Physical aging
The amorphous phase of PEKK is in the glassy state and subject to physical aging. The result is an increase in the yield stress in time. This process is accelerated by stress, which may lead to a selective increase of the yield stress at low strain rates where the material is under stress for longer periods of time.23,65,75–77
In both cases, the strain rate at which the transition is observed should increase with an increase in the testing temperature. The transverse strength data of carbon/PEKK measured at a temperature of
Although the exact reason for the deviation cannot be determined, it is clear from Figure 18(b), where the maximum applied stress is plotted versus the time-to-failure in static loading, that the long-term response has kinetics that compares well to that at low strain rates in Figure 18(a). To directly compare the strain rate dependence of the strength to the long-term data, the data in Figure 18(a) was fitted using the Ree-Eyring expression given in equation (4); the fit should be regarded as a guide-to-the-eye. However, the obtained expression could, in combination with a critical strain
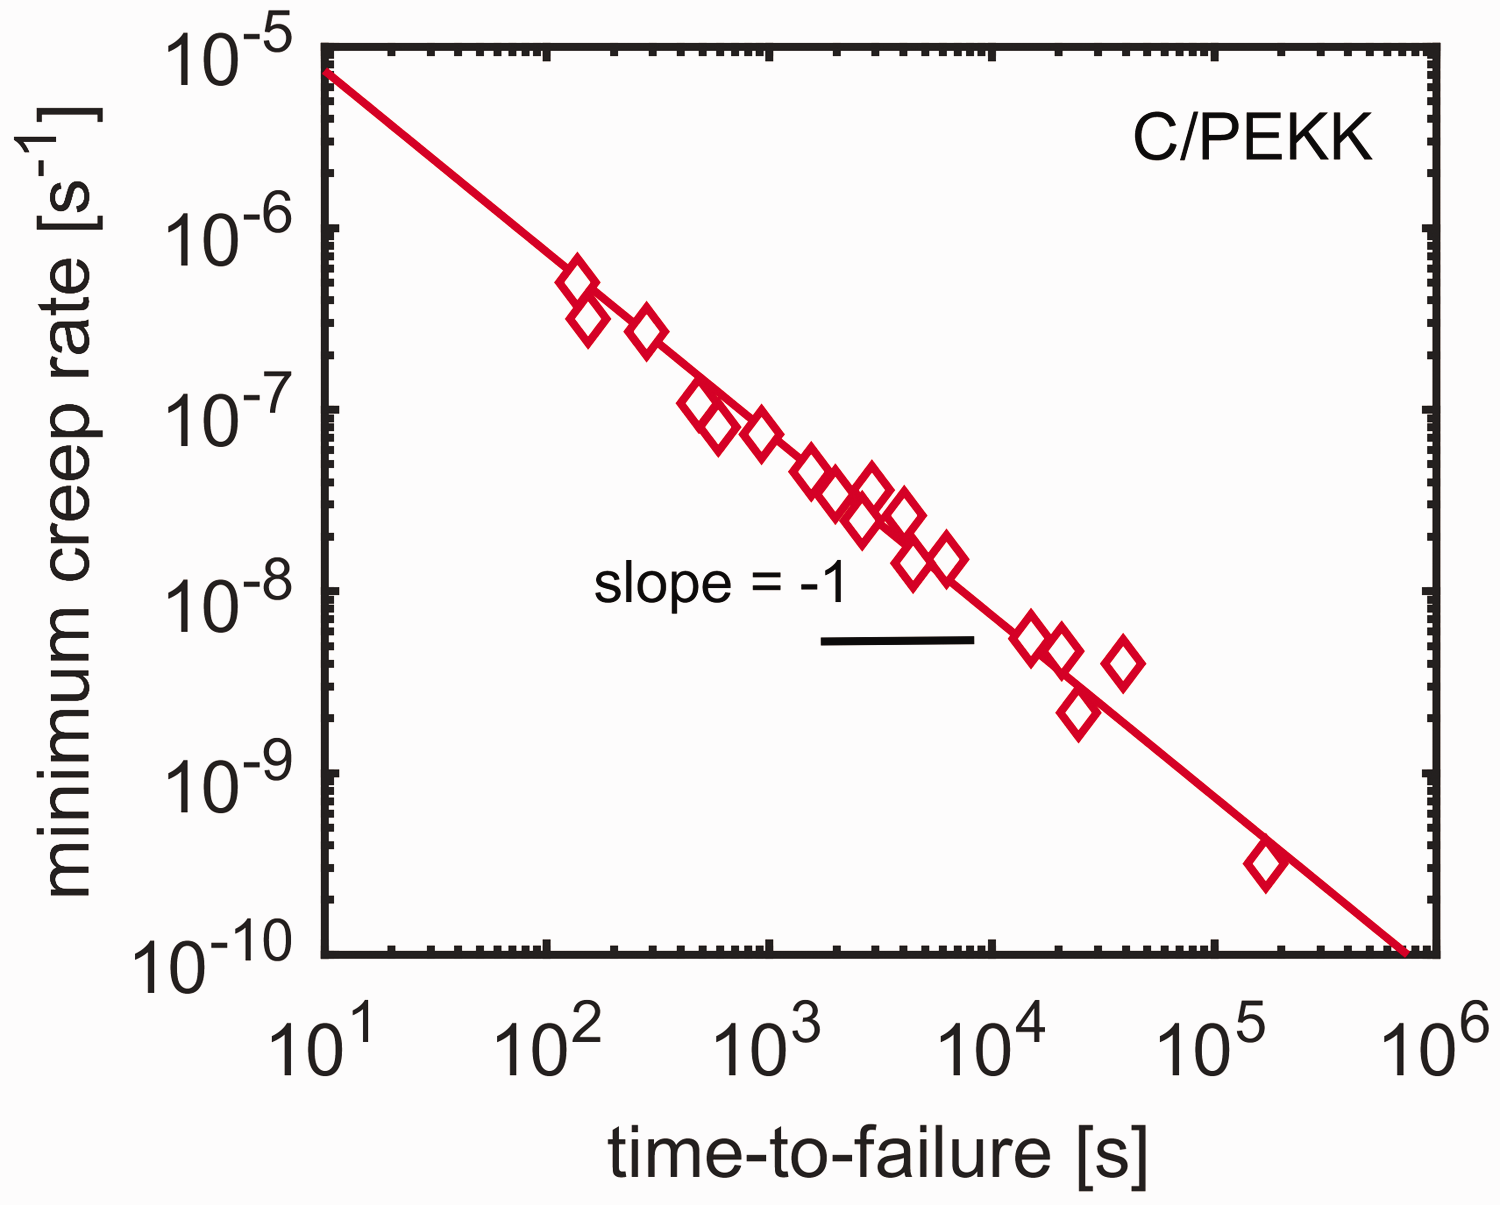
Minimum creep rate versus time-to-failure for carbon/PEKK. Markers represent experimental data and the line represents the fit with equation (5).
From Figure 18(b), it is clear that the creep lifetime data also displays a lot of scatter. Considering the experimental variability in the rate-dependent strength, however, the scatter in creep data appears to agree with the estimates following from the plasticity-controlled failure kinetics. Yet, due to the severe scatter, it is hard to give a definitive assignment of the failure mechanism. At this point, it is helpful to discuss the effect of cyclic loading on long-term failure kinetics.
Figure 20(a) presents the stress dependence of the lifetime of carbon/PEKK in cyclic loading at frequencies of 1 Hz and 10 Hz and a stress ratio R = 0.1. Figure 20(a) shows that under cyclic loading at 1 Hz, the stress dependence of time-to-failure shows a steeper slope compared to creep loading, indicating a change in the failure kinetics. Moreover, the scatter seems to be reduced, which might also suggest a different failure mechanism than in creep loading. Figure 20(a) also demonstrates that failure is accelerated by an increase in frequency, which agrees with crack growth-controlled failure. In order to investigate this further, the maximum applied stress is plotted against the number of cycles-to-failure in Figure 20(b). Similar to the observation in Figure 16 for carbon/PEEK, failure appears to be controlled by the number of cycles, rather than by time; a response that is typical for crack-growth controlled failure.
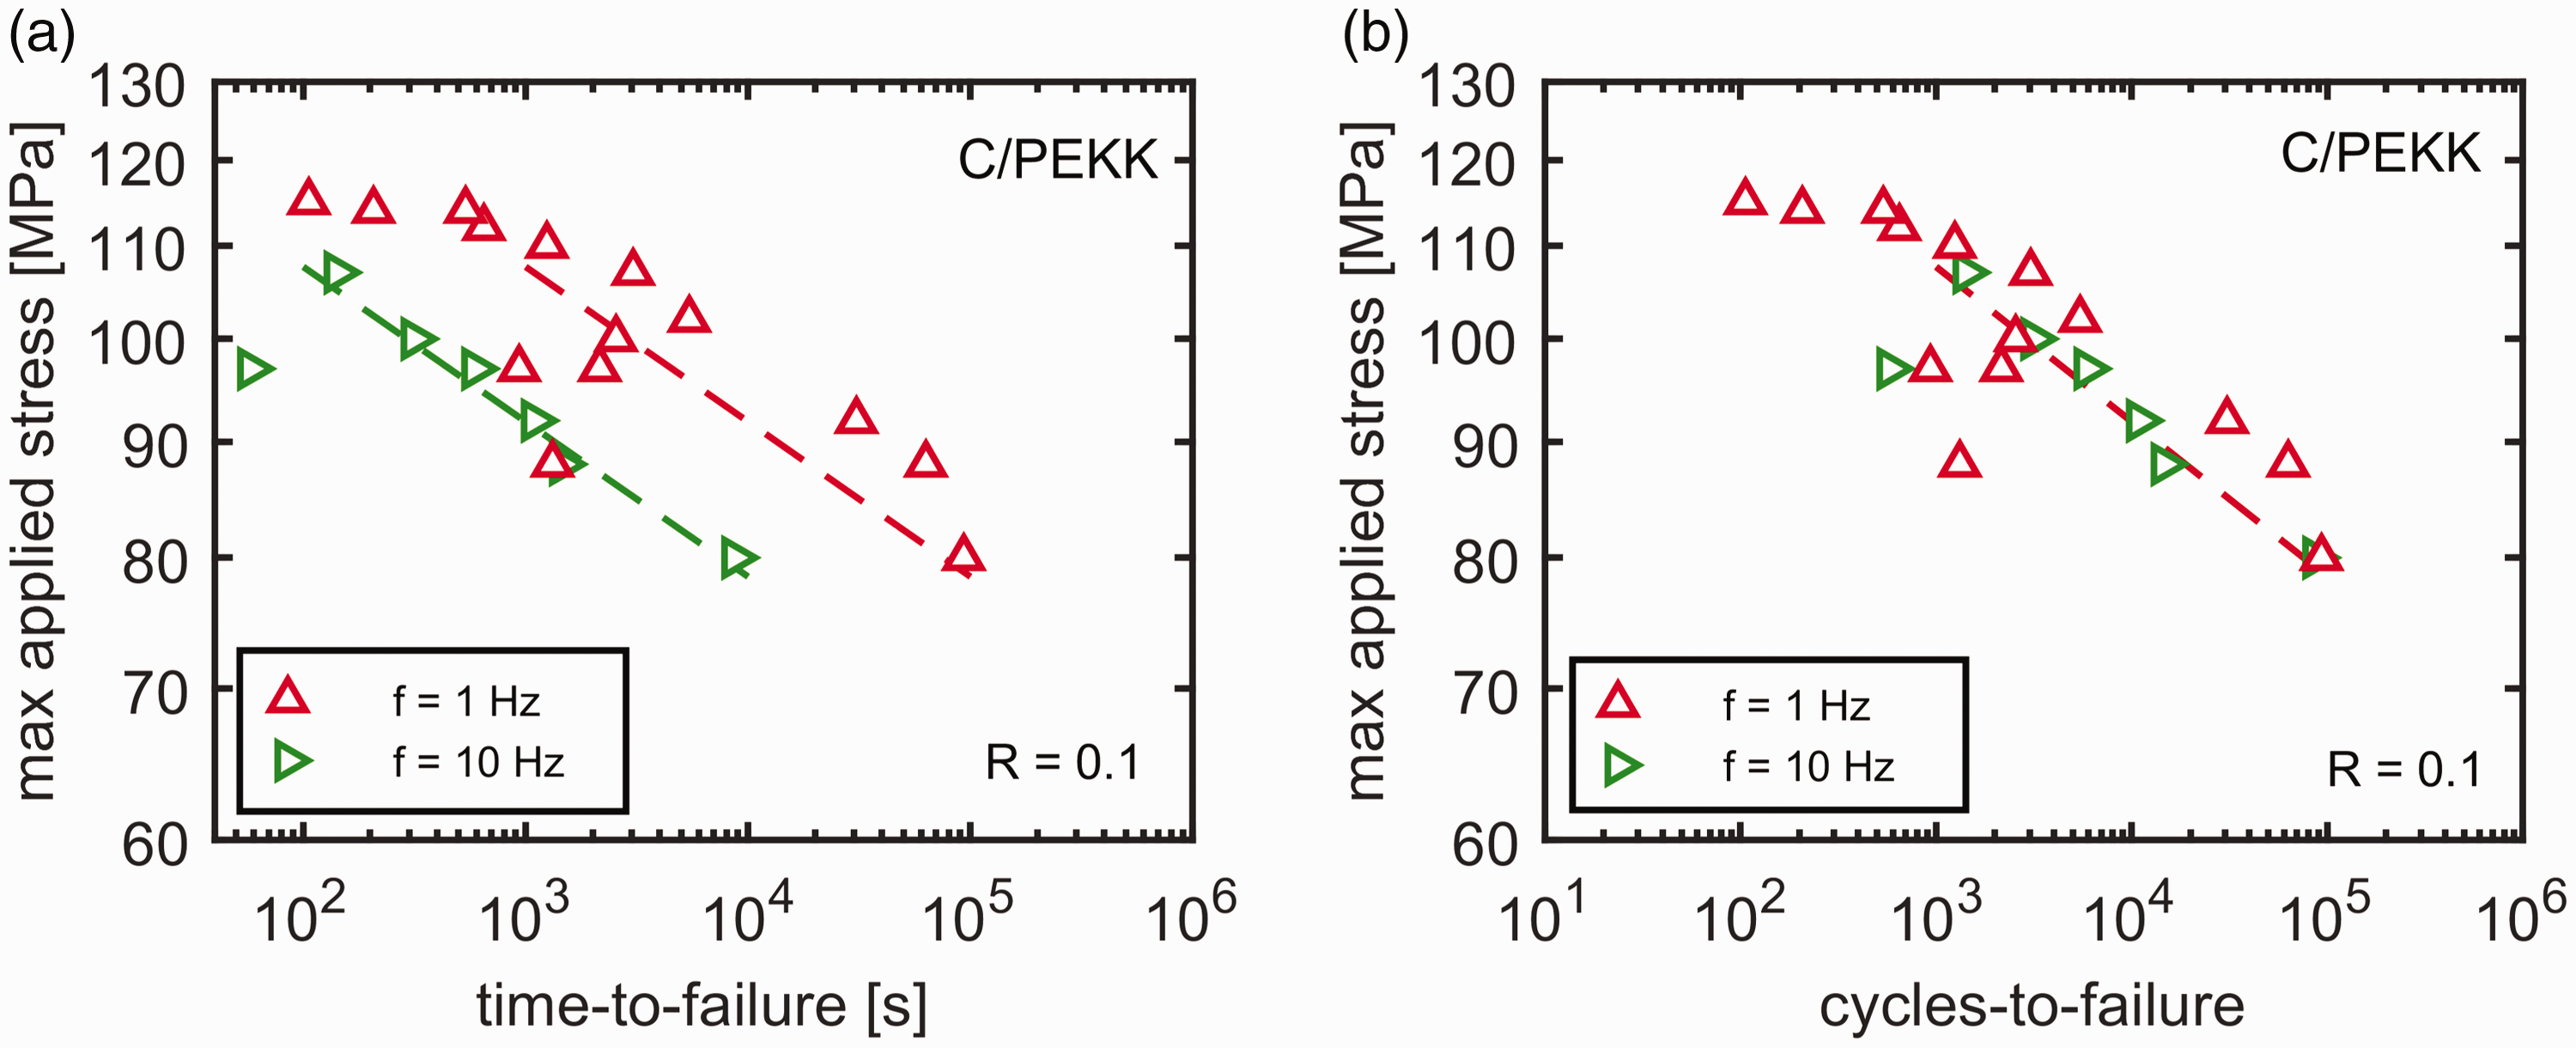
The effect of frequency on (a) time-to-failure and (b) cycles-to-failure for carbon/PEKK. The lines are guides-to-the-eye.
Conclusion
In the present work, we investigated whether the “plasticity controlled” failure mechanism, which had previously been identified for neat thermoplastics, also plays a role in the creep and fatigue behavior of transversely loaded UD composites.
The plasticity-controlled failure mechanism dominated both creep and fatigue behavior of glass/iPP over the entire load range covered. Application of creep and cyclic loading (investigating the effect of stress ratios of 1 and 0.1) and comparing the lifetime at the same maximum stress was used as a method for the identification of failure mechanisms. A decrease in the stress ratio led to an increase in the lifetime. Time-to-failure was independent of the frequency of the cyclic loading. An excellent relationship was observed between short-term constant-strain-rate tests and long-term creep and fatigue tests. This served as a method to predict the lifetime under creep and fatigue loading using short-term tests.
Nevertheless, the dominant failure mechanism was observed to be dependent on the load type and level for carbon/PEKK and carbon/PEEK. Creep failure of both materials showed indications of plasticity-controlled failure through the relationship between creep and the constant-strain-rate tests and different failure kinetics (such as the slope of stress vs time-to-failure graph) compared to fatigue behavior at lower loads. At low loads, an increase in the frequency accelerates the cyclic failure and cycles-to-failure is independent of the frequency. Thus, cyclic failure of carbon/PEEK and carbon/PEKK can be classified as crack-growth-controlled for a large load range. However, fatigue behavior at higher loads showed a clear contribution of plasticity indicated by a change in the slope of the stress vs time-to-failure graph.
Regardless of the dominant failure mechanism, the deformation was highly localized for all materials, which led to a brittle macroscopic appearance of the fracture surface.
Creep tests of all materials showed that a “critical strain”, which is independent of the magnitude of creep or fatigue loading, exists, similar to the behavior of neat thermoplastics in the plasticity-controlled regime. This is also an indication of the plasticity-dominated creep behavior of all materials we investigated. This critical strain was helpful for the prediction of the lifetime under plasticity-controlled failure conditions.
All in all, the identification of the failure mechanisms was concluded to be essential for the composites studied. Since plasticity-controlled failure is heavily influenced by parameters such as processing conditions, testing temperature, and physical aging; its identification is expected to have a high impact to account for the effect of these parameters on the characterization of creep and fatigue performance of thermoplastic composites in future studies.
Footnotes
Acknowledgements
Harald F. Janson is highly acknowledged for his experimental contributions on carbon/PEKK in scope of his M.Sc. thesis assignment.
Declaration of Conflicting Interests
The author(s) declared no potential conflicts of interest with respect to the research, authorship, and/or publication of this article.
Funding
The author(s) disclosed receipt of the following financial support for the research, authorship, and/or publication of this article: The authors would like to thank to DSM for its financial support.