
Abstract
This study presents a 3D Discrete Element Method (DEM) model for the progressive failure analysis of Carbon Fiber Reinforced Polymer (CFRP) composite materials subjected to uniaxial tensile loading. Particles in the model are packed and bonded in regular patterns (hexagonal or square). The relationship between the bond stiffness and material properties is established based on the average strain energy method. The random distribution of bond strengths calibrated from experiments with a variation of 30% and 10% following a normal distribution law is assigned to the bonds in 0∘ and 90∘ plies to capture random cracks, respectively. Tsai-Hill failure criterion is utilized for the calibration of bond strength of
Introduction
Glass or carbon fiber reinforced polymer (GFRP or CFRP) composite has been widely used in aerospace, mechanical and civil engineering for several decades, mainly due to its high stiffness-weight ratio. Besides, with proper design and optimization of the layer-up of several individual laminae, specific desired modulus and strength in different directions of the laminates can be achieved. However, due to the complexity of the physical microstructure of fiber-reinforced composite materials, the onset of damage does not cause the instantaneous failure of the entire structure, and there exists a progressive process from the damage initiation to the final structural collapse. 1 The local failure such as fiber breakage, matrix cracks, fiber-matrix debonding, and interfacial delamination, may cause some permanent loss of integrity within composite laminates, resulting in the loss of the stiffness and strength of the laminates. Therefore, understanding of the failure mechanism, prediction of the initiation and progression of the damage as well as the final maximum loads the structure can withstand is of significant importance for assessing the performance of the composite laminates and optimization of the reliable design. 2
Transverse cracking and delamination are typical damages before the final catastrophic failure when the laminate is subjected to tensile loading. Transverse cracking can be initiated from the matrix cracking and/or fiber/matrix interfacial debonding caused by the high tensile stress in 90∘ ply. Delamination is usually initiated by the shear stress concentrating between the two adjacent plies due to the different material properties of these plies, under tensile loadings or free-edge stresses. These damage processes have been studied by the researchers for many decades, theoretically, experimentally, and numerically.
Pagano et al. 3 developed an analytical model to predict the stress of the cross-ply laminates based on the assumption of steady-state cracking, subjected to the thermal and thermo-mechanical loading conditions. Meanwhile, they found that the steady-state cracking has occurred since the full-width cracks have developed. Gudmundson and Zang 4 proposed a new model to predict the thermoelastic properties of the composite laminates containing plies with transverse matrix cracks. However, this model only considered the average stress-strain relationship at given matrix crack densities, and it cannot deal with the local stress distribution at each ply. Additionally, this model did not consider the crack initiation and propagation, making the model less flexible for the different dynamic loading conditions. Kobayashi et al.5,6 conducted an analysis on the prediction of the formation of transverse crack evolution with energy release rate and average stress criteria based on Gudmundson and Zang 4 in quasi-isotropic laminates. It was found that the thickness of 90∘ plies and the modulus of adjacent plies have a significant influence on transverse cracking behavior. Okabe et al. 7 formulated an analytical model as a function of crack density based on the continuum damage mechanics for predicting the stiffness reduction of composite laminates. It was proved that the model is capable of predicting the stiffness of laminates containing damage caused by transverse cracks (or surface crack) with only mechanical properties of lamina and the lay-up configuration, and calculating the local stress distribution within a ply including transverse cracks as a function of the crack density. Wang et al. 8 proposed a model that consists of an application of fracture mechanics and a rational representation of material flaw distribution, which is a new concept of effective flaws to replace the conventional constant ply strength criterion. Onodera et al. 9 proposed a refined stress field model based on Okabe et al. 7 by considering the residual thermal strain for the prediction of the transverse crack density evolution. Ogi 10 proposed a theoretical model for predicting the transverse crack propagation within the cross-ply laminates based on a statistical distribution of microsized flaws, with an assumption that the initiation of transverse cracks only occurs through the ply thickness.
Several numerical methods have been proposed in the last decade for predicting and analyzing cracking in composites such as the finite element method (FEM)11–18 and Extended FEM (X-FEM).19–22 Within the framework of FEM, the stress distribution that is calculated to meet the failure criteria of a composite laminate is obtained by assuming that the material is not damaged, and the stress redistribution is calculated by the strain softening induced by the local damage, which is not considered in most criteria. X-FEM is very effective when dealing with cracks or even multiple cracks in homogenous isotropic materials, for which the enrichment functions are available. However, for complex composite material systems which have heterogeneous characteristics, the X-FEM can only work for some special case such as a delamination crack at a symmetric plane. 23 Besides, it is difficult for these methods to consider the interaction between different damage modes or the coupling among multiple cracks. A promising alternative numerical method called the phantom node method was proposed by Hansbo and Hansbo 24 to tackle the arbitrary cracking problem. They found that the arbitrary discontinuity in an element can be dealt with by adding an extra element on the top of that element, so that each of them can account for the stiffness and force contribution from its bisected physical domain, in which two domains are connected by linear or nonlinear springs, 24 or cohesive failure tractions. 25 The main advantage of this method is that the standard finite element shape function can be utilized within the framework of the phantom node method, rendering it completely compatible with standard FEM programs. However, adding extra elements changes the numerical model dimension dynamically, thus requiring full access to the source code, which is not always possible for commercial software. 26 In order to ease this limitation, Ling et al. 27 proposed an element, called augmented FEM (A-FEM), with double nodes dealing with the arbitrary intra-element discontinuity. Afterward, the A-FEM was successfully applied to predict the damage initiation and progression and failure prediction in the composite materials with an implementation of a subroutine in the commercial FE code ABAQUS/Explicit. 28
Apart from the FEM modeling, the discrete element method (DEM) has been introduced for modeling the damage propagation in the composite using a bond-based approach. Crack propagation in composite laminates and stress-strain curve were simulated under the transverse tensile loading by DEM in literature,29–32 which suggests the capability of the DEM model for predicting the damage initiation, propagation until the final failure strength by providing more details such as crack density and stiffness reduction, etc. However, for a test specimen subjected to tensile loading, transverse cracks are usually initiated from the free edges of the specimen, then propagate almost instantaneously through the full width of the specimen in the case of monotonic loading. 33 Thus, two dimensional DEM models are not capable of capturing the damage propagation in width direction, and three-dimensional models is more attractive when it comes to the damage propagation in any direction. Recently, a 3D DEM model was proposed by Maheo et al. 34 to demonstrate its ability to capture the damage propagation in composite without any preset paths. This model was then improved by implementing a cohesive contact model for modeling the interfacial delamination of composite materials. 35 However, it is still difficult to model the angle-ply damage propagation with their current 3D DEM model due to its geometry limitation.
In the authors’ previous work, DEM models have been developed to study the progressive failure in single fiber composite, 36 FRP laminae 29 as well as FRP cross-ply laminates. 32 In their latest research, 37 the authors were able to validate a 3D DEM model by the classical lamination theory and FEM for its elasticity, showing its capability of modeling the lamina, cross-ply and angle-ply laminates. This study expands upon the previous work by extending the developed 3D DEM model to analyze the damage initiation and progression in cross-ply laminates and QI composite laminates with an open hole. Firstly, the 3D DEM model was built up by combining different particle arrangement techniques for separate angle plies. The strength of the parallel bonds in different plies was calibrated from experiments and the Tsai-Hill failure criterion. Then case studies were performed to demonstrate the progression of transverse cracking and delamination in cross-ply and QI CFRP composite laminates with comparisons to experimental measurements and observations.
3D DEM modeling methodology
As reported in our previous work,
37
the extended 2D DEM model is capable of modeling the elasticity of the general anisotropic materials. The detailed theory of DEM, parallel bond model and particle packing strategies, used in the present 3D DEM models, can be found in literature.37,38 In contrast to previous studies, the damage process of a composite laminate is taken into consideration by means of the breakage of bonds. For simplicity and convenience, both of the bonds within a lamina and at the interface between different layers are modeled by the linear parallel bonds. The constitutive behavior of the parallel bond at contact is illustrated in Figure 1. It can be seen in Figure 1 that the mechanical behavior of the parallel bond is linearly elastic up to its tensile and shear strengths (σmax and τmax). Beyond which, bond breakage occurs, resulting in a sharp decrease of the stiffness and, consequently, the force. The maximum normal stress and shear stress can be determined by
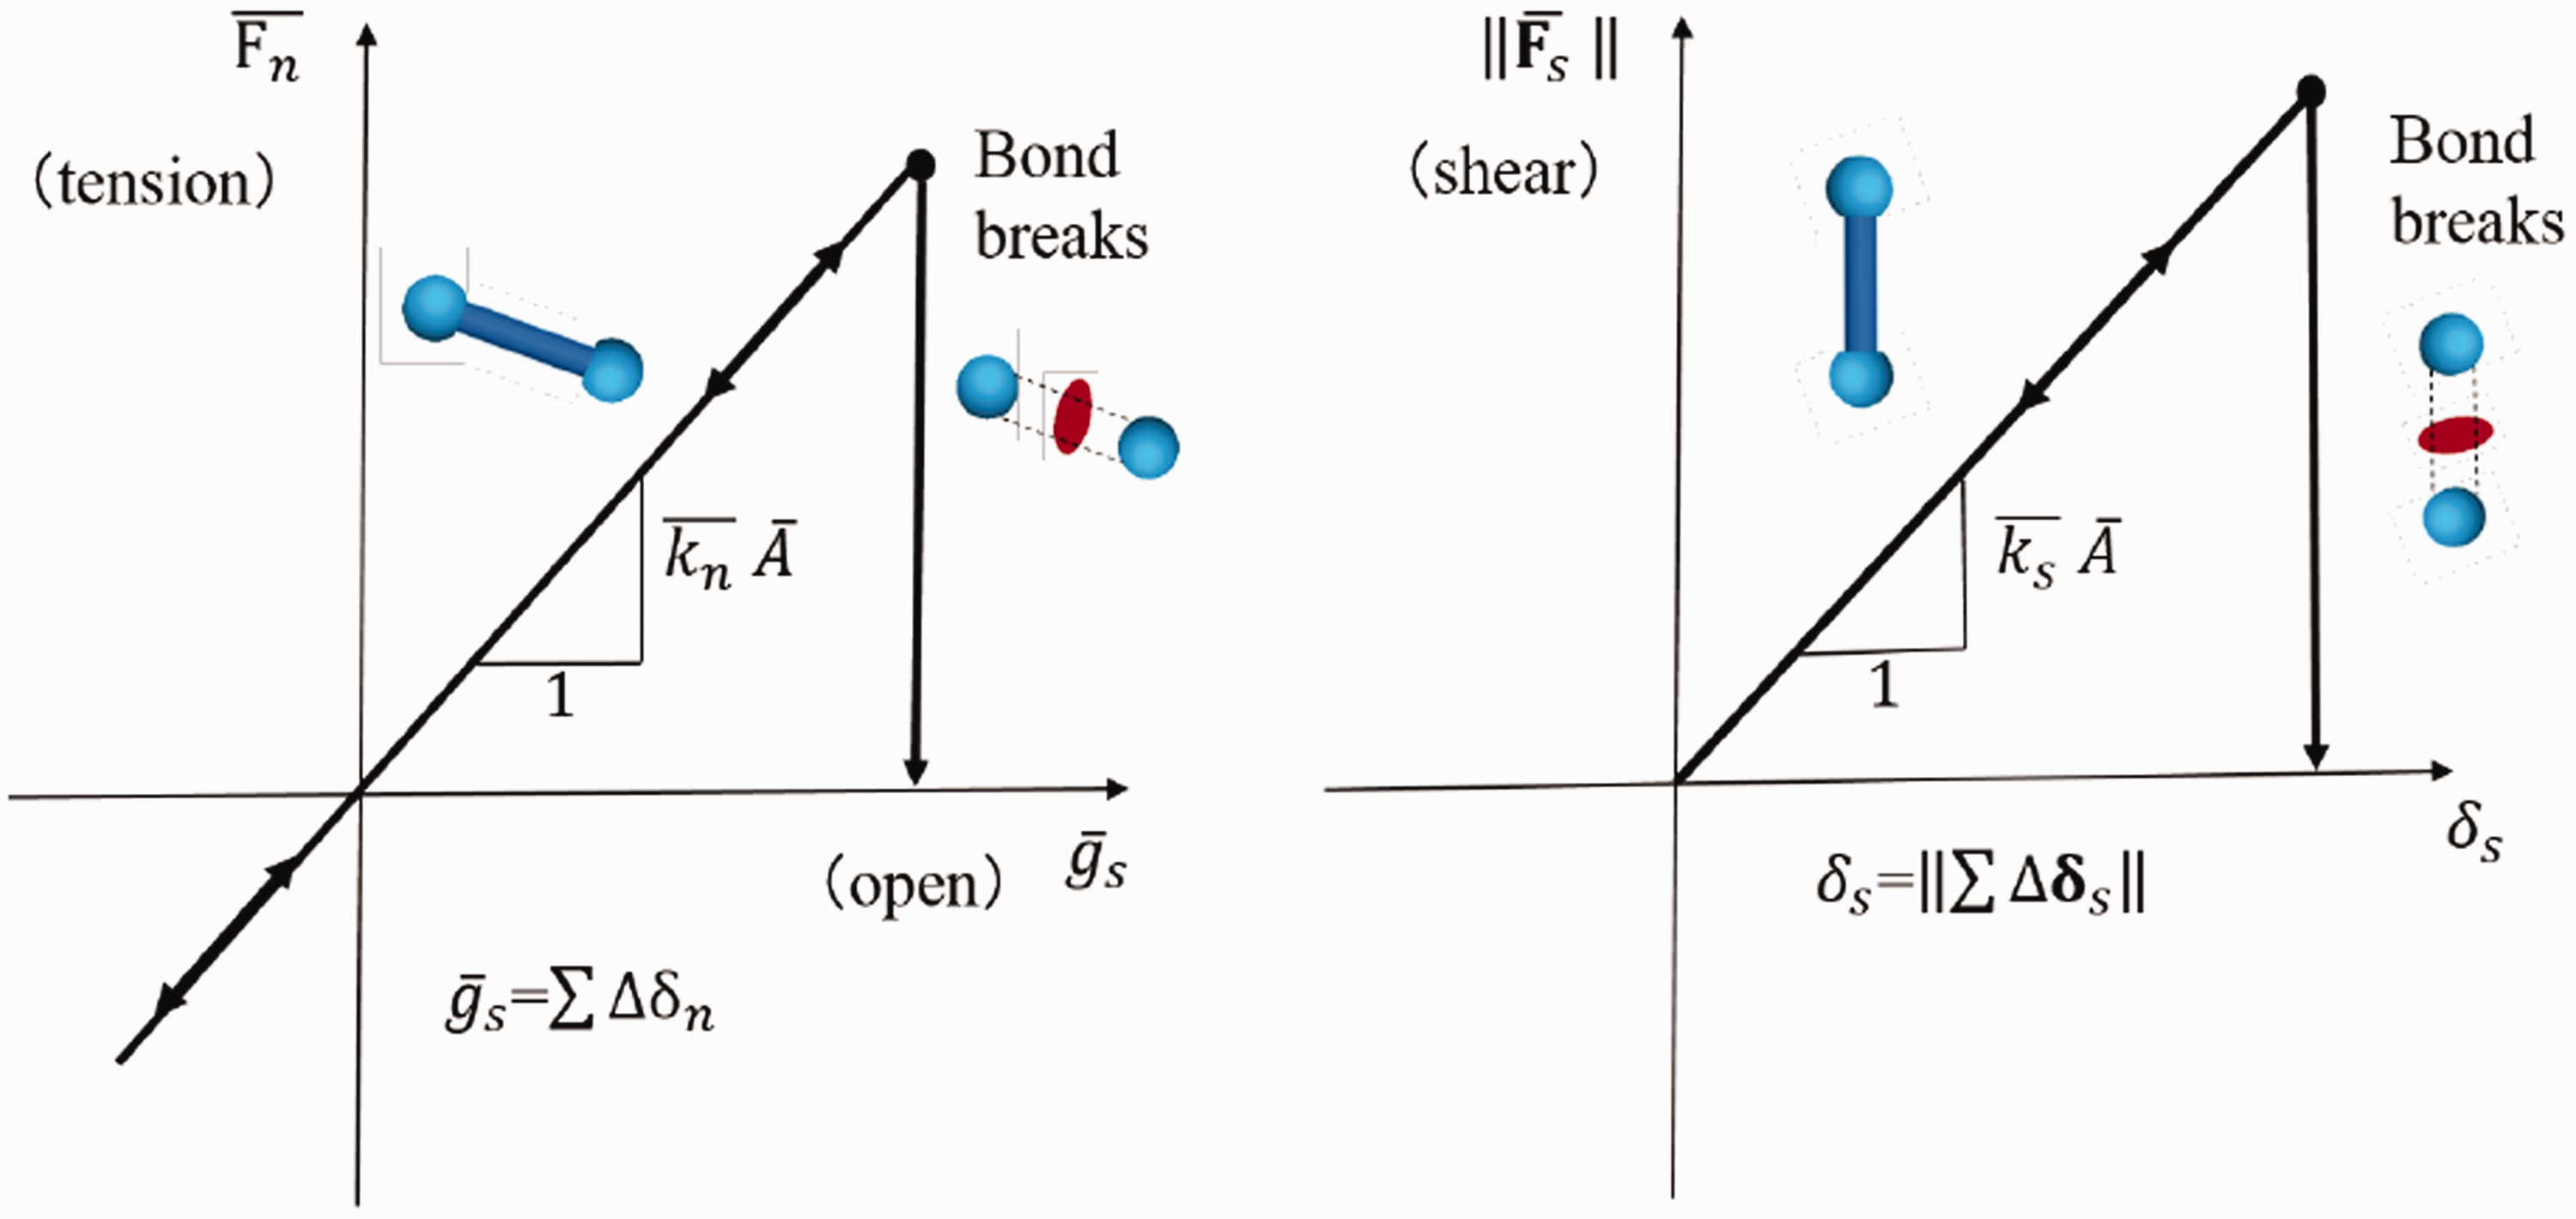
Constitutive behavior of the parallel bond.
In DEM models, particles can bond together at contacts and separate when the bond strength or energy is exceeded. Thus, it is capable of simulating the motion of individual particles and the behavior of bulk material assembled randomly or regularly with particles through bonds at contacts using specific constitutive laws. Different from the traditional solutions, which are based on the strain and stress concepts, contact properties are the predominant parameters in a DEM model, together with the geometry parameters of the particles. Subject to external loading, when the strength or the fracture energy of a bond between particles is exceeded, the bond breaks. Hence, damage modes and their interactions emanate during the process of debonding of particles. The way that DEM discretizes the material domain provides an alternative to tackle the discontinuity problems, such as crack tip singularities and crack formulation criteria in the damage/failure prediction of composite materials, thanks to its naturally discontinuous representation of composite materials using assembling particles in different strategies. 32
Modeling 0∘-,
-,
- and 90∘-ply lamina
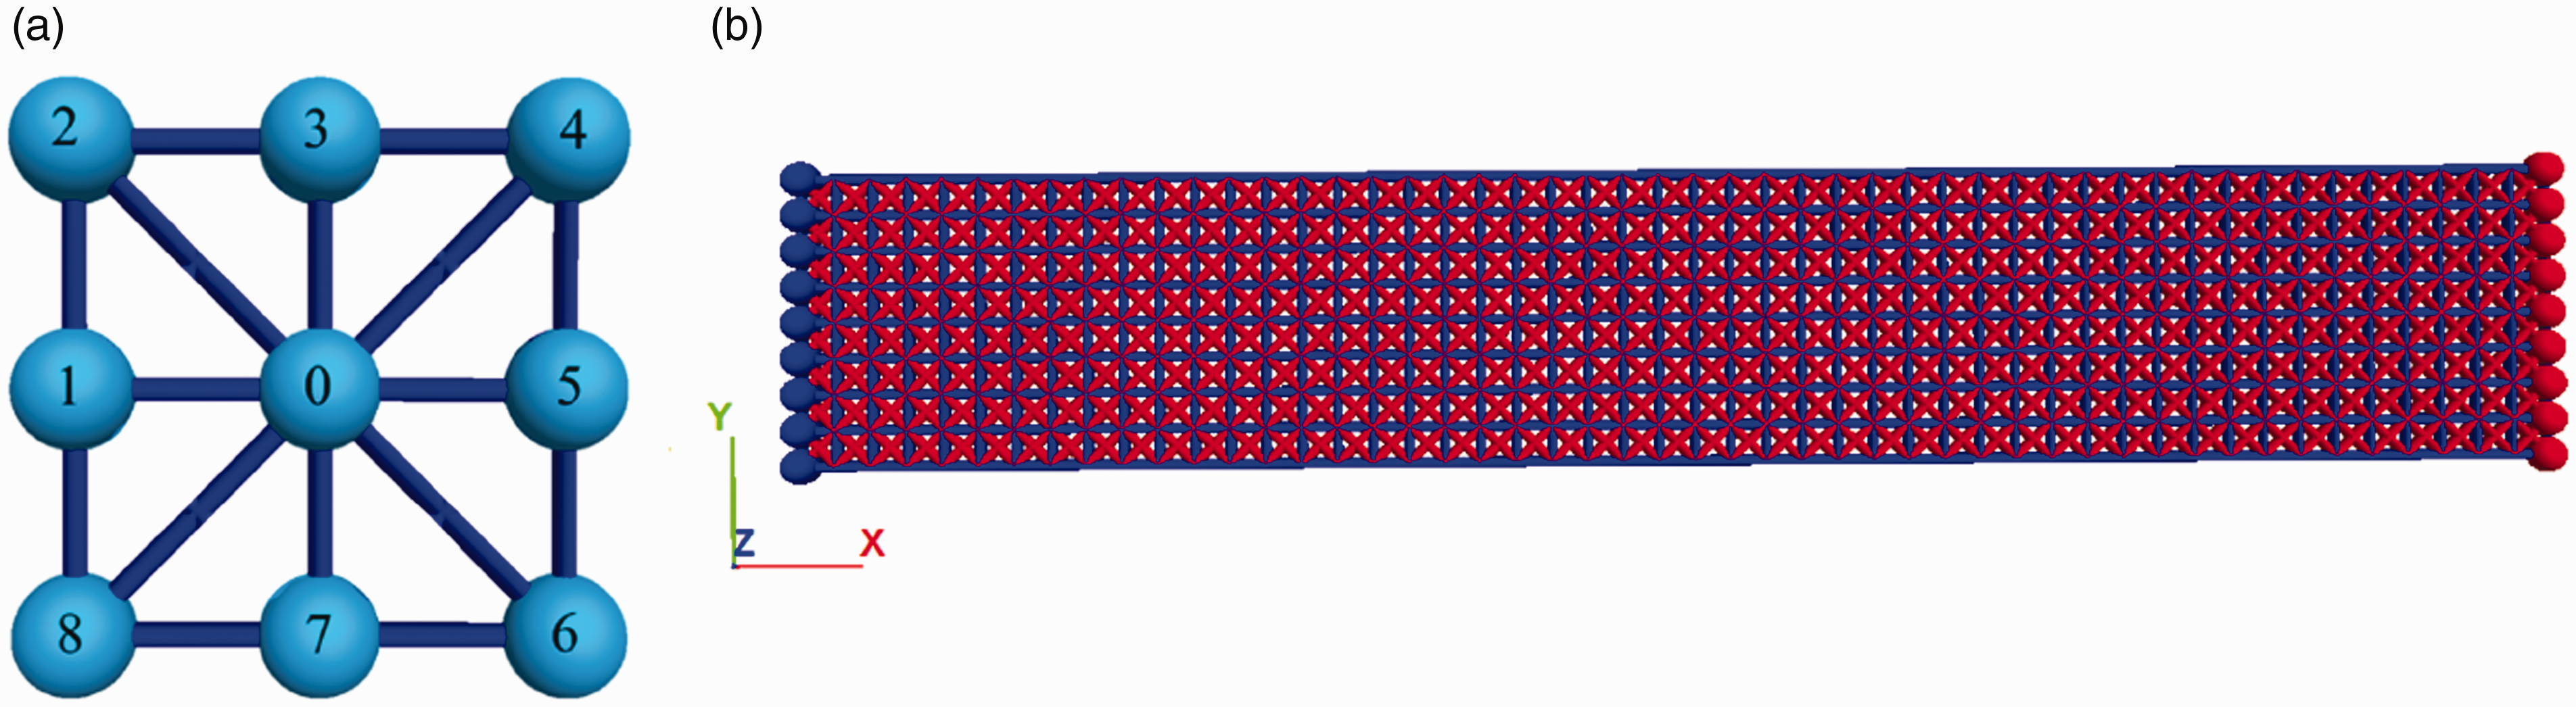
In the extended 2D DEM model, a lamina is modeled as a unidirectionally reinforced composite lamina by assuming a plane stress state with a six-spring hexagonal packing as a base unit, shown in Figure 2. Figure 2(a) and (b) represent the base unit for 0∘, 60∘ plies and 30∘, 90∘ plies, respectively. Noting that due to the limitation of the hexagonal geometry, the base unit of 90∘ and 30∘ plies can be obtained from a rotation of 90 degree of 0∘ and 60∘ base units to make sure there are bonds locating at the targeted angle plies. The constructed lamina from these base units can be found in Figure 3, in which the particles are hidden except at the boundaries, and red and blue bonds represent the fiber and matrix bonds, respectively. Here the parallel bonds aligned with the fiber direction are called fiber bonds and all others bonds matrix bonds. It is important to emphasize that the fiber bond elastic properties are not matched to the actual fiber properties but are determined by the average strain energy method based on the experimental elastic properties of the composite lamina along the fiber direction. The same is true for the matrix bonds. The strengths of these bonds are calibrated based on the experimental tensile strengths of 0∘ and 90∘ ply laminae.
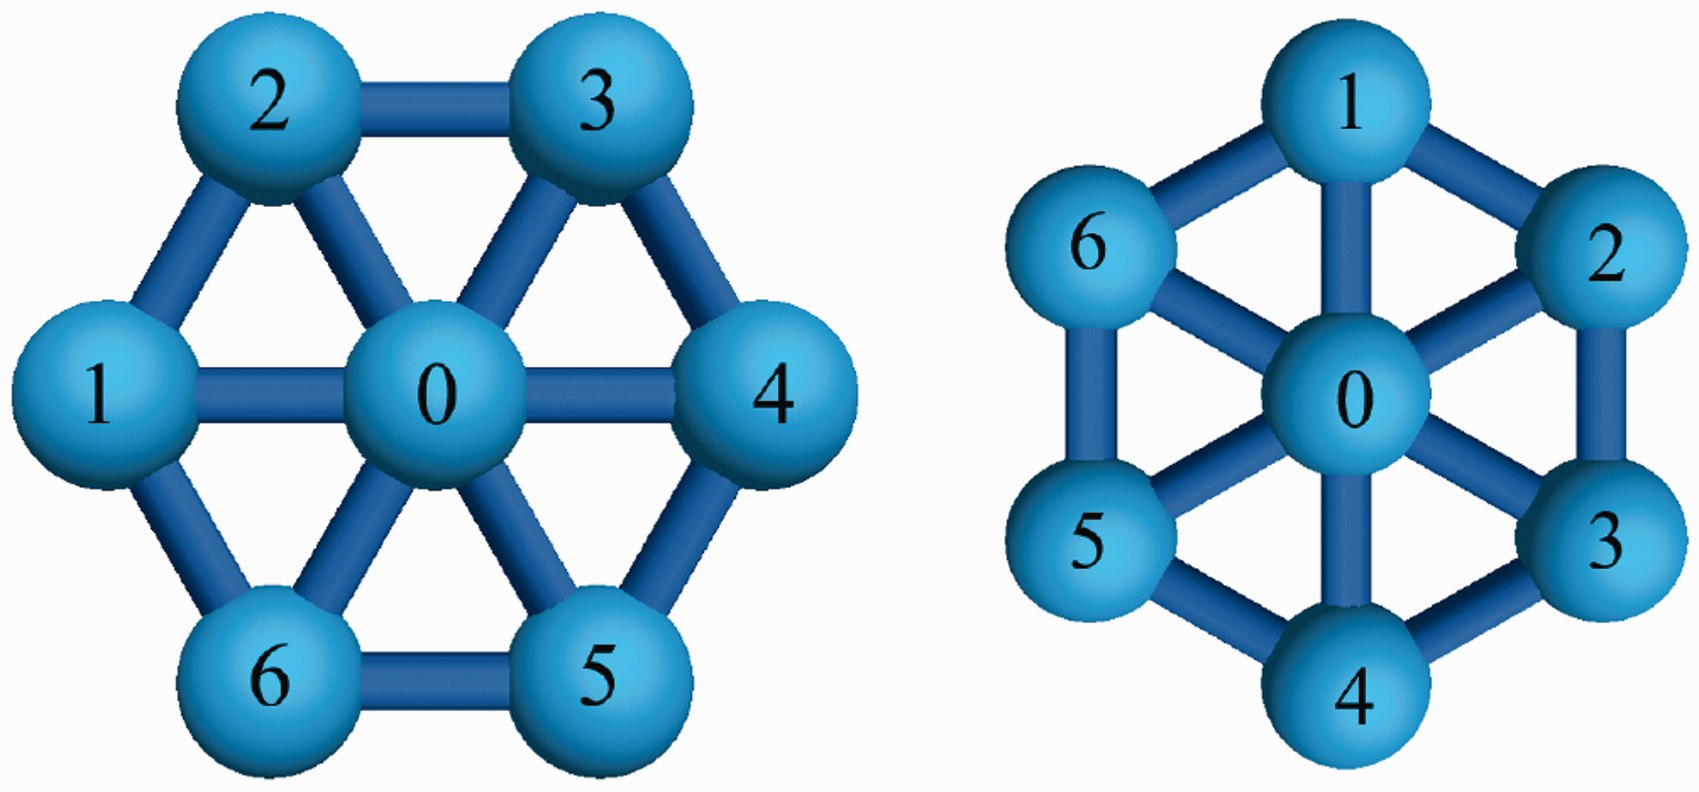
Basic unit of the hexagonal packing for the composite lamina. (For interpretation the diameter of particles is reduced to half of their original ones.).
Extended 2D hexagonal DEM model of composite lamina. (Particles are hidden except the ones of left and right boundaries with different colours; bonds with different colors represent different stiffnesses.). 37 (a) 0 ply, (b) 30 ply, (c) 60 ply and (d) 90 ply.
Each contact between the two particles is modeled with a linear parallel bond, represented by a set of elastic springs with constant normal stiffness kn and shear stiffness ks, respectively. For the sake of better visualization of the relation between particles and bonds, the diameter of particles is reduced to half of their original ones. The diameter of particles can be determined by dividing the thickness of laminates by the number of layers, while the numbers of particles in length and width directions can be calculated by dividing the length and width by the particle diameter, respectively. The relationship between the spring constants and elastic constants is established according to the average strain energy method.
39
Therefore, these spring constants can be related to the macro-scale elastic properties of the material, such as Young’s Modulus and Poisson’s ratio. In this approach, a general formula, which is based on the unit of Figure 2(a) for 0∘ and 60∘ plies, was adopted from the Liu and Liu
39
with average strain energy method for anisotropic materials, as follows:
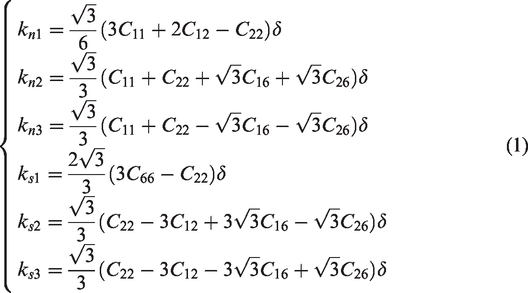
The reduced stiffness matrix of the material can be obtained by the Young’s Modulus and Poisson’s ratios within the plane stress state when
For the 30∘ and 90∘ plies shown in Figure 2(b), the x and y axials in the original coordinate, E1 and E2, and ν12 and ν21 need to be exchanged with each other to obtain the bond normal and tangential stiffnesses. 37
Modeling of
-ply lamina
Regular square packing is successfully applied to generate the model of
Extended 2D square DEM model of
3D DEM models for cross-ply and QI CFRP composite laminates
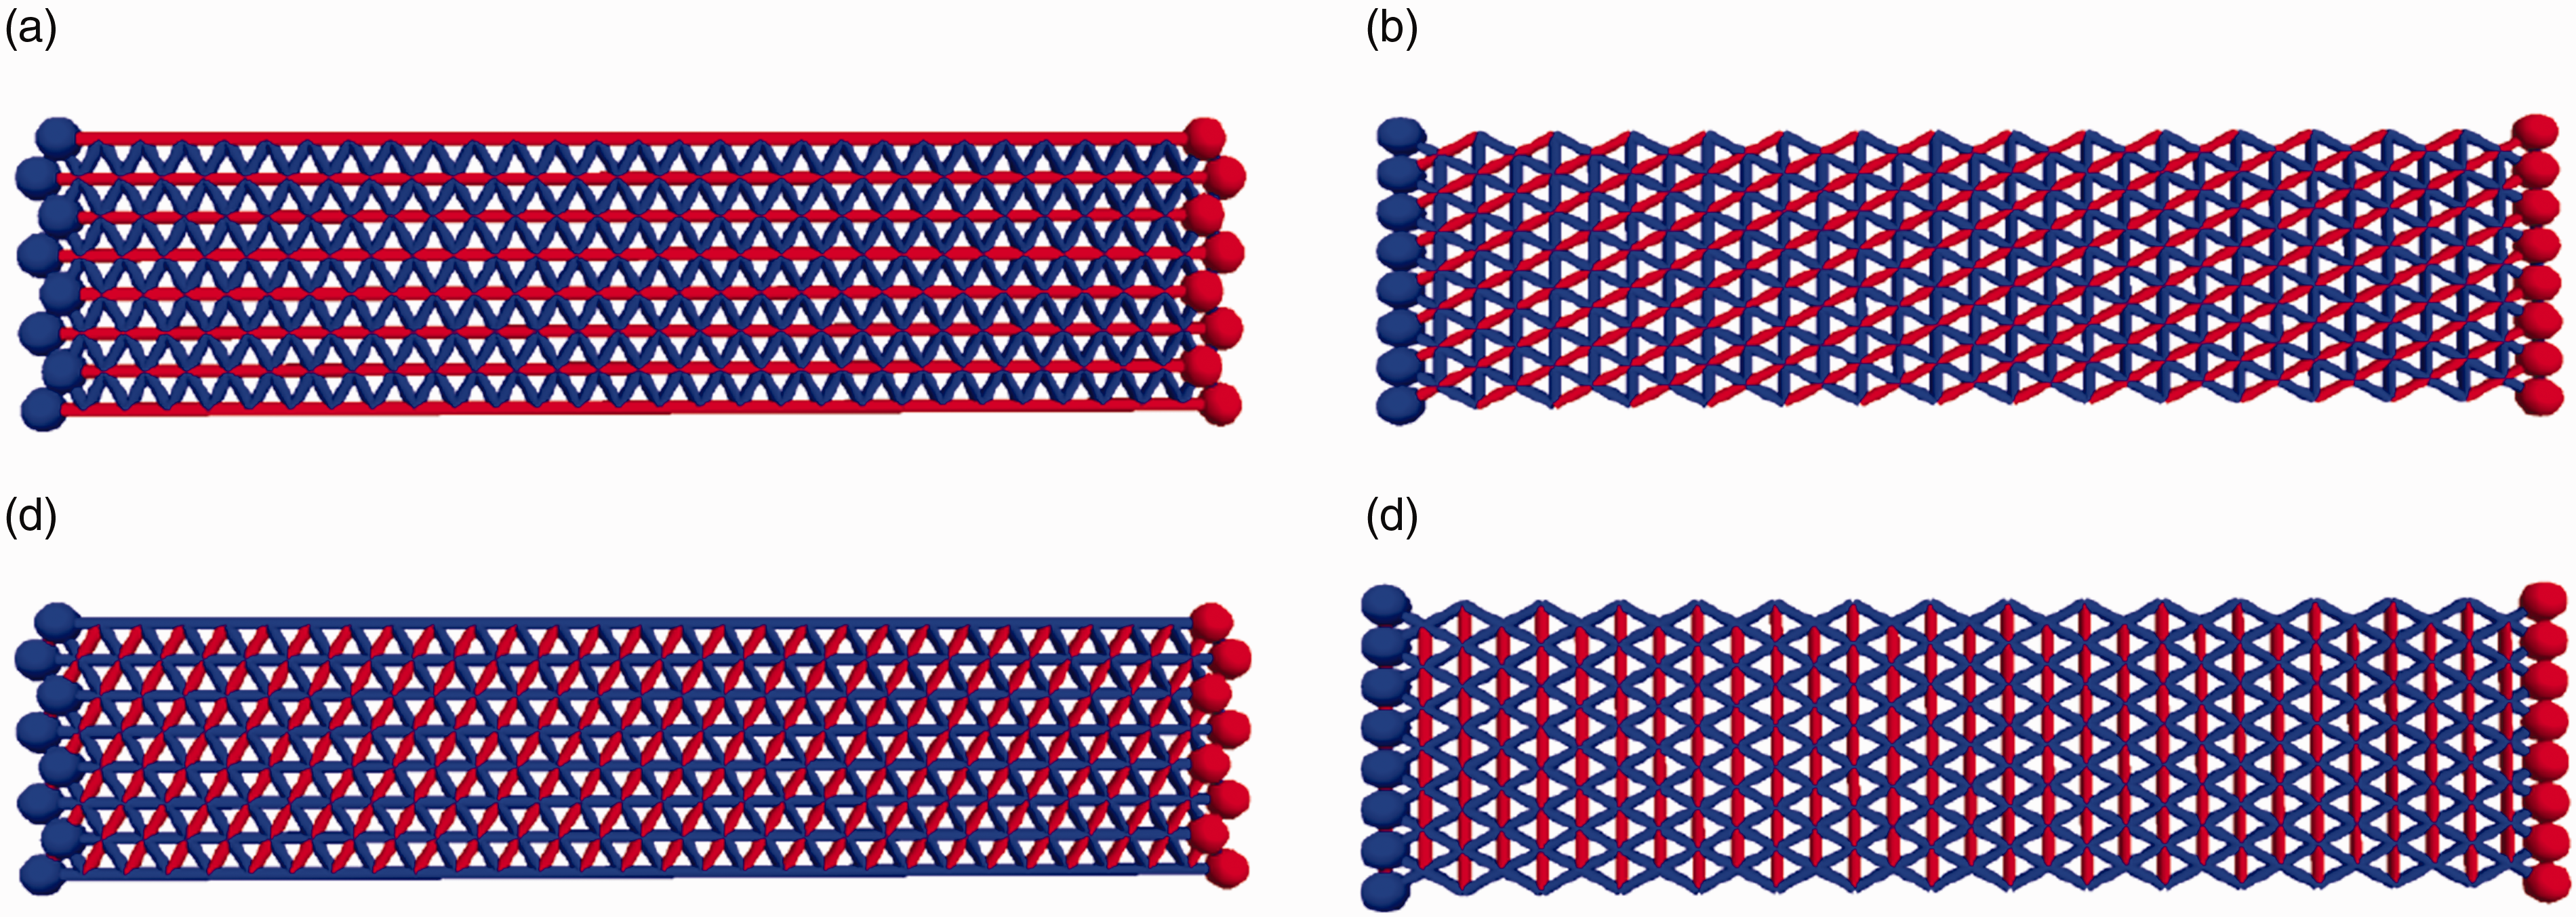
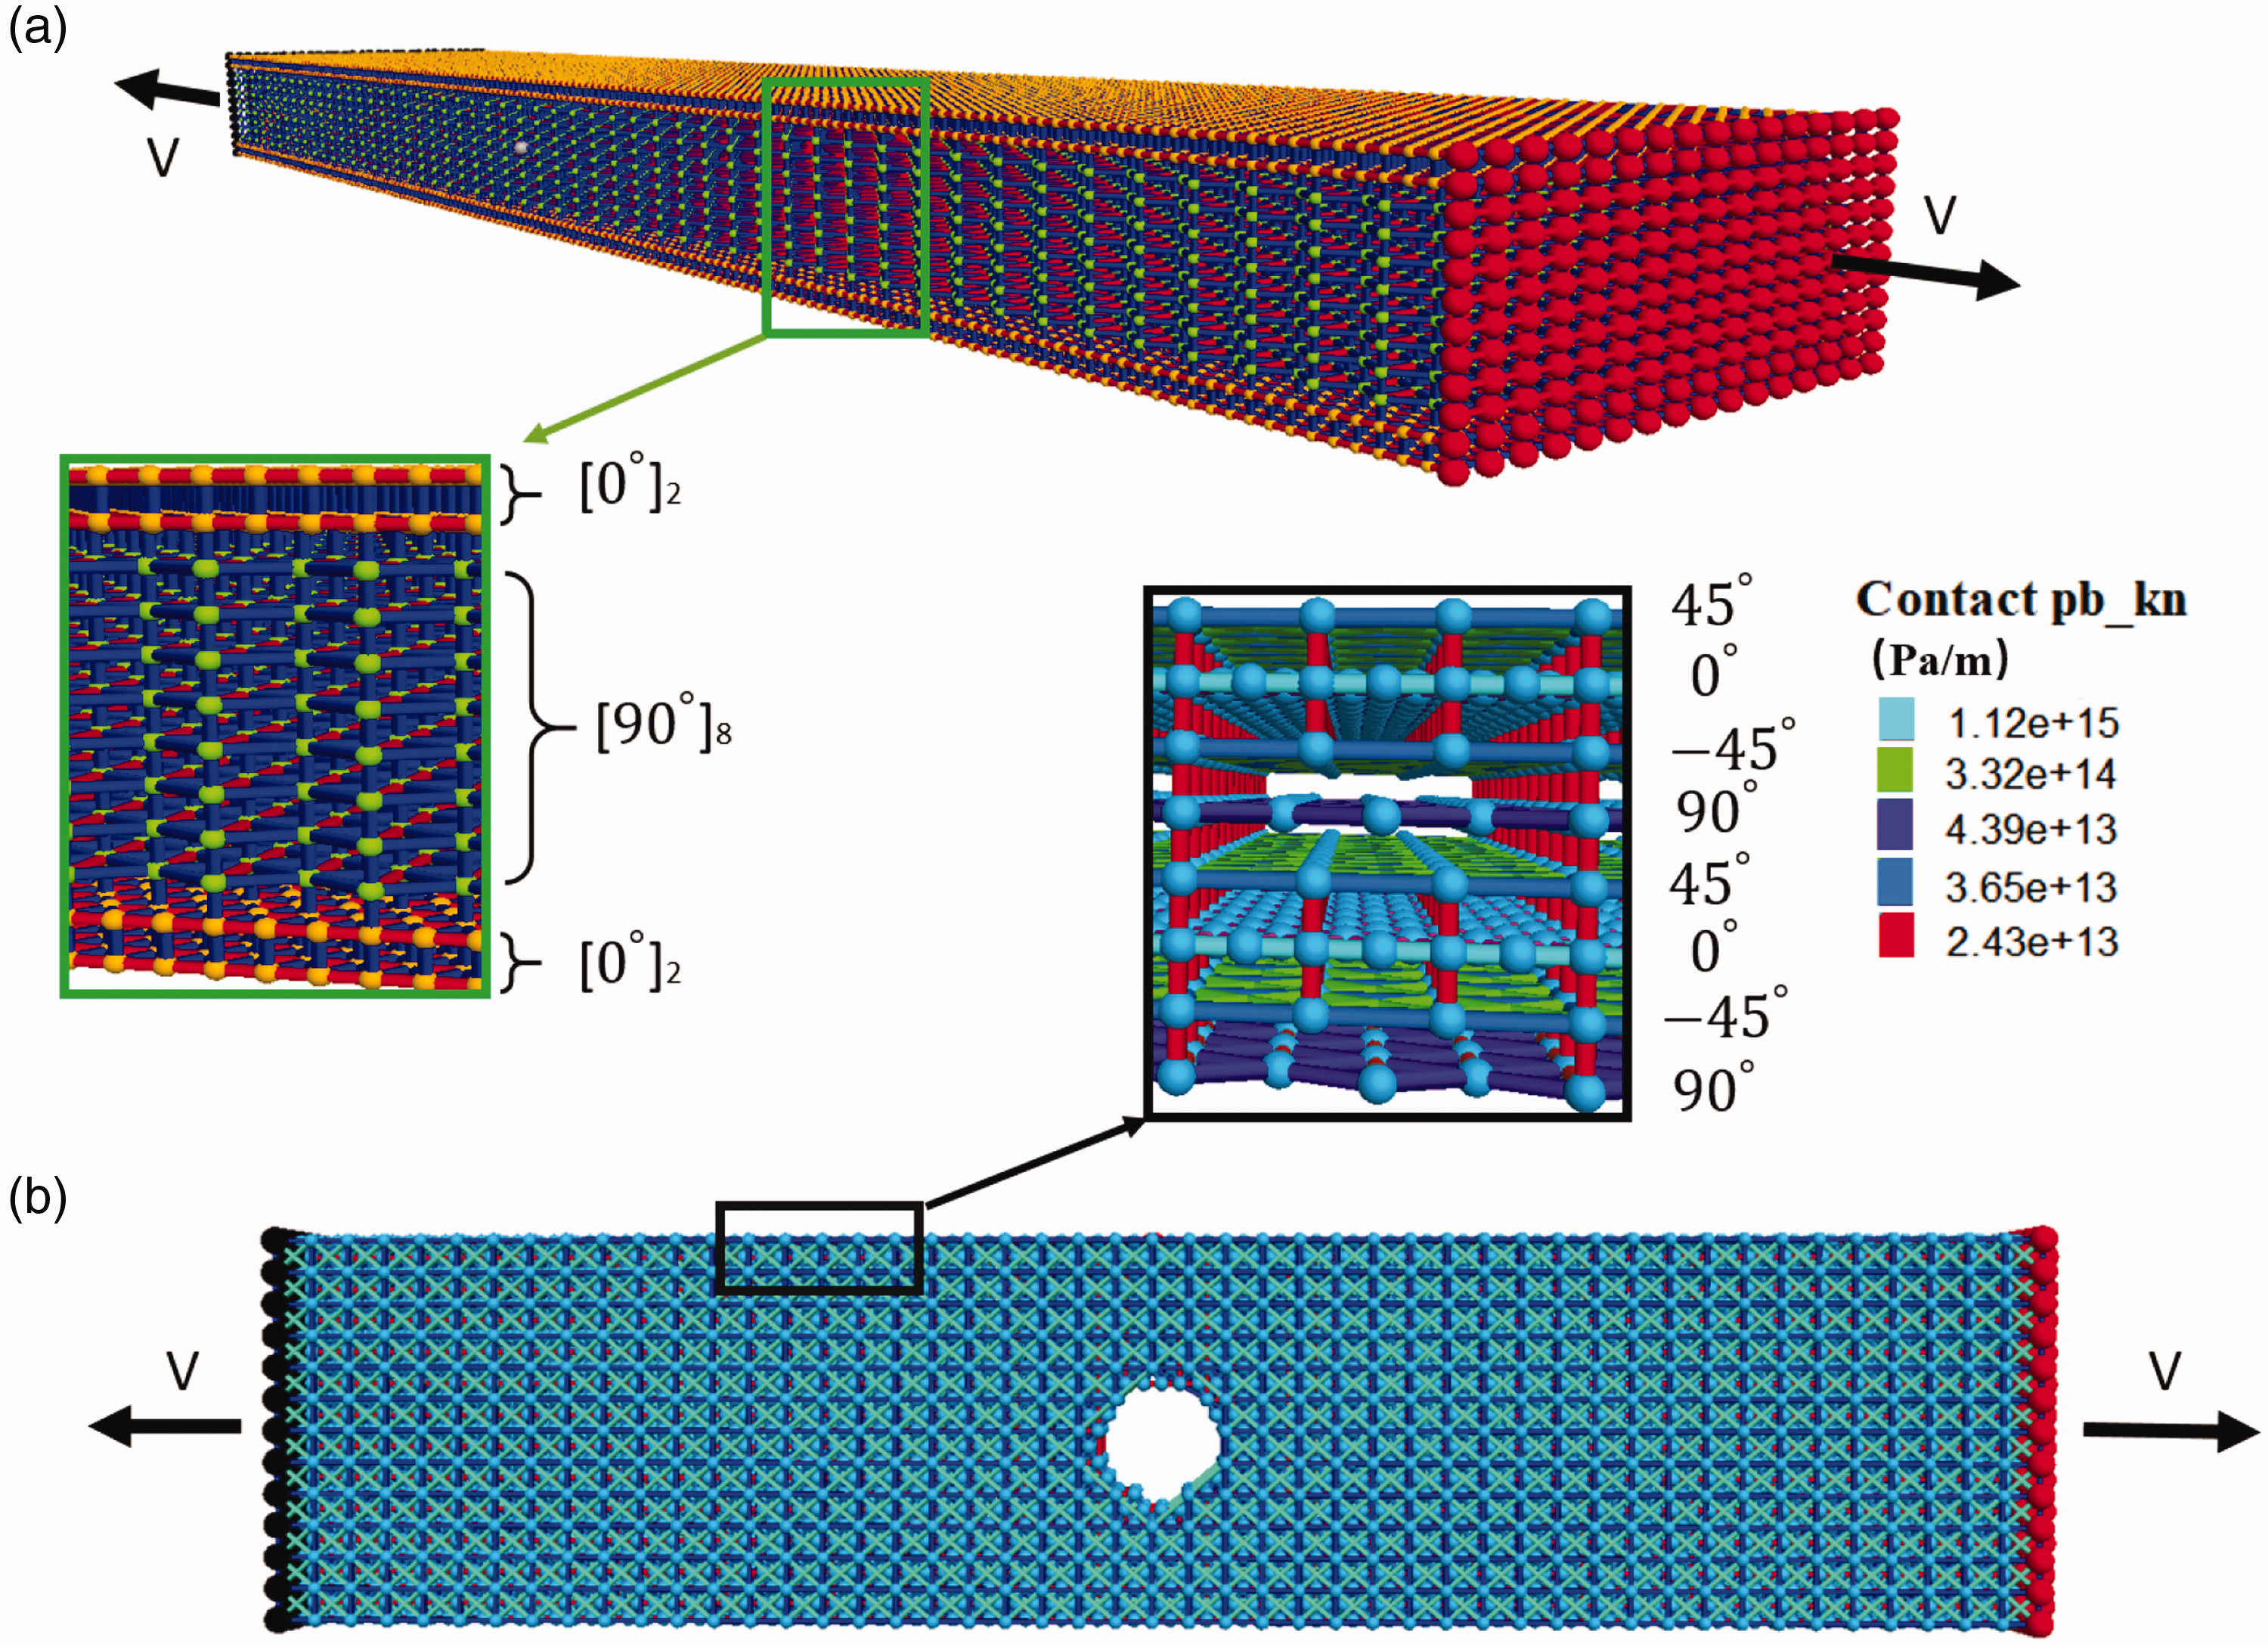
Two experimental cases, one cross-ply laminates and one QI composite laminates with an open hole, were selected to validate and compare with the 3D DEM models in terms of cross-ply and angle-ply CFRP composite laminates. A carbon/epoxy composite material named Hexcel M21/T800 with a stacking sequence of
When considering the damage progression of transverse cracking of composites, the strength distribution of the bonds with 90∘ plies should be taken into consideration. The accumulation of the transverse cracking results from their inherent defects such as microcracks, voids, areas of high fiber volume fraction, etc. causing the transverse layer to have a statistical distribution of strength along its length.
42
Thus, the random distribution of strength with a variation of 30% following a normal distribution law
42
was assigned in the 90∘ plies, while a variation of 10% was used in the strength distribution of bonds within 0∘ plies. A random generator was used in the DEM code PFC v5.30 to obtain the random numbers ranging within
3D DEM model for: (a)
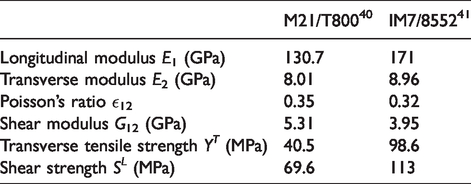
The generation of each new crack can be captured when a bond breaks and various information can be recorded to evaluate the performance of the laminates during this loading process, such as crack density along the length (including the cracks in the 90∘ plies), the stress distribution of each ply, the stress-strain curve, the crack density-strain curve and the longitudinal Young’s modulus. The procedure is cycled until a given elongation is reached. The schematic diagram of the procedure is shown in Figure 6. In this model, the interfaces between different layers are modeled with the parallel bond model. The material properties of the unidirectional carbon fiber reinforced epoxy composite laminae can be found in Table 1.
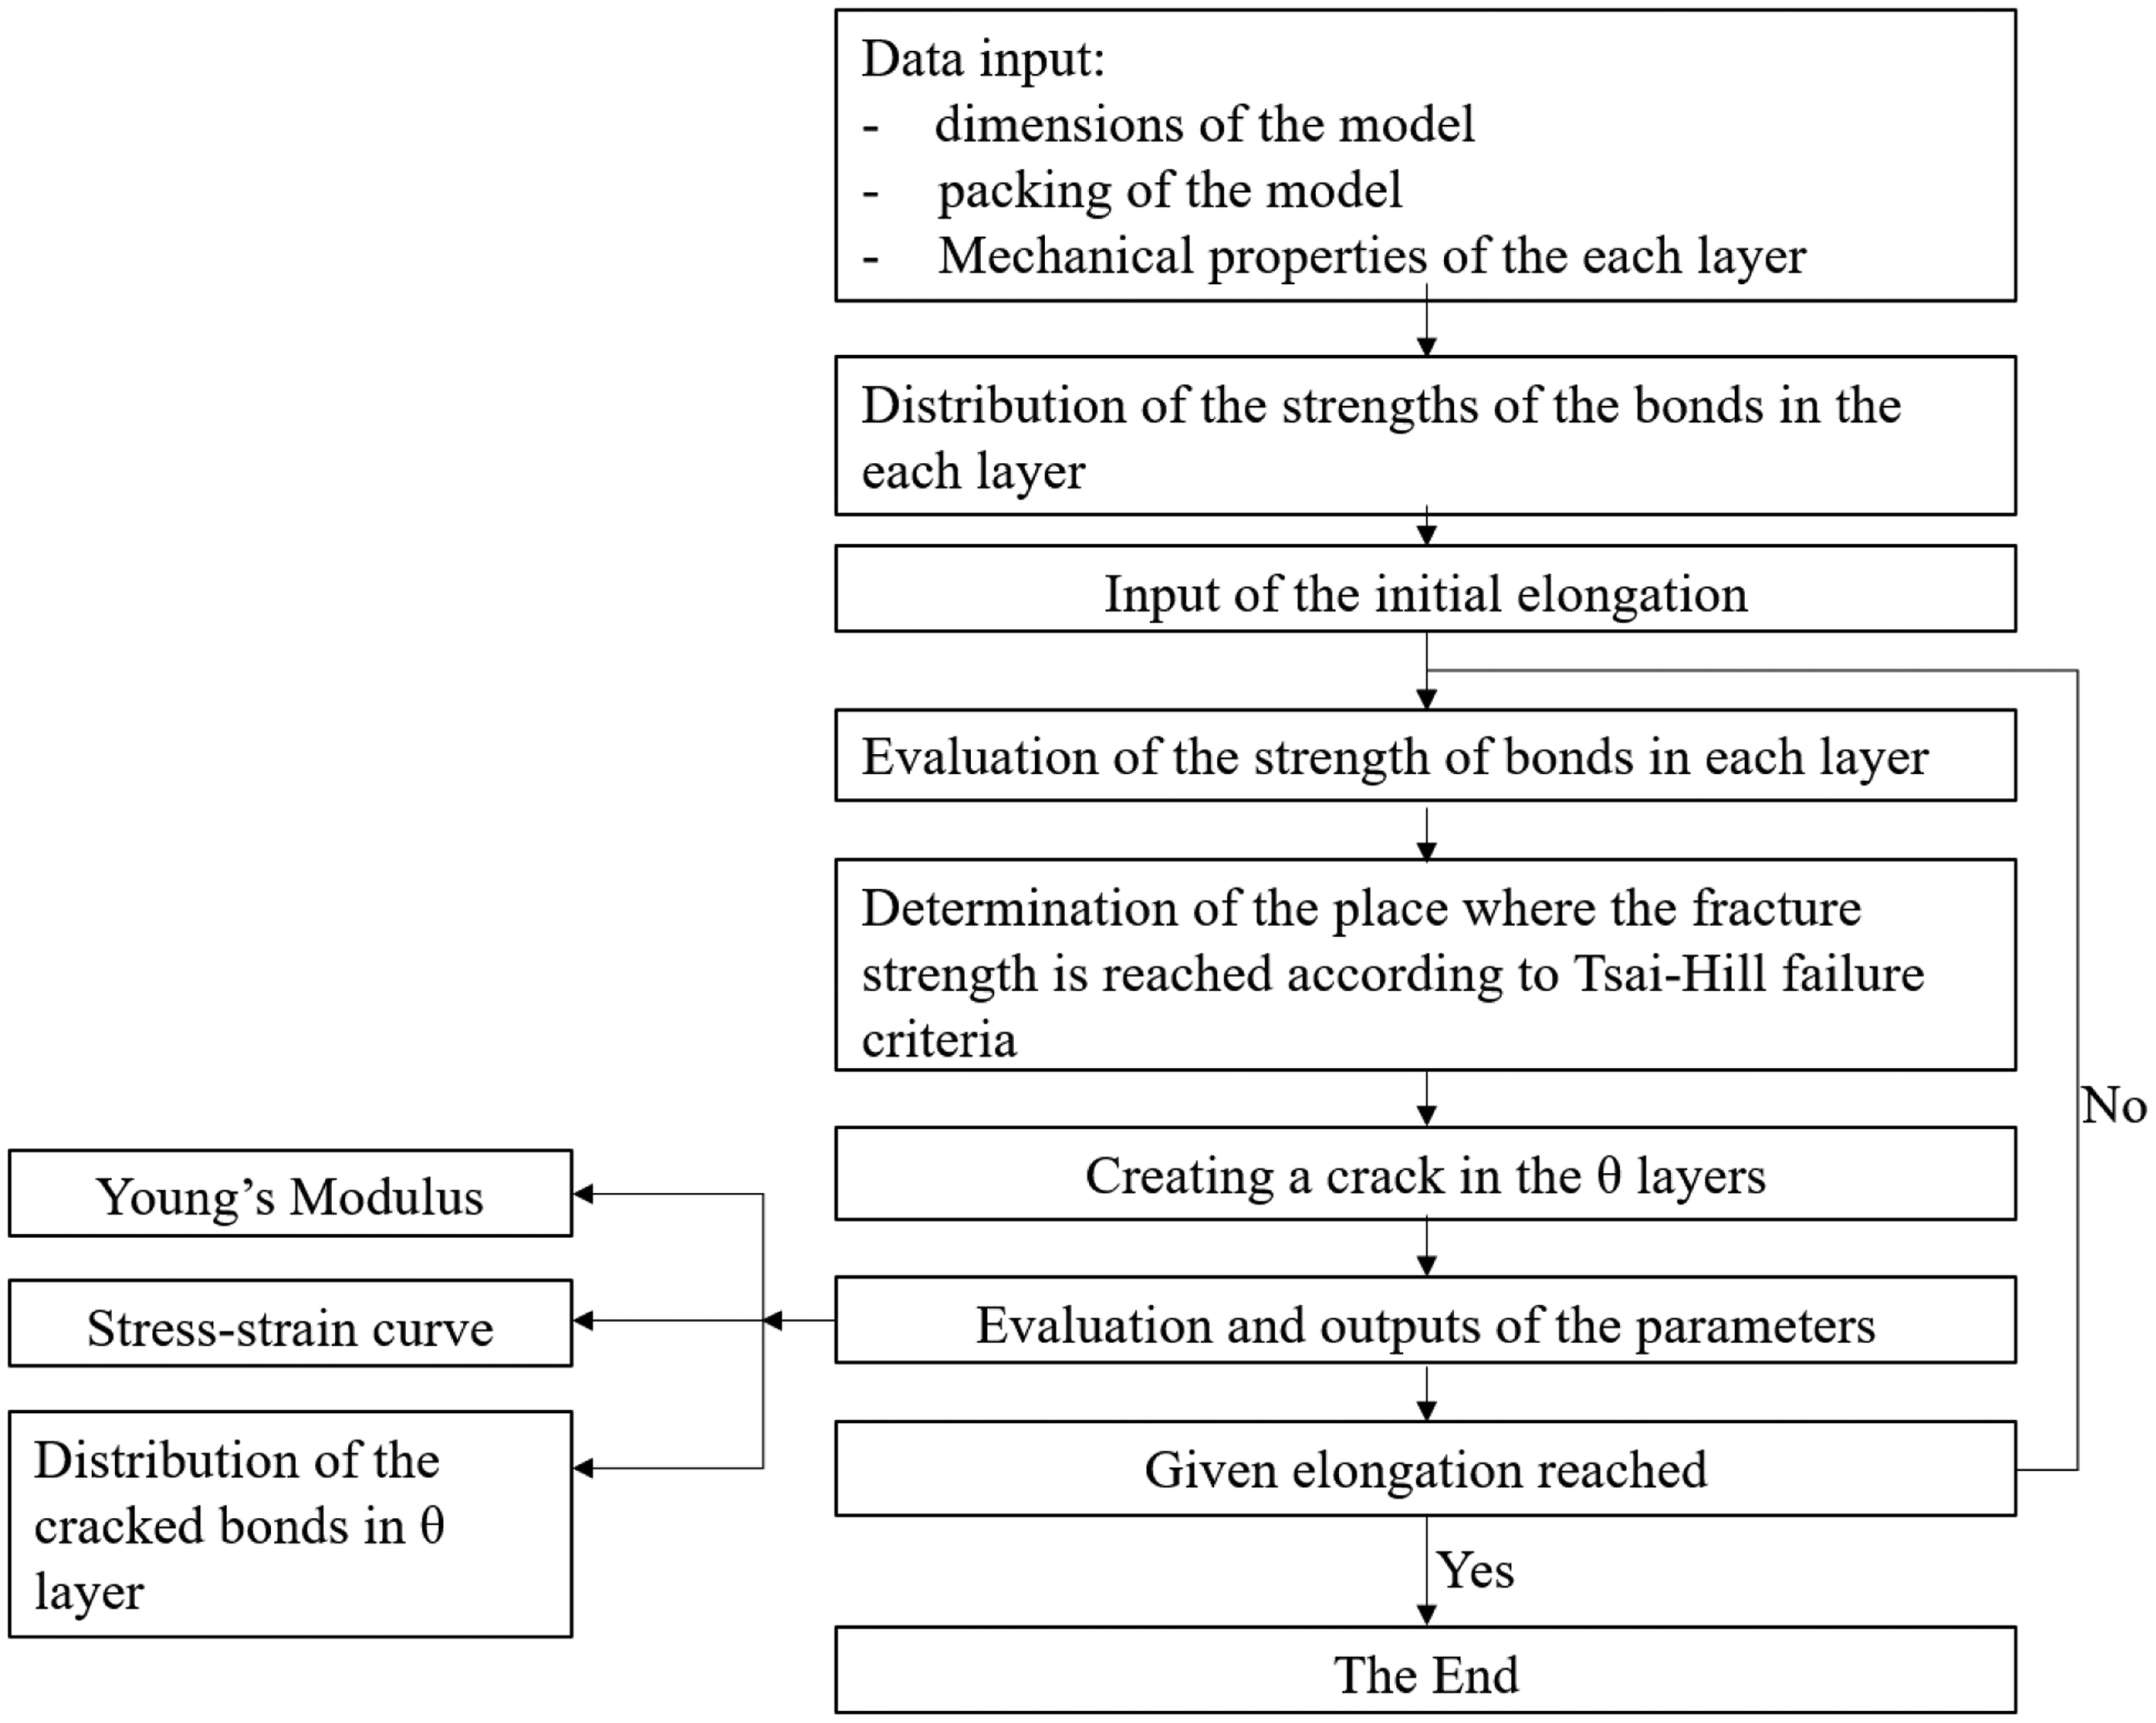
Schematic flowchart for the DEM modeling of damage progression.
Mechanical properties of UD carbon fiber epoxy composite laminae.
Failure of UD composite laminae
Tsai-Hill failure criterion
When simulating the failure process of the whole ply of composites, a failure criterion is usually needed in the numerical modeling with the framework of FEM. However, in the DEM-based modeling, due to the lack of rigorous formulation between the bond strength and macroscopic materials properties, the calibration of bond strength for any DEM model is inevitable. Bonds in 0∘ and 90∘ plies can be normally calibrated from the experimental ultimate tensile strength tests, while a failure criterion is needed for an angle-ply lamina when its experimental data are not available. Considering the simplicity of parameter identification of the criteria, Tsai-Hill failure criterion, 43 which is based on the distorted energy theory and interaction failure theory, is adopted for this model. This criterion is a quadratic, interactive stress-based criterion that identifies failure but does not distinguish between different modes of failure. Although the Tsai-Hill failure criterion does not distinguish between the compressive and tensile strengths, which can result in an underestimate of the maximum loads that can be applied when compared to other failure theories like Tsai-Wu 44 or Hashin 45 theories, it can be still utilized in this study where only tensile loading condition is considered.
Considering a unidirectional composite material lamina is transversely isotropic, the Tsai-Hill failure criterion, which has been proved to be successful under a wide variety of circumstances,
46
is given in equation (5) when the lamina is subjected to plane stress states.
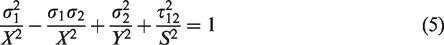
For a unidirectional angle-ply (θ) lamina subjected to a uniaxial loading (σx), which can be found in Figure 7, the transformation equations for expressing stresses in a 1–2 coordinate system (principal stresses) in terms of stresses in an x–y coordinate system (applied stresses) is written as
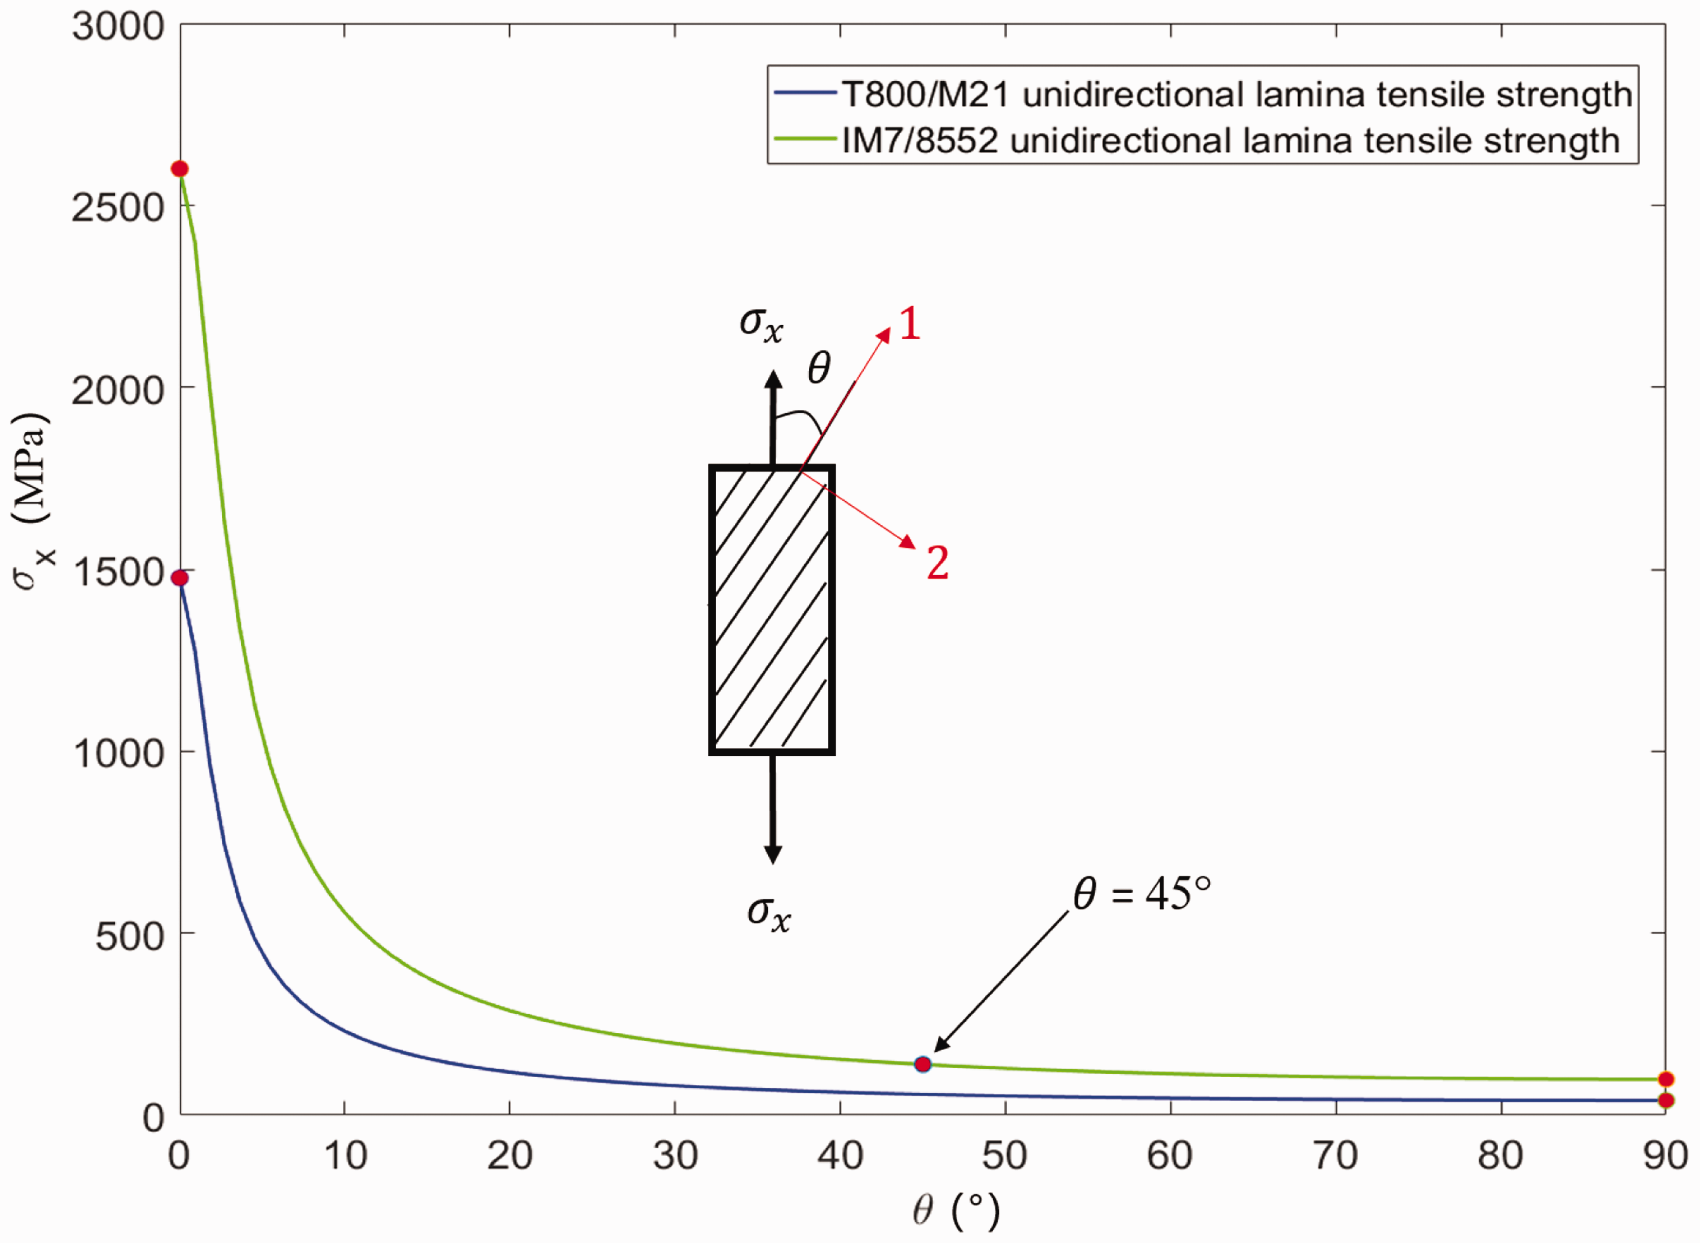
Failure strength prediction of a unidirectional lamina with Tsai-Hill failure criterion.
where
When the lamina is under an applied uniaxial tension (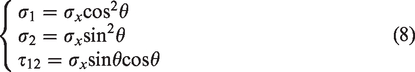
This criterion is used for the determination of failure strength of angle-ply composite laminae, which is then utilized to calibrate the strength of matrix bonds within the angle-ply laminae. Here in this study, only
Definition and visualization of cracks
Figure 8 illustrates the schematic representation of cracks in a cross-ply/angle-ply laminate (up) and numerical representation of the cracks in 90∘ plies of a cross-ply composite laminate. Normally, a crack will be counted when the crack locates through the thickness, which can be shown in Figure 8(a1) and (a2). However, due to the randomness of the strength of bonds, a crack will be counted once the length of the consecutive or interrupted cracks is larger than half of the thickness of the weak plies, such as shown in Figure 8(b1) and (b2). Figure 8(b2) shows an example of the cracks in the 90∘ plies of a cross-ply laminate, as each ply is modeled separately within the composite, a red disk along the thickness direction represents a crack in this ply. The cracks can be initiated from the 90∘ plies ply adjacent to 0∘ plies at both side and propagate toward the middle plane, or from the 90∘ plies at the bottom (top) adjacent the 0∘ plies and propagate toward the top (bottom) plies in the direction perpendicular to the loading direction. Therefore, these two cases will be considered when counting the cracks during the loading.
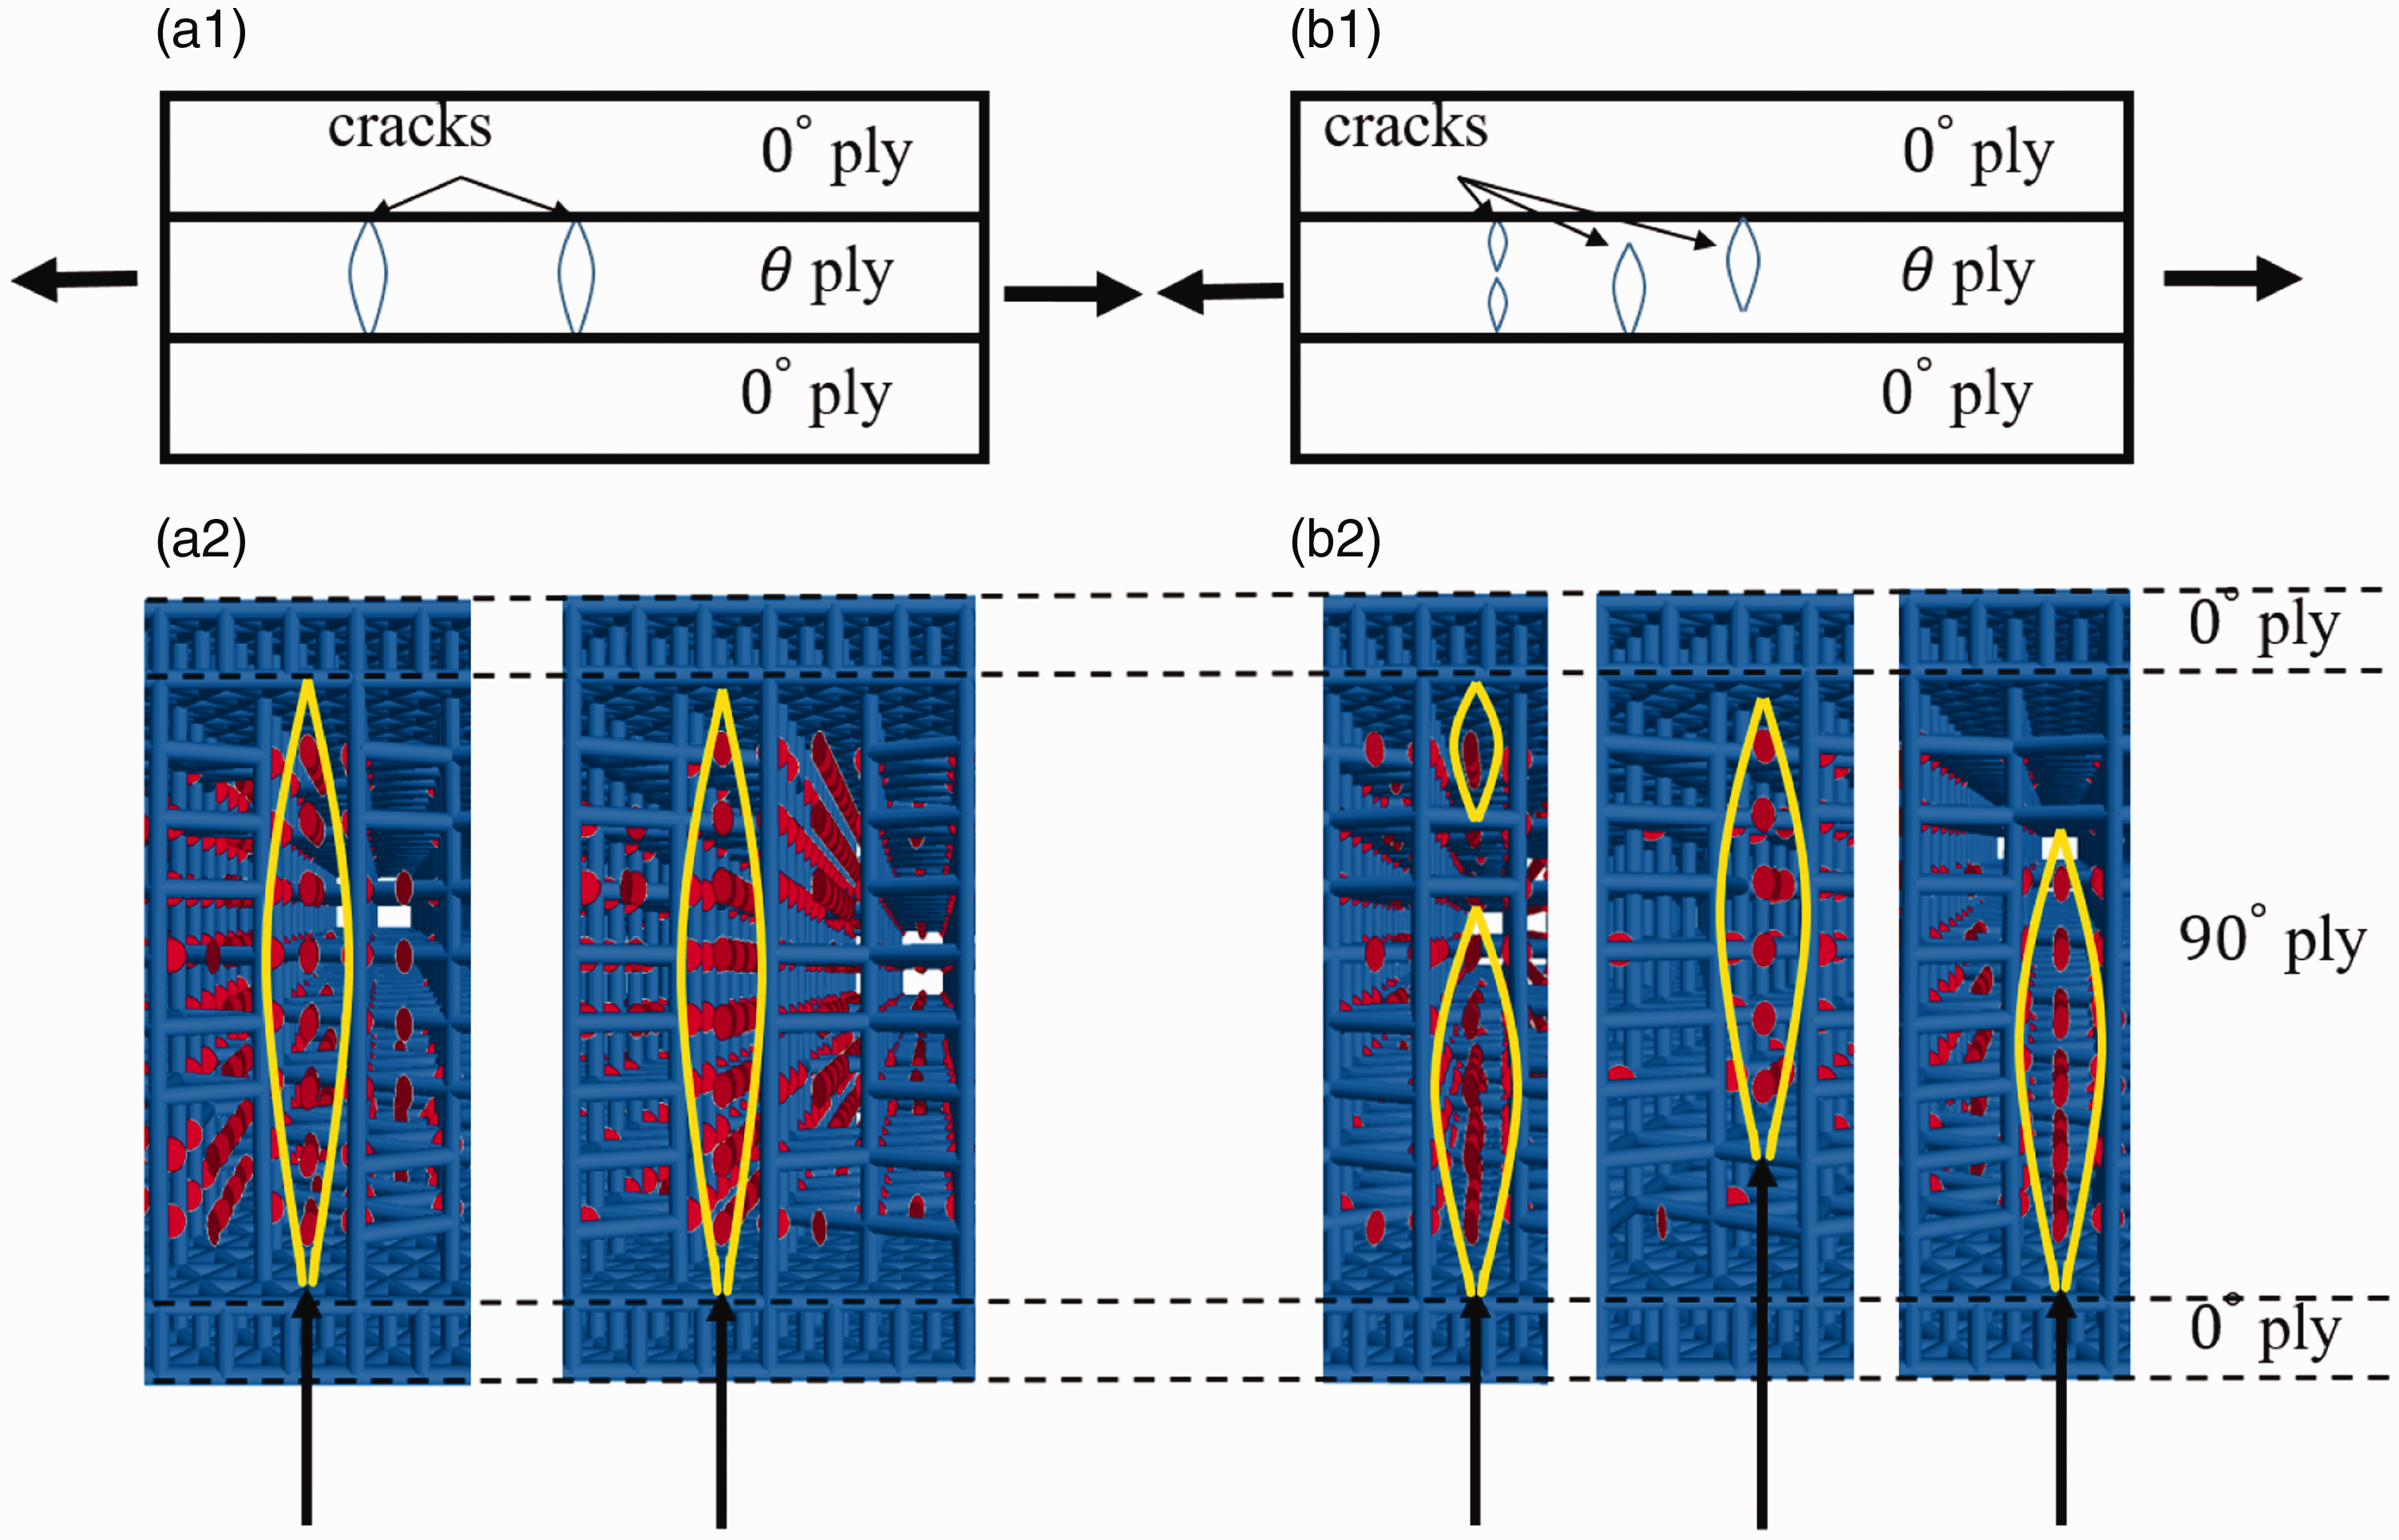
Schematic representation of cracks in a [
Case study of damage progression in composite laminates
Two case studies were conducted with this 3D DEM model by implementing the Tsai-Hill failure criterion for predicting the damage initiation and progression, including a cross-ply composite laminates and a QI composite laminates with a circular hole at the center.
Progressive failure in cross-ply laminates under tensile loading
In this study, an example of
The images of sequential cracks in Figure 9(a1) to (a3) come from the specimen 1 in the experiment from Sebaey et al.,
40
where crack occurs since loading strain reaches 0.4%. However, in the other two specimens, the crack starts from 0.32%, which corresponds to the cracks obtained from the numerical simulations in Figure 9(a2) and (a3). Due to the experimental scattering data, the number of cracks in three specimens near the applied strain of 0.4% ranges from 2 to 5, which can be calculated from Figure 10. The cracks counted in the DEM modeling with the smaller stiffness of
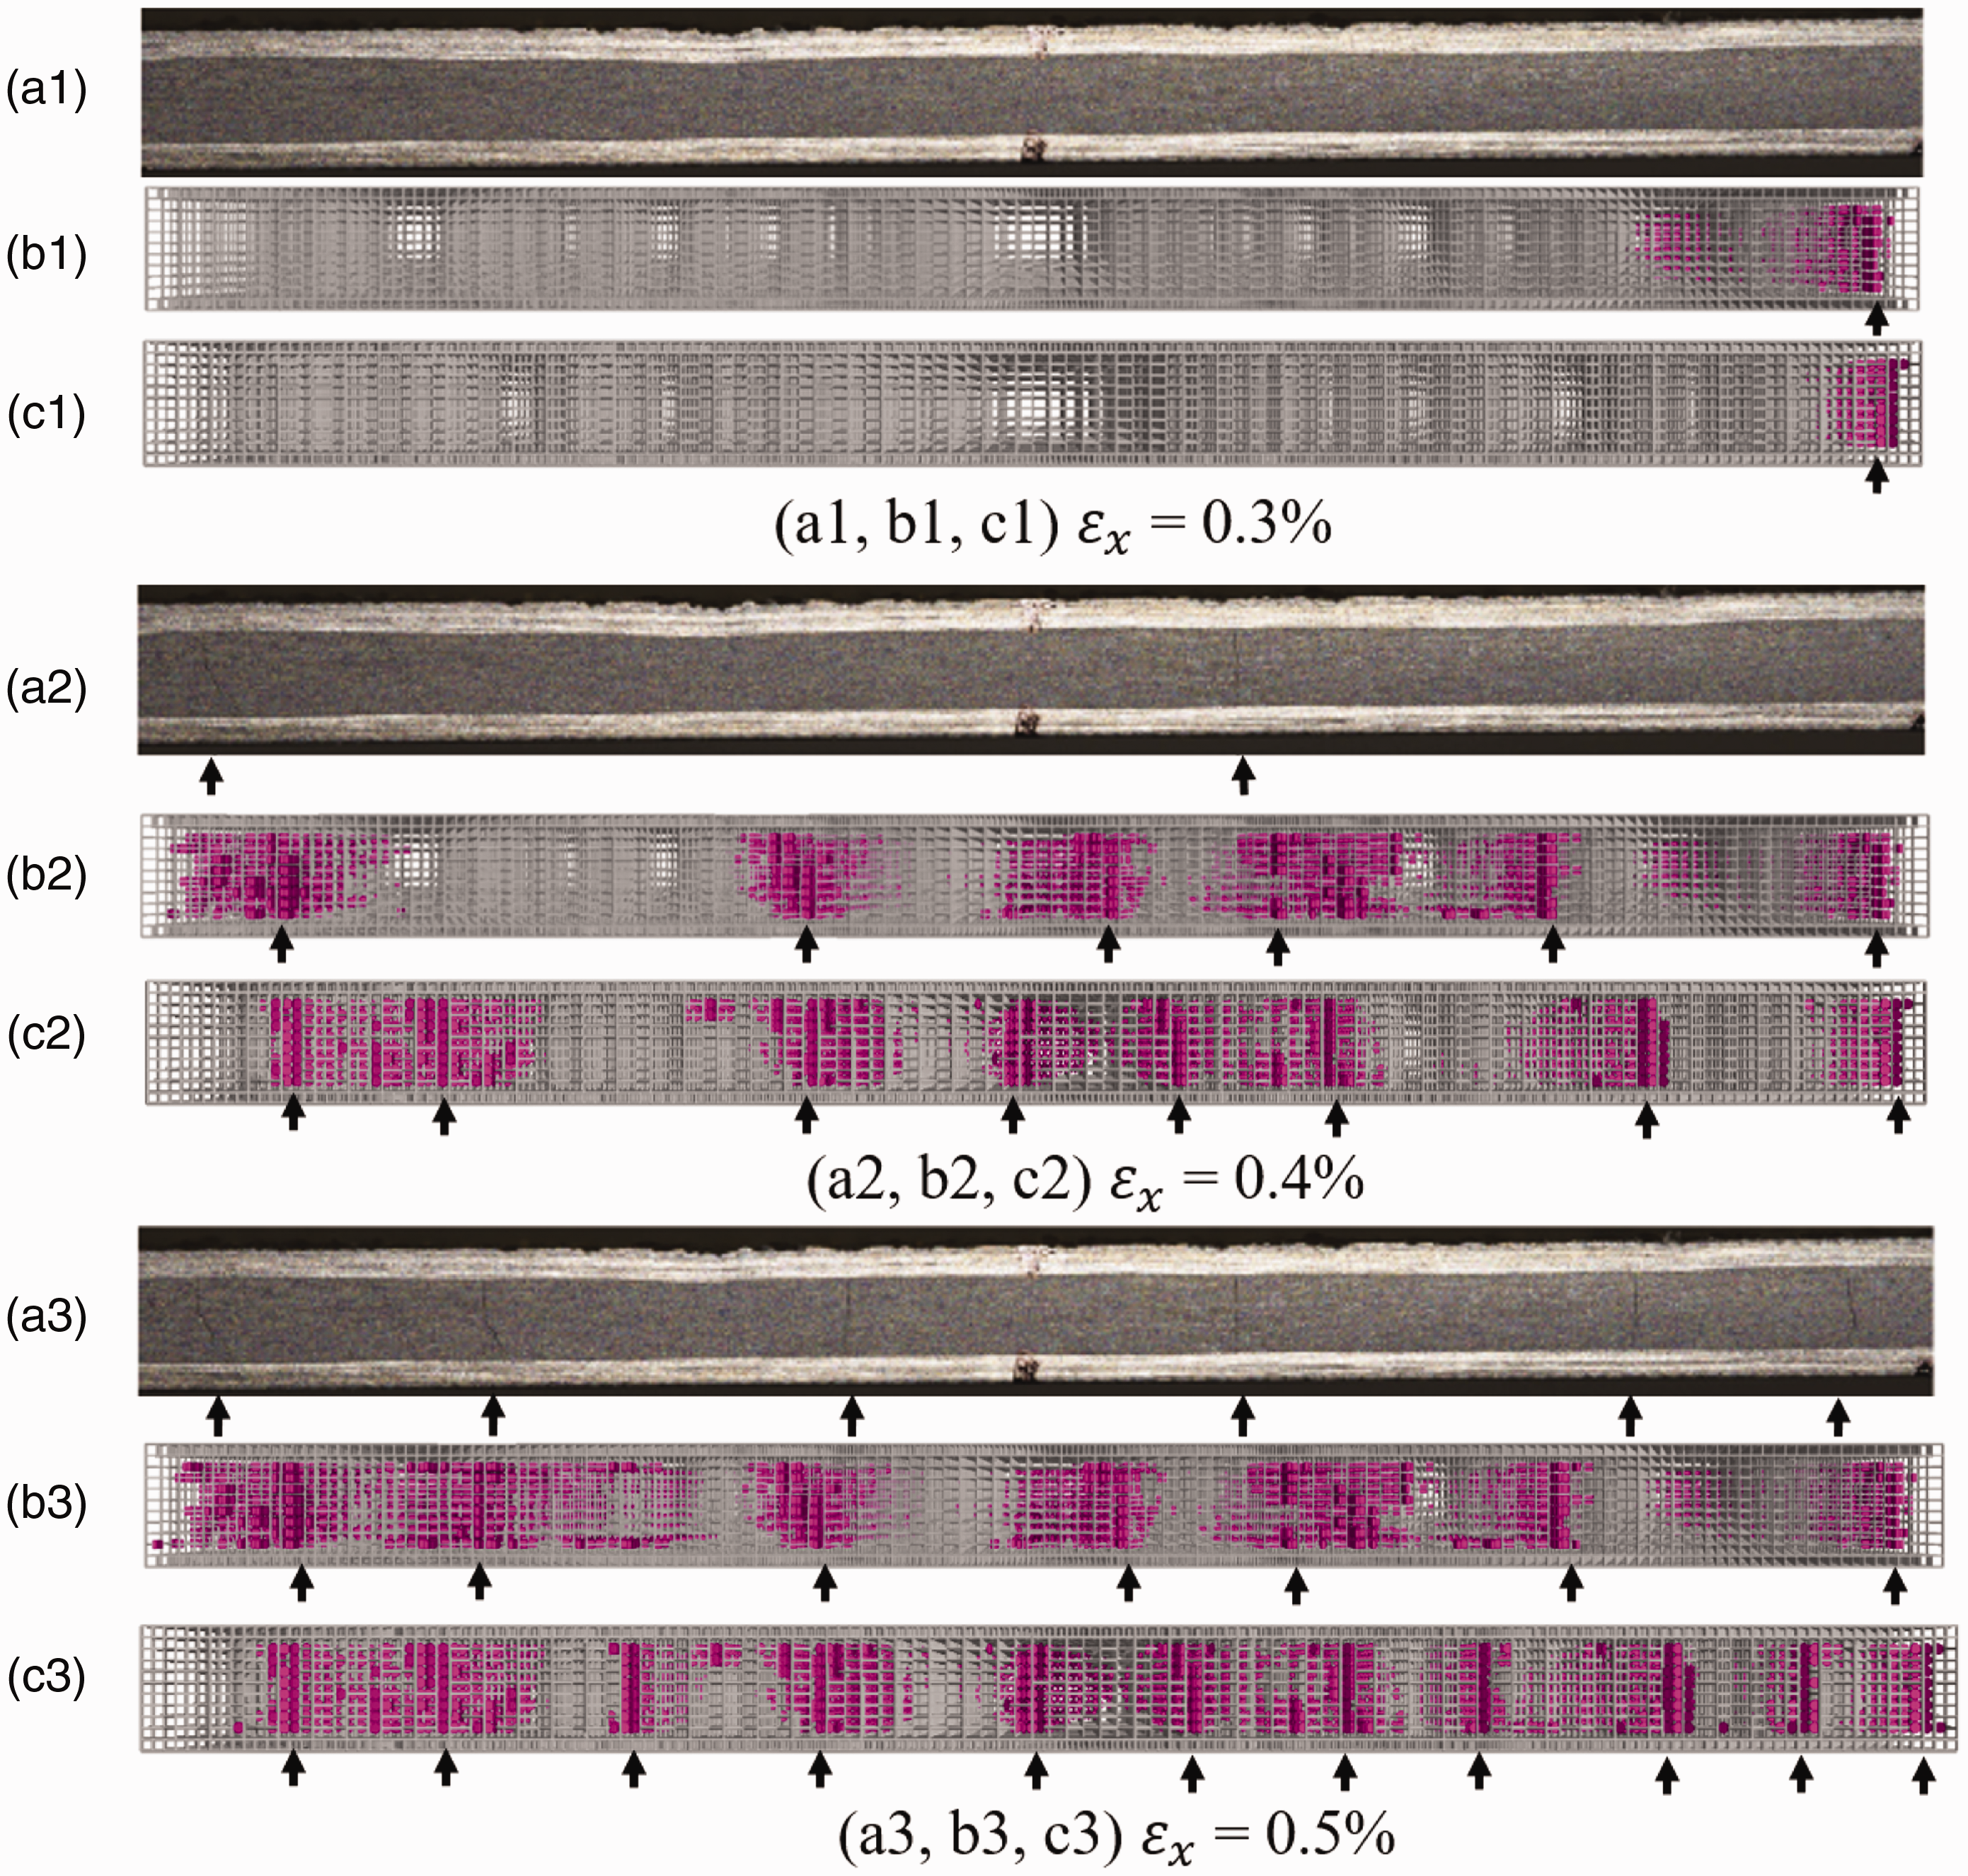
Comparison of the results from numerical simulations and experiments
40
regarding the sequent crack events of 90∘ plies at different uniaxial strains: (a1,b1,c1)
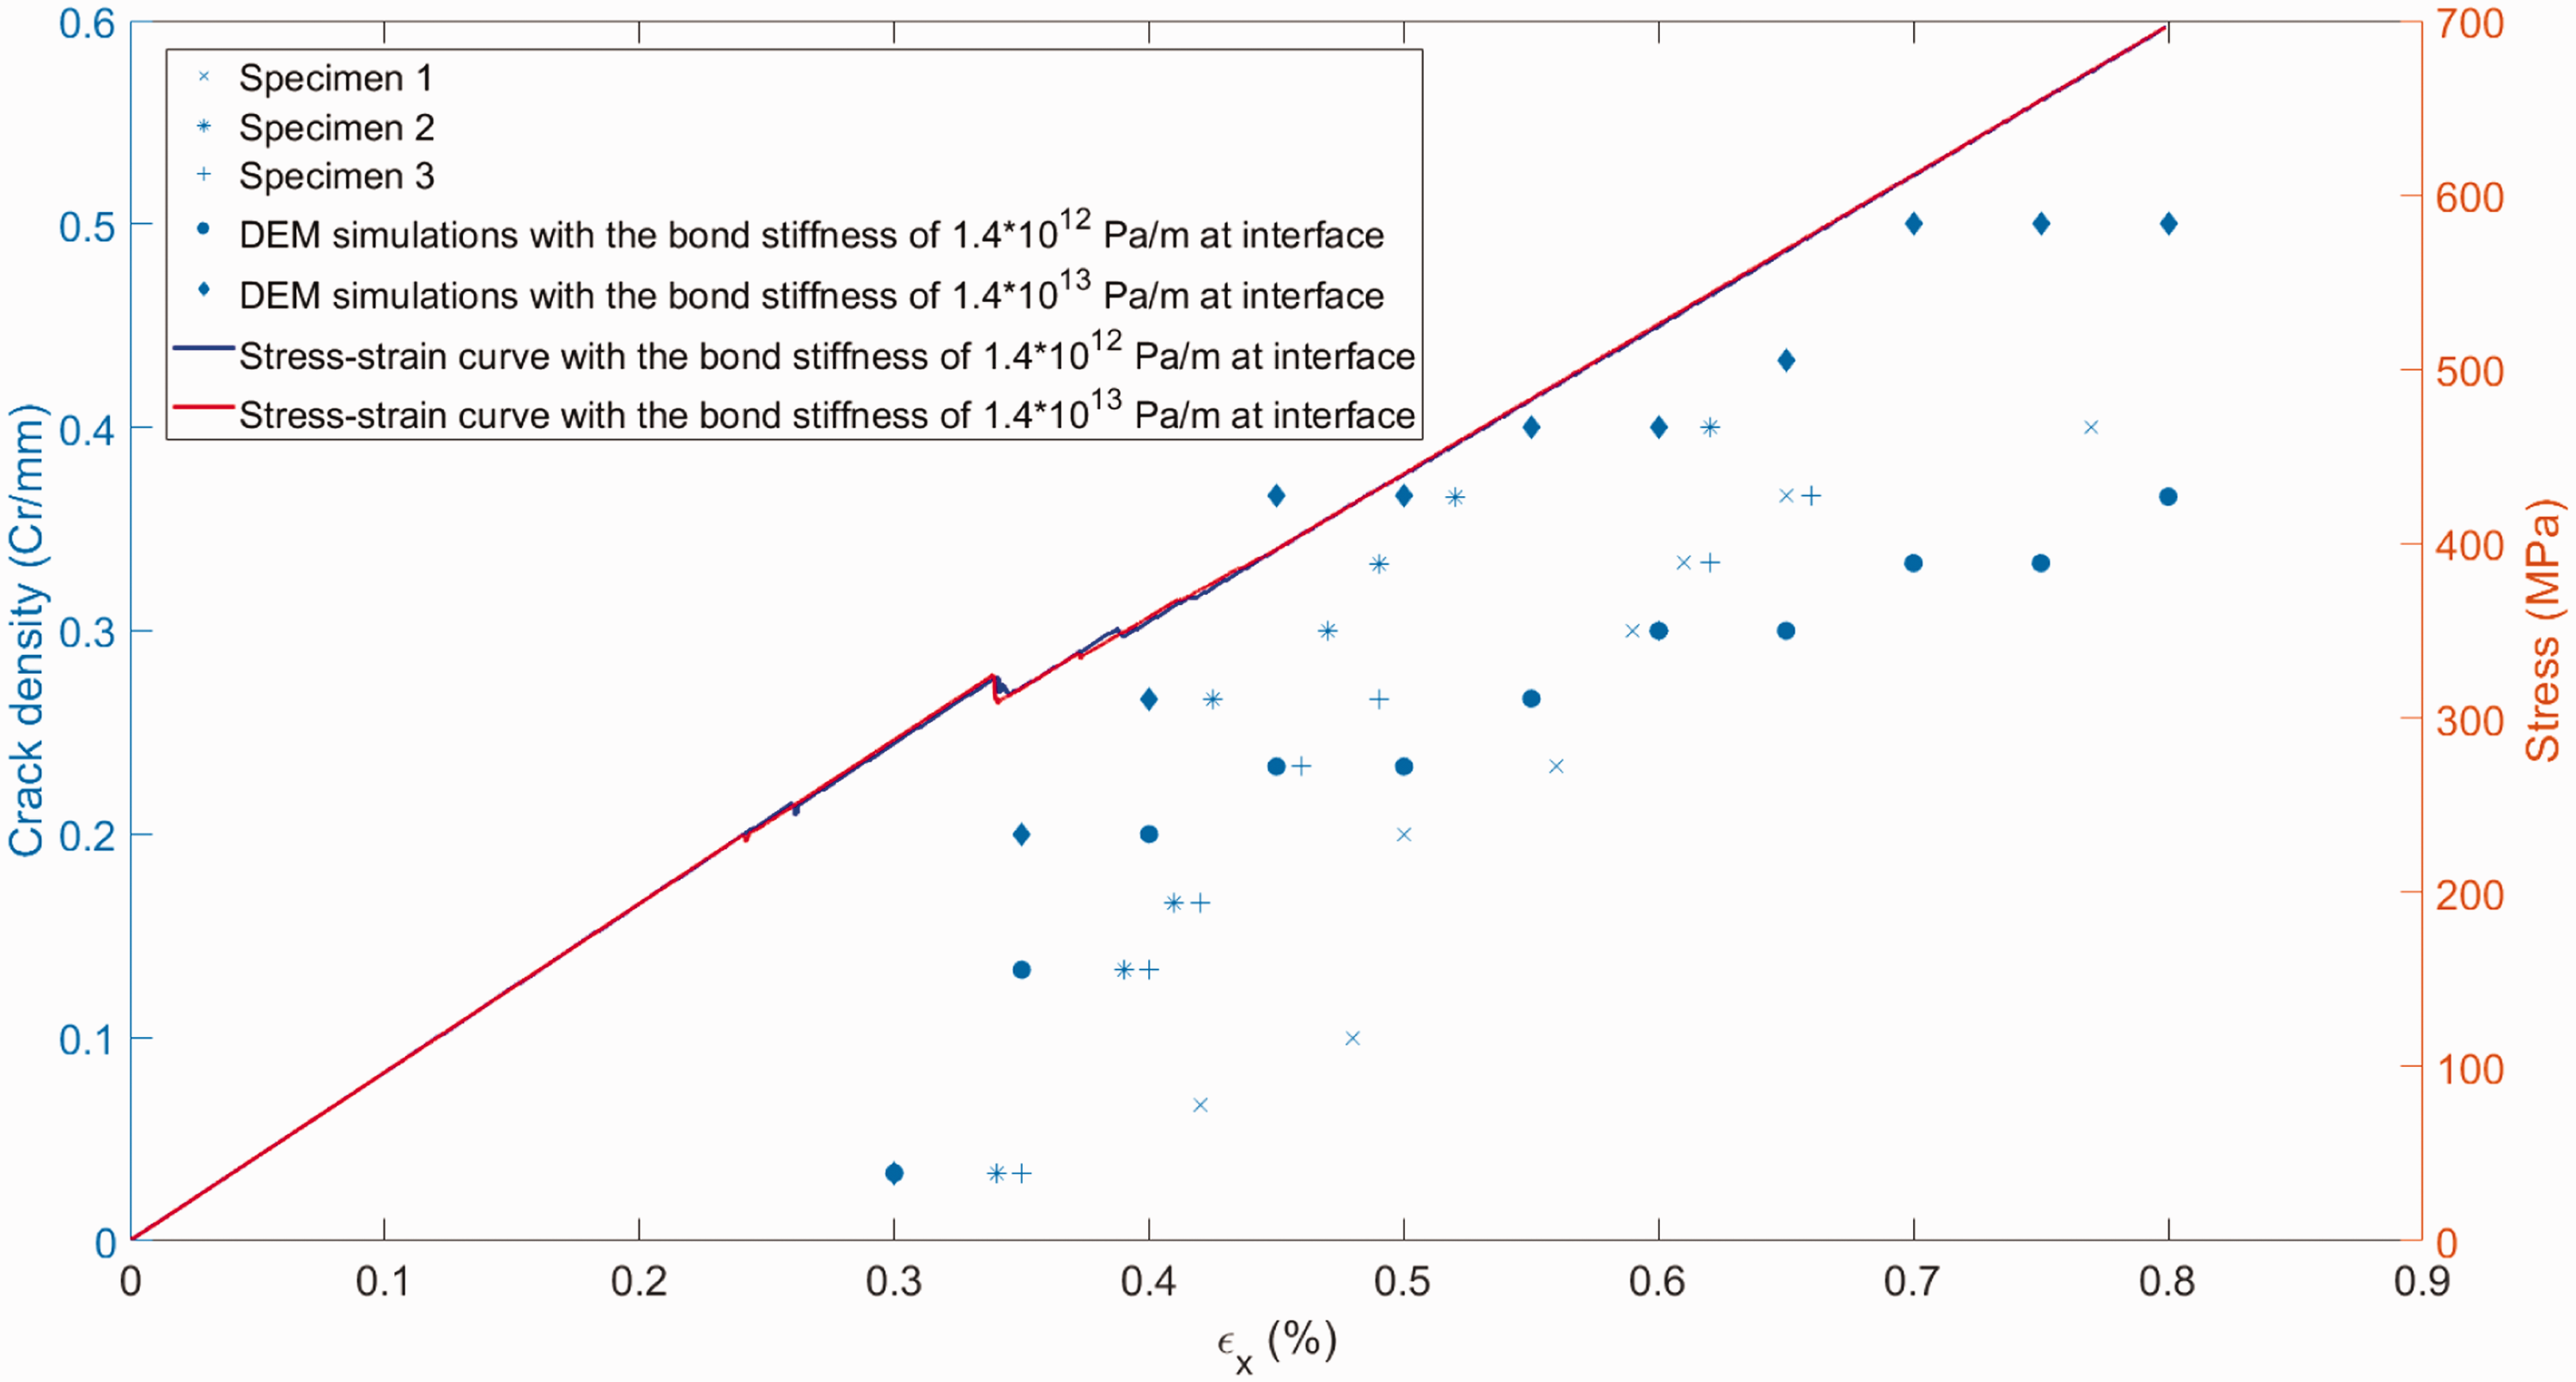
Comparison of the results of crack density vs applied strain from experiments 40 and DEM simulations, and stress-strain curve of simulations with and without interfacial delamination.
When the tensile stress is applied to cross-ply laminate along the fiber direction, cracks are formed in the 90∘ plies at a load level much lower than the ultimate strength of the laminate.
48
In Figure 10 the small drop (bonds breakage) occurs at 0.22% in the DEM simulation with the interface bond stiffness of
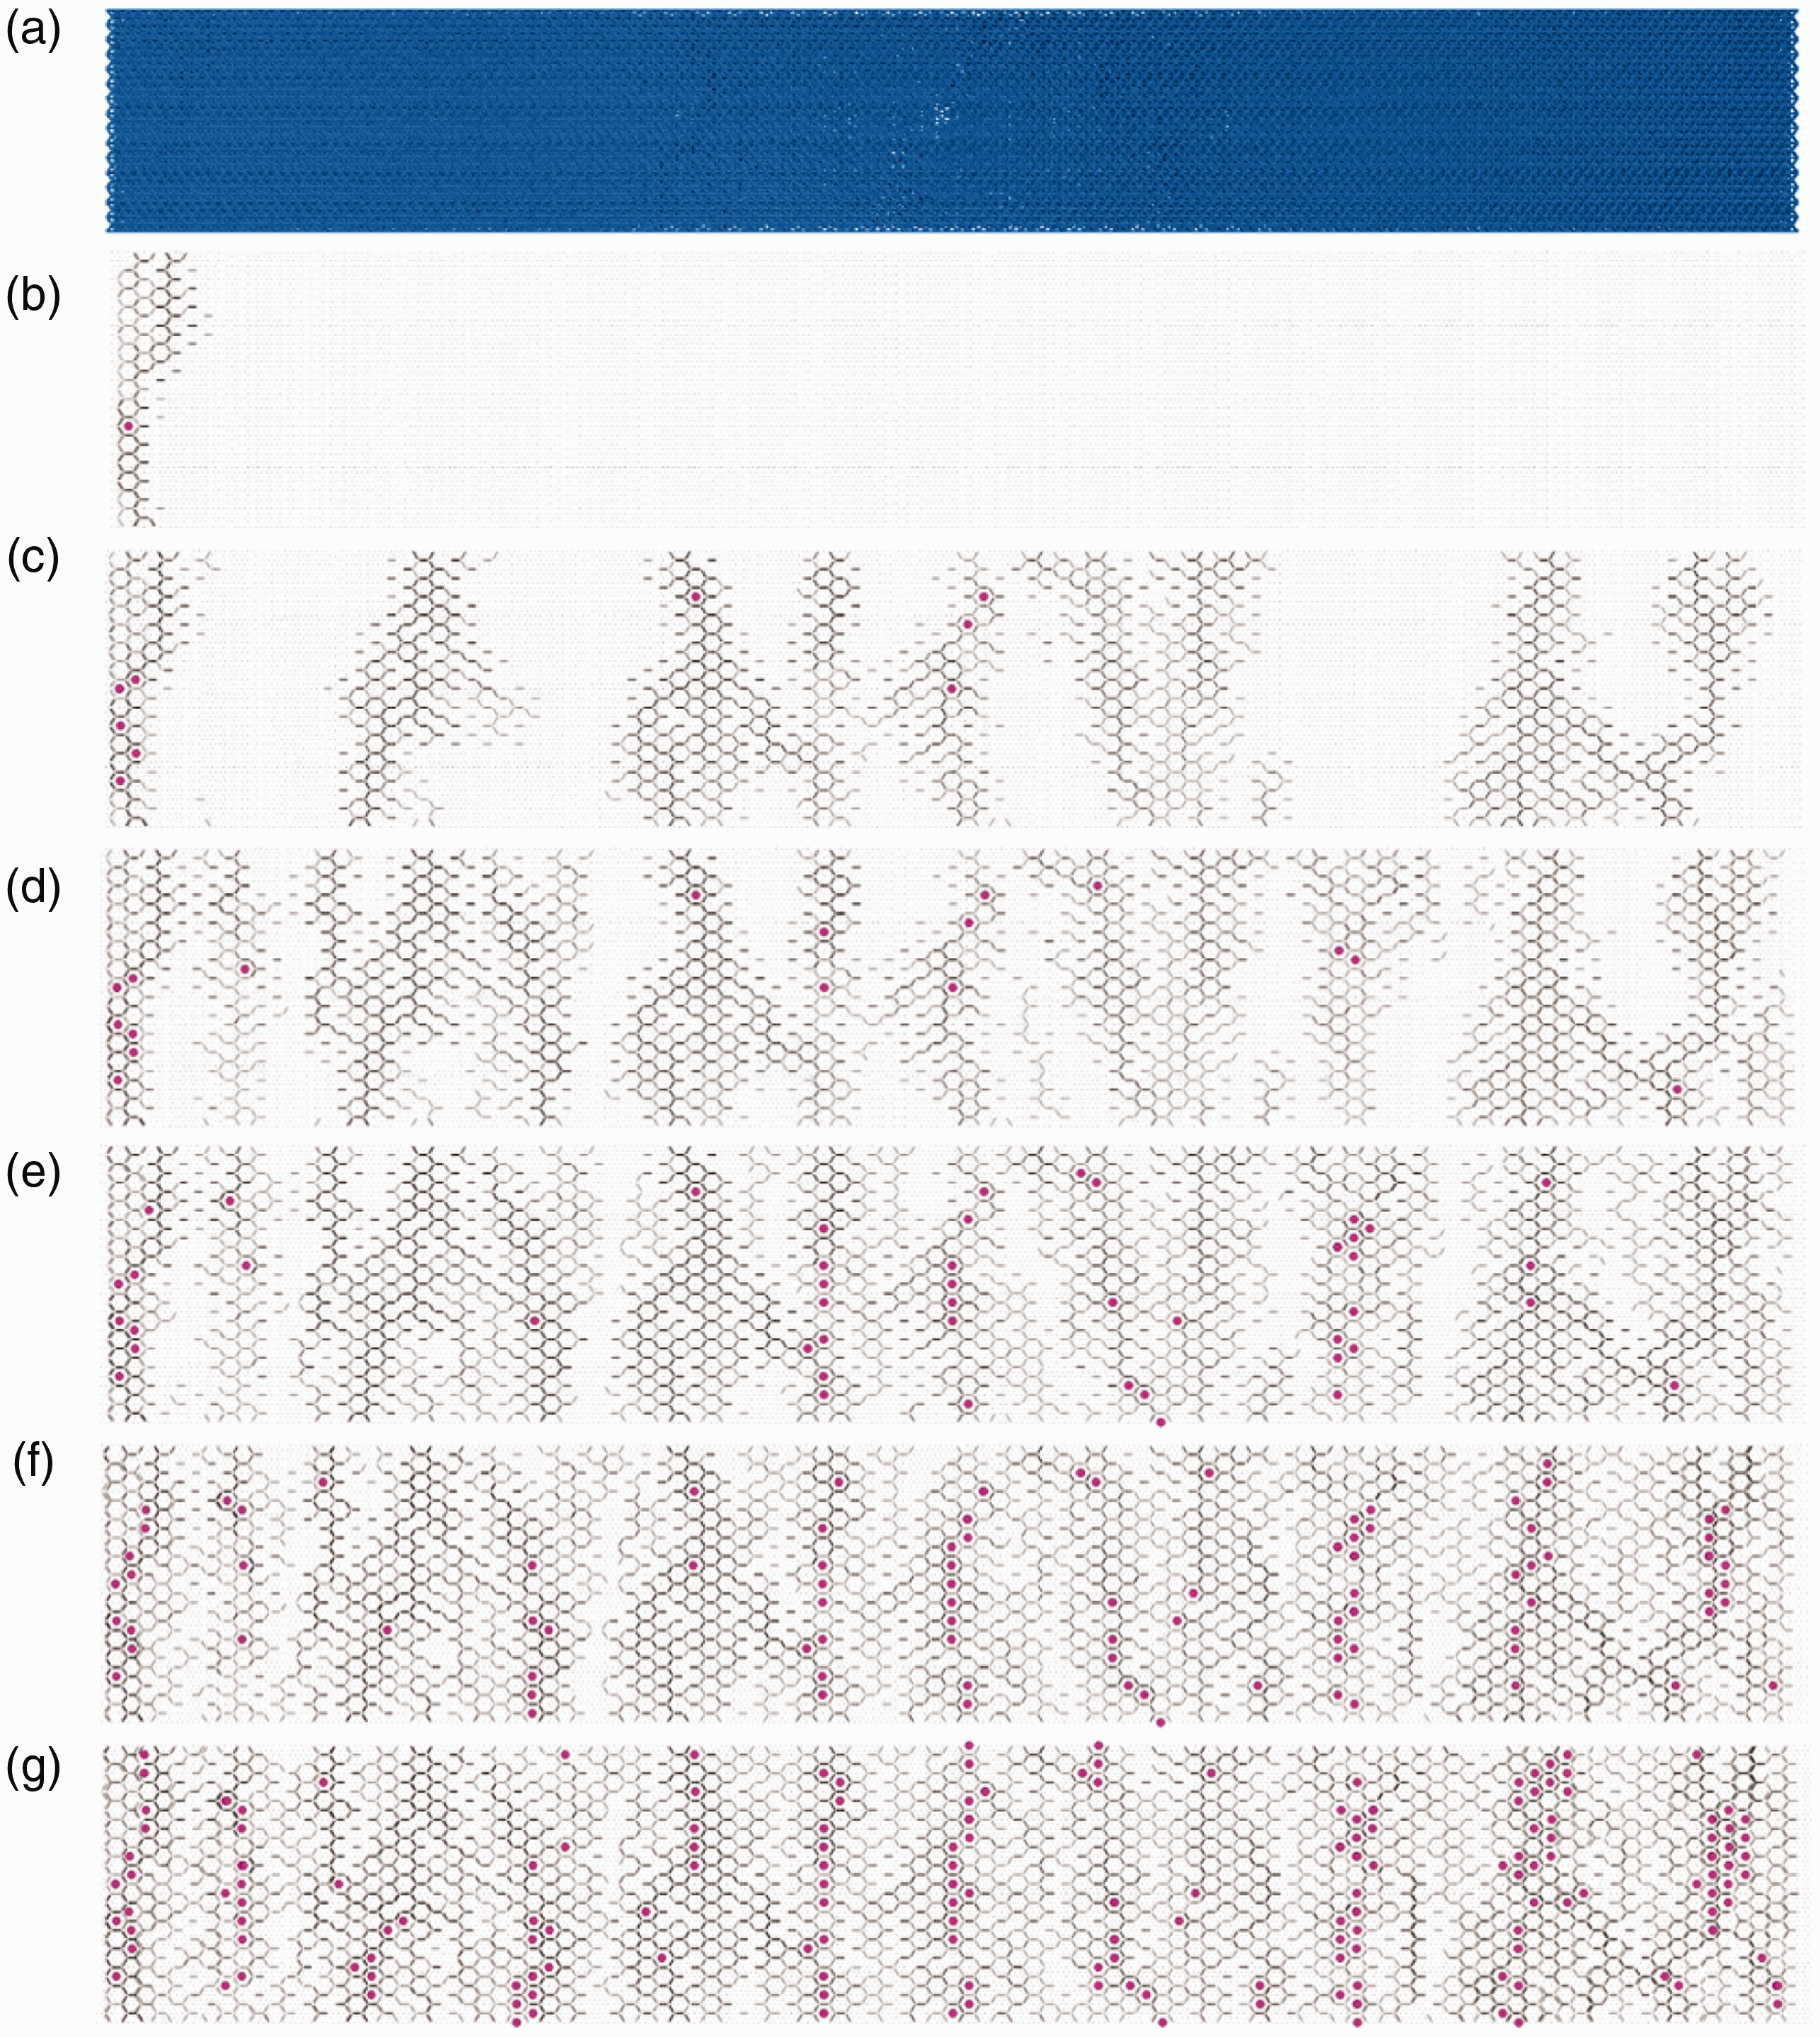
Top view of sequent cracks of 90° plies from DEM simulation with interfacial delamination at different uniaxial strains in width direction (the pink disks represent the cracks at the
The remaining stiffness of the laminates was calculated from the corresponding loading stress and strain at different loading strains and compared to the experimental and theoretical results in Sebaey et al., 40 which are normalized in Figure 12. The same stiffness reduction rate can be observed between the experimental findings and numerical results before the applied strain of 0.3%, which corresponds to the same crack density at this strain found in Figure 10. However, a big difference is detected when the applied strain reaches 0.35% because the crack density obtained from the numerical simulation results with two different interface stiffnesses are much larger than that in the experiments. Moreover, the underestimated stiffness from the numerical simulations may be due to the fact that the experimental data were measured after the specimens were unloaded 50 during which some micro-crack may be closed, resulting in a relatively higher remaining stiffness, while the stiffness was directly calculated by the stress and strain at the exact loading points in numerical simulations without a loading and reloading process. 32 In addition, the same trend for the curve of reduced stiffness can be found since the strain goes up to 0.5%, where the reduced stiffness reaches a plateau. Since it reaches the plateau, the slight difference between the numerical results with different interface stiffnesses suggests that the interfacial delamination has little influence on the remaining stiffness of the composite during the damage process, which can also be seen in Figure 10 where the two stress-strain curves overlap. This is mainly because the majority of the load is still held by the 0∘ plies. A small difference can be seen between the results from the DEM simulations and Ply Discount Method (PDM) since the remaining stiffness is calculated when the elastic properties (not include the Young Modulus in the fiber direction) of 90∘ plies are set to 0 in PDM. 40 The damages in Figures 9(c3) and 11(g) suggest that the 90∘ plies can only hold little load due to the significant amount of cracks.
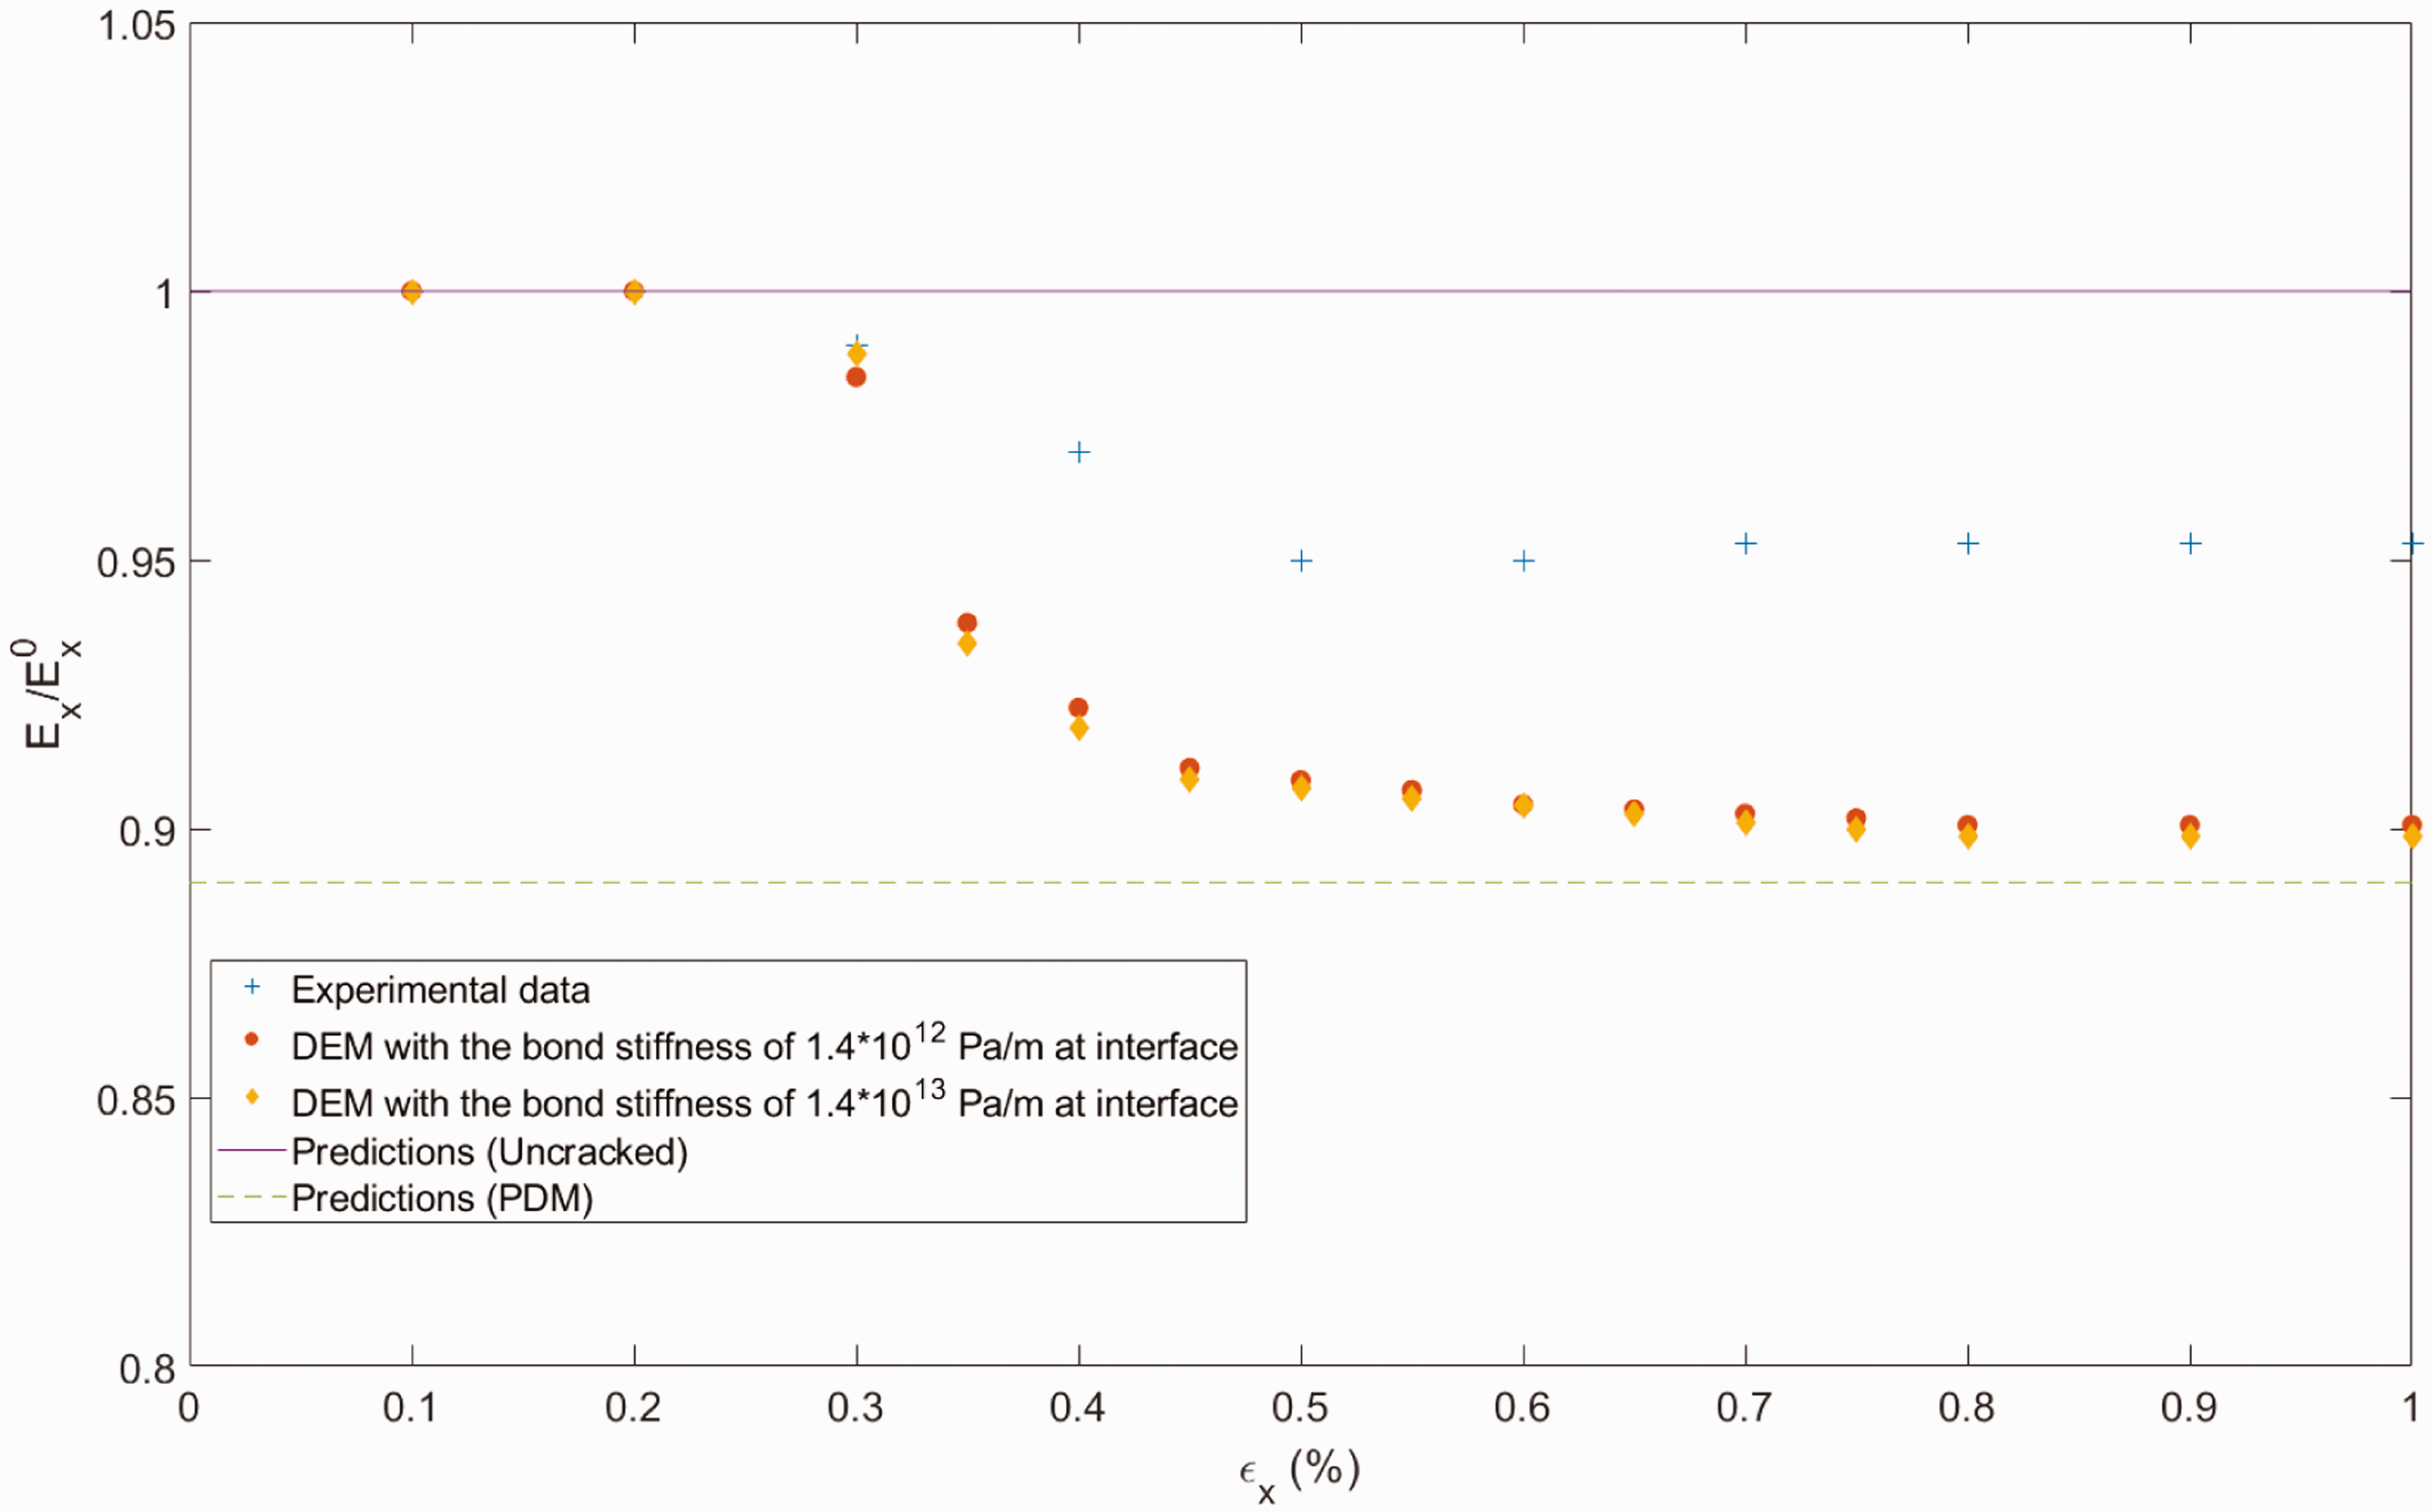
Comparison of the results of reduced stiffness in longitudinal direction vs. applied strain from experiments, Ply Discount Method (PDM) 40 and DEM models.
Progressive failure in the QI composite laminates with an open hole under tensile loading
In addition to the qualitative analysis for the QI
Damage initiation and propagation of
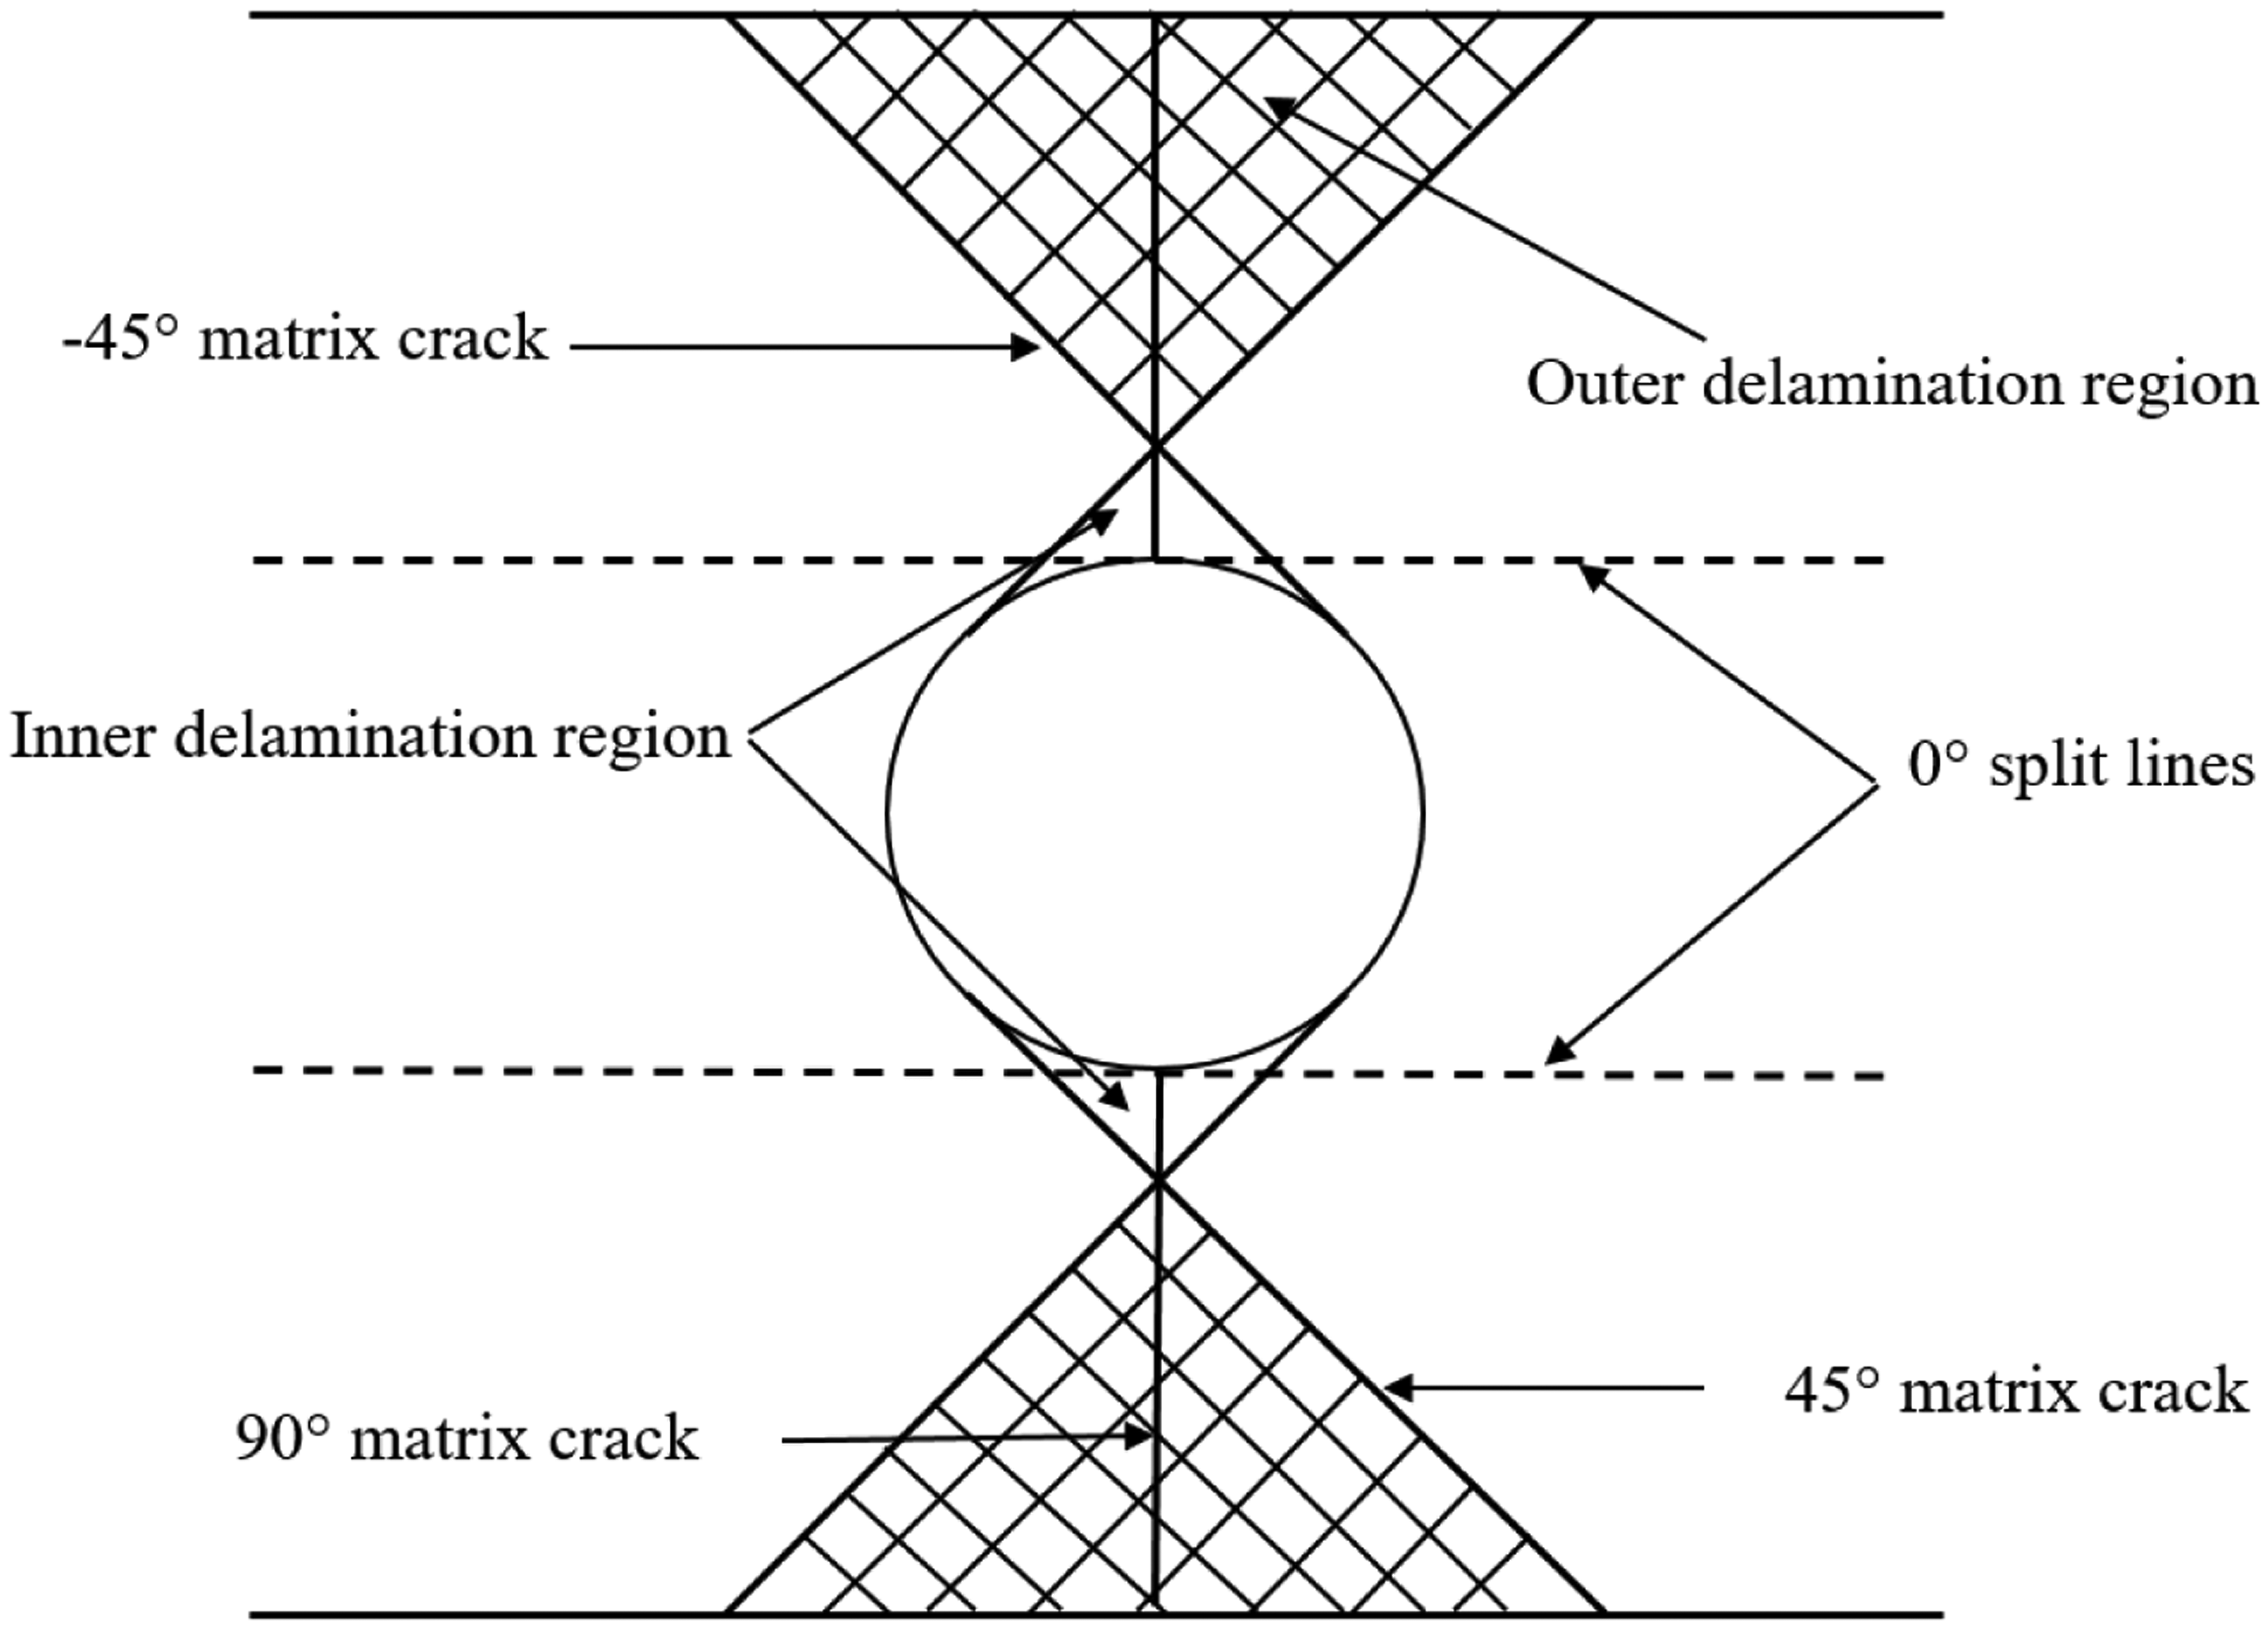
Isolated crack/damage around the hole and free edge of the specimen;
Extensive damage around the hole (inner delamination regions);
Damage across the width of the specimen from the hole (outer delamination regions);
Final catastrophic failure.
Due to the nature of the randomness of bond strength in the composites, cracking occurs randomly in different plies at a relatively low strain, which is shown in Figures 14(a) and 15(a). Figure 14 shows the damage initiation and propagation in each ply of
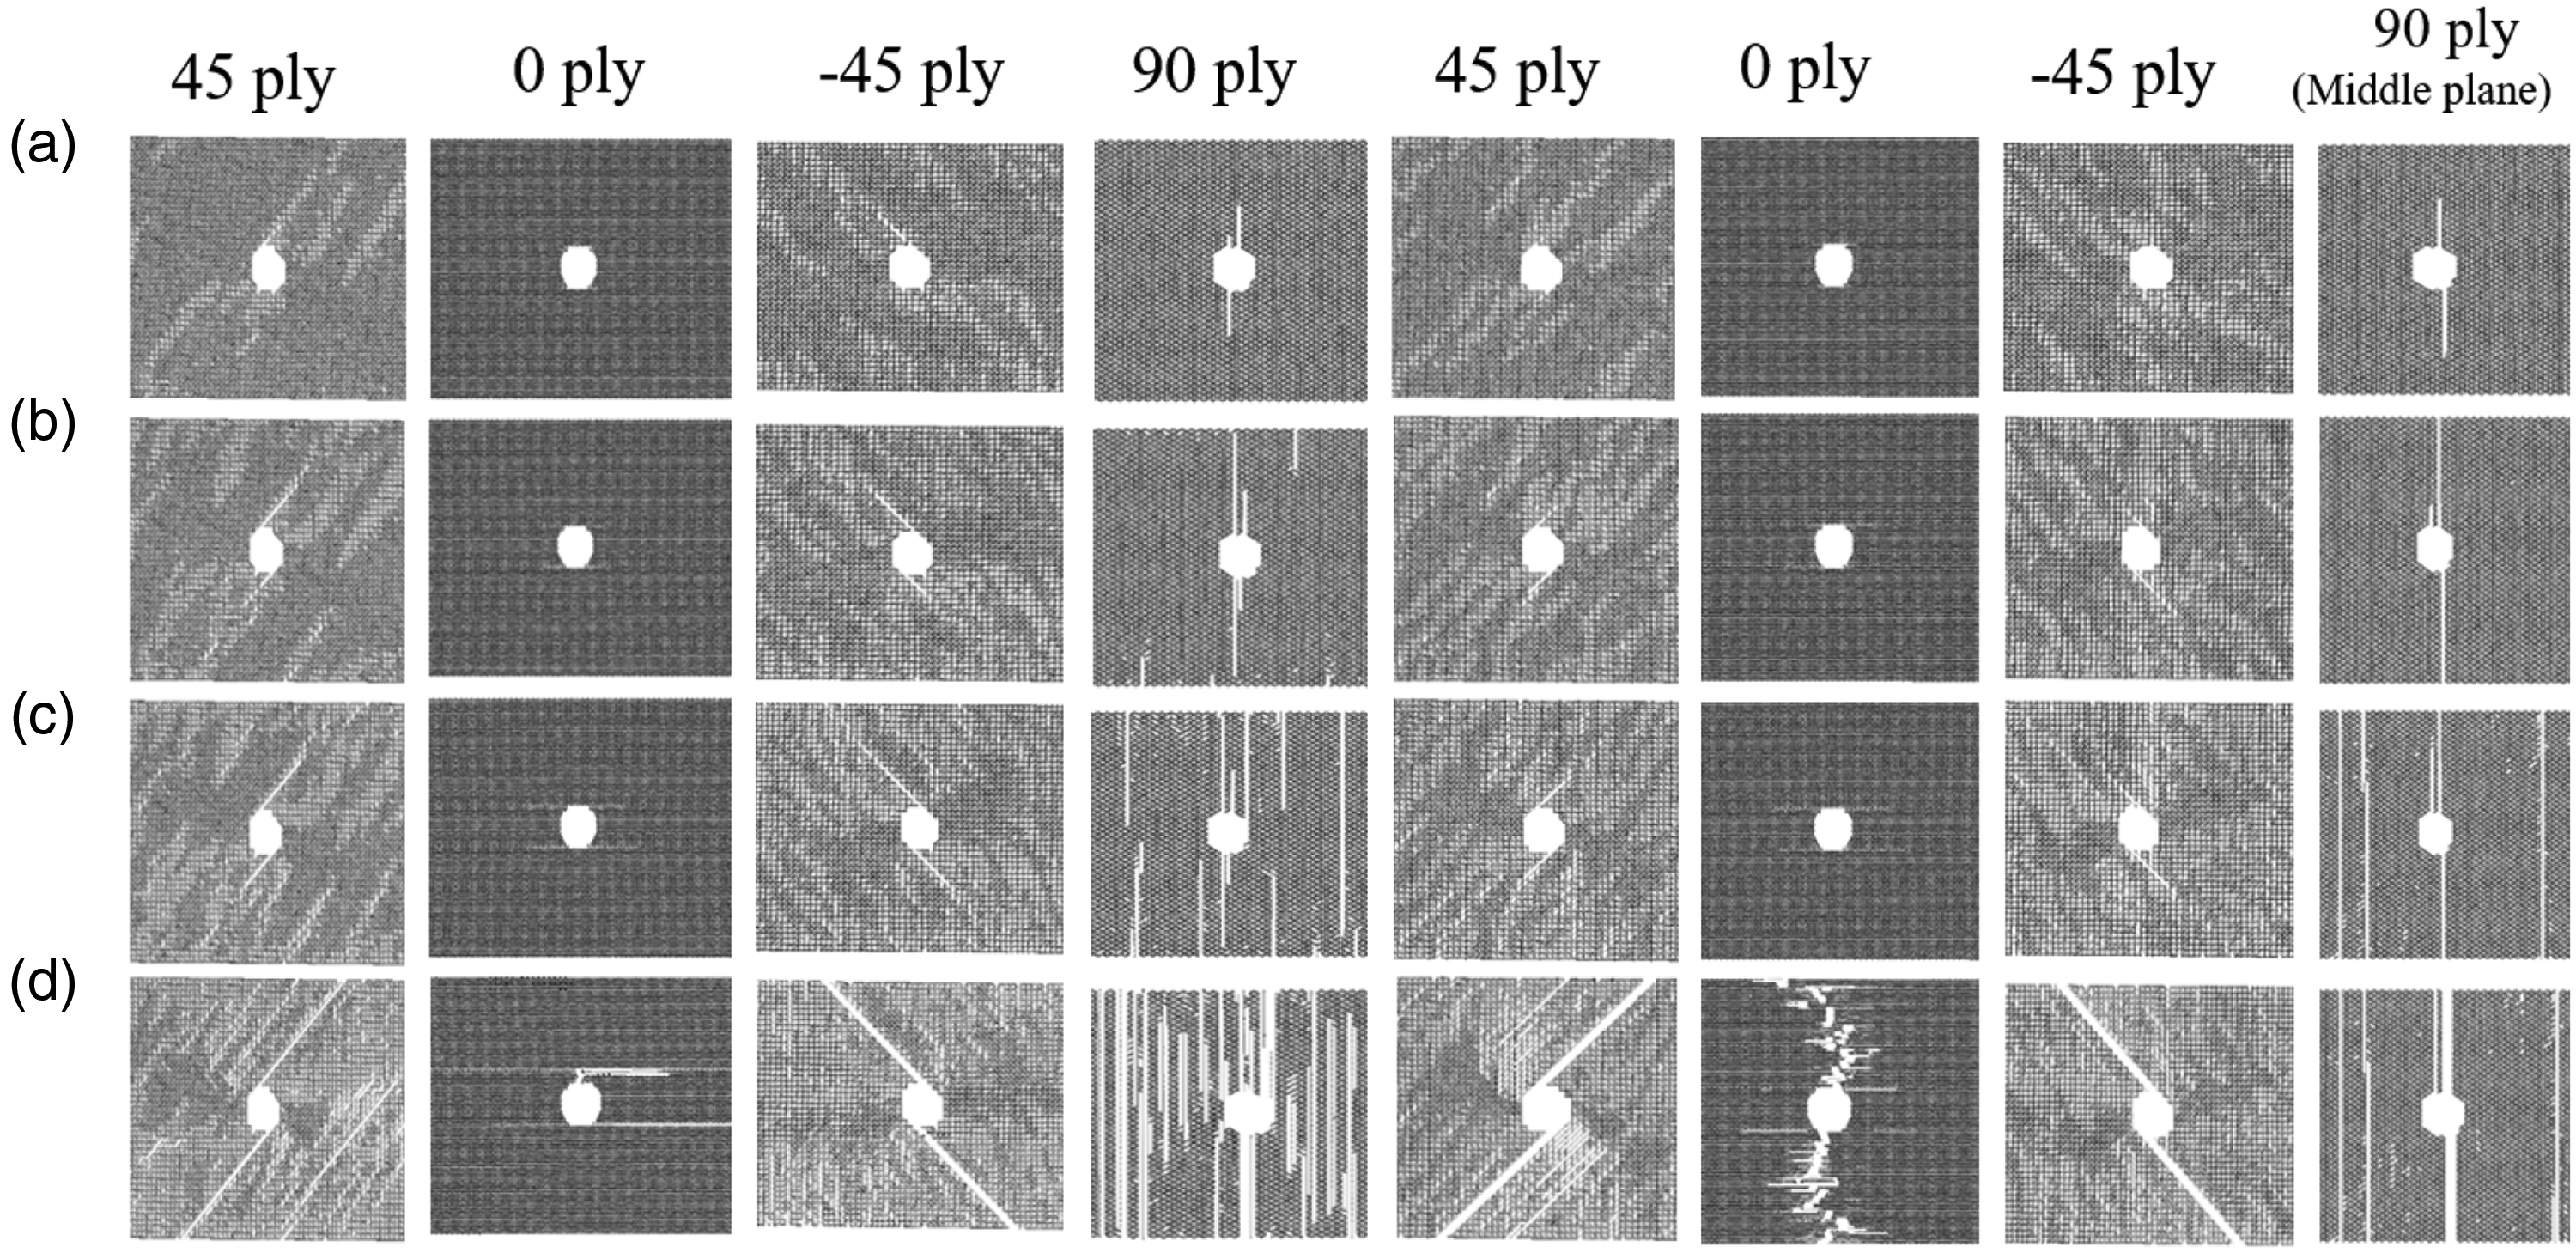
Damage initiation and propagation of each ply within the
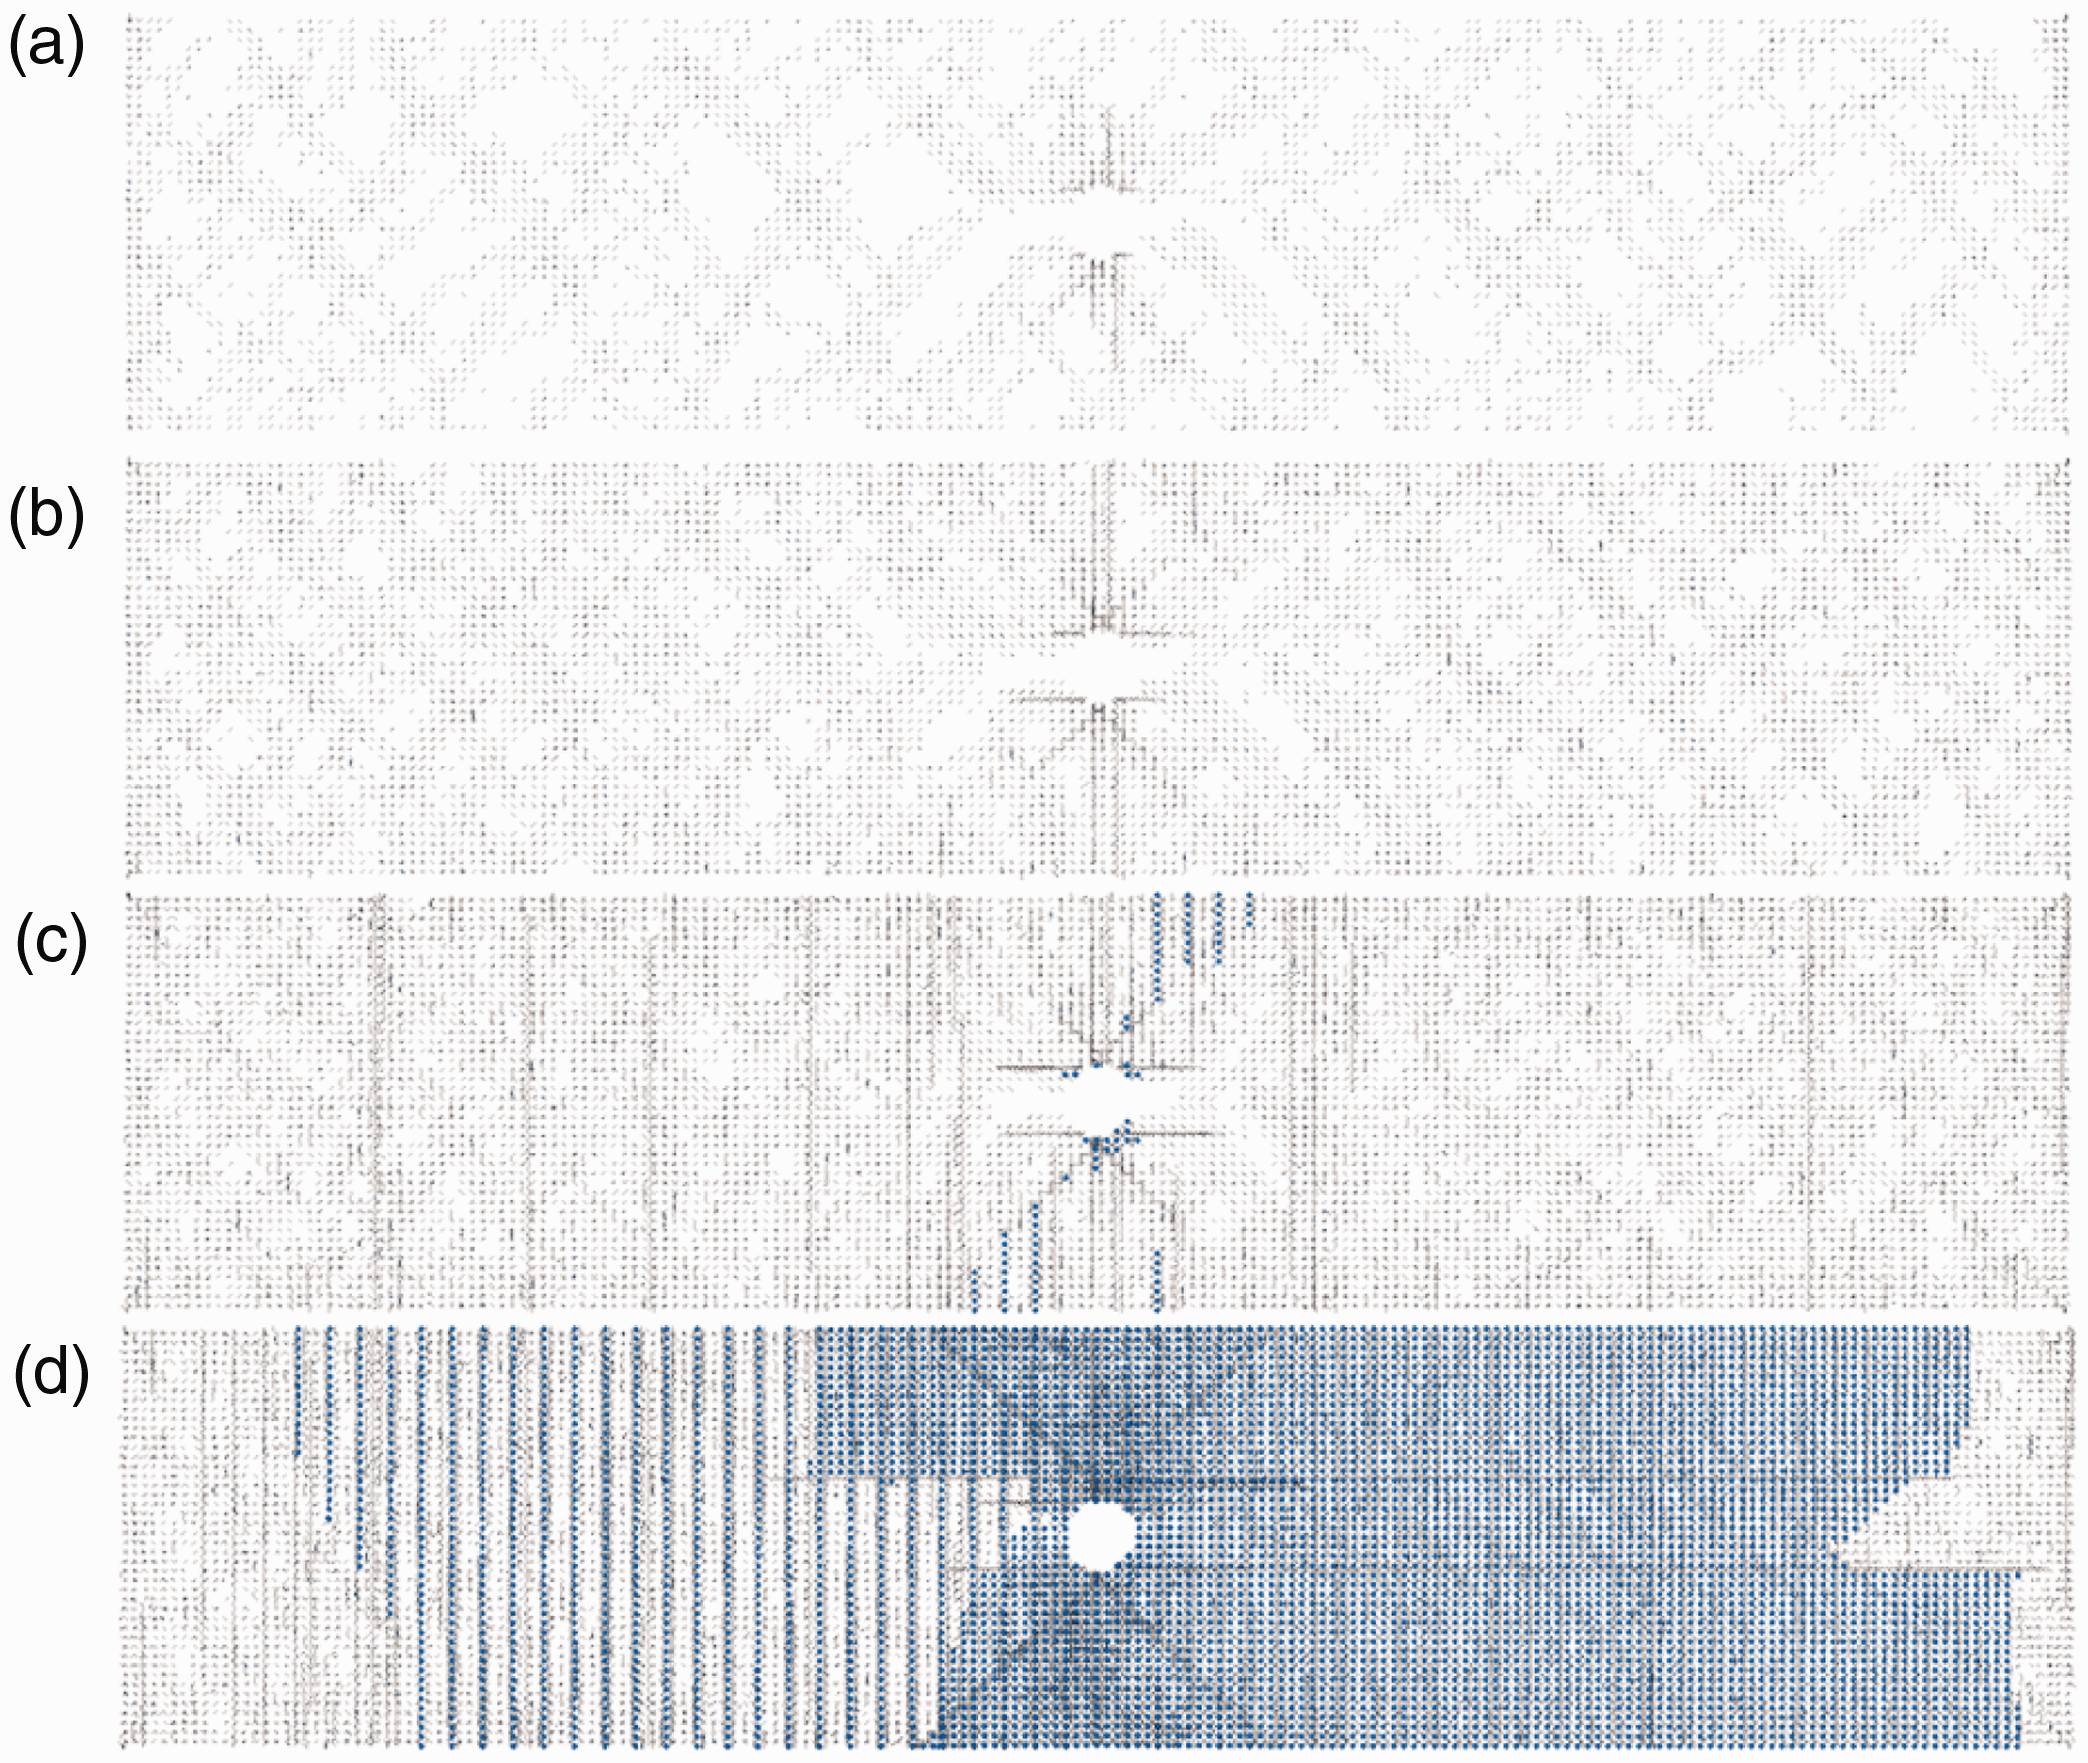
Damage initiation and propagation of interface of
In the second stage of damage development, the isolated cracks and splits in different plies joined together with associated local delaminations at the inner delamination regions, as shown in Figure 15(b) and (c). The delamination was initiated at the hole edge nearest to the 90∘ plies and propagated along the thickness direction towards the middle plane through the cracks in the adjacent plies. However, when the delamination propagation stepping up and down reached the 0∘ plies, it would be obstructed by the 0∘ plies, thus changing the propagation to the length direction. It can be seen in Figures 14(b) and (c) and 15(b) and (c) that the cracks in 0∘ plies can be captured since the loading strain ε reaches 0.44%, and then propagate along fibers from the hole edge, resulting in the splits of fibers at the strain of 0.58%. Piles pulled apart from each other, and cracks in the different interfaces were found, where damage propagation in the form of delamination cracks passed through the neighboring interface. After the 90∘ plies lost the capability of carrying loads, the cracks propagated from the interface to
In the third stage of damage development, the cracks propagated across the width from the inner delamination region to the outer delamination region until the free edge of the specimen. The first damage across the width of the specimen is in the 90∘ ply at the middle plane of the model, which is followed by
The propagation process of the delamination is seen in Figure 15(c) and (d). In addition, when the stress concentration accumulated in the 0∘ plies, reaching the strength of the highly deformed bonds, and then the redistribution of stress would occur, thereby delaying the fiber fracture (see Figure 14(d)), as explained in Mollenhauer et al.. 53 It should be noted that the delamination cracking is symmetric in the early loading stage while it becomes asymmetric when the strain is beyond 0.7%, which is probably due to the random distribution of bond strength at the interface, where the weakest bonds lead the progressive cracking path.
The damage zones in the third stage of damage are illustrated in Figure 16 with the comparison of results from experimental X-Ray techniques and DEM modeling. The delamination around the hole edge is clearly visible due to the high shear stress and Poisson’s ratio, and the same phenomenon is also found in the numerical results, where damage zones are represented by cracks at different loading strains (Figure 16(b) and (c)). Figure 16(b) suggests that the symmetric damage zones represented by the superimposed cracks start to emerge when the loading strain reaches 0.58%. As the strain increases until 0.73%, the triangular damage zone becomes more obvious, as shown in Figure 16(c), in which the yellow lines follow the edge of the damage regions.
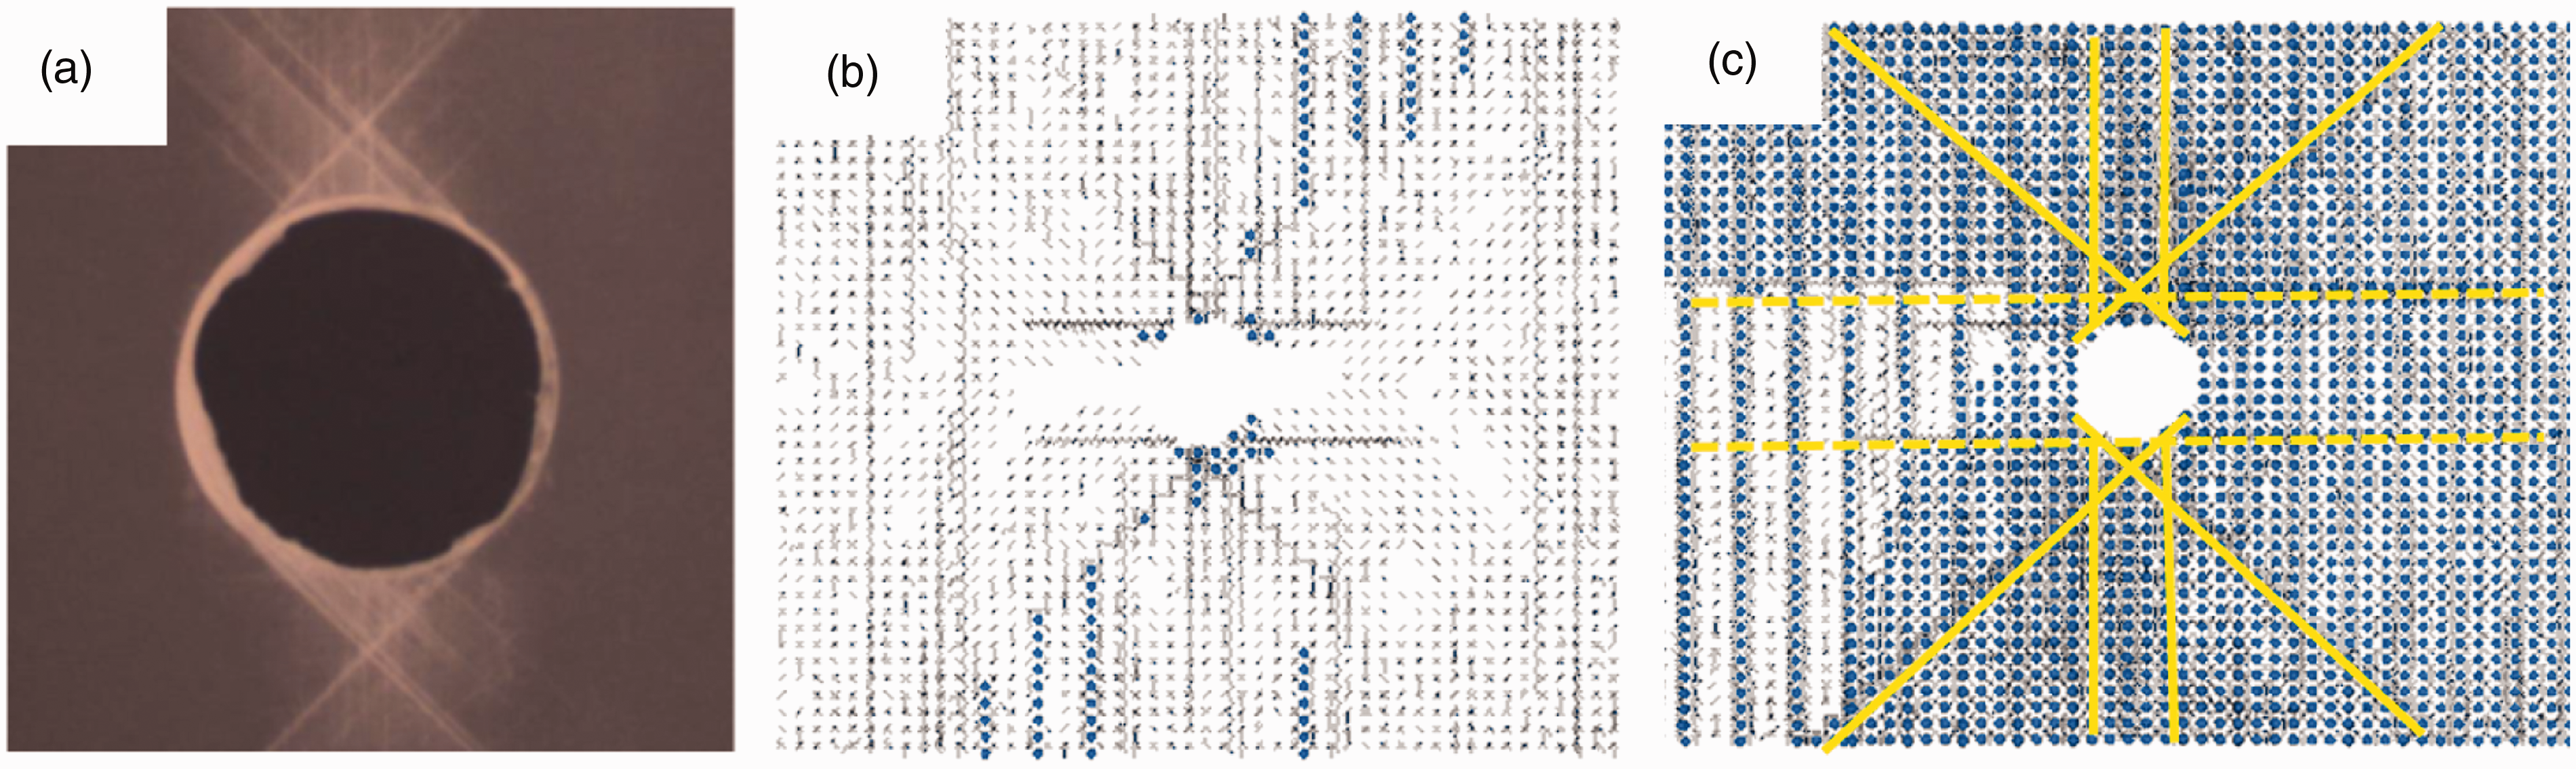
Damage zones associated with
The final catastrophic failure occurred in the form of fiber fracture when loading stress reached 378 MPa in the experiments and 340 MPa in the numerical simulation. Figure 17 shows the comparison of final surface-ply (
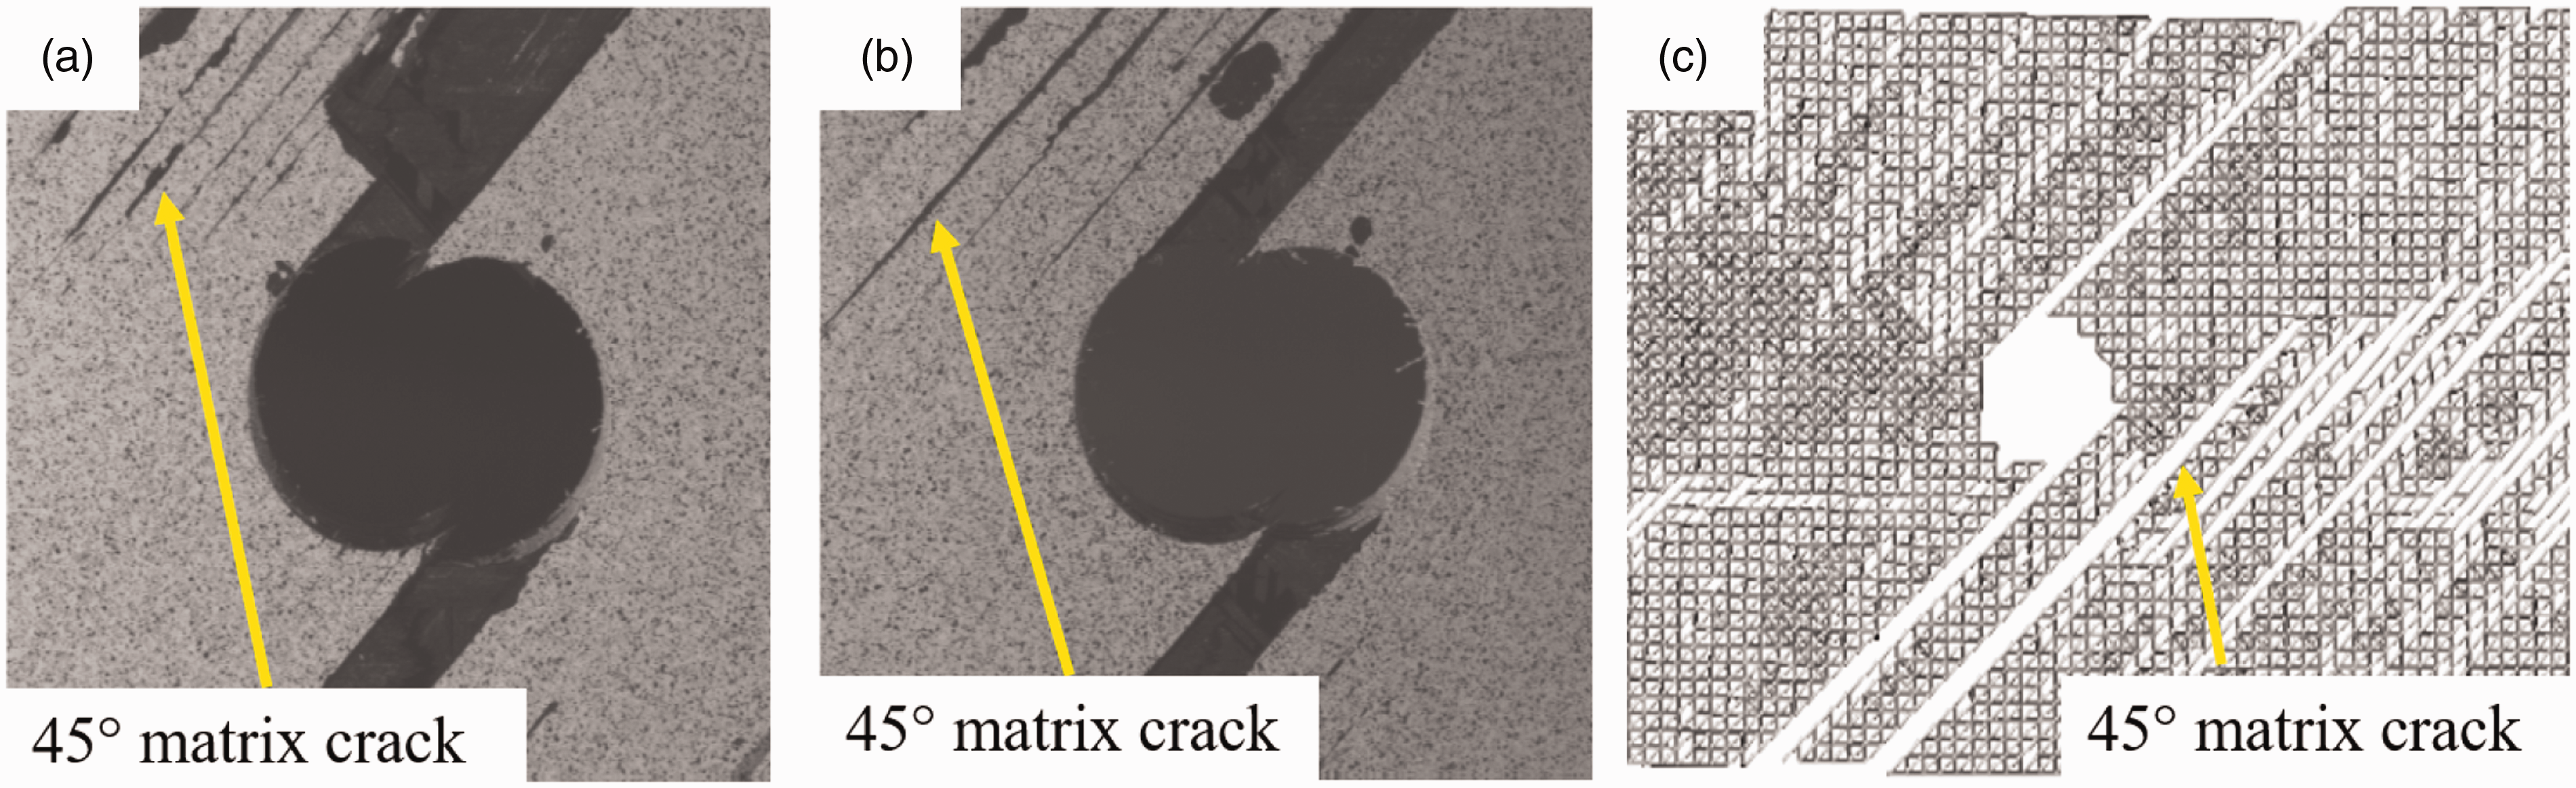
Comparison of final surface-ply cracks in the
Conclusions
In this study, the progressive failure of carbon fiber-reinforced composite laminates under uniaxial tension was numerically investigated by means of 3D DEM modeling. Extended 2D hexagonal and square packing strategies were adopted for the construction of 0∘ and 90∘ plies, and 45∘ ply, respectively. The parallel bond model was utilized to capture the constitutive behaviors of the bond between neighboring particles. The relationship between the bond stiffness and material properties was established based on the average strain energy method. The random distribution of bond strengths calibrated from experiments with a variation of 30% and 10% following a normal distribution law are assigned to the bonds in 0∘ and 90∘ plies to capture random cracks, respectively. The bond strength of 45% ply in the composite was calibrated from the failure strength prediction by the Tsai-Hill failure criterion. The maximum stress failure criterion was applied to predict the bond breakage of the DEM models.
Quantitative analysis was conducted for progressive damage prediction of the cross-ply M21/T800 CFRP with a stacking sequence of
The qualitative analysis of failure prediction of the
Besides, it is important to note that this is the preliminary attempt to investigate the damage initiation and propagation using 3D DEM solution. Currently, we are working on the quantitative analysis of the OHT problem with our experimental data. With the implementation of a more sophisticated cohesive model or seven-bond interface model for the interlaminar interface, the developed 3D model could be applied to predict the damage progression and failure strength of available composite laminates under more complex multiaxial loading conditions. From the perspective of computational cost, the simulations of cross-ply composite laminates under tensile loading cost around 9 h to reach its prescribed loading strain, while the simulation of the QI composite laminates with an open hole costs 40 h to reach its final failure. Of note, the automatic timestep mode should be utilized since it can adjust automatically and accordingly when bonds break, based on the current stiffnesses and masses of all objects in the system. In the future, GPU-based DEM code should be developed for the automatic generation of composite lay-up process and saving the computational cost, when more detailed damages in composite laminates can be captured with a larger DEM model.
Footnotes
Acknowledgements
We thank Dr. Harriet Peel at University of Manchester for proofreading this manuscript.
Declaration of Conflicting Interests
The author(s) declared no potential conflicts of interest with respect to the research, authorship, and/or publication of this article.
Funding
The author(s) disclosed receipt of the following financial support for the research, authorship, and/or publication of this article: This work was supported by the China Scholarship Council (CSC) and University of Leeds.