
Abstract
A cohesive zone model for delamination propagation in laminated composites under static and fatigue loading has been derived and validated with experimental data under different mode conditions. This study presents a new approach to quantify fatigue delamination degradation based on damage mechanics to evaluate the rate of fatigue damage (
Introduction
Fatigue-driven delamination in laminated composites is one of the general failure modes in composite structure e.g. airplanes, automobiles and wind turbines, all of which undergo cyclic loading. 1 Fatigue is also a major contributor to failures in rotating machinery and has been addressed in many research work.2, 3 Life estimation of composite materials is considered a serious challenge for engineers because of the uncertainties associated with damage initiation sites and propagation direction in these composites. There is a real and urgent need for reliable analytical methods to reduce the time and cost of experimental testing, and to enable optimally designed structures. 4
In composite structures, it is important to detect the damage at an early stage of failure and to know how the damage will grow during the service life of structures. A relationship between fatigue crack growth and stress intensity factor is generally written as a power law (i.e. the Paris law) for metals and composite materials. 5
Different approaches have been employed to analyse fatigue delamination growth, such as linear elastic fracture mechanics e.g. the virtual crack closure technique (VCCT), and cohesive zone models. Although the VCCT technique is widely used to simulate fatigue crack propagation, it has some limitations regarding crack path and re-meshing requirements. An alternative to the VCCT to simulate interface crack propagation, such as delamination in composite materials, is the cohesive zone model.
Over the last twenty years many researchers have used finite element methods, including the cohesive zone model, rather than attempt analytical solutions to simulate crack growth
Maiti and Geubelle 6 introduced the instantaneous interface stiffness degradation law under cyclical fatigue loading. The rate of change of cohesive stiffness was defined as a function of the number of cycles. They proposed a power law for the cohesive model that can be expressed in terms of discretized time steps. While the instantaneous cohesive stiffness was assumed by Serebrinsky and Ortiz 7 to degrade exponentially with each unloading-reloading cycle.
Load envelope methods have been suggested by many researcher8–14 to simulate fatigue damage growth based on experimental Paris law curves.
Gornet and Ijaz 15 investigated high-cyclic elastic fatigue damage model for carbon fiber epoxy matrix laminates. A classical interface damage was used to predict the fatigue damage parameters for different mode-mixtures.
Nojavan et al. 4 proposed a non-Paris law based fatigue cohesive zone model. The authors assumed a simple power law for fatigue delamination growth under pure Mode I and Mode II loading. Although their proposed model can predict mixed mode delamination growth from simple parameters, their research demonstrated that the suggested cohesive zone model can not be used for arbitrary damage onset and propagation. Therefore, a crack path must be pre-defined in order to arrange the elements along the crack path in the finite element model.
Fatigue loading
Composite structures can be subject to cyclic loads with different wave shapes such as sinusoidal, square, etc. The load fluctuates with a certain frequency (fn) with a constant amplitude and produces a periodical stress or strain. Figure 1 shows typical sinusoidal and square loading curves with relevant parameters i.e. average stress is ((σmax+σmin)/2), stress amplitude is (((σmax−σmin))/2), and R-ratio (σmin/σmax). High amplitudes of fatigue loading reduce the remaining life of the structure. 16
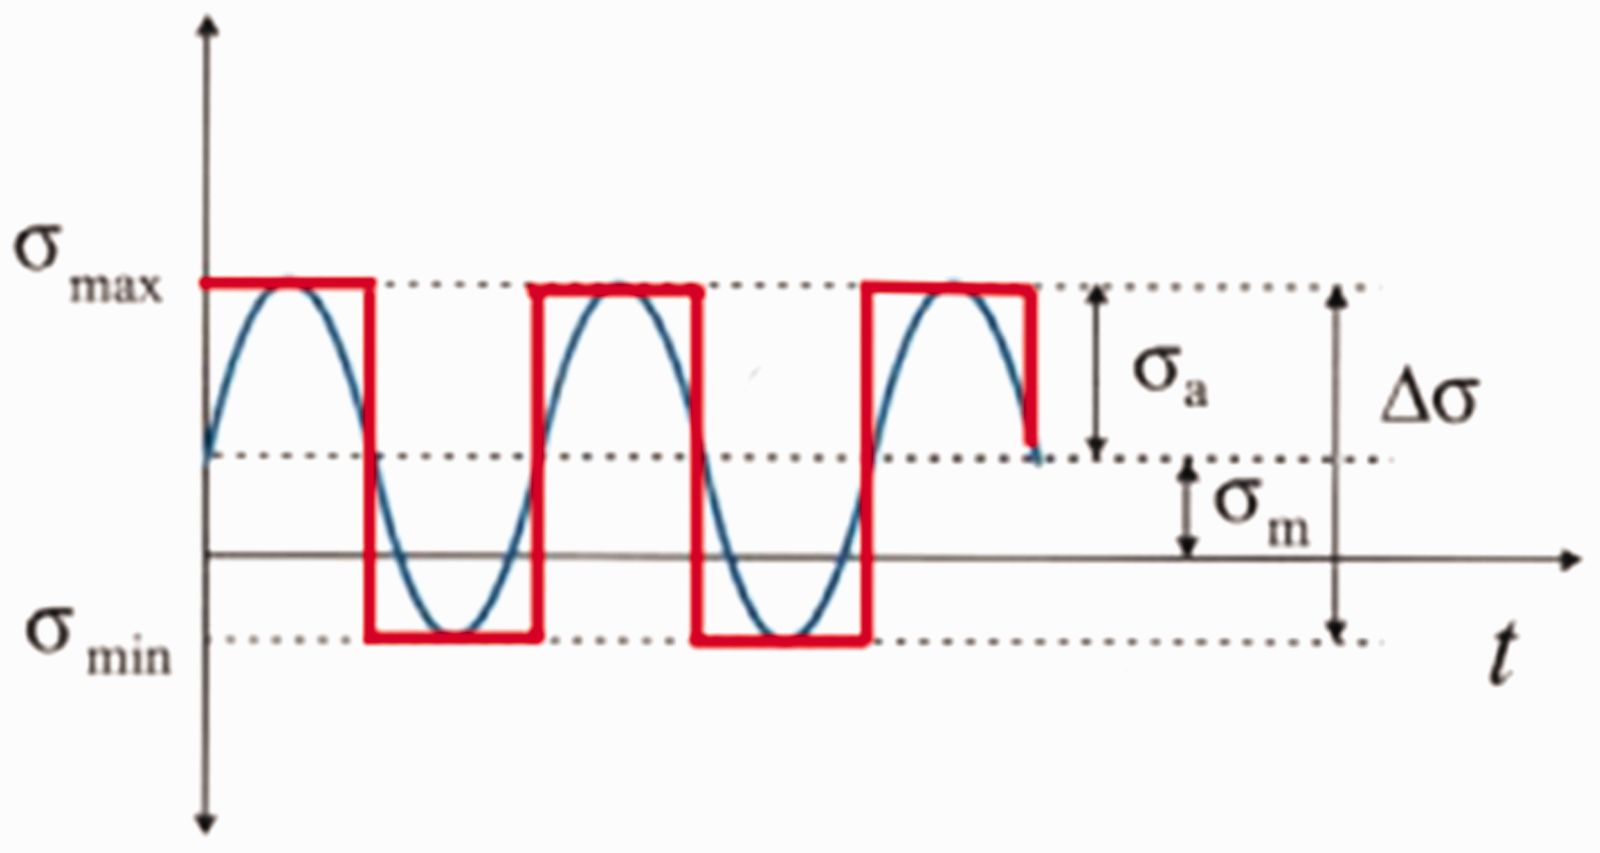
Sinusoidal and square stress functions.
In fracture mechanics, the crack growth rate depends on the stress intensity factor or the energy release rate, and propagates according to the Paris law. In the last few years many researchers have introduced algorithms into the cohesive zone model which include fatigue damage degradation. Belnoue et al.
17
employed the Paris law to represent fatigue in an interface element based on change in strain energy release rate, ΔG. The crack growth rate,

When the specimen is under mixed mode loading, i.e. Mode I and Mode II, the parameters C and m can be determined depending on linear or parabolic equations based on pure mode cases as in the following expressions
12
Linear rule
Parabolic rule


where the subscripts I and II indicates Mode I, Mode II, and mode ratio. mm is a mixed mode parameter to be experimentally determined.
Fatigue delamination does not propagate if the strain energy rate does not reach the threshold value Gth. In this region no measurable fatigue crack growth occurs and it is called subcritical growth region, as shown in Figure 2 (Region I). The delamination grows linearly when the energy release rate during the cyclic loading exceeds the threshold value. This is known as the region of stable growth (Region II) when plotted on a log–log scale, as shown in Figure 2. The nonlinear or unstable growth (Region III) occurs if the strain energy release rate is near to the static fracture energy Gc, see Figure 2. 13
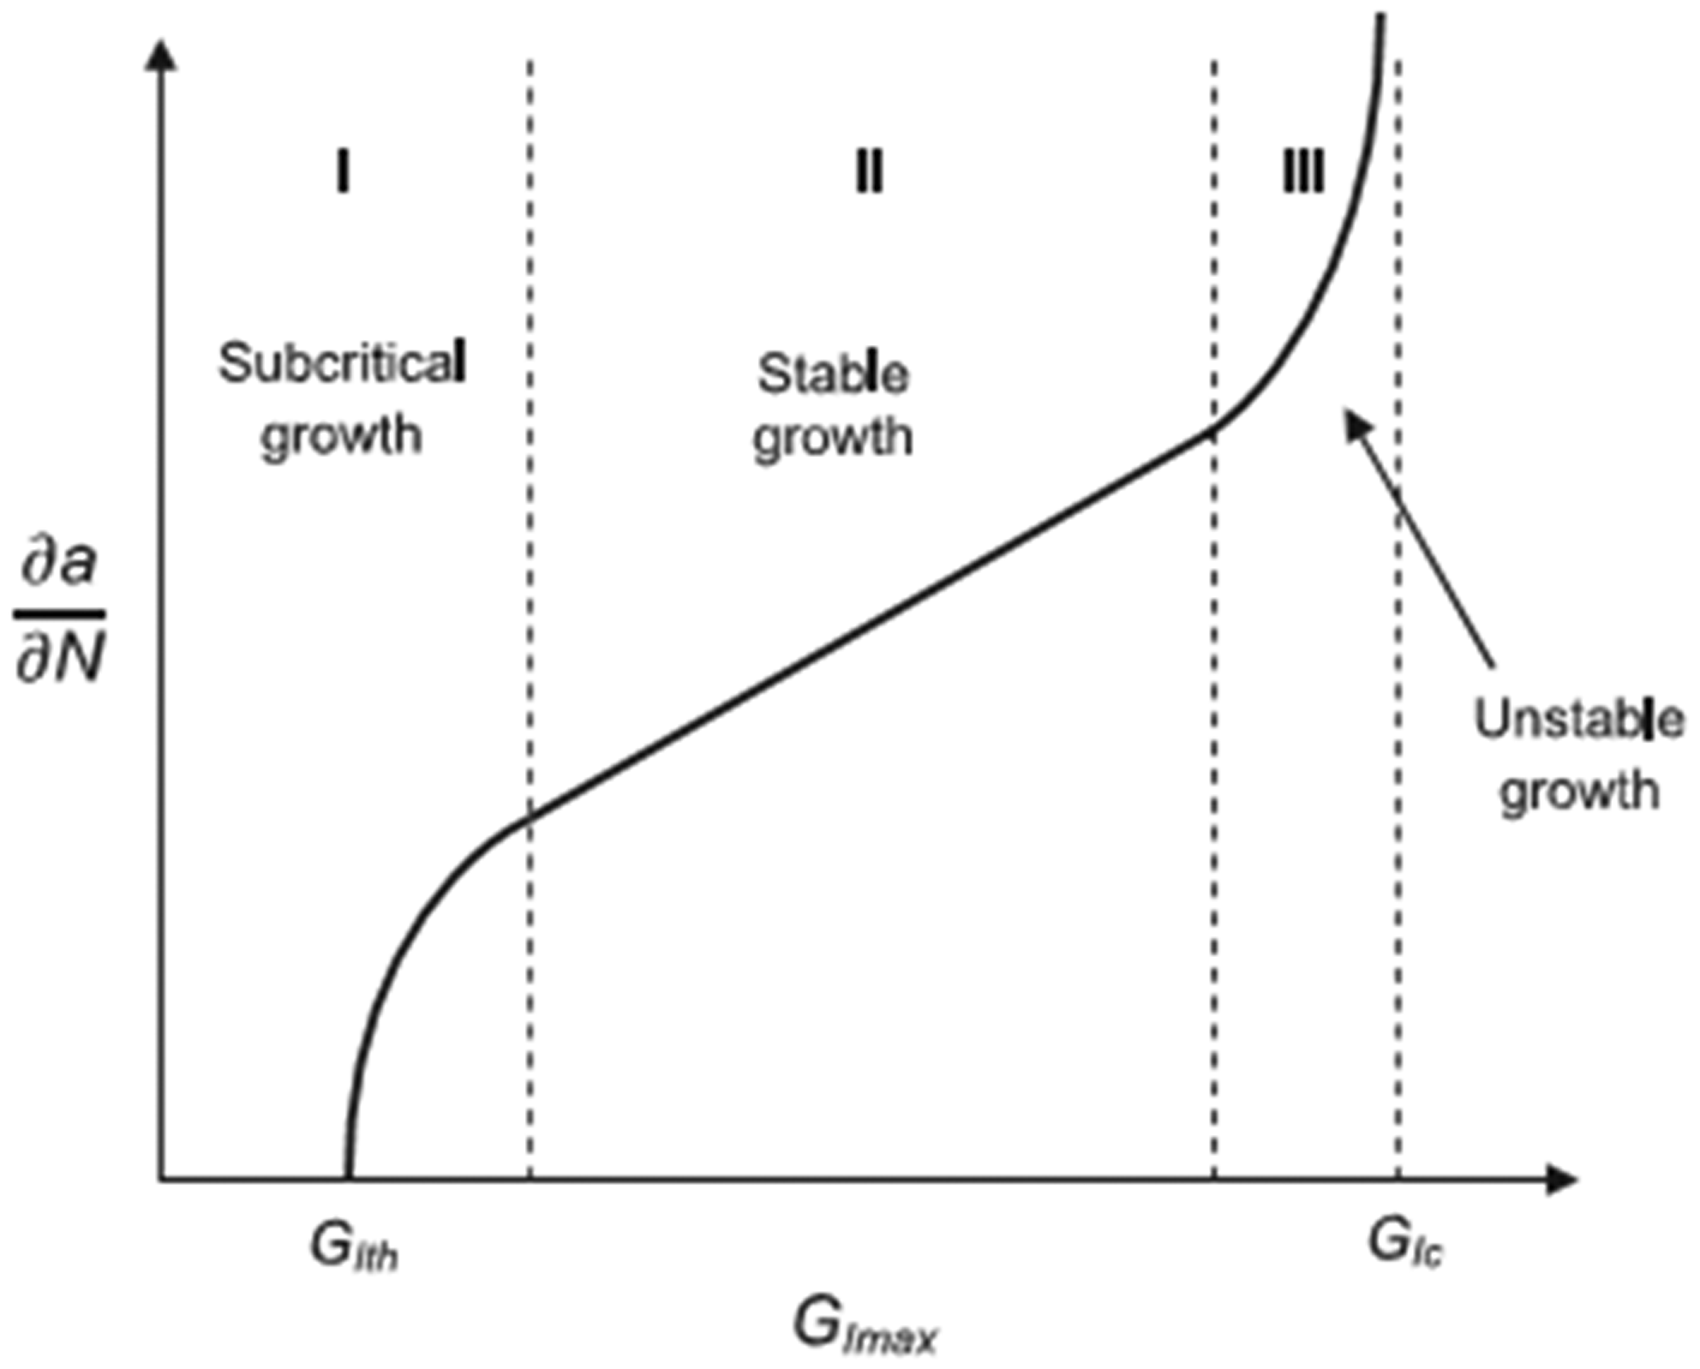
Typical fatigue delamination growth curve. 13
The change in strain energy rate during fatigue loading can be calculated from the instantaneous maximum strain energy and the load ratio R as
17

The interface element is easily simulated in a numerical model based on traction-separation responses, the fracture process zone ahead of a crack tip can be modelled using a CZM. Many different types of traction-separation relations have been investigated in the literature e.g. polynomial law, 18 trapezoidal model, 19 perfectly plastic relationship, 20 exponential law, 21 and bilinear cohesive law. 22 Among these the bilinear law gives good convergence of the finite element model and numerically is the simplest formulation.13,23
It is worthwhile to mention that the static damage evolution should be included in modelling the delamination growth under fatigue conditions. The total damage parameter can be calculated during cyclic loading as:

The total damage


Energy release rate at the crack tip can be calculated by integrating the traction-separation curve under cyclic loading, unless complete failure occurs. The fatigue loading causes stiffness degradation in the interface element, this leads to increase separation as total damage evolution accumulates. The highest strain energy release rate will be in those elements that lie in the process zone near to the numerical crack tip. The response of traction separation will follow a non-vertical path which matches the bi-linear law for static loading according to Turon et al. 9 and Harper and Hallett. 24
Developed fatigue damage degradation
The quadratic nominal stress criterion to predict the onset of delamination under mixed mode loading is one of the most frequently adopted failure criteria.
25
This criterion has been successfully utilized by many researchers e.g. Hameed et al.,
26
Zou and Hameed,
27
Belnoue et al.
17
and Kawashita and Hallett,
12
and is written as;
Damage growth under pure-mode loading is predicted using the energy release rate during loading and unloading, and fracture toughness:
The static damage evaluation is derived from damage surface concept and is written as:
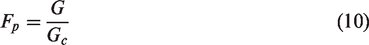
Damage initiation criterion (
From this condition, the static damage evaluation can be expressed as
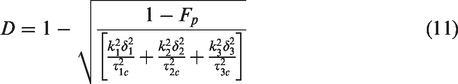
The ratio between damaged (
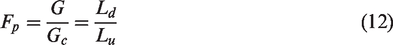
Where
Substitute equation (12) into the static damage evaluation equation (11), to obtain the relation between damage evaluation and damaged length ratio;
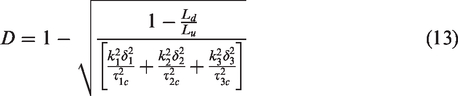
By differentiating the above equation with respect to the damaged length, we obtain a novel term
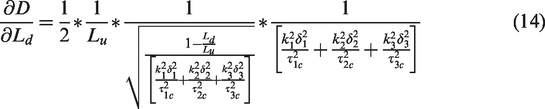
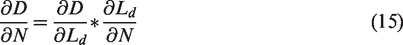
The evaluation of the rate of fatigue damage for each cyclic loading (
So,
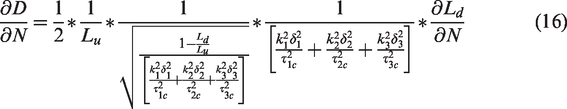
The damage accumulates ahead of the crack tip in the fracture process zone to give additional delamination length. This new length of delamination is calculated based on the damage fatigue crack lengths,
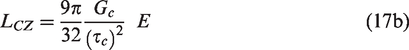
E is the Young’s modulus of the material.
The equation (17a) is derived with respect to the number of cycles to obtain the crack growth rate,
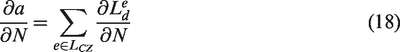
The incremental rate of delamination is assumed to be equal for all elements within the cohesive zone area. Therefore, the summation sign can be rewritten in terms of the number of elements (
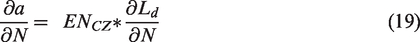

By substituting equation (19) into equation (16), the rate of fatigue damage (
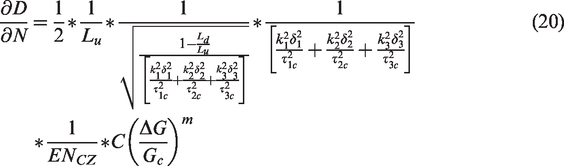
In the UMAT subroutine, the fatigue damage degradation is updated in the model for each time-step as;


Double cantilever beam (DCB) model
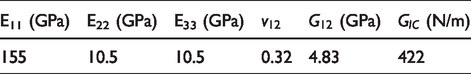
Double cantilever beam (DCB) specimens as reported by Landry and LaPlante 13 were adopted for this numerical simulation. The length and width of the specimen was 150 mm and 20 mm respectively with pre-crack length of 50 mm. The specimens have two unidirectional 16 ply-thick (3 mm thick) layers made from carbon/epoxy with material properties shown in Table 1. All simulations in this study were subjected to Mode I static and fatigue loading, and carried out using commercial finite element software ABAQUS. A two dimensional finite element model of DCB was implemented to reduce computational effort and save computer time. The layers were meshed using 4-node plane strain elements, whereas the cohesive elements were meshed with element type COH2D4 and placed between layers where the crack was expected to propagate.
Material properties of the carbon/epoxy layers used. 13
First, the static load was numerically applied on the DCB by specifying an opening displacement of each cantilever arm. The numerical results for energy as a function of displacement have been validated with experimental data reported by Landry and LaPlante. 13 The response of strain energy with each initial displacement is in good agreement with experimental results, as shown in Figure 3.
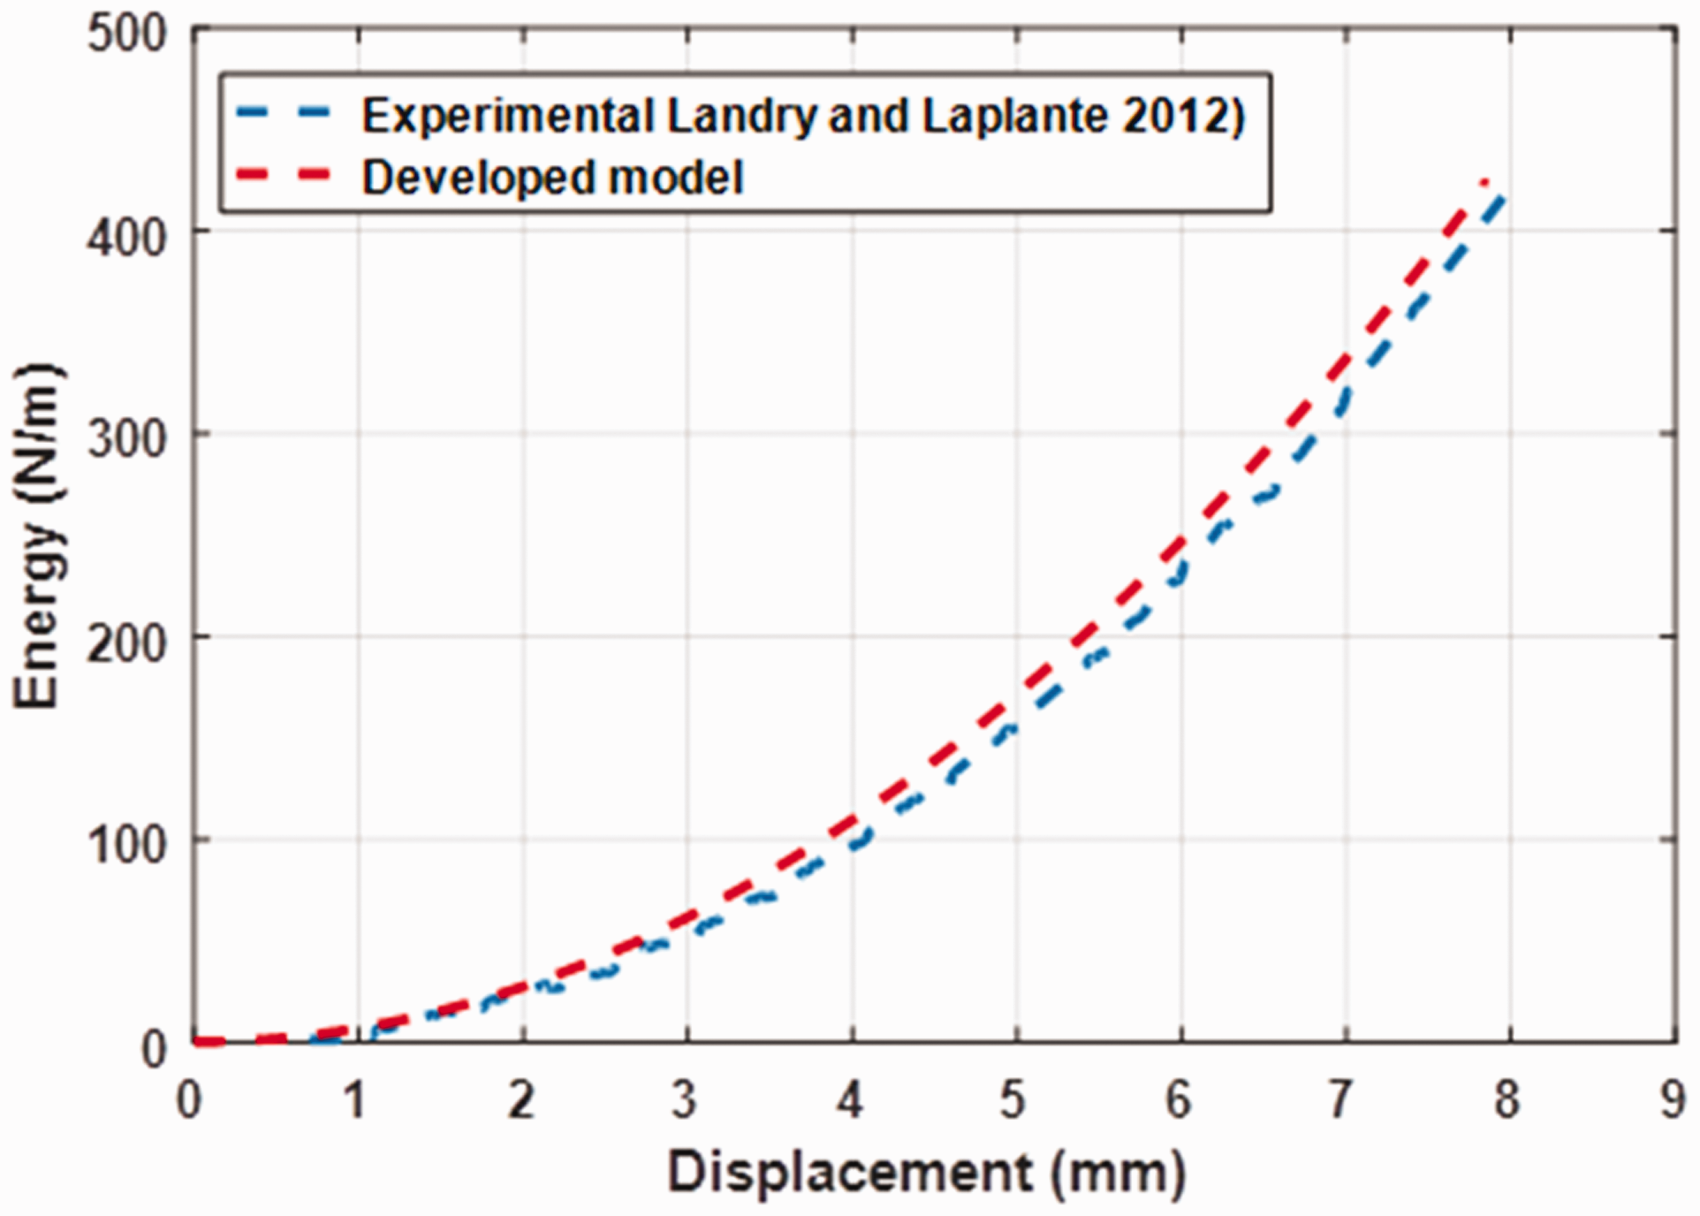
Comparison between developed model and experimental results of fracture toughness.
The experimental procedure was performed by Landry and LaPlante 13 as follows; the specimens were cracked approximately 5 mm and then subsequently subjected to the quasi-static load. When opening displacement reached to 9.5 mm, the static load was stopped and then, sinusoidal displacement cycles with an amplitude of 8 mm were performed.
The novel approach to fatigue damage degradation was implement in ABAQUS via the UMAT subroutine. It was necessary to define the cohesive zone length in the model which was estimated based on traction values, fracture toughness and Young’s modulus of the cohesive material. Fatigue delamination growth is determined by relating the damage accumulation of cohesive elements to the Paris growth law, equation (20). The damage accumulates with each cyclic loading based on equation (21) to produce a new crack length. Figure 4 illustrates damage accumulation for the DCB under different numbers of cycles. It is clear that the delamination length increases when the number of cycles increases from 250 to 3500. The difference between the experimental results and developed model is determined as;
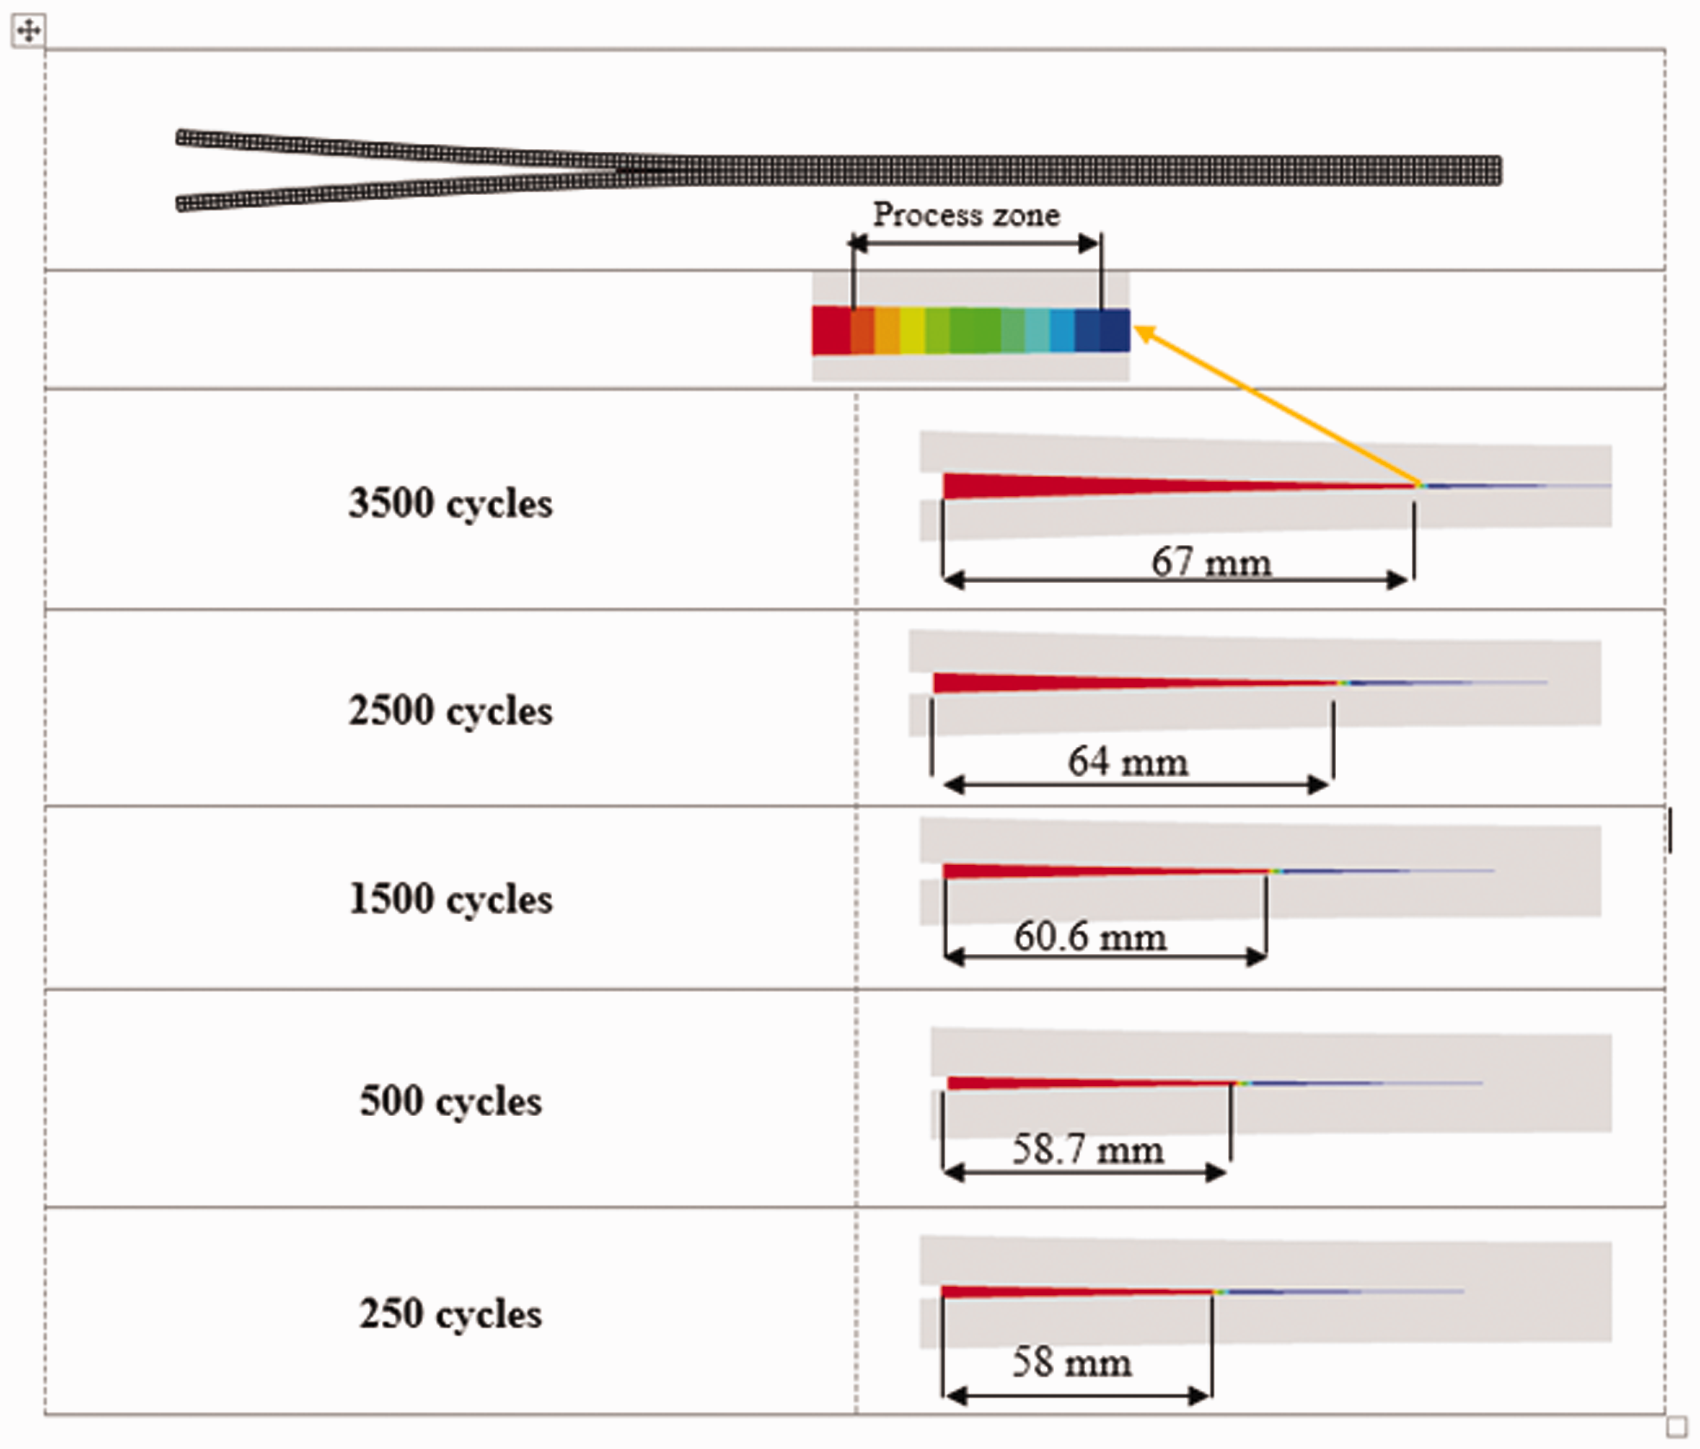
Delamination growth in DCB under different cyclic loading.
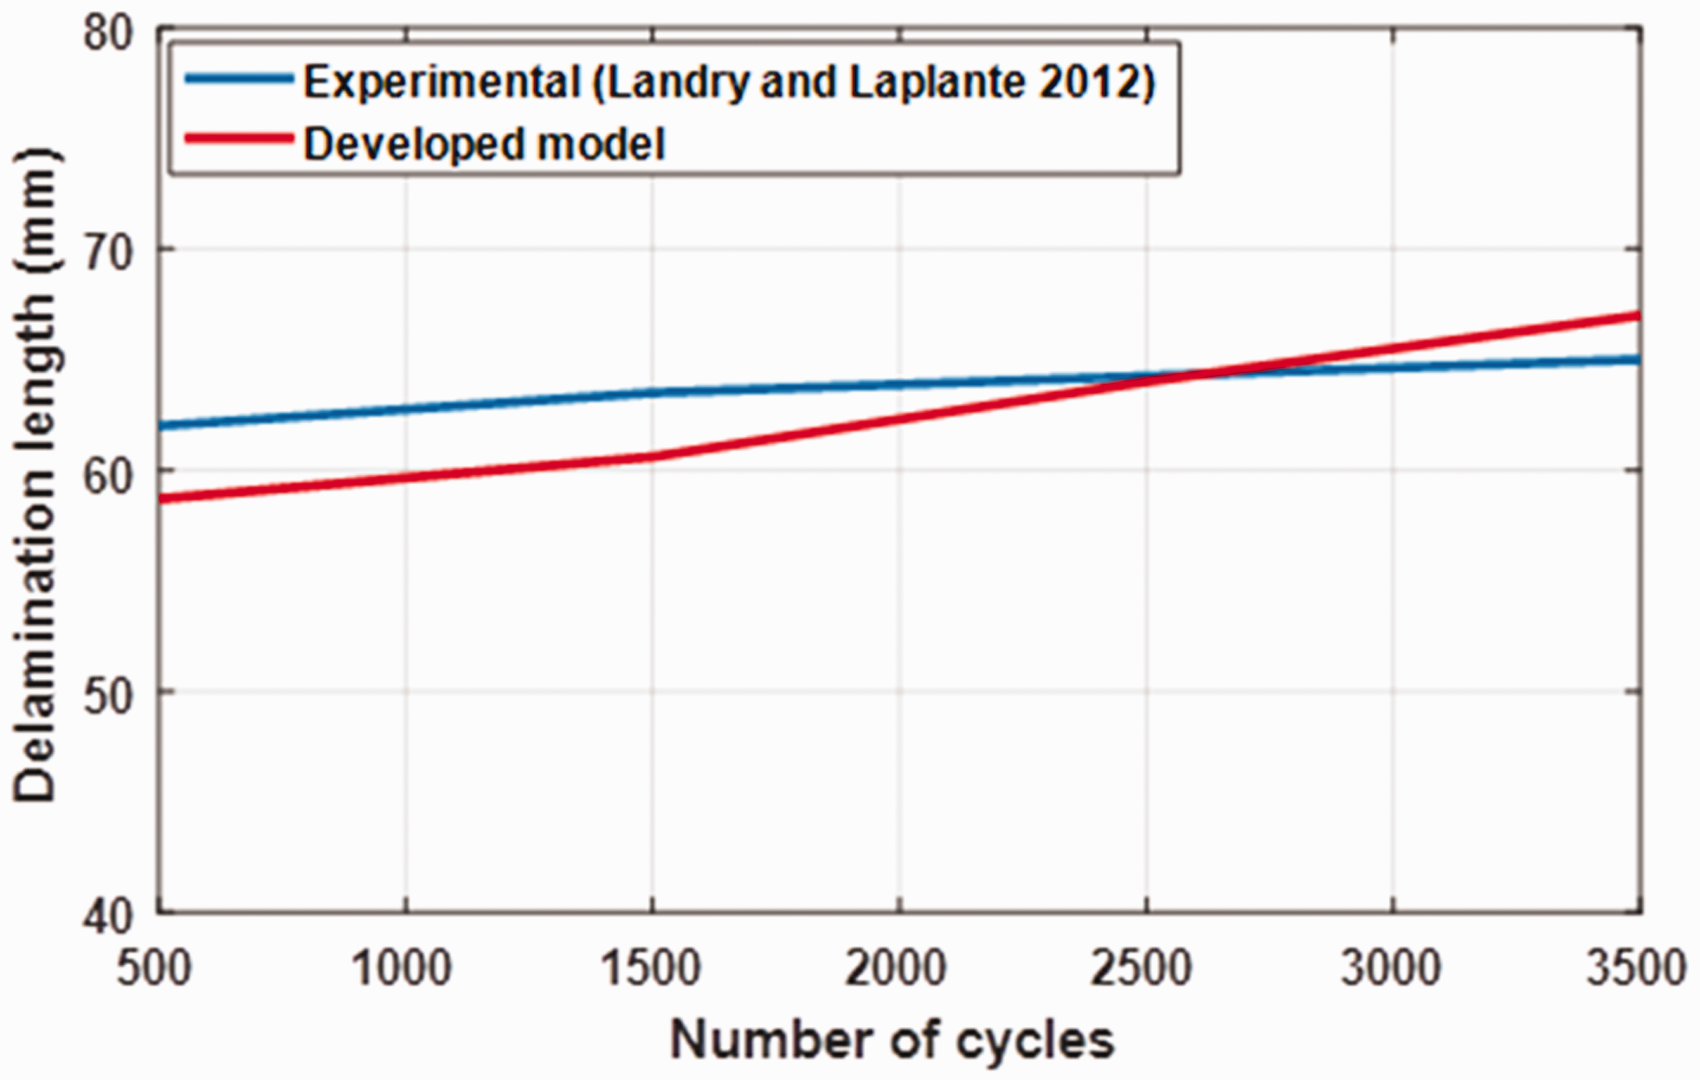
Comparison between developed model predictions and experimental results for delamination growth.
For example, the difference at 250 cycle is calculated as;
In the same way, the difference at 3500 cycles can be determined and it is about 3% as shown in Figure 5.
The fatigue crack growth rate using developed can be represented by Paris plot as shown in Figure 6. The simulation results of mixed mode were validated against experimental data available in literature. 29
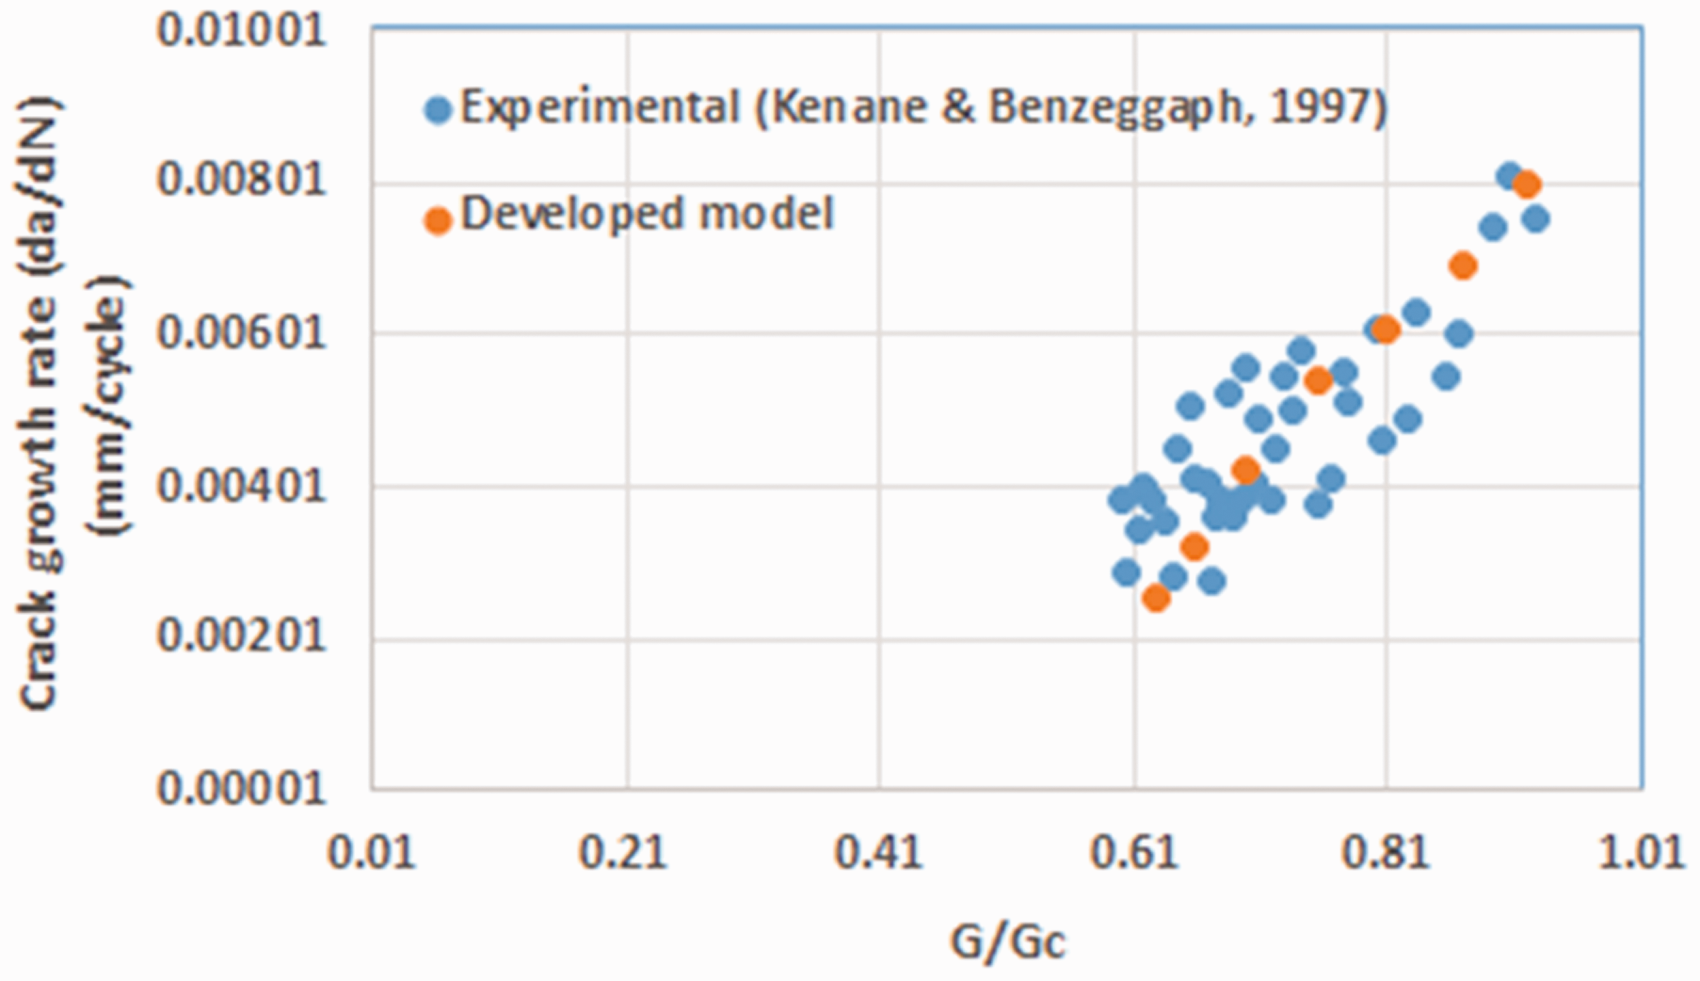
Comparison of simulated fatigue crack growth rates and experimental data available in literature. 29
Single lap joint (SLJ) model
Adhesively bonded joints have many advantages e.g. lower weight, and better fatigue performance compared with classical mechanically fastened joints. Therefore, they are used in many structural applications in industries such as automotive and aerospace. The increase in demand for adhesively bonded joints has been accompanied by investigating and developing numerical models to predict the response of the structure, and to describe the behaviour of damage in the adhesive joints. 30 The cohesive zone model is a very effective way to model adhesively bonded joints using finite element analysis
Khoramishad et al. 31 carried out static and fatigue loading of single lap joints (SLJ). The specimen consisted of two aluminium 2024-T3 layers bonded with FM 73 M OST toughened epoxy film adhesive. The substrates were pre-treated prior to bonding. This pre-treatment consisted of a chromic acid etch (CAE) and phosphoric acid anodising (PAA) followed by the application of BR 127 corrosion inhibiting primer, to maximise environmental resistance and bonding durability. The joints were cured at 120 °C, under 0.28 MPa pressure for 60 min. The dimensional details of the SLJ are shown in Figure 7. The overlap length, the width and the thickness of the bond line were 30, 12.5 and 0.2 mm, respectively.
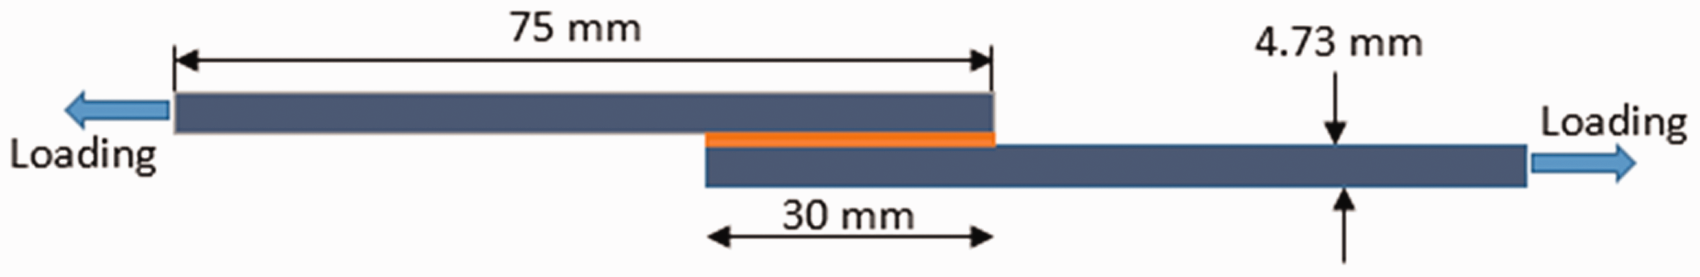
Single lap joint geometries.
The static tests were carried out by Khoramishad et al. 31 on the single lap joints (SLJ) to find cohesive zone properties e.g. fracture energy. The displacement control was applied to the specimen at a rate of 0.1 mm/min. Average static strengths of 10.0 kN was observed for the SLJ. After that, the single lap joints (SLJ) specimen was tested under fatigue load condition at 5 Hz with a load ratio of 0.1.
The interface element length used over the cohesive zone depends on mesh size in the finite element model. It effects the sensitivity of the fatigue response according to Naghipour et al. 32 Vassilopoulos, 5 in previous studies investigated the effect of mesh element size on convergence of the numerical model and found that using a mesh size less than 1 mm for the interface element provided better solution convergence. Therefore, in the present simulation the element size adopted for the adhesive was 0.2 mm.
Fatigue modelling was performed at maximum fatigue load of 40% of the static final failure load which was measured experimentally at about 10 kN. When the specimen was loaded statically at 4 kN, as shown Figure 8, it can be seen that, initially, the damage parameter is less than unity for each of the three elements. When the fatigue loading was activated, the first and second elements needed 200 cycles for the rate of increase of damage to begin to accelerate rapidly whereas in the third element the rate of increase of damage began to accelerate after about 500 cycles. This was because the value of the damage parameter for the third element at the end of the static stage was less than for the first and second elements.
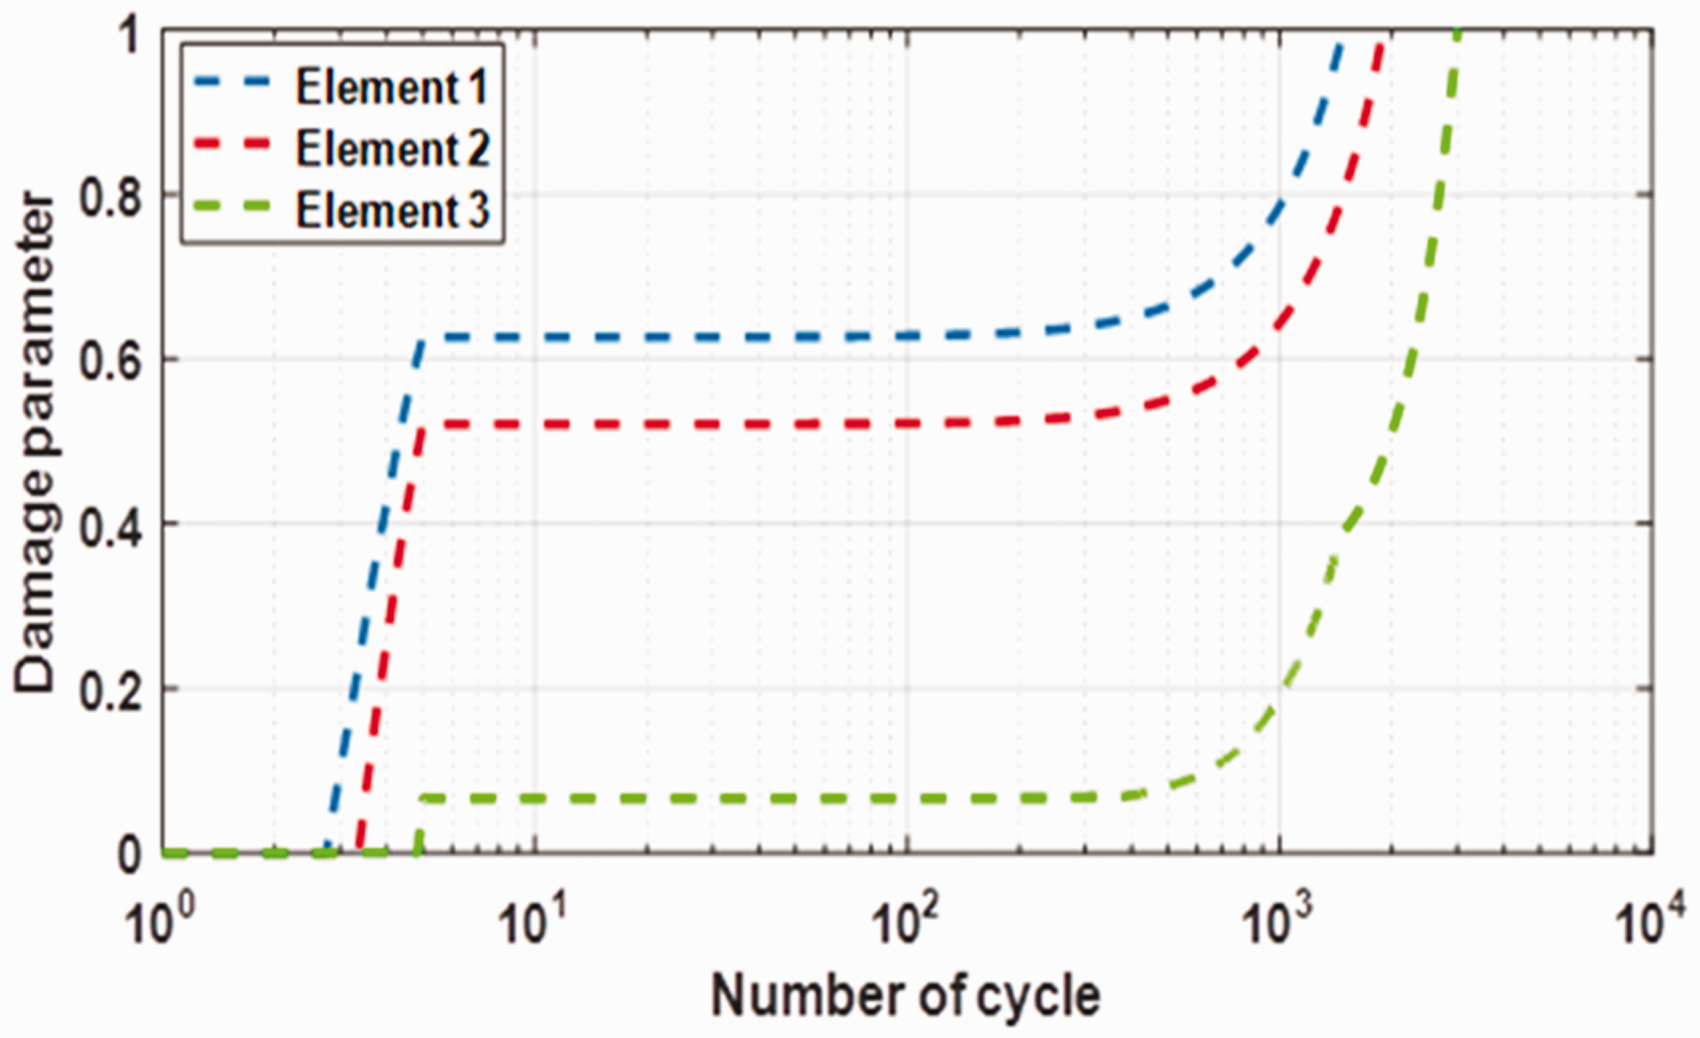
Damage propagation of the first, second and third element.
The delamination growth was simulated based on the model developed here. It should be observed that the damage grew symmetrically on both side of the adhesively bonded joint as shown in Figure 9. The variation of the damage parameter under different numbers of cycles, as predicted by the present model is also illustrated in Figure 9. The elements having state variable (SDV3) equal to unity in the damage contours represent complete failure of the cohesive zone, signifying no fatigue resistance. Based on model proposed here the crack needed 2000 cycles to grow to 0.30 mm and propagated to 0.45 mm when the number of cycles reached 4000. The measured delamination lengths by Khoramishad et al. 31 were 0.285 mm and 0.43 mm for 2000 and 4000 cycles respectively. Thus, the difference between numerical model and test was 5.2% at 2000 cycles and 4.6% at 4000 cycles.
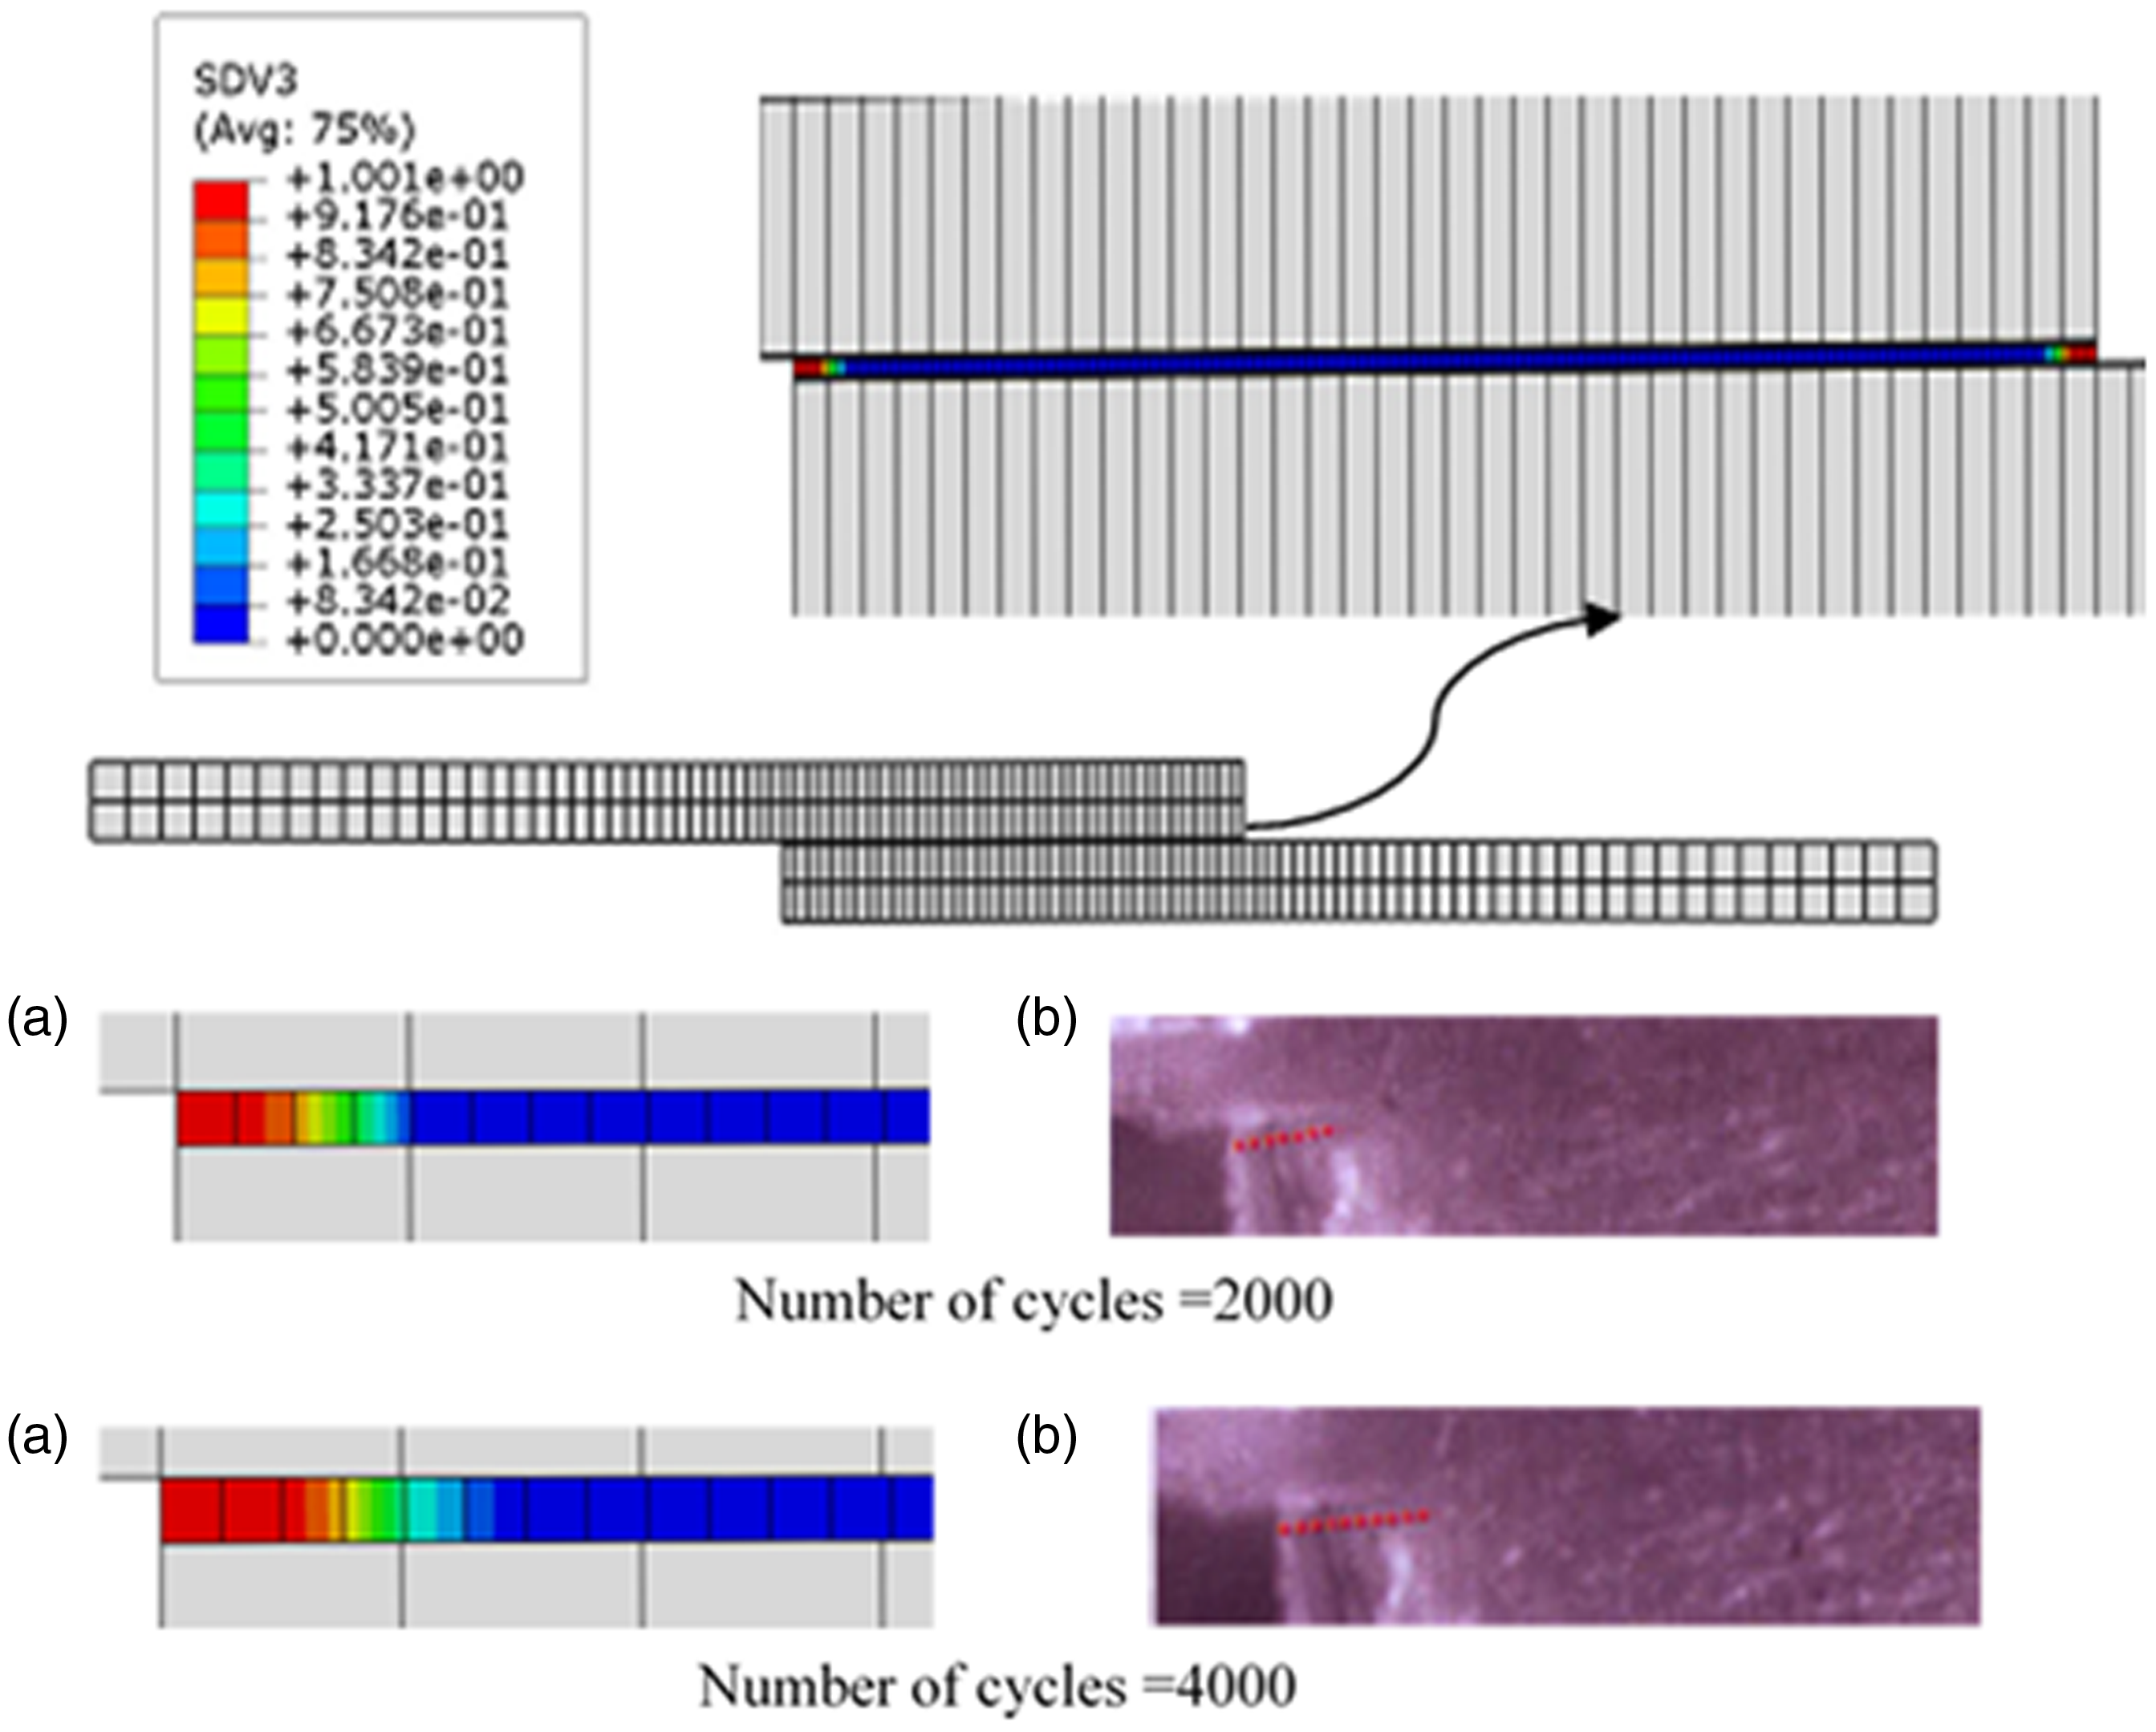
Delamination growth under different cyclic loading (a) developed model (b) experimental data by Khoramishad et al. 31
Conclusions
The objective of this paper was to present a novel fatigue delamination accumulation model. The novel approach was tested numerically under two different load conditions; Mode I loading which was performed on a DCB specimen, and Mode II loading which was carried out on an adhesively bonded joint. In addition, the simulation was performed of the mixed-mode model and compared with experimental data available in the literature 29 as shown in Figure 6. The simulation findings were compared against experimental results available in literature, the maximum difference between them was 5.0% for the DCB specimen and 5.2% for the SLJ specimen. This is taken as confirmation that the proposed model converges with experimental data when tested using numerical simulation.
Footnotes
Declaration of Conflicting Interests
The author(s) declared no potential conflicts of interest with respect to the research, authorship, and/or publication of this article.
Funding
The author(s) received no financial support for the research, authorship, and/or publication of this article.