
Abstract
In the rapidly expanding composite industry, novel inspection methods have been developed in recent years. Particularly promising for air-coupled testing are cellular polypropylene transducers which offer better impedance matching to air than piezoelectric transducers. Furthermore, broadband transmitters (laser-induced ultrasound and thermoacoustic emitters) and receivers (optical microphones) have opened a completely new chapter for advanced contact-free ultrasound inspection. X-ray dark-field radiography offers a different approach to detect porosity and microcracks, employing small angle X-ray scattering. These innovative ultrasonic and radiographic alternatives were evaluated in comparison with well-established inspection techniques. We applied thirteen different non-destructive methods to inspect the same specimen (a carbon fiber-reinforced polymer laminate with induced impact damage): air-coupled ultrasound testing (using piezoelectric transducers, broadband optical microphones, cellular polypropylene transducers, and a thermoacoustic emitter), laser-induced ultrasound testing, ultrasonic immersion testing, phased array ultrasonic testing, optically excited lock-in thermography, and X-ray radiography (projectional absorption and dark-field, tomosynthesis, and micro-computed tomography). The inspection methods were qualitatively characterized by comparing the scan results. The conclusions are advantageous for a decision on the optimal method for certain testing constraints.
Keywords
Introduction
Generally, reconstructed images obtained by inspection methods deliver only a more or less accurate approximation of the reality. Each non-destructive testing method has its own characteristic footprint, which alters information about the observed feature – it acts as a filter function. By comparing results of different methods, it is possible to distinguish between filter effects and the true conditions of the material and defects. In this paper, we aim to isolate both in order to investigate which of the imaged features are only imaging artifacts and which deliver beneficial information for evaluation. More appropriate conclusions about the inspected object can thus be made. Furthermore, we emphasize that the combination of different imaging methods deliver additional information about the specimen that cannot be obtained by a single method.
There are few recent publications dealing with a similar comparison. Grosse et al. 1 include results from air-coupled ultrasound (ACU), immersion testing and optically excited lock-in thermography (OLT) as applied to impact damage and flat-bottom holes. Ultrasound (US) immersion testing and X-ray micro-computed tomography (µCT) were applied and compared to inspect impact damages in carbon fiber-reinforced polymer (CFRP) in Ehrlich et al. 2 The damaged area determined by the µCT was significantly larger than the one obtained by US testing. Maierhofer et al. 3 compared the images obtained by different arrangements of passive (immediate after the impact) and active thermography with the C-scans of contact phased array ultrasonic testing (PAUT) and ACU. The specimen was an impacted CFRP plate. Abou-Khousa et al. 4 compared X-ray computed tomography, near field millimeter wave, shearography and immersion testing US methods on honeycomb composite specimens. Their results show an advantage of X-ray computed tomography in lateral resolution compared to other methods. Wang et al. 5 compared X-ray computed tomography, terahertz imaging and immersion US testing on glass fiber-reinforced polymer composites with delaminations. They demonstrated that for the specimen tested, terahertz imaging has higher contrast than X-ray computed tomography and higher lateral and axial resolution than immersion US testing. Schumacher et al. 6 applied US, thermography, eddy current, and X-ray methods (radiography, laminography and µCT) to CFRP laminate samples. They conclude that each of the methods can contribute different information to overall evaluation of the specimen. Hakim et al. 7 compared different variations of thermography testing methods on CFRP samples. Papa et al. 8 compared the results of electronic speckle pattern interferometry and PAUT on basalt composite laminates with induced low-velocity impact damages. Grager et al. 9 used various ACU testing setups to inspect CFRP samples with flat-bottom holes, foam core CFRP sandwich and an impact specimen that is used in the present study. We therefore included their results in this work to make a side-by-side comparison to other non-destructive testing (NDT) methods. Their results show the advantage of the broadband optical microphone as an alternative to the piezoelectric US receivers in its good spatial scan resolution. However, in contrary to our results, which were also achieved with a newer and more sensitive version of the optical microphone, they described the problems with lower sensitivity and scan artifacts at the damage boundary. Further description of this effect is given in Results of the comparison and discussion section.
X-ray dark-field radiography is a relatively new method that uses spatial intensity modulation on the micron scale to generate a contrast based on small angle X-ray scattering. 10 It is sensitive to electron density modulations on the micron scale and is suitable for detection of porosity, microcracks 11 and fiber orientation. 12 Recently, some progress was reported in terms of field of view and scanning speed 13 making this method of interest for an evaluation and comparison with other approaches.
In this work, we compare a broader spectrum of inspection methods than in the previous research being described in the literature. Furthermore, we include recently developed, more efficient, non-contact techniques using broadband US excitation and detection. By setting them side-by-side with the conventional and established methods,14,15 their potentials can be evaluated. Additionally, we compare various radiographic methods on the same example.
Piezoelectric and cellular polypropylene (cPP) transmitter, thermoacoustic emitter (TAE), and laser pulse were used as contact-free US sources. Piezoelectric and cPP receiver and different versions of broadband optical microphones were used for US detection in air in through-transmission setups. Other methods that are suitable for impact damage inspection in monolithic CFRP materials are also used in this study, namely, PAUT, immersion testing, OLT, and X-ray radiography methods (projectional absorption and dark-field, tomosynthesis and µCT). The purpose of our study is to get a broader overview of this extended group of test methods for CFRP plate inspection. Evaluating the results delivered by various methods deepens our understanding of their shortcomings and advantages. Hence better decisions can be made for a specific inspection task between the different alternatives.
Specimen description
The measurements, made on the same specimen, allowed us to perform a relevant comparison. It was a monolithic CFRP laminate with dimensions of 150 mm × 100 mm and 2.1-mm thickness. The scan area is indicated by the white frame in Figure 1. The material was composed of carbon fibers, glass fibers (2% of total fiber volume) and an epoxy resin matrix. The fabrication method was resin transfer molding and the orientation of the fiber layers was +45°/−45°/0°/−45°/+45°.
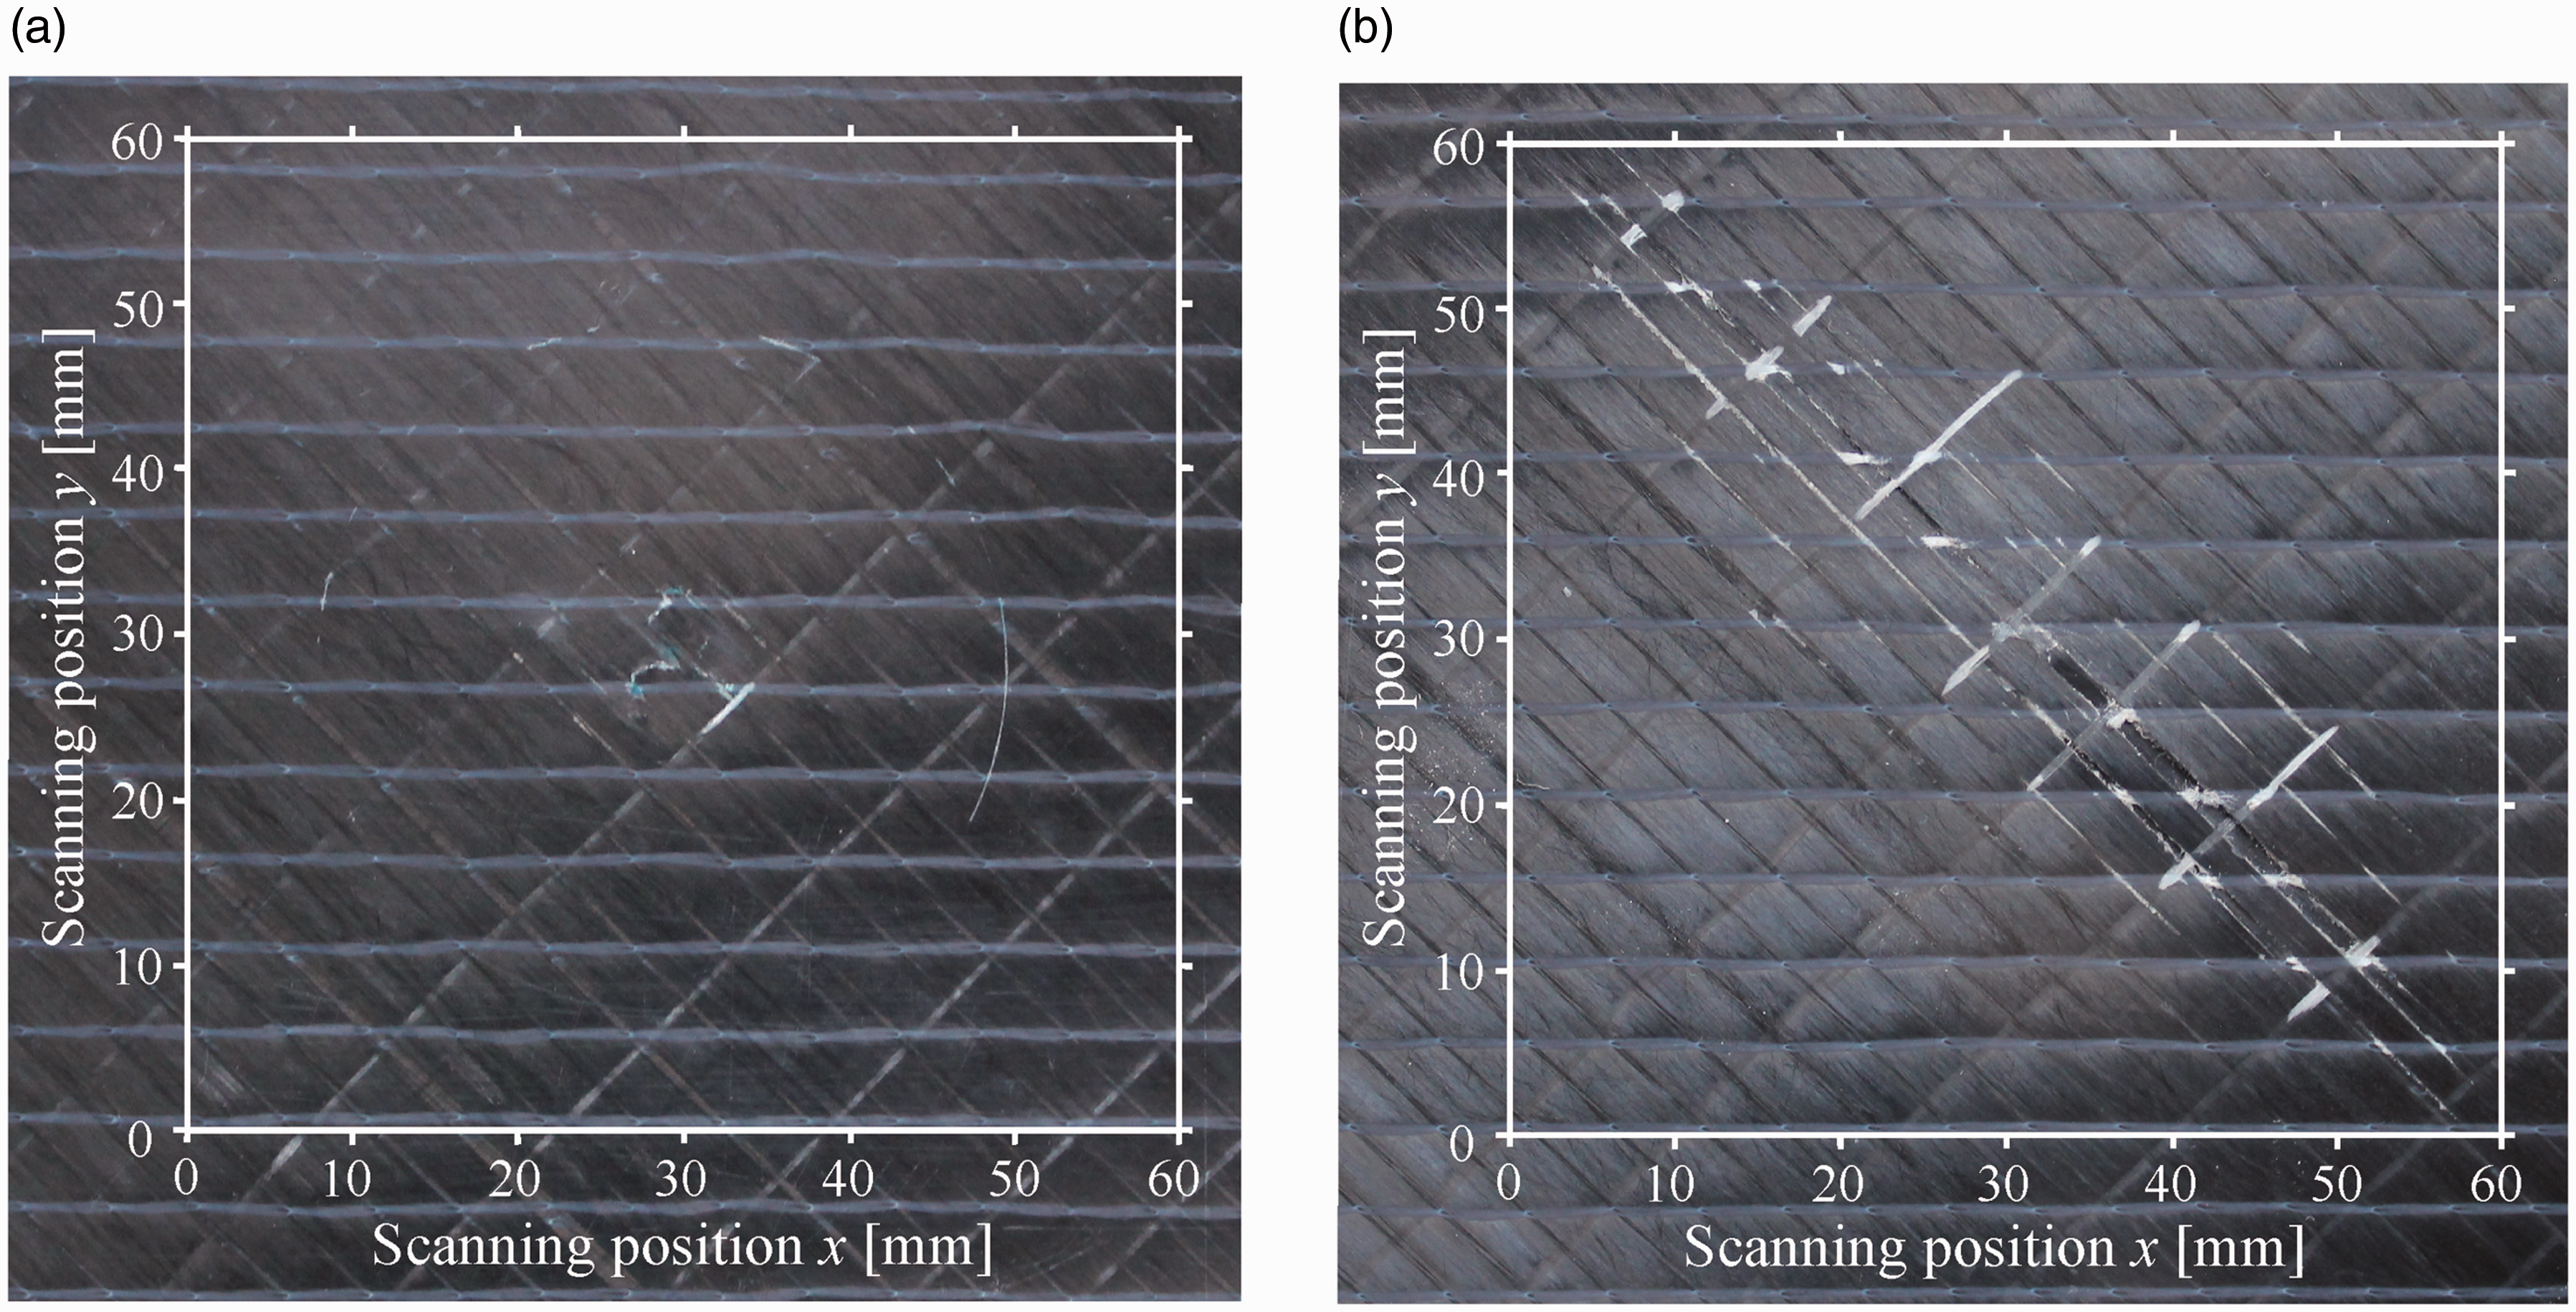
Front (a) and back (b) side of the specimen plate. The white frame indicates the scanned area.
The specimen was damaged by a 15-J-impactor according to ISO 183521,16 in a drop-weight test. The impacted side will be labeled as the front side throughout this publication. The impact location was centered at the coordinates (30 mm, 30 mm) according to the scan coordinate system depicted in Figure 1. The diameter of the hemispherical impactor was 15.75 mm.
Impact damage is a feature that is frequently inspected in CFRP – a common material used in aerospace and lightweight engineering. Due to its high practical relevance and its complex defect shape, it is an optimal feature to compare different NDT methods. It can be described as consisting of chaotically distributed median and lateral cracks and overlaying delaminations of different sizes and shapes.
We chose impact damage to compare the inspection methods for two reasons. Firstly, it is practically relevant: impact is one of the most common causes of damage which can emerge either during production (drop/impact of the tools) or during the utilization of the investigated object. Secondly, it has a complex defect shape, which can be described as consisting of chaotically distributed median and lateral (closed and open) cracks and overlaying delaminations of different sizes and shapes. Capability of the inspection methods to detect the specific details of the defect shape can thus be evaluated. CFRP is a common material used in aerospace and lightweight engineering, where meeting the adequate quality standards is of high importance. Impact damage significantly alters the macroscopic material properties of the CFRP structures, which need to be regularly inspected when used for safety-sensitive applications.
Methods description
In the following subchapters, a brief description is given of the test methods selected for comparison. Experimental equipment is identified together with the scan parameters. Separately, we explain how each of the C-scans was obtained. All of the ACU testing methods were conducted in classical through-transmission configuration with the US emitter placed on the front side of the specimen. The US excitation voltage was in a unipolar square shape. The number of pulses is labeled separately for each of the ACU method. Unless otherwise stated, no data averaging was applied.
Air coupled ultrasound: Piezoelectric transducers and optical microphones
Four scans were made using different piezoelectric transmitter and receiver (piezoelectric, optical microphone) combinations (Figure 2(a) to (e)).9,17–20 Individual experimental setups are described in separate subsections.
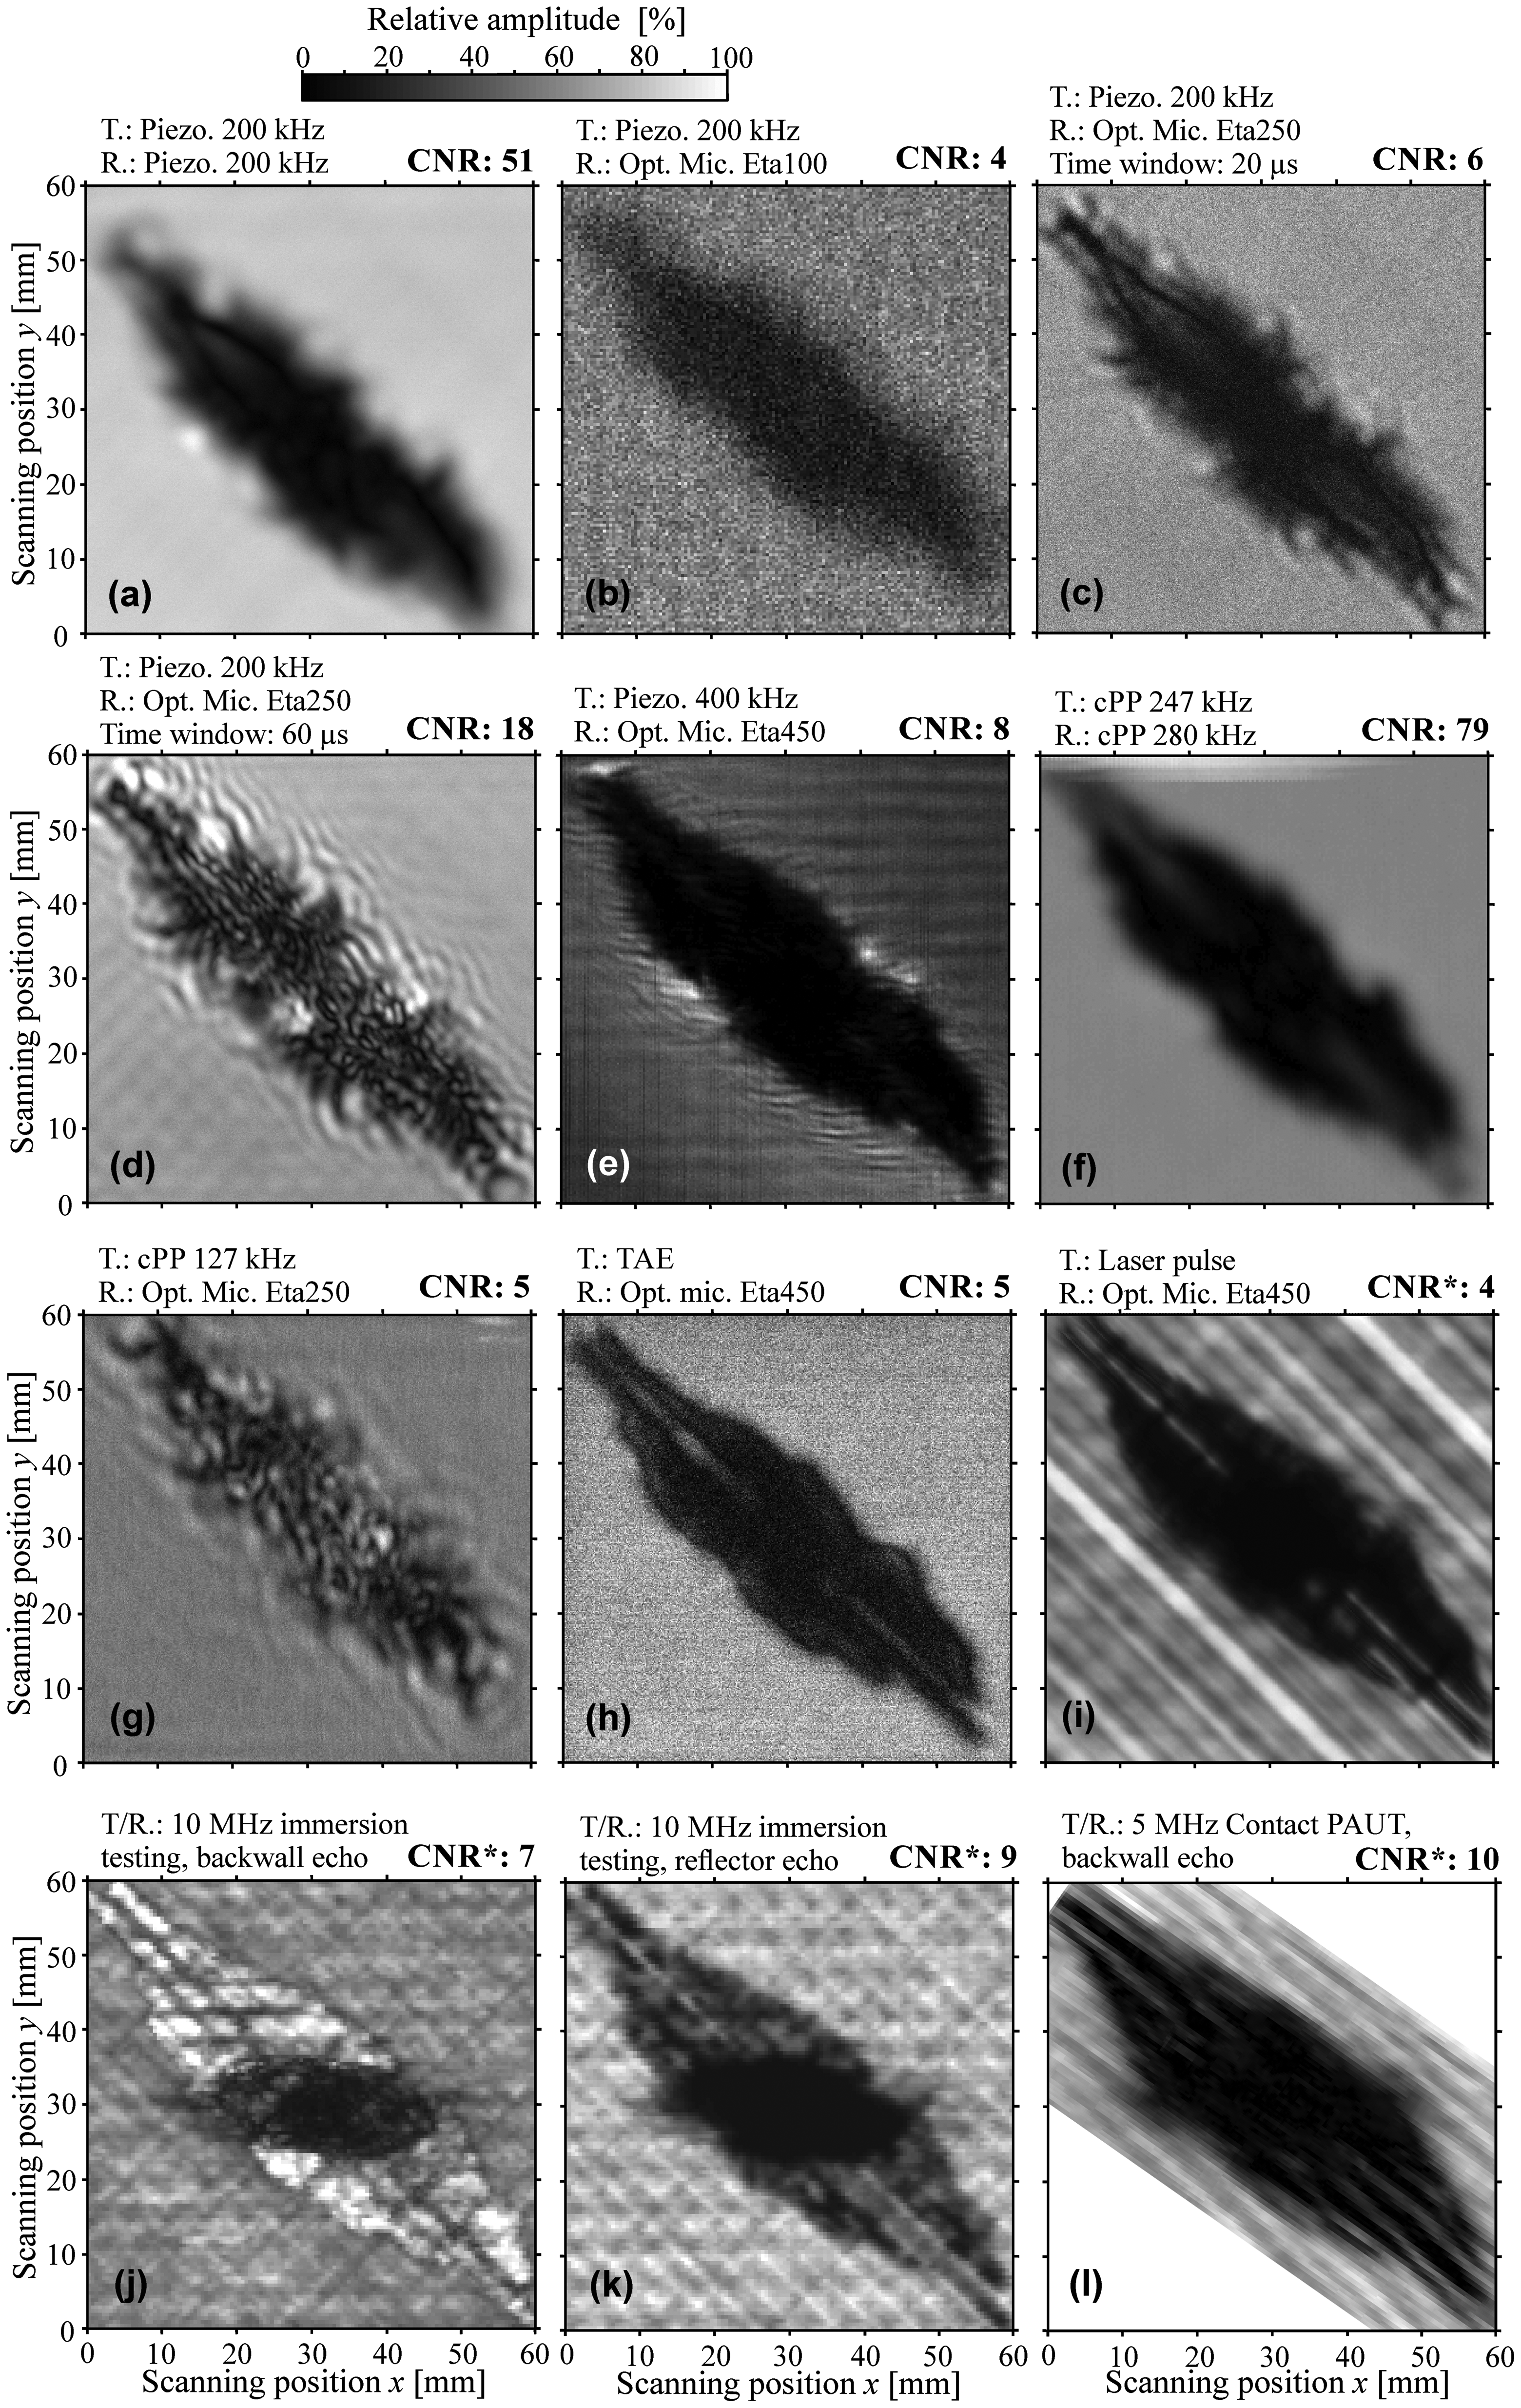
C-scans of the impact damage, obtained by various US methods: a piezoelectric transmitter in combination with a piezoelectric receiver (a) and various versions of optical microphones (b-e), a cPP transducer with a second cPP transducer (f) and an Eta250 optical microphone (g), a TAE with an Eta450 optical microphone (h), laser-induced US with an Eta450 optical microphone (i), immersion testing utilizing a backwall echo (j) and reflector echo (k), and contact PAUT (l). The corresponding transmitters (T) and receivers (R) are indicated on the left side above the scans and the contrast-to-noise ratios (CNR) on the right side above the scans. CNR marked with the symbol (*) are not reliable due to the exposed laminate structures.
The Eta100, Eta250 and Eta450 are versions of optical microphones produced by Xarion Laser Acoustics. Their sensitivity (0.35 mV/Pa, 10 mV/Pa and 100 mV/Pa at 1 kHz) increases and their self-noise (1.5 mPa, 50 μPa at 1 kHz, and 5 μPa at 500 kHz) decreases (measured at bandwidth of 1 Hz) with a higher version number, as specified by the manufacturer. Optical microphones are able to detect sound waves without any moving parts.21,22 They therefore have a significantly broader frequency range (from less than kHz to several MHz) compared to conventional air-coupled US sensors. Detection via Fabry-Pérot interferometer (etalon) eliminates one air-solid interface in the measurement configuration. The diameter of the laser beam is approximately 0.2 mm and the length of the etalon 2 mm. This results in the small aperture of the optical microphones, which enables a higher spatial resolution compared to conventional piezoelectric receivers.
Emitter: Piezoelectric transducer 200 kHz – receiver: Piezoelectric transducer 200 kHz
A pair of focused piezoelectric transducers AirTech 200 from Hillger NDT with 200 kHz nominal frequency and bandwidth of 21 kHz (-6 dB) was used.9,20 The diameters of their oscillators were 11.1 mm, their near-field length 18 mm, and the diameter of their soundfield in focus 3 mm (-6 dB). Sensitivity (transfer ratio in air) of the transducer pair was -33 dB. 10 pulses with amplitude of 142 V were excited by the USPC AirTech 4000 (Hillger NDT) electronics. Gain at reception was 48 dB. Scanning spatial resolution was set to 0.1 mm. Signals were filtered using an IIR-band-pass filter (190 kHz–210 kHz, of 8th order). C-scans were obtained by plotting the maximum amplitude value within the time window of the burst signal length (Figure 2(a)).
Emitter: Piezoelectric transducer 200 kHz – receiver: Eta100 optical microphone
The same AirTech 200 transducer as described previously was used as the US source. 19 On the receiver side, the first version of the optical microphone: Eta100 prototype was used to capture the US. 8 pulses with amplitude of 200 V were excited by the USPC AirTech 4000 (Hillger NDT) electronics. Digital gain at reception was 20 dB. The receiver was located 2 cm away from the back side of the specimen. C-scans were obtained by plotting the maximum amplitude value of the captured burst signal (Figure 2(b)).
Emitter: Piezoelectric transducer 200 kHz – receiver: Eta250 optical microphone
The same AirTech 200 transducer was used as US source.9,20 On the receiver side, an Eta250 optical microphone was used to capture the US with 8-mm air gap to the specimen. The scanning spatial resolution was set to 0.1 mm. Signals at each scan position were filtered with an IIR-band-pass filter (190 kHz–210 kHz, of 8th order). 10 pulses with amplitude of 200 V were excited by the USPC AirTech 4000 (Hillger NDT) electronics. Digital gain at reception was 5.7 dB. The typical burst signal length was 100 µs. C-scans were obtained by plotting the maximum amplitude value within the 20 µs (Figure 2(c)) and 60 µs (Figure 2(d)) time window, starting with the first break of the signal.
Emitter: Piezoelectric transducer 400 kHz – receiver: Eta450 optical microphone prototype
Focused piezoelectric transducer Sonoair CF 400 from Sonotec with nominal frequency of 400 kHz and bandwidth of 25 kHz (-6 dB, as measured by Eta450 optical microphone) was used as a US source. 18 The diameter of its oscillator was 20 mm, its near-field length 5 cm, and the diameter of its soundfield in focus 4 mm (-6 dB). Sensitivity (transfer ratio in air) of the transducer pair was -31 dB, as measured by the manufacturer. 8 pulses with amplitude of 400 V were excited by the Sonotec electronics. Gain at reception was 20 dB. On the receiver side, a prototype of the Eta450 was used. Specimen to microphone distance was set to 12 mm and the scanning grid size to 0.25 mm. The signal was filtered with a band-pass filter (Butterworth 350 kHz–450 kHz). To obtain the C-scans, the peak amplitude value (at nominal frequency of the US source) was plotted in greyscale (Figure 2(e)).
Air coupled ultrasound: Cellular polypropylene transducers (cPP) and Eta250 optical microphone
cPP has significantly lower acoustic impedance than conventional piezoelectric ceramics.9,23 The impedance match to air is improved by flat voids constructed within the cPP. Consequently, cPP transducers are more efficient at US generation and reception in air. That was the motivation for choosing it for the construction of air-coupled transducers for non-destructive testing. 23 Transmission of some wooden samples has shown that the signal-to-noise ratio of ferroelectret cPP transducers is about 6 dB higher than of commercially available transducers. 24 Sensitivity of the in-house cPP receivers has not yet been measured, but can be calculated approximately as shown in Gaal et al. 23 It amounts around 2.5 mV/Pa for transducers at 250 kHz and 3.9 mV/Pa for transducers around 80 kHz. We have measured sound pressure level of 146 dB (rel. to 20 µPa) in the focus of a similar transmitter (250 kHz middle frequency, 19 mm aperture and 50 mm focusing radius) as used in our experiment.
Another focused cPP transmitter with a peak frequency of 247 kHz, near-field length 6.5 cm and aperture size of 19 mm was used as a US source. A focused cPP receiver with near-field length 2.5 cm, aperture size of 11 mm and a peak frequency of 280 kHz was located at the opposite side of the specimen plate. Both transducers had a bandwidth of 20% (-6 dB) and the diameter of their soundfield in focus 2.5 mm (-6 dB). 25 The corresponding C-scan results are shown in Figure 2(f).
For a second cPP-experiment, the emitter was replaced with one having a lower peak frequency of 127 kHz and a bandwidth of about 16%. It was unfocused and had a soundfield diameter (-6 dB) of approximately 6 mm. The reason for this was that at the original testing frequency (247 kHz), the received US pressure level was too low to be detected by the Eta250 optical microphone. The Eta250 signal was band-pass filtered (105 kHz–145 kHz; of 8. order IIR). The C-scan results are shown in Figure 2(g). The electronic device used for both cPP transmitters was USPC AirTech 4000 (Hillger NDT). Additionally, the transmitters included an electrical matching network transforming the incoming 140 V to 1.8 kV to generate a double pulse for 247 kHz cPP transmitter and 5 pulses for 127 kHz cPP transmitter. The maximum amplitude within the time window of the burst signal is coded in greyscale for both experiments with cPP.
Air coupled ultrasound: Thermoacoustic emitter (TAE) and Eta450 optical microphone
A TAE generates US directly in air by an increase in the air’s internal energy through heat. 26 In comparison to conventional resonant transducers, TAEs induce significantly shorter pulses – typically around 1 µs. Consequently, TAEs have a broader frequency range, which potentially allows for a broadband spectral analysis of the testing specimen. Typically, US is excited by a short-time (µs) electrical discharge over a thin conductive film, applied on a carrier substrate.
For the CFRP impact specimen, a TAE with a spherically curved glass substrate with a 200 nm indium tin oxide film was used. 27 The glass was curved with a radius of 92.5 mm to achieve acoustic focusing. A concentric electrode design caused a radial current flow. The thermoacoustically active indium tin oxide area had an inner radius of 10 mm and an outer radius of 26 mm. The excitation electronics consisted of the USPC 4000 Airtech (Hillger NDT), a voltage divider, an Agilent 33500B (Keysight Technologies) arbitrary waveform generator (AWG) and an in-house power amplifier.
The spatial scan resolution was 0.15 mm, the TAE excitation voltage 375 V, the peak power was 18 kW and the width of a single pulse was 2 µs. The short pulse emitted by TAE was comparatively broadband: 742 kHz (-6 dB) with the center frequency at 410 kHz. At this frequency the sound pressure level was approximately 115 dB (ref. to 20 μPa). An Eta450 optical microphone was used as a receiver on the opposite side of the specimen. The signal was averaged 3 times. The difference between maximum and minimum amplitude value in the time window of the pulse width was plotted to generate the C-scan (Figure 2(h)).
Laser induced ultrasound in combination with the Eta450 optical microphone
Nd-YAG frequency-doubled, q-switched pulse laser with a wavelength of 532 nm (green light) was used to generate the US waves on the front side of the specimen. 28 The laser beam diameter was 8 mm (95% intensity level). The shock wave was induced in the thermoelastic regime (no ablation). The laser source was part of the US excitation system provided by Xarion Laser Acoustics. The US was captured on the back side of the specimen plate using the Eta450. When scanning, the optical microphone was located approx. 4 mm away from the specimen. The setup was the same as used for the local ultrasonic resonance spectroscopy experiment described in Rus and Grosse. 29
The increment length of the scan was 0.2 mm and the scanning speed 4 mm/s. To obtain the C-scan, the mean amplitude of the captured signal in a frequency domain between 500 kHz and 4 MHz was coded in greyscale (Figure 2(i)).
Immersion ultrasonic testing
For immersion tests, the US testing system USPC 3040S DAC from Hillger NDT was used with a H10MP15 focused probe from GE Sensing & Inspection Technologies GmbH. 16 It has a relative bandwidth of more than 80%, a nominal frequency of 10 MHz and a focal length of 15 mm in water. The transducer diameter was 5.0 mm. The scanning spatial resolution was 0.48 mm. The specimen was not degassed before being immersed in water.
C-scans were obtained by plotting the maximum amplitude value in a specific time window. For Figure 2(j), this window was set on the US echo from the back side of the specimen; for Figure 2(k), this window was set on the US echo from the reflector located on the opposite side of the specimen in the water, according to the US source (double through transmission technique).
Phased array ultrasonic testing (PAUT)
An Olympus OmniScan MX2 with 5L64-A2 phased array contact sensor was used in experiment. 30 It is a 5 MHz linear array comprising 64 piezoelectric elements with total aperture length of 38 mm. A C-scan was generated while sweeping the sensor head perpendicularly to the array orientation with the maximum speed of 15.5 mm/s. The sensor head location was specified by a wheel displacement encoder. The sensor head was directly in contact with the front side of the specimen. Water was used as a couplant. The scan resolution was 0.17 mm in sweep direction and 0.6 mm in array element direction. The amplitude of the backwall echo is shown in Figure 2(l).
Optically excited lock-in thermography (OLT)
The infrared camera used in this setup was IRCAM Equus 327k SM PRO. 16 It has a spectral range between 1.5 μm and 5 μm wavelengths with the resolution of 640 Pixel × 512 Pixel. A wide-angle lens with a focal length of 28 mm was used for the tests. For external optical excitation, a PAR-64 Profi Floorspot halogen lamp emitter with the maximum power of 1,000 W was used together with a ESG 570 F signal generator from Edevis GmbH. The camera and the lamp were located on the same side of the specimen. The lock-in frequency was set to 0.05 Hz. In Figure 3, the phase shift between the incident and reflected wave is coded in greyscale. The phase range was chosen in a range in which the damage is most visible.
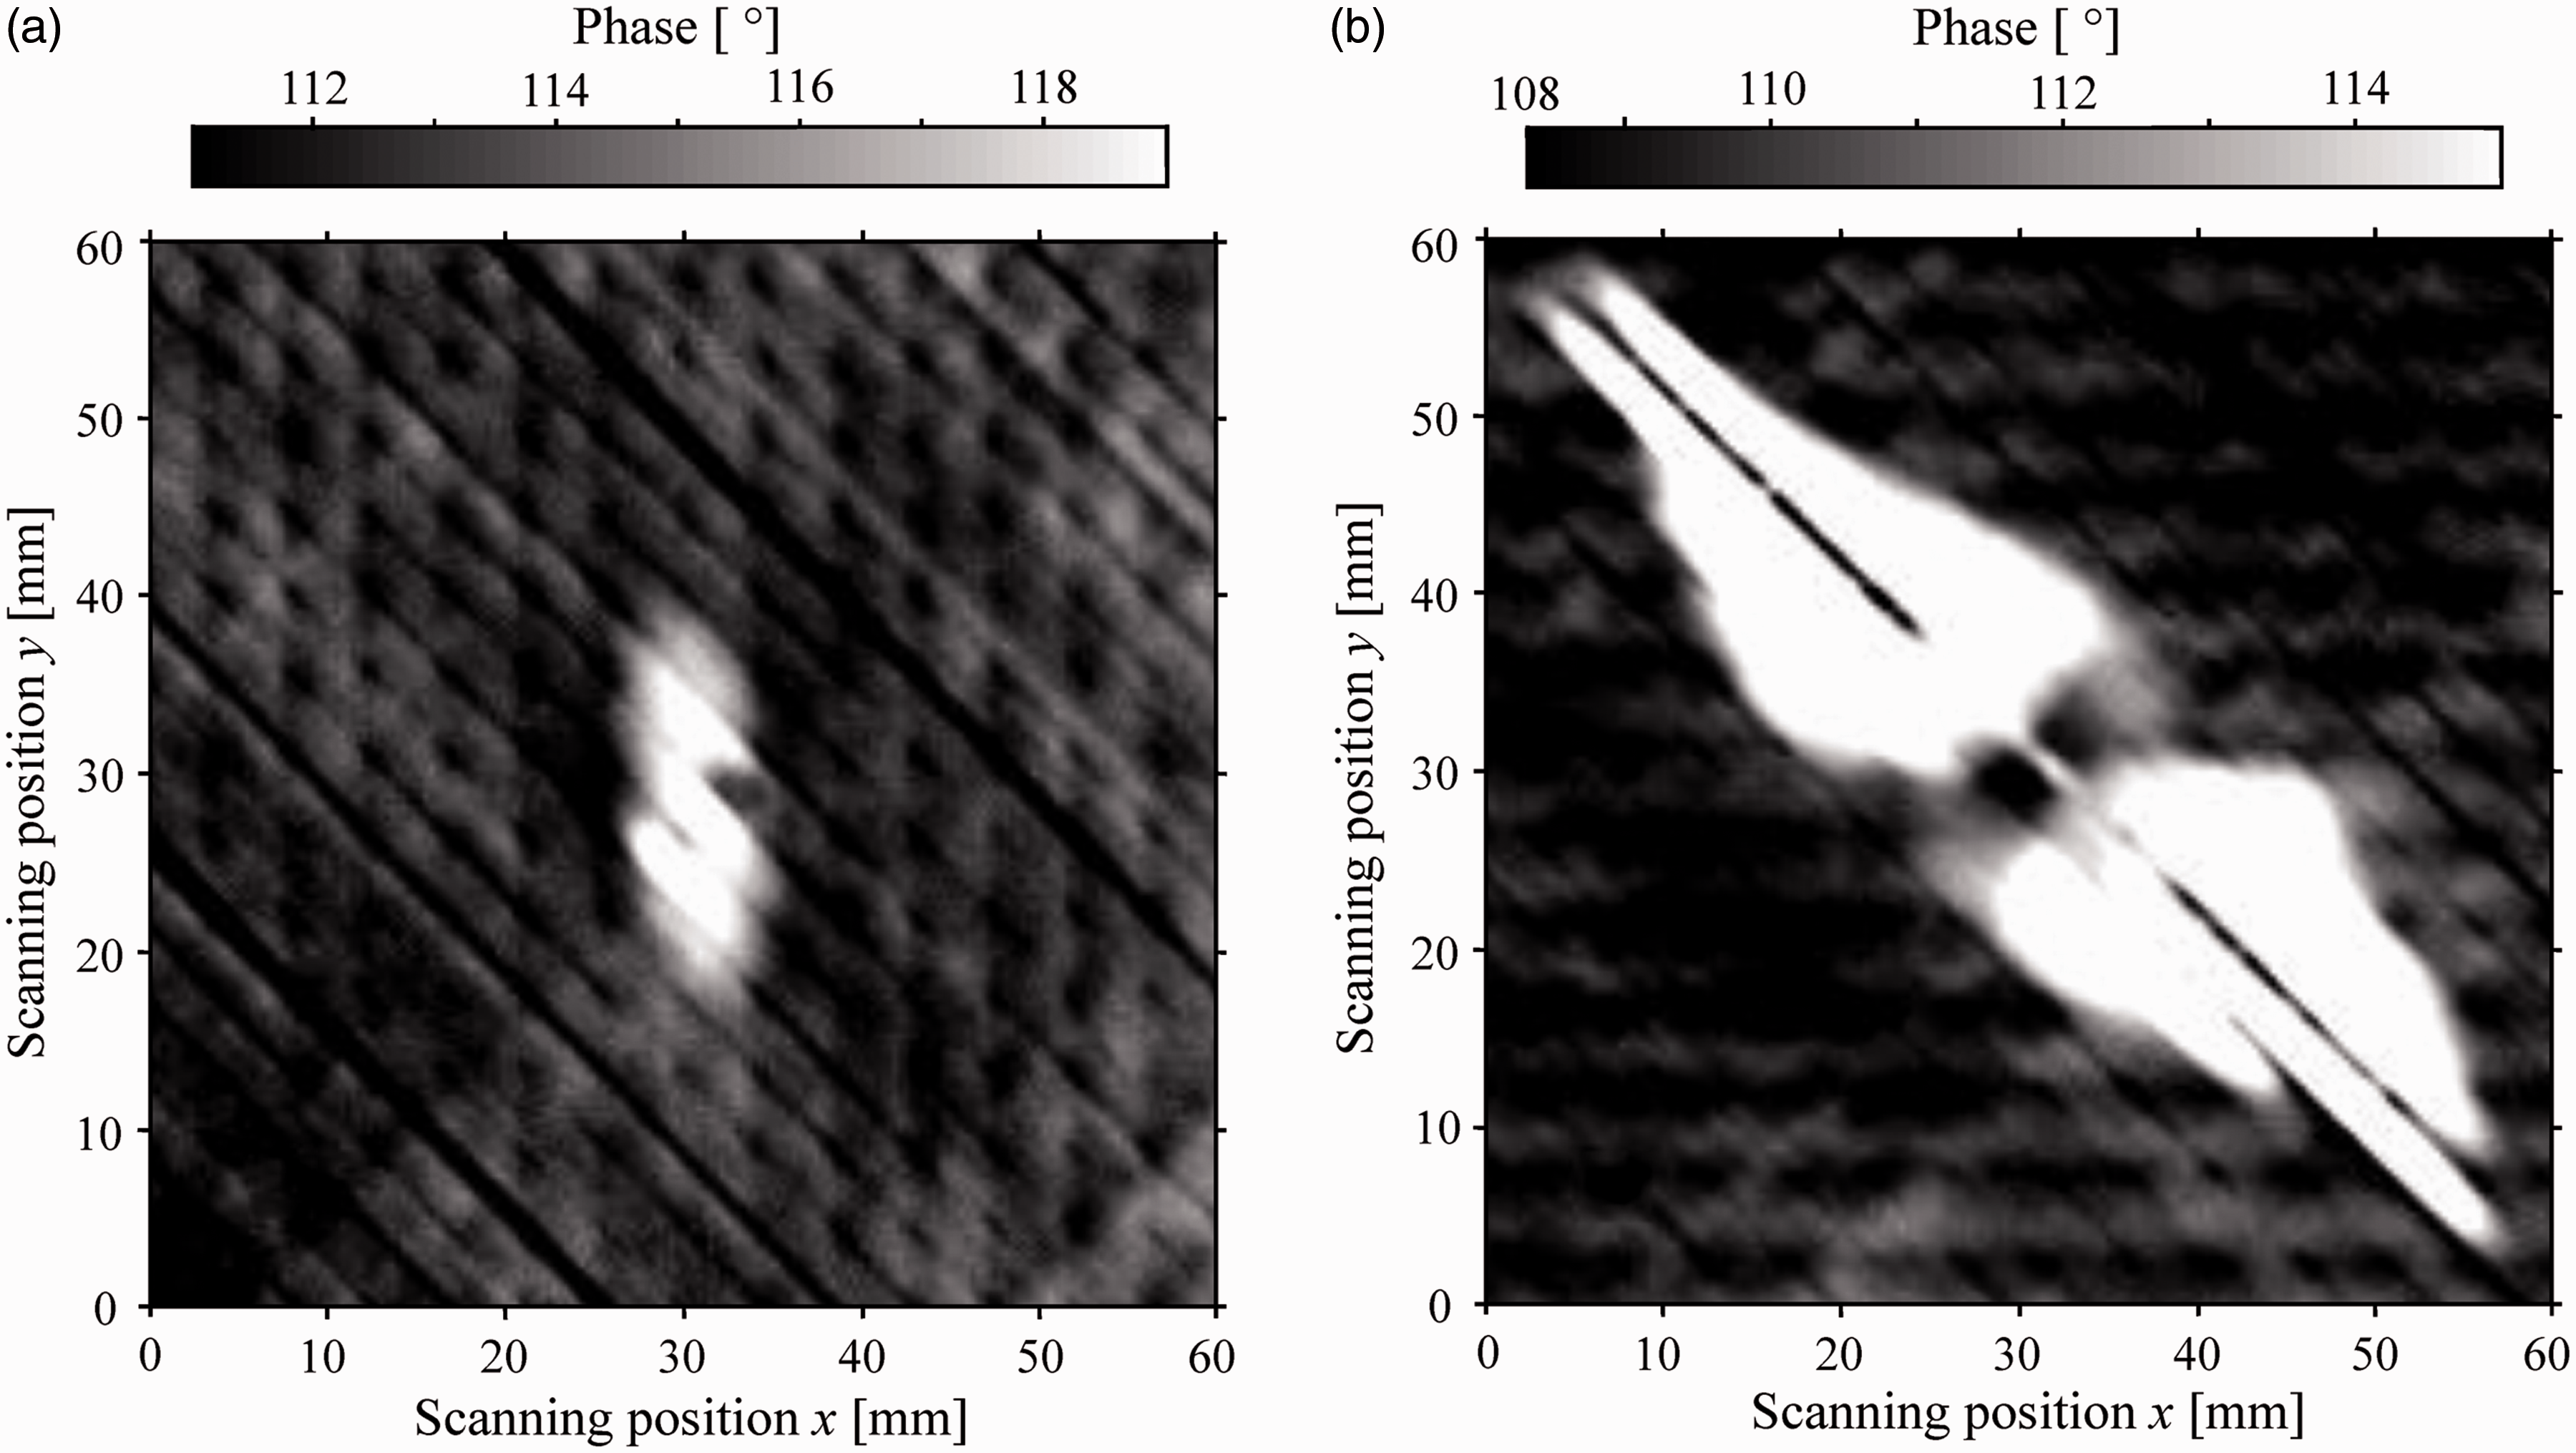
OLT phase images of the front (a) and back (b) side of the specimen.
X-ray radiography methods
Projectional absorption radiography and tomosynthesis
A tomosynthesis scan was performed using a GE Phoenix v|tome|x S system operating the microfocus transmission X-ray tube at an acceleration voltage of 30 kV and a current of 500 µA. The sample was mounted exactly between the source and detector (1,000 × 1,000 pixel) resulting in a magnification factor of two, an effective pixel size of 100 µm and a field of view of 10 cm × 10 cm. 100 projections were captured in the ±20° range with 2 s exposure time each. A projection perpendicular to the plate surface is shown (inverted, normalized transmission) in Figure 4 (a). The tomosynthesis was reconstructed by a standard filtered back-projection using the same software as described below for µCT. The greyscale was windowed respective to the full range of the filtered back-projection to make the damage as visible as possible and comparable to the absorption image. It is most visible in the planes corresponding to the back-most layer of the plate (Figure 4(b)).
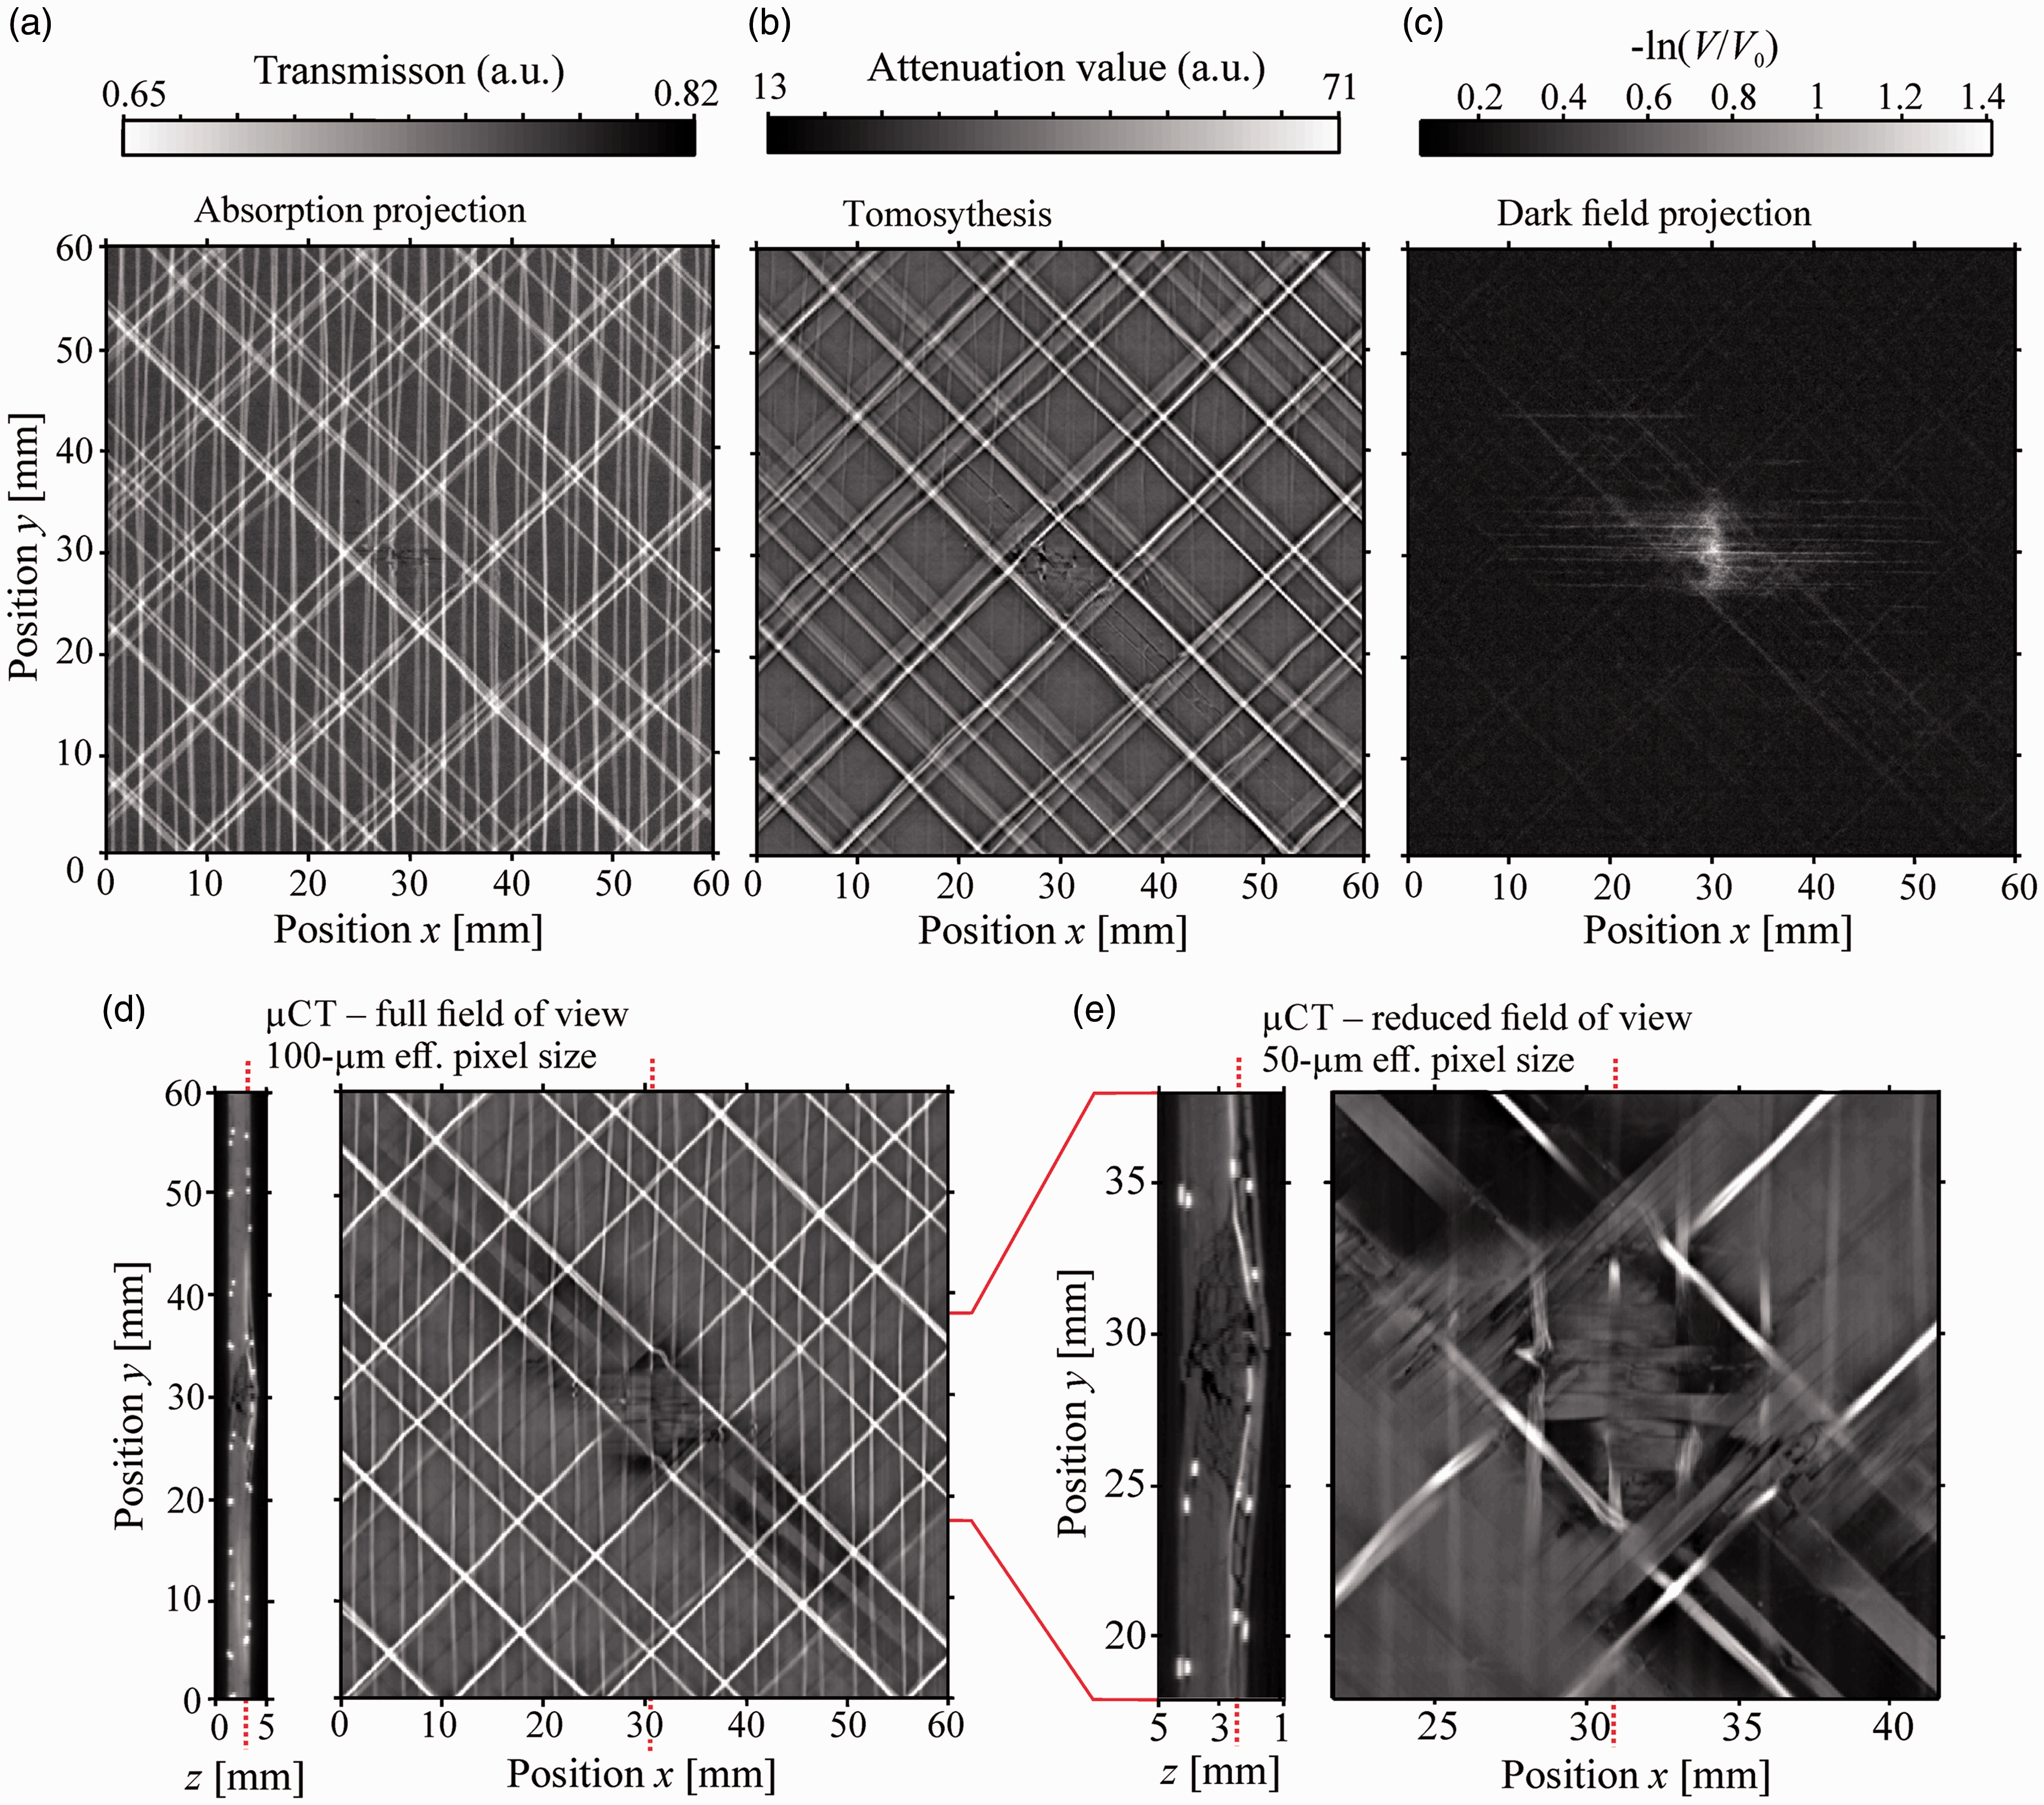
X-ray radiographs: absorption projection (a), tomosynthesis (b), dark-field projection (c), and selected µCT slices of full field of view (d) and reduced field of view (e). Positions of cross-sectional images are marked with dotted lines in the background.
Projectional X-ray dark-field radiography
The X-ray dark-field radiographs were acquired with a lab-based Talbot-Lau grating interferometer operated at 50 kVp and 50 W tube power (X-RAY WorX SE 160, tungsten reflection target). The detector was an XRD 4343CT (Varex Imaging) with a pixel size of 150 µm. The system is arranged in a symmetric geometry employing two absorption gratings and one phase grating, all with a period of 10 µm and an inter-grating distance of 0.85 m, achieving a mean visibility of about 33%. Every dark-field frame was acquired by a phase stepping with 11 steps and an exposure time of 2 s each. Since the field-of-view in the sensitive configuration (sample 5 cm in front of the phase grating, 75 µm effective pixel size) is limited to about 3 cm × 2 cm, the sample was imaged in 12 exposures and stitched together after processing. The shown radiograph (Figure 4(c)) displays the negative natural logarithm of the relative visibility drop (V/V0) close to the maximum dynamic range in the acquired data.
Micro-computed tomography (μCT)
The µCT scans were performed using the same X-ray system and geometry as for the tomosynthesis. The acceleration voltage was increased to 50 kVp (200 µA) for a better penetration at increased transmitted thicknesses. Two µCT scans were performed with a 360° rotation of the specimen. The first had the same geometry as the tomosynthesis and was conducted with 1,601 angular projections at an exposure time of 20 s each. The second was performed at 4× magnification (5-cm × 5-cm field of view, 50-µm effective pixel size) with 1,001 angular projections at 15 s exposure time. The volumetric images were reconstructed from the projections by the X-AID FDK Reconstruction Suite Version 2019.11.4 by Mitos GmbH. Selected slices from the 3 D data are shown in Figure 4(d) and (e), where the greyscale values up to a constant factor represent the effective X-ray attenuation coefficient. For both measurements, the range of greyscale values was adapted similarly for a clear visualization of the damage.
Results of the comparison and discussion
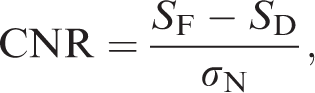
In Figure 2, we collected the C-scans of each of the US methods described in the previous chapter. OLT and radiography results are shown separately in Figures 3 and 4, respectively. On the right side above each C-scan, its contrast-to-noise ratio (CNR) is labeled. It is defined as
In the previous chapter, a description is given for each US method, and how the amplitude scalar values were extracted from the A-scans for each scanning position. They are coded in greyscale to avoid subjectivity and are expressed in a relative range according to the minimum and maximum amplitude value of each scan (linear scale). It is possible to qualitatively compare the shape of the damaged area obtained by different methods and compare the signal-to-noise ratio of the scan image. We can examine which details of the impact damage are visible by a single method. By observing the boundary of the defected area, we can observe the level of spatial averaging of the specific method caused by the transducer’s aperture. The detected damage surface can also be compared.
ACU inspection with the piezoelectric transmitter and receiver yields good contrast (Figure 2(a)) between the damaged and damage-free area. The results are spatially blurred due to the 3-mm diameter of the transducers’ soundfield in the focus. Detectability of the damage and resolution of the inspection process could be improved by using transducers of higher nominal frequency, which is however limited by attenuation level of US in the tested material.
The first model of the optical microphone (Eta100 prototype) had low sensitivity in this measurement configuration, which leads to a lower signal-to-noise ratio (Figure 2(b)). With each newer model of the optical microphone, the sensitivity was increased, which can be seen by the improvement in the quality of the scan image (Figure 2(b) to (e)). Spatial resolution is improved when the piezoelectric receiver is replaced by the optical microphone because of the small sensor’s acoustic aperture. This is however negated by the image artifacts that blur the boundary and the interior of the damage (Figure 2(c), (d), and (g)). They are caused by mechanical interference, thickness resonances, and delamination clapping, while the US wave train travels through the chaotically cracked and delaminated area. These local defect resonances have their characteristic frequencies typically in the range above several 10 kHz, but mostly below the plate thickness resonance frequency.29,31 These effects are more pronounced, when the US is detected over a wide frequency range e.g. by optical microphones. The effect of the measurement time gate width on these artifacts, in which the maximum amplitude is extracted to create a C-scan, can be observed by comparing Figure 2(c) with (d). These resonance artifacts are only present if the time window length is extended, which shows that the resonance effects occur after the first break of the US wave. No artifacts are present in Figure 2(h) when using the TAE and Eta450 optical microphone because the evaluated time gate width is reduced to the length of the US pulse (2 µs). The increase of the US amplitude transmitted through the plate at the left-side and right-side of the damage boundary at scanning position y = 30 can be explained similarly for Figure 2(e).
When applying a higher US frequency (400 kHz instead of 200 kHz), the shape of the damaged area is more pronounced and the artifacts at the damage boundary reduced (Figure 2(e)). This higher testing frequency allows for a more accurate determination of the damage surface, since higher US frequencies are dissipated more in the damaged area. Consequently, boundaries of the damage are clearer and the contrast between damaged and undamaged area is higher. A similar improvement could also be achieved by increasing the testing frequency of the conventional setup using a pair of piezoelectric transducers.
CPP transducers (Figure 2(f)) provide contrast improvement over conventional piezoelectric transducers (Figure 2(a)). Spatial blurring appears to be slightly reduced. Please note, that the testing frequency was lowered for the Figure 2(g), since the cPP transmitter had been used in the combination with an Eta250 optical microphone. Apart from this, the ACU inspection with piezoelectric transducers of increased frequency (400 kHz) was applicable, since a more sensitive Eta450 optical microphone was available for this measurement. We expect an improvement of cPP inspection results while using Eta450 instead of Eta250 optical microphone.
TAE generate short (µs) US pulses matching the broadband frequency characteristics of the optical microphone. This and the laser-excited US inspection are the only couplant-free methods described in this paper that allows MHz-range US inspection. The contour of the damage surface is well visible due to high-frequency US, which was focused on the small specimen surface. However, it is challenging to induce high-energy short-lasting US pulses. The signal-to-noise ratio is therefore lower in Figure 2(h). We want to emphasize that TAE is still in the development process and the full performance potential has not been tested yet (e.g. maximum pulse energy).
Laser US is able to generate short-lasting, high-energy US shock waves in higher frequency range (MHz) with repeatability suitable to be used for C-scan generation. Almost no US in the frequency range from 500 kHz to 4 MHz is transmitted through the plate in the delaminated area. This provides a good contrast between damaged and damage-free plate area (Figure 2(i)). The damage area determined qualitatively by the laser US is comparable to the one determined by immersion testing (Figure 2(j) and (k)), which is often referred to as the most accurate method to evaluate the size of damage.
As it is the case for all the ACU methods in our experiment, no reliable conclusions about the interior of the damage (overlying delaminations, cracks and porosity) can be made.
Comparing all the ACU methods (including the laser US method) with the radiography methods (Figure 4), we can conclude that none of these deliver reliable information about the interior of the damaged area (also when the amplitude is expressed in logarithmic scale). At the first additional solid-to-air transition caused by an internal delamination or crack, almost all of the transmitted US is dissipated. Overlying delaminations, cracks and porosity cannot be reliably distinguish by ACU methods used in our experiments.
This is not the case for immersion testing (Figure 2(j) and (k)). Defect and material structure are clearly visible. The approximate true size of the defect can be easily determined by examining the C-scan obtained by the reflector echo (located behind the specimen plate), since the US in this case travels twice through the damaged area (Figure 2(k)). Since US are being reflected from the back side of the specimen, we can distinguish additional details about the damage, for example the area with a higher density of cracks lies directly under the impact location (Figure 2(j)). The adjacent brighter regions of the impact damage are caused by resonances due to the delamination of the last ply. This is the dominant damage pattern in this region, which can also be seen in the following µCT evaluation.
PAUT inspection results are presented in Figure 2(l). The data are shown only within the trace, which was covered by the linear movement of the probe. The result shows a good contrast. The material structure is visible, however less clear than in the case of the more sensitive immersion inspection. The object shape differs from the one obtained by the immersion testing or by the laser US method. As with every contact inspection method, its applicability depends on the surface quality and its smoothness.
The orientation of several fiber layers can be determined by immersion testing method (Figure 2(j) and (k)). With the measurement setup, where US was excited by the laser pulse and detected by optical microphone Figure 2(i), we can distinguish the orientation of the surface fiber layer on the receiver side.
In Figure 3, results of the OLT applied to both sides of the plate are shown.
In the case of OLT, the inspection can be performed single-sided. However, it was found that the results strongly depend on the side from which the inspection is performed. As shown in Figure 3(a) the inspection from the front side shows only a small fraction of the damaged area, while the inspection from the back side provides a result that corresponds well with the US inspection methods (Figure 3(b)). The delamination that is located near to the opposite surface of the plate is difficult to be detected by one-sided OLT, and the damage size is strongly underestimated. In non-defective areas of the sample, the induced heat wave is reflected on the back of the sample. In areas where only the last layer is delaminated, the reflection occurs only a few tenths of a millimeter earlier. These small differences are very challenging for OLT to detect.
In Figure 4, radiography results are shown: absorption projection (a), tomosynthesis (b), dark-field projection (c) and µCT (d, e). The volumetric µCT data of the full field of view (100-µm effective pixel size) (Figure 4(d)) and reduced field of view (50-µm effective pixel size) (Figure 4(e)) are shown in selected cross-sectional images. Their positions are marked with dotted lines in the background, respectively.
Absorption-based techniques (Figure 4(a), (b), (d), and (e)) deliver a significant contrast between the glass and the carbon fibers due to a strong difference in X-ray attenuation of silicon and carbon in the used energy range. The central part of the damage is only slightly visible in a single X-ray absorption projection. The lateral cracks are not distinguishable. The medial cracks are more pronounced in the tomosynthesis and defects between fiber bundles are recognizable. However, glass fibers below and above the examined layer are blurred, which is a typical feature of tomosynthesis. In the dark-field projection image, the central part of the damage delivers a high contrast compared to the remaining outer area and the glass fibers are almost invisible. As evident from the µCT data, this bright area features a high density of microcracks. Therefore, projectional dark-field might be an efficient technique to detect such a kind of morphology without the need for high resolution and object rotation, as is the case with tomosynthesis and µCT.
In Figure 4(d), the cross-sectional frame, on which the delaminated surface appears the largest (0.6 mm from the back surface) is shown. However, the damage boundaries are not well pronounced since the closed cracks do not deliver a significant contrast in X-ray attenuation and partial volume artifacts limit the sensitivity to very narrow delaminations. The surface of the damaged area obtained by µCT is therefore smaller and less accurate than compared to the US inspection methods. In Figure 4(e), a detailed structure can be seen in the central region of the damaged area. The high resolution scan reveals the voids between the displaced fiber bundles and the microscopic cracks.
Conclusion
The comparison of different methods is a basis for decision making regarding an inspection task with certain framework conditions. In the conclusion, we suggest optimal inspection methods for specific applications.
If the inspection process is to be automated and performed quickly, ACU is the most elegant solution for the specimens with suitable geometry (plates), especially if they are sensitive to liquid couplants. For larger impact damages and delaminations, where sub-millimeter resolution is not required, the transmission with cPP transducers or classical piezoelectric transducers delivers the highest contrast and is the most cost-effective. On the other hand, if the precise damage surface is of additional value or if the damage size is too small to be conventionally detected, we suggest using a 400 kHz piezoelectric transducer in combination with an Eta450 optical microphone.
Furthermore, if even higher sensitivity for damage detection and increased spatial resolution is required, we recommend laser-induced US or immersion testing. These two methods are capable to detect the delamination with the smallest opening of all of the methods described in this paper; µCT at this point is limited by resolution and hardly detects any delaminations with openings below the voxel size. Laser-induced US is advantageous if the specimens cannot be immersed in water (e.g. big-sized, corrosive, fragile or hot specimens) or if the laser safety standards are easier to be realized for a specific application than the handling of the specimen in water. While it is possible with immersion testing to analyze the inner structure of the damage (worse than with µCT), the laser-induced US is strongly dissipated over the entire area of the damage on the other hand. This shows that laser-induced US is a good indicator for the presence of the damage in the frequency range considered in this work.
PAUT is an elemental and accurate method and is a good alternative for thicker and larger parts that have a testing surface smooth enough to assure good coupling. It is especially advantageous for parts that require single-sided inspection. However, contact US inspection is more challenging to be automated.
OLT is a suitable solution for near-surface damage inspection of materials that are not thermally sensitive. Larger areas can be investigated integrally without an extensive scanning arrangement.
TAE offer a potential to increase the time resolution of a scan due to the short pulses that they are capable of emitting. Next to the laser-induced ultrasound, these offer a possibility for single-sided ACU inspection and better depth resolution.
If the detailed three-dimensional structure of the defect is to be studied, µCT still does not have a persuasive alternative. It is suitable for detection of density changes, inclusions, voids, open cracks and for the determination of the fiber orientation. However, a compromise between resolution and scanned range should be made while being subjected to the following limitations. First, the scanned volume in µCT has to be rotated in the field of view of the imaging device, which makes large, but thin objects difficult to inspect. Furthermore, scan time is a limiting factor and makes high-volume quality control of even small parts quite challenging. The data handling as well as the reconstruction and automated evaluation requires specialized hardware and software solutions and increases the efforts immensely. Therefore, µCT is most effective in research and development or process control, where a detailed understanding of the material structure and properties is required. However, µCT data might help for model building, simulation and validation of results and for conclusions drawn from other methods. µCT can be of high value, especially when microscopic properties have to be correlated to macroscopic material performance or physical interactions at the micron-scale are studied, which are exploited in other inspection methods.
For flat, large objects, X-ray CT variants such as tomosynthesis/laminography can be considered if only the meridian cracks are to be detected. Thus, the scan time can be significantly reduced compared to µCT.
The porosity and presence of microcracks can be detected specifically by X-ray dark-field radiography without object rotation, much lower system resolution and higher speed. It might have advantages over US when impact damages in more complex sample geometries have to be inspected. Additionally, dark-field projections from different orientations can deliver additional information about the orientation of the microcracks and the fiber structure. 12
In contrast to µCT, US inspection methods are able to directly detect the mechanical properties of the damaged area, since they significantly affect the mechanical wave propagation (US damping, reflection, scattering, etc.). It is therefore possible to selectively detect features that are crucial for the specimens’ macroscopic mechanical properties (delaminations, closed and open cracks, etc.).
For further improvement of the inspection process, there is a potential advantage in combining different test methods. For example, the µCT data can be fused with US inspection data. Additional information could consequently be obtained, which is not achievable if both methods are considered separately.
For example, exact in-depth location and size of the closed cracks can only be obtained by comparing Figure 4(d) with Figure 2(i), (j) or (k). µCT data suggest that the detached layers at 0.6-mm depth from the back side of the plate extends over the entire damage surface, the value of which can more precisely be determined by US inspection. Complementary use of these two methods is advantageous for plate inspection, since medial cracks can be better detected by X-ray radiography and lateral cracks by US methods. Furthermore, the approximate location of the damaged area can be more efficiently determined by US for larger testing objects. The detailed structure of the damage can be subsequently analyzed by the focused application of more rigorous X-ray radiography methods.
Footnotes
Declaration of Conflicting Interests
The author(s) declared no potential conflicts of interest with respect to the research, authorship, and/or publication of this article.
Funding
The author(s) disclosed receipt of the following financial support for the research, authorship, and/or publication of this article: The authors acknowledge the German Federal Ministry of Education and Research for financial support.