
Abstract
Fibre-reinforced polymer composites are increasingly used to make pipes and pressure vessels. The relationship between wet-winding manufacturing, composite microstructure, and the mechanical performance is complex due to many process parameters and material properties involved. Efficient manufacturing aspirations however drive process innovations that include new, radically different tow impregnation methods. In this work, the process–property–performance relationship is experimentally construed for hoop-wound carbon fibre/epoxy composite cylinders. The difference between cylinders produced by a new tow impregnation system and cylinders from the reference impregnation system was investigated. Winding speed and cylinder wall thickness were considered as two additional variables. The results indicate that, within current scope, composite microstructure is relatively insensitive to the winding speed and to final cylinder thickness. Meanwhile, un-optimized changes for tow impregnation affect the void content, the size distribution of voids and the interlaminar failure mode in short beam shear.
Introduction
The following experimental work explores the connection between filament winding process and the composite microstructure. A short introduction is given first in the context of research literature.
Microstructure
Fibre-reinforced polymer composites are made from two or more material phases which remain distinct. Individual constituents – the fibres and the matrix – are mixed, and a small amount of (usually unwanted) voids can also be present. A thorough review on different aspects of voids in composites is given by Mehdikhani et al. 1 The volume fractions for the fibres, the matrix, and the the voids, and the spatial arrangement of these constituents are created during the production process. Voids as process outcomes are partially responsible for the variability in composite manufacturing.2,3 Controls are often exercised for the amount of voids allowed in finished composite parts. Primary aerospace structures can require <2% void content. 2 For large parts, zero void content is very difficult to achieve. The void content is also challenging to control in low pressure processes such as filament winding. Helical plies typically endure less compaction and therefore can display more voids than hoop plies.
Composite microstructure defines the load sharing between the fibres and the matrix, and the stress concentrations between these material phases. When loaded, materials are more likely to fracture at locations of stress concentrations. Both matrix cracks and even individual fibre failures have been shown to interact with nearby voids in filament-wound materials. 4 Changing production parameters affects the micro-structural morphology and thereby the mechanical performance. Microstructural information is important for modeling as well.5,6 To estimate the properties of composites in greater detail, geometrical/topological information concerning individual phases is needed. This information is necessary in addition to the average values of fibre and void fractions and the properties of individual constituents. The calculation of material properties from a specific and detailed microstructure, rooted in the production process, will greatly enhance the predictive capabilities of modeling.
Filament winding
Even though conventional wet filament winding is highly automatized, it still suffers from low production rates. This problem may be addressed by some form of new thinking. 7 Another approach is to develop new concepts within current wet-winding technology. One remarkable design is the ring-winding technology. 8 This system has multiple pay-out eyes and a specific impregnation unit as an important manufacturing innovation.9–11 A good potential for high material output, reduction of production costs and a better control over the process compared to conventional winding has been reported.8–11 A different set of modifications, referred to as ‘clean filament winding’, have also been reported in detail.12–17 The reduction of waste (resin, solvent) and fewer emissions to the atmosphere are emphasized in these works. The resin bath is replaced with a combination of a resin impregnation unit and spreading stations for tow bundles. Controlled fibre spreading is a key feature that facilitates a more effective impregnation of filament tows. As the tows are extensively spread out (i.e. made thinner and wider), their impregnation time decreases. The performance of this system was validated at an industrial site, and it was concluded that winding cylinders with equivalent properties to conventional wet winding is possible.
A good understanding of interactions between process–property–performance dimensions is very laborious to obtain. A multitude of process parameters, their interactions and a large number of material properties involved makes it a challenging task. There are a number of works already available in the literature.18–23 When summarized, they show that the pre-tension of tows is clearly the most influential parameter affecting the tensile properties of hoop-wound composites. Increasing fibre pre-tension increases compaction and the fibre volume fraction of the composite. It makes good sense to remove its potentially large effect from current work (by choosing a constant pre-tension) when investigating more subtle effects from the impregnation system, the tow speed and the laminate thickness. Voids, similar to the matrix phase, are reported to only have a minor effect on fibre-dominated tensile properties.
Image analysis
Digital image analysis has been applied to investigate the microstructure of fibre-reinforced polymer composites for many years now.24,25 The state-of-the-art microstructure characterization is based on micro-CT. This method comes with less inherent bias compared to optical microscopy. The ‘section bias’ of optical micrographs typically refers to how, e.g. the measured void content depends on the direction the specimens are cut, and the 2D images are taken. Observing elongated voids from different cut directions gives different cross-section areas for the exact same voids. Optical micrographs are also local and therefore not entirely representative of the whole specimen i.e. they are ‘location biased’. Micro-CT on the other hand has fewer shortcomings and is able to provide the full 3D information non-destructively.4,6,26 Unfortunately, micro-CT equipment is still few and far between, and high resolution tomograms are typically restricted to small sample sizes. Regular optical microscopy is therefore still used for current work.
The research interest in microstructure is focused on both the distribution of fibres27–29 and the distribution of voids.4,6,23 The means of describing realistic fibre or void arrangements are not settled, and many alternative descriptors can be used for characterizing spatial dispersion. The measures of microstructure presented in a typical research are only a small subset of possible metrics that can be defined. In this research, well-known metrics of average fibre volume fraction and average void content are utilized. In addition, more detailed parameters about the microstructure – namely, the local fibre volume fractions, and the sizes and shapes of voids – were also measured and their statistics presented.
Motivation and novelty
Damage accumulation and many other properties of composites depend on its microstructure, including the void content.4,23 However, very few specifics are available about the filament-winding process effects on the detailed microstructure. There is little information on how the fibres are packed inside the composite, and how the voids are shaped. Typical reported data are not very detailed, including only average fibre fractions, average void contents and, occasionally, representative micrographs. This is insufficient for detailed numerical analysis, e.g. for creating representative volume elements that reflect the realistic microstructure. Considering this knowledge gap, and the practical interest for using new fibre impregnation systems, the objectives of this research were defined as follows:
To determine which properties of the hoop-wound composite change when a new resin impregnation method is employed; And conversely, to identify which properties remain unchanged regardless the variations in processing. This indicates properties of hoop-wound composites that are less sensitive and therefore less useful for process optimization purposes.
Current work investigates how the microstructure and the mechanical performances change when a new, un-optimized impregnation method is employed for wet filament winding. The aim is to determine which specific aspects of composite microstructure are affected by this change. Winding speeds and the cylinder thickness were also varied due to their practical importance. The general aspiration was to build new knowledge about the microstructure, something that would not be tied to one impregnation concept only. Although apparent strengths (short beam shear, split disk tension) are also measured and presented, the main focus here is on microstructural evaluation (fibres, voids), which has not been investigated in detail by similar studies before.
The novelty in the work comes from characterizing the microstructure of the composite. Therefore, custom-written image analysis algorithms are briefly introduced first. These algorithms are applied to characterize the microstructural morphology – the size, the shape and the spatial arrangement of fibres and voids. Our work shows that statistical distribution of local fibre volume fractions from hoop-filament winding is close to Gaussian. Also, that voids have a specific quantifiable morphology of how they are shaped and distributed. This morphology gives realistic inputs for future modeling to numerically investigate how the microstructure affects structural performance. Regarding novel impregnation concepts, it is concluded that their development and optimization should aim for the minimization of void content while avoiding mechanical/friction damage to the fibres.
The experimental data used for this investigation was collected during a thesis project. 30 Neither the data nor the analysis were part of the published thesis, unless directly referred to.
Materials
The composite cylinders were filament wound using Toray T700SC-12k carbon fibres and epoxy resin system from EPIKOTE MGS RIMR 135 and EPIKURE MGS RIMH 137 curing agent. All cylinders have the same 140 mm internal diameter from the high density polyethylene mandrel. Hoop winding was carried out in [+89.4 °/−89.4 °] layer pairs with respect to the cylinder axis. The tows were laid down at 5 mm bandwidth using a constant 40 N pre-tension at the spool creel. The cylinders were cured for 24 h at room temperature and then post-cured for 16 h at 80 ℃, following the resin supplier recommendations.
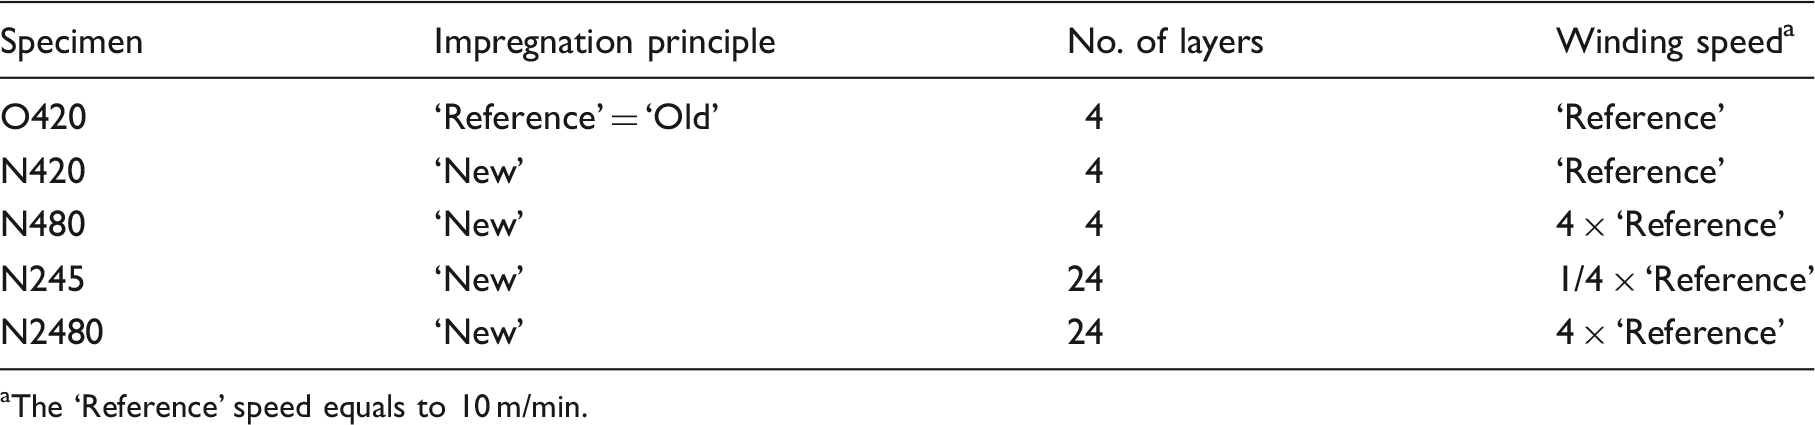
The cylinders were produced using five configurations of production parameters, as detailed in Table 1. The reference configuration denoted O420 defines the standard approach for tow impregnation (see Figure 1(a)). It employs a partially submerged drum and a doctor blade to regulate the amount of resin on the drum. A four-layered thick cylinder was wound with this standard method.
The configurations of filament wound cylinders. The ‘Reference’ speed equals to 10 m/min.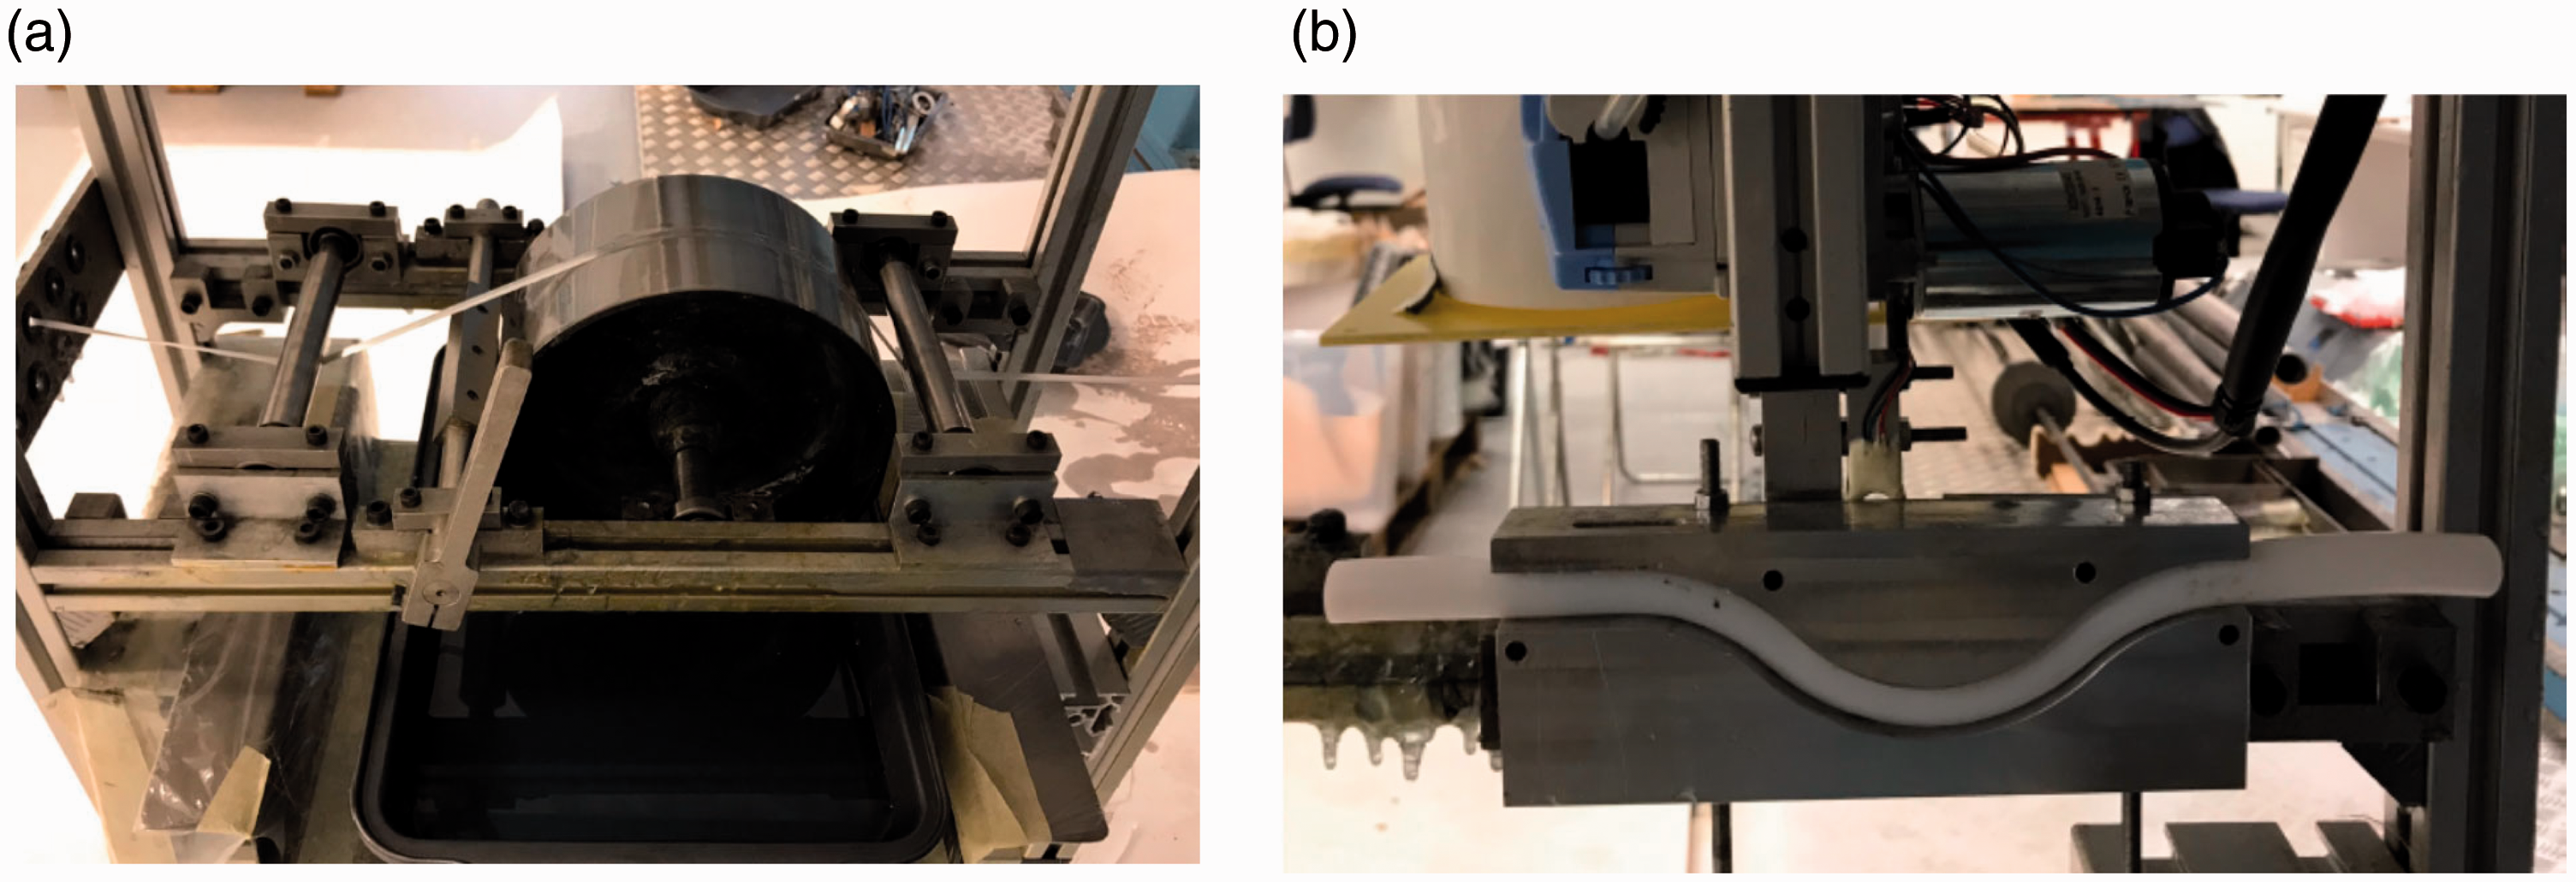
Thereafter, four other cylinders were produced, employing a new impregnation system (Figure 1(b)). This system uses a closed sinusoid-shaped tube without moving parts, a device motivated by Paessler et al. 8 and Miaris et al.9–11 The rationale for the new design stems from the search for novel solutions for faster and better-controlled production. Cylinders of 4-layer and 24-layer thickness were wound using the new system. The winding speeds were chosen from a quarter to four times the ‘Reference’ speed of 10 m/min. Both the old and the new impregnation systems were employed with slightly excessive amounts of resin dosing. The excess resin was manually scraped off throughout winding.
The new device for tow impregnation (Figure 1(b)) is still developmental and therefore not optimized. Its final specifics are a work in progress. The device is ‘not optimized’ in terms of the tube material (currently PTFE), its diameter, the degree of tube ovality, its longitudinal shape, the location where the resin enters the tube and other design parameters. The new device will pass additional design iterations to improve its performance. Current work identifies the qualities of composite, which can be taken as targets to further optimize the device. The fact that the new impregnation device is not optimized is rather a benefit because it likely increases the differences in performance compared to the reference system. It enables to better identify the effects the impregnation system has on the composite microstructure.
The PTFE impregnation tube is vertically clamped by an aluminium tool, making its cross section laterally oval. The filament tow is pulled through the tube, and the resin is injected at the entrance of the siphon at atmospheric pressure. Tow tension increases along the impregnation unit due to friction between the filaments and the tube wall and due to shearing from the resin film. The tow becomes impregnated along the tube length. A compaction pressure is created at the curves of the tube, forcing the impregnation process. A more detailed description for this impregnation process can be found in the literature.9–11 This principle is different from the reference system, where the tow is impregnated by pressing against the rotating surface of the drum which brings up a film of resin from the open bath below. This work was undertaken to assess how the composite wound by the new impregnation system (‘N’) distinguishes from the composite by the old (‘O’) i.e. reference system and which are the sensitive characteristics for assessing the impregnation variability. A more ambitious goal was to determine the microstructural features that both of these systems produce. Two impregnation systems are very different, and it is likely that common observed features are generally applicable to many different processes.
The variables in manufacturing also include the constituent materials – the resin (pot life/curing/viscosity, temperature, humidity), the fibres (strength, sizing) and the composite design (stacking sequence). 18 For current specimens, these variables were kept constant to the best of experimental capability to simplify the analysis of results.
Micrographs and the image analysis
Two main material characteristics are studied, denoted by V f and A0, and defined as the fibre and the void areas of the cross-section, in proportion to the full cross-section area. For unidirectional long fibre-reinforced composites, as used throughout this work, the fibre area fraction equals the fibre volume fraction V f . For voids, the third (tangential) dimension is hereby not reported, and current analysis does not make any assumptions about it either, calling the area fraction A0 ‘void content’ rather than ‘void volume fraction’. Detailed micro-CT scans have shown that voids in filament wound composite are elongated along the fibre direction.4,6
Composite specimens were cut transverse to the fibers and embedded in small blocks of resin. Mechanical surface preparation (grinding, polishing) was carried out in steps, using successively finer abrasive media. The micrographs were obtained by Alicona confocal microscope using reflected light optical microscopy. The raw images were taken at:
100 x magnification (11.2 [pixels/μm]) for fibre volume fraction (V
f
); 20 x magnification (2.3 [pixels/μm]) for void content (A0) analyses.
The edges of the images were cropped, excluding the specimen surface and the information stamp left by the microscope. Individual micrographs were slightly rotated to align the composite material axes with horizontal/vertical axes of the image. The analysis region size was kept constant: 0.37 × 0.26 mm2 for V f analysis and 1.9 × 1.0 mm2 for A0 analysis. This gave an overview of one-layer thickness for V f and four-layer thicknesses for A0 analyses, sufficient for the evaluation of the average microstructure. Multiple images, randomly taken throughout the cross-section, were analysed for every specimen configuration. Previous image analysis work had identified that through-thickness trends in microstructure were rather mild, if present at all.
The saturation and the brightness were slightly modified in all images, and the micrographs were converted to greyscale (Figure 2(a) and (b)). A typical histogram of a greyscale image is shown in Figure 2(c), where different material phases are distinguished by different levels of grey. In simple terms, the fibres contain the lightest pixels, the voids the darkest and the grey pixels of the matrix lay between these two extremes. The peaks of the histogram are not distinct and separate, but overlapping, which makes it difficult to unequivocally separate individual phases. During grinding, brittle carbon fibres break and scratch the specimen surface. Such artefacts from surface preparation affect each individual image differently. The perfect image does not display scratches or residues from grinding, the fibres appear perfectly circular and the image is fully in focus. A flat surface that is normal to the fibres, and to the axis of the microscope, needs to be prepared. In reality, the specimens and the procedures always deviate from this ideal.
Micrograph of specimen N2480-2 (20 × magnification): (a) original image; (b) the analysis region, cropped from the greyscale image; (c) histogram of grey levels in the analysis region.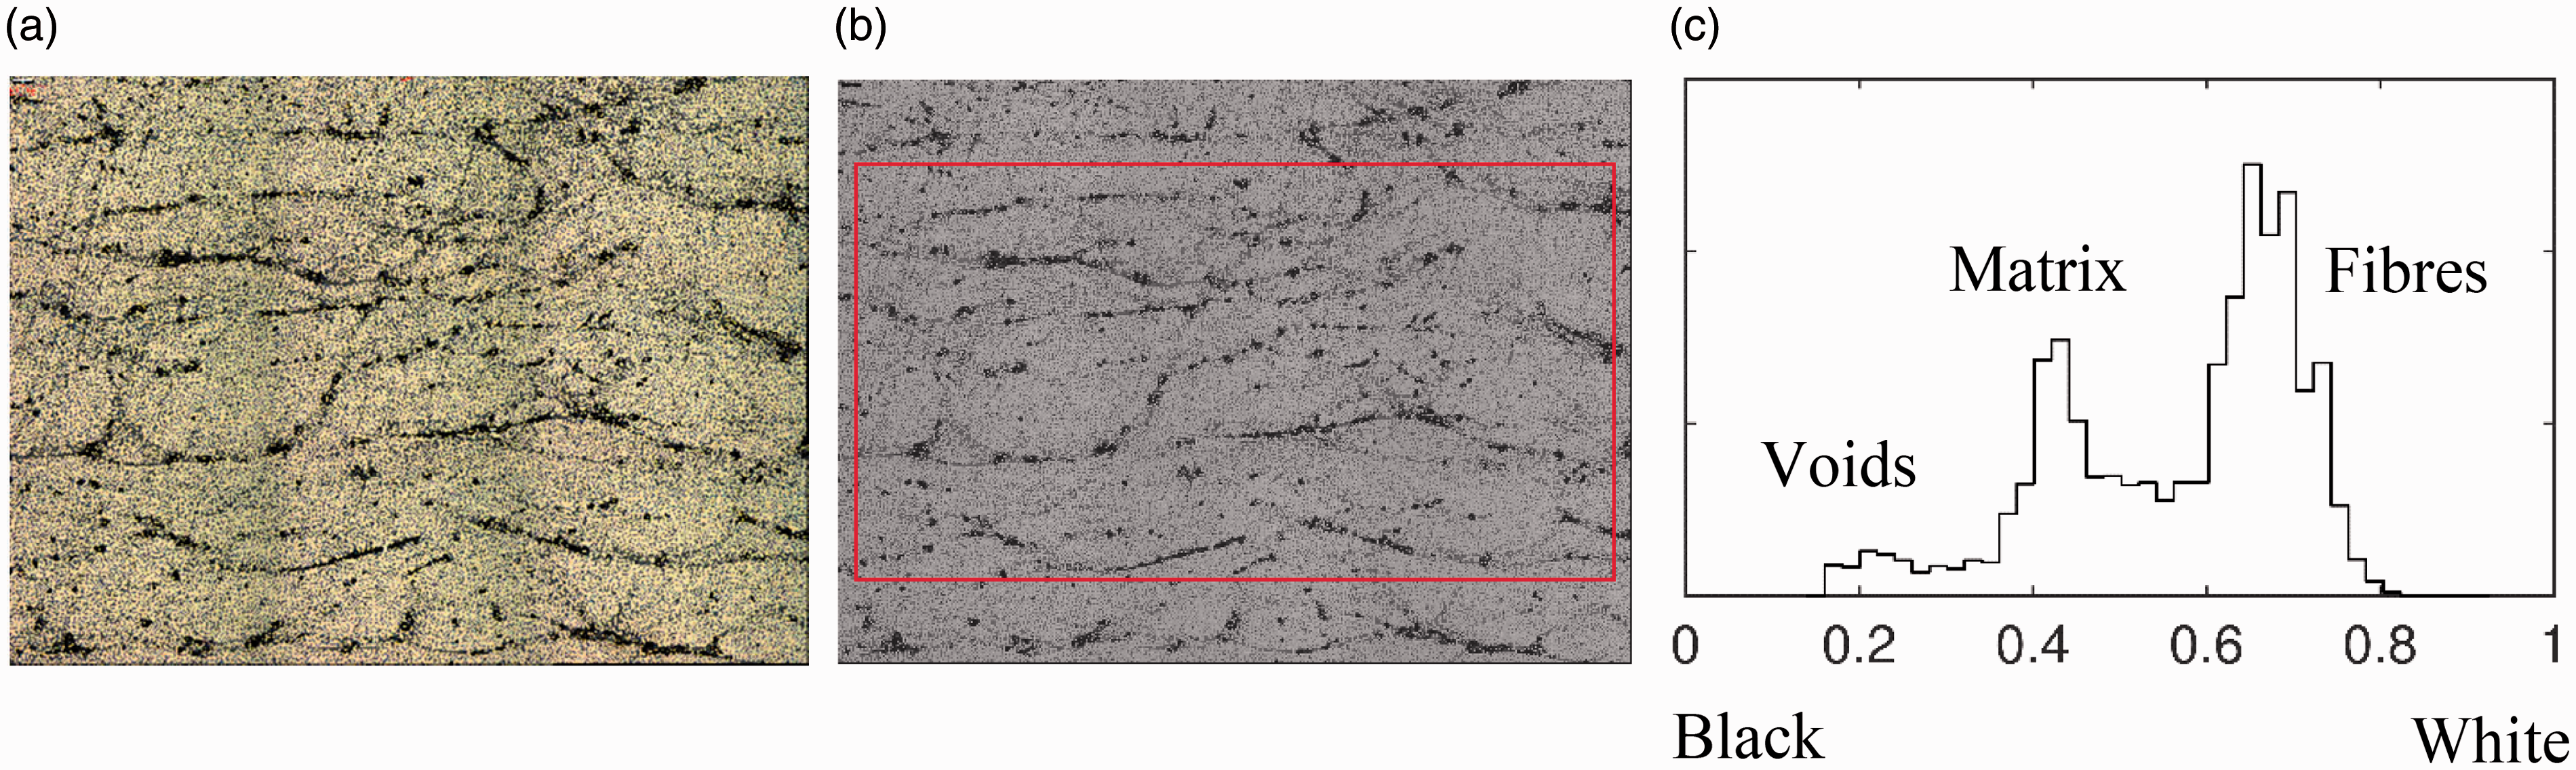
The basic principles of two image analysis algorithms are shortly described in the following. The values of algorithms' internal parameters were selected by trial-and-error i.e. by manual calibration. It needs to be pointed out that these internal parameters were kept constant in all of the analyses. That is, all images/configurations have been analysed by exactly the same numerical procedures to facilitate adequate comparisons.
Fibre volume fraction Vf
The image is first converted from grey to binary, and a series of morphological opening, erosion, closing, reconstruction, etc. operations are carried out. The fibres are then identified using a circular Hough transform algorithm, which can effectively distinguish even touching fibers. Detected circles are first filtered based on the centre-to-centre distance (discarding misidentified circles that clearly overlap) and then based on the grey level values of pixels in each identified circle. The identified fibres/circles are allowed to have different diameters. The resulting algorithm is robust and only gives a few falsely detected or missed fibres in each image, out of thousands. A typical example can be seen in Figure 3(b), and similar performances were visually verified for all images. The mean diameter of fibres identified from all micrographs was 6.82 ± 0.17 μm (at two standard deviations), a close agreement with 7 μm from the manufacturer's datasheet.
Fibre volume fraction from micrograph O420-1 (100 × magnification): (a) original image; (b) fibre detection (V
f
= 54.1%).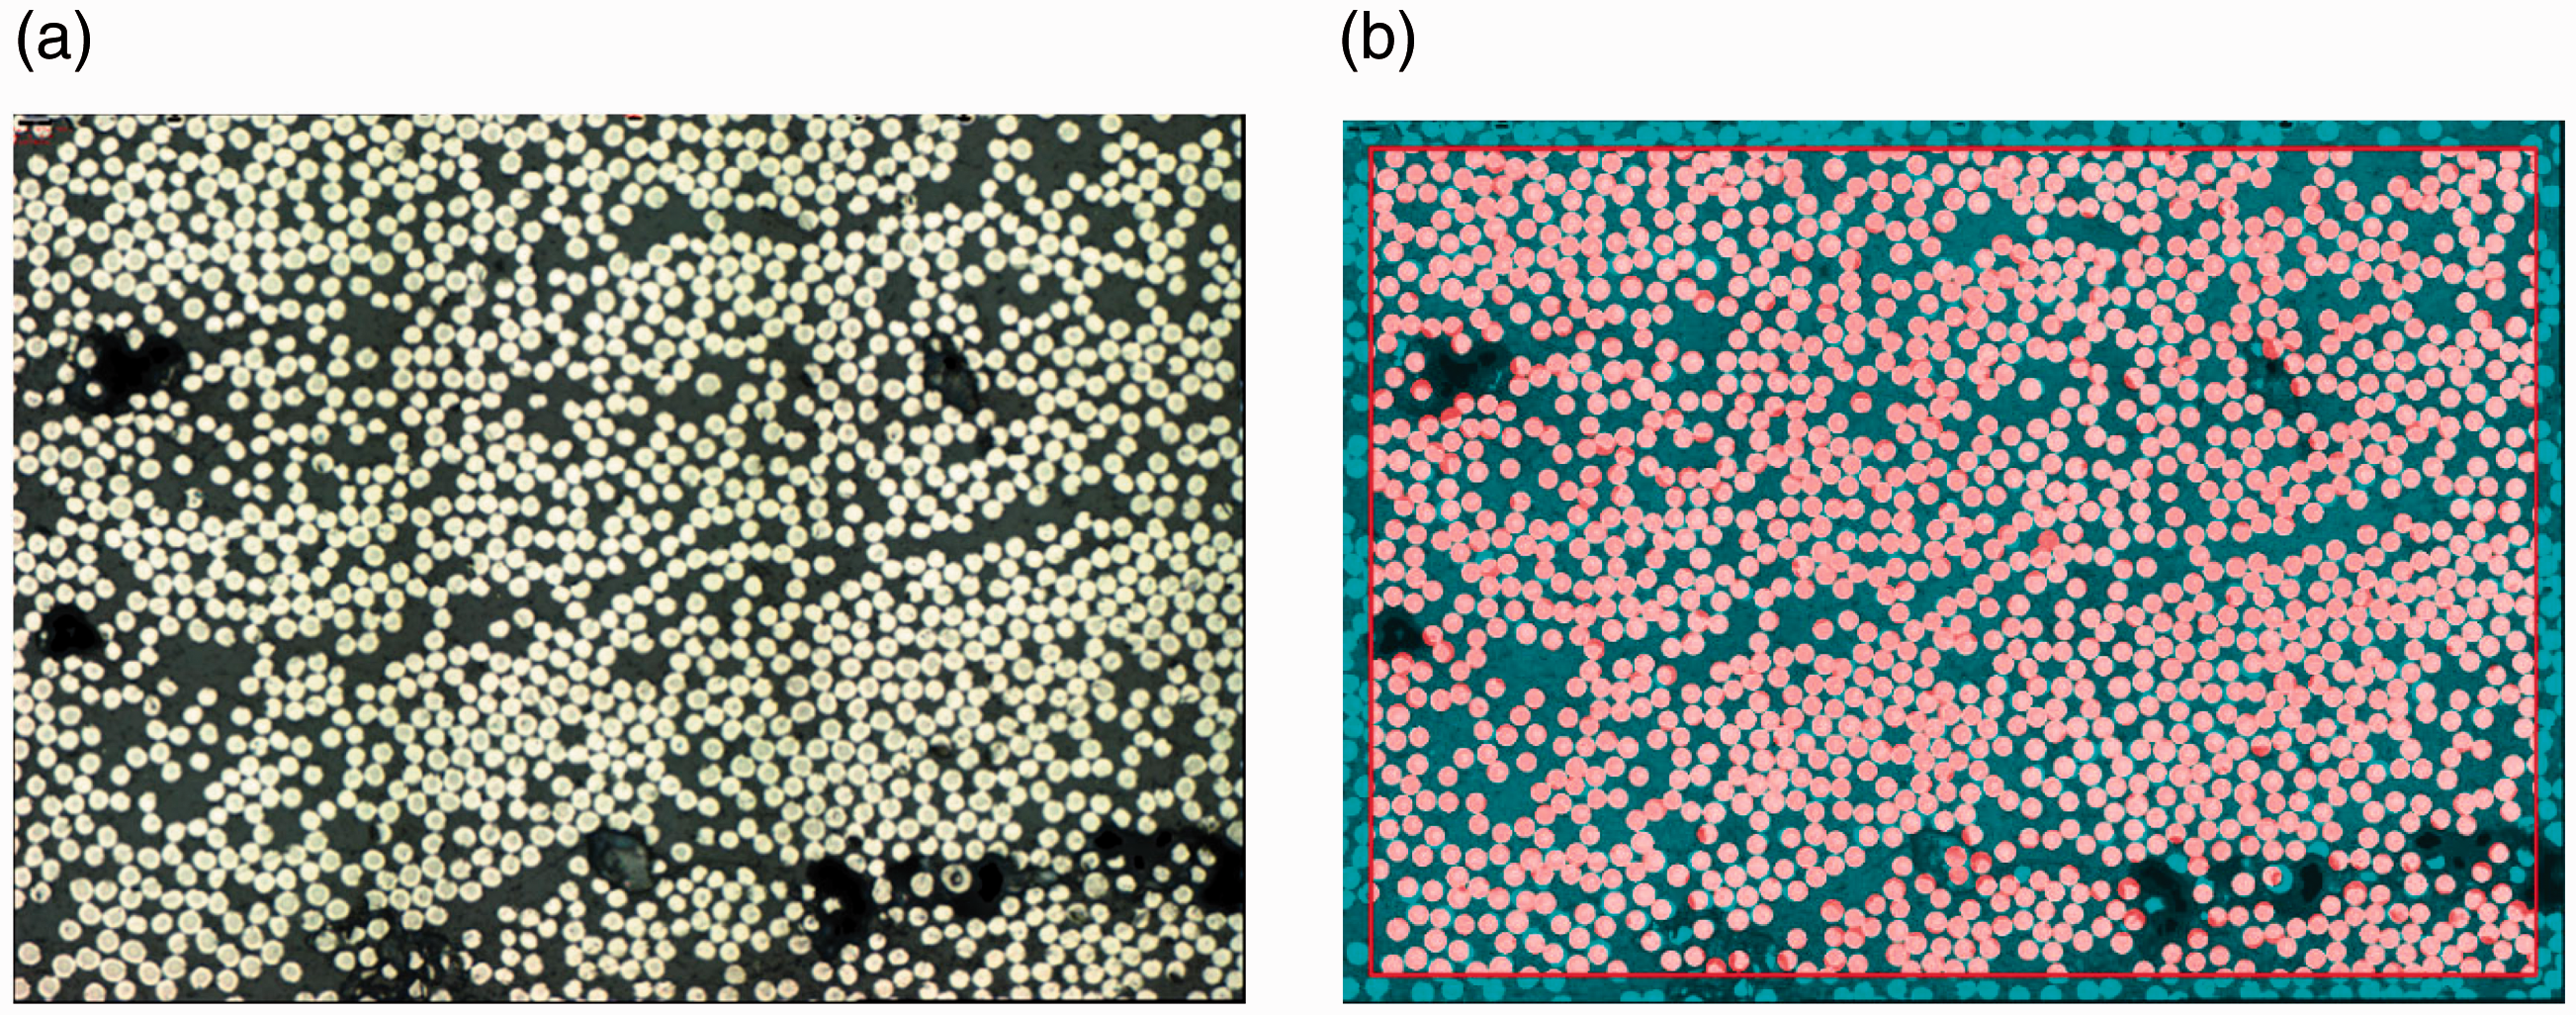
Void content A0
Voids are identified based on areas of pixels below a certain grey-level threshold, i.e. by separating dark peaks on the histogram as seen in Figure 2(c). Artifacts such as small dark regions appearing on top of fibres and elsewhere in the cross-section – residues from surface preparation – are removed by median filtering. This cleaning process was manually calibrated and is applied the same way to all images. The void detection algorithm cannot properly distinguish between small voids and small dark residues left by the surface preparation. Both appear as dark pixels. So, the filtering/cleaning process brings some bias, reducing the detection of very small voids. Microvoids with dimensions below one fibre diameter are the most affected. A typical example of void detection is shown in Figure 4. The voids are approximated by ellipse shapes, as seen in Figure 4(c), to obtain statistical information for further analysis. A distinction is made between large voids that appear elongated, similar to cracks and smaller voids with a more circular appearance.
Void content detection from micrograph N480-1 (20 × magnification): (a) original image; (b) voids (A0 = 4.1%) identified on a greyscale outtake; (c) large and small voids marked by ellipses of different colour.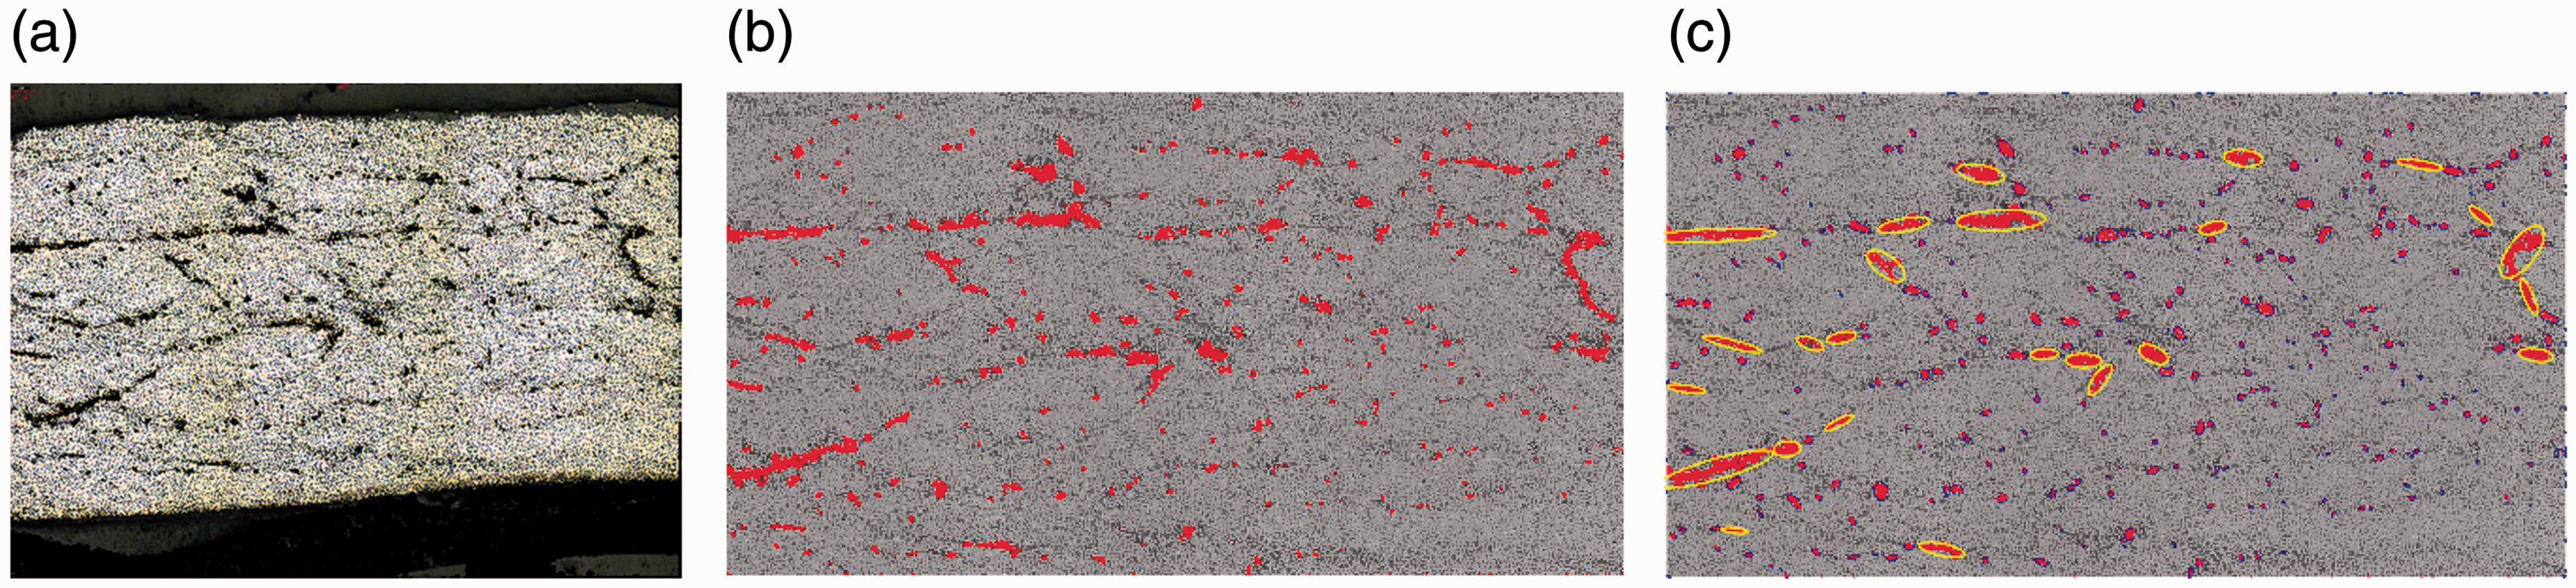
Microstructural characteristics
Fibre volume fraction Vf

Fibre volume fractions and fibre diameters.
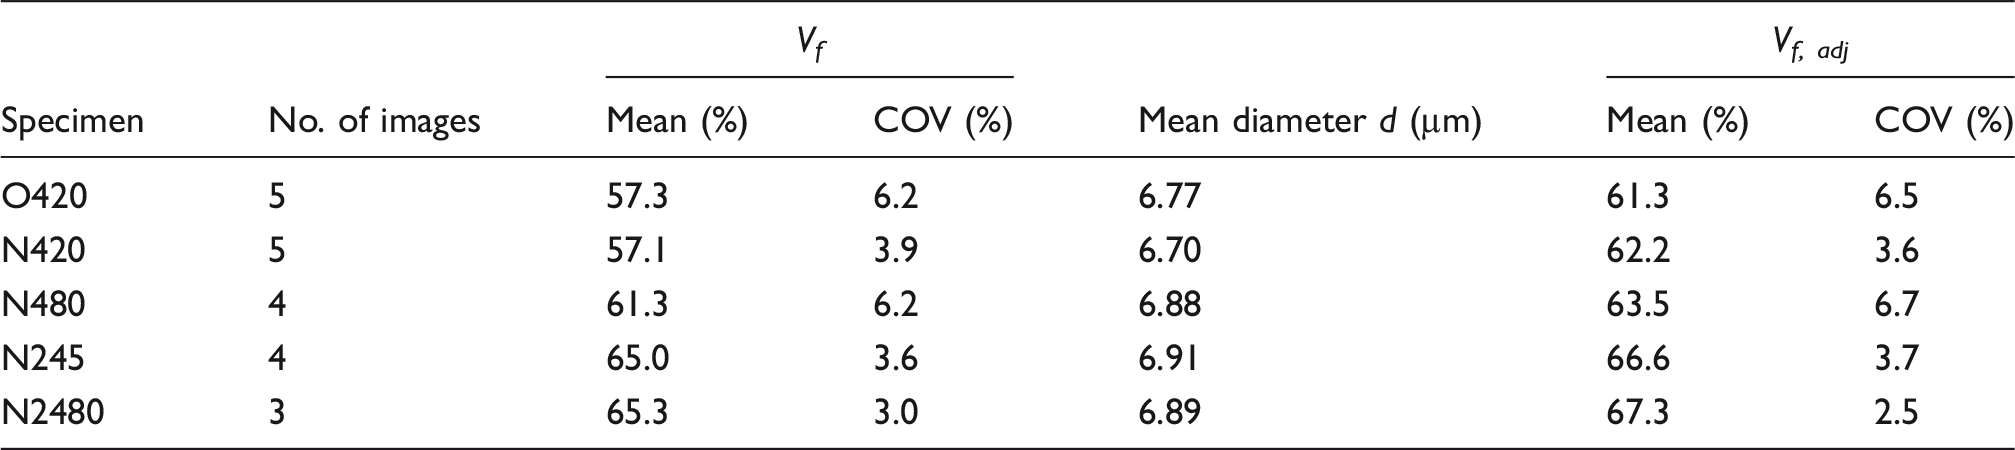
The fibre volume fraction of specimens from the reference process (O420) has previously been assessed by the standard method EN 2564.32,33 This procedure is based on matrix digestion i.e. the chemical extraction of 7 μm carbon fibres. When the possible presence of voids (0–5%) is considered, the reference fibre volume fraction is estimated to range between 59% and 62%. The comparison of fibre volume fractions from all specimens (Table 2) is now visualized in Figure 5. The numbers of analysed images are written on individual bars, and each image was considered a separate measurement for the dispersion analysis. The good agreement of O420 measurements, both before and after the adjustment, with the reference interval validates the V
f
image analysis algorithm.
Fibre volume fractions with uncertainty intervals (±2 st. dev).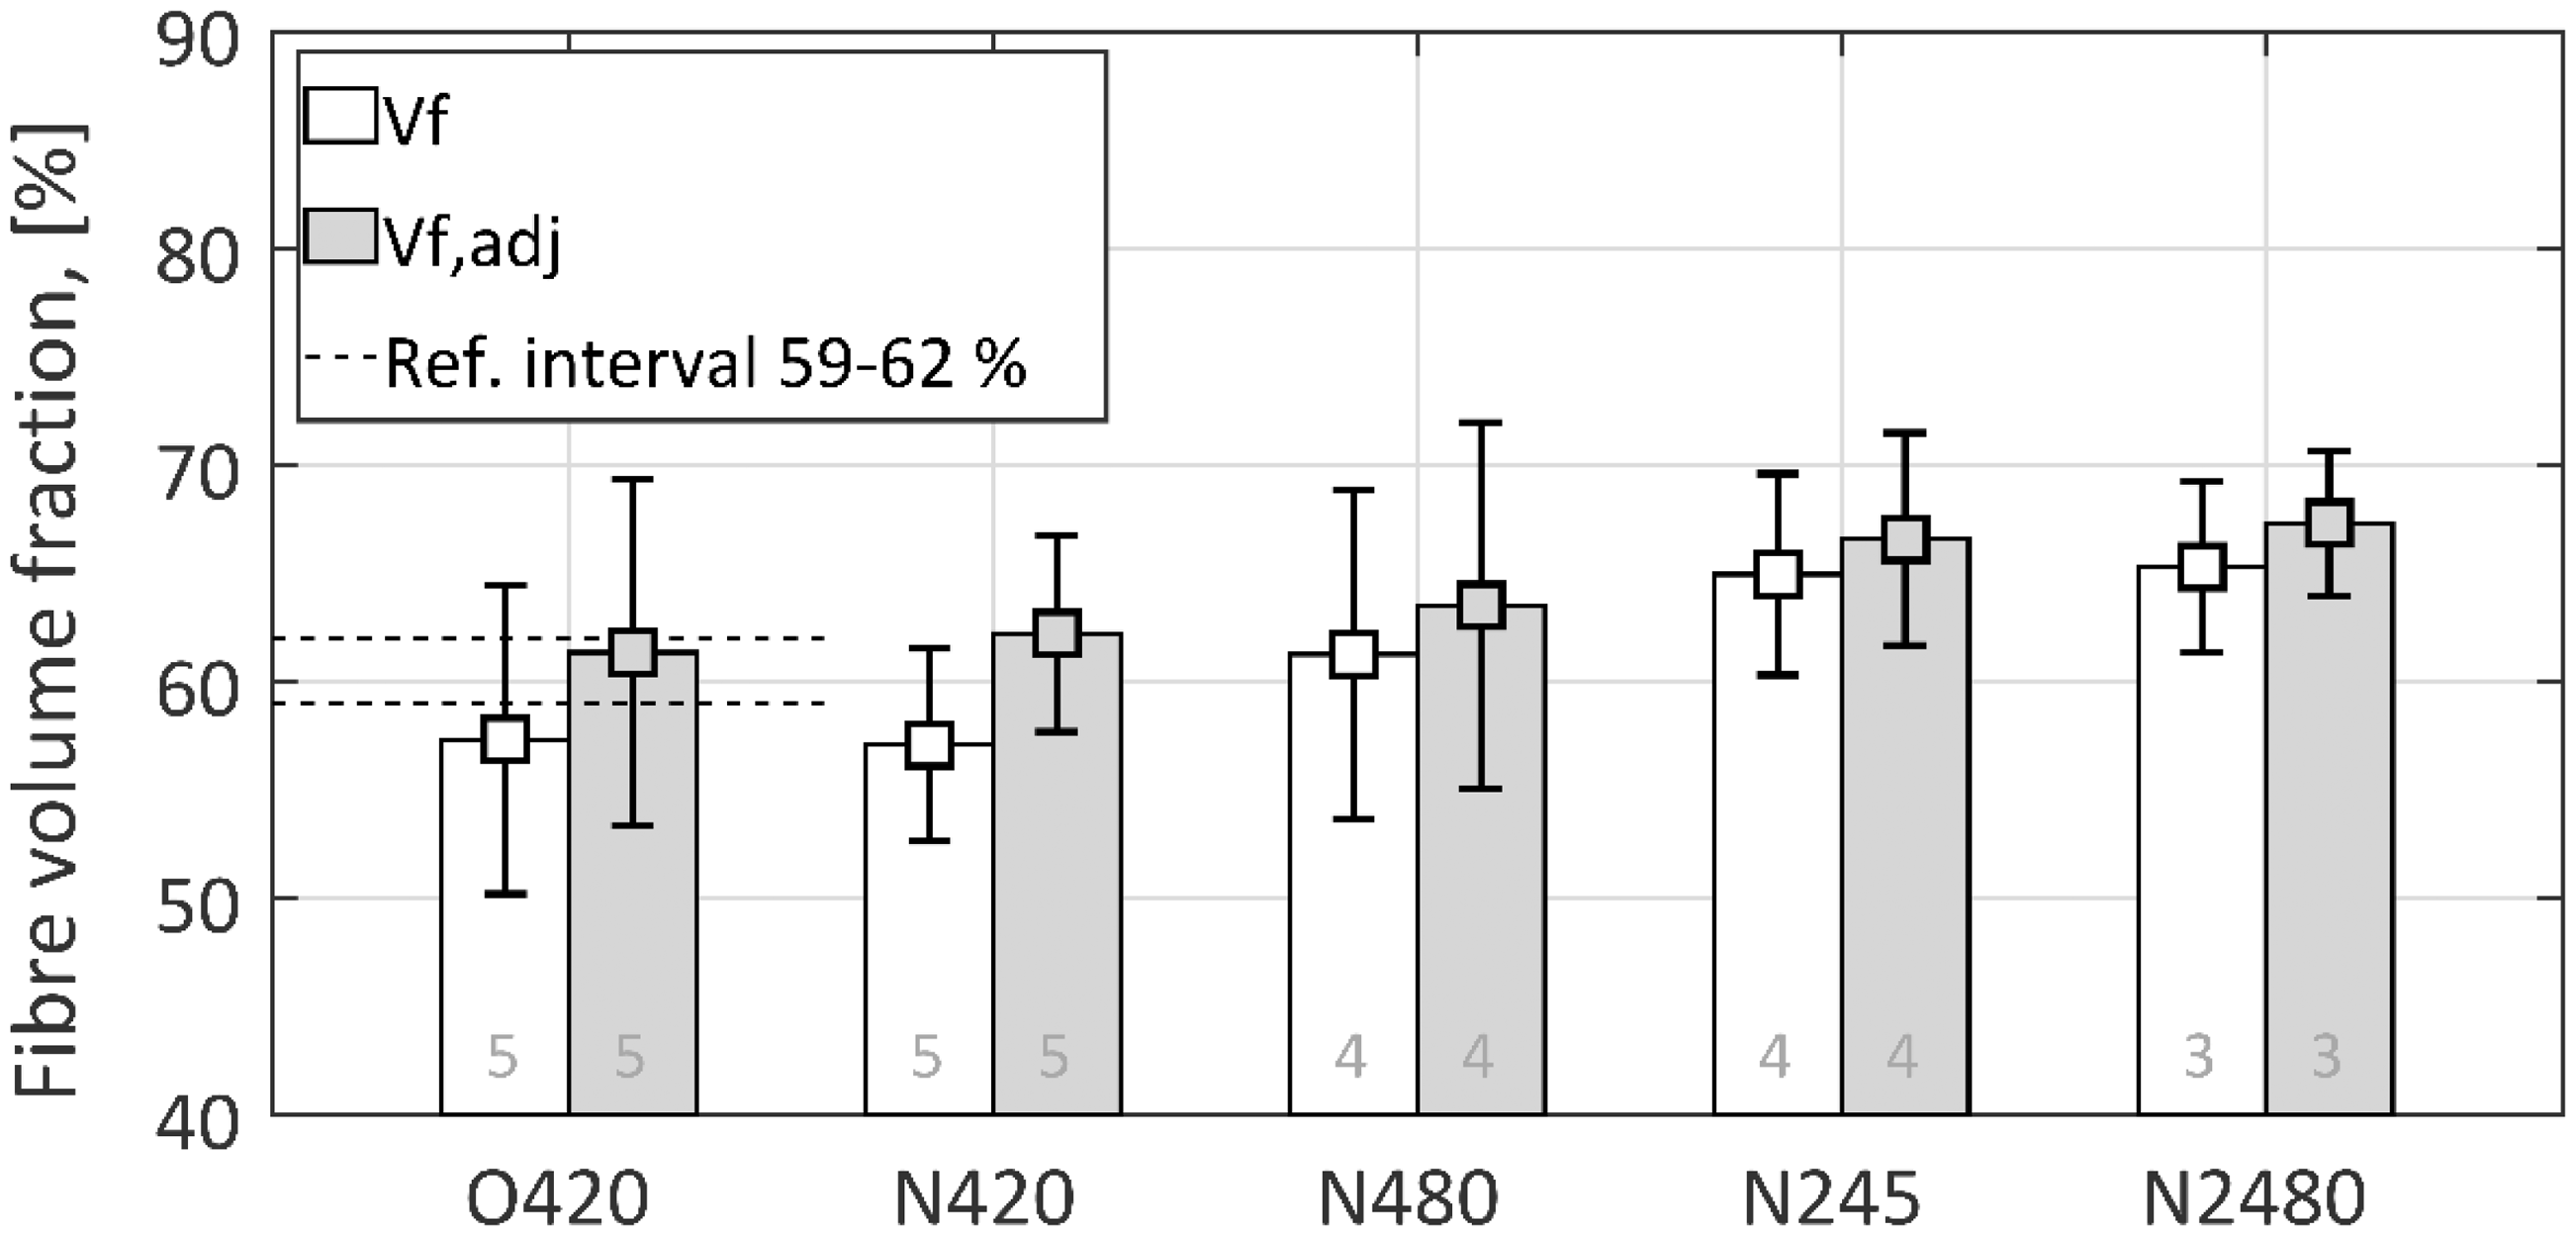
Meanwhile, Figure 5 shows that neither the impregnation method nor the winding speed had a significant influence on the fibre volume fraction. The V f results in Figure 5 are insensitive to these variations in the production process. Noticeably, thick specimens N245 and N2480 display higher mean fibre fractions, but the results are still within dispersion bounds of thin specimens. The average fibre volume fraction of filament-wound cylinders has been reported to be mostly affected by the pre-tension of tows (the stacking sequence is disregarded here). 18 Supporting evidence to this is also found in Pathak, 31 where the wall thickness of cylinders remained constant even in conditions of extremely varying resin/void contents (and a constant pre-tension). This suggests that the build-up of fibres on the mandrel (the structure that defines V f ) is mostly defined by pre-tension, for low viscosity resins such as epoxy. The term ‘low viscosity’ refers to a resin medium that provides little movement resistance for tows/filaments that are wound on previous layers of fresh composite. High tow tension and the low viscosity of the resin facilitate the squeeze out of excess resin and voids. Tensioned filaments can move quickly through liquid resin and settle directly on the previous layer of fibres. Increasing the amount of resin saturates the volume surrounding the fibres, replacing the empty volume i.e. voids with resin while the overall composite thickness remains constant. For current specimens, the pre-tension of 40 N is fairly high, and it was kept constant. This is why no clear correlation is observed between less-sensitive process parameters (winding speed, wall thickness) and the average fibre volume fraction.
Local fibre volume fractions
The spatial distribution of fibres over the cross-section area is examined next. This is carried out to recover evidence about filament winding, the process responsible for creating the packing of fibres. Current understanding of such a relationship is very basic, so we also seek to identify fundamental characteristics of how individual fibres are actually distributed. This work looks at the local fibre volume fraction as a scalar field only, disregarding the pattern analysis i.e. whether the fibres are positioned clustered, random, or regular. 27
The square and the hexagonal array (Figure 6(a) and (b)) are typical idealizations of fibre packing. These arrangements give 79% and 91% volume fractions, respectively, for maximum possible packing of constant diameter fibres. The actual fibre distribution (Figure 6(c)) is considered somewhat random at low volume fractions, and it approaches the hexagonal arrangement for high volume fractions. Average fibre volume fractions over 80% can be considered very high, unachievable with the common filament-winding process. As high pressures or vacuum are employed in the processing, the amount of resin-rich regions and voids can be reduced. This way, higher average V
f
values and a more homogeneous distribution of fibres can be achieved.
Examples of Voronoi diagrams (solid lines) for different distributions of generator points (dots): (a) square (V
f
= 60%); (b) hexagonal (V
f
= 60%); (c) real microstructure (V
f
≈ 60%).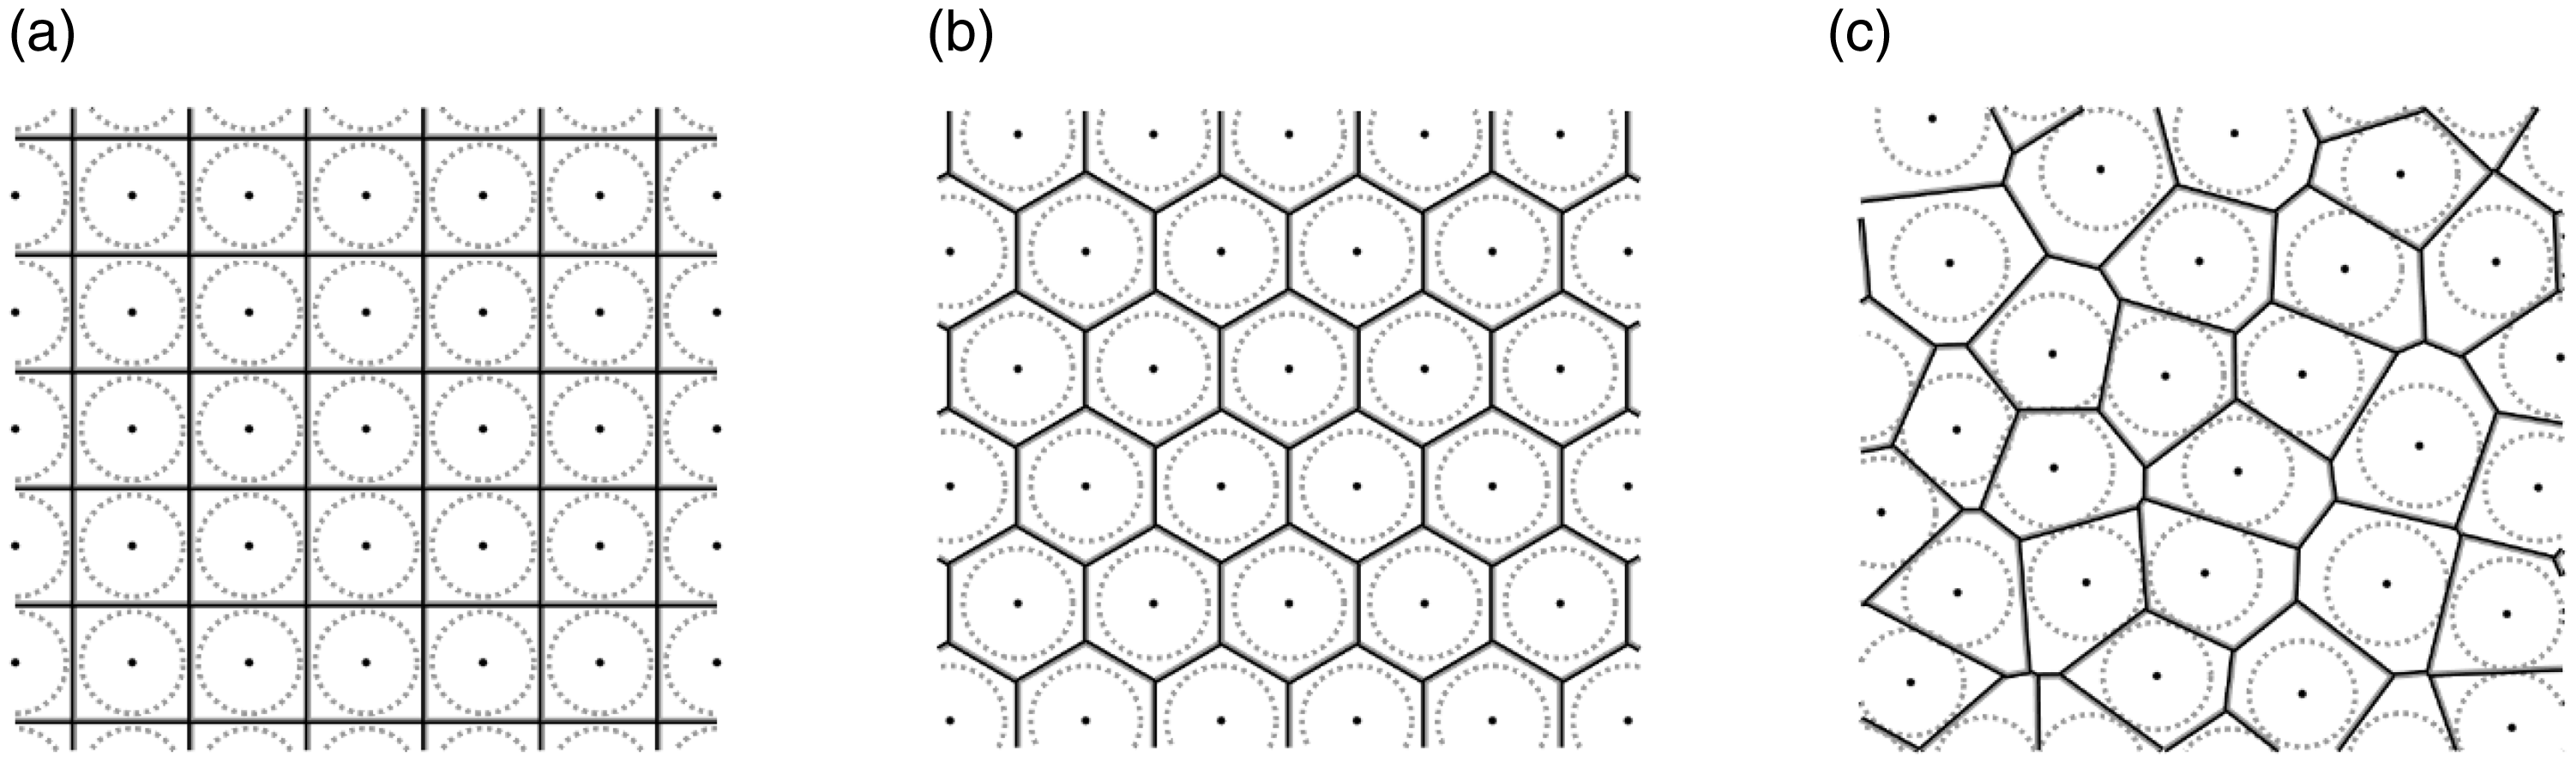
Voronoi diagrams 34 are introduced to calculate the local fibre volume fractions. They help to partition the composite cross-section into unique and mutually exclusive polygons, representing regions of influence around each individual fibre. Figure 6 demonstrates planar Voronoi diagrams for three cases of fibre distributions. The generator points for individual polygons are the centre points of the fibres. The diameters of fibres are in fact immaterial for constructing the polygons. Every point on the cross-section plane is assigned to the closest generator point. The boundaries i.e. Voronoi edges are the locations equally close to two or more generator points. The Voronoi diagram can be defined as a union of Voronoi edges, forming one polygon around each fibre. The local fibre volume fraction is now defined as the relative area of each individual fibre to its Voronoi polygon area.
Only the Voronoi polygons fully inside the cropped regions of micrographs were considered, so the analysis would not be affected by the edges. The example in Figure 7 shows how the local fibre volume fraction varies substantially between dense regions with very high values (V
f
≥ 80%) and regions of low densities (V
f
≤ 40%). The latter typically signifies voids and resin-rich areas. A colour intensity can be utilized to visualize the quasi-continous local fibre fraction, as in Figure 7(b). A better overview is achieved when the image is partitioned into larger regions of local fibre fractions; four intervals, ≤ 40%, 40–60%, 60–80% and ≥80%, were chosen for Figure 8. This way, different intensity regions become better distinguishable.
Local fibre volume fractions for specimen O420-1: (a) fibres in the analysis region; (b) local fibre volume fractions denoted by colour intensities. Examples of local fibre volume fractions in micrographs: (a) O420-1; (b) N245-4; (c) N420-2; (d) N480-3.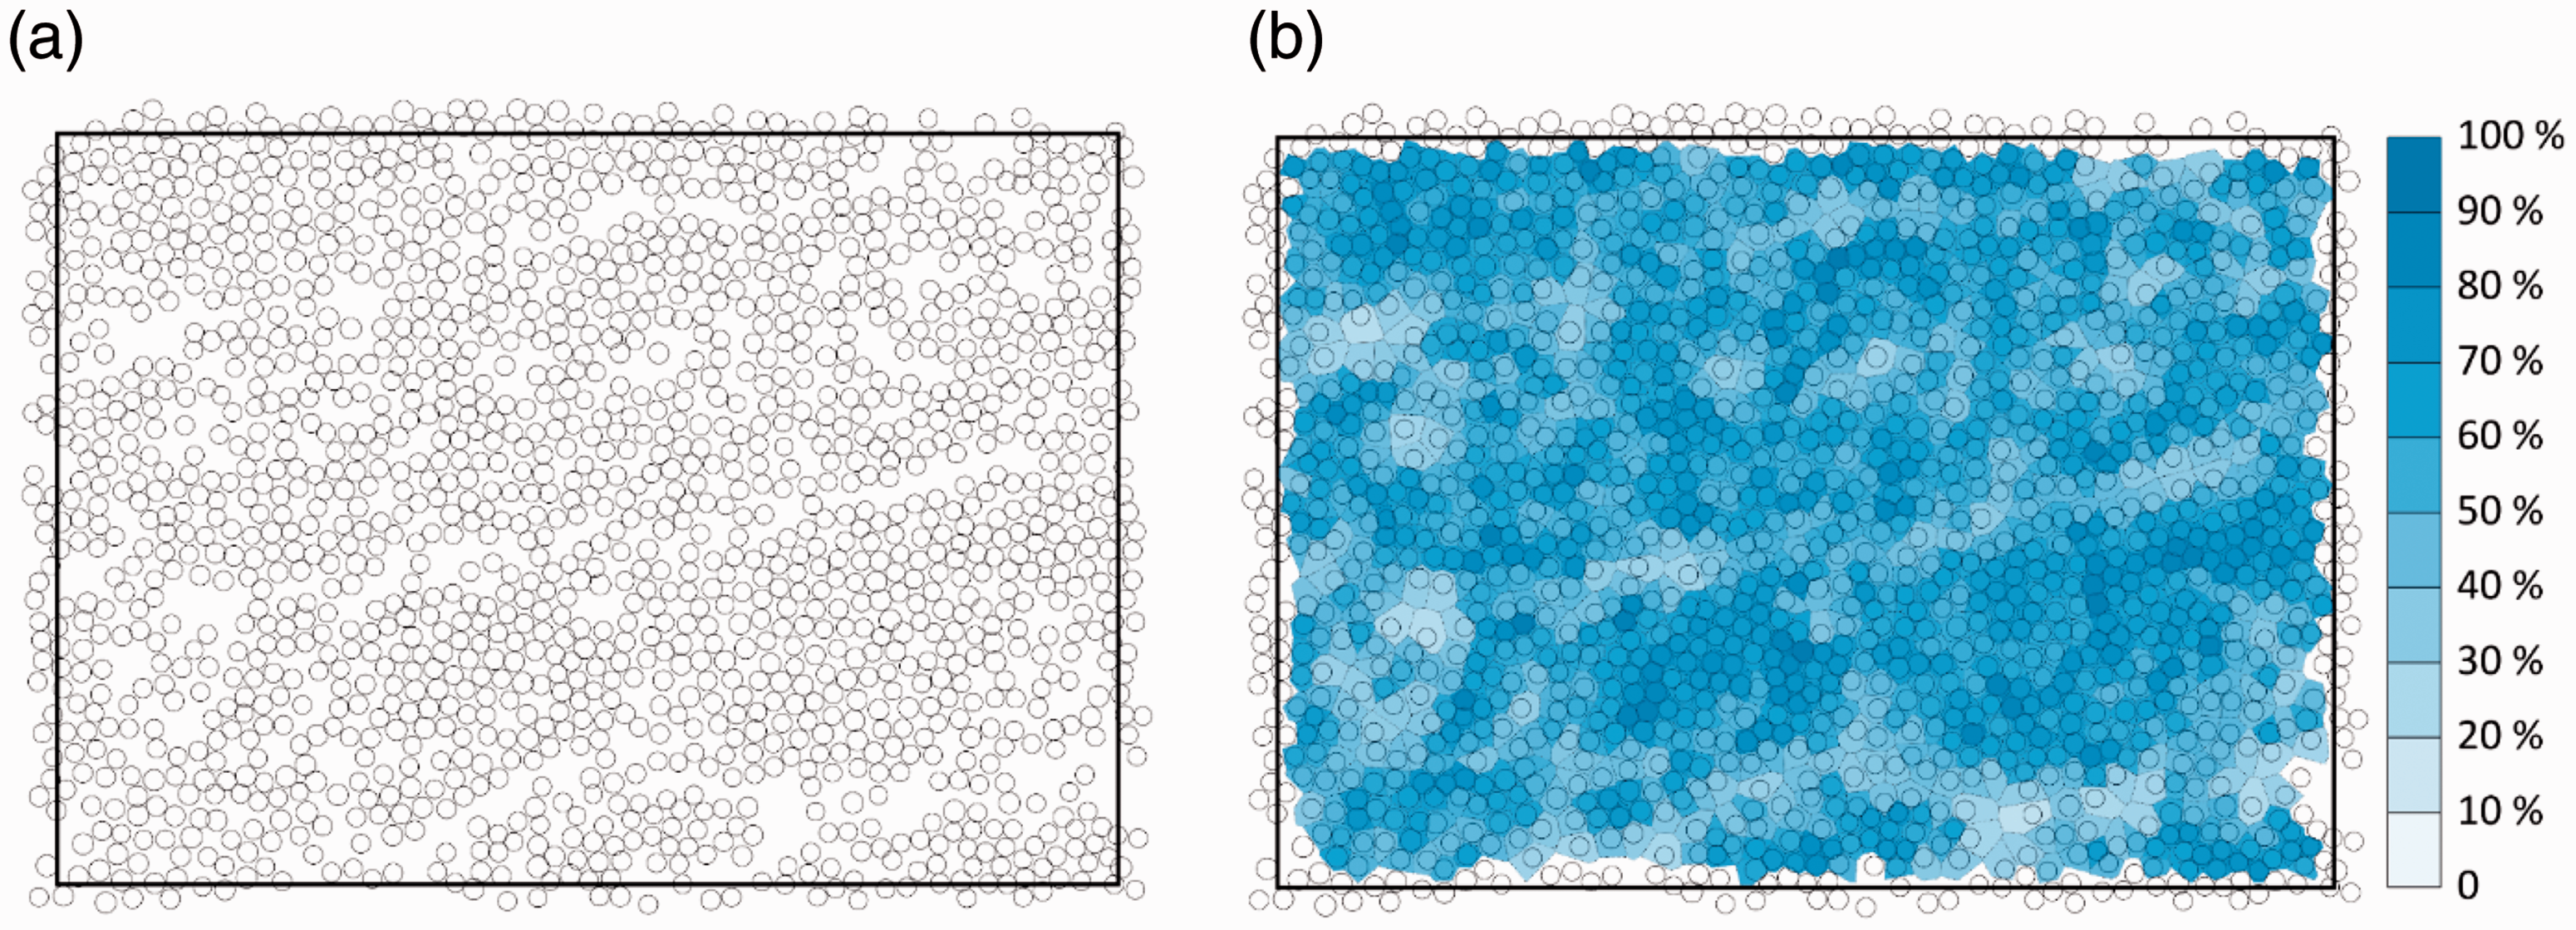
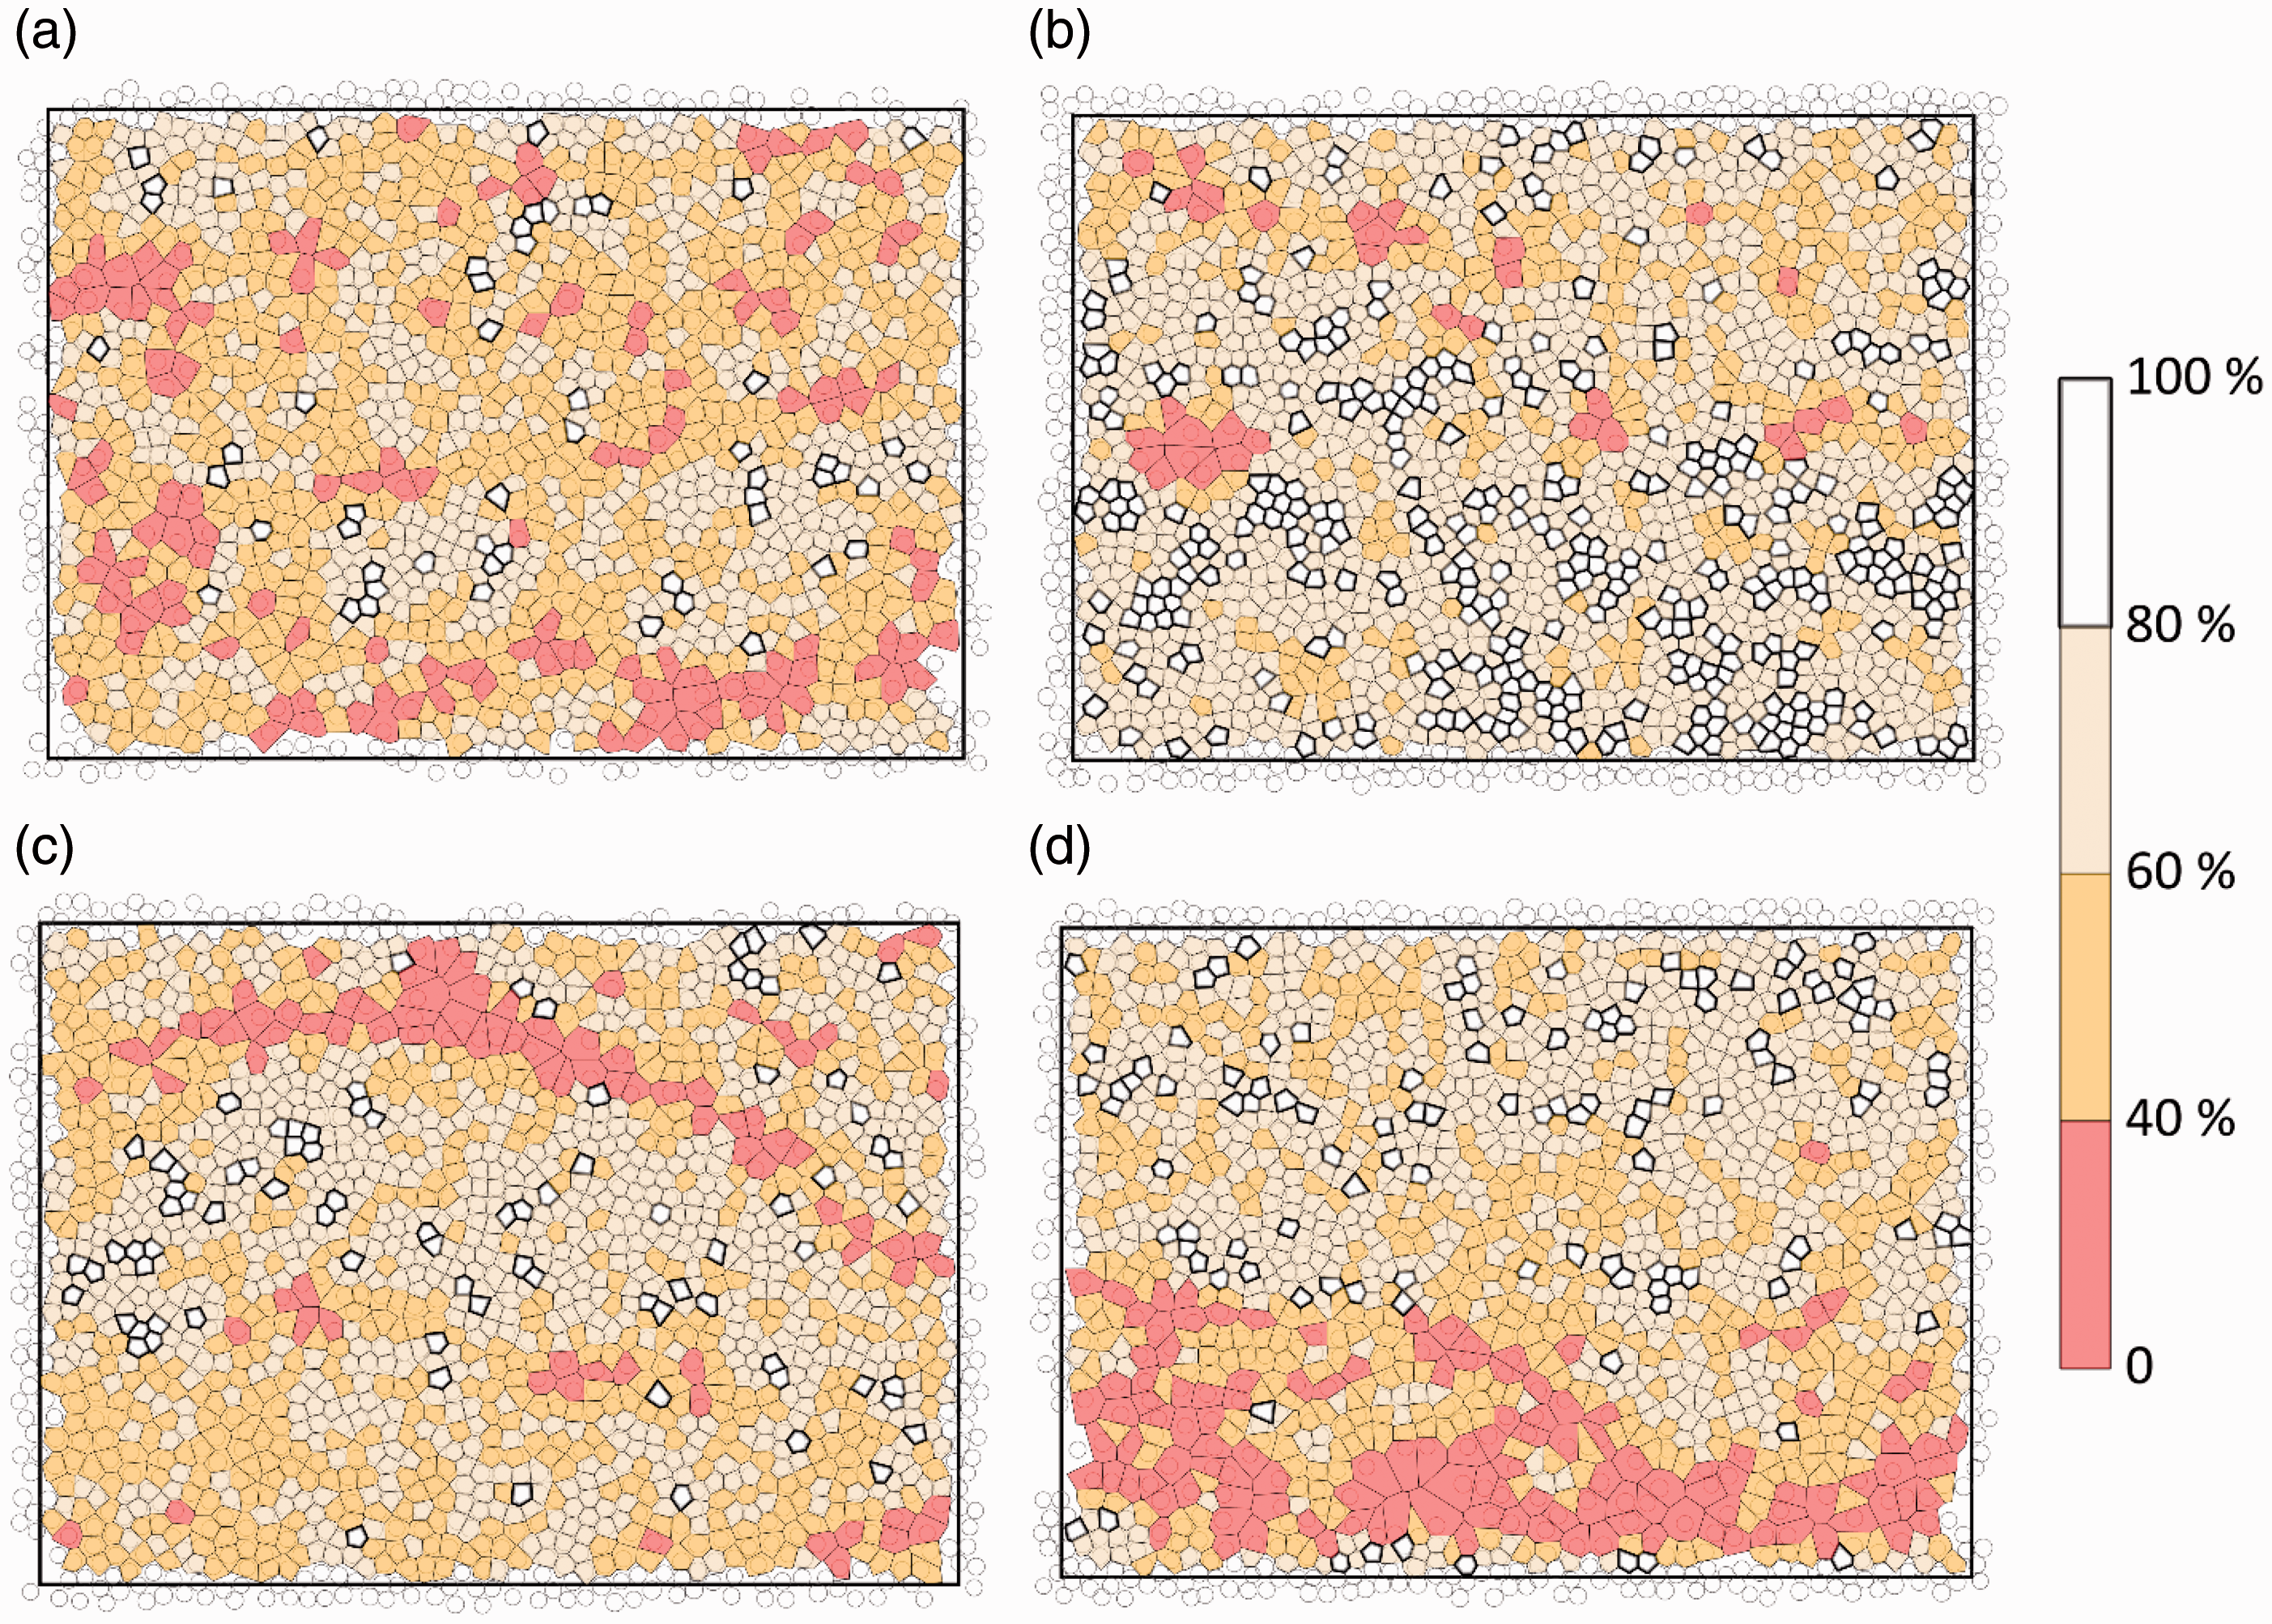
It is evident from Figure 8 that most of the composites have typical fibre volume fractions between 40% and 80%. The low V f regions can be sparsely distributed (Figure 8(a) and (b)), or clustered (Figure 8(c) and (d)), depending on where the specific images are taken. The spatial distribution between the most populous 40-60% and 60–80% segments seems random. The transition between extreme densities is gradual. High density areas (V f = 80–100%) are typically surrounded by areas with slightly less dense packing (V f = 60–80%); and vice versa, voids and matrix rich regions (V f = 0–40%) are surrounded by areas from the next step in packing density (V f = 40–60%).
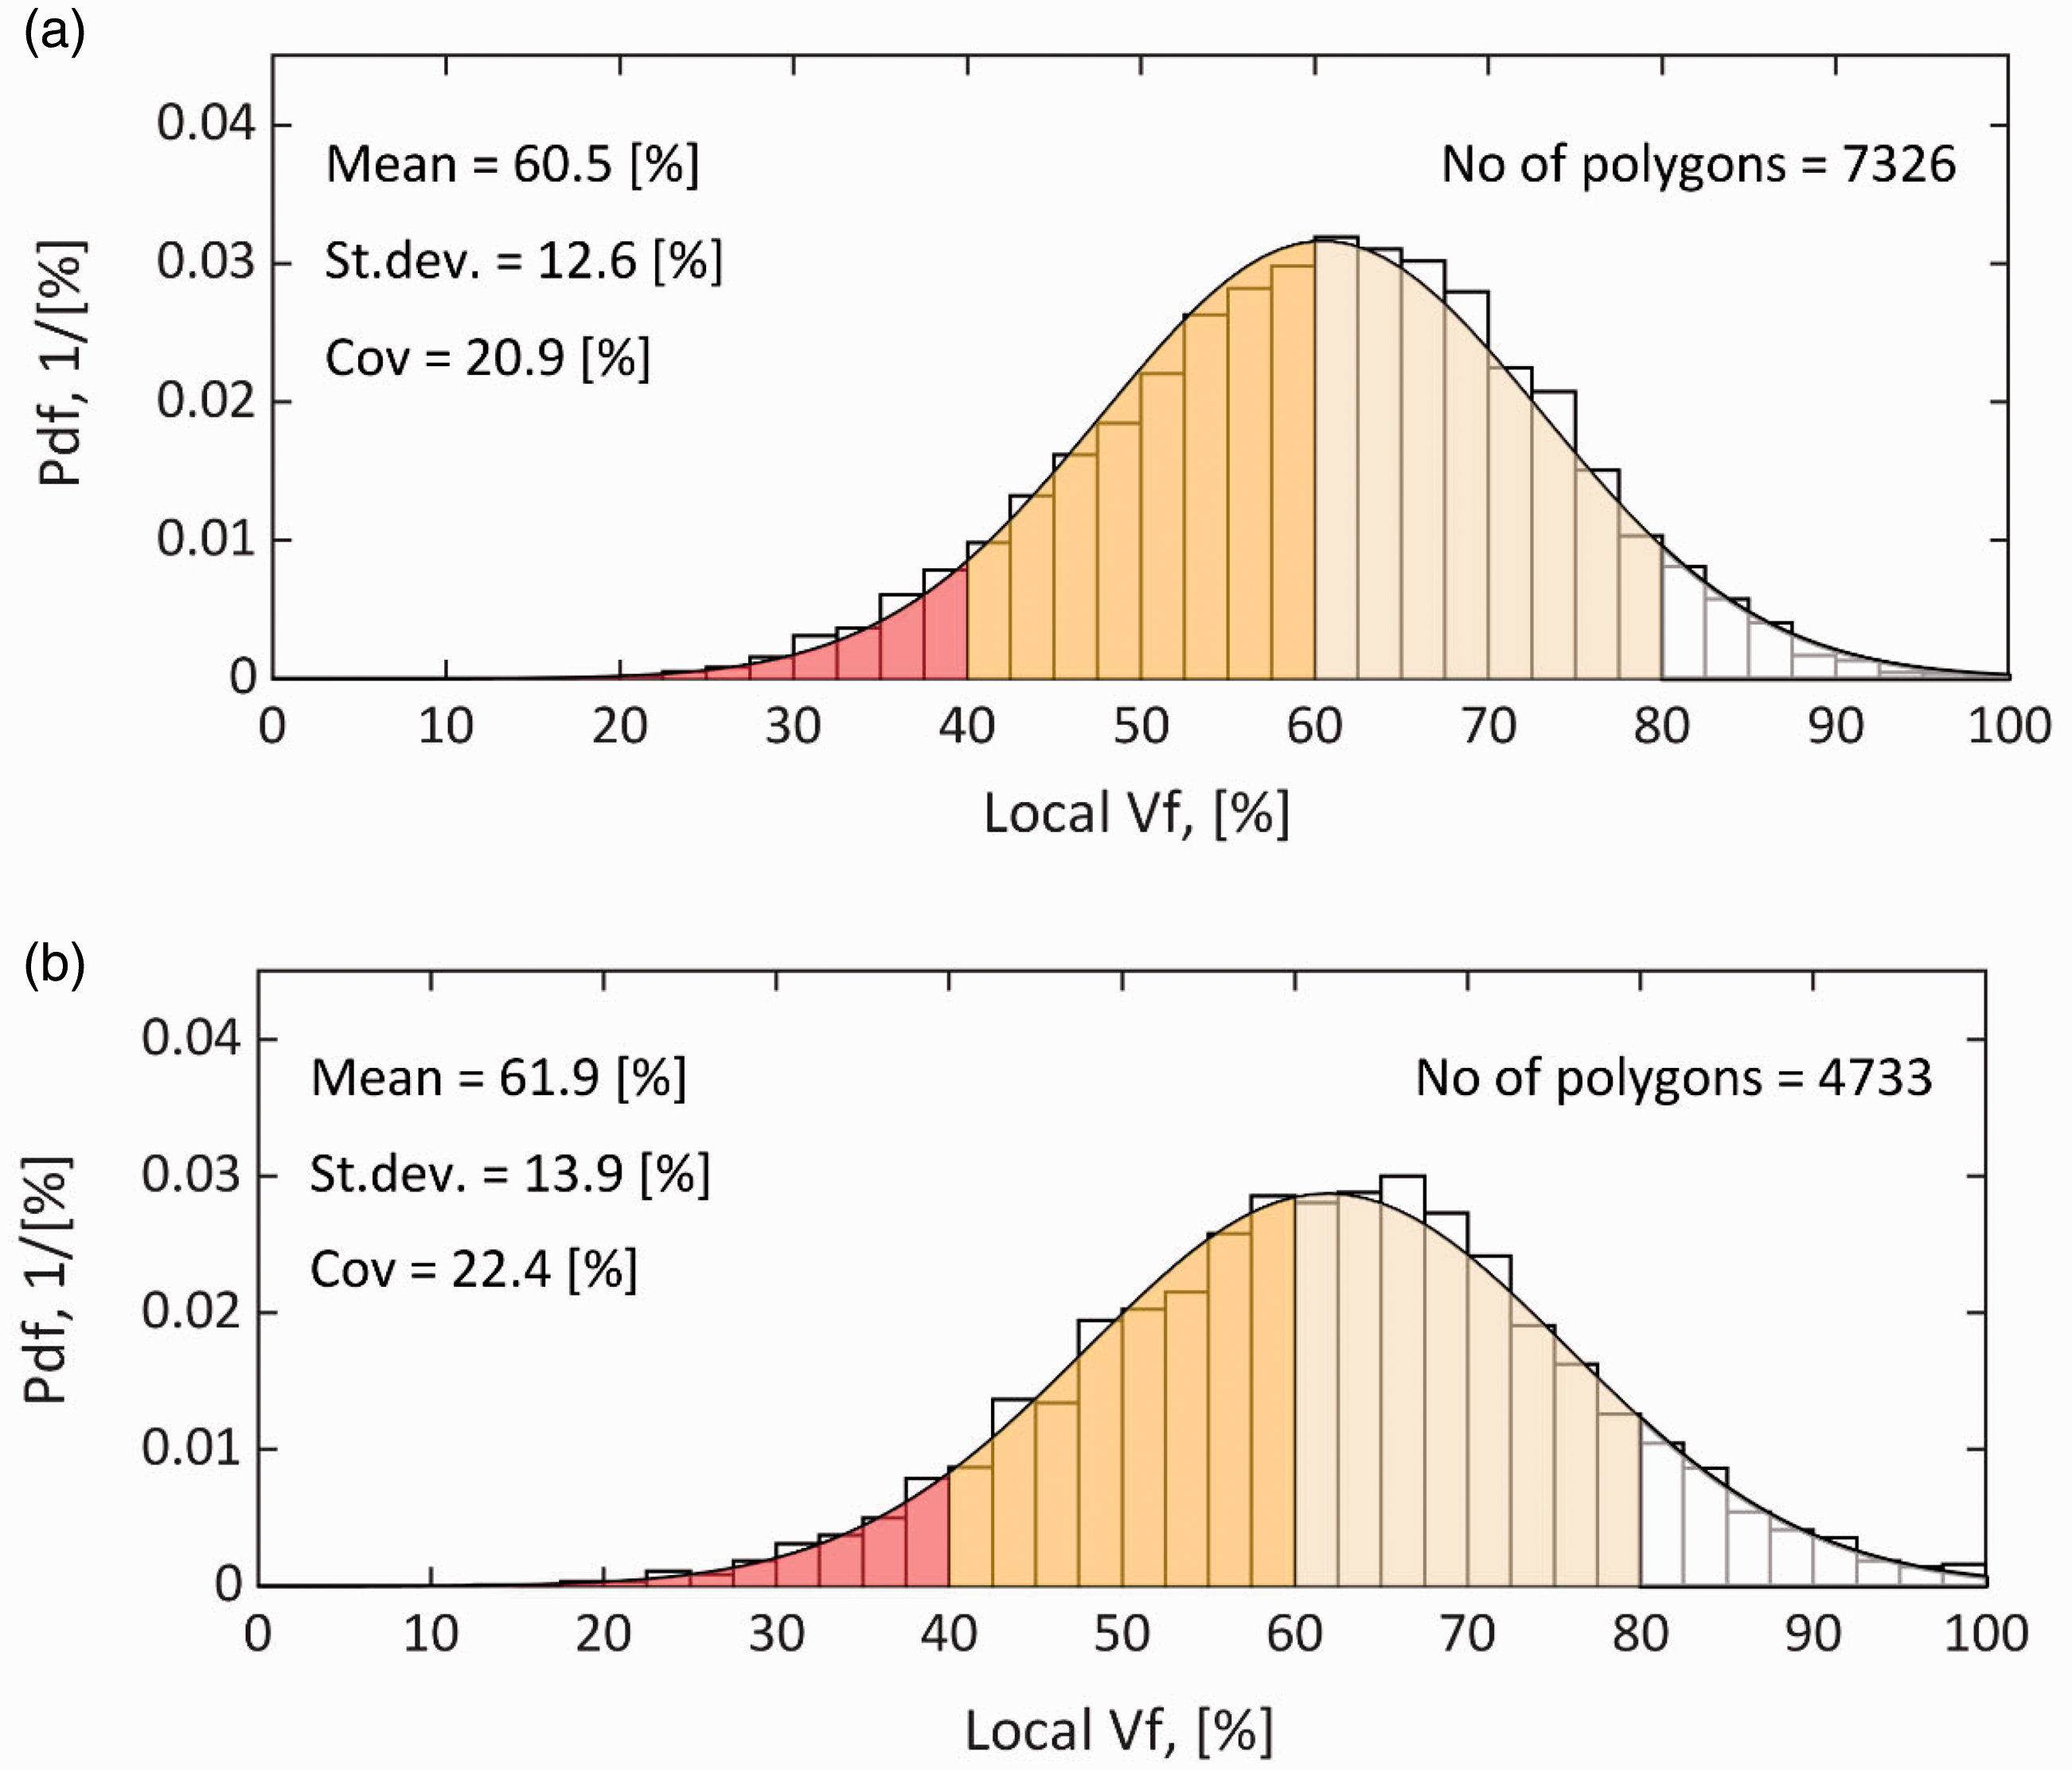
The statistical distribution of local fibre volume fractions approaches a normal distribution, as seen from examples in Figure 9. This near Gaussian distribution was witnessed from all analyses, regardless the process variables. The distributions tend to be a little skewed, so, in most cases, they did not pass the chi-squared goodness of fit test, e.g. Figure 9(a). Some distributions also passed the test, as in Figure 9(b), but this was less common. The histograms show that fibre volume fractions in a few Voronoi polygons actually exceed the assumed theoretical maximum of 91%. This is possible since the diameters of identified fibres vary, and small overlaps are allowed from circle detection image analysis. The dispersion of local V
f
values from Voronoi polygons is very consistent over all processing configurations (st. dev ≈ 13% and COV ≈ 20%). The set of local fibre fractions appears to approximately follow a Gaussian distribution. The failure in passing the chi-squared test causes us to denote it as ‘close to Gaussian’, ‘approximately Gaussian’ or to ‘resemble a Gaussian distribution’. The discrepancy of not passing the statistical test was not investigated further however.
In summary, the local fibre volume fractions or the features of fibre packing did not reveal any obvious connections to filament winding process variables. The average fibre volume fractions were ca. 60–65% and their spatial distribution nearly Gaussian regardless the impregnation principle, the wall thickness or the winding speed. This also means that the V f and the fibre-packing arrangements are unsensitive targets when optimizing the performance of the fibre impregnation unit.
Void content and its distribution
Voids are the second important aspect of composite microstructure besides the quantity and the packing of fibres. The void content was measured for four specimen configurations, and the results are shown in Figure 10. The results from individual images are shown by dots and their means by square markers. The numbers of voids from individual images are written next to the dots. However, the pure number of voids might not be particularly informative since small voids can be numerous but contribute very little to the overall void content. The error bars are drawn to visualize ±2 st. dev. dispersion. Due to a small number of available images (two per configuration), proper confidence intervals (e.g. 95%) would become extremely wide.
Void contents with ± 2 st. dev intervals. The results from individual images are shown by dots, with total numbers of voids (in brackets). The mean void content (i.e. the bar height) is denoted by a square.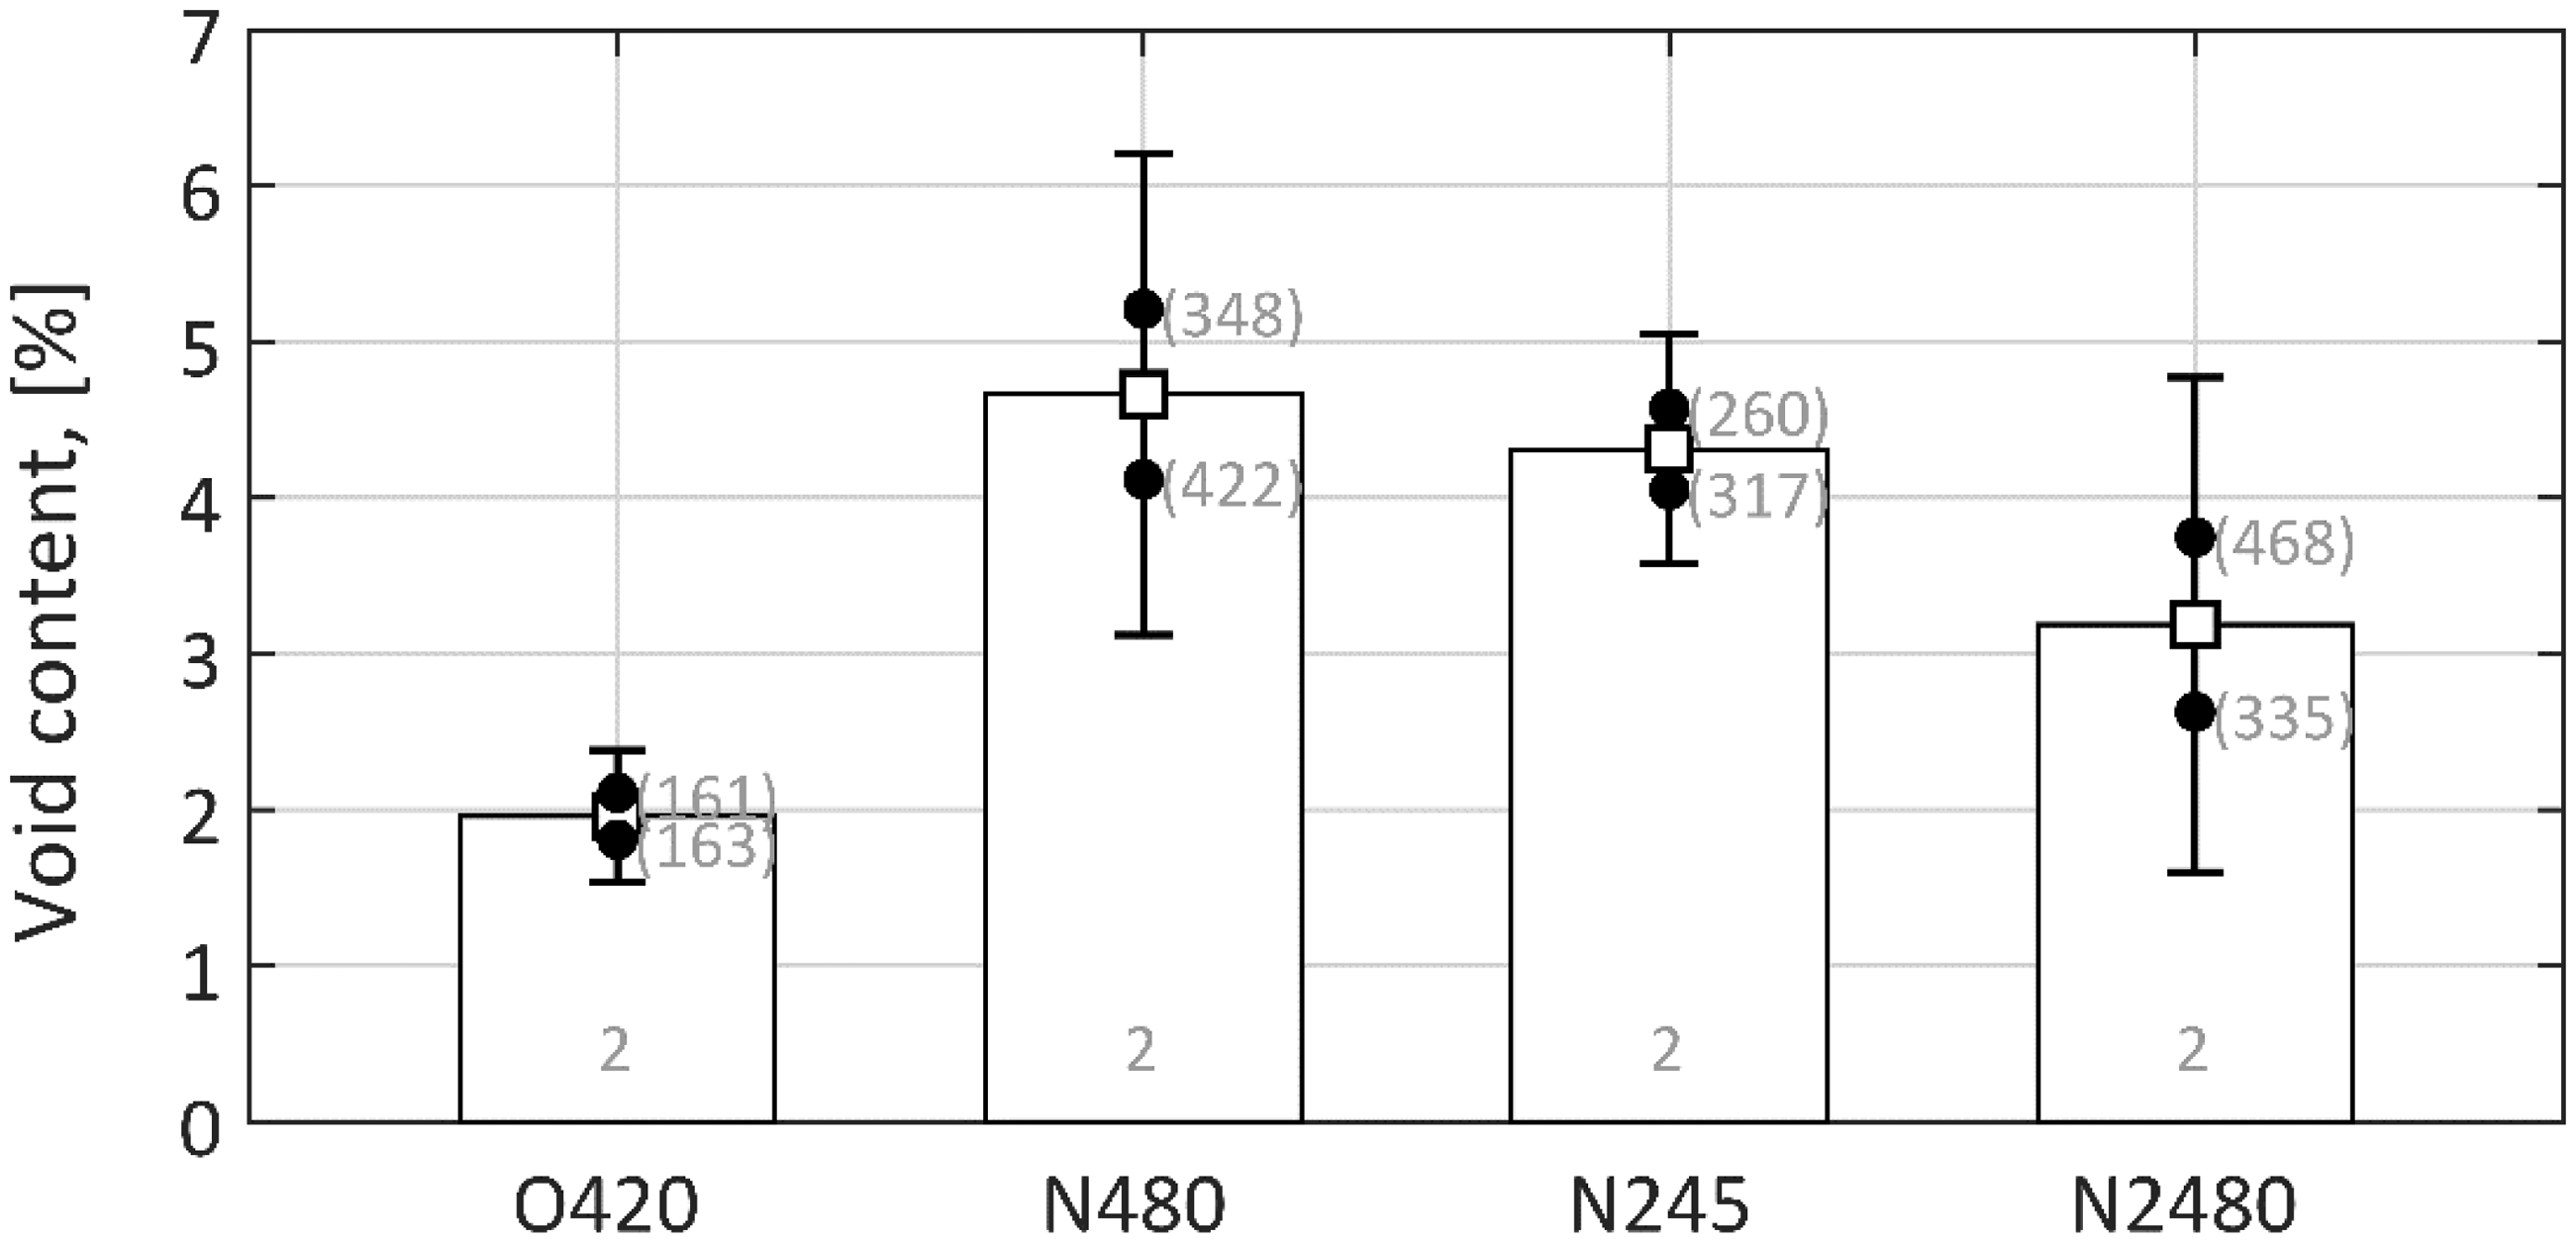
The mean values in Figure 10 indicate a correlation to the impregnation method. The reference impregnation O420 gave a much lower void content compared to the new un-optimized impregnation process (N480, N245 and N2480). The difference in the mean void content is approximately 1.5–2.0 times. Previous research 18 has indicated that average void content is nearly constant throughout laminate thickness and is only significantly affected by winding pre-tension. The pre-tension was kept constant at 40 N at the spool creel for all specimens in this work. The sinusoidal shape of the siphon builds up additional friction along its length, so the pre-tension at the mandrel for ‘N’ specimens is expected to be higher than for ‘O’ specimens. Higher pre-tension should correlate with fewer voids, which is the opposite of what is actually observed (Figure 10). This enables to conclude that the difference in the void content is caused by the difference in the impregnation method itself.
The reference impregnation system spreads the fibre tows at the drum in a way that the siphon prototype does not yet fully replicate. Optimizing the impregnation process and getting the bubbles out from the wet tow needs to be a key task in further developing the impregnation prototype. Void fractions below 3% were measured for individual tows by Miaris et al.9,10 The optimized impregnation unit in Miaris et al. 11 reported < 2% void fraction, and the voids were mainly located at the edges of tows. Another group 12 noted that the largest degree of fibre spreading (i.e. making the tows the widest) produced the lowest void content. Meanwhile, the hazard of damaging fibres by excessive friction should also be considered. 35
Visual observations from individual micrographs, such as in Figure 11, lead to conclude that voids, especially large voids, appear preferentially in the interply regions of the composite. This has also been noted by others, e.g. Rojek et al.
6
and Zhu et al.
23
The layers of filament wound composite are irregular due to narrow tows and a relatively high pre-tension. This gives a somewhat random placement of tows when they settle on top of slippery and soft composite layers below. Interply regions in Figure 11 therefore exhibit a wave-like profile rather than being perfectly straight and horizontal.
Clustering of voids (red) in the interply regions: (a) O420-1 (A0 = 2.1%); (b) N480-2 (A0 = 5.2%); (c) N245-2 (A0 = 4.6%); (d) N2480 (A0 = 3.7%).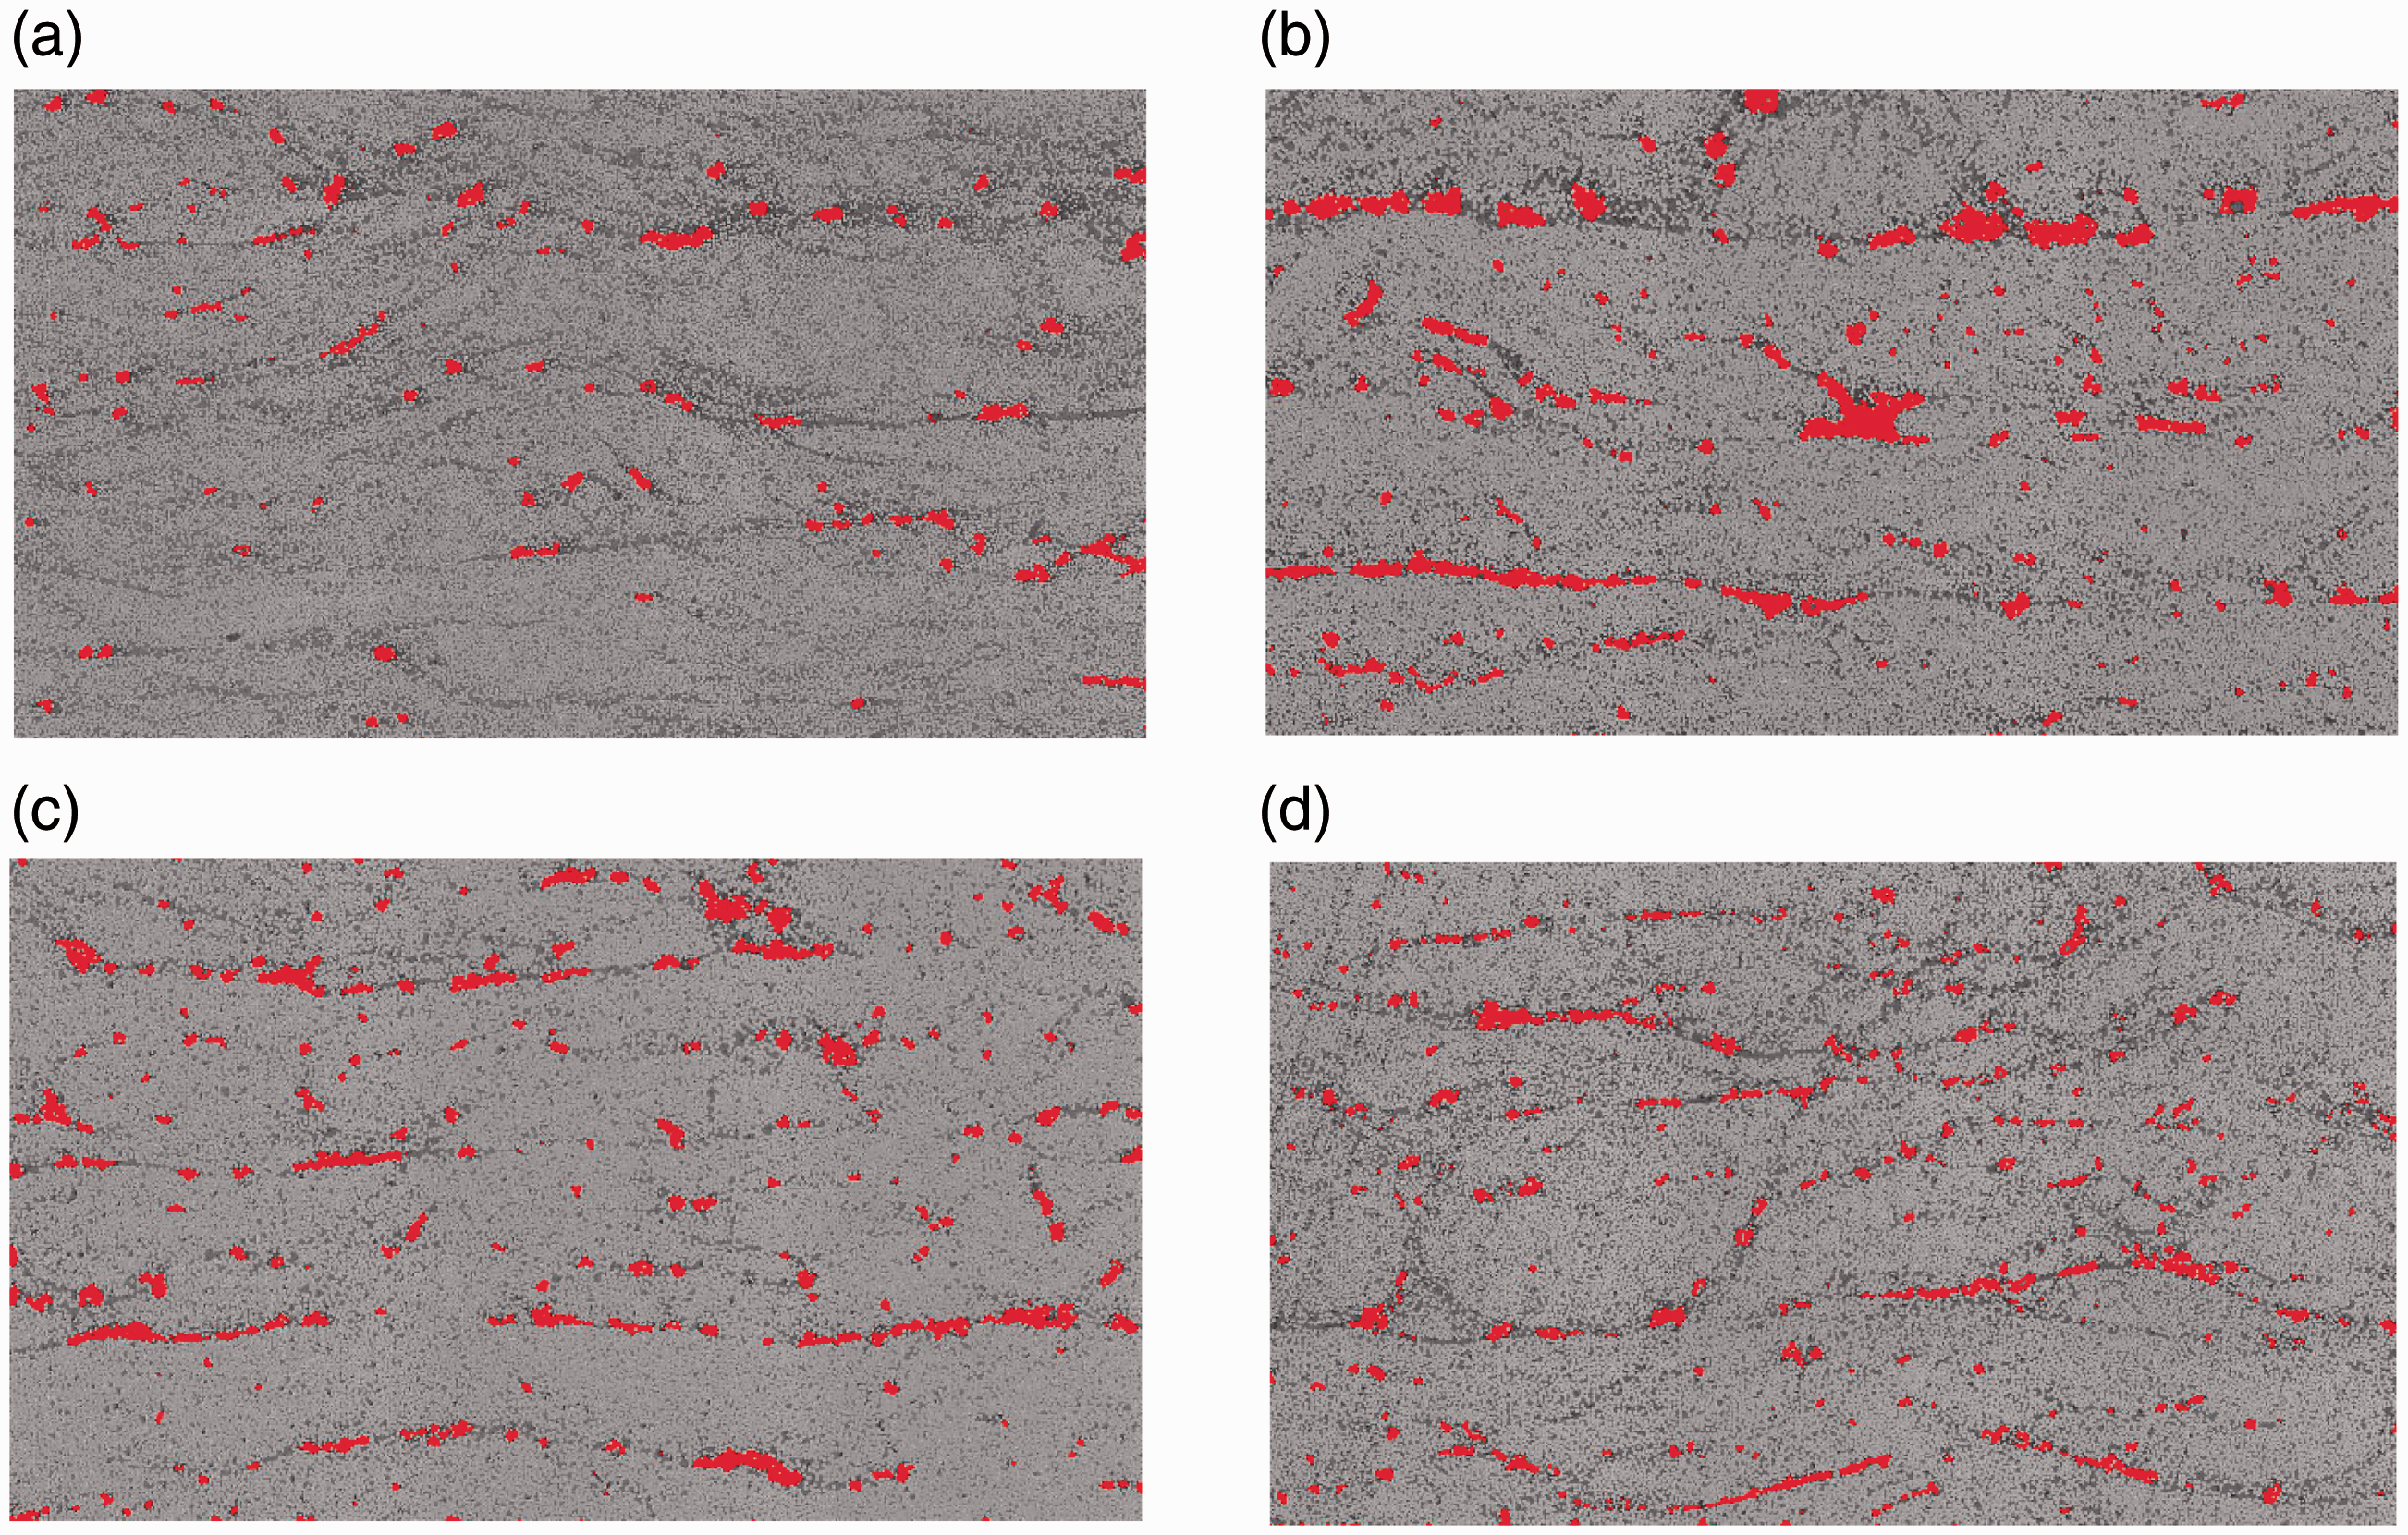
While Figures 10 and 11 characterize the average amount of voids and their spatial positioning, there is little information available about the size distribution of individual voids. Visually judging, many voids are small and appear approximately circular, while a few are larger, similar to elliptical cracks. Some metrics must be defined first to quantify the size distribution of voids. All connected void areas are approximated by elliptical shapes, as shown in Figure 12. The ellipse does not necessarily have the same surface area as the void but rather it defines the approximate length (major axis 2a) and the width (minor axis 2b) for otherwise irregular-shaped voids. The ellipse shape can occasionally be quite different from the actual void shape, but it is a decent approximation in most cases. Ratio a/b ≥ 1 characterizes how circular the void is, with unity referring to a perfectly circular void shape. In addition, a certain threshold value a
lim
is defined for the major axis length. Voids with 2a > a
lim
are considered as ‘large’ voids with the total area AL,0. When the chosen threshold is a
lim
= 0, all voids are considered ‘large’ and obviously AL,0/A0 = 100% (A0 is the total void area). In the other extreme, when the threshold length is set high (e.g. a
lim
= 1000 μm = 1 mm), usually, no voids will exceed it and AL,0/A0 = 0.
Voids approximated by elliptical shapes (a
lim
= 50 μm).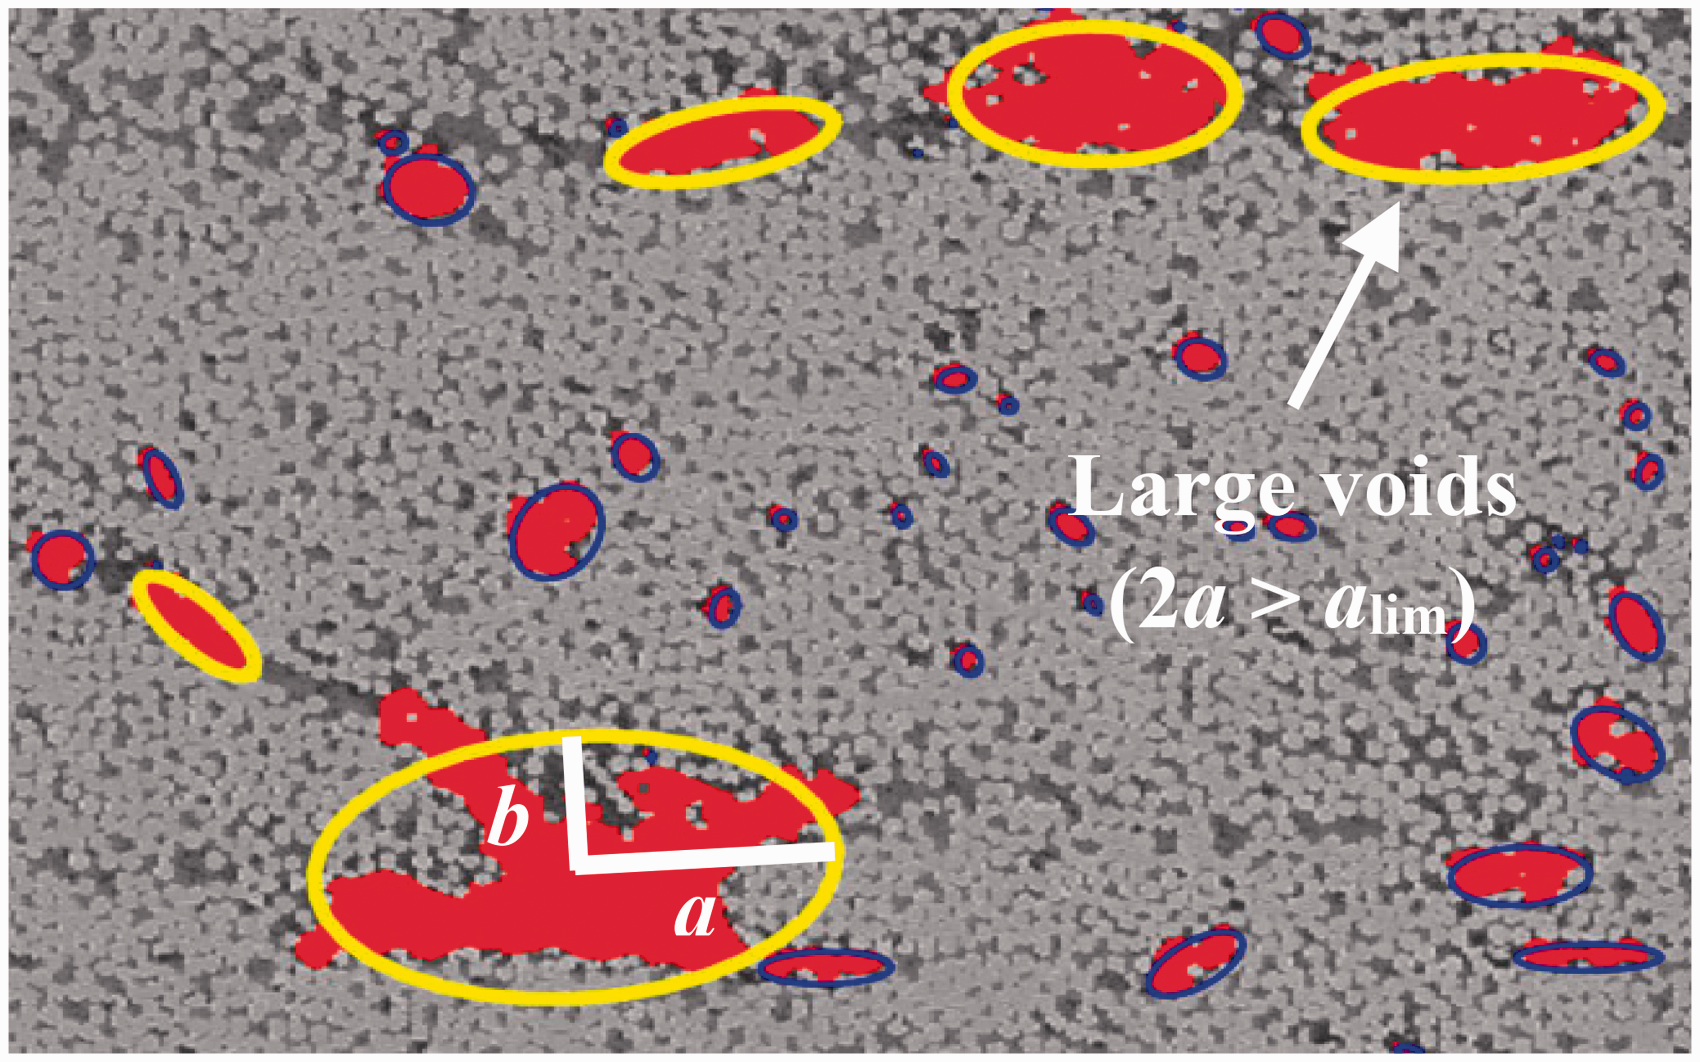
The distribution of void sizes becomes clear when the statistics from all voids is visualized on one graph. Figure 13 shows the void distribution on double-logarithmic axes with individual void areas A0,i and the elongation ratios a/b for the corresponding ellipses. Only the large voids (2a ≥ a
lim
) are denoted by markers. All other (small) voids are marked by black dots. Dashed lines are added as approximate guides to better depict overall trends. The solid line at A0,i = 38.5 μm
2
= const. marks the cross section area of one carbon fibre for visual reference. The precision of identifying voids much smaller than the fibre size becomes increasingly worse due to limitations from raw image resolution and the small residues left by the surface preparation. The confidence in numerical values obtained for these extremely small voids is therefore low. The combined area fraction and the influence of such small voids may be negligible, as also noted by Little et al.
26
Meanwhile, Figure 13 shows a clear trend that small voids tend to be more circular (a/b → 1) than large voids. A similar effect was also noted from micro-CT measurements of vacuum-cured carbon fibre-reinforced polymer (CRFP) laminates.
26
Circular voids disappear for void sizes A0,i > 1000 μm
2
. Statistics also showed that the major axes of large elongated voids align well with the horizontal material axis. It is very rare to find voids with a/b > 10 and with A0,i > 6000 μm
2
which seem to be some kind of practical limits for this material system. Interestingly, the void length threshold a
lim
= const. defines a nearly linear front between small and large void sizes as evident from Figure 13(a) to (c).
The distribution of voids by areas (A0,i) and shapes (a/b). Small voids (dots) and large voids (markers) that exceed a given length threshold a
lim
are distinguished: (a) a
lim
= 20 μm; (b) a
lim
= 50 μm; (c) a
lim
= 135 μm.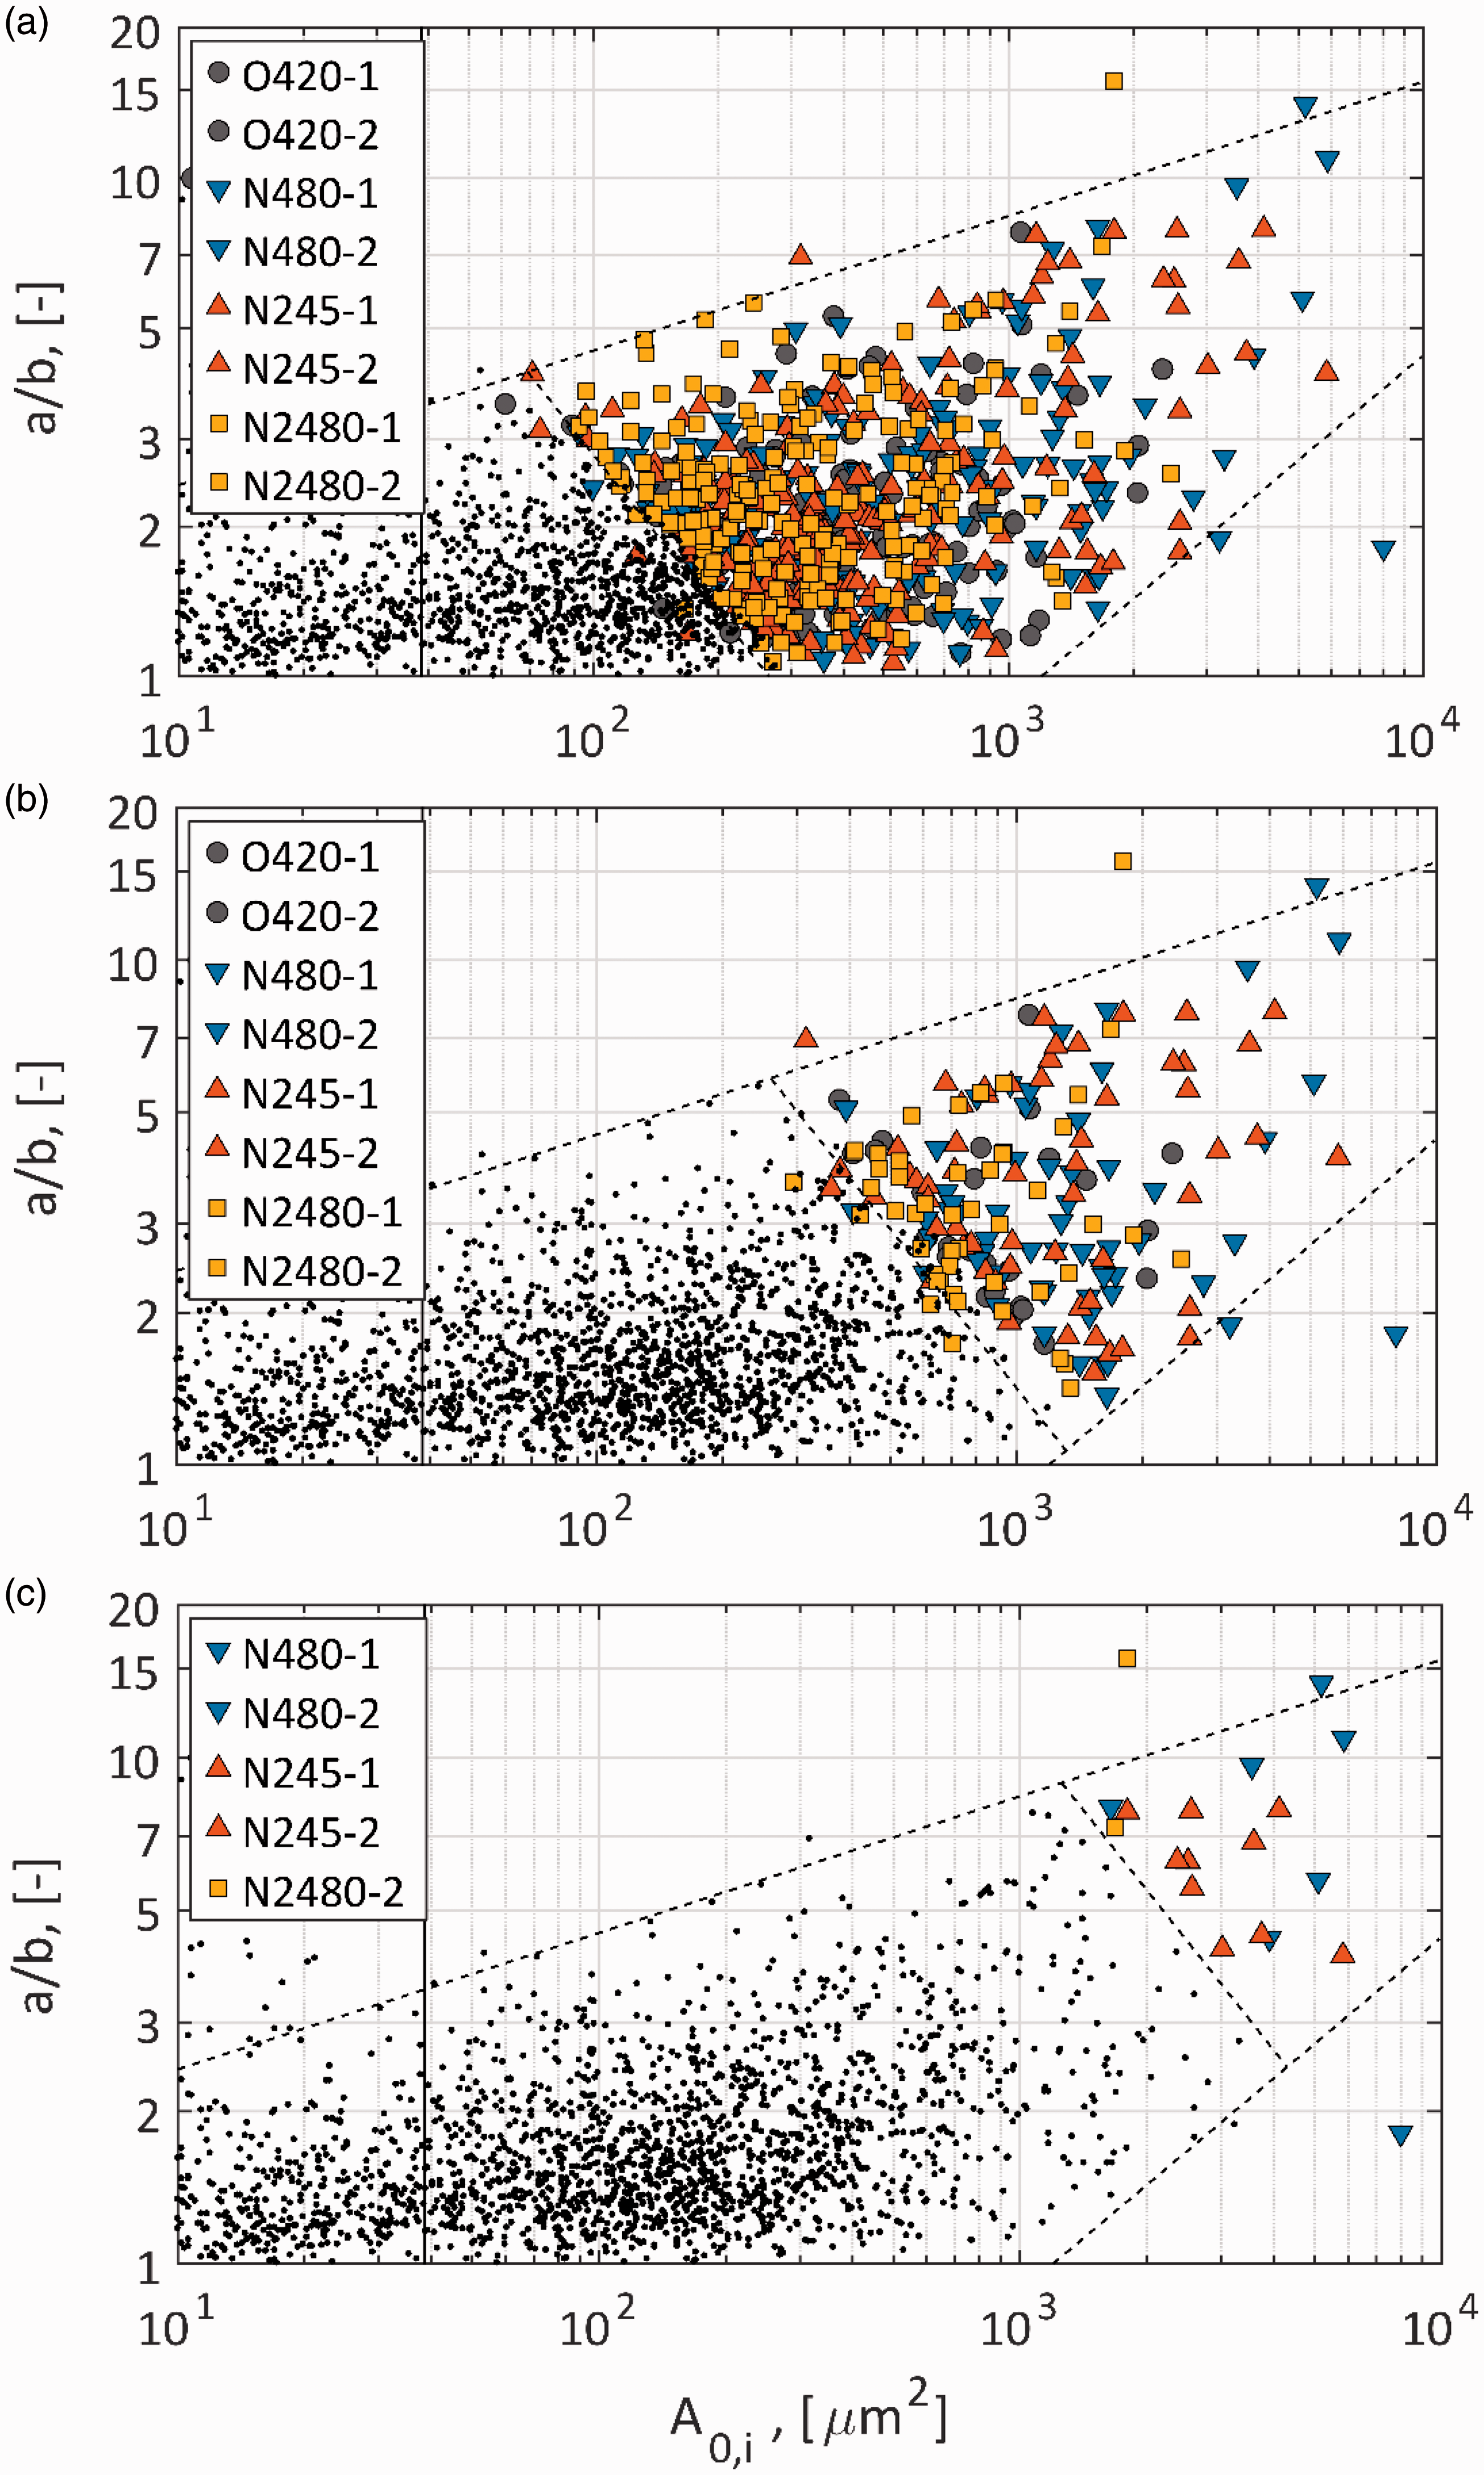
Since the impregnation unit is unpressurized, the voids inside the wet tows are essentially trapped air originating from wetting in the impregnation unit. As tensioned fibre tows are laid on the mandrel, they compact the composite layers below. The excess resin and some voids are squeezed out during winding. The movement of voids into the interply, their merger and shape elongation occurs with the aid of compacting stress from the surrounding fibres. This process can also be facilitated by the voids being preferentially located at the edges of tows when exiting the impregnation unit. 11 The void morphology becomes set after the gelation of resin.
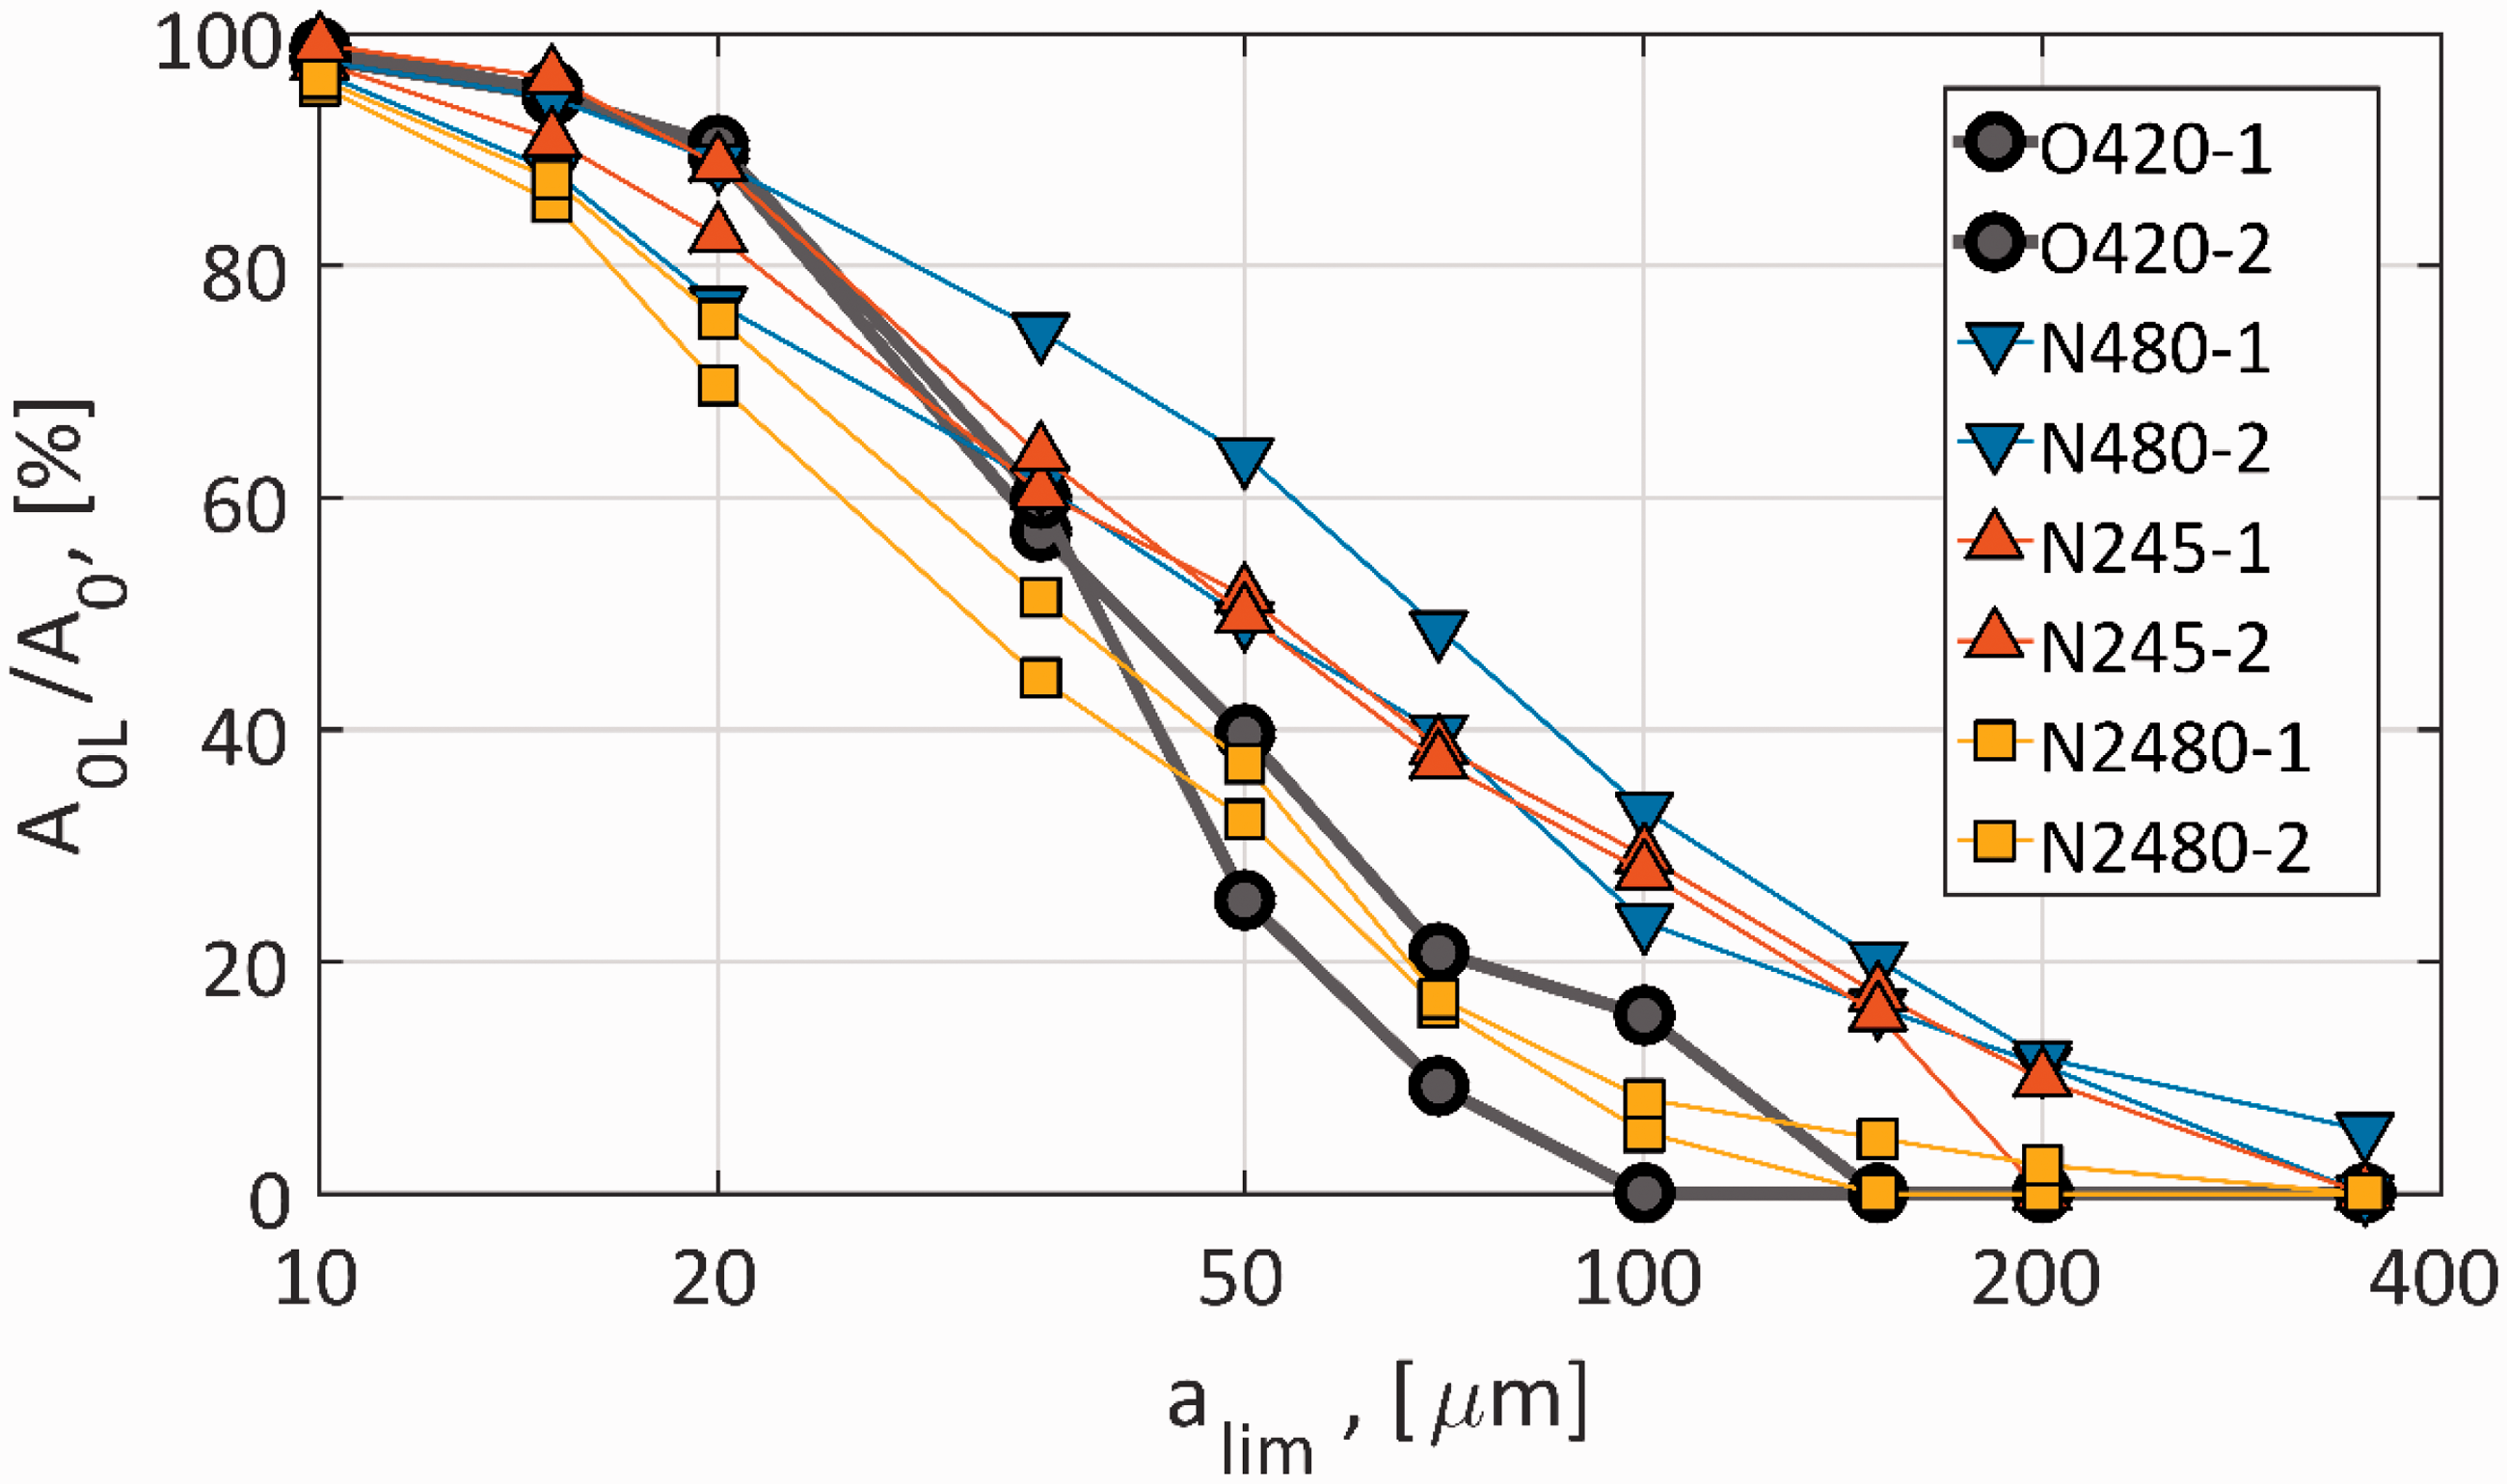
Another aspect of interest is how the proportion of large voids by area AL,0/A0 changes with the threshold a
lim
choice. Figure 14 shows the relative proportions of voids with length a
lim
or larger. This essentially becomes a sigmoid-shaped cumulative distribution function (CDF) on semi-logarithmic axes, if the relative area is considered an analogue to probability. One such CDF is calculated for each individual image. When given a
lim
is small (ca. 10–20 μm), most voids are considered large, and the relative area AL,0/A0 changes slowly. Although there is a large number of small voids (see Figure 13(a)), they only contain a very small fraction of the total void content. The proportion of small voids is lowest for the reference ‘O’ specimens, as evident from Figure 14. On the other end of spectrum, however, we see that no voids longer than a
lim
= 150 μm can be found from the reference ‘O’ configuration specimens. The specimens made by the new impregnation method ‘N’ display longer tails i.e. they contain longer voids, with some even exceeding 300 μm. The mid-CDF drop in Figure 14 is steepest for the reference ‘O’ configuration specimens, meaning that they have the narrowest void content distribution with regard to void lengths. The new impregnation method ‘N’ specimens display relatively more void area both at the low and high ends of the void length spectrum. The statistics shown in Figures 13 and 14 present a convenient and a concise way for describing the sizes, the shapes and the amounts of voids in a filament wound composite.
The proportion of large voids (by area) with respect to chosen threshold length a
lim
.
Measurements of apparent strength
Hoop tensile strength is the most relevant strength property for internally pressurized pipes or pressure vessels. Delaminations in composite cylinders resulting from impacts or other contact damage are partially caused by interlaminar shear. Both tensile and shear-dominated strength properties were measured for this work. The aim was to quantify how different impregnation methods and winding speeds correlate to quasi-static strengths. A large cylindrical shape is obscure in the experimental sense, and it proves more challenging to measure pure properties, compared to small cylinders, coupons or dogbones. Two types of experiments, a short beam shear test and a split disk tensile test, were carried out as seen in Figure 15. It is well known that both of these set-ups give apparent strength properties due to the spatial stress variability and the impurity of the stress state. The number of layers in specimens was kept constant for one specific experiment type. The experimental description, the data, and the numerical values presented here were adopted directly from Mulelid.
30
The strength characterization of cylindrical specimens: (a) failure modes for short-beam strength; (b) short-beam testing, failure mode B. The specimen was coloured white to better identify failure modes; (c) split disk tension. Circumferential splitting of the ring (arrow).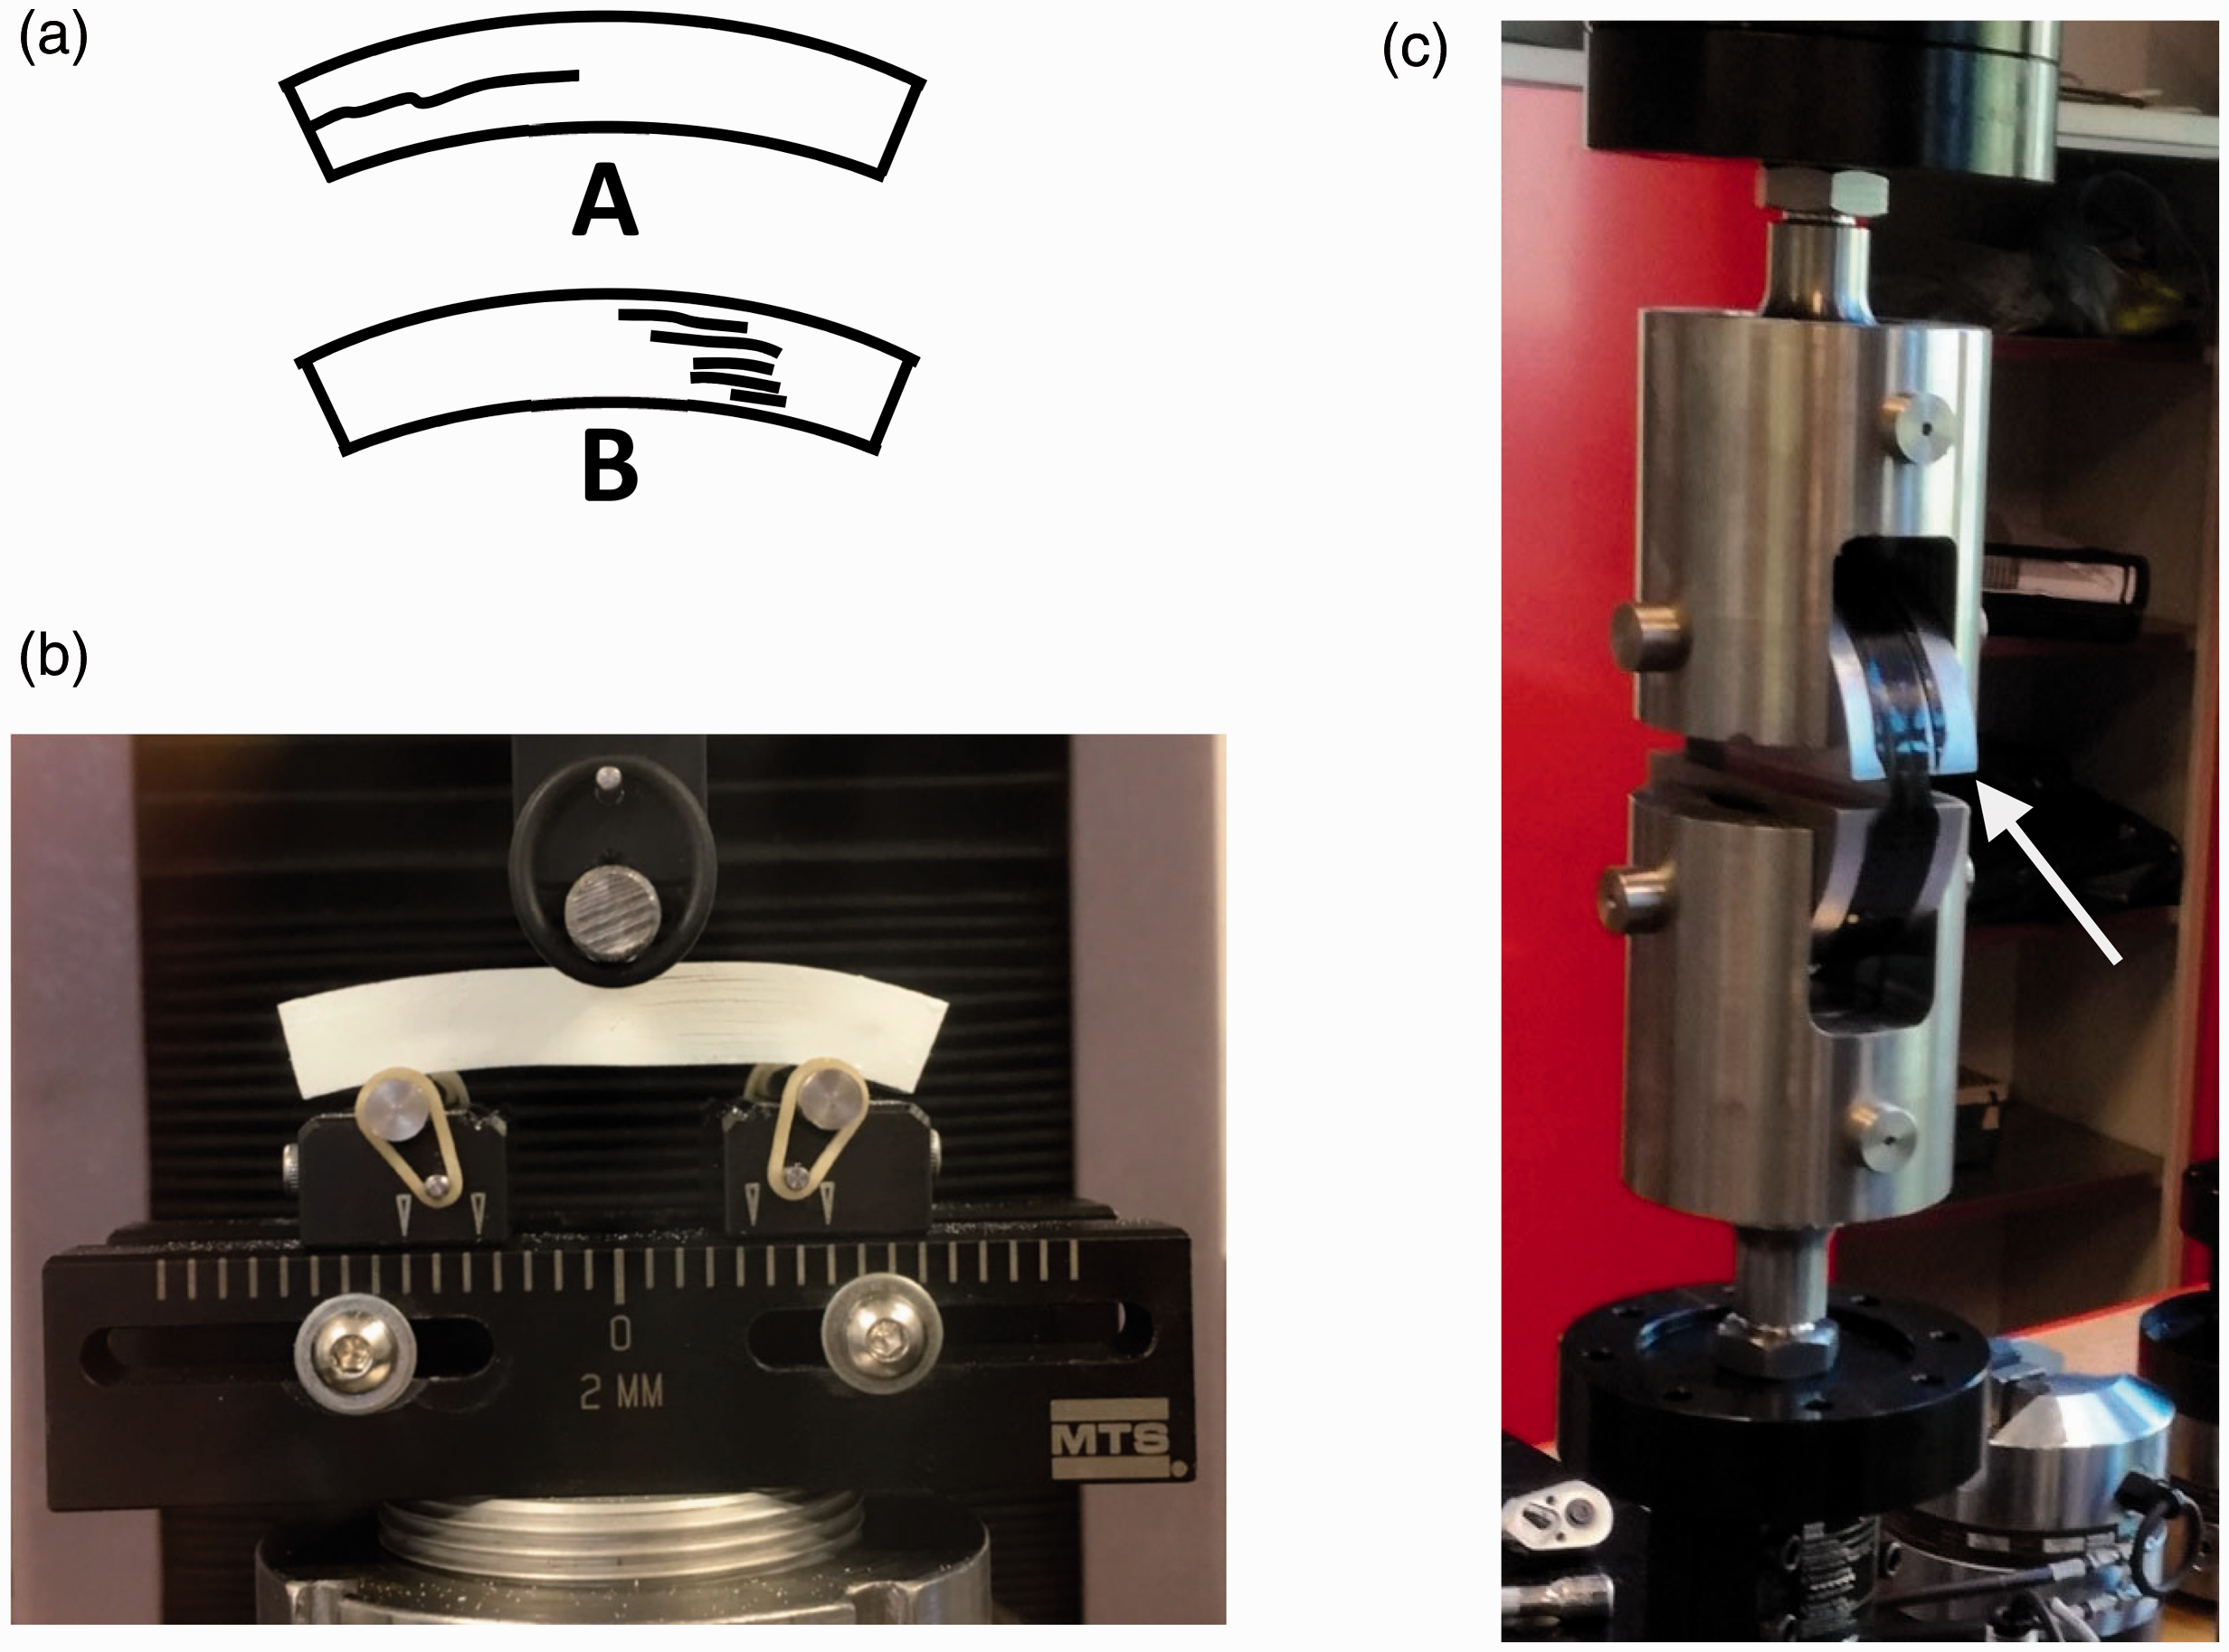
The interlaminar shear properties were characterized by short-beam strength experiments (Figure 15(b)), following ASTM D2344.
36
Small deviations from recommended specimen geometry were necessary. The thicknesses of specimens varied in the interval t = 6.5–6.9 mm and the widths in w = 11.7–12.0 mm. The diameters of support rollers and the loading nose were 4 mm and 6 mm, respectively. The span-to-thickness ratio L/t was 4:1 and the loading speed 1 mm/min. The apparent short-beam shear strength was calculated from

Tensile properties were measured from split-disk tensile experiments, following ASTM D2290.
37
The test set-up shown in Figure 15(c) was custom made, with two hinges along perpendicular planes. Its self-aligning characteristics aim to reduce stress concentrations from global bending moments, better approximating a uniform tensile load. Circular notches were ground on two sides of the specimen with a nominal 16 mm radius. The specimens were t = 1.1–1.2 mm thick, the widths were w = 23.3–25.0 mm, and wred = 13.6–15.7 mm at the depth of the reduced area. The reduced areas were centered at the split gap in the cylinders, deviating from the ASTM D2290
37
procedure. The rings were loaded at 2.5 mm/min displacement rate. Since tensile specimens are unidirectional (as all other specimens in this work), they split-cracked around the circumference before the ultimate tensile failure (Figure 15(c)). The failure progression was extremely rapid, and its location could not be visually observed. The failure originates most likely from the location of the split and the reduced area due to a combination of stress concentrations. The apparent tensile strength was calculated from the maximum load Fmax and the reduced cross-section area by

The results from both sets of strength experiments are summarized in Figure 16. Since the specimens have a constant number of layers for one type of experiment, they are denoted a little differently compared to previous. The impregnation principle is still either ‘O’ or ‘N’, and the winding speeds are denoted either by 20 (reference), 5 (4 × slower) or 80 (4 × faster). So, the specimens are overall named the same as in previous, except the number of layers is replaced by a dash. The number of test specimens for one test configuration is denoted at the bottom of individual bars, accompanied by the failure mode indication (‘A’ or ‘B’) for short-beam strength.
The summary of test results from two strength experiments (±2 st. dev).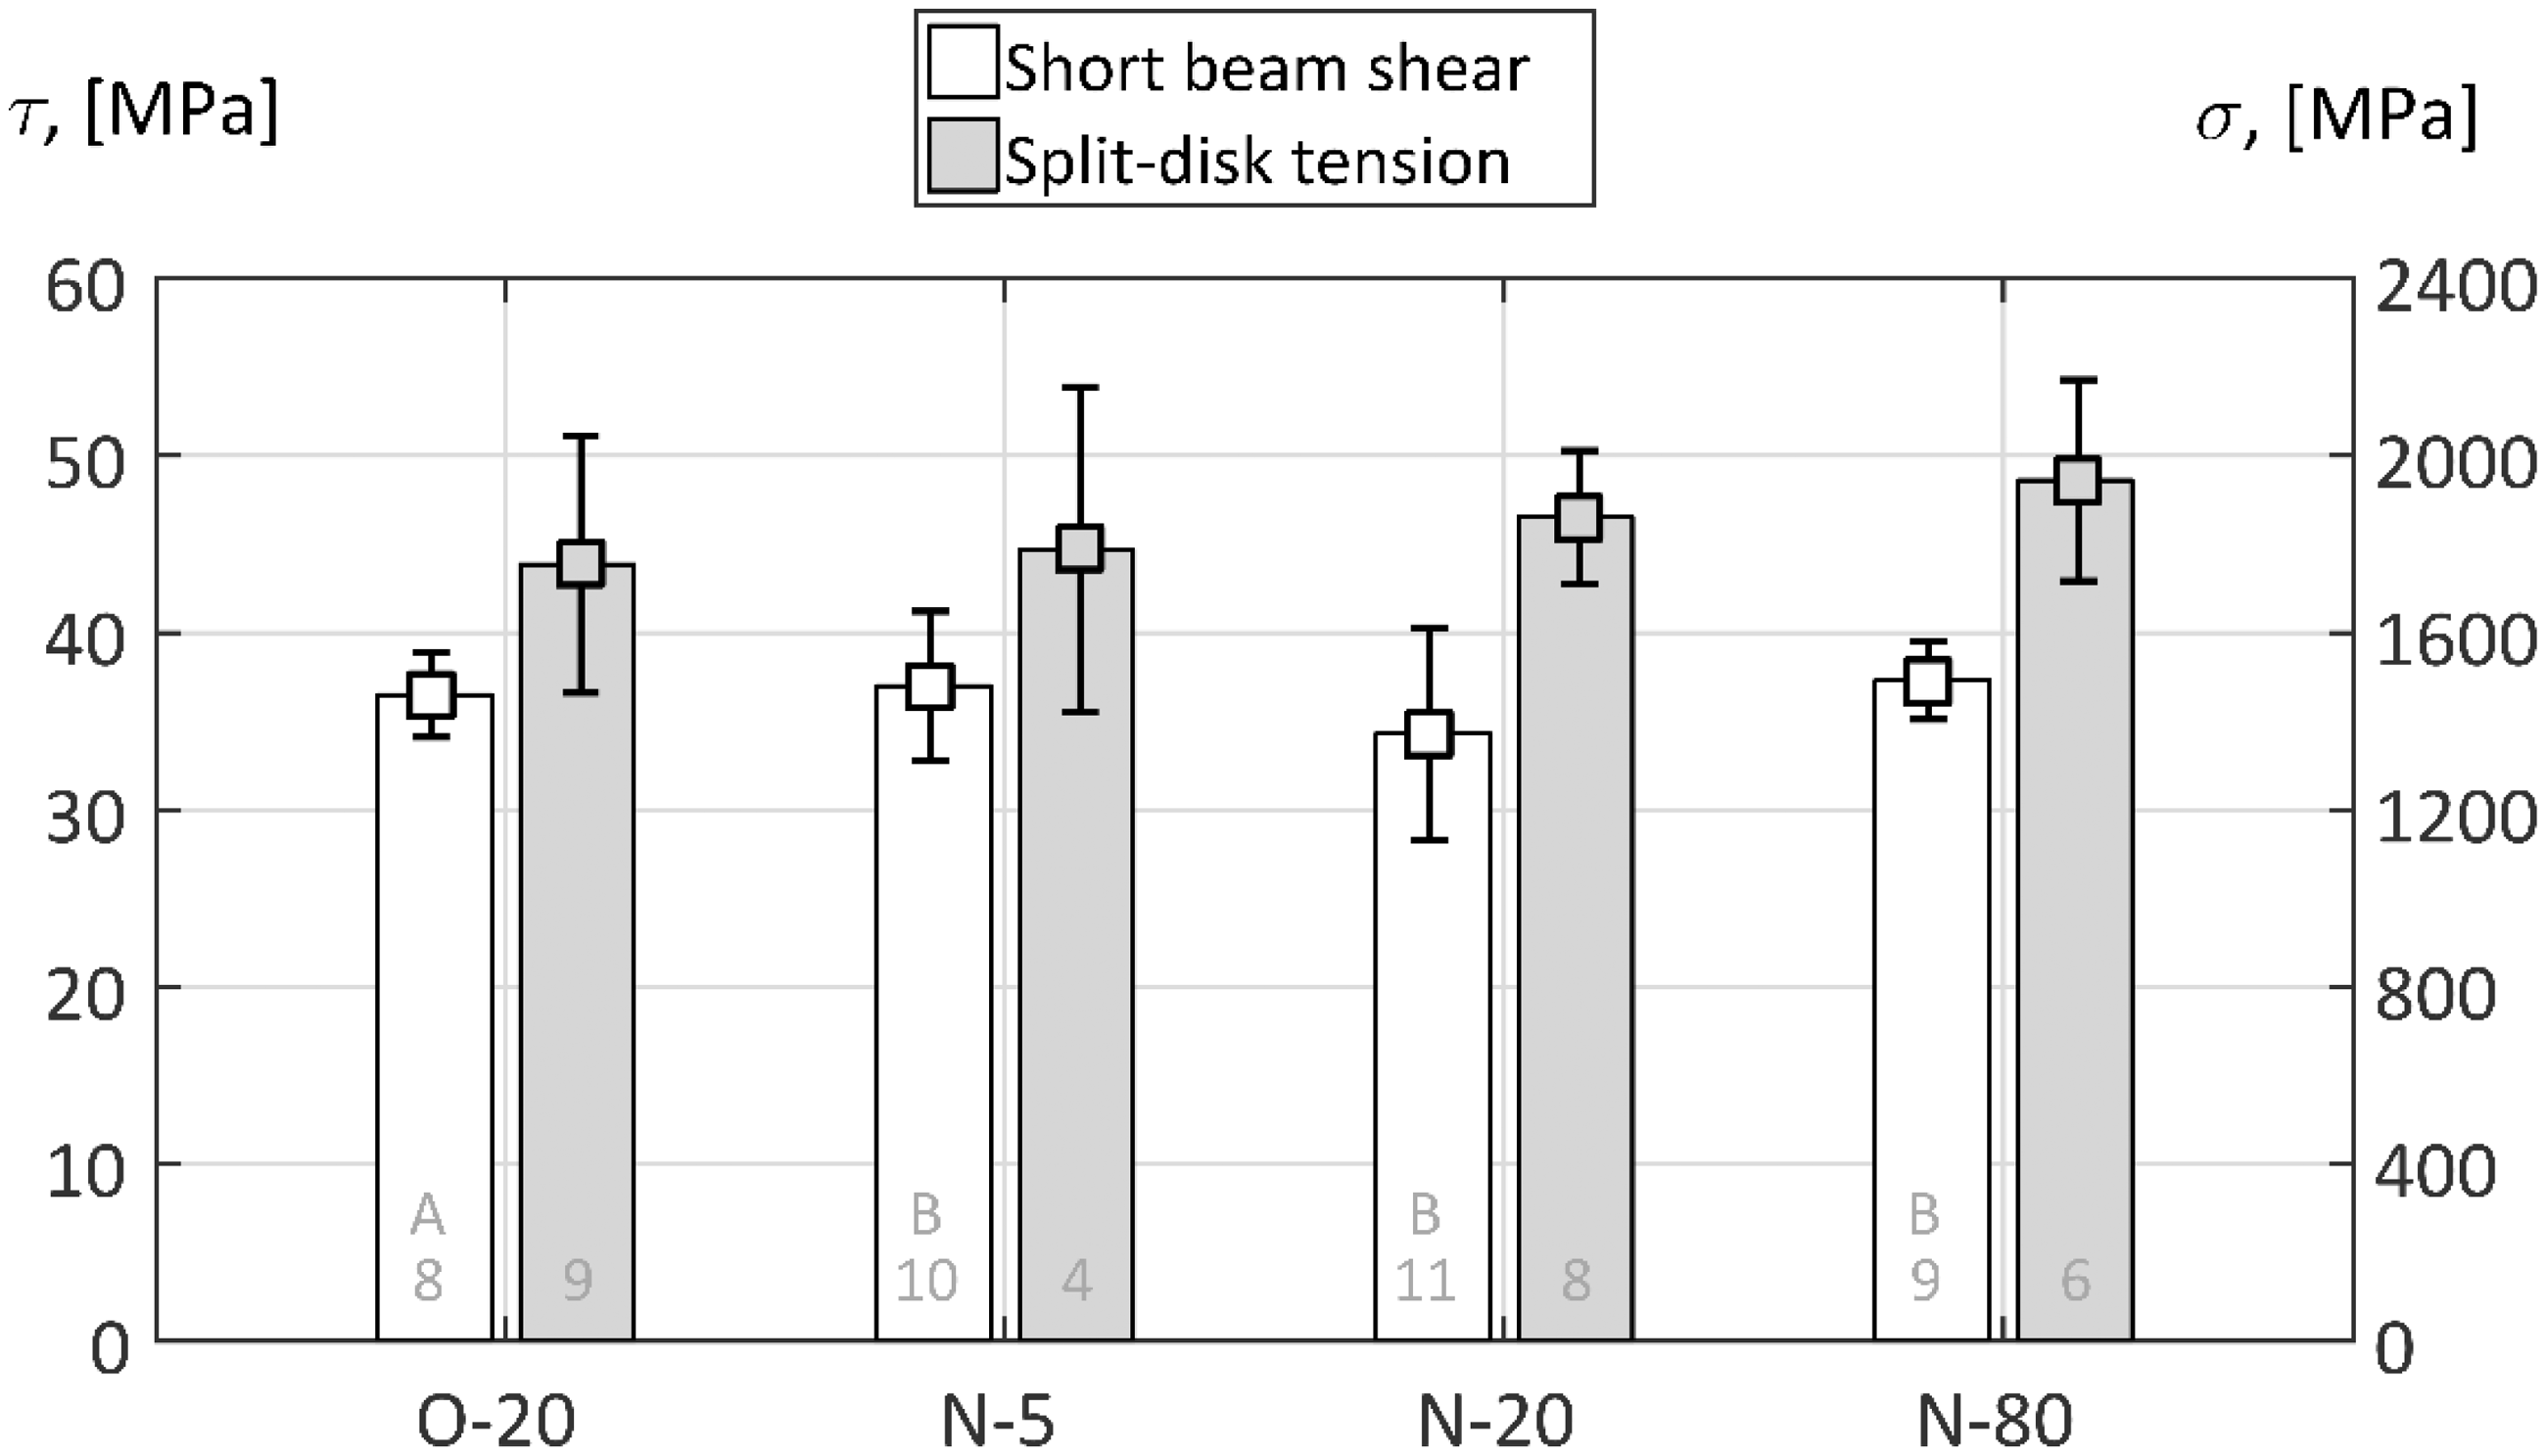
Considering the dispersion intervals, the tensile strengths are remarkably consistent, and no significant trends are caused either by the change in the impregnation principle or by the winding speed. This is expected since the fibre volume fractions were also similar, close to V f = 60%, for analogous configurations (Figure 5). All tensile strengths in Figure 16, however, remain clearly lower than reference composite strengths from the fibre manufacturers datasheet (σ = 2550 MPa at V f = 60%). Difficulties in measuring the tensile strength of highly anisotropic unidirectional carbon fibre composites are well known. The observed strength discrepancy suggests that stress concentrations from split disks have a significant influence on the composite tensile strength. These stress concentrations cannot be fully removed due to the nature of the set-up – the gap between nearly-half-cylinders always causes some bending and localized effects. Choosing a different layup by winding helical layers above and below the hoop layers and centering the reduced area away from the split should help to mitigate such tensile strength discrepancy in the future.
The void content over all specimens varied by a few percent (Figure 10). The effect from the void content variation should be amplified for interlaminar shear since additional voids cluster preferentially into narrow interply regions (Figure 11). The relationship between void content and interlaminar shear strength has been studied.1,38 By different estimates, a void content increase by 1% causes around 5–10% drop in short-beam strength. When considering approximately equal shear strengths as seen in Figure 16, the void content difference between ‘O’ and ‘N’ specimens is apparently masked by dispersion from other factors. It is noted that the failure mode in short-beam shear specimens changes. It switches from Mode ‘A’ (a single crack) with reference impregnation to Mode ‘B’ (saturation of multiple cracks through thickness) for the new impregnation method. It is possible that overall larger void content, concentrated at interply regions, is also the cause for switching from a single interlaminar crack to the gradual saturation of multiple cracks. More experiments are needed to either confirm or reject this and to gain empirical understanding of failure progression – if and how the failure mode is affected by changes in the impregnation method and the void content. Remarkably, the short-beam shear strength values for ‘O’ and ‘N’ specimens remain approximately constant, despite different modes of failure.
Conclusions
This is the first study where the effects of processing parameters on the detailed microstructure of hoop wound CFRP cylinders are investigated. The work was initially undertaken to identify changes in the composite that occur when employing a new resin impregnation method.
The void content appears to be a good indicator for distinguishing different impregnation methods. The reference method using a drum/doctor blade gave a much lower average void content (ca. 2%), compared to the new impregnation method (ca. 3–5%). Also, the distribution of void lengths was wider, and more short and long voids are created in the process, when using the new impregnation method. Both, the short-beam strength and the split-disk tensile strength remained insensitive to the impregnation method. The apparent strength values proved incapable of reliably distinguishing between the tow impregnation methods. The failure mode of short-beam strength however changed with the impregnation method. More work is needed to explain this correlation or causality. The winding speed did not affect the apparent strengths.
In addition to previous, current investigation also produced new general knowledge about hoop-wound CFRP microstructure. The following experimental observations were noted, regardless the variations in process parameters (the impregnation method, the winding speed or the specimen thickness).
The average fibre volume fractions of composite cylinders were found to be statistically similar regardless the impregnation method, the winding speed or the specimen thickness. When using a pure hoop layup with a low viscosity resin, the packing of fibres is mostly affected by the pre-tension of tows, a parameter kept constant in this study. The spatial distribution of fibre volume fractions was evaluated by Voronoi diagrams. The distribution of local fibre volume fractions was found to closely resemble a Gaussian distribution. No correlations between the local fibre volume fractions and the filament winding process parameters were however noted. Micrographs show that (especially large) voids tend to cluster into the interply regions of the composite. Small voids are more circular, while large voids become increasingly elongated i.e. elliptical. Voids have a specific quantifiable 2D morphology of how they are shaped and distributed, as reported in Figures 11 to 14.
Accounting for the microstructural observations above, the development and optimization of wet winding impregnation concepts should aim for the minimization of void content while avoiding mechanical/friction damage to the fibres. The average fibre volume fraction, its spatial distribution, and apparent quasi-static strengths are unsensitive optimization targets by current scope.
Footnotes
Declaration of Conflicting Interests
The author(s) declared no potential conflicts of interest with respect to the research, authorship, and/or publication of this article.
Funding
The author(s) received no financial support for the research, authorship, and/or publication of this article.