
Abstract
Process-induced distortion of composite structures often leads to a violation of tolerances, making the assembly of components difficult and expensive. It therefore can inhibit a cost-effective mass production of high-performance composite structures. Process-induced distortion is often introduced by curved regions of a part due to spring-in. Main drivers are chemical shrinkage of the resin and thermal expansion of both fiber and resin during cooling after demolding. Both contribute to residual strains and consequently lead to distortion of the manufactured part. The spring-in phenomenon has been already addressed in many studies. However, variations in manufacturing and specimen properties inhibit a detailed comparison of the results. Hence, it is difficult to isolate major influencing parameters. Here we show spring-in results of specimens that were manufactured using the very same experimental setup and laminate configuration but different resin and fiber types. It is therefore possible to identify the interaction of the curing temperature and the maximum achievable glass transition temperature of the individual resins as a major influencing factor. Furthermore, it is shown that the properties of the investigated resins do not differ largely in terms of thermal expansion and chemical shrinkage. Moreover, the latter was measured using two different techniques to enable a comparison. Numerical spring-in prediction revealed good accuracy throughout the investigated specimen configurations. Limitations found are the influence of the sewing of fiber textiles and the sensitivity of the model to gradual changes of the layup. Moreover, different homogenization techniques are compared with regard to spring-in prediction accuracy.
Keywords
Introduction
The spring-in phenomenon has already been the subject of research in many studies. A large part of them deals with process-induced distortions during autoclave prepreg processing.1–10 More recently published studies investigate spring-in of specimens manufactured using RTM.11–16 Many studies investigate the influence of geometrical features of the specimen on spring-in. Others have studied the impact of the layup regarding stacking sequence or laminate thickness. Furthermore, many different materials of Prepreg as well as injection molding resins have been used in these studies. However, comparison of the results is limited due to different specimen geometry or layup mismatch. This study presents spring-in results of specimens that were manufactured using the exact same geometry and layup but different resins and fiber textiles. This therefore enables examination of specific material properties and their contribution to spring-in. For this purpose, each resin is characterized with respect to shrinkage, thermal expansion and gel point. Furthermore, polyurethane (PU) resins are increasingly used in manufacturing of high performance composite structures. In comparison to usually applied epoxy (EP) resins, they promise lower material costs, cycle times, curing temperatures and shrinkage. The last two aspects directly influence the dimensional stability of the manufactured parts since they can lead to a decrease in thermal and chemical strains. As a consequence, the need for expensive compensation techniques like shimming is avoided, making it easier to deploy composite materials in competitive and cost-driven large batch manufacturing like in the automotive industry. However, up to now there is no proof of these advantages in the literature besides the use of thermoplastic PU as a low-profile/-shrinkage additive.17,18 Furthermore, spring-in of composite parts manufactured with PU resin has not yet been investigated.
Theory
Spring-in of composite structures
Manufacturing of composite parts typically involves cross-linking of the resin at elevated temperatures. This introduces process-induced residual strains and finally residual stresses due to chemical shrinkage (CCS) and thermal contraction, which lead to warpage and spring-in of the composite part. Both effects were separated by Albert et al.
3
While warpage is mainly driven by extrinsic parameters such as part-tool-interaction, processing temperature and autoclave pressure,
19
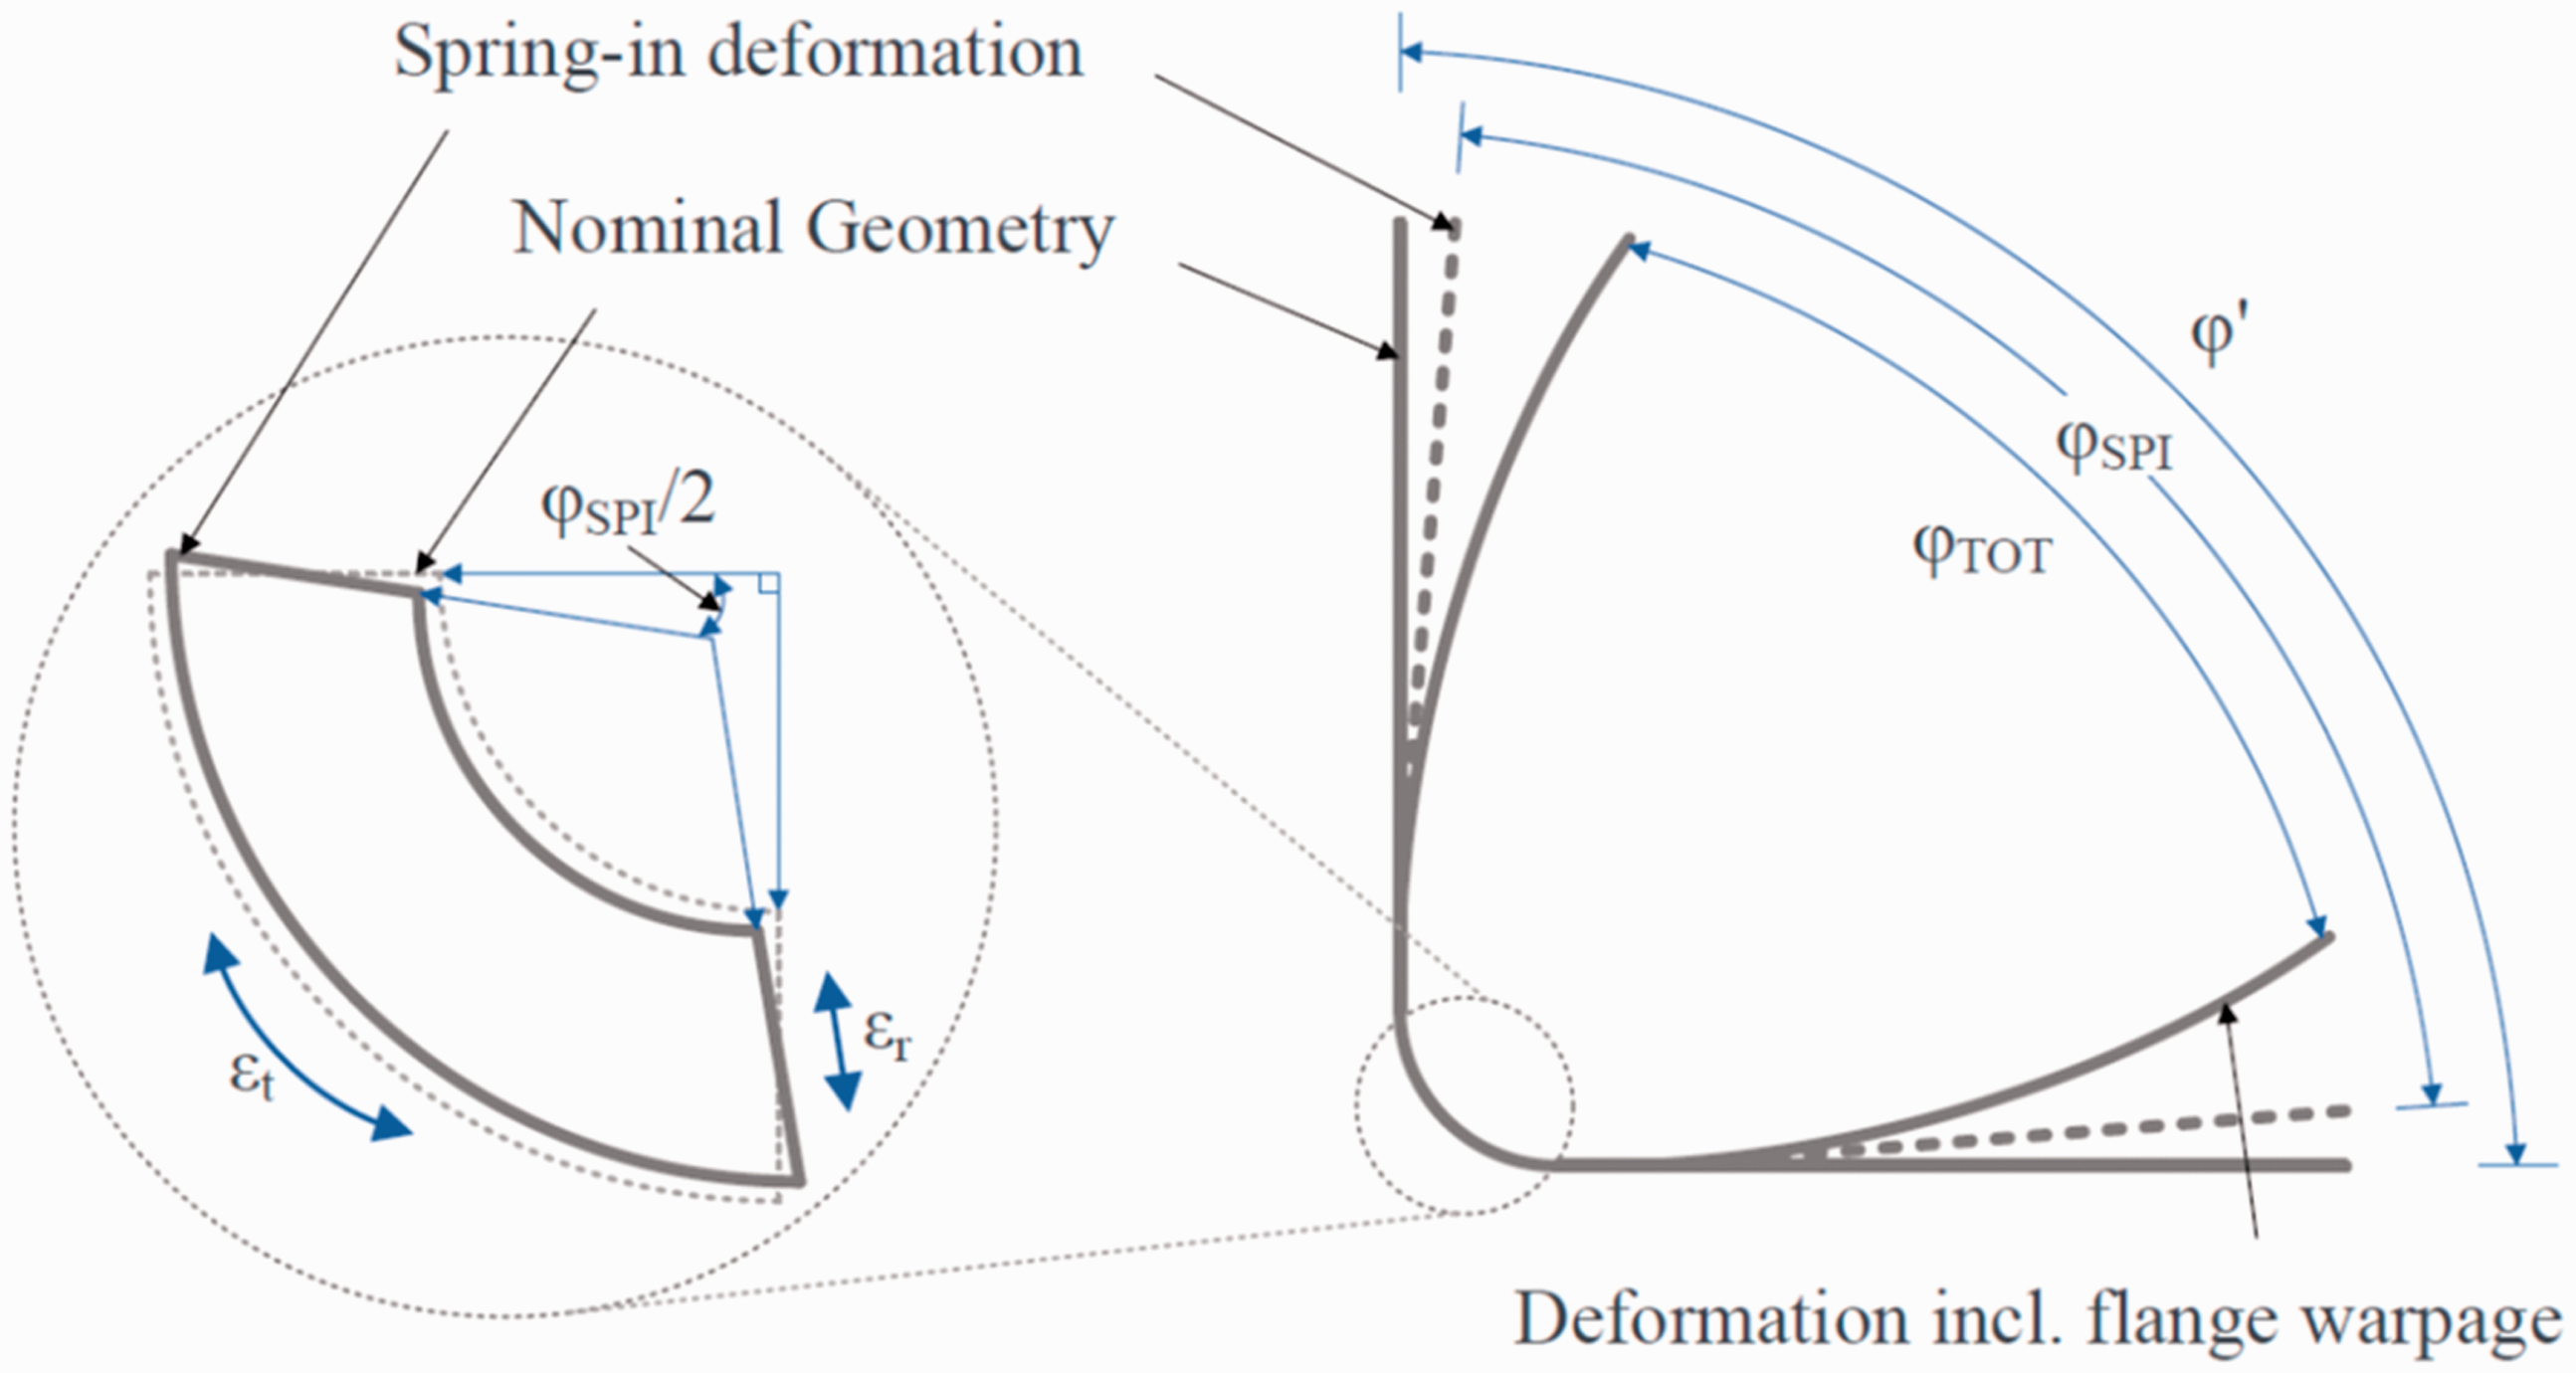
spring-in also is heavily depending on intrinsic factors such as the part geometry, lay-up, as well as the properties of resin and fibers.10,20–22 Spring-in occurs in curved part areas only. As shown in Figure 1, the difference in through-thickness strains compared to in-plane strains (ɛr ≫ ɛt) leads to distortions. The enclosed angle φ′ decreases.
Process-induced distortion of an L-profile specimen.
16
A lot of experimental work has been conducted on process-induced distortions in the past. Nevertheless, only a few authors focused on closed mold RTM technology11–16 and even fewer on fast curing resin systems.16,23 CF/EP parts manufactured using closed mold RTM using fast-curing matrices were investigated in Groh et al. 16 It was found that slow and fast curing resins behave similar. The chemical contribution to the overall spring-in was in the same order of magnitude for all investigated specimens. Processing temperature had a more significant impact on spring-in than the exchange of the resin system. The simplified modeling approach in the study was able to give quite good estimates of the spring-in but was not able to account for the viscoelastic behavior of the material nor could the residual stresses be quantified.
Other authors analyzed the contribution of chemical and thermal shrinkage to the overall spring-in for slower curing resin systems. Nelson and Cairns 20 found the chemical portion to be between 30% and 60%, which is in good accordance with Yoon and Kim 9 and Nyman et al., 24 who reported 58% and 60%, respectively. Other studies showed an even higher contribution of CCS. Ding et al. 25 determined a portion of 65% and Bapanapalli and Smith 22 measured 75%. Kappel, 19 who did extensive experimental work on the subject, found the chemical portion to be within a range from 33% to 64% over all specimens. Canal et al. 23 investigated the temporal evolution of residual strains in CF/EP and CF/PU composites by using FBG sensors. They found higher residual strains in CF/PU compared to CF/EP which they attributed to the higher reaction temperature of the PU-system. A subsequent comparison with another epoxy resin, which was cured at an equal high temperature as the PU resin, revealed no significant difference in residual strain level. Furthermore, their results show a dominance of thermal over chemical strains with respect to their contribution to residual strains. Specific volume measurements of an epoxy resin published by Choy and Plazek 26 show a more balanced influence. However, the impact of CCS on residual stress level is not yet fully understood. Some studies conclude that strains due to shrinkage do not contribute largely to the overall stress state since they occur at the beginning of the process where the material exhibits only low mechanical properties and significant stress relaxation.23,27–29 On the contrary, Hu et al. 30 investigated the warpage of bi-material specimens and compared these measurements with simulation results. They found that by neglecting CCS, the prediction quality of the warpage simulation impairs significantly. Equal results are found by Jain and Mai. 31 White and Kim 32 developed a viscoelastic material model for calculation of residual stresses during cure and cool-down. According to their findings, residual stresses that develop before cool-down are not negligible as it is commonly assumed. Even though their study includes stress relaxation, the final residual stress state was significantly affected by stress contributions during cure and before cool-down.
Material characterization
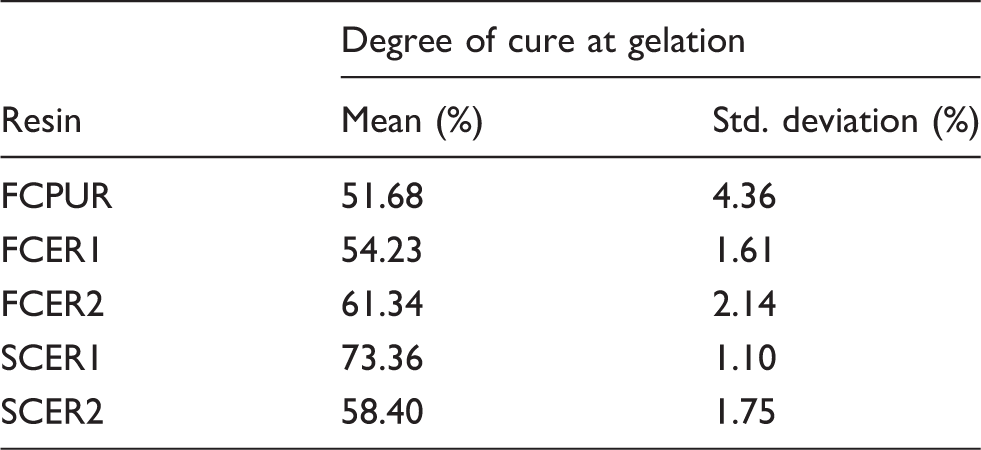
Degree of cure at gelation
The degree of cure at gelation is characterized using differential scanning calorimetry (DSC). For analyzing the enthalpy of reaction, 11 ± 0.5 mg of liquid resin is sealed into an aluminum pan and heated from 25 to 250 ℃ with a rate of 15 K/min. Measurement of each resin is repeated three times and a DSC 2 by Mettler Toledo is used.
The degree of cure at gelation is determined by correlation of the DSC data with rheometer measurements using the same temperature profile. First, the time of gelation is analyzed by multi-frequency oscillation in the rheometer (Gemini HR nano, Malvern Instruments) at 1, 2, 4 and 8 Hz. The gelation is determined by the crossing of the phase angles, which means the phase angle is independent of the frequency. The measurements are performed three times with a plate diameter of 25 mm and a gap size of 1 mm. These results are correlated over time to the DSC results, which gives the degree of cure at gelation. From the measured data, mean values as well as the corresponding standard deviations are calculated.
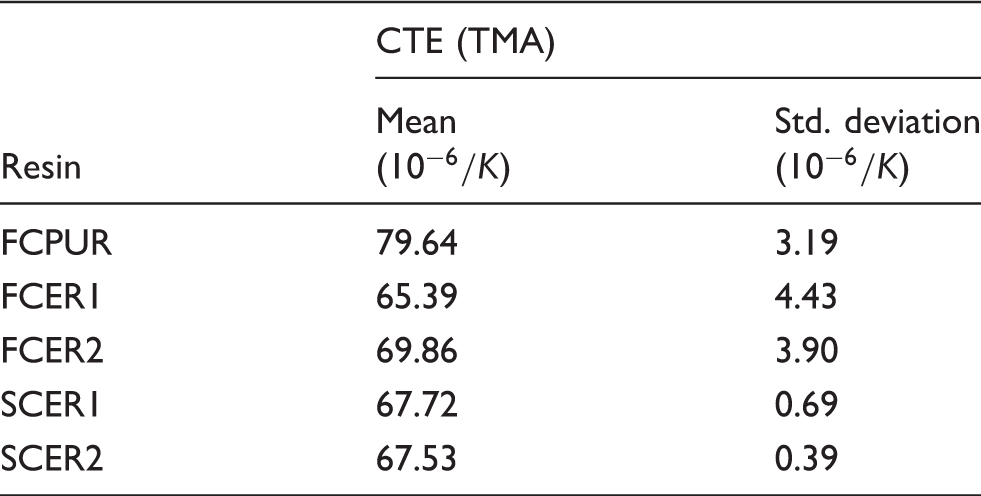
Coefficients of thermal expansion
The coefficients of thermal expansion (CTE) of the studied resins are analyzed by thermal mechanical analysis (TMA/SDTA841e, Mettler Toledo) according to DIN 51045. Cured samples are heated twice from 0℃ to a temperature significantly above
CCS
The measured value of CCS depends on the measurement technique used.33,34 It is therefore vital to give exact information on which measurement technique is used in order to be able to correctly assess the results. CCS of epoxy resins is reported to be between 2.0 and 7.6%26,33,35 and values for PU vary between 1.82 and 5.95%.34,36 Based on these ranges, PU seems to be advantageous due to lower amount of shrinkage. However, the number of studies available is limited.
In this study, CCS of the resins is analyzed by video-imaging (VI) and rheometer measurements. For VI, a drop of resin is placed on top of a hot aluminum pedestal. This setup is illuminated from the back and a camera monitors the resin's contour from the front. The recorded pictures allow the calculation of the resin's volume and the CCS over cure. 33 The rheometer measurements are performed in a plate–plate setup without any applied torsion. The resin is cured between two aluminum plates, which have a diameter of 40 mm and a gap size of 1 mm. The resin's shrinkage during cure is compensated by adapting the gap size such that the normal force remains zero. The CCS is calculated by the altered gap size according to Haider et al. 37 For both methods, the epoxy resin is isothermally cured using the individual cure cycles of the resins (cf. ‘Material properties’ section). Measurement of each resin is repeated five times and a mean value as well as the corresponding standard deviation is calculated.
Mathematical model for spring-in prediction
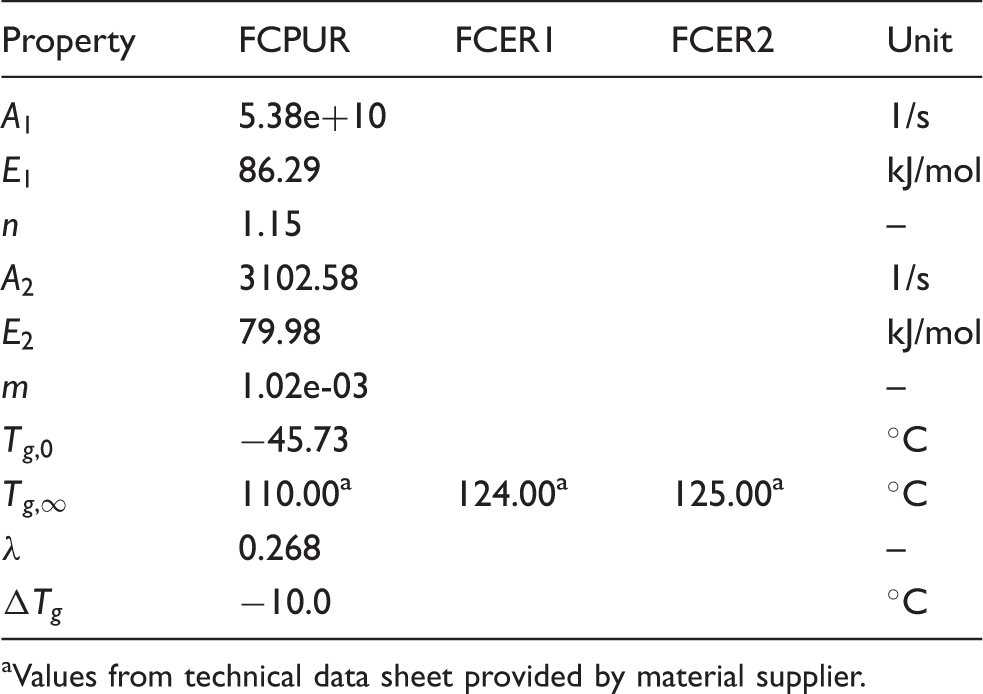
For the numerical prediction of the spring-in-angle, a simple linear elastic material model is used and implemented as a user-subroutine (UMAT) in Abaqus. Due to the multitude of different resin materials involved in this study, thorough characterization in terms of detailed reaction kinetics and evolution of mechanical properties during cure of each resin was not reasonable. Therefore, these relationships are modeled using simple models, which are adapted for each material using values from their technical data sheets. The evolution of the cure degree is described using the Kamal-Malkin kinetic model,
38
which defines the cure rate by


The relationship between cure degree and glass transition temperature is given by the Di-Benedetto equation
39

Since the Kamal-Malkin model is not capable of modeling premature vitrification, the maximum achievable cure degree of all resins is 100%. This assumption is valid as long as the CCS is characterized using the exact same cure cycle resulting in the same cure degree as the process. That said, the cure degree can be interpreted as a relative quantity where 100% relates to the maximum cure degree that can be achieved at a specific cure temperature. The same applies to the maximum achievable glass transition temperature
The material switches between liquid, rubbery and glassy state, depending on the current cure degree and the difference between the current cure temperature and glass transition temperature. In a typical RTM process, the material gels after exceeding the cure degree at gelation. This is accompanied by a change in material state from liquid to rubbery. As soon as

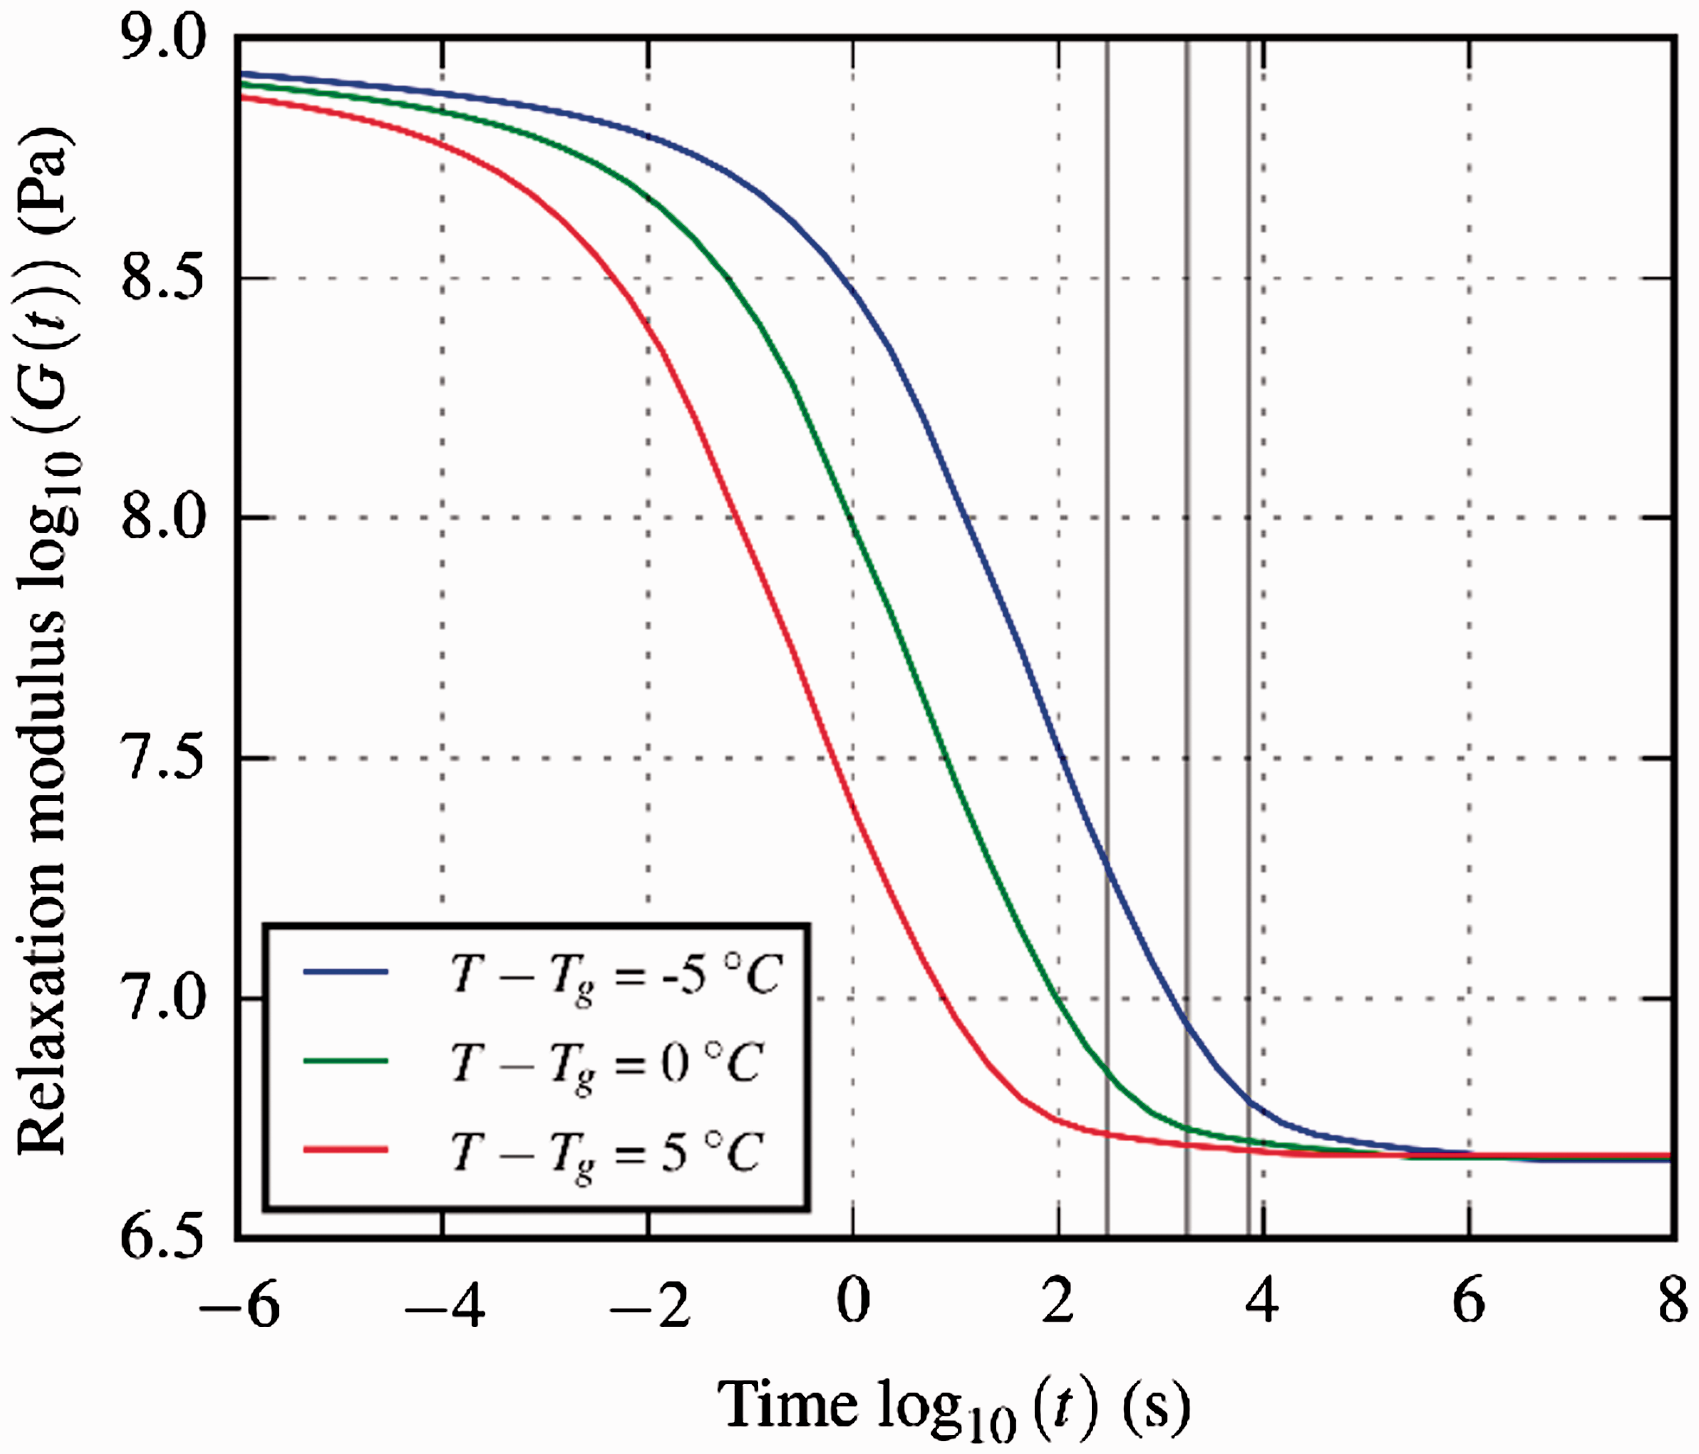
The material state indicator Predicted temporal evolution of the relaxation modulus of fully cured Hexcel 8551-7 resin for temperatures close to the maximum glass transition temperature. Vertical lines correspond to cure times of 5, 30 and 120 min. Model and parameter set were taken from Simon et al.
41
The shape of the transition between glassy and rubbery state can be adopted to the actual material behavior by using model parameters b and c of equation (4). Since it is not possible to directly measure this transition, model parametrization should be done based on a measureable quantity instead. One possibility is the shear modulus of the resin which can be described by

in which the cure dependency of the rubbery shear modulus

In equations(5) and (6),

With the assumption of linear-elastic and isotropic material behavior, the elastic modulus of the matrix is given by

The same approach is used to model the coefficient of thermal expansion, which is given by

Homogenization of the mechanical properties as well as the CTE and CCS for a single unidirectional ply is based on micromechanical formulas originally developed by Bogetti and Gillespie. 43 This model has been selected as the resulting homogenized material properties are in good agreement with values predicted using a periodic representative volume element (RVE). A comparison of these homogenization methods and the impact on spring-in is shown in more detail in ‘Influence of micro-mechanical model on spring-in prediction accuracy’ section.
Numerical spring-in prediction is carried out using a linear elastic material model which has been implemented in an Abaqus subroutine (UMAT). Based on the homogenized ply properties, the subroutine assembles the stiffness matrix

The total strain increment

The individual components of thermal and chemical strains are given by


Results and discussion
Material properties
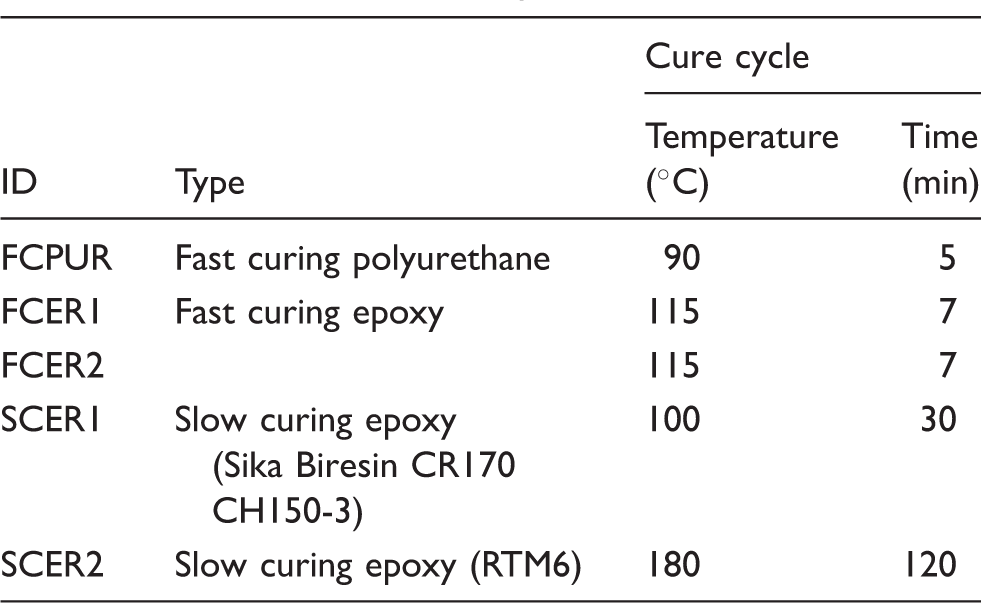
One of the aims of this study is the characterization of the impact on spring-in when using different resins. Therefore, five resins have been selected and characterized.
Resins used in the study.
Parameters for modeling of reaction kinetics and glass transition temperature.
Values from technical data sheet provided by material supplier.
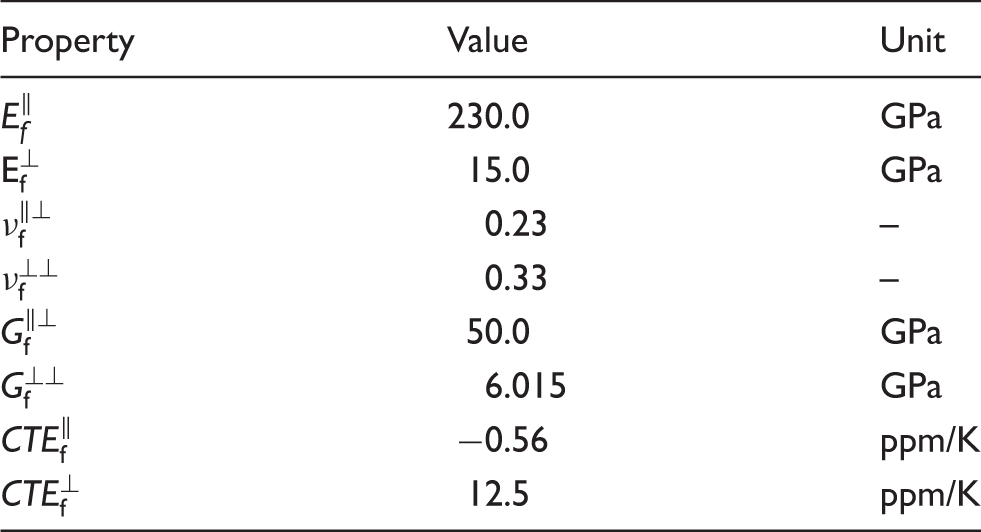
Material properties of fiber.
Material properties of the resins.
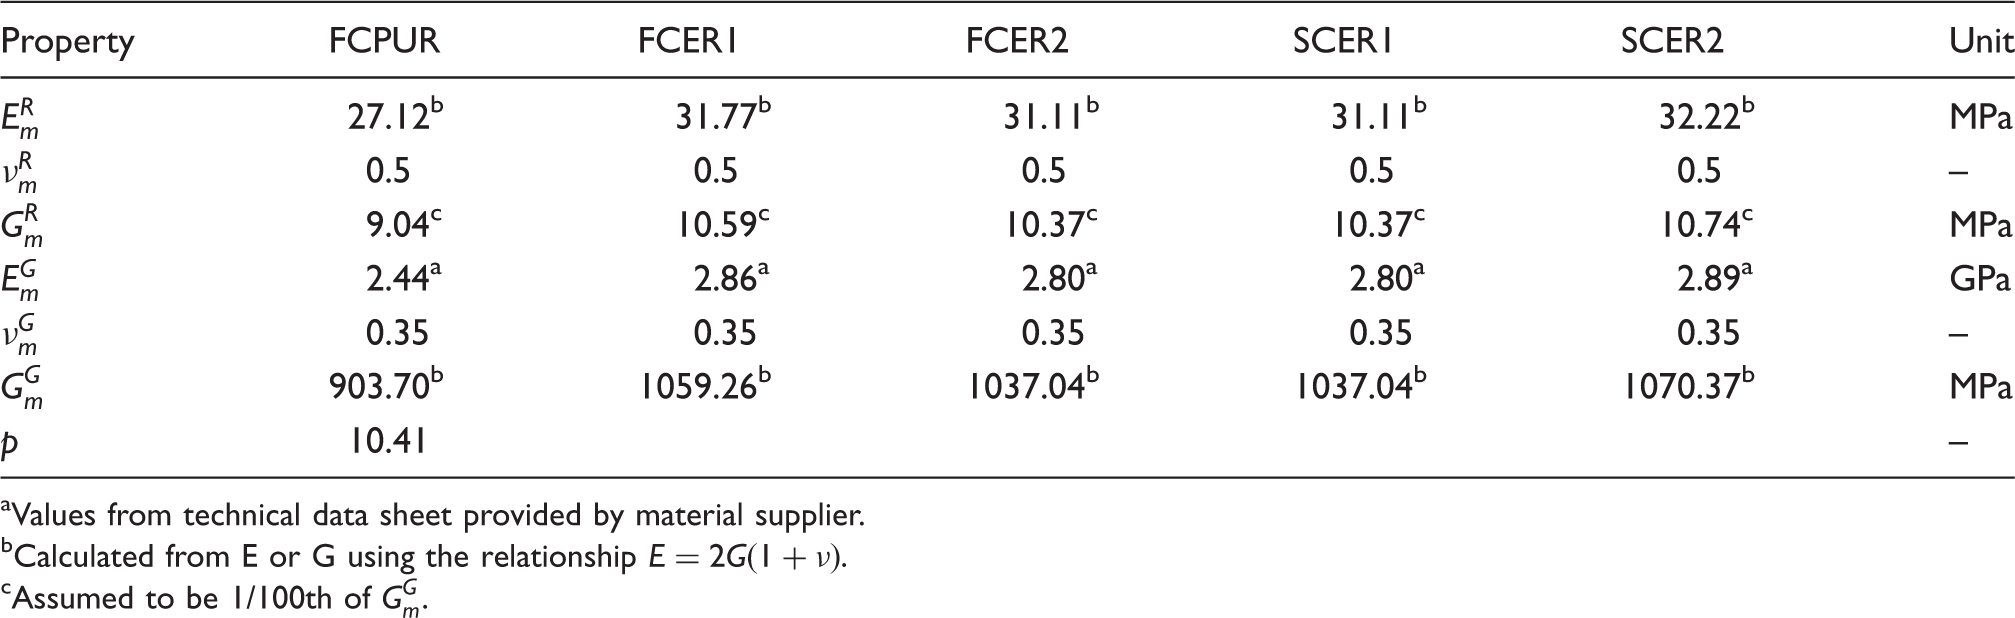
Values from technical data sheet provided by material supplier.
Calculated from E or G using the relationship
Assumed to be 1/100th of
Measured degree of cure at gelation of the resins.
Measured coefficient of thermal expansion (CTE) of the resins.

Measured amounts of chemical shrinkage of the resins.
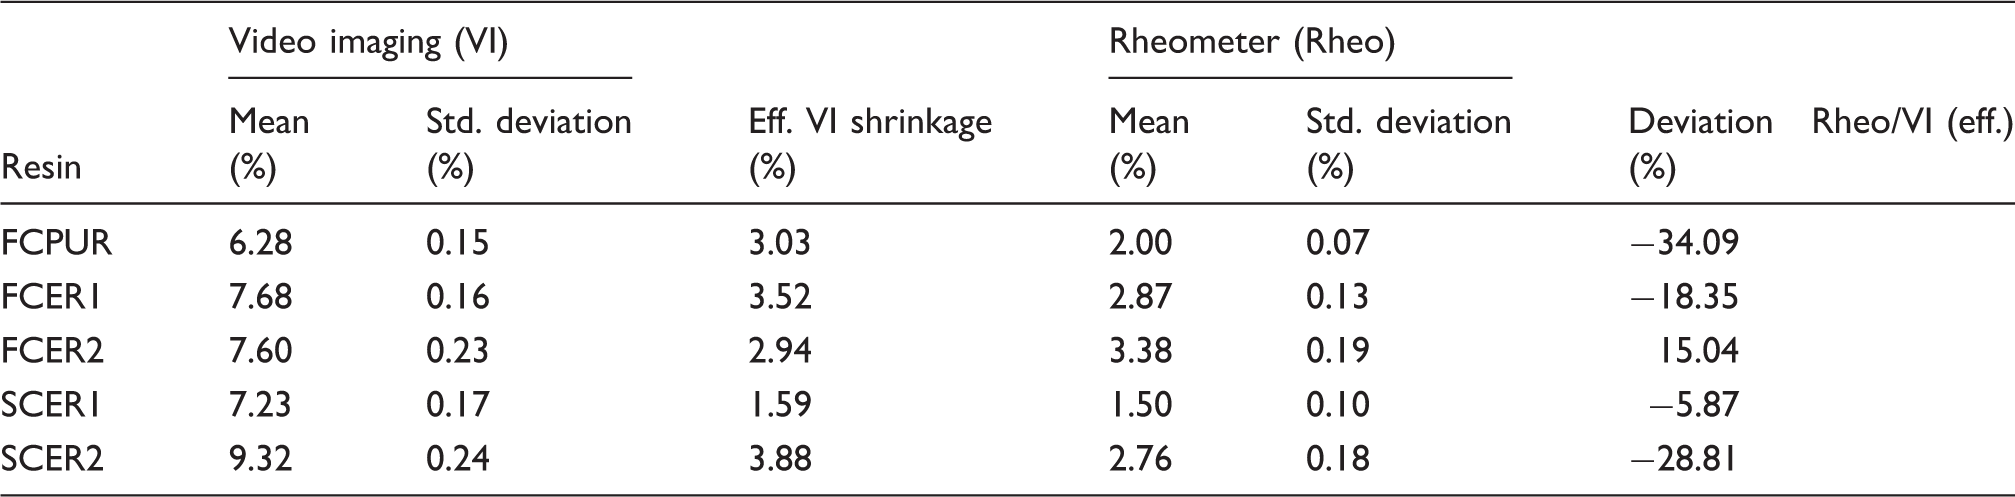
The resulting values of effective shrinkage are also given in Table 7. The difference between shrinkage from rheometer and shrinkage from VI is greatly reduced. However, as is indicated by the last column of Table 7, shrinkage from rheometer still shows smaller values. The disparity is most likely due to different boundary conditions acting on the resin during measurement. The parallel plate setup hinders the resin from shrinking within the directions parallel to the plates. Only in axial direction, the material is able to deform freely. Therefore, the measured shrinkage depends strongly on the experimental setup, mainly plate diameter and gap size, as was already addressed by Exner and Wierach. 11 As a result, the shrinkage as measured by using a parallel plate rheometer is neither purely volumetric nor linear. Consequently, values from VI should lead to more accurate shrinkage measurements.
A possible source of error is given by equation (14) which implies a linear relationship between volumetric shrinkage and degree of cure. Since shrinkage data from video imaging contain the volumetric shrinkage of the material over the whole cure process, it is possible to check the validity of this assumption. The corresponding evolution of the cure degree is predicted using a reaction kinetics model that was parameterized for SCER1 resin in Bernath et al.
44
During this process, emphasis has been put on accurate prediction of curing under isothermal conditions, which were also applied during shrinkage measurements of the present study. Since vitrification is likely to occur under these conditions, the Grindling kinetic model is used. Figure 3 shows the evolution of shrinkage during cross-linking of SCER1 resin.
Evolution of chemical shrinkage during cross-linking of SCER1 resin measured using video imaging.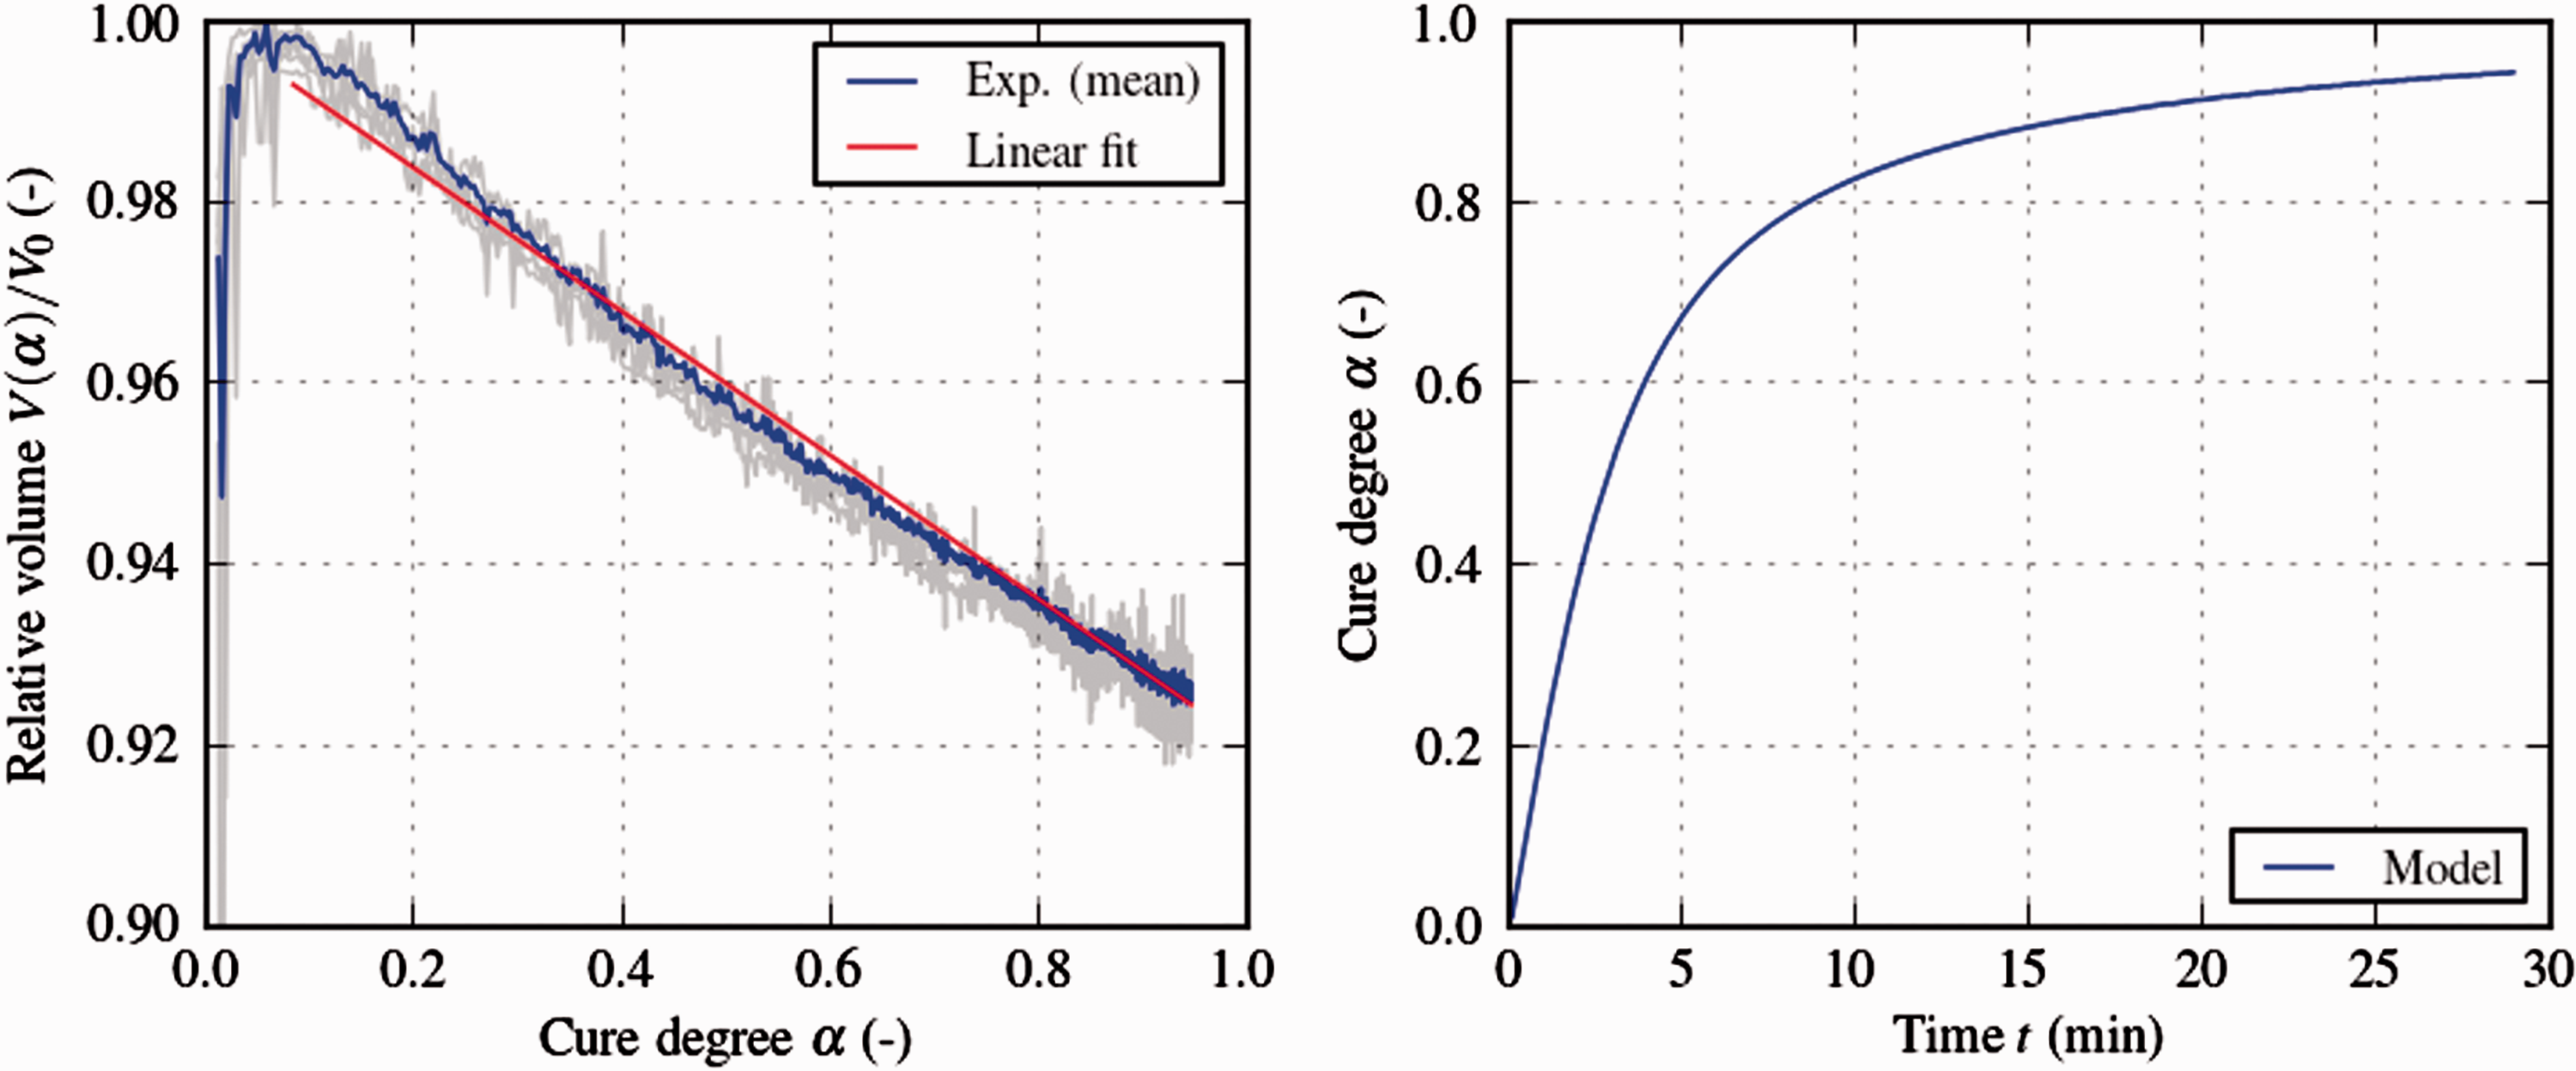
Apart from initial scattering, the averaged experimental curve shows only a small amount of curvature, leading to an approximately linear relationship between shrinkage and curing. This is especially true if only the shrinkage from gelation to full cure is considered, which for this resin is
Spring-in-angles of L-section specimens
The L-section specimens used in this study were manufactured using a low pressure, closed mold RTM process similar to state of the art industrial applications. A standard tool steel is used as mold material and the mold is heated and cooled by water. Similar to high volume industrial applications, an isothermal process is applied for all produced parts. The consolidation process is vacuum supported in order to promote resin flow during process (p vac < 10 mbar).
The specimens have a flange length of 58 mm and a width of 248 mm. The inner radius is 5 mm and the nominal laminate thickness is 2 mm. The nominal enclosed angle of the tool is 90°. Preforming of the textile material is realized on a perforated ureol foam tool with the help of a vacuum-supported elastomeric membrane. Both biaxial fiber textiles are non-crimp fabrics (NCF) with an areal weight of 300 g/m2 manufactured using either Toray T620 or Panex 35 fibers.
The occurring deviations from the nominal geometry, schematically depicted in Figure 1, are detected by means of three-dimensional optical scanning. A GOM Atos Triple Scan measuring system and the corresponding software GOM Inspect are used for analysis. Best fit planes are constructed within the software to determine the angle between the flanges of the L-profile after processing. The deviation from the desired enclosed part angle of 90° is subsequently denominated Δϕ. The specimens were also checked for additional flange warpage and torsional deflection. In case of symmetric layups, none could be detected. Asymmetric layups, however, exhibit distinct flange warpage, making comparison of experiment and simulation more complicated.
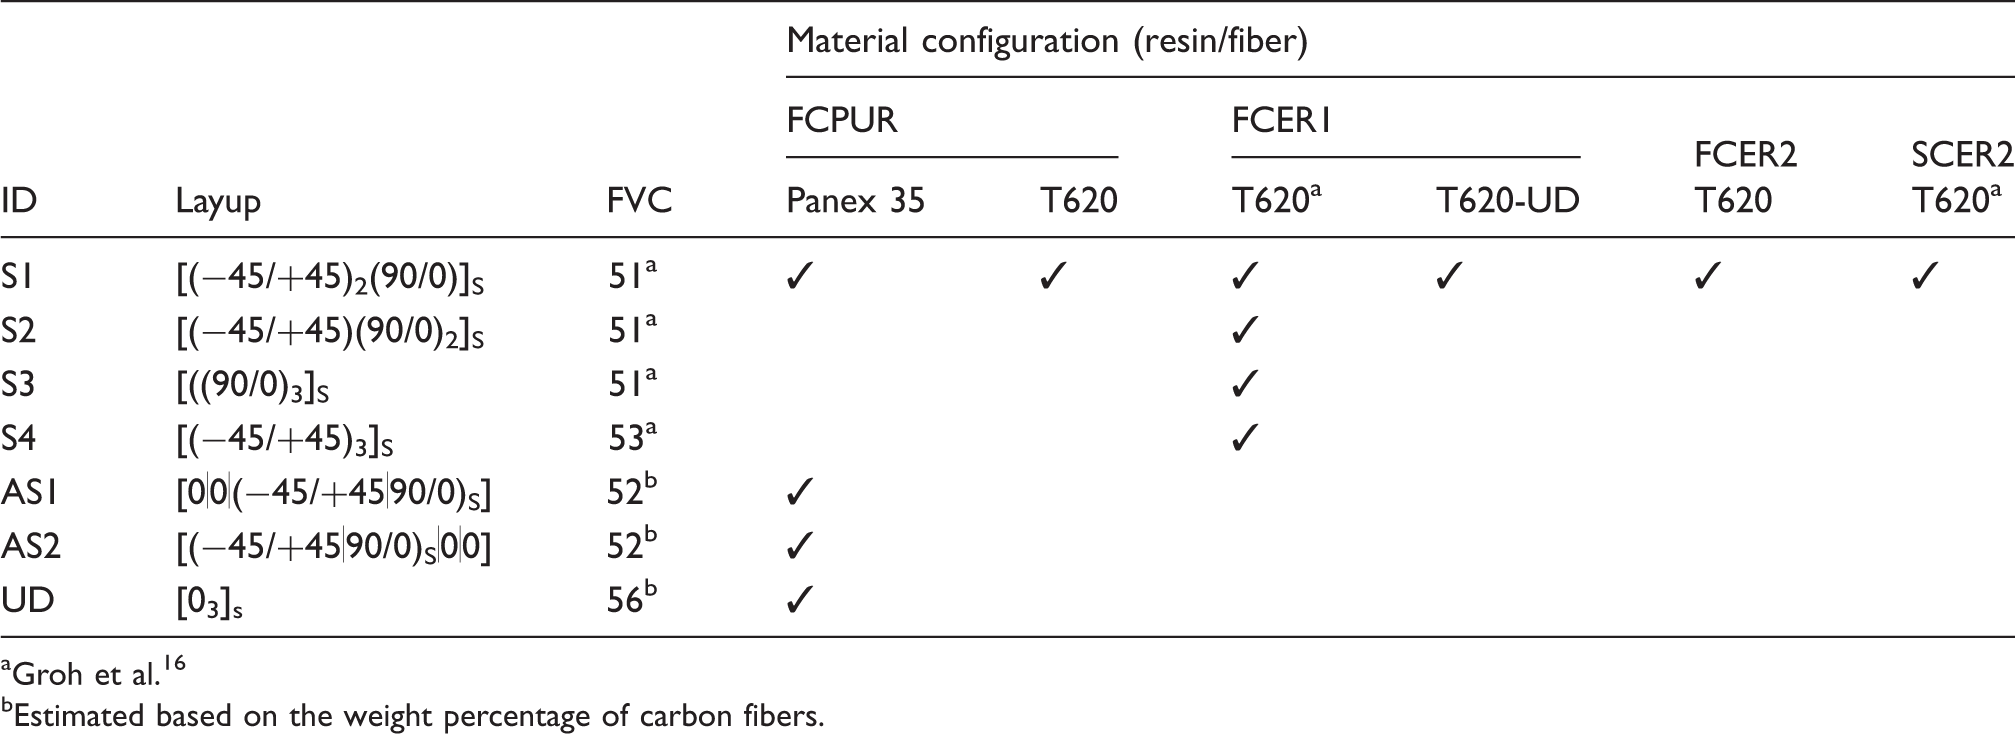
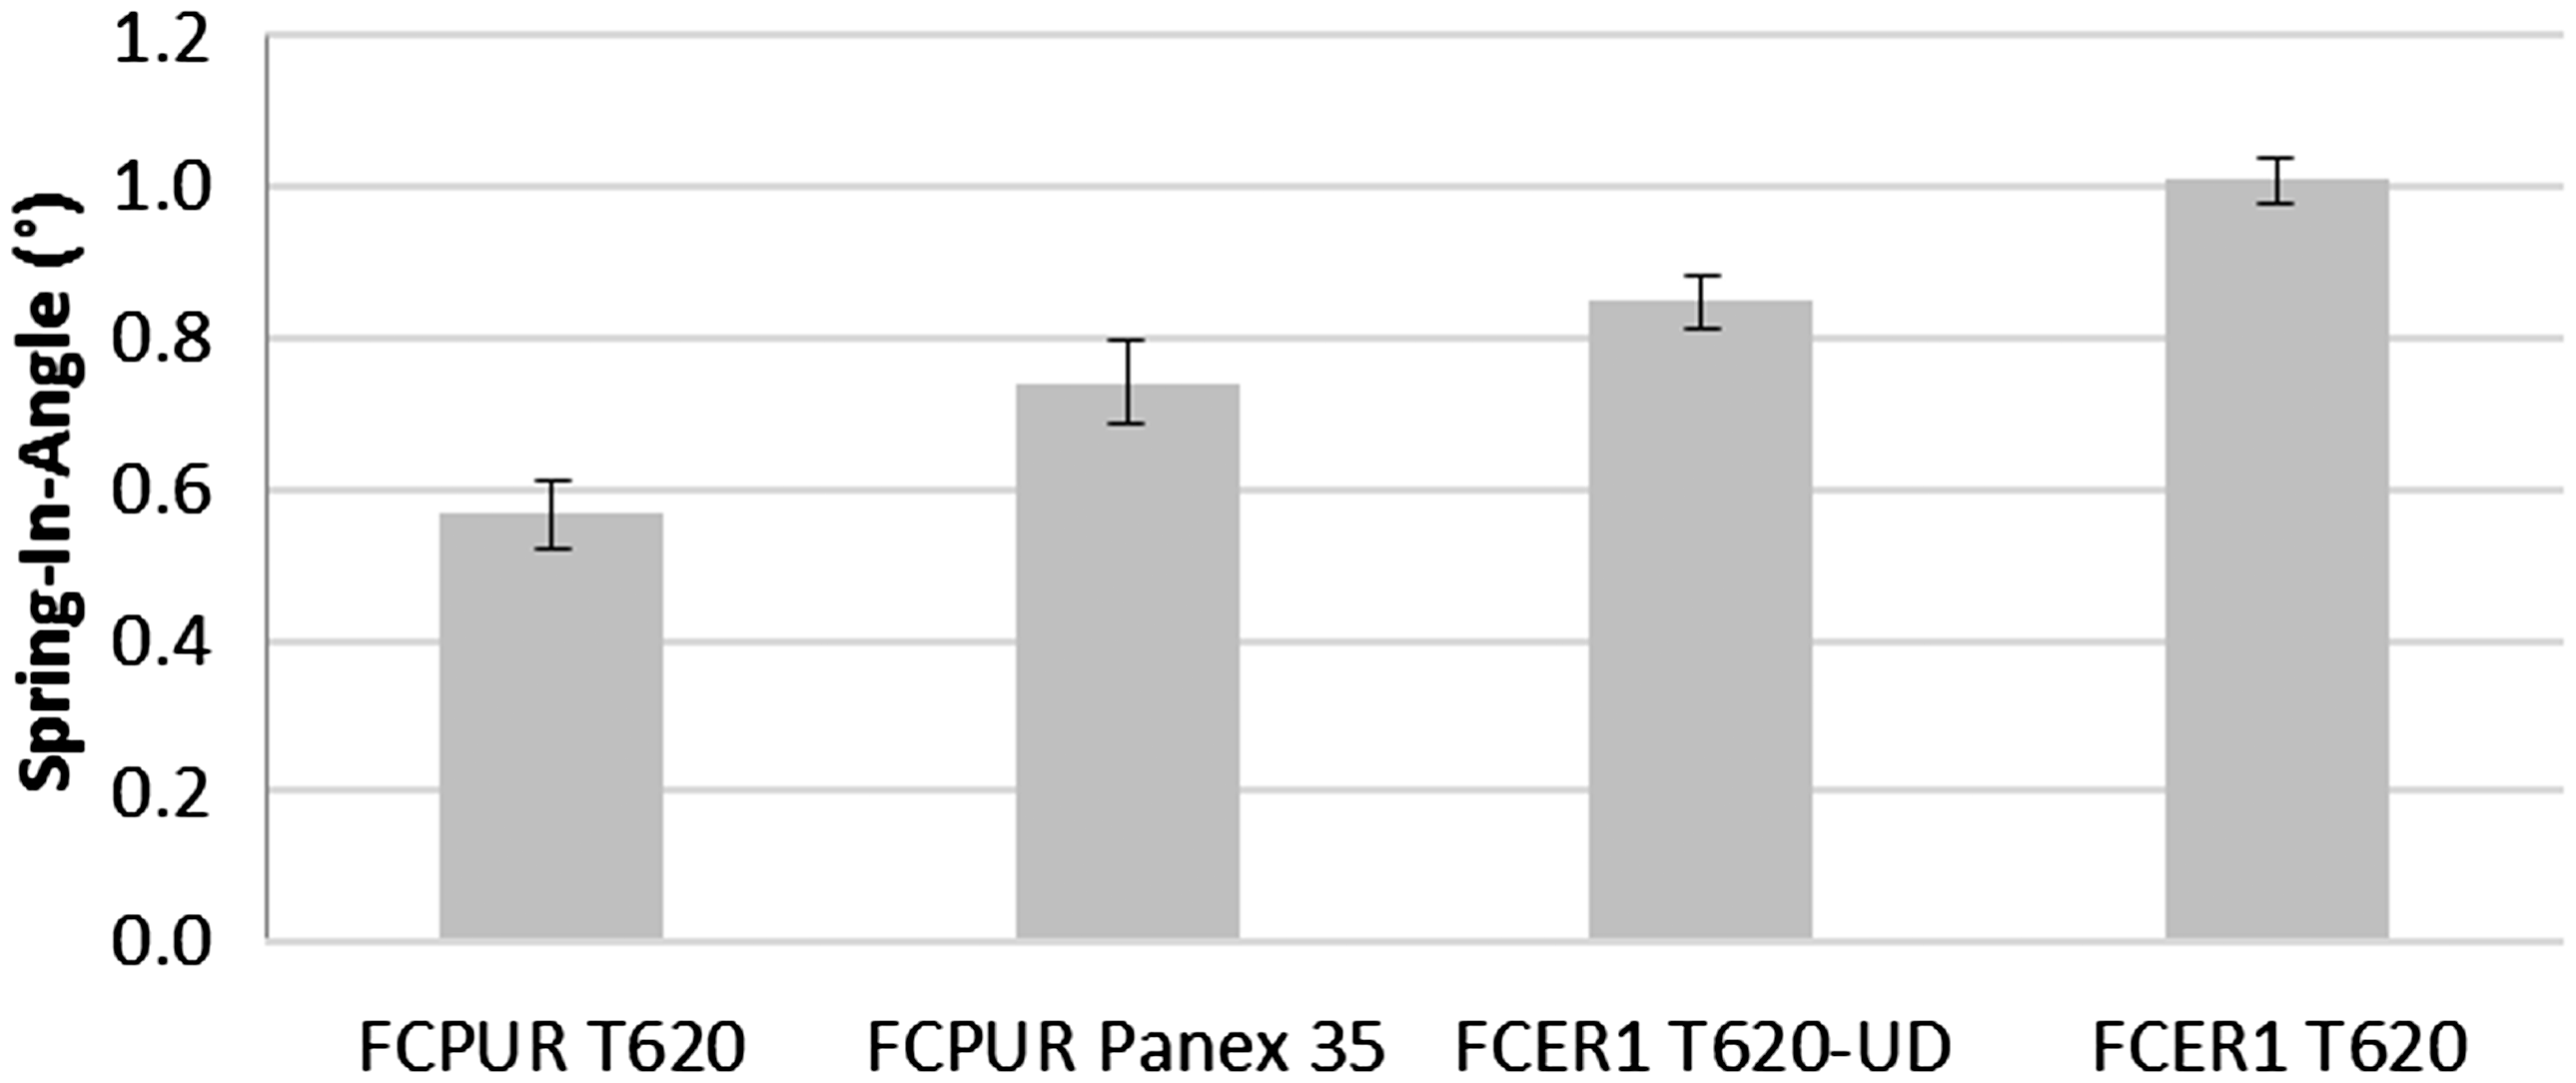
Table 8 gives an overview of the specimen configurations used in this study. Laminates S1 to S4 as well as UD are symmetric. AS1 and AS2 are similar to S2 specimens but contain an asymmetric laminate. AS1 has additional 0° unidirectional layers at the inner radius of the L-section, whereas AS2 has two additional 0° unidirectional plies at the outer radius. Table 8 also contains the manufactured resin and fiber combinations. In order to enable a broad comparison of the spring-in phenomena, specimens with layup S1 were manufactured with each of the investigated fiber and resin types except for SCER1. Furthermore, T620-UD denotes specimens with unidirectional rather than biaxial non-crimp fabric T620 fiber textiles. The corresponding spring-in-angles as well as the cure temperatures of the resins are shown in Figure 4.
Spring-in-angles and corresponding cure temperatures of specimens with layup S1 and different resin and fiber configurations. FCER1/T620 and SCER2/T620 values obtained from Groh et al.
16
Laminate and resin configurations of the specimens. Groh et al.
16
Estimated based on the weight percentage of carbon fibers.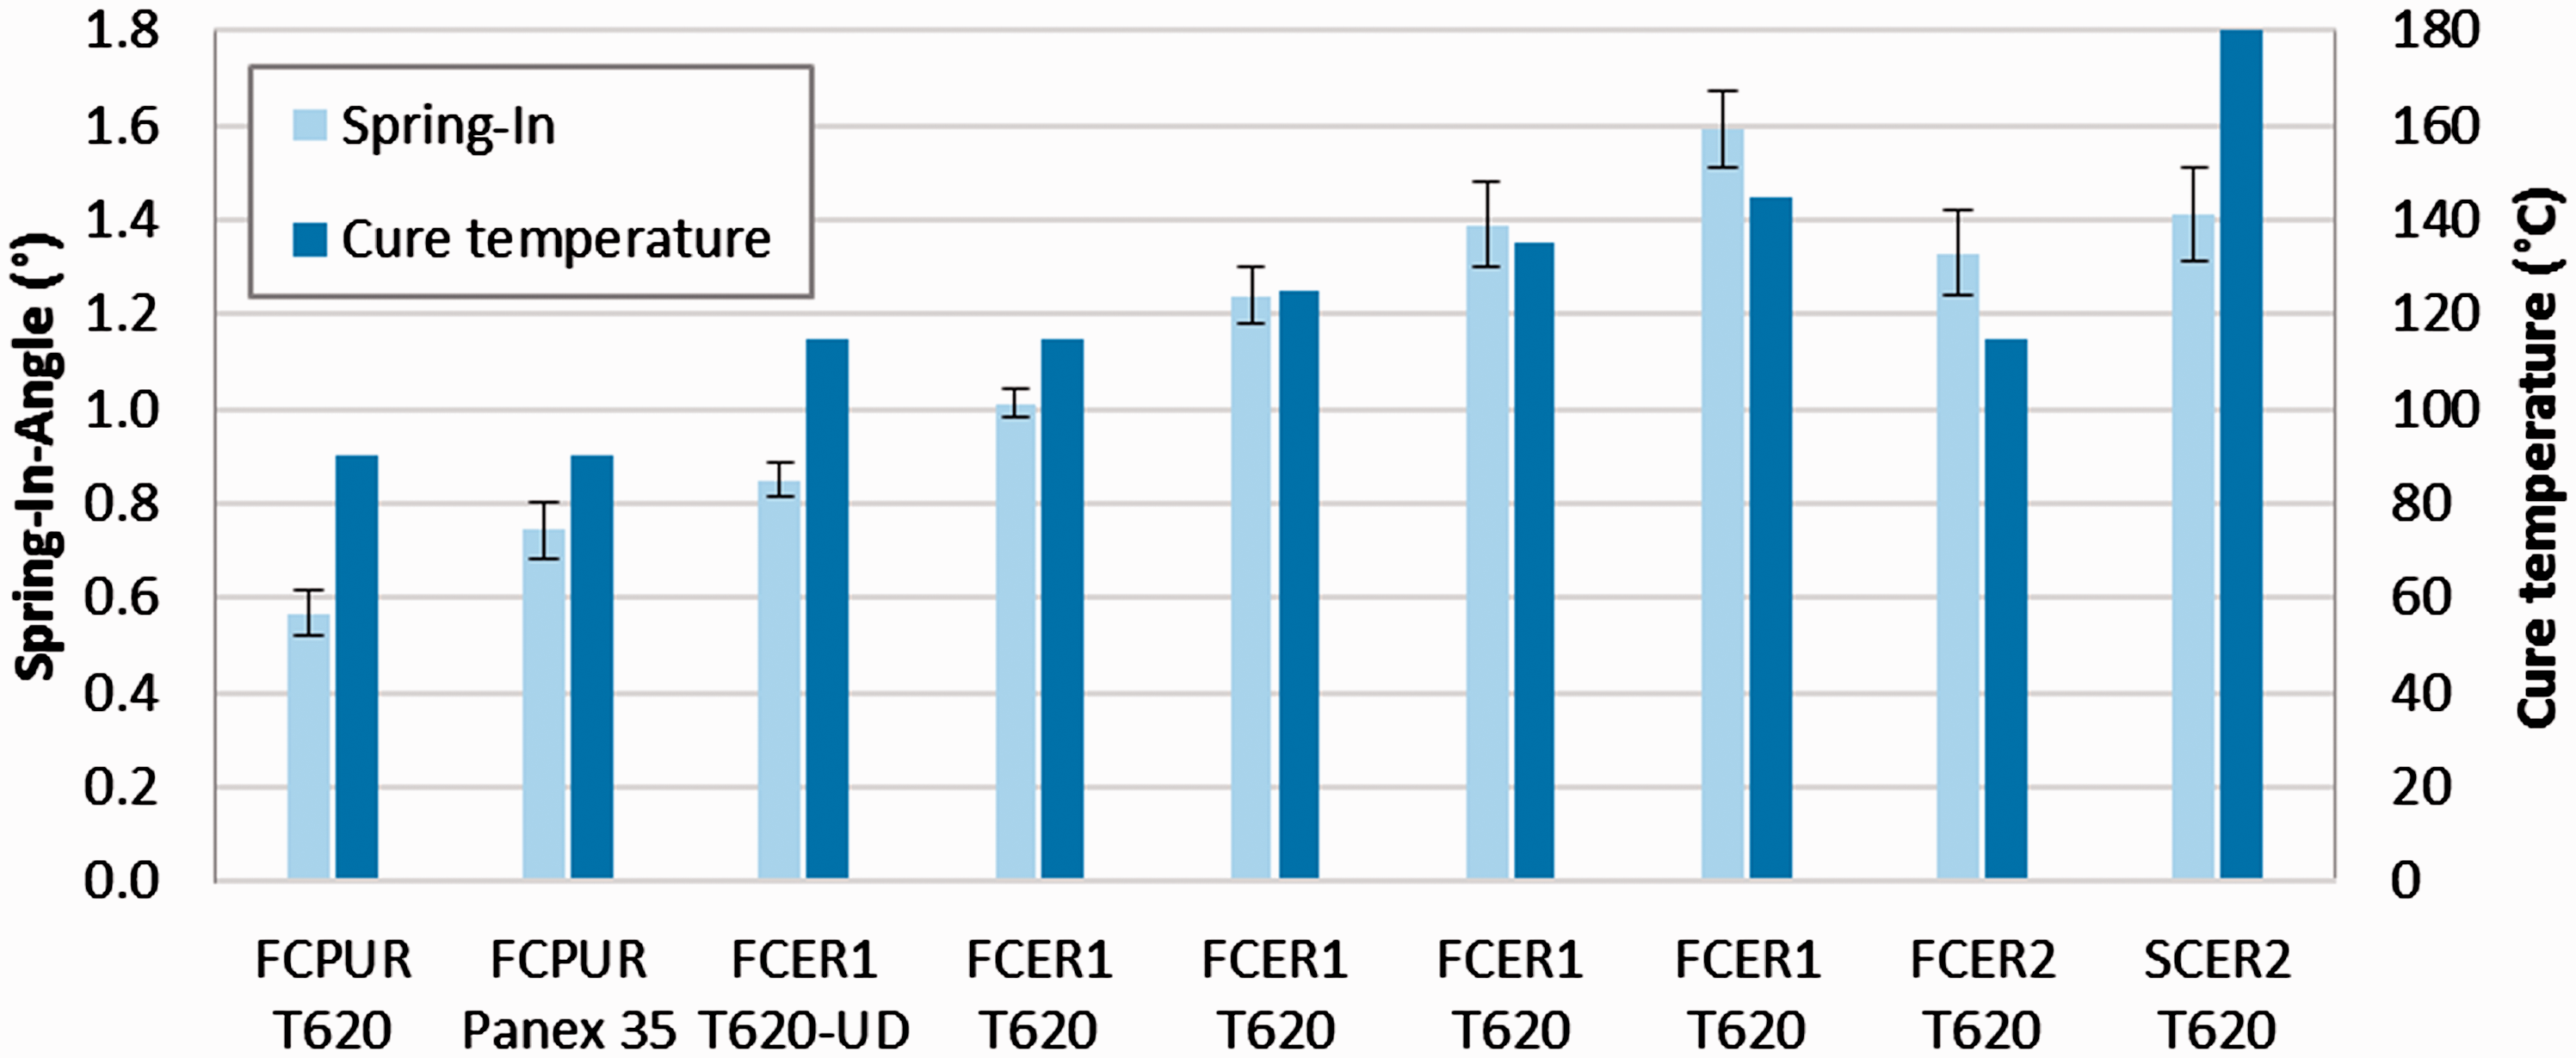
The specimens' spring-in-angles differ largely depending on the type of resin and fiber. Two conclusions can be drawn from these results. Firstly, the results indicate that the cure temperature has a strong influence on the process-induced distortion. This is expected since it directly correlates with the amount of thermal strain during cool-down after demolding. Secondly, the type of fiber textile has an impact on the spring-in-angle, which is obvious when comparing the specimens that were manufactured using the same resin but different fiber types. Figure 5 shows spring-in-angles of FCPUR and FCER1 specimens that were manufactured using two different fiber textiles. The results indicate a significant difference in process-induced distortion. Spring-in of FCPUR specimens is increased by 31% when using a textile based on Panex 35 fiber instead of the T620 textile. In case of FCER1 resin, spring-in is reduced by 16% when changing the fiber textile, although both fiber textiles that were used for manufacturing of these specimens are based on the same T620 fiber type. This implies that the difference in spring-in is not only caused by a different fiber type but also by other properties like sewing thread material or pattern. However, more investigations are needed in order to identify the reason for this.
Spring-in-angles of specimens with resins FCPUR and FCER1 and different fiber textiles. FCER1/T620 value obtained from Groh et al.
16
The temperature dependency of spring-in, as demonstrated in Figure 4, reveals that lower process-induced distortion can be expected by choosing FCPUR over the other resins. In order to clarify whether this is solely caused by the lower recommended cure temperature of FCPUR, the temperature dependency of FCER1 specimens is further analyzed in Figure 6 and a linear relationship between cure temperature and spring-in is assumed. By extrapolating the temperature dependency to lower temperatures, a hypothetical FCER1/T620 specimen cured at 90℃ yields a spring-in-angle that is about the same as that of the FCPUR/T620 specimen. This may again indicate that the type of resin has a strong influence on process-induced distortions but only due to their difference in cure temperature, which is needed by the material to reach a sufficiently high degree of cure.
Temperature dependency of spring-in-angle. FCER1/T620 and SCER2/T620 values obtained from Groh et al.
16
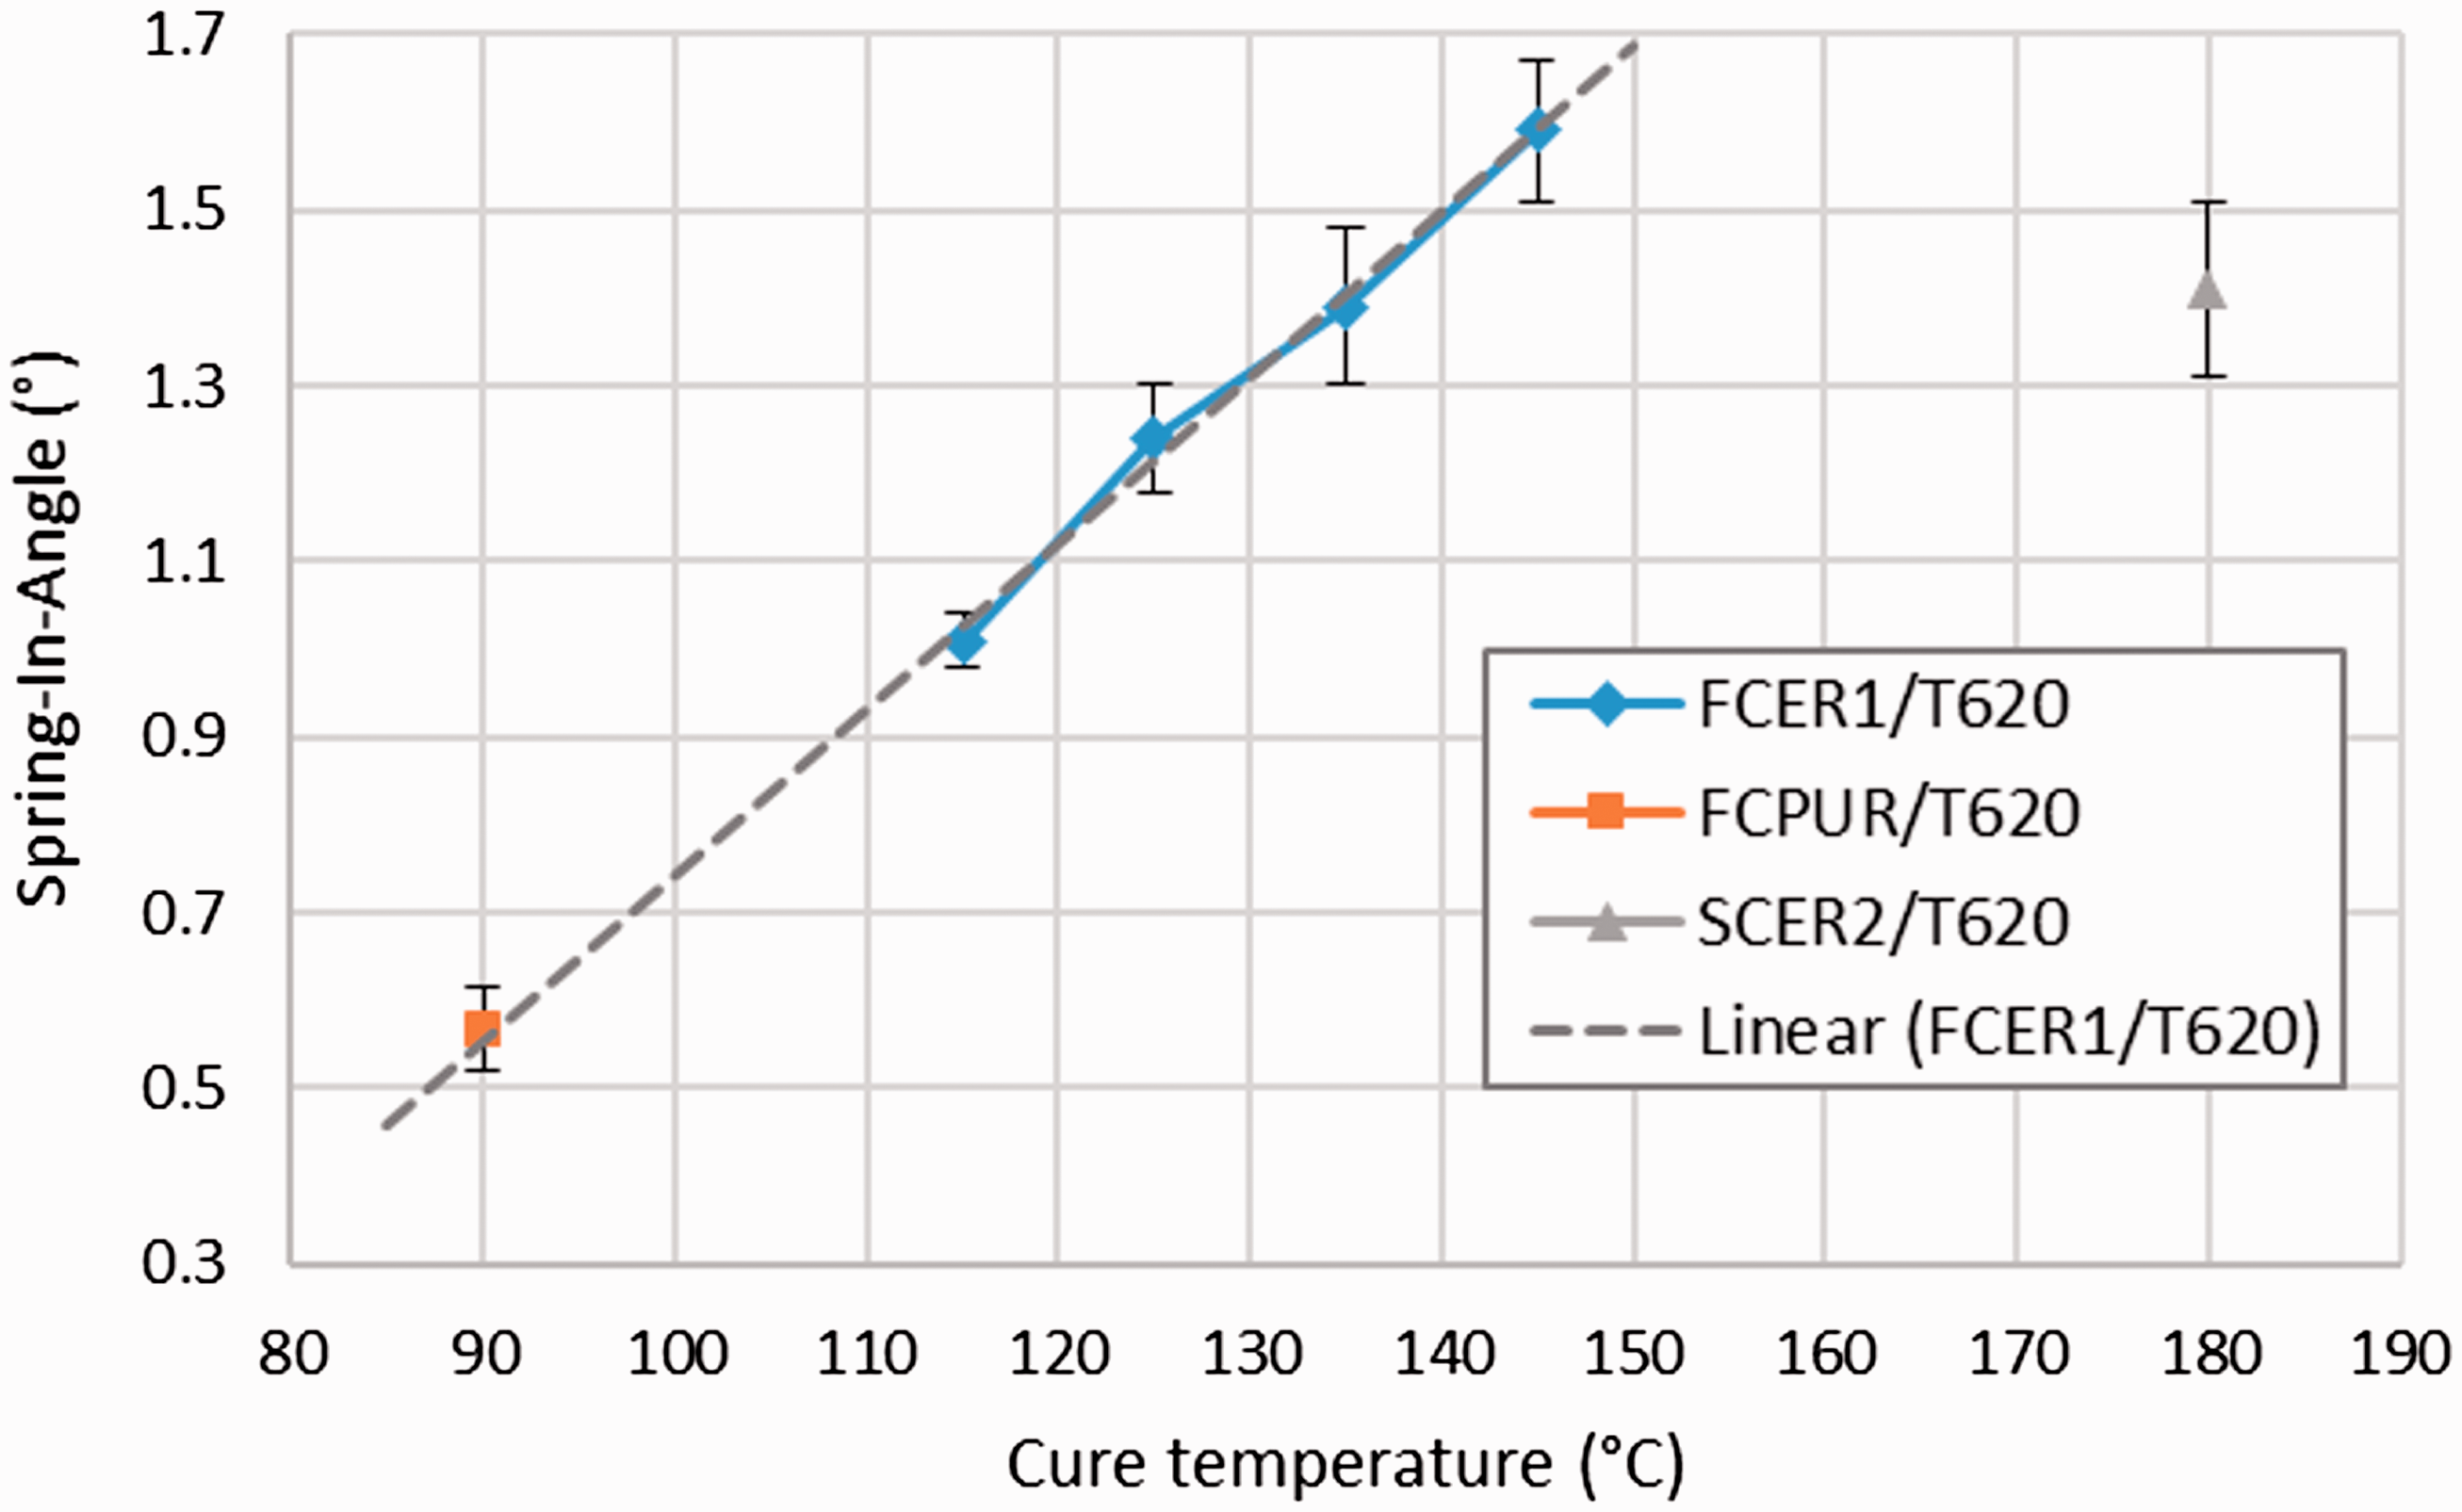
Figure 6 also contains spring-in of a specimen fabricated using SCER2 (RTM6) resin. Although these specimens were manufactured at a relatively high process temperature of 180 C, the measured spring-in is actually smaller than that of the FCER1 specimen manufactured with a much lower cure temperature of 145℃. Moreover, both the effective CCS as well as the thermal expansion of SCER2 are slightly higher than that of FCER1 resin (cf. Tables 6 and 7). Obviously, the absolute value of cure temperature is not as decisive as is its value relative to the current glass transition temperature of the resin. From this point of view, the higher spring-in of the FCER1/T620 specimen, cured at 145 C can be explained by the fact that it is actually cured 21℃ above
Figure 7 shows spring-in-angles of FCPUR/Panex 35 and FCER1/T620 specimens with different layups. In general, FCPUR exhibits smaller spring-in-angles compared to FCER1. Furthermore, by comparing FCPUR UD and S1 specimens, the nearly quasi-isotropic layup S1 reveals a much higher spring-in. The main reason for this is in-plane strain locking present in the quasi-isotropic layup. While the resin is allowed to shrink in transverse and through-thickness direction of the laminate in case of a pure unidirectional layup, the former is hindered by neighboring plies in a quasi-isotropic laminate. As a consequence, quasi-isotropic laminates show higher process-induced strains in thickness direction as shown experimentally by Rogers et al.
47
Spring-In of FCPUR/Panex 35 (left) and FCER1/T620 (right) specimens with different layups. FCER1/T620 values obtained from Groh et al.
16
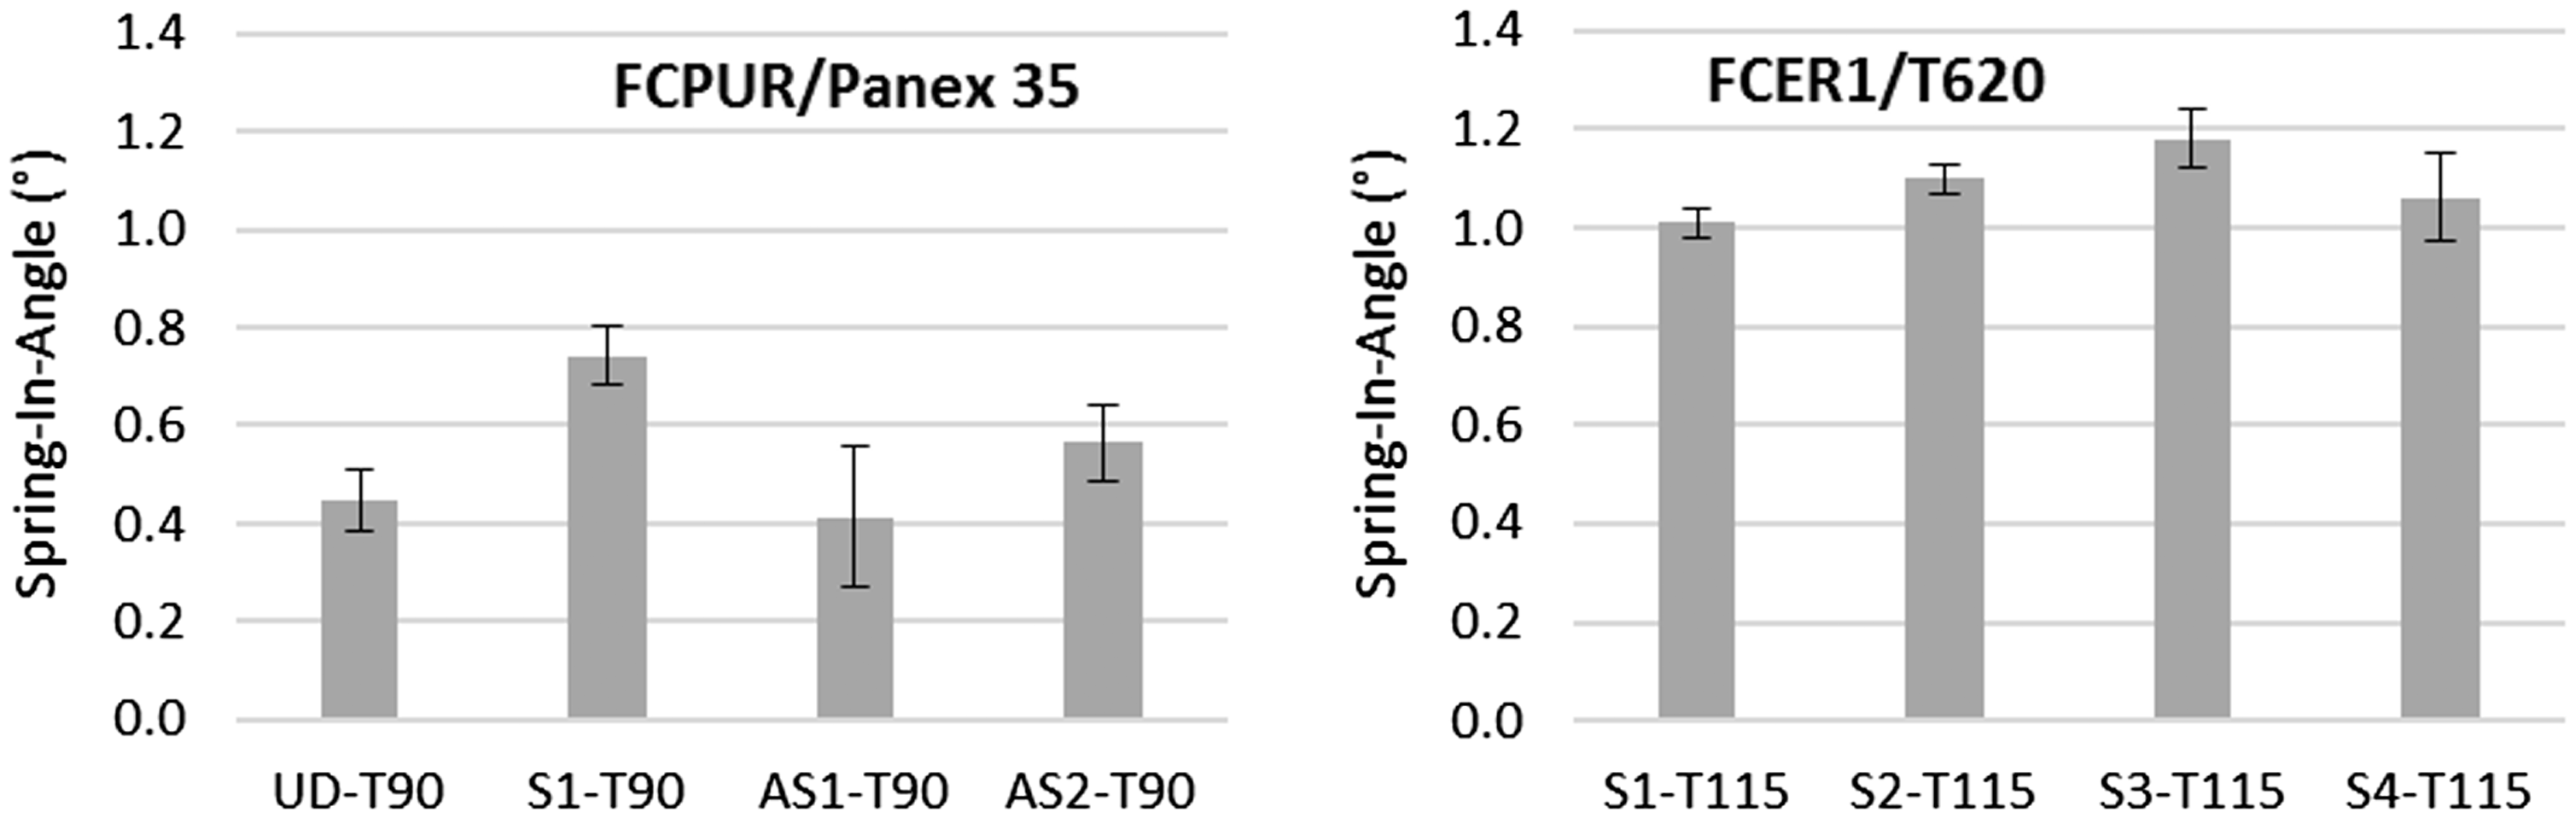
By adding plies of 0° orientation to either the inner (AS1) or outer (AS2) radius, the spring-in is reduced, compared to the symmetric quasi-isotropic layup S1. It should be noted, however, that in order to maintain an equal laminate thickness and fiber volume fraction, two of the four ±45° plies had to be left out. This affects spring-in in two ways, which both yield a reduction in spring-in. Firstly, the added unidirectional plies exhibit much lower residual strains in tangential direction compared to 45° or −45° oriented plies. Secondly, the thickness of the additional unidirectional plies is four times the thickness of one unidirectional layer of one biaxial textile. Therefore, transverse strain locking due to surrounding fibers may be less pronounced in these layers, leading to lower strain in through thickness direction.
Although the AS1 specimens show relatively large scatter, their mean spring-in-angle is smaller than that of the AS2 specimens. This is expected since according to the parallel axes theorem, the outmost plies have the biggest impact on spring-in. It therefore makes a difference whether these plies are of 0° or 45° orientation. While the former means very low thermal and chemical strains as well as high mechanical properties, the latter exhibits high thermal and chemical strains, accompanied by a low stiffness in matrix-dominated transverse direction. In case of the AS1 laminate, the 0° oriented plies are placed at the inner radius of the specimen. Therefore, tangential residual strains are greatly reduced on this side of the layup, leading to a smaller sample deformation. At the same time, the residual strains of the ±45° oriented plies at the outer radius result in tensional stress, which counteracts spring-in.
The influence of the stiffness is also evident in the comparison of the FCER1/T620 specimens as reported by Groh et al. 16 and shown on the right side of Figure 7. S4 and S3 layups both are purely cross-ply but the stiffness of each biaxial ply in tangential direction is much higher in case of S3 due to 90°/0° fiber orientation. This fact is confirmed by comparing S3 with S2 and S1 specimens. As more of the outmost plies are replaced with less stiff -45°/45° oriented plies, spring-in decreases. The smaller spring-in of S1 compared to S4 may be because of less transverse strain locking since the layup of S1 is not purely cross-ply. It should be noted, however, that the S4 samples show a relatively high scatter. Furthermore, the FCPUR/Panex 35 results show higher scatter than FCER1/T620 specimens although the same experimental setup was used for manufacturing. A possible reason for this may be a higher sensitivity to forces applied during specimen demolding of the PU resin. This may also be the cause of the higher scatter of the S4 series of FCER1/T620 specimens. Since this layup does not contain any fibers strictly oriented in tangential direction, matrix properties may dominate the composite's behavior in terms of persistent deformations due to additionally applied forces.
Numerical prediction of spring-in of L-section specimens
Spring-in-angles are calculated using the numerical model and homogenization formulas presented in ‘Mathematical model for spring-in prediction’ section. The nodes at the outer surface of the part are fixed during the curing step. Afterwards, the part is allowed to deform freely while it is cooled down to room temperature. The enclosed angle is calculated by at first fitting planes to each flange of the deformed specimen. From these planes, normal vectors are derived and the spring-in-angle is evaluated by applying the dot product to them.
Figure 8 shows a comparison of experimentally measured spring-in-angles and those from numerical simulations, both for FCER1 resin and T620 fibers. The simulation results are further separated in values calculated by using coefficients of CCS as measured by VI and rheometer (Rheo).
Comparison of measured and predicted spring-in-angles of FCER1/T620 specimens. Experimental values for FCER1/T620 material obtained from Groh et al.
16
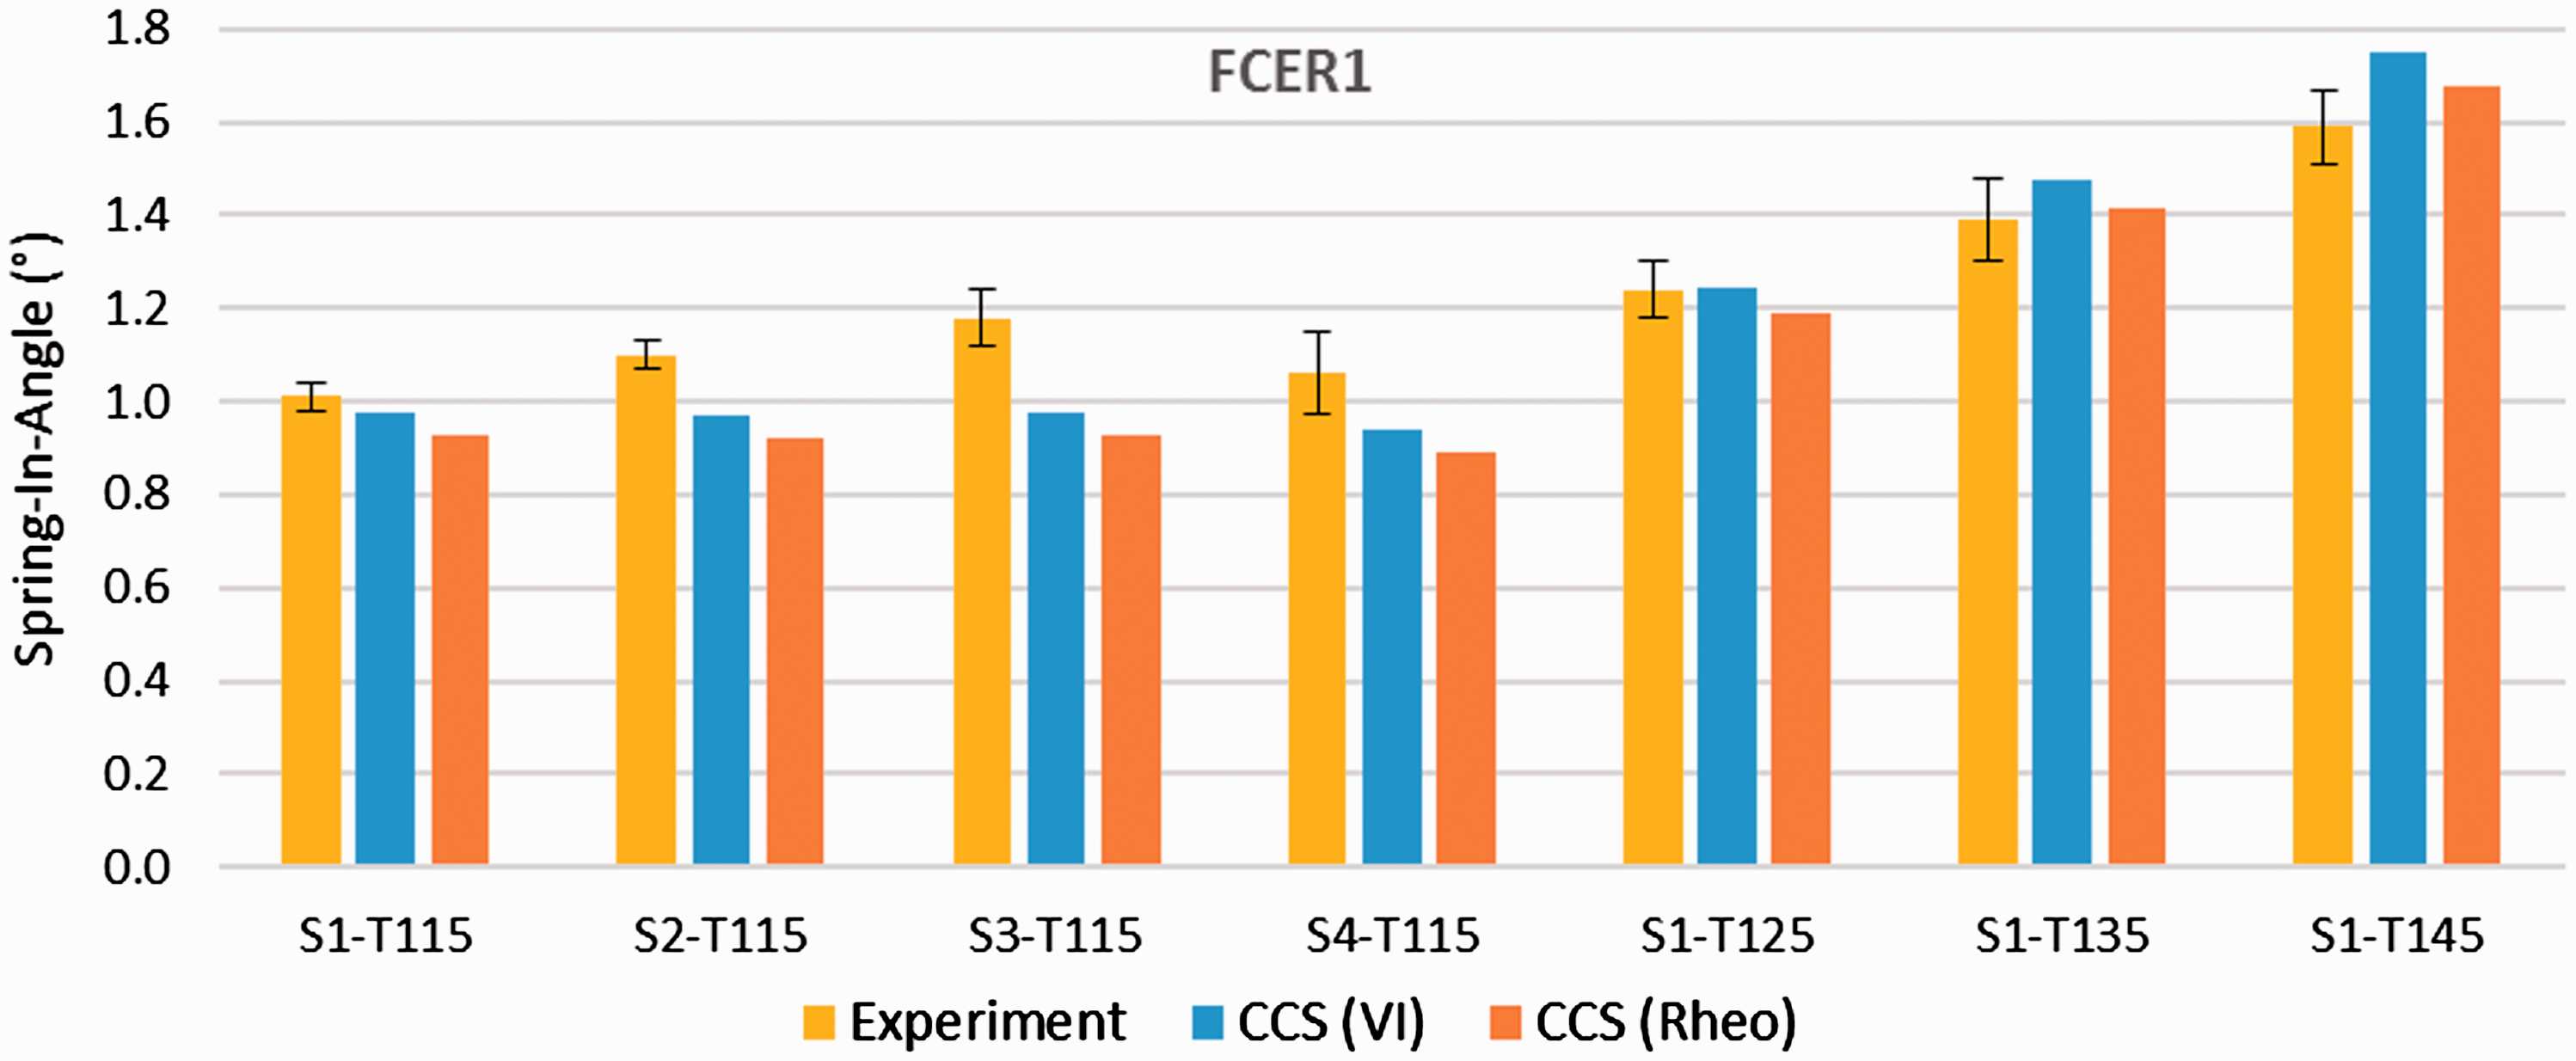
In general, good agreement is achieved between numerical results and experimental measurements. Furthermore, angles calculated using shrinkage data from VI show better accordance with experiments for all but the S1 layup series' with the highest and second highest curing temperature (S1-T135 and S1-T145). Moreover, the variation of the layup, represented by specimens S1-S4, is not captured well by the numerical results.
The comparison of experimentally measured and numerically predicted spring-in of FCPUR specimens is shown in Figure 9. Both shrinkage measurements result in about the same spring-in predictions. The pure unidirectional specimen (UD-T90) is predicted favorably. The prediction of the S1-T90 specimen yields a value that falls in between the spring-in of the specimens with PX35 and T620 fibers. The asymmetric layups lead to smaller spring-in only in case of the AS1 laminate. The prediction for AS2 laminate gives a value that is significantly higher than that of the S1 specimens. The experimental results, however, do not show this tendency.
Comparison of measured and predicted spring-in-angles of FCPUR specimens.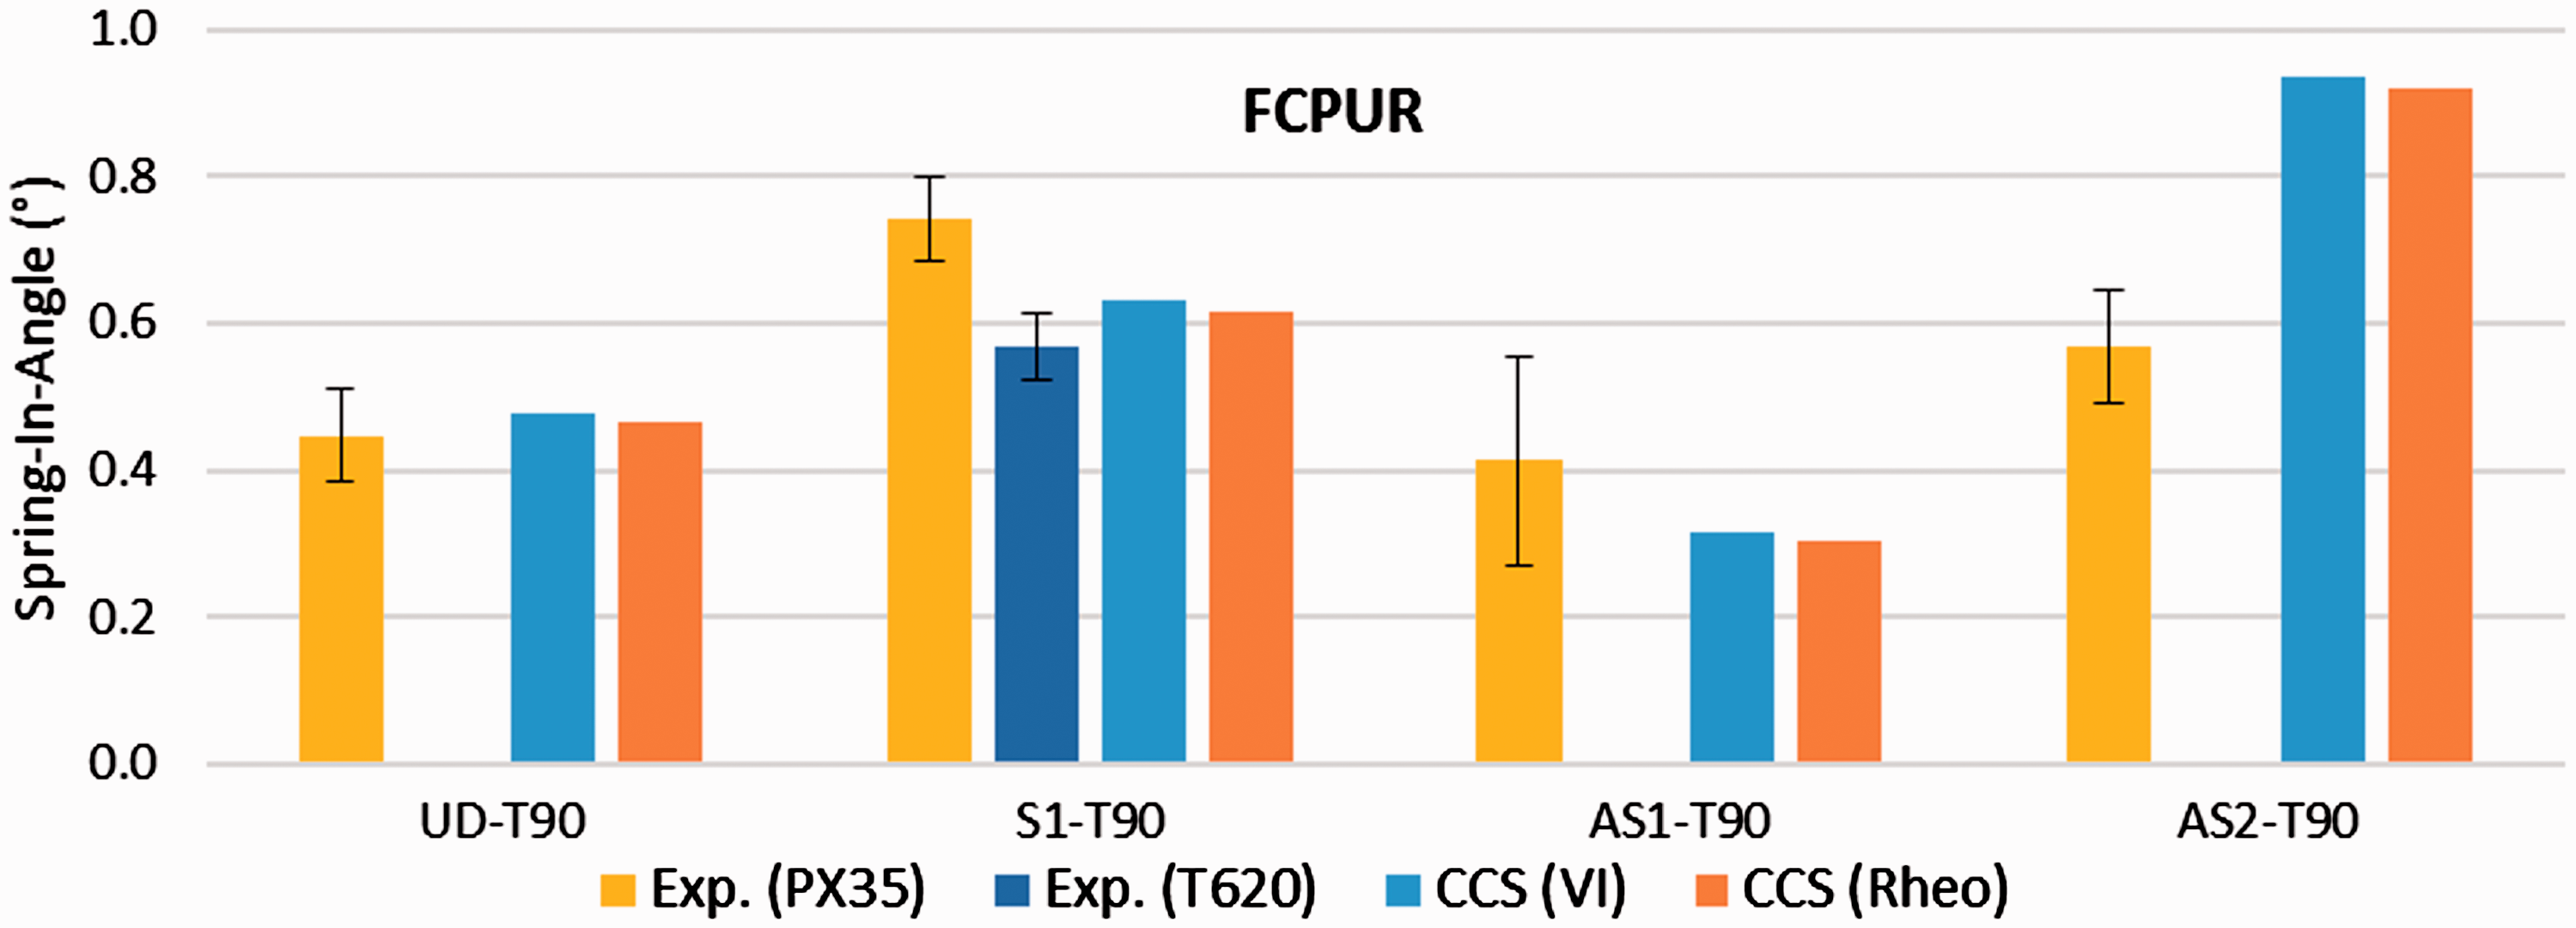
Specimens manufactured using the asymmetric layups AS1 and AS2 exhibit flange warpage. Hence, the discrepancy between experiment and simulation in case of the latter may be to some extent caused by flange warpage as this effect makes comparison more difficult due to the more complex displacement field. As shown in Figure 10, the spring-in of AS2 specimens becomes a function of the longitudinal position, at which it is evaluated. Furthermore, the applied procedure applied for spring-in evaluation involves fitting of planes to each flange of the specimen. While this is performed using GOM Inspect software for evaluation of the experiment, the result of the simulation is analyzed using Abaqus CAE/Python. Hence, the methods applied for fitting of the planes may differ. This is unproblematic as long as no flange warpage occurs. In case of layup AS1 and AS2, however, flange warpage occurs and may therefore introduce an evaluation error, leading to increased scatter or the shown discrepancy between experiment and simulation.
Comparison of experimentally measured and numerically predicted process-induced distortion of a AS2-T90 specimen.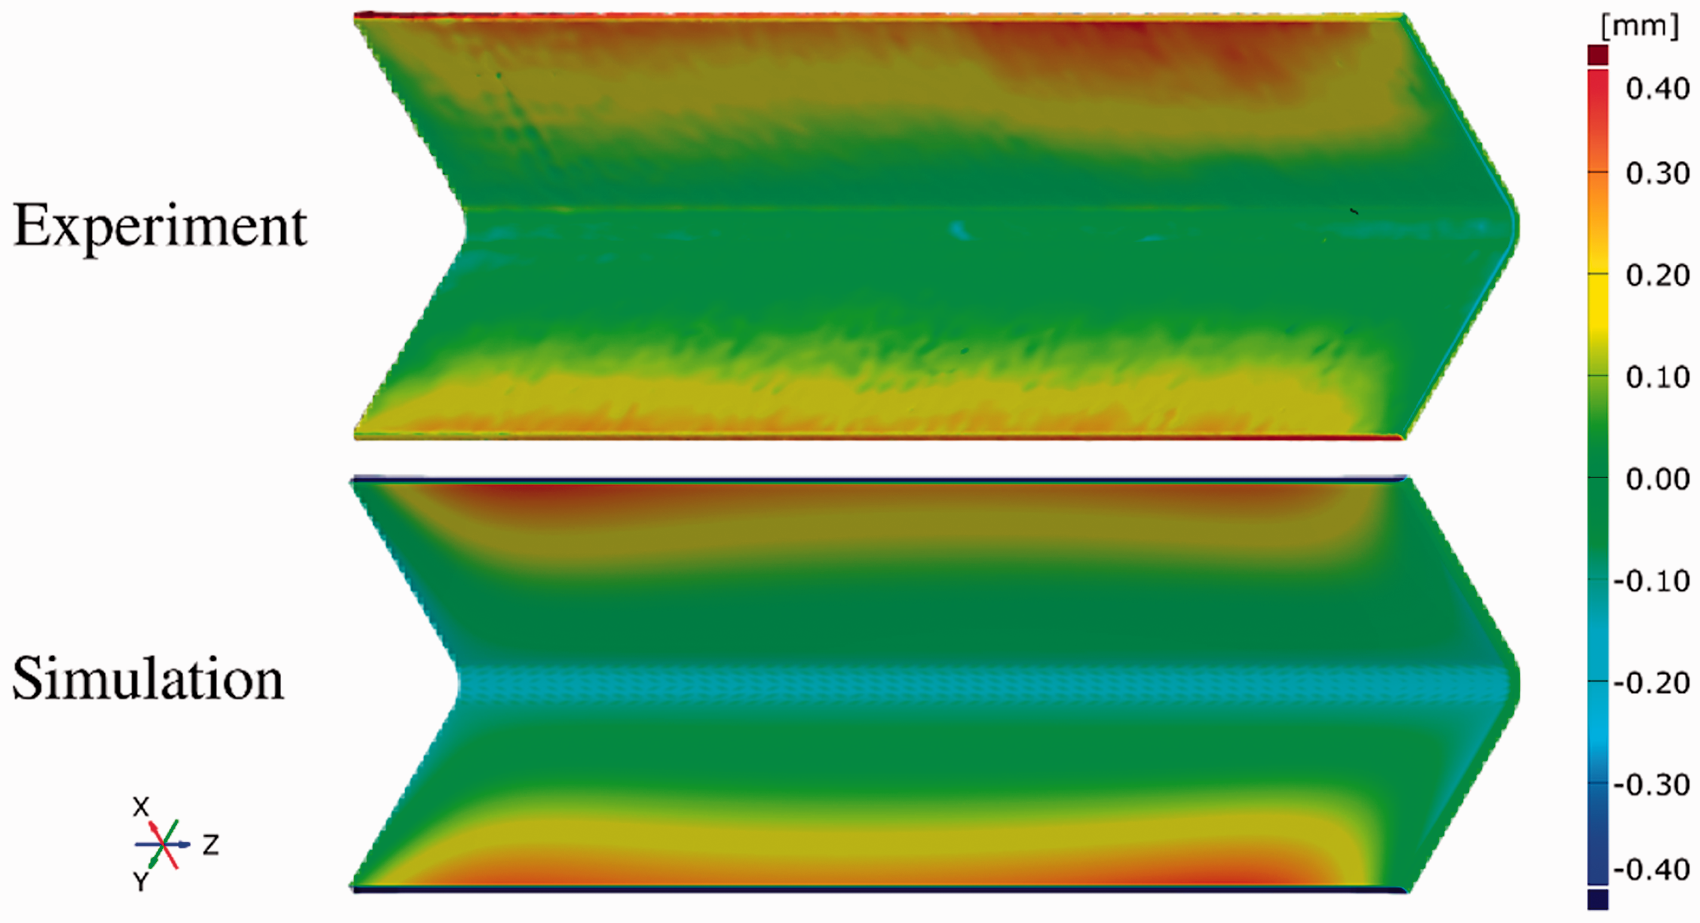
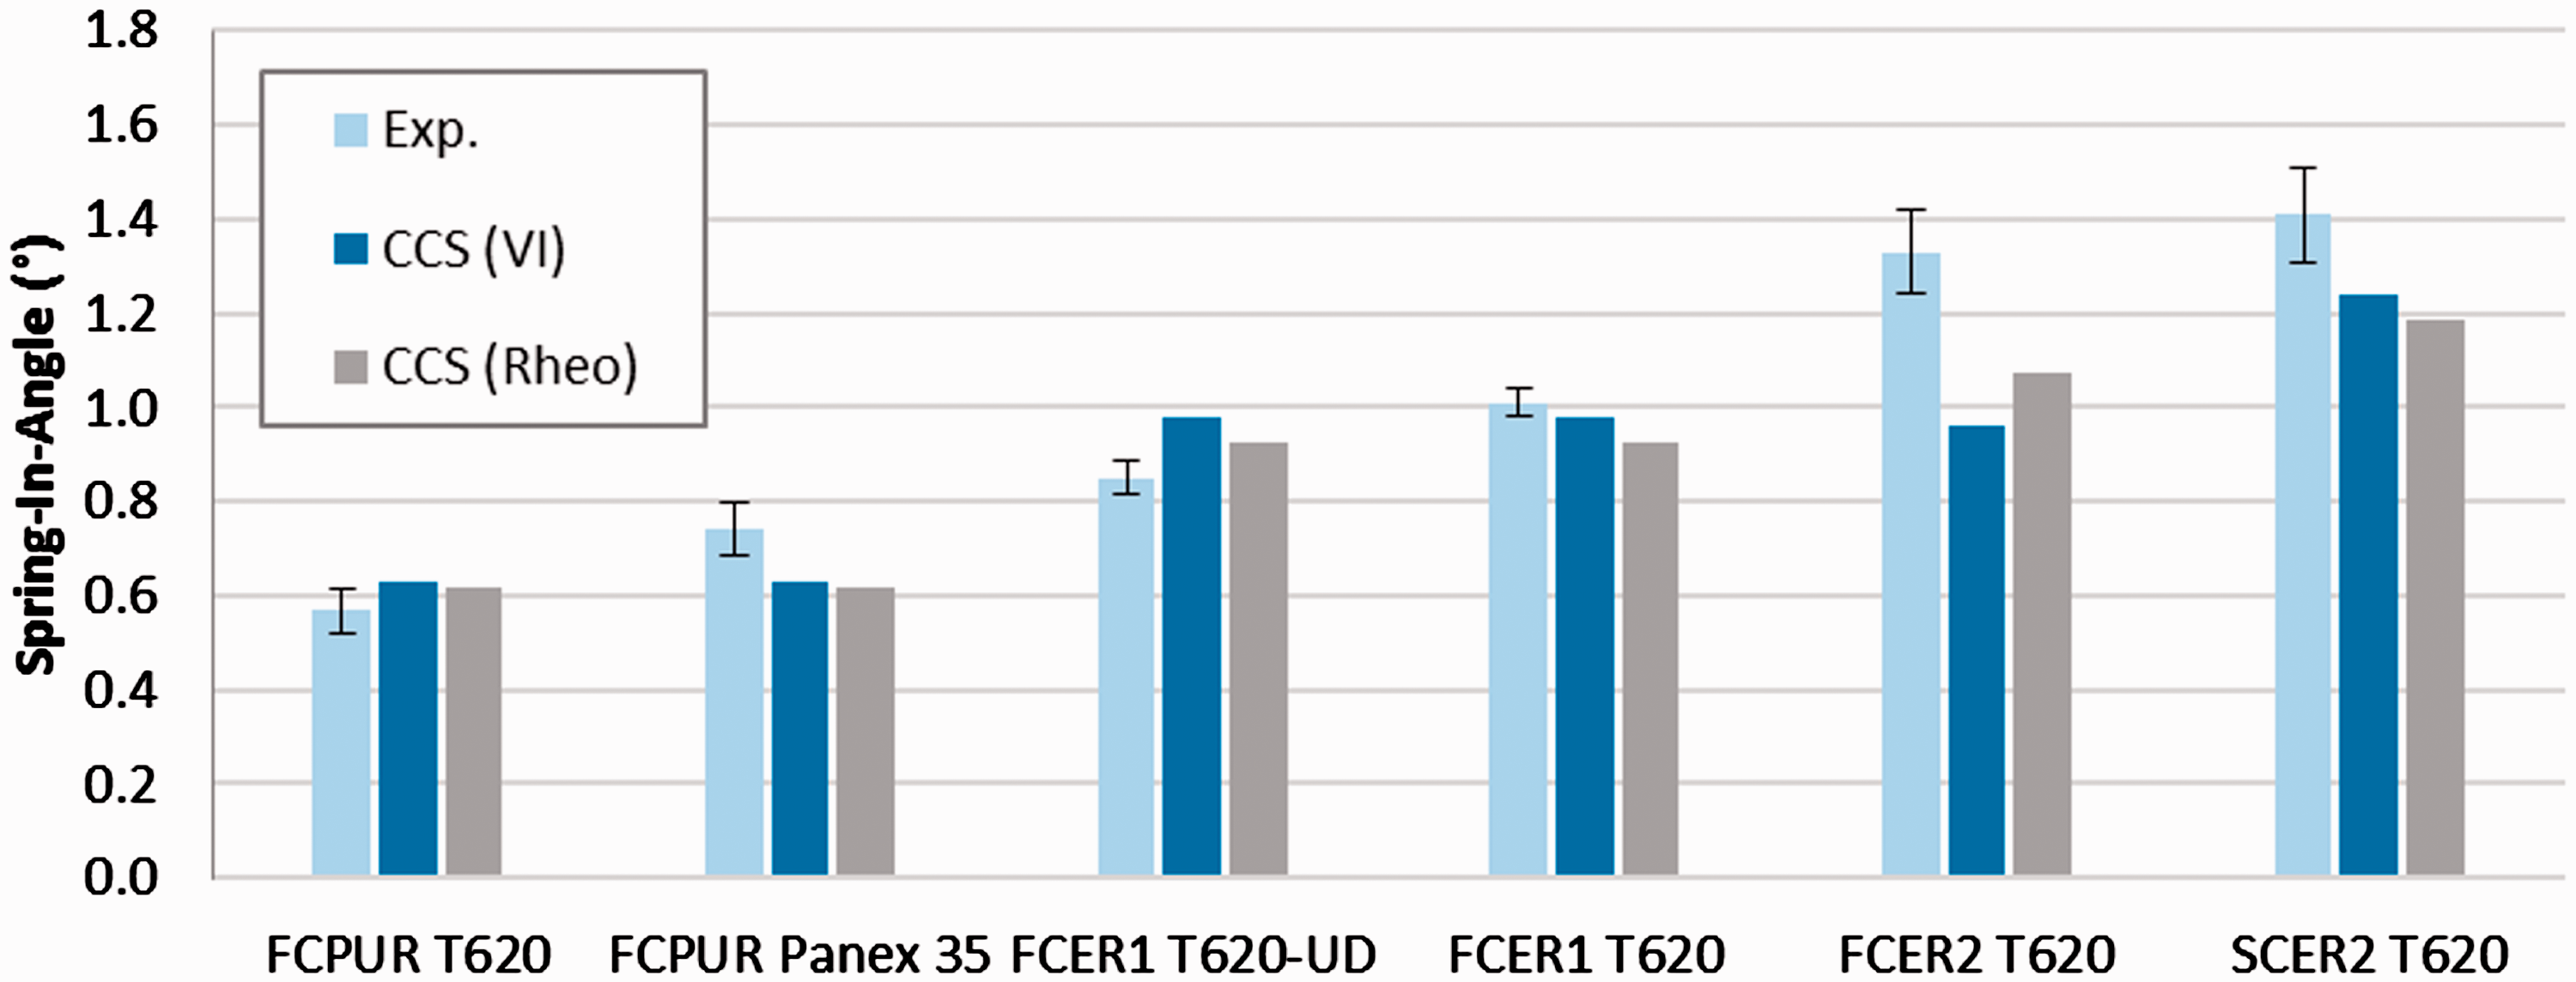
Figure 11 shows a comparison of measured and predicted spring-in of specimens with S1 layup and different resin and fiber types. The model gives good results for some of the investigated resin and fiber combinations. However, it lacks flexibility regarding fiber textile properties and therefore is not able to show the influence of different sewing patters or threads. Moreover, the higher spring-in of FCER2/T620 compared to FCER1/T620 cannot be explained with a difference in any of the material properties investigated in this study. A possible reason for this deviation may be due to differences in the relaxation characteristics of the resins. Since an elastic model is used in this study, this cannot be accounted for by the simulation.
Comparison of measured and predicted spring-in of specimens with S1 layup. Experimental values of FCER1/T620 and SCER2/T620 material obtained from Groh et al.
16
Influence of micro-mechanical model on spring-in prediction accuracy
The use of analytical micro-mechanical models is convenient since they enable to model the cure dependency of the resin's modulus separately and prior to homogenization. When using RVE technique, this is more difficult to achieve since homogenization is carried out numerically and each homogenized parameter set belongs to a specific material state. However, RVE modeling is considered more accurate than micro-mechanical models. Furthermore, many different variants of the latter exist, which makes it difficult to choose a suitable one. In this section, a simplified process-simulation is presented in order to compare predictions of different analytical models. In each simulation, a fully cured L-section specimen (
Figure 12 shows the resulting spring-in angles of the specimens when using different homogenization techniques. The table below the diagram lists the methods used for homogenization of the CTE as well as the elastic properties, from which the components of the stiffness tensor Comparison of different homogenization methods and the impact on the resulting spring-in due to cooling of the specimen by 100℃ while the resin is in glassy state.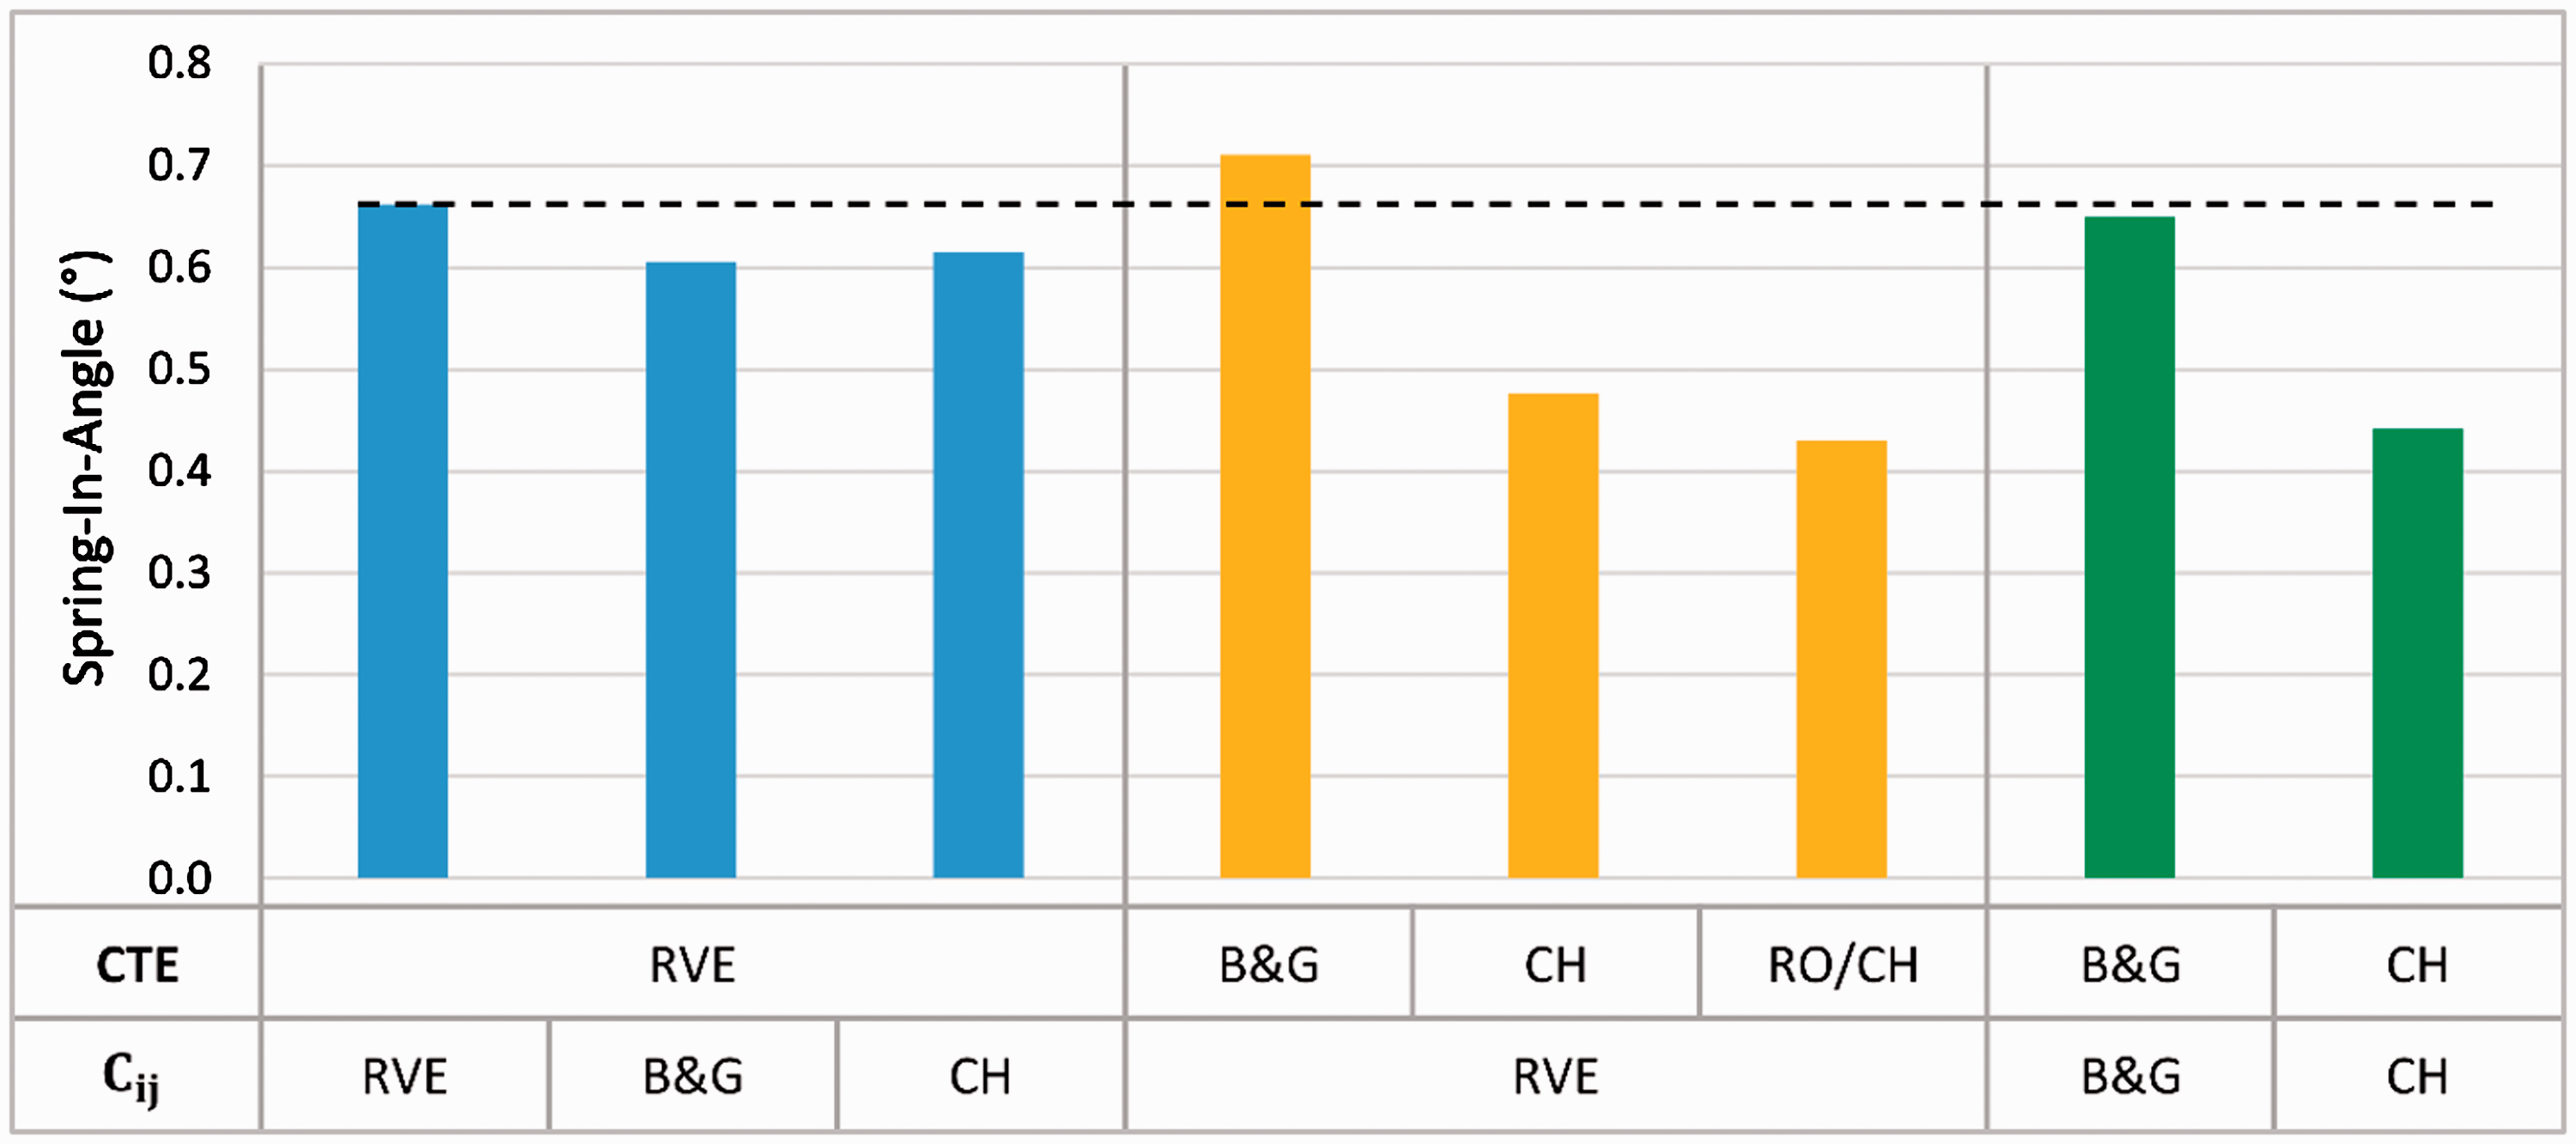
Unidirectional ply properties homogenized using different numerical and analytical methods.
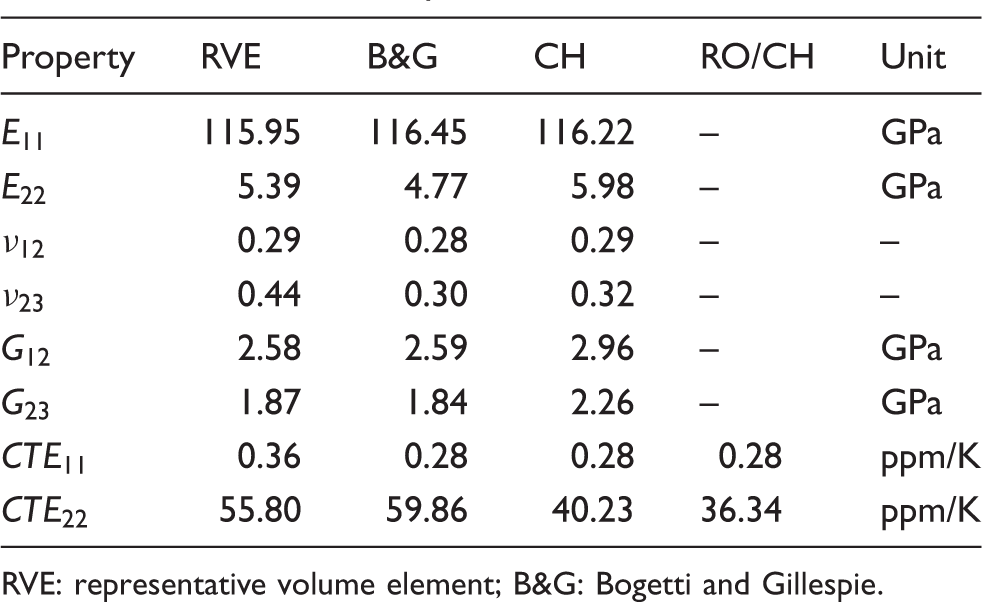
RVE: representative volume element; B&G: Bogetti and Gillespie.
Conclusion
The materials examined in this study show no notable differences in thermal expansion and effective CCS that could explain the variations in spring-in observed in the experiments. The most determining quantity therefore is reaction temperature which explains why the PU shows the lowest spring-in of all investigated resins. However, this conclusion is only valid if the reaction temperature remains lower than the ultimate glass transition temperature
Characterization of CCS using VI yields better results compared to values from rheometer measurements since the latter is sensitive to both gap size and diameter of the parallel-plate setup. On the other hand, VI does not provide the effective shrinkage and therefore separate measurement of the point of gelation is required to calculate the effective shrinkage that eventually causes spring-in.
Comparison of experimental and numerical results shows good accuracy for many of the investigated specimens. However, it also reveals some shortcomings of the used simulation method. Altering the layup in the experiments shows a significant influence on spring-in, which is not reproduced by the simulations if the laminate remains symmetric. Contrary to this, sensitivity of the model is too high in case of asymmetric layups. However, the discrepancy between simulation and experiment in case of the latter may also arise from evaluation errors introduced by flange warpage. Furthermore, the experimental results indicate that the choice of fiber textile has a strong influence on spring-in. This difference remains when exchanging biaxial with unidirectional textile, which both use the same fiber type. This therefore implies a dominance of the sewing and possibly of the type of sewing thread used.
Choosing an appropriate micro-mechanical model for homogenization of unidirectional ply properties is vital as this can have a significant impact on predicted spring-in angles. Furthermore, the method used for homogenization of CTE and CCS is found to have more influence on prediction quality as that used for homogenization of mechanical properties. Regarding the latter, the Poisson's ratio
Footnotes
Declaration of Conflicting Interests
The author(s) declared no potential conflicts of interest with respect to the research, authorship, and/or publication of this article.
Funding
The author(s) disclosed receipt of the following financial support for the research, authorship, and/or publication of this article: Part of the presented study was financially supported by the German Federal Ministry of Education and Research (BMBF) within the project SMiLE, which is gratefully acknowledged. Furthermore, the presented numerical method for spring-in prediction was developed within the Priority Program (SPP) 1712, founded by Deutsche Forschungsgemeinschaft (DFG), which is gratefully acknowledged.