
Abstract
Voids, the most studied type of manufacturing defects, form very often in processing of fiber-reinforced composites. Due to their considerable influence on physical and thermomechanical properties of composites, they have been extensively studied, with the focus on three research tracks: void formation, characteristics, and mechanical effects. Investigation of voids in composites started around half a century ago and is still an active research field in composites community. This is because of remaining unknowns and uncertainties about voids as well as difficulties in their suppression in modern manufacturing techniques like out-of-autoclave curing and parts with high complexity, further complicated by increased viscosity of modified resins. Finally, this is because of the increasing interest in realization of more accurate void rejection limits that would tolerate some voidage. The current study reviews the research on formation, characterization, and mechanical effects of voids, which has been conducted over the past five decades. Investigation and control of void formation, using experimental and modeling approaches, in liquid composite molding as well as in prepreg composite processing are surveyed. Techniques for void characterization with their advantages and disadvantages are described. Finally, the effect of voids on a broad range of mechanical properties, including inter-laminar shear, tensile, compressive, and flexural strength as well as fracture toughness and fatigue life, is appraised. Both experimental and simulation approaches and results, concerning voids' effects, are reviewed.
Keywords
Introduction
Fiber-reinforced composites (FRCs) are used in lightweight structural applications by virtue of their superior mechanical properties and lightness. Manufacturing defects are one of the main factors that deviate the mechanical properties of FRCs from the expectations. They are defined as irregularities that cause the composite properties to depart from designed specifications. With this definition, defects must be clearly distinguished from damage. Damage refers to the irregularities that appear only after the composite is loaded. For example, matrix cracks and delamination caused by loading are damage, and matrix cracks induced by thermal stresses should be considered as defects. Some studies define another type of anomaly in FRCs, named design features, which are micro- and meso-structures that form unavoidably due to geometrical aspects of the part, e.g. fiber misalignments or tow distortions formed at corners and sharp curves. The key to identify a manufacturing defect is to check if it could be eliminated with manipulation of processing parameters. 1
Defects can be classified, based on their location, into matrix, fiber, and interface defects. 2 Fiber defects include fiber waviness and misalignment and broken fibers (due to fiber curving during manufacturing, friction in the textile machine, etc.), interface defects include initial fiber/matrix debonding and interlaminar delamination, and matrix defects include incomplete matrix cure, and voids. Voids, i.e. regions unfilled with polymer and fibers, are one of the most significant defects. Their significance is due to their considerable effect on a wide range of composite properties and mechanisms leading to failure as well as to their high formation probability in different manufacturing techniques. As a result of their importance, voids are by far the most studied manufacturing defect.
Although void content has been identified in many studies as a parameter influencing mechanical properties, it has been proven that an accurate analysis of voids' effects needs to also account for other void characteristics such as their shape, size, and location. To better understand the effects of voids, one must evaluate their characteristics in correspondence with their formation. The evaluation of the effects of voids started in the 1960s, but it is only in the 1980s that researchers started a systematic analysis of void formation. Both fields of research are still among the most active research areas in composites science. This has several noteworthy reasons. Firstly, both formation and effects of voids are not yet completely understood. Secondly, modern manufacturing techniques such as out-of-autoclave (OoA) curing and automated prepreg laying that target lower production costs and time and higher accuracy are confronted with voidage as one of their main issues. Thirdly, with the increased viscosity of modified polymers and the higher complexity of parts in recent composite structures, the evacuation of voids becomes more difficult. 3 Finally and importantly, producing a defect-free composite is highly expensive while often not needed. In order to minimize the manufacturing costs, a performance assessment strategy based on characterization of defects and quantification of their effects is required. This needs the manufacturing process to be quantified with parameters that can be varied to minimize the cost, yet fulfilling the mechanical requirements, a paradigm called defect damage mechanics by Talreja.4,5 This is in particular important for industrial applications, such as automotive, marine, and renewable energy industries, which are more sensitive to manufacturing costs. 6
Analysis of the bibliographic data in Science Citation Index shows that the number of publications per year satisfying the search criterion “(void* and composite* and fib*) or (porosity* and composite* and fib*)” has increased from two publications in 1989 to 554 publications in 2016. This number was on a constant level of about 100 publications per year in 1997–2005, with a sharp increase in 2006–2016, in which period the number of papers per year almost quadrupled. Dividing the number of publications for the search criterion mentioned above by the number of publications for the search criterion “composite* and fib*”, per year, an approximation of the fraction of publications on void/porosity in total publications on FRCs is obtained. A similar trend is observed for this fraction, starting from 0.61% in 1989 to 5.20% in 2016. The present report covers the period from the early papers of 1960s to the most recent publications.
Realizing the importance of voids in FRCs, an extensive analysis of the performed and ongoing research on voids is greatly needed. Despite the need, such a study does not exist. There are several reviews (some of which are outdated) that cover specific aspects related to voids, for instance the voids' effects on mechanical properties (1978), 7 defects in general and their detection (1988, 1992),8,9 non-destructive characterization techniques (2004), 10 void formation in liquid composite molding (LCM) (2011), 11 automated prepreg laying (2012), 12 and OoA curing (2015). 13 In the current paper, we present a comprehensive review of nearly half a century of research on voids in FRCs, including their formation, characteristics, and effects, allowing the evaluation of the famous materials science triangle of Processing–Structure–Property for these features. Additionally, advances in characterization techniques for voids are presented.
The review is rather extensive. It includes the following sections: 1) Introduction, 2) Void formation, causes, and control, 3) Characterization of voids, 4) Void characteristics, 5) Effect of voids on mechanical properties, 6) Numerical modeling techniques in studies on voids, and 7) Conclusions. The Void formation section covers Liquid composite molding and Prepreg technology. In the Characterization of voids section, different techniques, including Density determination, Microscopy, Ultrasonic testing, and X-Ray micro-Computed Tomography, are addressed. The Void characteristics section covers Void content, Void shape (morphology), Void size, and Location and spatial distribution. In the Effect of voids on mechanical properties section, different properties are investigated, including Inter-laminar shear strength, Tensile properties, Compressive properties, Flexural properties, Transverse cracking, Inter-laminar fracture toughness, Impact performance, Fatigue behavior, and Hygrothermal effect on mechanical properties. The Numerical modeling techniques in studies on voids section addresses Prediction of void effects in the elastic regime as well as Strength prediction with voids.
Void formation, causes, and control
Formation and evolution of voids during processing of FRCs are not the same for all manufacturing techniques due to the difference in thermodynamic and rheological phenomena happening in these processes. The emphasis is also different. For example, in LCM void formation and evolution are broadly studied, whereas in autoclave curing, more attention is paid to the voidage in final parts, rather than to the evolution of voids during the process. In more recent manufacturing processes, such as OoA processing and automated prepreg laying, the formation of voids has also become a point of interest.
Liquid composite molding
Formation of voids
LCM is a process for manufacturing of thermoset composites through liquid resin infiltration into fibrous preforms. The term covers a large group of processing techniques, of which the most well-known ones are resin transfer molding (RTM) and vacuum-assisted resin transfer molding (VARTM). In LCM processes, there are several causes for void formation such as mechanical air entrapment during resin flow (main cause), 14 gas created due to chemical reactions during cure, 15 and nucleation of dissolved gases in the resin. 16 The air entrapment is mainly due to the inhomogeneous fiber architecture, resulting in non-uniform permeability of the fiber preform, which causes local variation in resin velocity. This local velocity variation is exacerbated by the capillary effect, prevailing at the micro-scale. 17
Owing to the multi-scale nature of FRCs, the voids can be formed in three different scales: macro, meso, and micro. Micro-voids are formed in between the fibers in a tow, meso-voids in between the tows, and macro-voids in a larger zone of the preform (observable with the naked eye). Micro-voids are smaller than meso-voids in transverse cross-section, while are usually larger in planar view (Figure 1(a)). Micro- and meso-voids formation is controlled by the micro-scale flow at the tow level relating to the heterogeneous medium of the preform, whereas macro-voids form with regard to the macroscopic (global) flow considering the preform as a homogeneous medium. The macroscopic and micro-scale flows are strongly coupled, interacting with each other.
11
(a) Schematic of void formation during longitudinal and transverse flow in liquid composite molding of a dual-scale fibrous preform, exhibiting the competition between the viscous flow and the capillary flow – inclined arrows show the transverse impregnation of the tow; micrographs showing (b) micro- and (c) meso-voids inside and between tows, respectively
18
; (d) schematic relationship between void content and the modified capillary number introduced in equation (4), showing an optimum capillary number for achieving minimum voidage.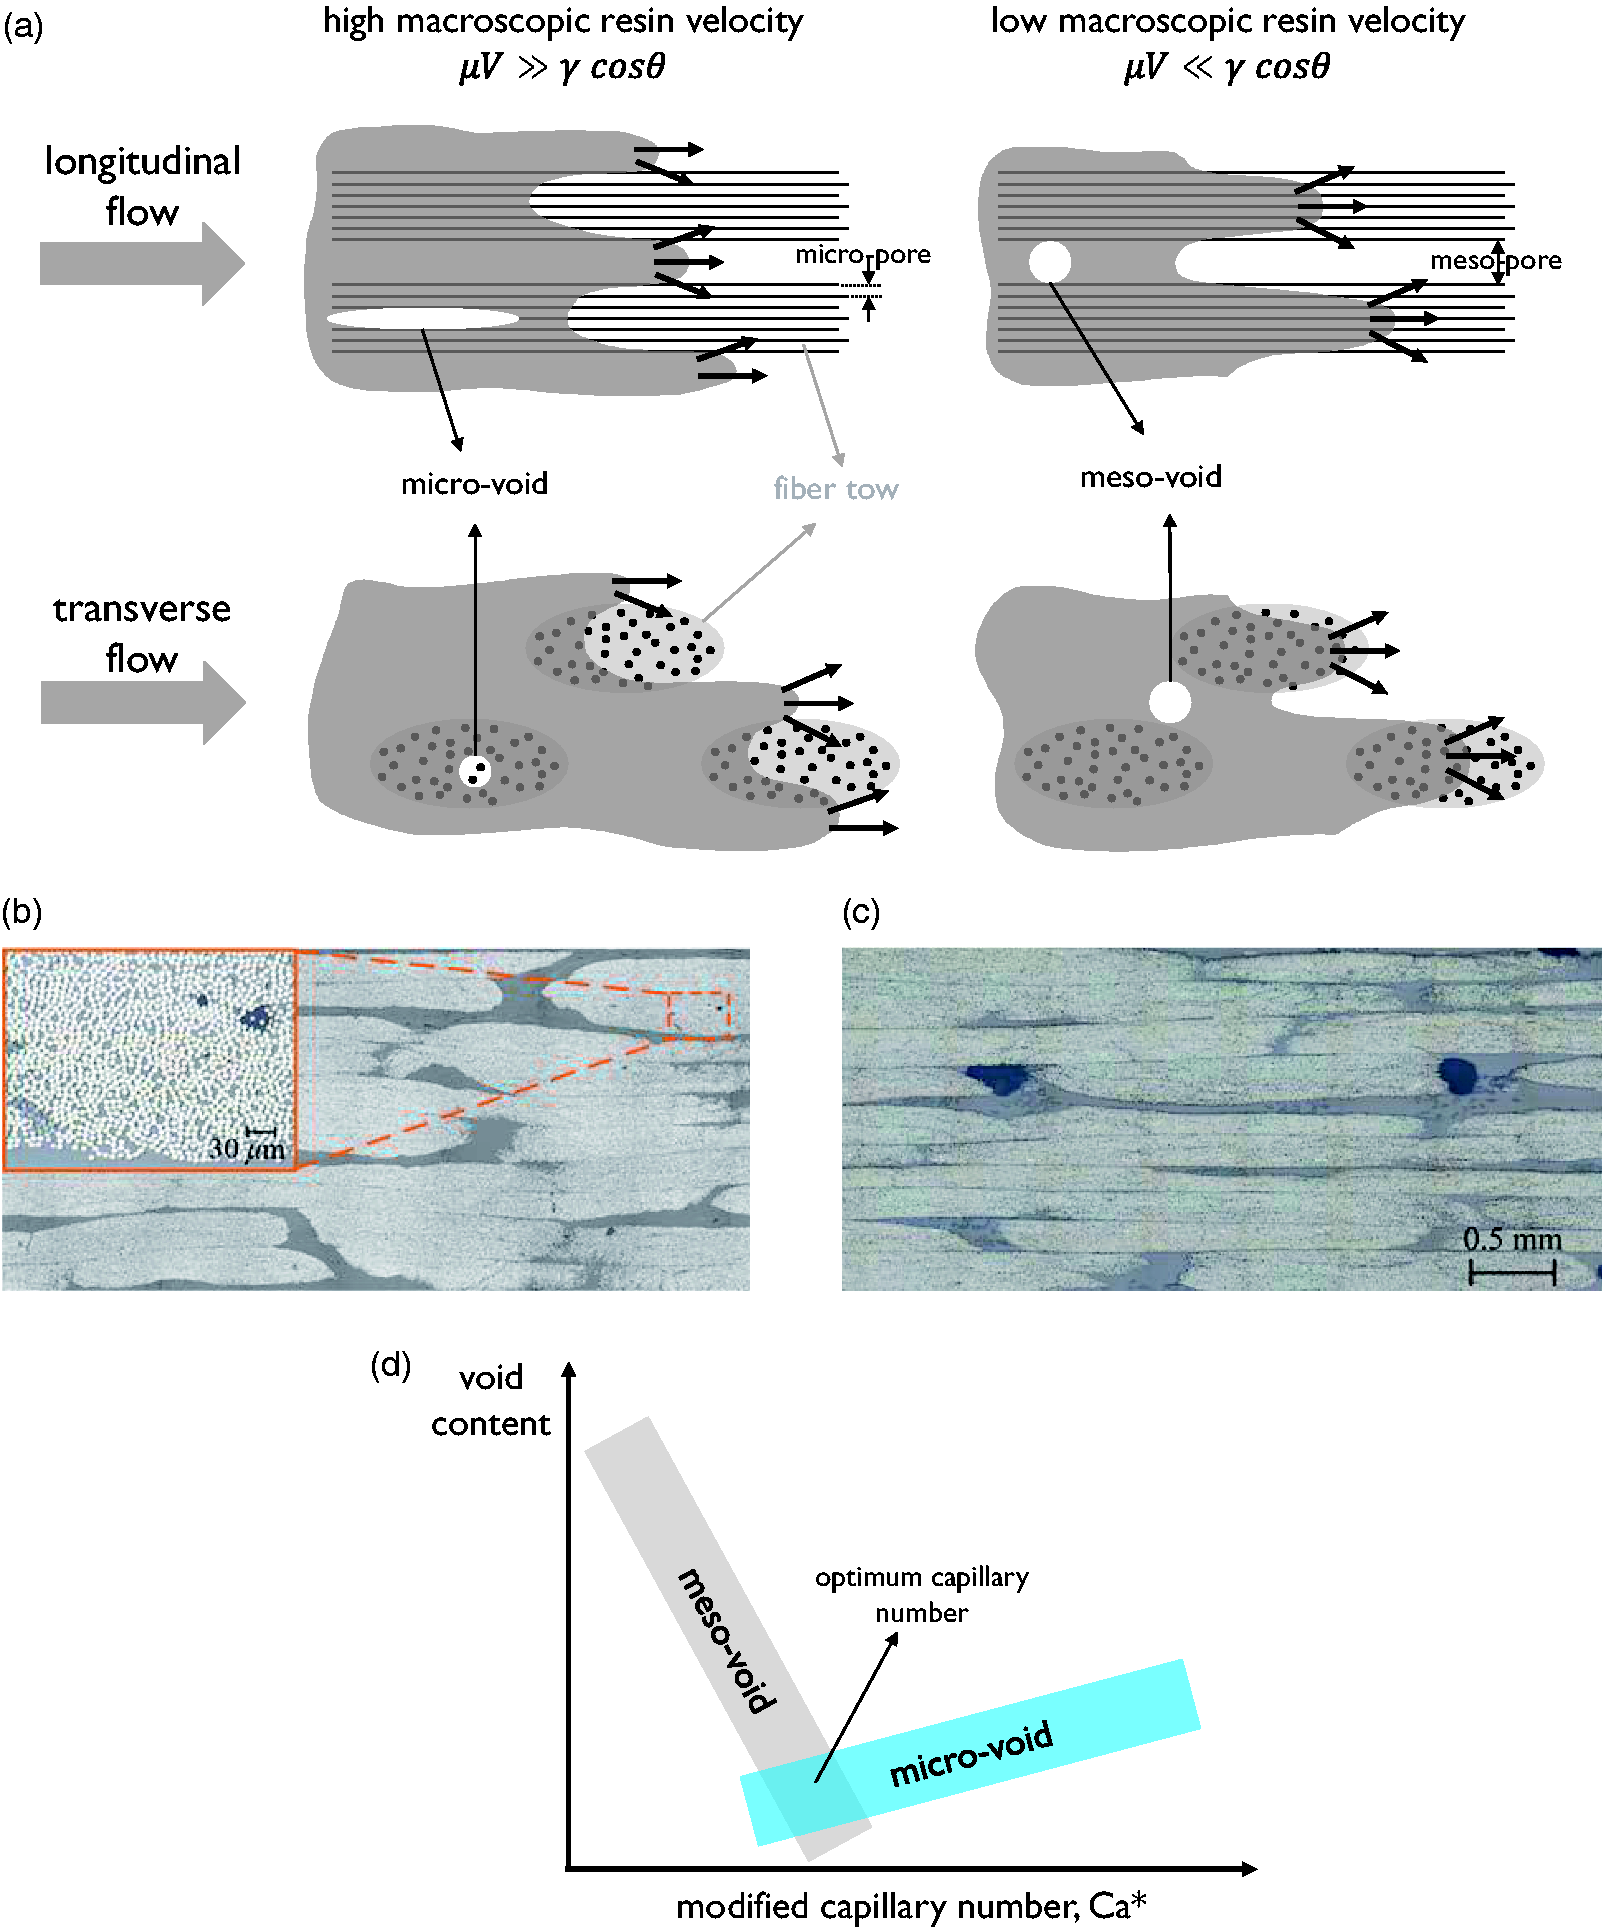
In the literature, the voids with the same scale are sometimes differently called. For instance, another name for macro-void is “dry spot”, for meso-void is “inter-bundle”, “inter-tow”, or “channel” voids, and for micro-void is “intra-bundle”, “intra-tow”, or “tow” voids. 11 Moreover, meso-voids are sometimes incorrectly called macro-voids. In the present review, the terminology introduced in the beginning of this paragraph is used. Furthermore, terms “pore” and “porosity” that are used in many studies to refer to voids are changed to “void” and “voidage”, respectively, in order to ensure consistency. “Pore” is used here to specify the empty regions in the reinforcement structure, before impregnation and “porosity” refers to these before-impregnation pores.
Formation of macro-voids: A macro-void is a zone that has not been impregnated by the macroscopic resin flow yet, while the resin flow front has reached the vent.
19
This type of void, observable even with the naked eye, is induced by distorted flow patterns, due to irregular permeability of the preform, improper injection locations,
20
or the presence of inserts, ribs, and cores in the mold.
21
The formation of the macro-voids is often modeled by a conventional mold-filling approach for a saturated flow, where a moving distinct edge (the flow front) divides the domain into two regions: saturated and unfilled.
22
This simulation approach is based on substituting the Darcy’s law
23

Liu et al. 21 presented a simulation feature in the Liquid Injection Molding Simulation (LIMS) software tool 25 to numerically predict the location, size, and pressure of all dry spots formed during the filling process, by which optimal processing conditions for a controlled injection (with regard to dry spots) can be achieved. Lee et al. 20 performed a numerical simulation, based on the mass–momentum balance for modeling the macroscopic flow, to investigate a control methodology to avoid dry spots. This was performed along with a real-time control scheme, detecting the flow front with optical sensors, to obtain experimental results for validation of the model. These simulation studies suggest methodologies to achieve optimal processing conditions to minimize the formation of macro-voids.
Formation of micro- and meso-voids: Mechanisms: Although the LCM process is considered to be successful for production of parts with no visible dry spots, the impregnation of fibers inside tows can be incomplete, resulting in un-wetted fibers, potentially causing small-scale, i.e. micro- and meso-voids. 26 These voids show more complicated physics in their formation and evolution, compared to the macro-voids. Therefore, a large amount of research has been performed in this area, suggesting a dual-scale framework for the study of voids in LCM. This dual-scale voidage is characteristic for tow-based composites (short term for textile composites made of yarns, excluding unidirectional (UD) plies, random mats, and short fiber composites). It correlates with two distinct scales of gaps to be filled with the resin flow: the large gaps (meso-pores) between fiber tows and small channels (micro-pores) inside tows between individual fibers (Figure 1(a)). In fact, the fiber preform can be considered as two interacting and superimposed continuous porous media, one containing meso-pores and the other containing micro-pores. 27 According to numerical investigations by Tahir et al., 28 the macroscopic permeability of the dual-scale fibrous preforms is governed by meso-pores.
Between the tows, the hydrodynamic force drives the resin viscous flow, but between the fibers, due to the small pore diameter, the surface tension becomes significant, and thus the wicking flow due to capillary pressure becomes a dominant factor to drive the resin flow. Formation of meso- and micro-voids is controlled by the competition between the viscous flow and the capillary flow. If the capillary flow between fibers dominates the flow, the meso-pores remain unfilled, and meso-voids form between tows (Figure 1(a) and (c)). On the other hand, if the hydrodynamic flow is faster, the micro-pores remain unfilled, and micro-voids form inside tows (Figure 1(a) and (b)).
11
This competition is quantified by capillary number (
The macroscopic (global) resin flow can occur in two directions relative to the fiber direction. Through analytical modeling, it has been shown that when the flow is perpendicular to the fiber direction (transverse flow, Figure 1(a)), voids are distributed throughout the composite, 40 whereas in case of flow parallel to the fiber direction (longitudinal or axial flow, Figure 1(a)), void formation is localized at the flow front region. 41 For the parallel flow, void localization at the flow front was also experimentally observed as significantly higher void content close to the ventilation side of the laminate. 14 Some exotic angles of resin flow are also studied in literature, e.g. in the literature,42,43 which are explained further in the current section.
Various methodologies have been employed to perform in situ visualization of void formation at the flow front, during resin impregnation. They include high-resolution video-assisted microscopy, 30 video recording, 44 combination of image analysis and visualization techniques, 45 infrared thermography, 46 voltage sensor system, 37 and X-ray micro-computed tomography (micro-CT). 47 Rohatgi et al. 30 observed that for the same capillary number, the micro-void content was higher for transverse flow than for the axial flow. In a multidirectional laminate, the voidage was much lower in layers parallel to the flow, and it increased with increase in the off-axis angle, as observed through micro-CT by Sisodia et al. 48
Whether the macroscopic flow is longitudinal or transverse, the impregnation of the tows can take place in two directions: parallel (straight arrows in Figure 1(a)) and transverse (inclined arrows in Figure 1(a)) to the macroscopic flow direction. Using an analytical model, Binetruy et al. 44 concluded that for the longitudinal macroscopic flow, the tow impregnation happens mainly transverse rather than parallel to the flow.
An experimental methodology, based on capillary rise monitored by fluorescence visualization, was developed by LeBel et al. 49 to identify the capillary properties of fibrous preforms as well as the penetrativity of resins (an intrinsic property of the fluid and of the fluid–fiber interface), which were considered as the key parameters responsible of void formation by air entrapment. This technique was employed to determine a window of the optimal modified capillary number, and hence an optimal flow front velocity. They also claimed that the capillary rise analysis is more suitable for exploring the impregnation mechanisms in fibrous preforms than a separate study of dynamic viscosity, surface tension, or contact angle between fiber and resin.
Formation of micro- and meso-voids: Theory: In modeling the formation of micro- and meso-voids, unlike of macro-voids, the assumption of a distinct edge for the flow front (saturated flow) is not valid since, due to the capillary effect, there exists a partially saturated (or simply unsaturated) zone at the flow front that separates the fully impregnated zone and the unimpregnated zone. The direct consequence of this delayed impregnation is the trapped air within the preform when resin has already reached the mold exit. Therefore, a variable, called degree of saturation, i.e. the ratio of the filled volume to the total pore volume in a unit cell, is defined to take into account the delayed impregnation. The mass conservation equation at an arbitrary point reads as
50
The difficulty in this approach is that the relative permeability and the capillary pressure should be known. This is done by either experimental measurements or micro-scale simulations. 11 In the global analysis of unsaturated flow, the resin motion in the inter-tow gaps (meso-pores) is described by the Stokes flow. 22 The micro-scale flow, in small channels in between fibers in a tow, can be simulated based on the Stokes flow with distinct flow front, 22 Darcy’s law with coupling between the two flow regions, 25 or Brinkman equation. 11 The capillary rise can be modeled based on the modified Jurin’s law for dual-scale fabrics. 49
The key factors for modeling of the impregnation and void formation in LCM processes are the dual-scale nature of the porous medium and its saturation.11,33,50 This has been investigated for decades. Patel and Lee 27 proposed a phenomenological model based on a modified Darcy’s law and continuity equations inside meso- and micro-pores. Depending on the permeabilities and the capillary pressures of the pores, resin saturation distribution could be calculated with the model, and the fraction of meso- and micro-voids could be determined. Kang et al. 17 proposed a mathematical model to describe mechanisms of void formation based on a microscopically non-uniform velocity field at the front of a transverse resin flow. The model showed that for a given fiber preform, the combined effect of resin velocity and capillary pressure can be described by the capillary number. The model can predict the size and content of voids within and between fiber tows.
In addition to the modified capillary number, fabric microstructure parameters such as global and tow fiber volume fractions and macroscopic and tow permeability were found to be important in prediction of void content, according to Gueroult et al. 37 Moreover, the fabric shear angle and flow direction greatly influence the size of meso-voids, as revealed by the mathematical model based on the analysis of the resin flow velocities inside and outside fiber tows by Yang et al. 43
The effect of geometrical anisotropy, arising from the difference in geometry of fiber bundles in the warp and weft directions, on void formation in woven fabrics was investigated by Matsuzaki et al. 51 They developed a mathematical model for inter-tow (meso) void formation, which showed that optimal flow velocity and preferable flow direction change with geometric anisotropy of the fabrics. The results of this model were in agreement with their experimental results for impregnation of woven glass fabrics with an unsaturated polyester resin in the literature. 52 The same authors experimentally studied the effect of resin flow angle relative to the angle of an anisotropic fabric preform on void content. 42 They found that with changing the flow angle from 0 to 90°, void content reaches a minimum value, corresponding to the trade-off between inter-tow and intra-tow impregnation. From the observations on the change of impregnation directions with the resin flow angle, they derived an analytical model that can predict void content at any arbitrary resin flow angle as well as the minimum-void angle for a given flow velocity.
Overall, analytical models show that besides capillary pressure and resin viscosity (capillary number), fabric microstructure, fabric shear angle, flow direction, and preform geometrical anisotropy play a role in void formation in LCM. However, in case of high injection pressure, Hu et al. 53 suggested that the capillary effect is negligible. With this assumption, they developed a mathematical model, based on two simplified unit cells of multi-layer woven fabrics, to analyze the formation and size of voids. They concluded that in case of the flow in the weft direction, the void size is a function of the ratio of weft axial permeability and warp transverse permeability.
Formation of micro- and meso-voids: Numerical simulations: Void formation is also simulated numerically. In some early numerical studies, the modeling is based on methods such as Stokes/Brinkman lattice Boltzmann, e.g. Spaid and Phelan. 54 Later, numerical studies linked the microscopic capillary effect within tows to the macroscopic resin flow by means of tow saturation. Bréard et al.55,56 developed a numerical procedure to simulate mold filling, accounting for void formation. Determining the permeability of the fiber preform as a function of saturation, they concluded that the quality of LCM parts in terms of void content can be predicted by modeling the impregnation process that takes into account the dual-scale porous medium and saturation degree.
Parseval et al., 57 and Pillai and Advani58,59 proposed to use a “sink” term in the continuity equation (equation (2)) to account for the delayed impregnation of tows in numerical modeling. The name “sink” is because tows act as sinks of liquid and keep on absorbing the resin even after its front has passed them. 60 Simacek and Advani 61 modeled this sink term by appending extra one-dimensional (1D) elements to the conventional mesh in a finite element (FE)/control volume approach. They implemented the tow saturation model in the simulation package LIMS. This model was later used as a basis in various research studies on void formation for predicting dynamic void content (representing air entrapment and void motion),33,62 investigating the effect of capillary number, fiber volume fraction, and position along the injection length, 63 simulating different processing methodologies, 64 modeling the effect of capillary pressure and air entrapment on fiber tow saturation, etc. 19
The effect of surface tension (capillarity) and wetting in LCM was studied using a bifluid–solid contact model developed by Liu et al. 65 within an FE framework. They concluded that dynamics of the contact line motion needs to be considered for more accurate results. Using the boundary element method, Patiño Arcila et al. 66 simulated the impregnation process of the dual-scale fibrous preform by coupling Darcy flow in inter-tow gaps (meso-pores) with Stokes flow in intra-tow channels (micro-pores). This allowed for simultaneous fulfillment of both dynamic and kinematic interface boundary conditions at the moving flow front. The void formation was simulated in a model, where the flow direction-dependent capillary pressure was calculated without experimental factors, and the surface traction effects at the flow front were taken into account. The authors claimed that the shape of the flow front is modeled very accurately in comparison to other techniques, implementing the reconstruction of the moving boundaries. From this approach, they were able to draw some conclusions on void characteristics, namely that voids are formed at the side of the transverse tows (wefts) where the resin leaves the tow, and their aspect ratio increases as the void becomes smaller.
Numerical simulation is also a useful tool for optimization of the flow front velocity to minimize the void content.20,31 Lundström et al.
67
developed a three-dimensional (3D) numerical model for the impregnation of non-crimp fabrics (NCFs), using a network model that mimics biaxial fabrics. With the focus on inter-tow (meso) voids, it was shown that intrinsic perturbation in the bundle geometry is of high importance. DeValve and Pitchumani
36
presented a more detailed numerical simulation of the infiltrating dual-scale resin flow through the ideal architecture of plain weave fibrous preforms accounting for the capillary effects within the fiber bundles. They predicted the air entrapment locations within the fiber preform as well as the size and shape evolution of the voids, for different Capillary and Reynolds numbers, as displayed in Figure 2.
Simulation steps of resin infiltration in liquid composite molding of a woven preform, shown on 2D cross-sections for 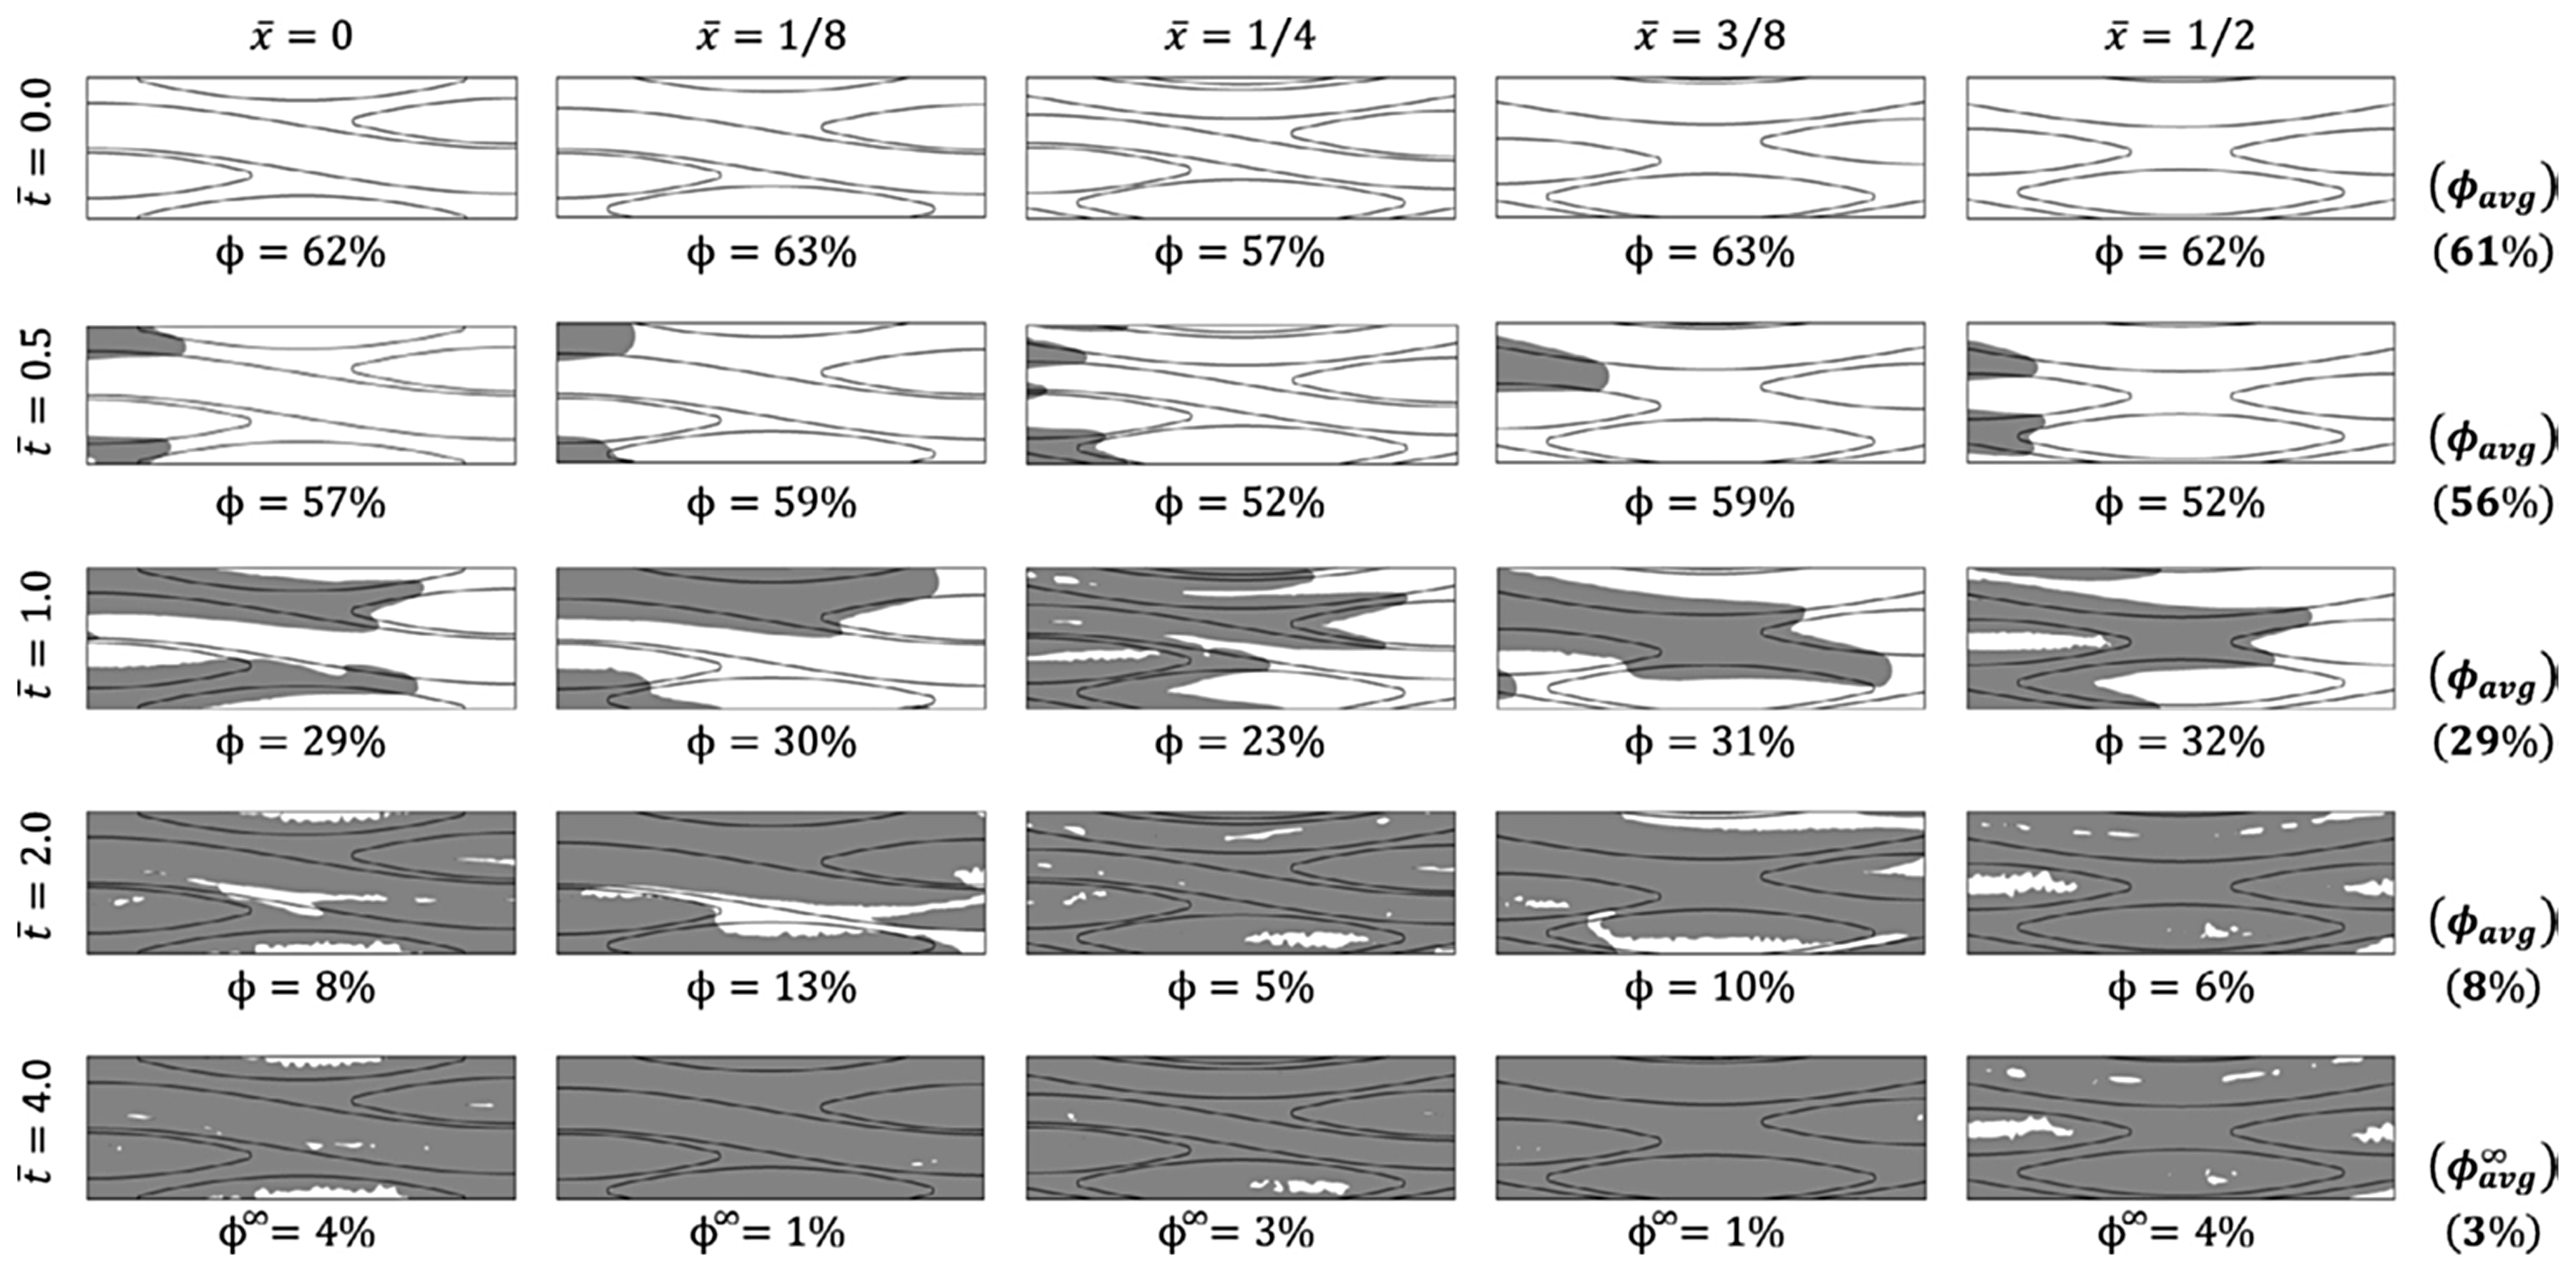
Concluding remarks on modeling of the void formation: Macro-voids, or rather dry spots, can be predicted with the state-of-the-art software, based on the solution of the Darcy equation with varying permeability over the preform because of the local preform deformations. These calculations do not ask for a detailed consideration of the preform local internal geometry and need only the local permeability as a function of the local fiber volume fraction and the local fiber direction. Such a link can be provided by analytical/numerical approximations, and the local preform compaction and distortion can be calculated using forming/draping models.
Meso- and micro-voids should be modeled taking into account the preform internal geometry, and the Stokes solution for local flow is needed, probably coupled with the Darcy approximation, in the inter-tow gaps. The key points for the prediction of void formation are modeling of a dual-scale flow, unsaturated flow, and capillary effects. The detailed modeling representing all these phenomena is appearing in the last few years, but this work is far from being finished. Approximations like “sink factor” are useful shortcuts within the existing modeling tools, but need calibration to become predictive. One can expect that in the coming decade, the progress with computational power, the numerical methods in computational fluid dynamics, and the multi-level modeling will bring the full dual-scale free surface models to the off-the-shelf simulation software.
Void compression and dissolution
After voids are created, their size and shape may change before the consolidation is finished. This can happen in two ways: they may be compressed by or dissolved into the resin. In the case of mechanically entrapped voids and no diffusion, the compression behavior of voids can be approximated by the ideal gas law 14 including surface tension and a capillary effect. 68 Therefore, for isothermal conditions, the final volume of voids can be calculated. As pointed out by Park and Lee, 11 two types of error can be introduced in such calculations: for micro-voids inside tows, the air pressure inside the voids does not increase immediately with increase in the ambient resin pressure; resin cannot permeate any further into the tow if the micro-void is already highly compacted by the resin.
In reality, molecules migrate over the void–resin interface, and the dissolution of gas into the resin takes place due to diffusion (in a steady-state situation). Lundström 68 investigated the in situ dissolution of cylindrical micro-voids, trapped between fibers, during RTM, and made a qualitative comparison with Fickian-based theoretical analysis. He found that the voids disappear in the order of minutes due to the diffusion. Moreover, not only high pressure but also high (local) flow rate and low initial gas concentration in properly degassed resin improve the dissolution of the trapped voids. However, if initial concentration of gas or water within the resin is high, the voids will grow instead of dissolving into the resin. Matsuzaki et al. 45 showed that the molecular diffusion can lead to void growth in VARTM process. The void shrinkage or expansion due to diffusion depends on whether the resin is undersaturated or supersaturated with the gas, respectively. During vacuum-assisted impregnation, resin pressure goes below the atmospheric pressure. Hence, the resin becomes supersaturated, and the gas molecules dissolved in the resin diffuse into the void, causing expansion of the void. Matsuzaki et al. 45 explained that the void content changes after void formation: voids can move with the resin flow, escape from tows to inter-tow regions, shrink due to surrounding pressure change, and grow because of the diffusion at the void–resin interface. Each of these steps may be influenced by the resin injection pressure and pressure gradient.
Yamaleev and Mohan 26 argued that diffusion-based models can only predict the voidage in the final stage and cannot be used in evaluation of the initial void dynamics. They proposed a numerical model that includes the liquid/vapor phase transition occurring in the gas mixture entrapped inside tows. It was concluded that the condensation of the gas mixture, during the microscopic impregnation process, reduces the steady-state void size considerably in comparison with that predicted by the models with the ideal gas assumption. In addition, the void formation is much faster if the real gas effects are considered. The void size predicted by such a model can be used as initial conditions in diffusion-based models like the one in the literature. 68
Void motion
Only some voids stay where they are formed and the rest move with the resin flow, in particular in axial flows where void formation occurs at the flow front. The mobility of voids can be expressed by the force balance between the drag caused by the pressure gradient across the void and the adhesion due to surface tension. 11 In general, void mobility is characterized by two non-dimensional parameters: the capillary number and the ratio of the void size to the inter-tow or inter-fiber spacing. High resin velocity, which means high capillary number, provides high mobility for voids. 11 There is a critical capillary number, above which the void becomes mobile. 27 However, Kang et al. 69 stated that a geometric hindrance force may also affect the transport of the voids, and thus geometric configuration of the mold should be considered in addition to the capillary number. About the influence of void size on its mobility, different arguments have been made.27,69–71 In general, meso-voids (between tows) may be removed easily if they move with the resin, while micro-voids (inside tows) are more difficult to remove. Rohatgi et al. 30 attributed this to the much larger gaps between the tows than those within the tows, which results in insufficient drag due to the hydrodynamic pressure to make the micro-voids mobile. Because of the difficulty in their mobilization after they are formed, it is essential to minimize formation of the micro-voids, which necessitates a proper choice of the molding conditions. Lundström 70 concluded that for removal of micro-voids, mechanisms such as compression and diffusion are more probable to occur than motion.
Frishfelds et al. 72 showed that in impregnated NCFs, voids move with the resin through the inter-tow channels, and are trapped if the channels become too narrow. The voids move, on average, biased to the direction of the tows. For the same fabric geometry, Lundström et al. 67 showed that intra-tow (micro) voids move much slower. However, it is common for them to become inter-tow (meso) voids in the case of high resin wetting of fibers.
The void mobility is the highest when it is nearest to resin flow fronts according to Gangloff Jr et al. 73 They derived a relationship between the dimensionless void size, process capillary number, and void mobility, based on a simplified model proposed in the literature. 74 By aid of synchrotron micro-CT, Vila et al. 47 performed an in situ analysis of the motion of voids during tow impregnation. They observed that voids are trapped inside tows when the distance between fibers is below a critical value. Therefore, the micro-flow and mobility of micro-voids between fibers depend on the local microstructure, mainly the local fiber volume fraction, and the presence of convergent/divergent individual fiber trajectories. Additionally, wetting between the resin and fibers and rheological properties of the resin play a significant role. Sisodia et al. 48 attributed the higher voidage in off-axis plies of a multidirectional laminate to the more difficult escape of voids with resin flow through the off-axis channels compared to that through the parallel channels with the flow.
Park et al. 35 presented an integrated modeling approach for the void formation, in the meso-pores between fiber tows and in the micro-pores inside fiber tows, as well as compression and transport of voids, which was implemented into an FE code for mold filling simulations. They showed that a partially saturated zone (bubbly zone) forms behind the macroscopic flow front. To obtain a full impregnation, they suggest to perform a bleeding process, in which by keeping the injection pressure high, and air vents open, even after the macroscopic resin front reaches the air vents, the voids in the partially saturated zone are removed.
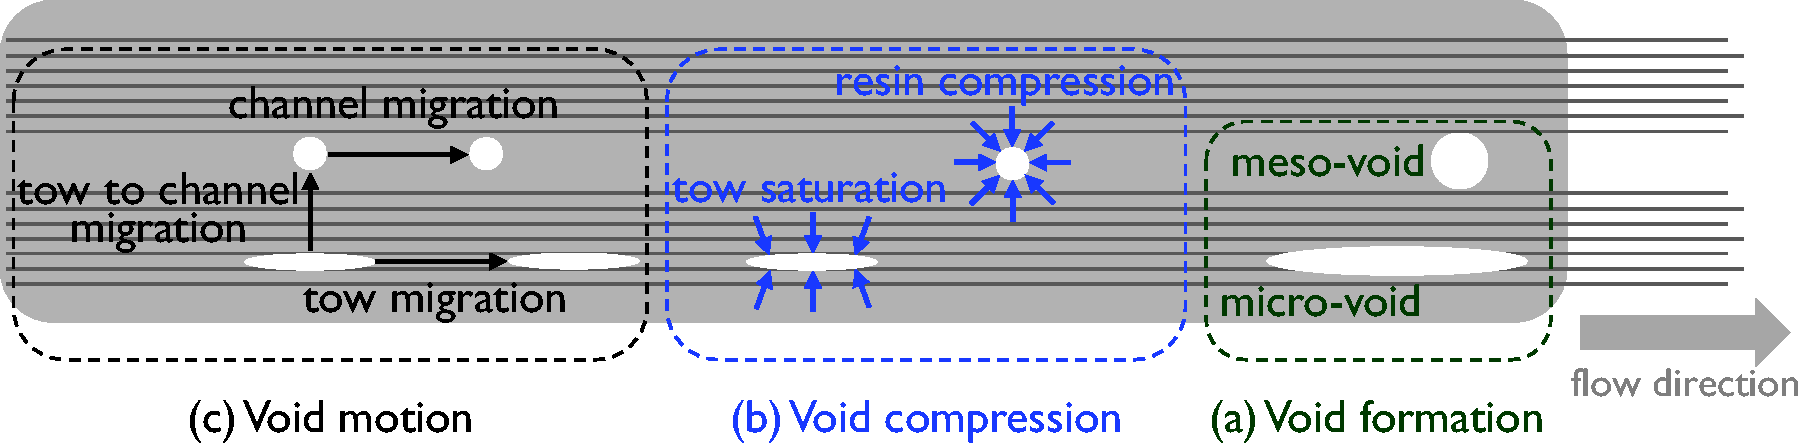
Concluding remarks on void formation mechanisms in LCM processes, and how to avoid them: In conclusion, to reduce the void content in an LCM product of a given material, the stages of formation, compression/dissolution, and motion of voids should be controlled (Figure 3). As explained above, void formation can be minimized by optimization of the (modified) capillary number. Although according to the model of Labat et al.,
75
a very high injection (inlet) pressure increases the formation of micro-voids, it is favorable for the other two stages. It can help to reduce the void size due to compression, to dissolve the voids in the resin due to increase in solubility of the gas, and to make the voids mobile due to increase in resin velocity, in particular causing the hydrodynamic pressure to overcome the capillary pressure for micro-voids entrapped inside tows.11,20
Three stages of void life during resin impregnation through a resin transfer molding process: (a) formation of micro- and meso-voids, respectively, inside and in between the tows, (b) compression of meso-voids due to increase in resin pressure and of micro-voids due to tow saturation, and (c) motion of meso-voids in inter-tow channels or of micro-voids inside tows or to the inter-tow channels – inferred from the literature.
35
Appropriate application of vacuum also can assist in reduction of voids in LCM. The effect of vacuum is explained by the reduction of air pressure, which favors the compression of the entrapped air,18,35,67,76 or by compression of the voids when the vacuum is released after injection, 14 or by high compaction of preform as a result of vacuum. 77 Vacuum may have negative effects as well. For instance, it can induce another source of voids, which is evaporation of (certain volatile components in) the resin. 18 In addition to optimization of the (modified) capillary number, increase in the inlet pressure, and application of vacuum, other treatments, such as degassing the resin prior to infusion16,68 and continuing the resin flow after the mold filling is complete (bleeding),35,64,78 are often performed to reduce the void content. Moreover, some other methods to achieve a low void content have been proposed: compressing mold walls during injection, 79 applying a permanent post-fill pressure (packing pressure) after injection,80–82 light waxing of the mold surface with buffing, applying vibration to the mold,83–85 applying sufficiently high magnetic compressive pressure, etc.86,87
However, for an accurate evaluation of the influence of processing parameters on the part quality, particularly void formation, optimization of those parameters should be performed in a set, not based on individual parameters, but taking into account any probable interdependency between the parameters. For instance, Kedari et al. 77 showed that a combination of strong vacuum and high mold temperature requires a reduced inlet pressure for minimizing the void content, in the case of impregnation of E-glass random mats with polyester. They presented a flow compatibility model to explain that there must be a different optimal inlet/outlet pressure drop of a VARTM process at a different mold temperature.
Prepreg technology
Unlike in LCM products, void formation in FRCs produced with the prepreg technology is mainly studied with the focus on the laying up and curing stages. Void formation in the impregnation stage is much less discussed in the open literature. This is because in the prepreg-based composites, the impregnation stage is typically performed by the material supplier prior to composite manufacturing. The mechanisms of void formation and growth during cure in prepreg composites are not yet fully known. 88 Available studies mainly focus on understanding of the general physics as well as correlations between the voidage in the final part and manufacturing parameters. In addition to the intra-laminar voids, inter-laminar voids are a big issue in prepreg technology, which is not the case in LCM. The main sources of voids in prepreg composites are air entrapment either during impregnation (intra-laminar void) 7 or during laying up (inter-laminar void),2,89 volatiles arising from resin during its cure, 7 and moisture dissolved in the resin. 90 The latter was the prime source in prepregs of past generations, 78 whereas modern prepregs have very small volatile and moisture contents, which makes mechanical air entrapment the chief mechanism.
Initial impregnation and the level of volatiles in the resin are the factors that can be controlled in the production of prepregs, to reduce the final voidage. The governing factors in manufacturing of composite parts are storage and conditioning of the prepregs, laying up process (controlling the level of entrapment between the plies), and curing conditions. Different manufacturing technologies should be studied separately because of the difference in their laying up and curing processes. The focus in the literature has been mainly on autoclave curing, OoA curing, and automated prepreg laying.
Autoclave curing process
One of the most common manufacturing techniques used for fabrication of high-performance structural FRCs is the autoclave curing process. This is because of the high-pressure environment in the autoclave, which results in a high fiber volume fraction, and facilitates the dissolution and removal of voids in the part. There are several models proposed for formation and evolution of moisture-based voids during cure of thermoset resins. The curing process was modeled by Loos and Springer, 91 who related the cure cycle to the thermal, chemical, and physical processes taking place during cure. They explained that after a void is formed, its size might alter due to thermal expansion, diffusion effects, or changes in the void pressure because of the changes in ambient temperature and pressure. Their model accounts for the last two mechanisms. A good agreement between the experimentally measured void contents, as a function of the cure pressure, and the void contents predicted with the Loos and Springer model is found in the literature 92 for hot-press processing.
The dissolution and growth of moisture-based voids in the prepreg during cure was described to be diffusion-controlled by Kardos et al.
90
They analyzed and modeled these phenomena as a function of temperature and pressure. The stability of voids was described with a pressure–temperature–humidity map, as exhibited in Figure 4, which determines conditions for void growth or dissolution throughout the cure cycle. Later, Boey and Lye
93
modified the diffusion-based model by a unit matrix volume, defined as the volume of resin required to produce a certain void content with a single void of a given diameter, which is a characteristic parameter for the resin.
The stability of pure-water void formation during cure of epoxy matrices, described in a pressure–temperature–humidity map.
90
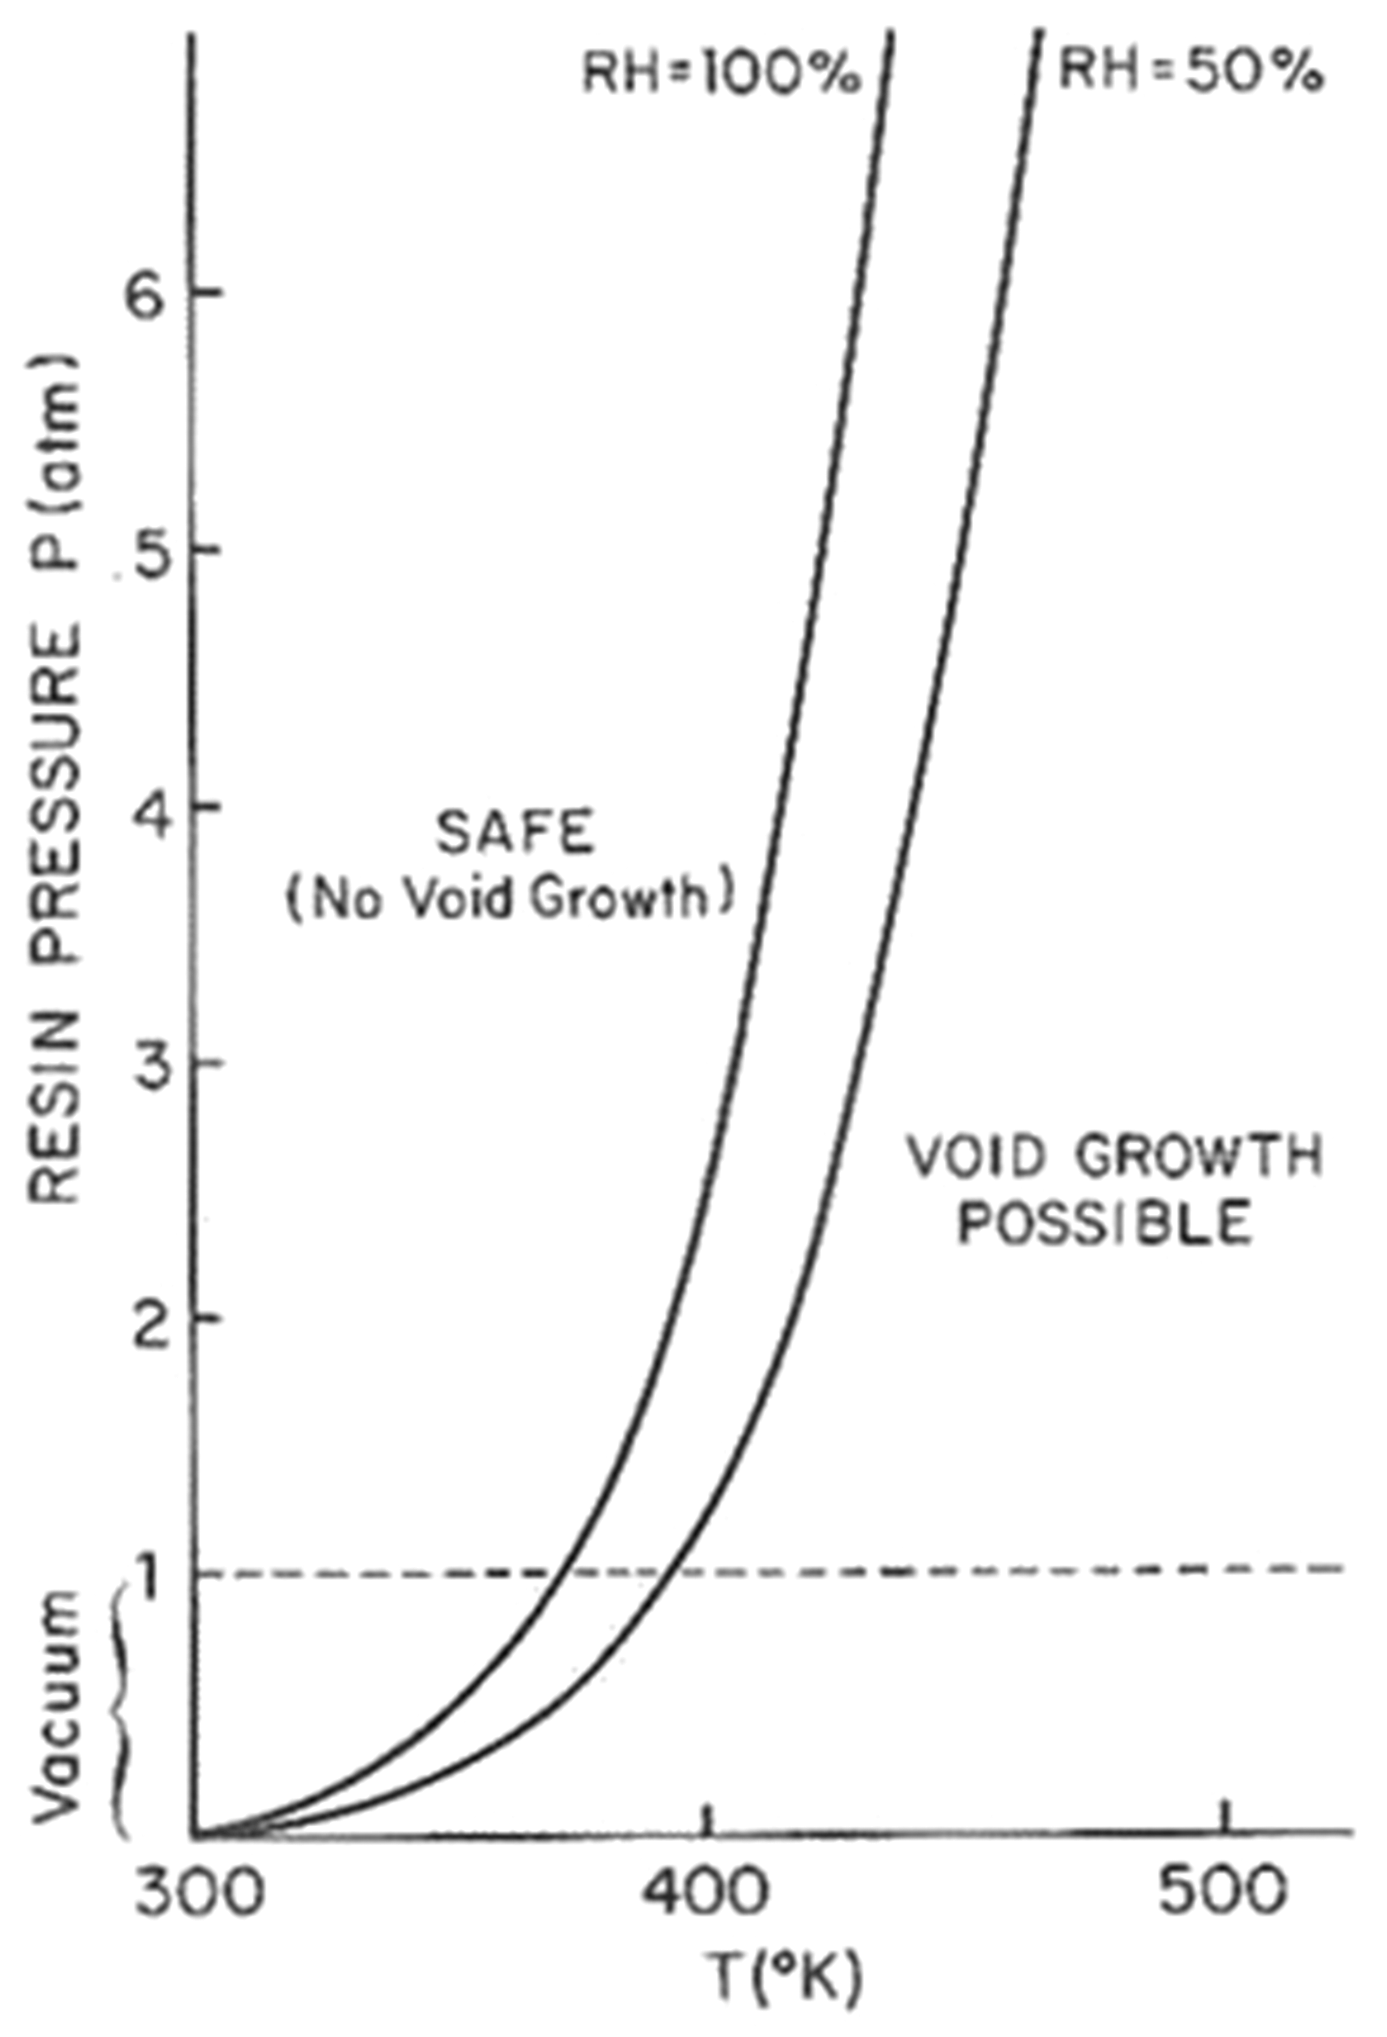
Kardos’ model, however, did not account for surface tension of the resin. This results in an unrealistic increase in the void size with temperature. Wood and Bader 94 developed a diffusion model that can predict the rate of growth or collapse of entrapped voids in the resin, with the advantage of accounting for surface tension. They concluded that voids can be collapsed, and their growth can be suppressed by control of pressure and temperature even if the resin is saturated with a gas. Other modifications were made to Kardos’ model by White and Kim 95 to model the void growth during staged curing, which is a manufacturing technique applying intermediate partial cure during laying up of thick composites. They took into account the effect of surface tension in obtaining the bubble gas pressure. Moreover, the initial bubble radius was determined by a force balance at the bubble wall. They argued that due to the cooldown in the staged cure, the decrease in partial pressure of gases inside voids causes the voids to collapse if the resin viscosity is sufficiently low.
Ledru et al. 3 argued that Wood and Bader’s model has low sensitivity to the autoclave pressure and proposed a coupled visco-mechanical and diffusion void growth model, which considers surface tension as well as pressure sensitivity. Through this model, it was concluded that there are three key parameters influencing the void size evolution: the onset of pressure application, the concentration of diffusive species, and the diffusion coefficient. They showed that the void size (radius) increases with temperature in the first stage of cure, drops with the application of pressure in the second stage, and is almost constant in the third stage (high pressure and temperature).
According to de Parscau du Plessix et al.,
96
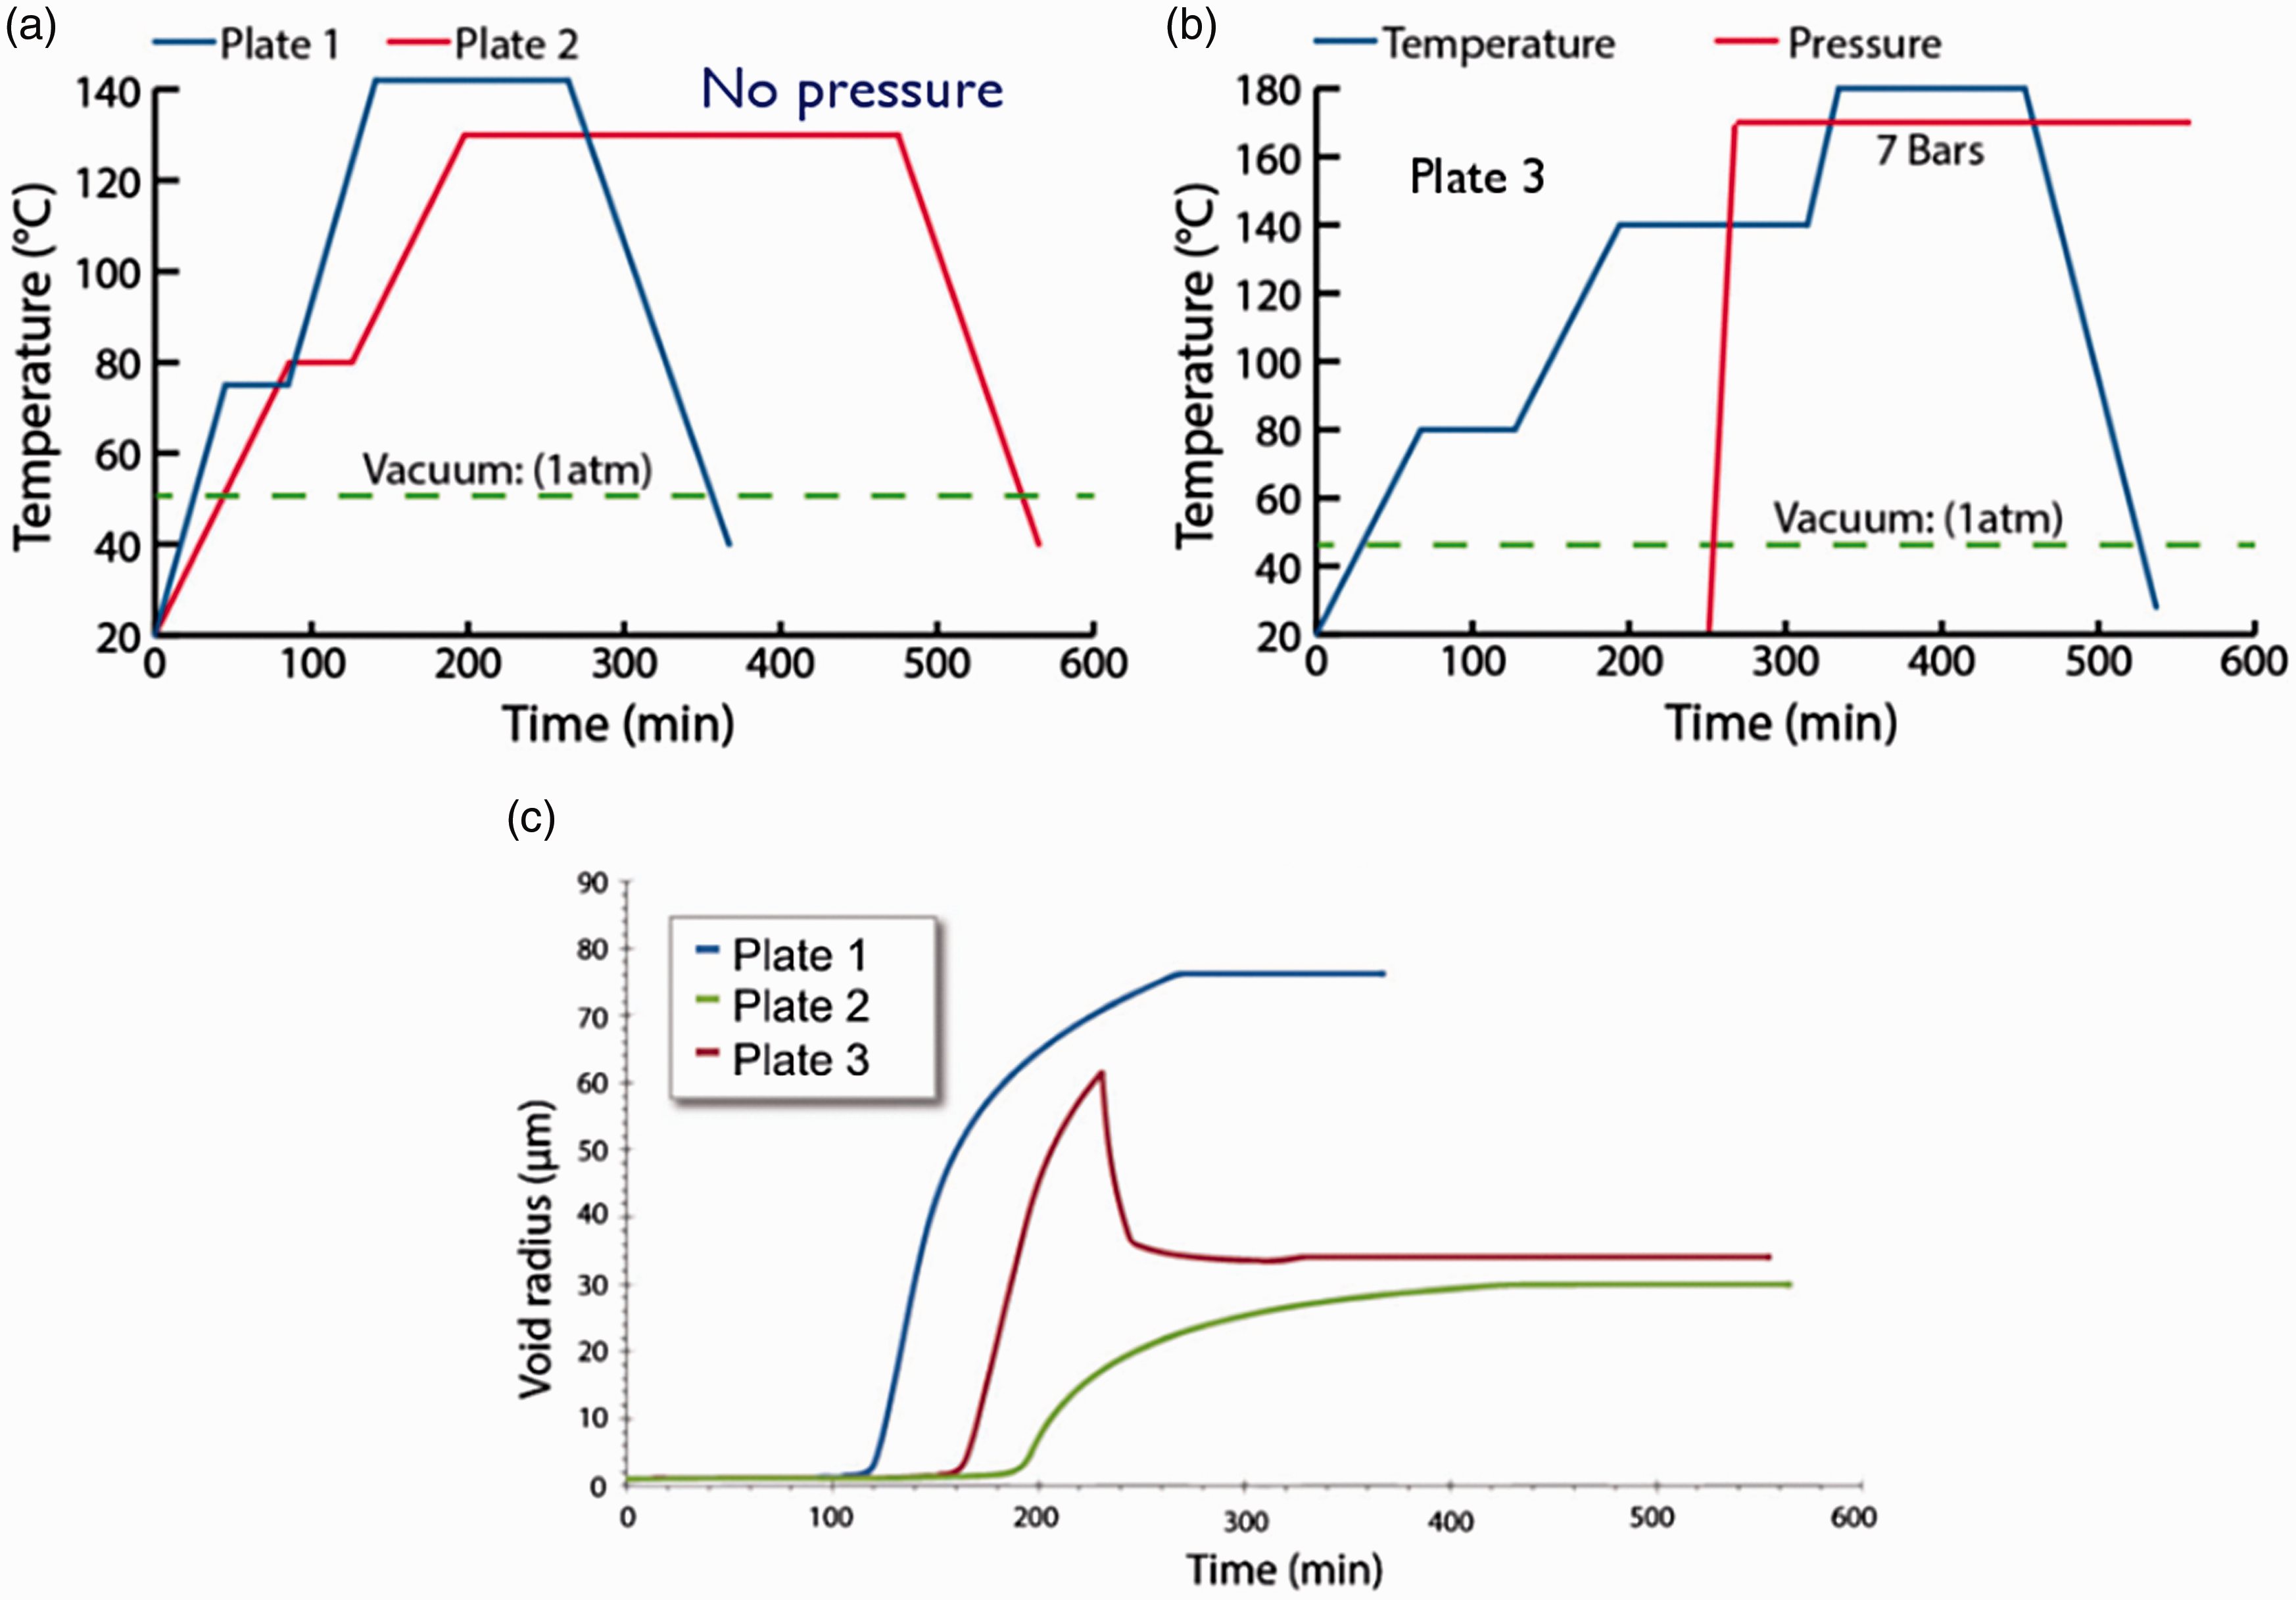
these models are not able of predicting a reasonable size for the voids (prediction of extremely large radii). Therefore, the authors developed a different model for the prediction of growth of spherical voids, which accounts for the non-Fickian (Dual-Fick) behavior of the epoxy resin as well as the slowdown of water diffusion due to polymerization. The additional slowdown of water diffusion at the interface was explained by the formation of an interphase around the void, having different diffusive properties. For three different cure cycles (Figure 5(a) and (b)), they predicted the evolution of void size, which had a reasonable order of magnitude (radius in the order of tens of micrometers, as shown in Figure 5(c)). However, they argued that the highly complex physics behind the void formation and growth during cure is not yet completely clear for researchers. Furthermore, according to Hernández et al.,
97
the above models correspond to small spherical voids growing inside polymer, but not to cylindrical voids forming in a viscous matrix in the presence of fibers.
Temperature and pressure profiles during three different cure cycles of epoxy matrices: (a) Plates 1 and 2 with no pressure and (b) Plate 3 with pressure; (c) the corresponding void radius evolution, predicted by de Parscau du Plessix et al.’s model, showing a drop in the void size for the cycle with pressure and the minimum final size for the cycle with longer time at a high temperature.
96
With an appropriate cure window, i.e. an optimized set of temperature, vacuum pressure, and autoclave (cure) pressure profiles versus time, large parts can be fabricated with almost no voids, because the high pressure largely suppresses the evolution of volatiles and dissolved species and eliminates any entrapped air. 88 The removal of intra-laminar voids by means of vacuum is more difficult since they are not connected and also the through-thickness air-permeability of prepregs is low; therefore, the void evacuation is done mainly through inter-laminar zones. 98 Stone and Clarke 99 manipulated the autoclave pressure and the vacuum-bag internal pressure in order to obtain specimens with a variable void content for their analysis. The vacuum level in composite manufacturing is around 0.5 bar.
Shim et al. 100 found that without vacuum and in the presence of autoclave pressure, a high inter-laminar voidage exists, but the composite made with vacuum and without autoclave pressure has the highest voidage. Hence, autoclave pressure plays the consolidating role, suppressing residual air growth simultaneously. Similarly, Liu et al. 101 concluded that an autoclave pressure is imperative to reduce the void content down to an acceptable level. Boey and Lye 93 showed that without the application of vacuum, void content can be reduced by increasing the cure pressure, but even with high pressures, a small degree of voidage is present. Furthermore, they showed that in the absence of vacuum, with increase in cure temperature, the void content increases. Campbell et al. 102 explained this by the increase in the volatile vapor pressure when temperature is increased. They also mentioned that factors such as prepreg surface roughness, laying up environment, laminate thickness, ply orientation, internal ply drop-offs, tooling, and bagging play a role in void formation during autoclave processing of prepregs. According to Olivier et al., 103 the size, shape, and distribution of voids alter with cure cycle parameters. They determined optimal curing pressure conditions to minimize void content based on the results of thermogravimetry and mechanical spectrometry tests.
The influence of residual solvent content in a prepreg, controlled by the drying time prior to cure, on the void formation was investigated by Naganuma et al. 104 They observed that in the case of short times of prepreg drying, open voidage (to the thickness surface) with large and irregularly shaped voids is formed around the bundle intersections, while in the case of long drying times, closed voidage with flat and semicircular voids is formed in the spaces between plies.
Koushyar at al. 105 explored the effects of variation in autoclave parameters on voidage in a composite panel and observed that maintaining the vacuum throughout the cure cycle results in a high void content. The latter was found to increase with increase in the cure pressure. They explained this by boiling volatiles in the resin when vacuum is maintained at elevated curing temperatures. Li et al. 106 showed that when the cure pressure is low, a considerable number of large voids mostly at ply interfaces are formed, of which the number and size decline significantly when the pressure is increased. For low cure pressures and in the presence of vacuum, Kakakasery et al. 107 observed that debulking, which is removal of air and volatiles by application of vacuum at a rather high temperature prior to cure, could significantly reduce the intra-laminar voids. Curing at high pressures drastically diminished the void content and standard deviation of the measurements.
Concluding remarks on voids in autoclave curing processes: The role of autoclave pressure is crucial in suppressing the void formation. For selecting the suitable profiles for the cure window parameters, i.e. pressure, temperature, and vacuum, they need to be optimized together, rather than separately. There are also other factors, including residual solvent content and humidity, which influence the void formation in autoclave processing. Techniques such as debulking and prepreg drying can be employed to further reduce the voidage in final parts.
OoA curing process
With the composite market growth and considering high costs of autoclave processing of large parts, OoA manufacturing techniques have shown potential over the past two decades to meet future demand. In particular, autoclave-quality parts have been manufactured through vacuum-bag-only (VBO) consolidation. 13 Low capital investment, lower consumable costs, and improved energy efficiency can be counted as advantages of OoA, in addition to higher production rates. 108 They are due to the possibility of using a diverse range of lower cost cure setups, such as conventional ovens, heating blankets, heated tooling, 13 and hot presses. 97
In contrast to the autoclave process, in which alleviation of voids is easily done by means of high pressure, the void formation and mitigation are serious issues in the OoA process. Although modifications to the prepregs for OoA manufacturing are needed (explained in the following paragraph), appropriate processing conditions, especially sophisticated thermal cycles, are essential to achieve a high consolidation and low void contents. 13 OoA production of large parts with void contents less than 2% is reported in the literature; some examples are reviewed in the literature. 13 The current section is devoted to OoA curing of prepregs, while other non-autoclave techniques dealing with LCM such as RTM and VARTM are already discussed in the Liquid composite molding section.
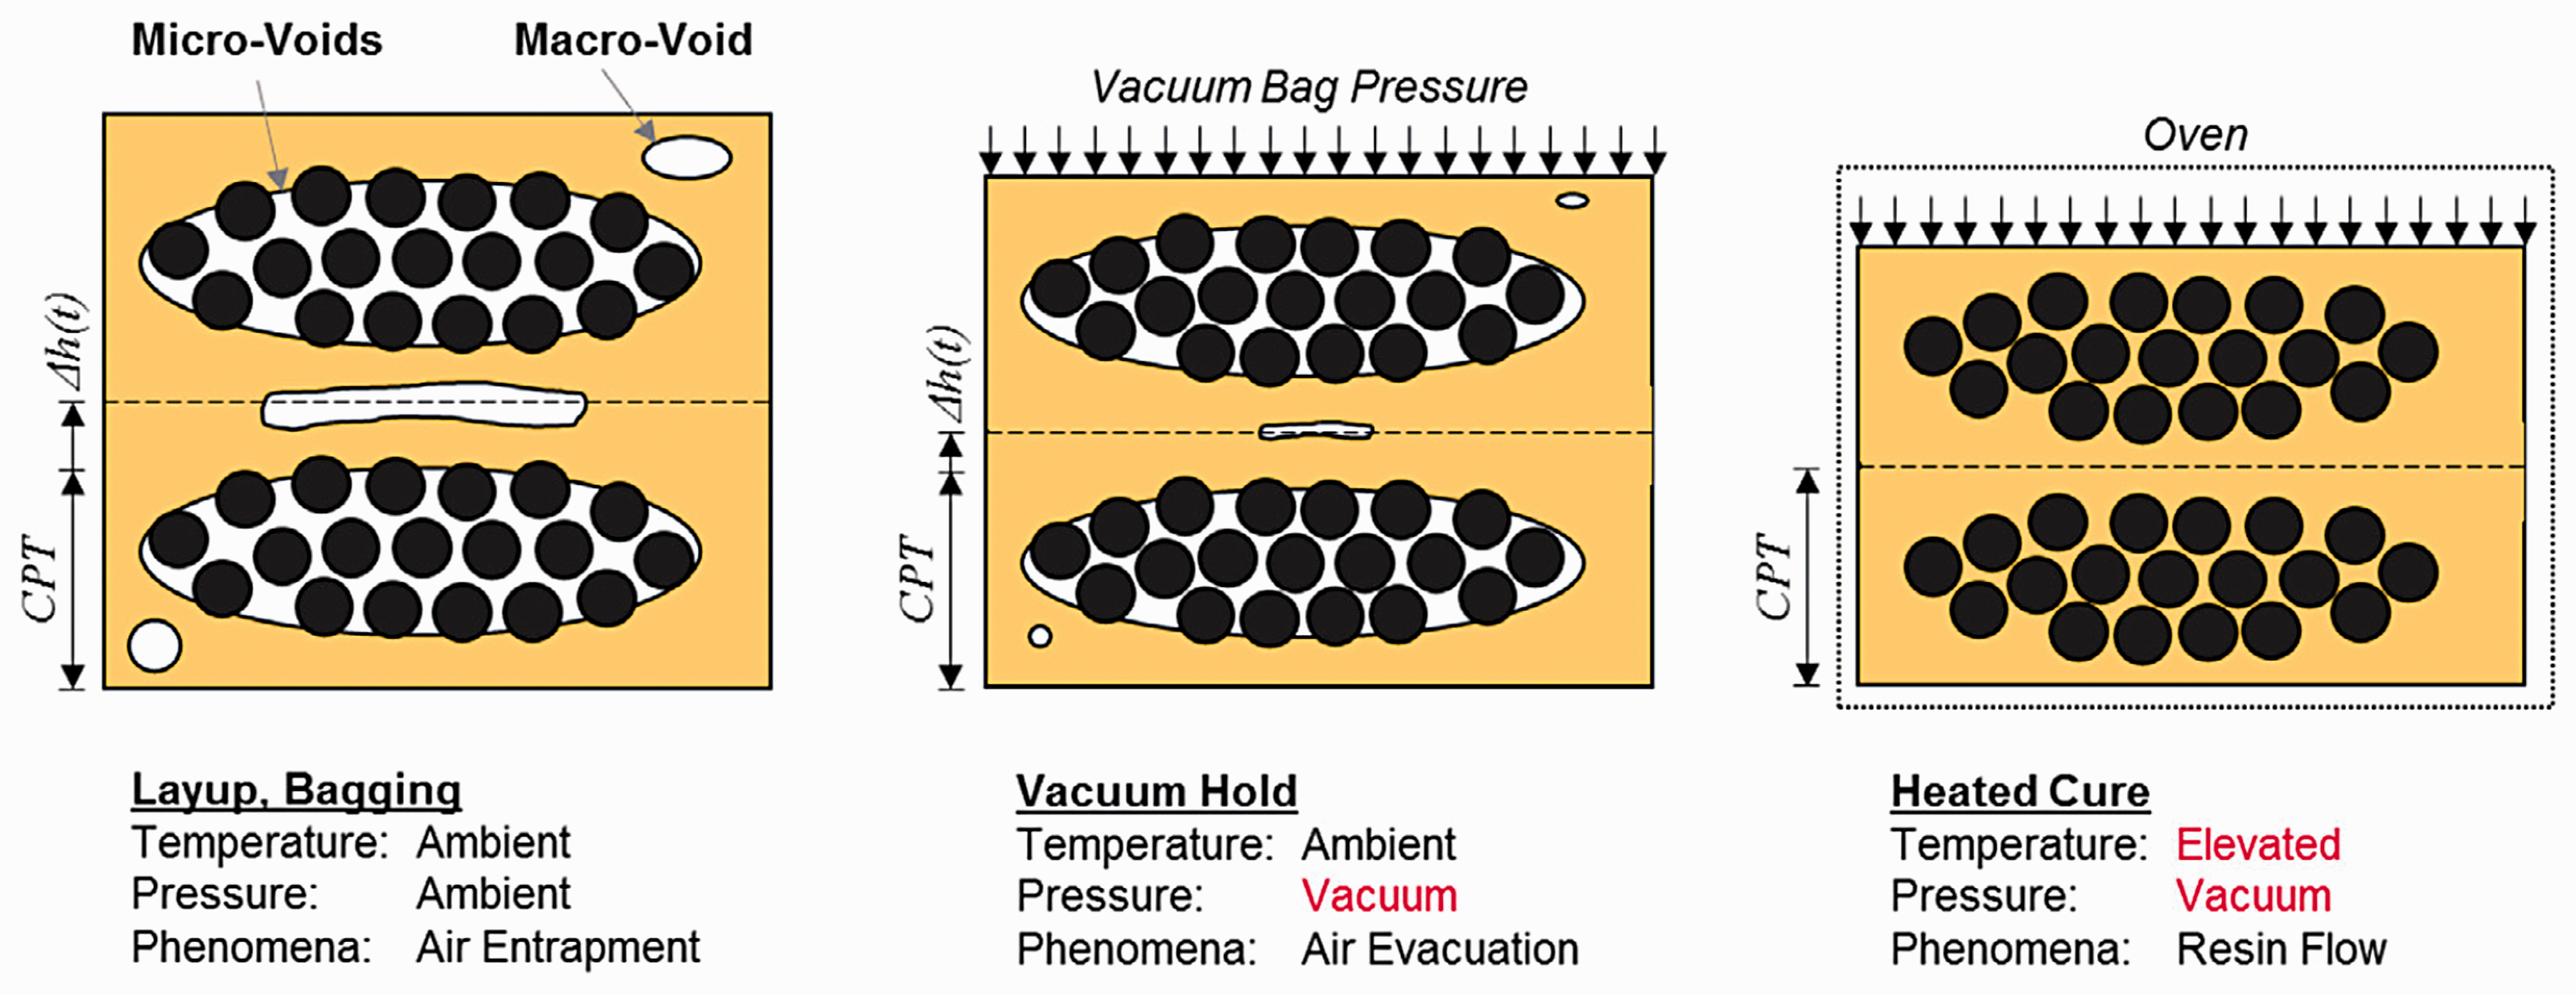
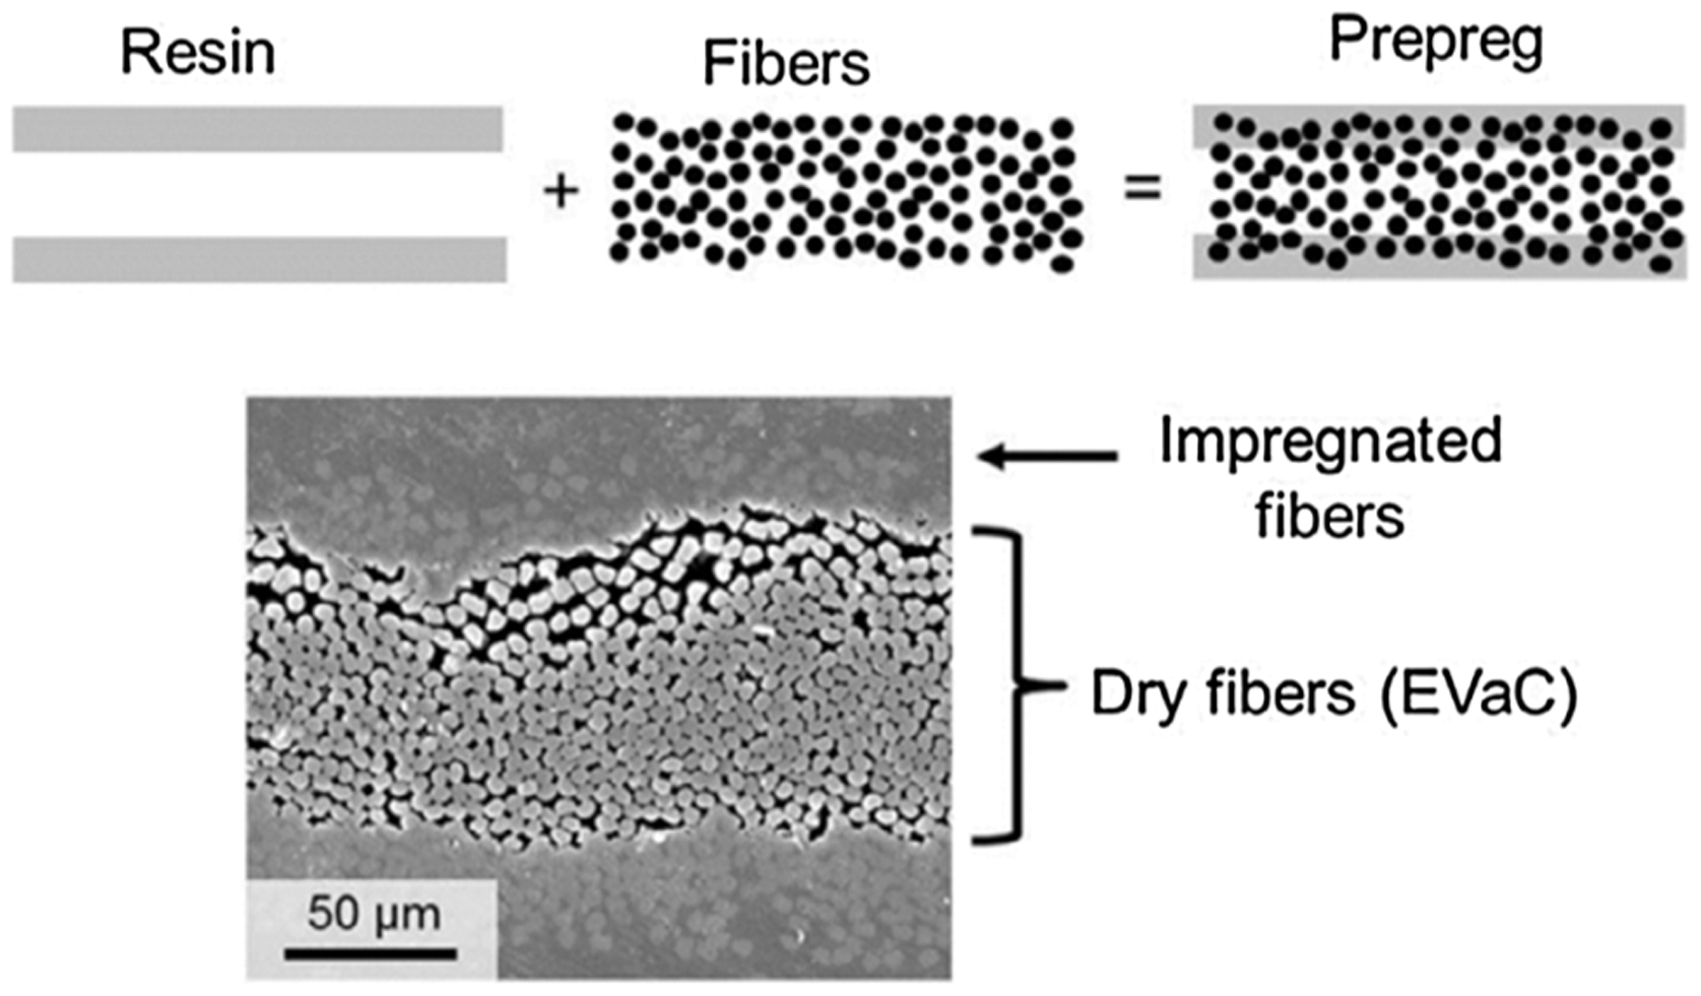
VBO consolidation: VBO is an OoA technique that only applies vacuum along with high-temperature initial- and post-cure to consolidate laminates. Voids in OoA, in particular in VBO composites, can be classified into “flow-induced” voids, resulting from insufficient impregnation of fibers before resin gelation, and “gas-induced” voids, due to the presence of entrapped air, moisture, or resin volatiles. In an unconsolidated stack of plies, voidage can exist in three forms: micro-voids within dry tow cores, meso-voids within the resin-rich regions around tows, and inter-laminar voids between the plies. During VBO, when vacuum is applied, air is evacuated through the dry tow cores, and the content of meso- and inter-laminar (gas-induced) voids reduces. Then, when temperature is increased, resin flows into the dry tow areas, causing the content of flow-induced voids to decrease (Figure 6). It can be concluded that to get rid of the gas-induced voids during VBO consolidation, surprisingly, the introduction of an open-cell porosity into the prepreg, which facilitates the air evacuation, is required.
13
This can be achieved by partial impregnation of the preform during the prepreg production, which makes the VBO prepregs “breathable” through the intra-tow voids, as illustrated in Figure 7. Thus, the degree of impregnation in a prepreg becomes a prominent factor determining the void content in the final part made of this prepreg.13,109–112
Schematic of prepreg lay-up consolidation during vacuum-bag-only process: Removal of meso-voids within the resin-rich regions (including ply interfaces) by vacuum application and of micro-voids within the tows by applying heat. Schematic and micrograph of a “breathable” prepreg consisting air evacuation channels suitable for VBO – EVaC stands for “Engineered Vacuum Channels”.
13
Nevertheless, partial impregnation can be present in the final laminate in the form of flow-induced micro-voids inside tows if the material and thermal conditions are such that the curing reaction finishes before complete impregnation of tows takes place. According to Centea and Hubert, 113 this can occur due to a high initial degree of cure (induced for example by high out-time 112 ), fiber-dense tows, slow heating rates, low dwell temperatures, as well as low impregnation time. 114 Therefore, to produce a void-free laminate, in addition to the partial impregnation of the as-received prepreg (special prepreg for VBO processing), which is a requirement for sufficient air evacuation, a proper rheological evolution of resin during VBO is essential. Resin viscosity must evolve during VBO such that at each stage, favorable viscosity for void elimination at that stage is acquired. This means a high viscosity during vacuum application to retain the intra-tow voids as paths for evacuation of gas-induced voids, and a low viscosity during heating to allow resin flow into the intra-tow voids, removing flow-induced voids. This is schematically shown in Figure 6. This proper evolution of the resin viscosity can be achieved through optimization of material parameters and process conditions. 13
The ability of vacuum to reduce gas-induced voids and that of heating to decrease flow-induced voids were reported by Centea and Hubert. 115 They performed micro-CT on laminates processed to different stages of a simple cure cycle. After an hour-long room temperature vacuum hold, the number and size of the meso- and inter-laminar voids decreased dramatically, whereas the micro-voids tended to be reduced through progressive impregnation only once the material was heated. From this work, the relationship between process conditions and voidage in VBO was perceived and it was further investigated in a later study, 113 where high ramp rates and isotherm temperatures were found to rapidly complete the tow impregnation, which may prevent the removal of meso- and inter-laminar voids. On the other hand, if ramp rates and isotherm temperatures become very low, tow impregnation might be stopped due to gelation leaving micro-voids in the tows. In an earlier study, Davies et al. 116 used Quickstep cure a as an OoA technique (but not VBO) and showed that higher process ramp rates in Quickstep processes can reduce resin viscosity, thus facilitating void removal. In particular, the consolidation of the laminate was improved with a lower void content due to maintaining a lowered resin viscosity for a long period. In addition to the application of vacuum for evacuation of the gas-induced (trapped) voids and providing sufficient heat, pressure, and time for removal of the flow-induced voids, Fernlund et al. 117 suggested an extra intermediate stage necessary for control of void formation in OoA: Heating the laminate up to cure while keeping the resin pressure high enough to maintain the volatiles dissolved until resin gelation.
Low-voidage carbon/polyether ether ketone (PEEK) laminates was manufactured through oven vacuum-bag processing by Zhang et al. 118 Using a resin infusion void filling model, 119 they could estimate the time required to achieve zero voidage. They underlined the importance of the gas diffusion at the void–resin interface in predicting the final void content. Moreover, the material variability within prepregs is suggested by Helmus et al. 120 to have a significant influence on void formation in OoA prepregs. They proposed a stochastic method to model the material variability, which can be used to simulate, more accurately, the void formation during OoA consolidation.
The change in the air evacuation capacity with time, during VBO cure, can be measured by the change in through-thickness air permeability, which was performed by Tavares et al. 121 According to their results, through-thickness air permeability of prepregs, being influenced by progressive prepreg impregnation and evolution of resin viscosity, changes by several orders of magnitude during VBO cure. This means that also the potential for removing gas-induced voids changes during VBO cure. Characterizing the prepreg surface roughness and the evolution of the surface contact during OoA cure, Helmus et al. 122 suggested that the entrapped inter-laminar air can either be evacuated from the surface roughness valleys, move inside the prepreg and then exit through the tow evacuation channels, or migrate in the out-of-plane direction. Therefore, fiber distribution and in-plane and out-of-plane air permeability play a role in evacuation of the entrapped inter-laminar air.
So far, the formation and removal of voids, mainly caused by air entrapment either inside tows or between plies during VBO cure, have been discussed. VBO suffers from another source of voids, which is moisture in the resin. Grunenfelder and Nutt
88
showed that the high pressure in autoclave is sufficient to suppress void formation even for prepregs with high level of moisture absorbed, whereas in VBO processing, void volume fraction increases exponentially as a function of moisture content (Figure 8). They validated their results against the modified diffusion-based model of Boey and Lye.
93
Kay et al.
123
confirmed that moisture and entrapped air are the dominant sources of voids within VBO prepregs, while cure-arising volatiles rarely become a source of voids.
Effect of initial humidity on the void content in woven carbon/epoxy composites, manufactured with VBO and autoclave processes, showing a high sensitivity of VBO to humidity compared to that of autoclave process; the void content was measured experimentally and predicted using the modified diffusion-based model of Boey and Lye
93
– VBO, an OoA technique that only applies vacuum along with high-temperature initial- and post-cure to consolidate laminates.
88
VBO: vacuum-bag only.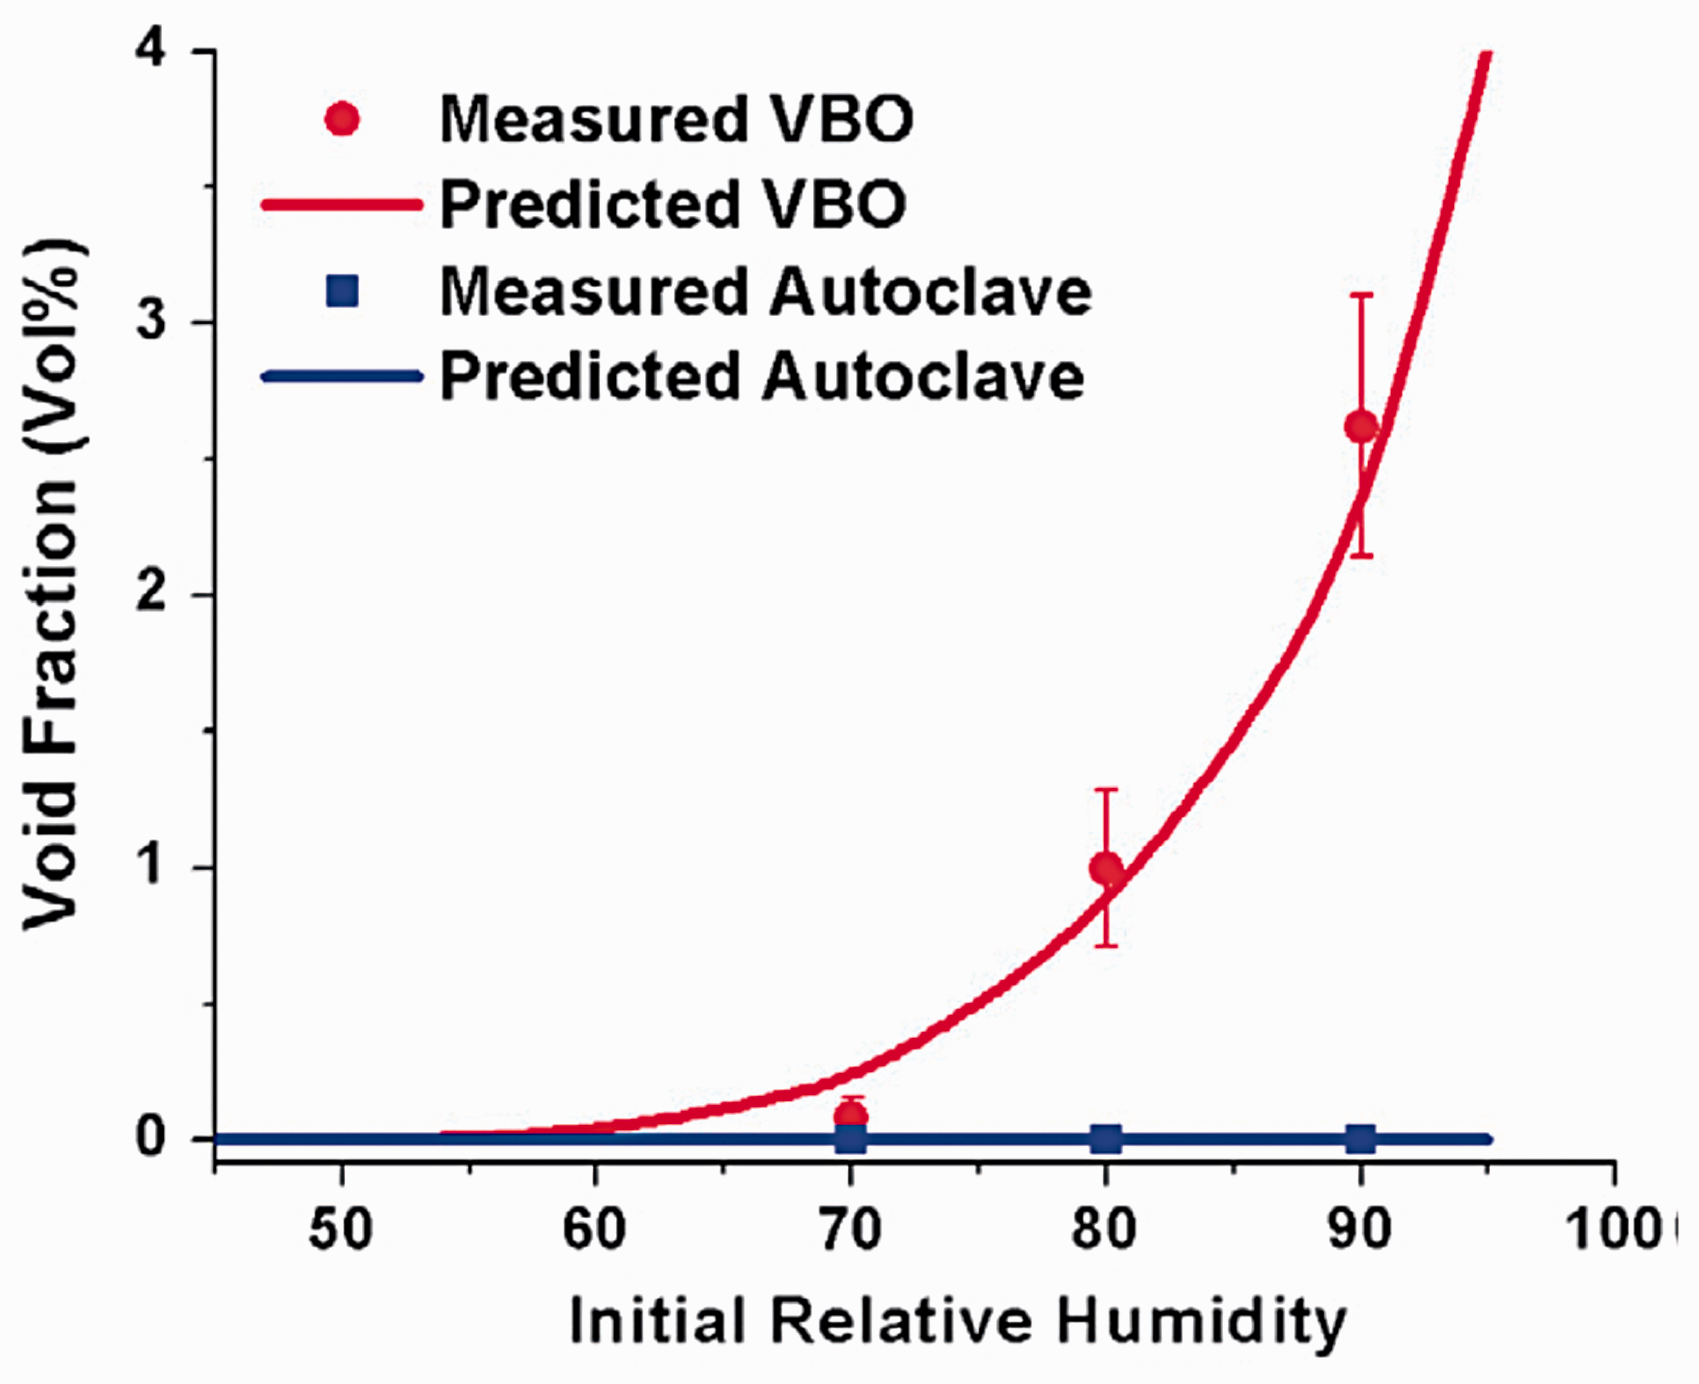
Using mass spectrometry, Agius et al. 108 proved that the main volatile within a prepreg is water, and traces of other volatiles such as alcohol, acetone, and ethanol are very small. If the water vapor pressure exceeds the hydrostatic resin pressure during cure, the moisture-rich voids can grow, which happened only during the second stage of the recommended cure cycle, in their case. Later, they 124 found that a conditioning procedure (120 min at 40℃ under −97 kPa absolute pressure in a vacuum oven) prior to laying up and cure could effectively reduce the moisture and solvent volatiles within the prepreg. They showed that the conditioned composite had consistently lower void content throughout the VBO cure, without any visible void growth. In general, the absence of high pressure in VBO processes makes it vulnerable to the process deviations that reduce the void-suppression capacity. 13
Besides resin moisture, another undesirable process deviation may arise from decreased resin pressure (due to reduced ambient pressure) 125 or increased void pressure because of the poor vacuum,123,125 and insufficient air evacuation as discussed above. 125 Moreover, geometric complexity 126 and large size of the part 123 can aggravate void control in VBO processing. Techniques such as applying resonance by a pneumatic vibrator to the curing system 127 are proposed for reduction of void content in OoA processes.
Hot press curing: Hot press manufacturing, as another OoA technique, is studied with regard to void formation, as well. Employing a hot press with an identical constant pressure, but different temperature cycles, Hernández et al.97,128 concluded that the final void content depends on the actual evolution of the resin dynamic viscosity throughout the cure cycle. Through micro-CT, they observed that initial voidage in an unconsolidated prepreg was limited and mainly concentrated within the tows, hence intra-laminar. In the cured laminate, however, most of the voidage, being elongated in the fiber direction, was inter-laminar resulting from the air entrapment during laying up. This represents the case that partially impregnated tows exist in the as-received prepreg, but have been fully impregnated before the gas-induced voids are removed through the unimpregnated tow cores. They figured out that a low voidage in OoA products could be achieved through a proper temperature cycle, which results in a wide processing window, in which the resin viscosity stays low. Moreover, the resin flow in these works97,128 was anisotropic and mainly occurred along the fiber direction, in agreement with the higher permeability factor in this direction. The dominant resin flow in the fiber direction caused a channel-type structure, and enabled the transport and coalescence of voids along the fibers. 97 As a consequence of a fiber-rich skeleton in the composite (explained in the Location and spatial distribution section), the pressure distribution during consolidation becomes inhomogeneous, which may influence the volume fraction, size, and location of the voids. 128 Observing a rise in the void content with restricting the flow region, Anderson and Altan 129 found the resin outflow as the dominant mechanism for evacuation of voids during hot-press cure at low pressures.
The combined effect of plate pressure and prepreg humidity exposure on void formation was investigated by Anderson and Altan. 130 They observed that at low processing pressures, the composite with high moisture content have the highest void content. However, the effect of moisture was diminished with increase in pressure such that at high pressures, void content tend to reach an asymptotic value of ∼1.6%, independent of moisture content. They also found that the moisture absorption/desorption of the prepreg can be described by a 1D Fickian diffusion model. A model for the prediction of void content based on the processing pressure and moisture content was developed, being able to predict the non-zero asymptotic value. In a similar study by Gu et al., 131 an asymptotic value of ∼0% was obtained. Moreover, increase in gel temperature was found to increase the void content, at a given pressure and moisture content. This was attributed to higher void growth at higher temperatures.
Concluding remarks on voids in OoA curing processes: Void formation in VBO processes is a serious issue due to low (vacuum) pressure during the process. Qualitatively, the formation and evacuation of the voids are well understood, but methods for quantitative prediction and design of the process is yet to appear due to complexity of the phenomena involved. For flow-induced voids, these phenomena relate to change of the resin viscosity with advancement of the gelation, for gas-induced voids – complex diffusion of air, resin volatiles, and moisture.
Automated prepreg laying
As stated in the beginning of the Prepreg technology section, modern prepregs possess a very low volatile and moisture content. Therefore, the final voidage is predominantly controlled by the air entrapment during laying and consolidation pressure applied to collapse the entrapped voids. 132 The automated prepreg laying involves a unique stacking process and sometimes in situ consolidation, and hence it is interesting to investigate this technique from the voidage point of view. Automated tape laying (ATL) and automated fiber placement (AFP) are the two main technologies of automated prepreg laying, used today to manufacture advanced composites. The main difference between ATL and AFP is in the width of the prepreg they use. The tapes used in ATL are much wider than those used in AFP. Thus, AFP can deal with more complexity in the part geometry, while ATL is suitable for production of flat or low-curvature parts. 12 Both thermoset and thermoplastic automated lay-ups may be consolidated in an autoclave or OoA (for example, using in situ consolidation during the laying process), depending on the materials and manufacturer. For thermoplastic prepregs, the application of AFP is more common than ATL. 12 Moreover, automated tow/tape placement (ATP), a technique in which consolidation already happens during the tow/tape placement, is used to lay up thermoplastic prepregs. This technique can significantly reduce manufacturing costs benefiting from in situ consolidation. 133 It is worth noting that the void formation in the automated lay-ups can be influenced by the presence of defects in the tow laying, caused by not-that-precisely-laid tows, namely gaps (matrix pockets between tows) and overlaps (zones of increased local fiber volume fraction on the overlapping tow boundaries).
Regarding the voidage in thermoset automated lay-ups, Lukaszewicz and Potter 98 argued that variability of the uncured prepreg in terms of initial voidage, resin content, and surface roughness determines the final voidage in the cured composite. Therefore, they measured these three parameters in two different uncured prepregs. Inside the prepregs before cure, a high voidage was found, which decreased toward the center of the prepreg cross-section. The void content did not correlate with the void size. Similarly to the void distribution, the average resin content decreased toward the middle of the uncured prepreg. This similarity may be linked to the prepreg manufacturing method. Regions with a high resin content are probable to have higher voidage. One of the prepreg types had a surprisingly high surface roughness, which is more likely to trap inter-laminar voidage, in particular in large parts. Overall, it could be deduced that the variability in the unconsolidated prepreg is too high to allow simple development of robust analytical models for predicting final voidage in these materials.
Later, Lukaszewicz et al.
132
showed that high-quality carbon/epoxy laminates, with respect to voidage, can be produced from autoclave prepregs without application of debulking and additional pressure, but with sufficient compaction of each ply during the automated laying process at elevated pressure and temperature and using VBO (OoA) curing. They developed an automated laying simulator to provide proper operating parameters. By compaction of each ply during laying at high temperatures, surface roughness of prepregs is reduced, decreasing the inter-laminar sites for air entrapment. At very high laying temperatures (∼70℃), much of the intra-laminar voidage in the uncured prepreg is also removed, achieving a void content of ∼2%, as can be qualitatively observed in Figure 9.
Influence of the temperature in the laying process on voidage of a UD carbon/epoxy composite, processed with ATL and out-of-autoclave cure: (a) at 40℃ voidage is ∼7.4% and (b) at 70℃ voidage is ∼2.1%.
132
For automated laying of thermoplastic prepregs, usually ATP is used. ATP can include the following steps: heating, development of intimate contact between overlying tows and removal of inter-laminar voids, interfacial healing, consolidation and squeeze flow due to the compaction roller force (reducing the intra-laminar voids), void growth resulting from high temperature, and polymer degradation. 134 The quality of ATP composites is assessed mainly with the interfacial healing and voidage in the final part. Pitchumani et al. 134 modeled the void growth as the expansion of air in a quiescent polymer melt at certain pressure and temperature, and void consolidation as a squeeze flow of a compressible fiber–resin–voids mixture under the compaction rollers. They concluded that as the consolidation force exerted by the rollers increases, the interfacial bonding increases and the final voidage reduces. When the heat input is increased, the void growth is promoted and voidage is increased although interfacial bonding is improved. However, if a forced cooling is applied after consolidation, the void growth is suppressed, leading to a reduced final voidage.
Tierney and Gillespie 133 determined the through-thickness void distribution in ATP parts based on variations in processing conditions by means of a macroscopic flow model and a microscopic void dynamics model, coupled with the heat transfer solution. Large gradients of internal void content were found through the thickness, attributed to the preheating of the composite surface (tacking approach) and repeated compaction (multiple passes) during the laying process. The model showed that these multiple passes drastically reduce the final void content. The deconsolidation, i.e. the void growth in high-temperature low-viscosity matrix, is somewhat controlled within the laminate, but it increases the void content in the laminate surface. As a solution, the authors proposed quenching of the material surface directly after the consolidation step. Lamontia et al. 135 explained that the temperature, force, and contact time of the compaction rollers at the laying head play an important role in controlling voidage through resin flow. However, they argued that high-quality in situ thermoplastic ATP anyway needs flat tapes with low initial voidage since tape roughness hampers the layer-to-layer intimate contact, leaving behind inter-laminar voids. The removal of initial voids is also hardly possible since the through-thickness escape route is eliminated by the compaction force, leaving intra-laminar voids in the laminate. Therefore, the application of flat tapes with low voidage was found to be a more practical remedy than the use of low placement velocities or large compaction forces. Through a non-local void filling model, Simacek et al. 119 showed that the predicted void content, in addition to the initial void content, depends on the initial void distribution along the prepreg width. Their model describes the void dynamics in thermoplastic prepregs during the tape placement, and accounts for the volatile pressure in voids, compaction load, fiber bed response, and resin pressure due to squeeze flow.
In contrast to the autoclave processing of semi-crystalline thermoplastic composites, the in situ OoA consolidation processes of these composites have a narrow processing window where elevated temperature and pressure are applied. Therefore, macroscopic resin flow, reptation of polymer chains across ply interfaces, and numerous void reduction mechanisms (e.g. coalescence, migration, compression, bubbling), which take place usually in autoclave, happen to a smaller extent in the in situ consolidation processes. Consequently, prepreg variables such as void content, level of crystallinity, dimensional tolerance, and fiber volume fraction become the crucial factors determining the quality of the semi-crystalline thermoplastic composites produced by ATP and in situ consolidation. In addition, the heat source, which can be hot-gas, infra-red, or laser, plays a key role.
136
Comer et al.
136
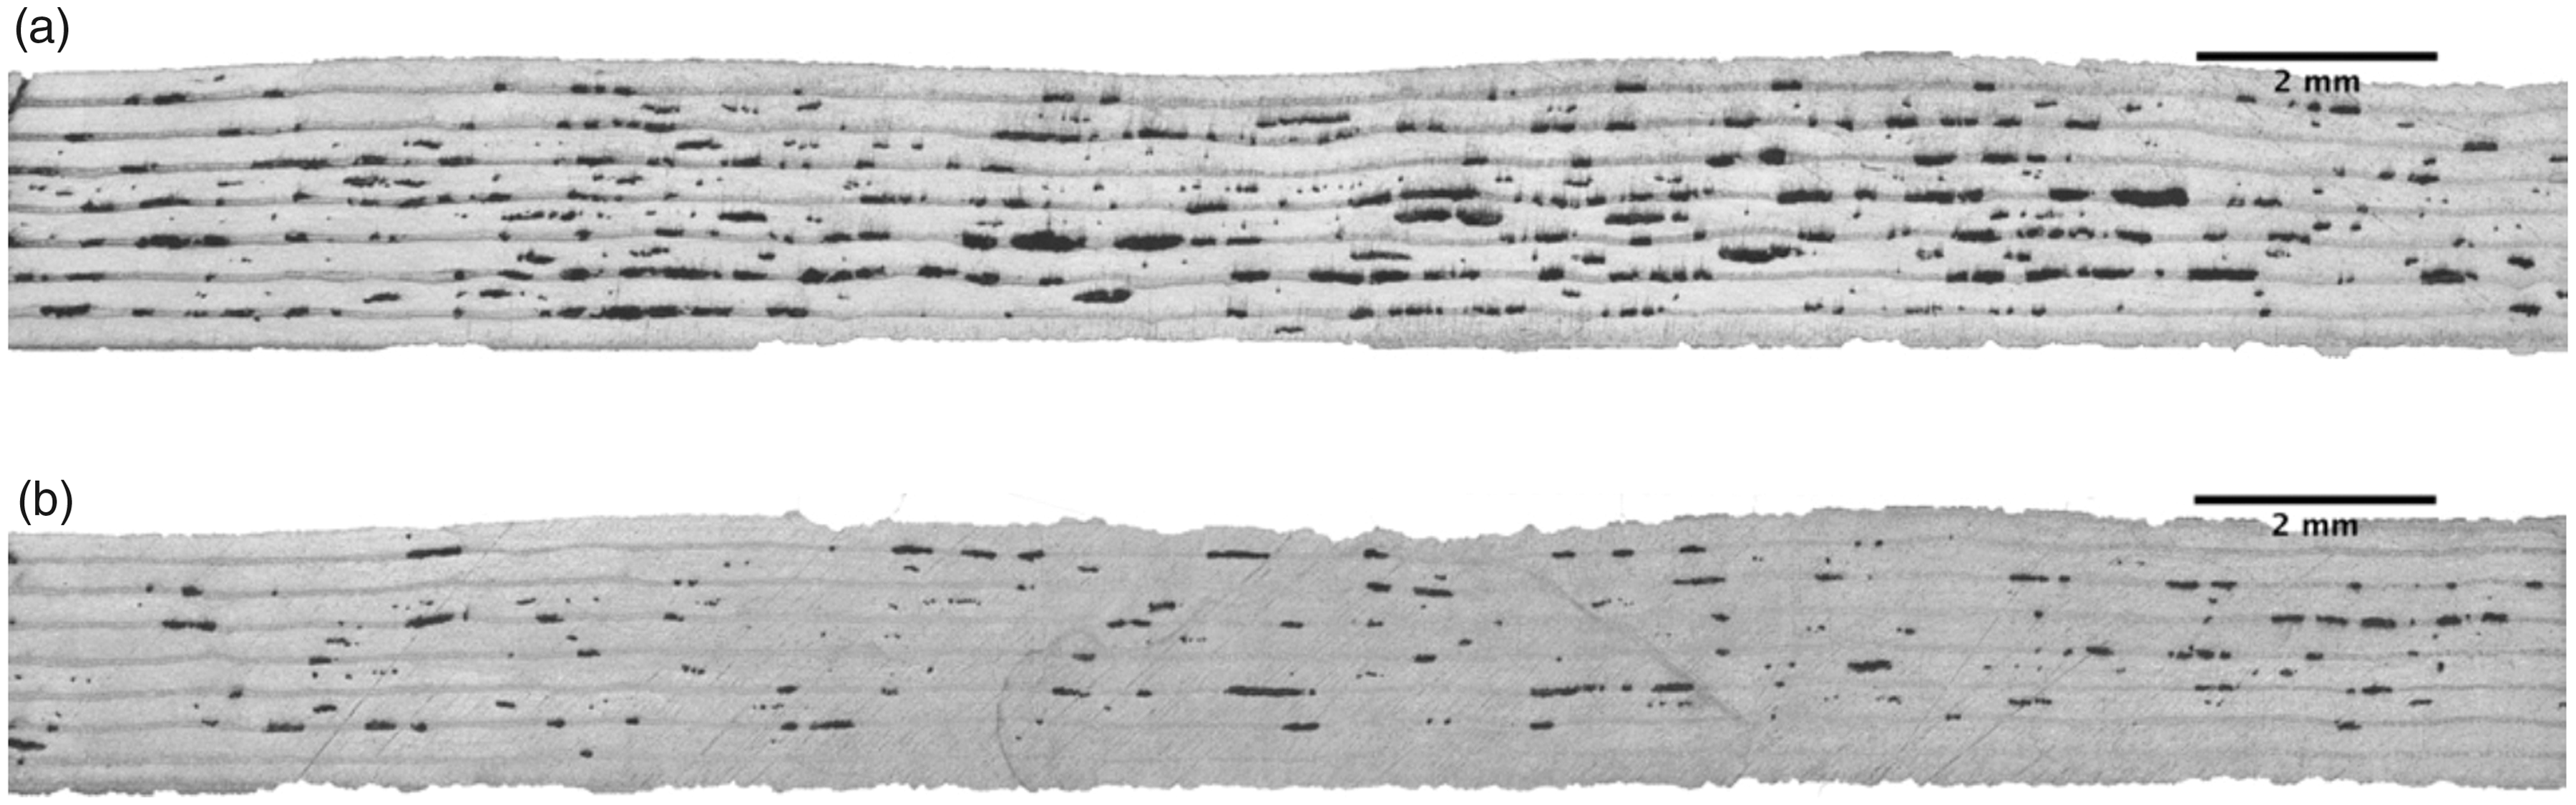
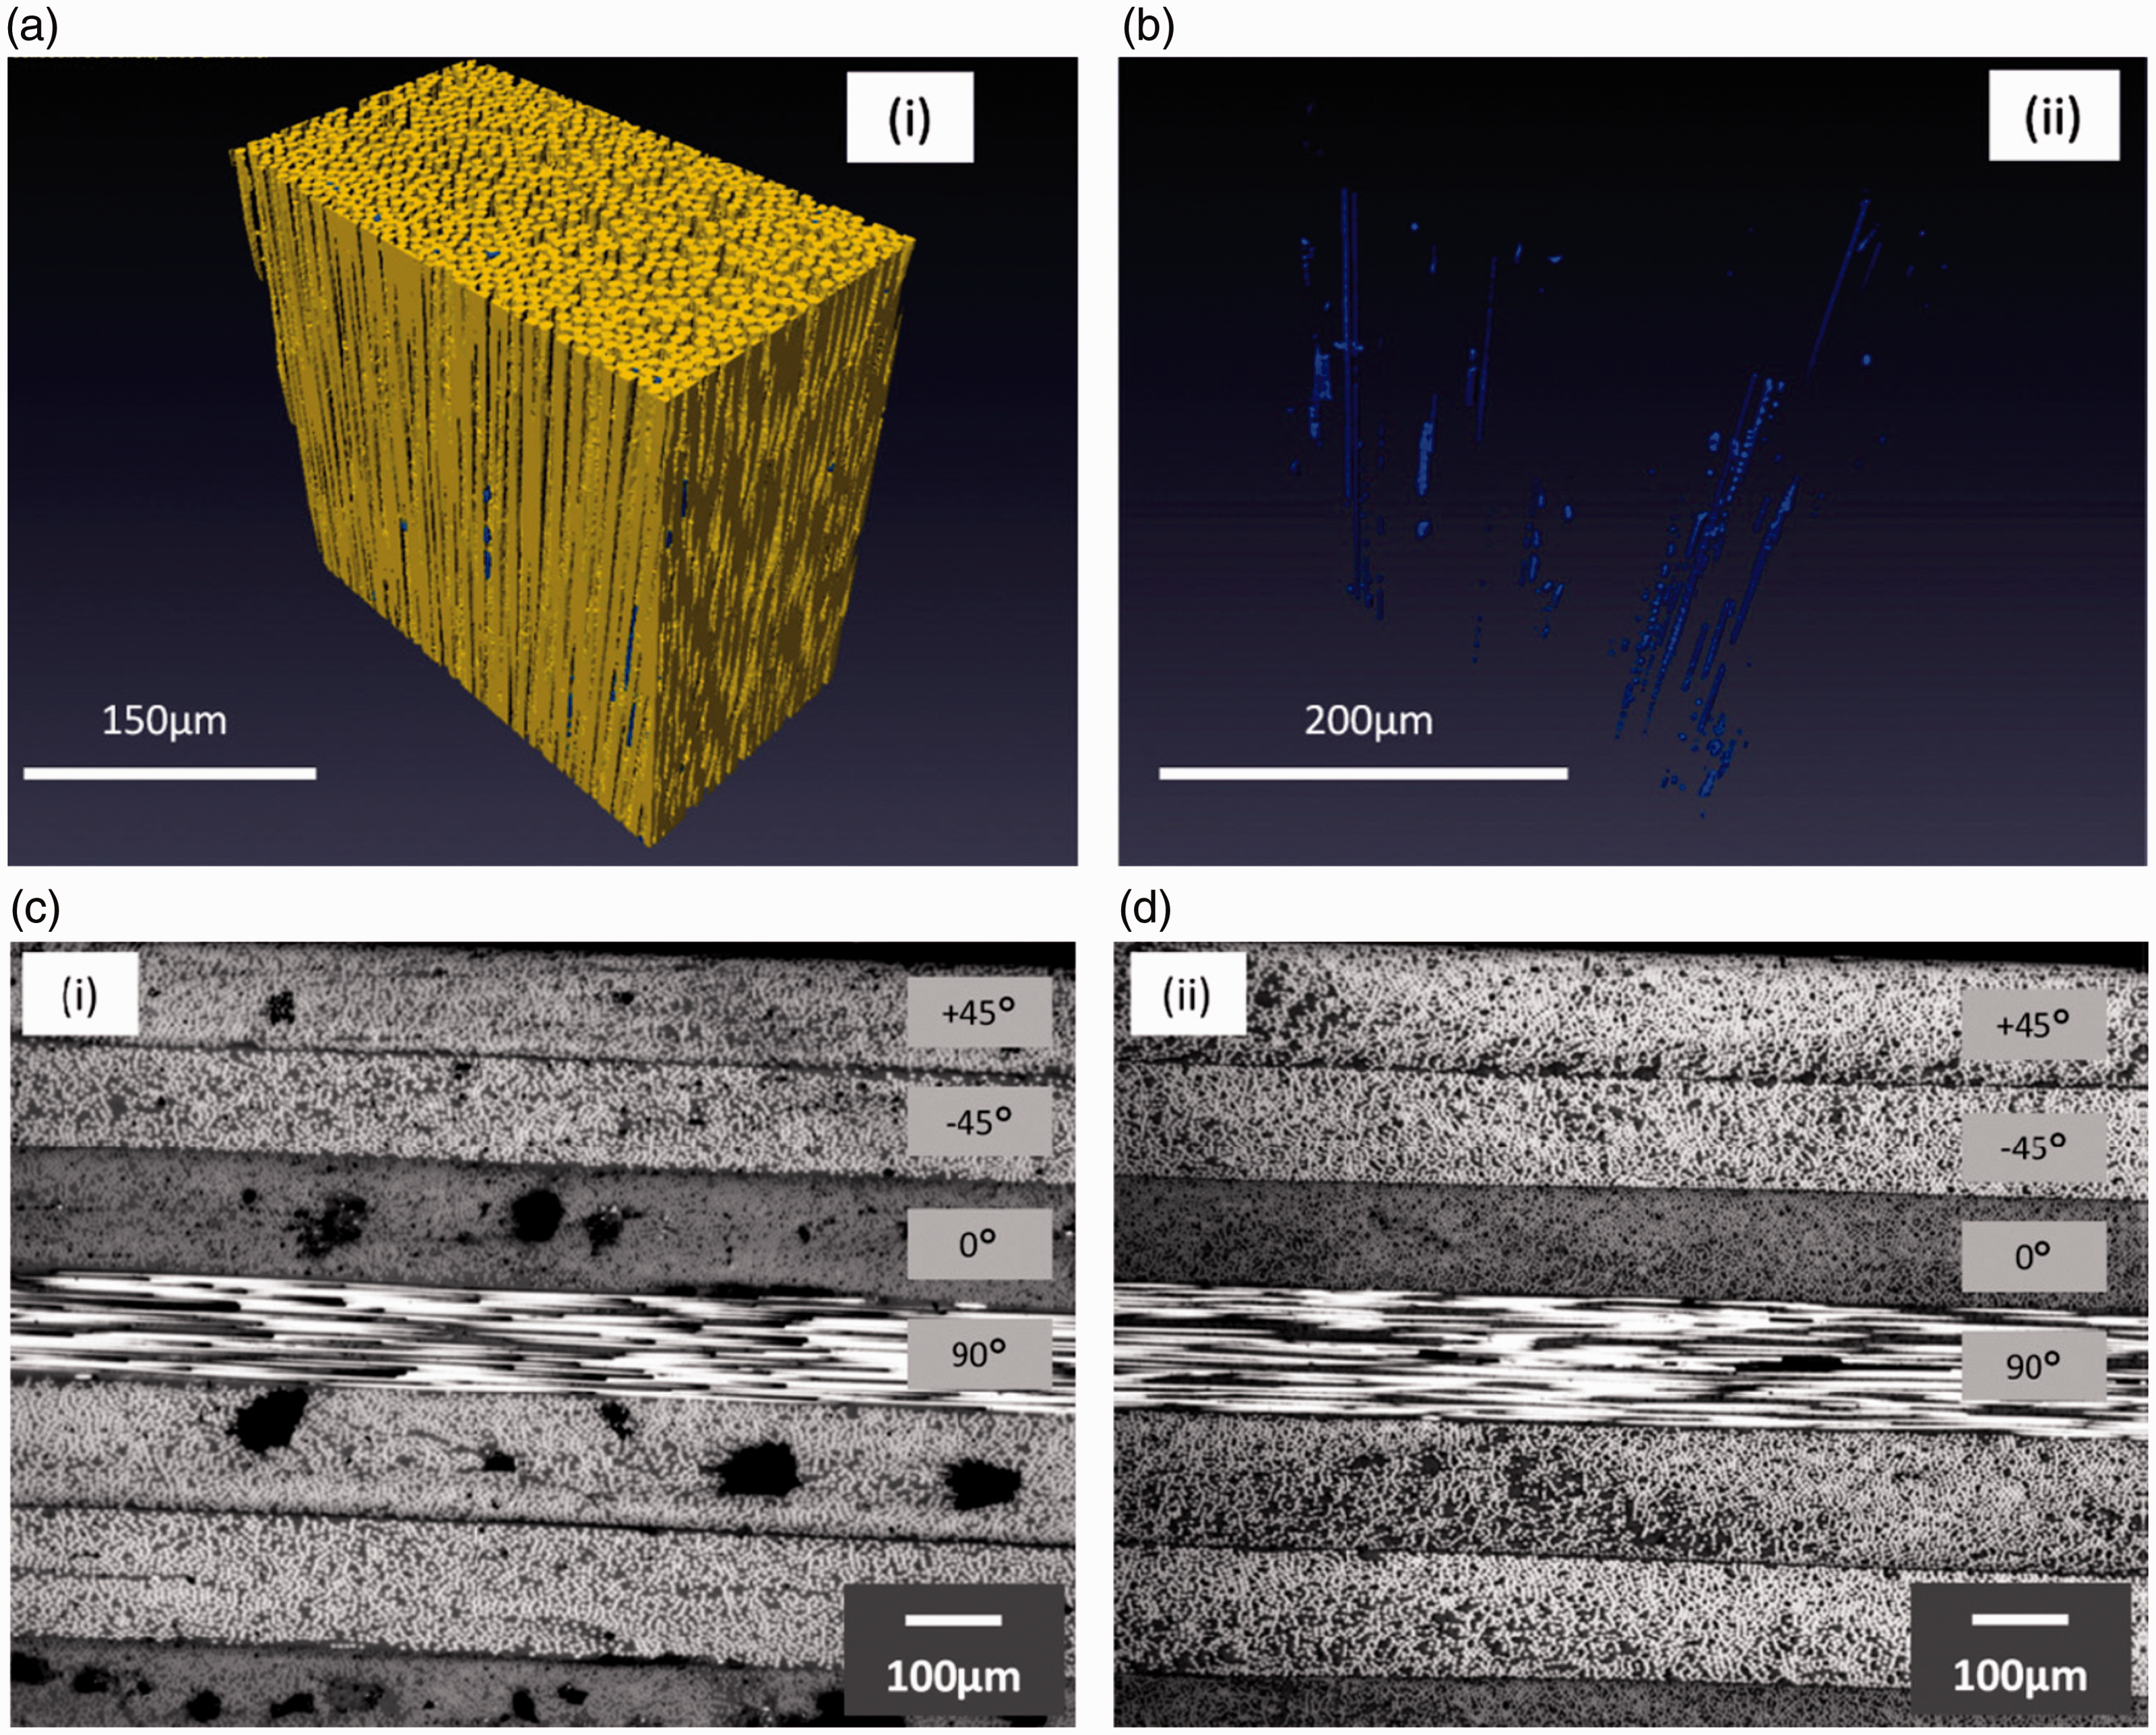
observed through micro-CT that the voids, in an unconsolidated carbon/PEEK prepreg, are highly elongated in the fiber direction (Figure 10(a) and (b)), as found in the literature.
118
They also found that voidage increased through laser-assisted ATP (an OoA consolidation process, which couples an elevated temperature with high dynamic shear forces exerted by the compaction roller), whereas it reduced during autoclave processing (Figure 10(c) and (d)). This could be due to the addition of inter-laminar voids, trapped during laying, which are controlled by prepreg roughness and processing parameters. Moreover, rebound of intra-laminar voids because of inadequate extracted heat could be the reason for the increase in the void content.
Micro-CT images of an (unconsolidated) automated tape placement carbon/PEEK prepreg (UD), showing (a) carbon fibers (yellow) and intra-tow voids (blue) (b) only elongated voids in the fiber direction; higher voidage in micrographs of automated tape placement specimens consolidated (c) with laser-assistance than those consolidated (d) in autoclave.
136
Concluding remarks on void formation
Phenomenology of the void formation is quite well understood and described, both for LCM and prepreg processing routes. However, the state-of-the-art is far from complete, especially in predictions of the void content and morphology for given processing conditions. The questions which should be still answered and the problems to be solved are:
Darcy simulation of the preform impregnation may show the preform as fully filled, but meso- and micro-voids can still exist in the “filled” regions – how to couple Darcy simulation with Stokes modeling, accounting for the internal fibrous structure of the preform? What is the relation between intra-tow and inter-tow void formation in LCM? What is the relation between curing kinetics, matrix shrinkage, gas diffusivity, and void formation in autoclave and OoA prepreg processing? How interfaces (between tapes in winding or AFP and between plies in laminates) influence the void formation and how to model these phenomena? If the overall void content is below detection limits, can still micro-voids or sporadic large voids be present and constitute a danger for failure under in-service loading conditions? Is it possible to segregate processing parameters/conditions/factors, which lead to formation of voids with different size/shape/distribution?
Characterization of voids
Characterization of voids has been a subject of research since voids in FRCs became known, going back to the 1960s. Since then, this field has evolved noticeably, starting from simple density determination methods and progressing to advanced X-ray CT inspection. Some of the techniques explored and used for void characterization in composites are categorized as non-destructive testing & evaluation (NDT&E) techniques while others are destructive. In the current section, we review most of these techniques, focusing on their advantages and disadvantages. Additional information can be found in the literature.7,8,10,137,138
Density determination
This technique gives the void content value, i.e. the void volume fraction. According to ASTM D2734, the void content (Vv) can be obtained by the relative difference between theoretical (
Accurate void content measurement requires accurate knowledge of the physical properties of the constituents, namely fiber and matrix. The accuracy on the void content is, for the best results, not better than ±0.5%. 7 Even, non-physical negative values for void content have been reported in case of wrong density inputs, 139 for which simple data correction methods are proposed. 140 Not all voids are taken into account in density determination technique. 141 Furthermore, it reveals nothing about other void characteristics such as size and shape (explained in the Void characteristics section). This technique is destructive, but suitable for quality control purposes since it is applicable to large samples and is relatively fast.
Microscopy
Void characterization is possible by means of optical and electron microscopic techniques, for example with a scanning electron microscope (SEM). Void content can be determined by methods such as optical counting,142,143 and area fraction.144–146 Hsu and Uhl 147 confirmed that the area fractions obtained from microscopy on cross-sections are quite close to the volume fractions obtained by the density determination method. Purslow 143 considered an accuracy of 0.2% for optical microscopy in determination of the void content. Rousseau et al. 148 found that the value of void content measured through image analysis (performed on microscopy images of cross-sections) is higher than that obtained through the density determination technique for all tested samples. Bodaghi et al. 149 suggested that a statistical analysis of 20–25 images can determine the void content with an acceptable accuracy. Microscopy also allows characterization of the void size, shape, and distribution.
However, results of microscopy are dramatically section-biased, which means they depend on the direction of the two-dimensional (2D) section that is chosen for analysis.138,150–152 This means that microscopy characterization of voids in different views does not necessarily give the same results (“section-bias error”). The effect of the microscopy view on the resulting void content, size, and shape in RTM composites was investigated by Hamidi et al. 150 Thickness view (perpendicular to plies) was found to provide more accurate results for void content, whereas the actual void size distribution seems to be obtained more precisely in planar view (parallel to plies). In order to more accurately assess the shape of the voids, a combination of both views must be incorporated. Moreover, microscopy is a local analysis, and in case of high dissimilarities in void characteristics throughout the composite (e.g. in different plies 145 or in different locations of the laminate width, thickness, 128 or length 153 ), local results may not be treated as representative (“location-bias error”).
Ultrasonic testing
Ultrasonic (US) testing is one of the most widely used NDT&E methods for evaluation of voids in composites. The velocity and attenuation of a US pulse traveling through (through-transmission technique) or reflecting/backscattering from the back surface (pulse-echo technique) of an FRC depend on void content and fiber volume fraction. By virtue of simplicity as well as less sensitivity to variation in fiber volume fraction, measurement of attenuation has been used more commonly than that of velocity in void characterization.
10
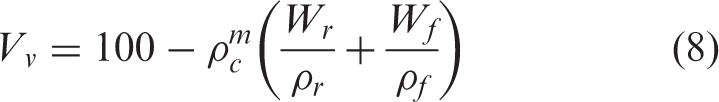
Stone and Clarke
99
noted that there is a bilinear relationship between void content and US attenuation coefficient in UD carbon FRCs, as plotted in Figure 11(a). They explained that up to void content of ∼1.5%, the voids are mainly volatile-induced, which form as small spheres within plies. Beyond 1.5%, however, air entrapped inter-laminar voids, which are significantly larger than the volatile-induced voids, tend to predominate. This change of void scale at the “knee” void content caused a break in the linear correlation of void content and US attenuation. In some studies, however, a linear relationship is reported, which can be due to the presence (or measuring) of only one void scale, i.e. void contents either lower or higher than the “knee” void content, and/or because of difference in reinforcement structure or matrix material.137,154,155
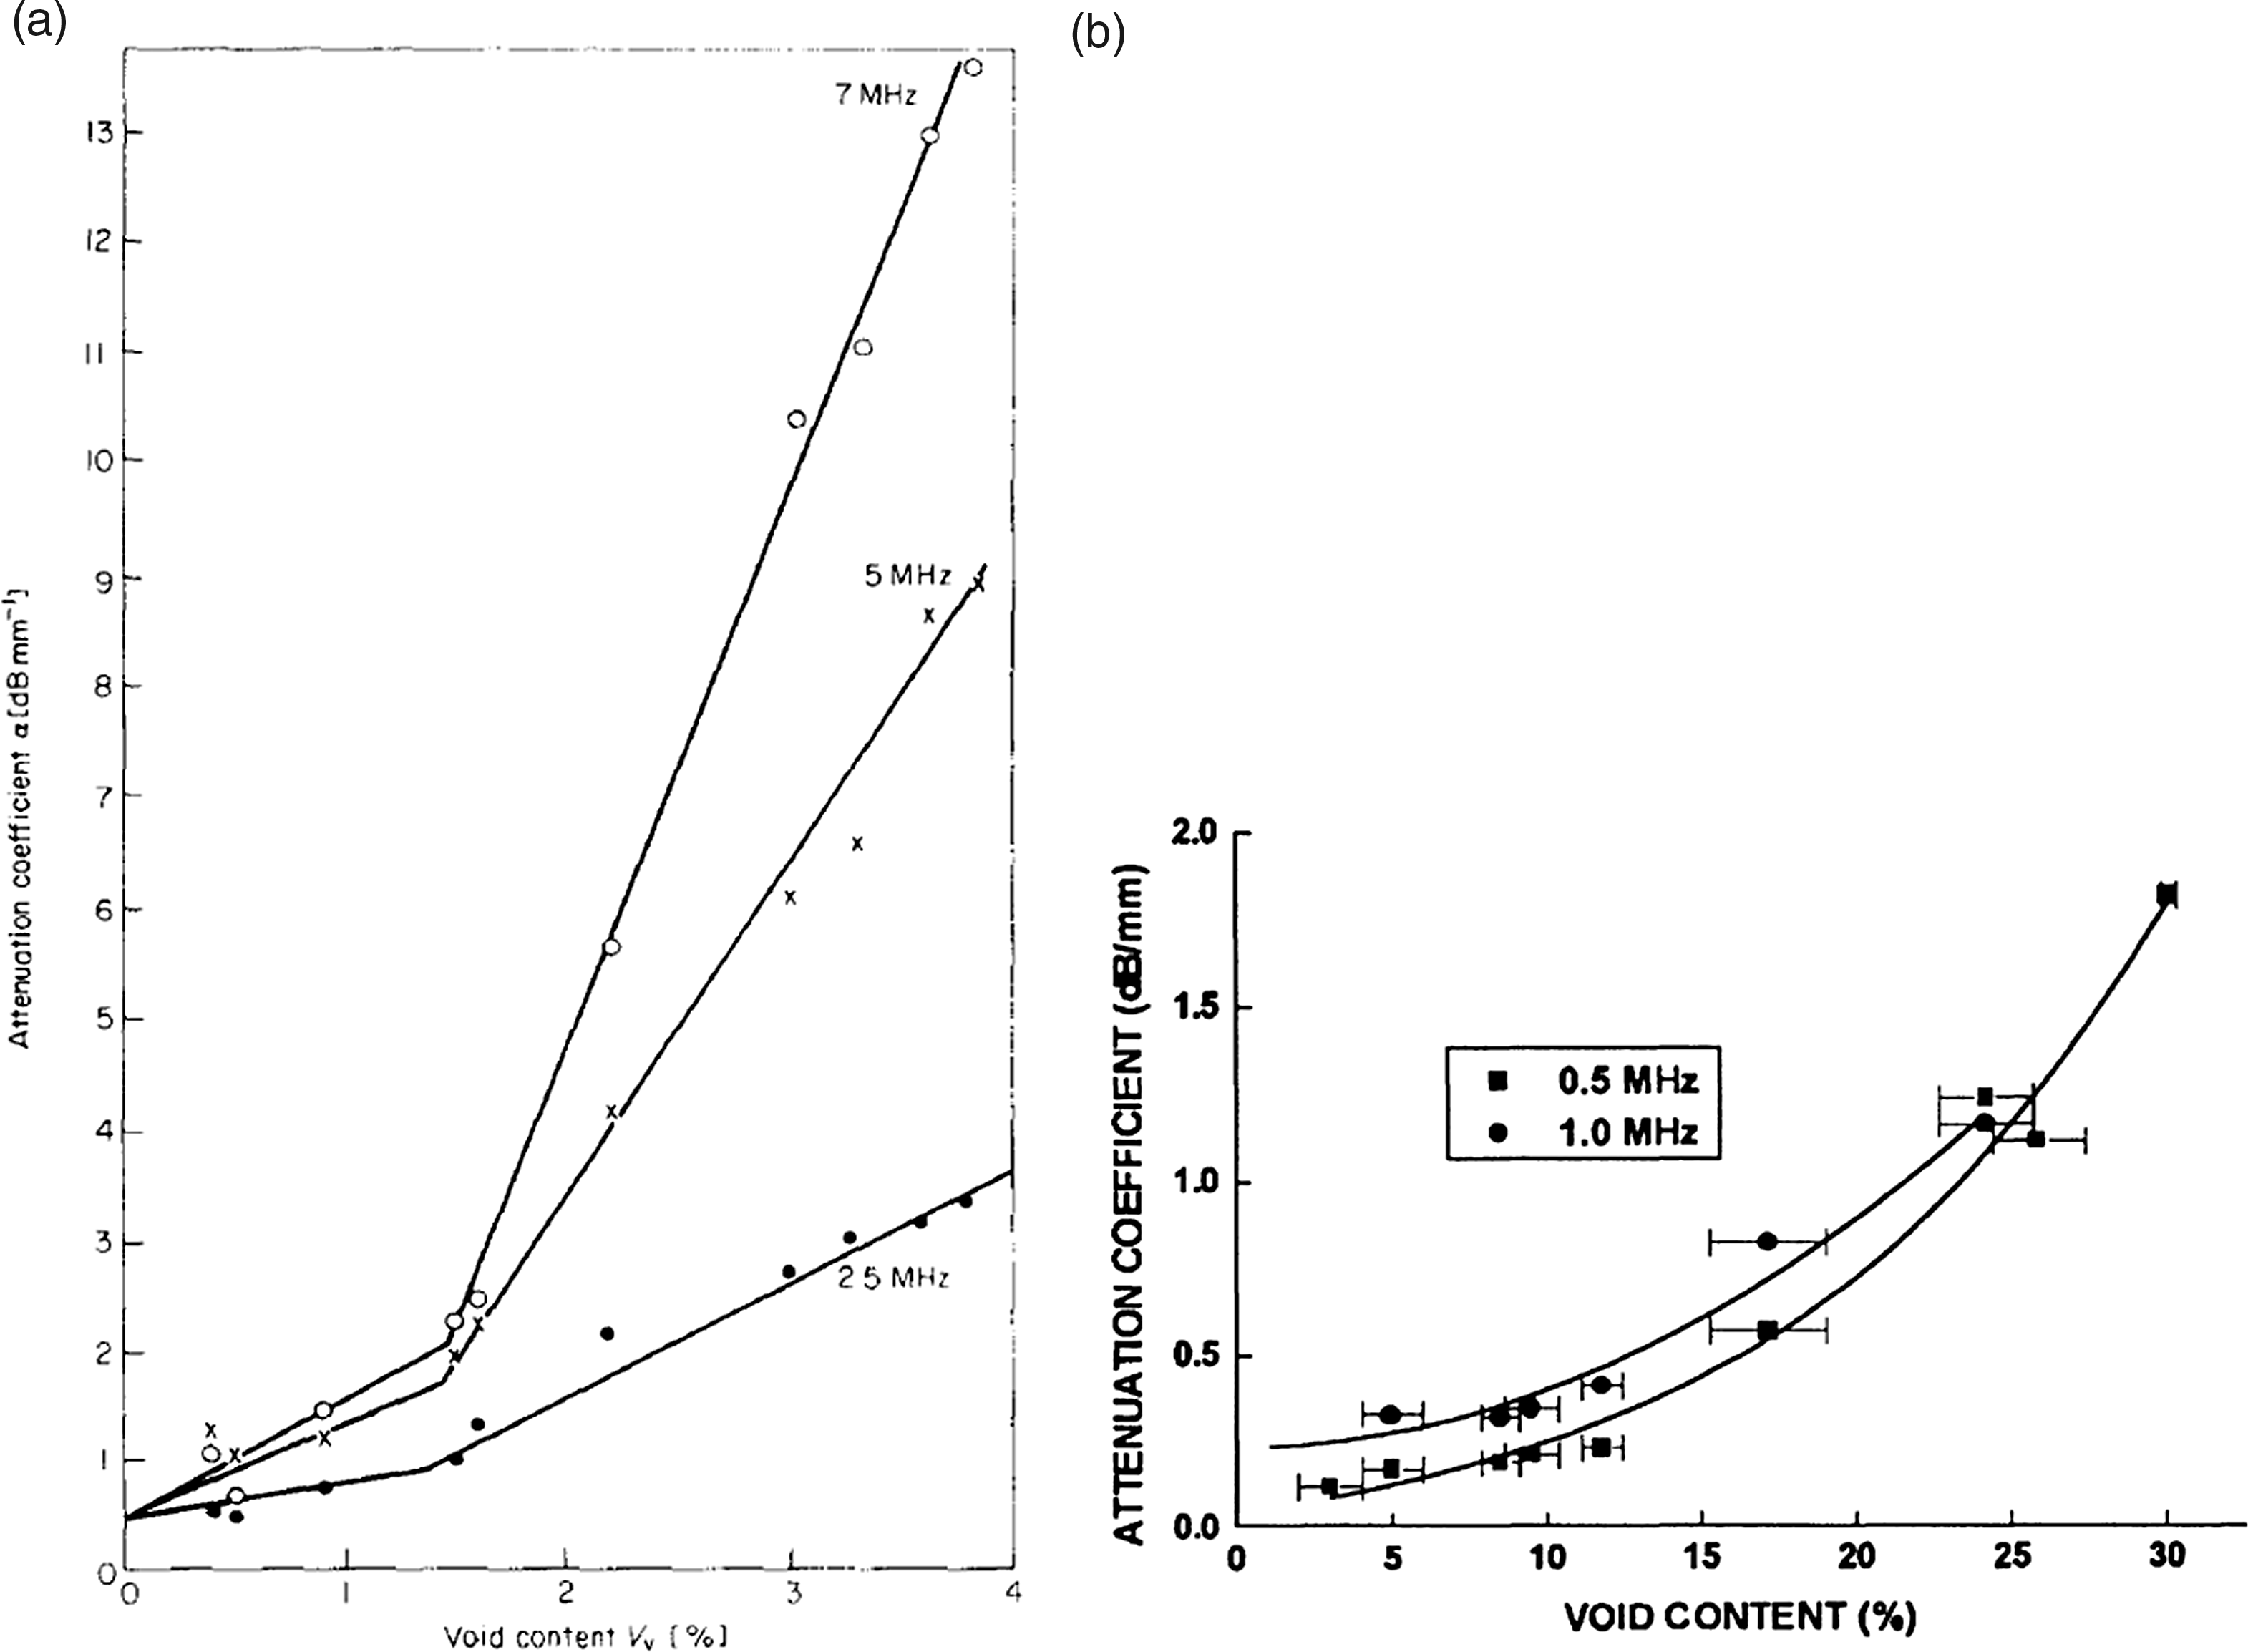
A theoretical expression relating the US attenuation coefficient to the void content as well as to the cube of radius of the (spherical) voids in UD composites was derived by Martin. 156 This is valid only for relatively low ultrasound frequencies and void contents. Moreover, the assumption of spherical voids is not valid for UD composites. Showing the unreliability of this model in cases such as occurrence of multiple-scattering effects of the waves, and non-uniform size distribution of voids in a woven glass/polyester composite, Mouritz 157 observed that for high void contents up to 30%, the rate of increase in attenuation coefficient grows with void content (Figure 11(b)). A 2D random void model, describing random morphologies of voids was proposed by Lin et al. 158 Through this model, it was found that the US attenuation coefficient obtained is no longer a fixed value, but one depending on the void morphology. Yu et al. 159 numerically simulated the interaction between the US wave and FRCs with random voids and could predict an attenuation coefficient change with the void content fitting better with experiments than the analytical (Martin 156 ) model.
For given materials, calibration curves could be constructed, according to Reynolds and Wilkinson, 160 by which the measurement of two or more US wave velocities could be translated to an estimate of the void content. It was also shown by Stone and Clarke 99 that the attenuation increases with frequency (Figure 11) and laminate thickness. The slope of attenuation versus frequency curves was correlated to the void content by Hsu and Nair. 161 Later, the frequency dependence of the attenuation and phase velocity due to voidage was investigated by Jeong and Hsu. 162 The attenuation was found to hold an approximately linear dependence on frequency, with the slope higher for laminates with higher void contents. In fact, the attenuation slope and void content are linearly correlated, and the correlation constant was found to be dependent only on the void shape, which differs in different composites. Consequently, a prior knowledge about the laminate structure and void morphology is required if the void content is to be measured by (a single) US measurement.
The US polar scans can also be employed for inspection of voids in composites, in either transmission, reflection, or backscatter mode.163–167 This technique provides a huge amount of data on the local characteristics of the material, useful for analysis of the internal structure and features, especially for characterization of the backside of structures in a single-sided setup. 168 On the other hand, it faces more difficulties with in-service inspection 10 and does not suit for quantitative explorations, but the limitations are tried to be addressed to make it a reliable quantitative NDT&E method. 168
The main drawback of the direct US techniques is the need for a coupling agent (e.g. water or oil) between the material and US transducer. This is in particular an issue for large composite structures or composites, of which the mechanical properties are sensitive to moisture uptake. This can be overcome by the application of air coupling. Air-coupled US inspection methodologies include surface topography, transmission analysis, and guided (Lamb) wave inspection.169,170 The latter, being a more frequent approach, uses generation and detection of acoustic guided (Lamb) waves by an air-coupled transducer. The Lamb waves are transmitted to the plate through one surface, interact with the defects inside the plate, and are detected by a receiver above the same surface of the plate, but outside of the reflection field.171,172 As an example, the voidage in a UD 24-ply carbon/epoxy composite was investigated by Hudson et al., 173 using an air-coupled transducer and a laser Doppler vibrometer imaging system, which resulted in similar image quality compared to that obtained by conventional (immersion) US scanning.
Application of laser-generated ultrasound (LU) for inspection of voids in composites has been explored, mainly because of the possibility of non-contact inspection.174–176 Although this technique has been integrated into the inspection process of some modern aircraft industries, it is being still improved mainly in terms of sensitivity to voids.177–179 Karabutov and Podymova180,181 developed an LU spectroscopy method, which allows quantitative evaluation of the influence of dispersed microscopic spheroidal voids and isolated extended inter-laminar delaminations on US attenuation. High spatial resolution and overall signal bandwidth were achieved by Pelivanov and O’Donnell, 179 using LU probe signals for imaging of voidage. By overcoming the drawbacks of conventional US techniques, such as limitation to flat samples with low surface roughness, and the need for a coupling agent, the authors claimed that LU imaging can provide direct data on voidage, similarly to that of X-ray tomography, while LU is portable and cheap, and provides easier access (i.e. through one side of the sample). Moreover, LU generates broadband acoustic pulses, which allows exciting of a wide range of frequencies, providing a wide range of information (through a B-scan). LU suffers from being hardware-intensive and potentially dangerous in operation.
Another notable drawback of US inspection is its slow and low-flexibility performance. Phased array US technique is proposed as a solution to these problems. It uses an US transducer, which is composed of an array of small piezoelectric elements, opposed to the conventional US transducers that have only one element. This allows multiple examinations from a single location, providing auditable data files, and more flexibility. Furthermore, this technique is much faster than the conventional US technique.182,183 The disadvantage of the phased array US technique is the limitation to thin samples. The application of this technique for investigation of voids in carbon FRC is examined, e.g. in the literature.184,185
X-ray micro-CT
X-ray CT combines a series of X-ray images from different angles of an object to create cross-sectional tomographic images that can produce a 3D representation of the object. Based on the difference in the absorption and scattering of X-ray by different materials, it allows analysis of the internal structure of the object. With the capability to focus the X-ray beam to a-few-micrometer spot size, X-ray micro-CT emerges as the most accurate technique available for 3D evaluation of microscopic features, including voids inside FRCs. Still, the accuracy of the results depends largely on the image processing techniques that are employed for detection of voids. In some studies, synchrotron micro-CT is used for high-resolution analysis of voids. These studies are specified in the text.
The voids in an RTM woven glass/epoxy composite were visualized by Schell et al.63,186 through micro-CT. In some cases, a contrast agent was added to the resin, before impregnation, in order to increase its absorption coefficient, which would result in more distinct histogram peaks of air and polymer. They could observe small spherical voids present in the resin-rich zones and large irregularly shaped voids between overlying tows. A comparison between micro-CT and some other void characterization techniques was made by Little et al.
138
They confirmed that, having no section-bias and less location-bias error, it is the most accurate and reliable technique, available for analysis of the void shape, size, distribution, and content in composites. Their micro-CT-detected voids in UD-ply carbon/epoxy composites are presented in Figure 12.
Voids in a composite with UD carbon/epoxy plies characterized by micro-CT, displayed in (a) top, (b) 3D, (c) front, and (d) side view.
138
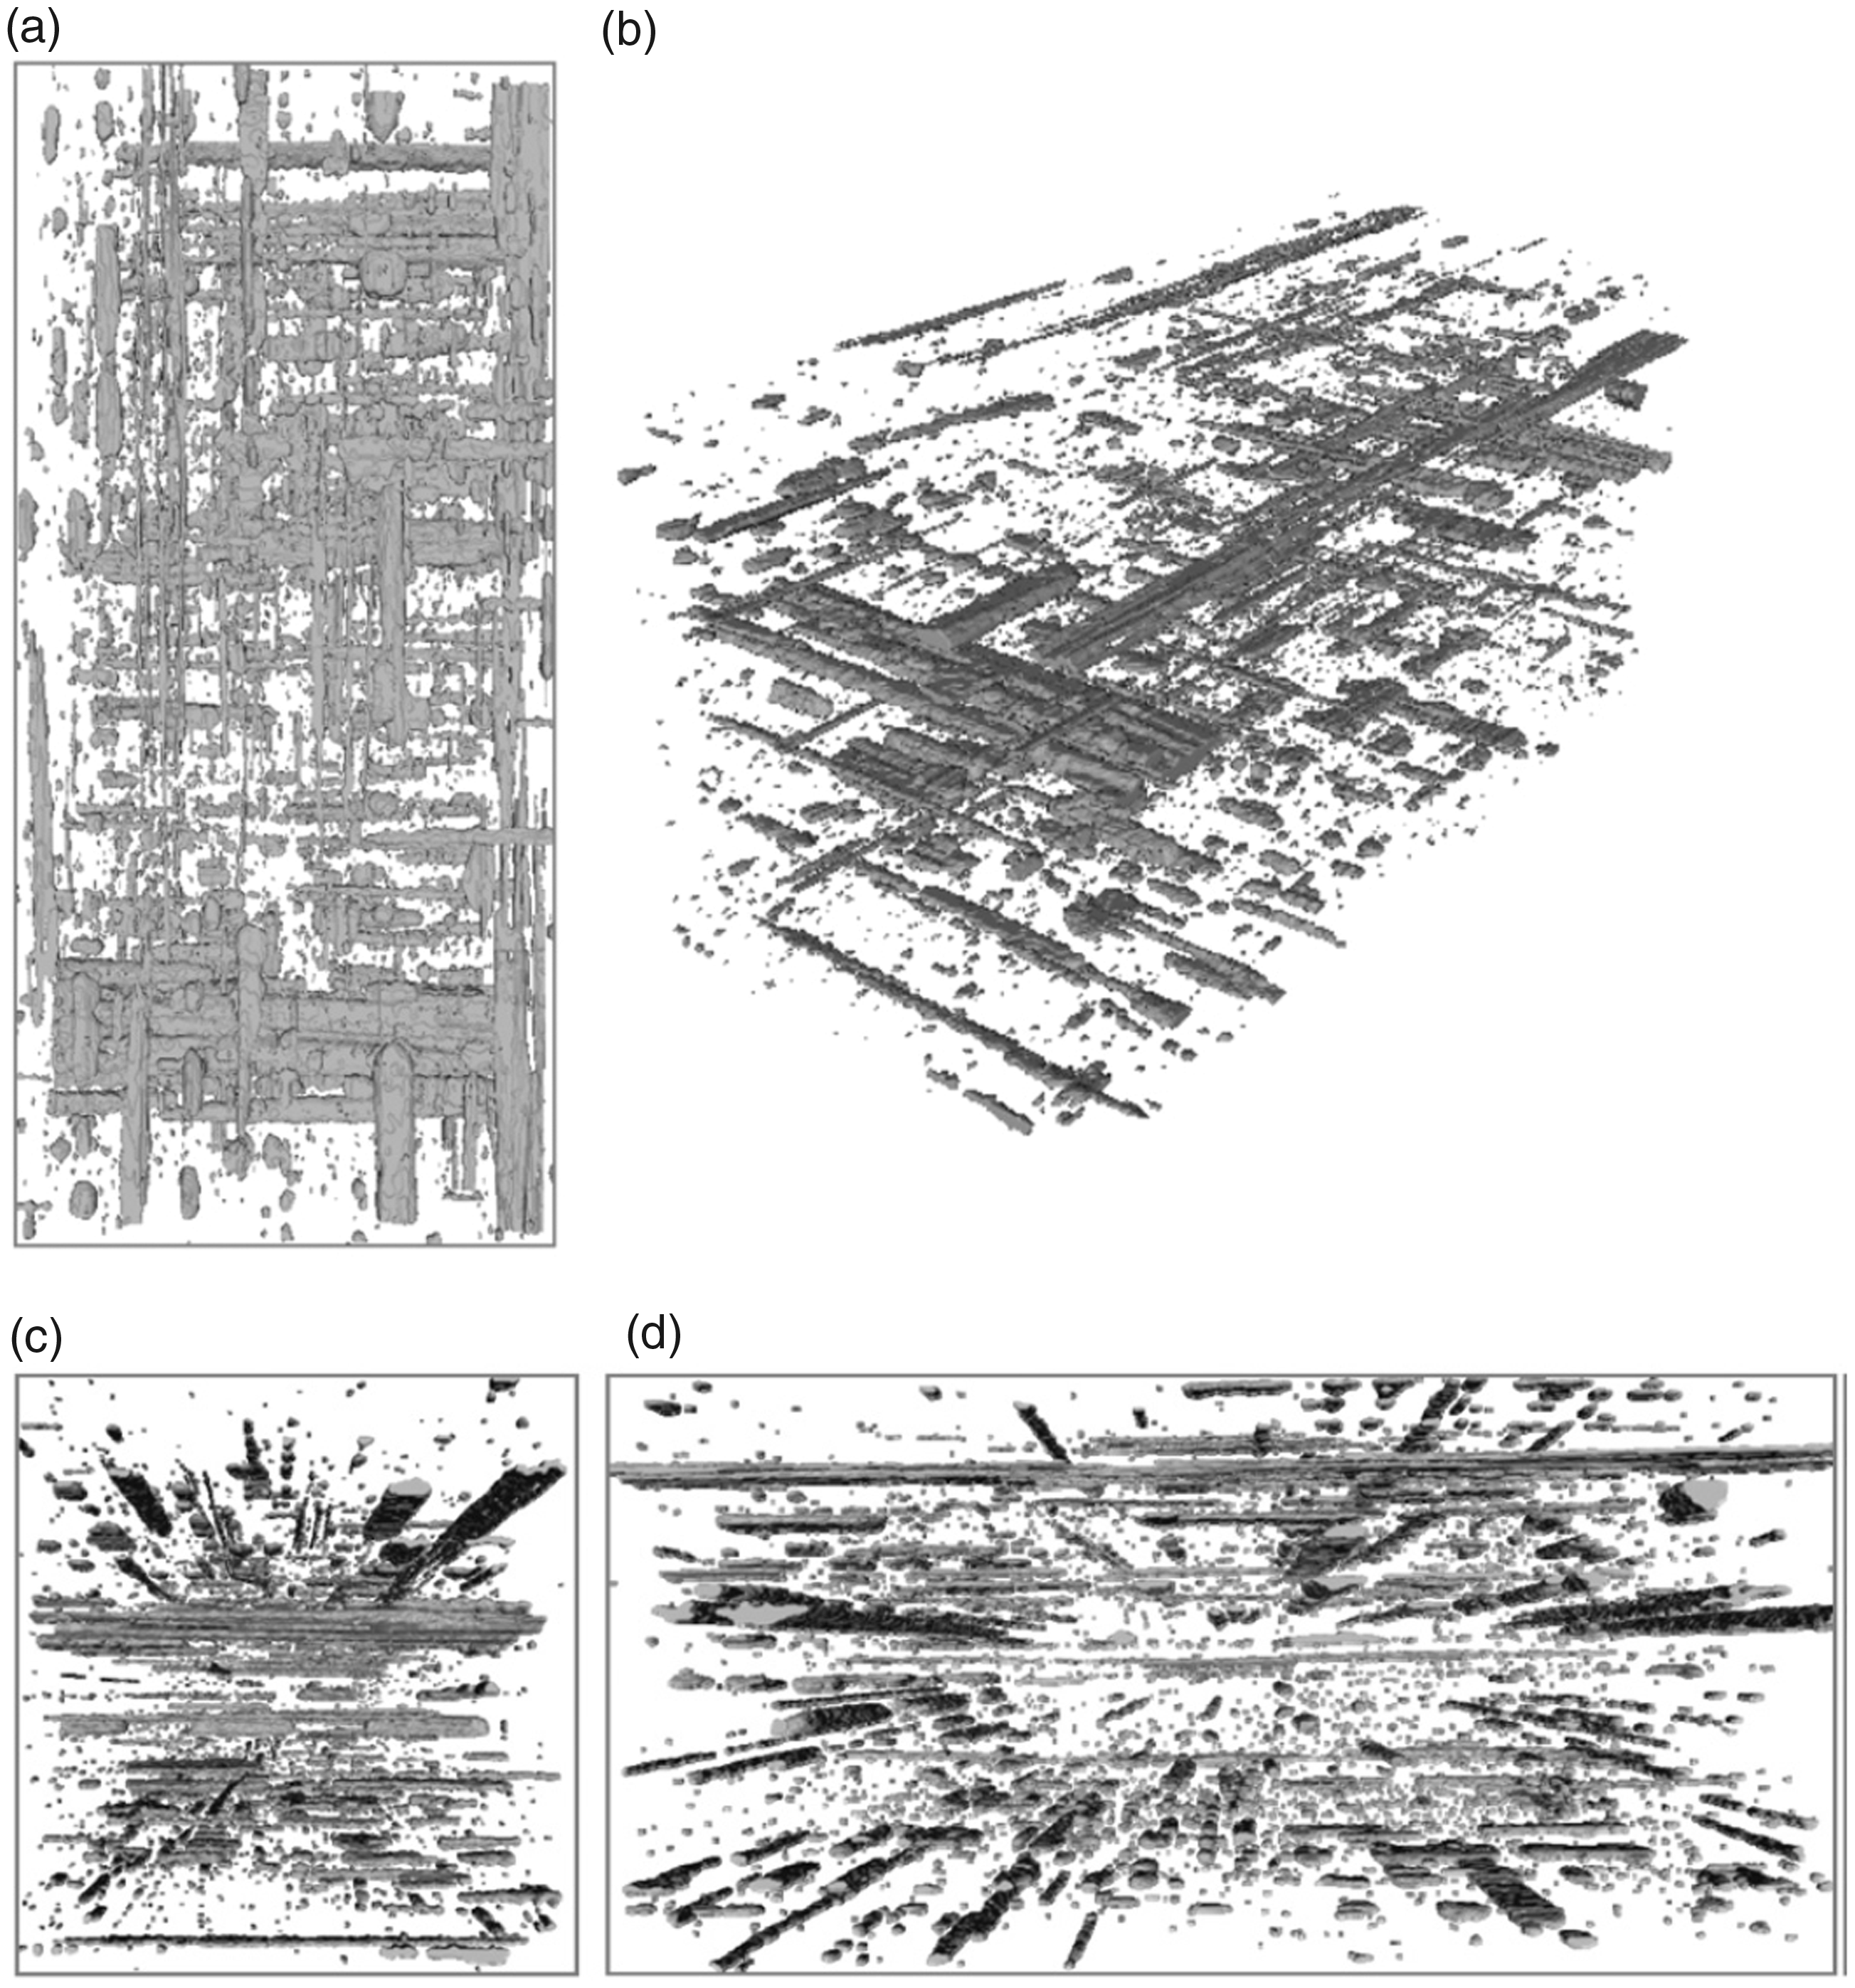
Nikishkov et al.
151
demonstrated the advantage of micro-CT over microscopy in terms of the section-bias error and concluded that the thickness view gives a more comprehensive image of the fabric composite structure, including resin-rich regions and voids, than the planar view, which has a higher error in void detection. For a woven carbon/epoxy composite, the void content resulting from the planar view varied from 0.4% to 9.5%, whereas from the thickness view, it varied from 1.3% to 4.1%. The planar and thickness views of the composite are displayed in Figure 13(a) and (b), respectively. The authors also showed that micro-CT results depend on the scan resolution and on the material-void threshold, i.e. a gray value that separates solid material from air. They developed a high-accuracy methodology, employing sub-pixel contouring for the average gray values of the air and material in micro-CT results, which was used in their void-detection algorithm. The detected voids can be observed in Figure 13(c).
Micro-CT micrographs of a woven carbon/epoxy composite in (a) planar view, (b) thickness view, and (c) thickness view with the voids, larger than a few pixels, detected by the developed algorithm in the literature.
151
The planar view reveals elongated voids in the fiber direction inside tows, small spherical voids in resin-rich regions, and flat voids between plies (shown schematically in Figure 14(b)).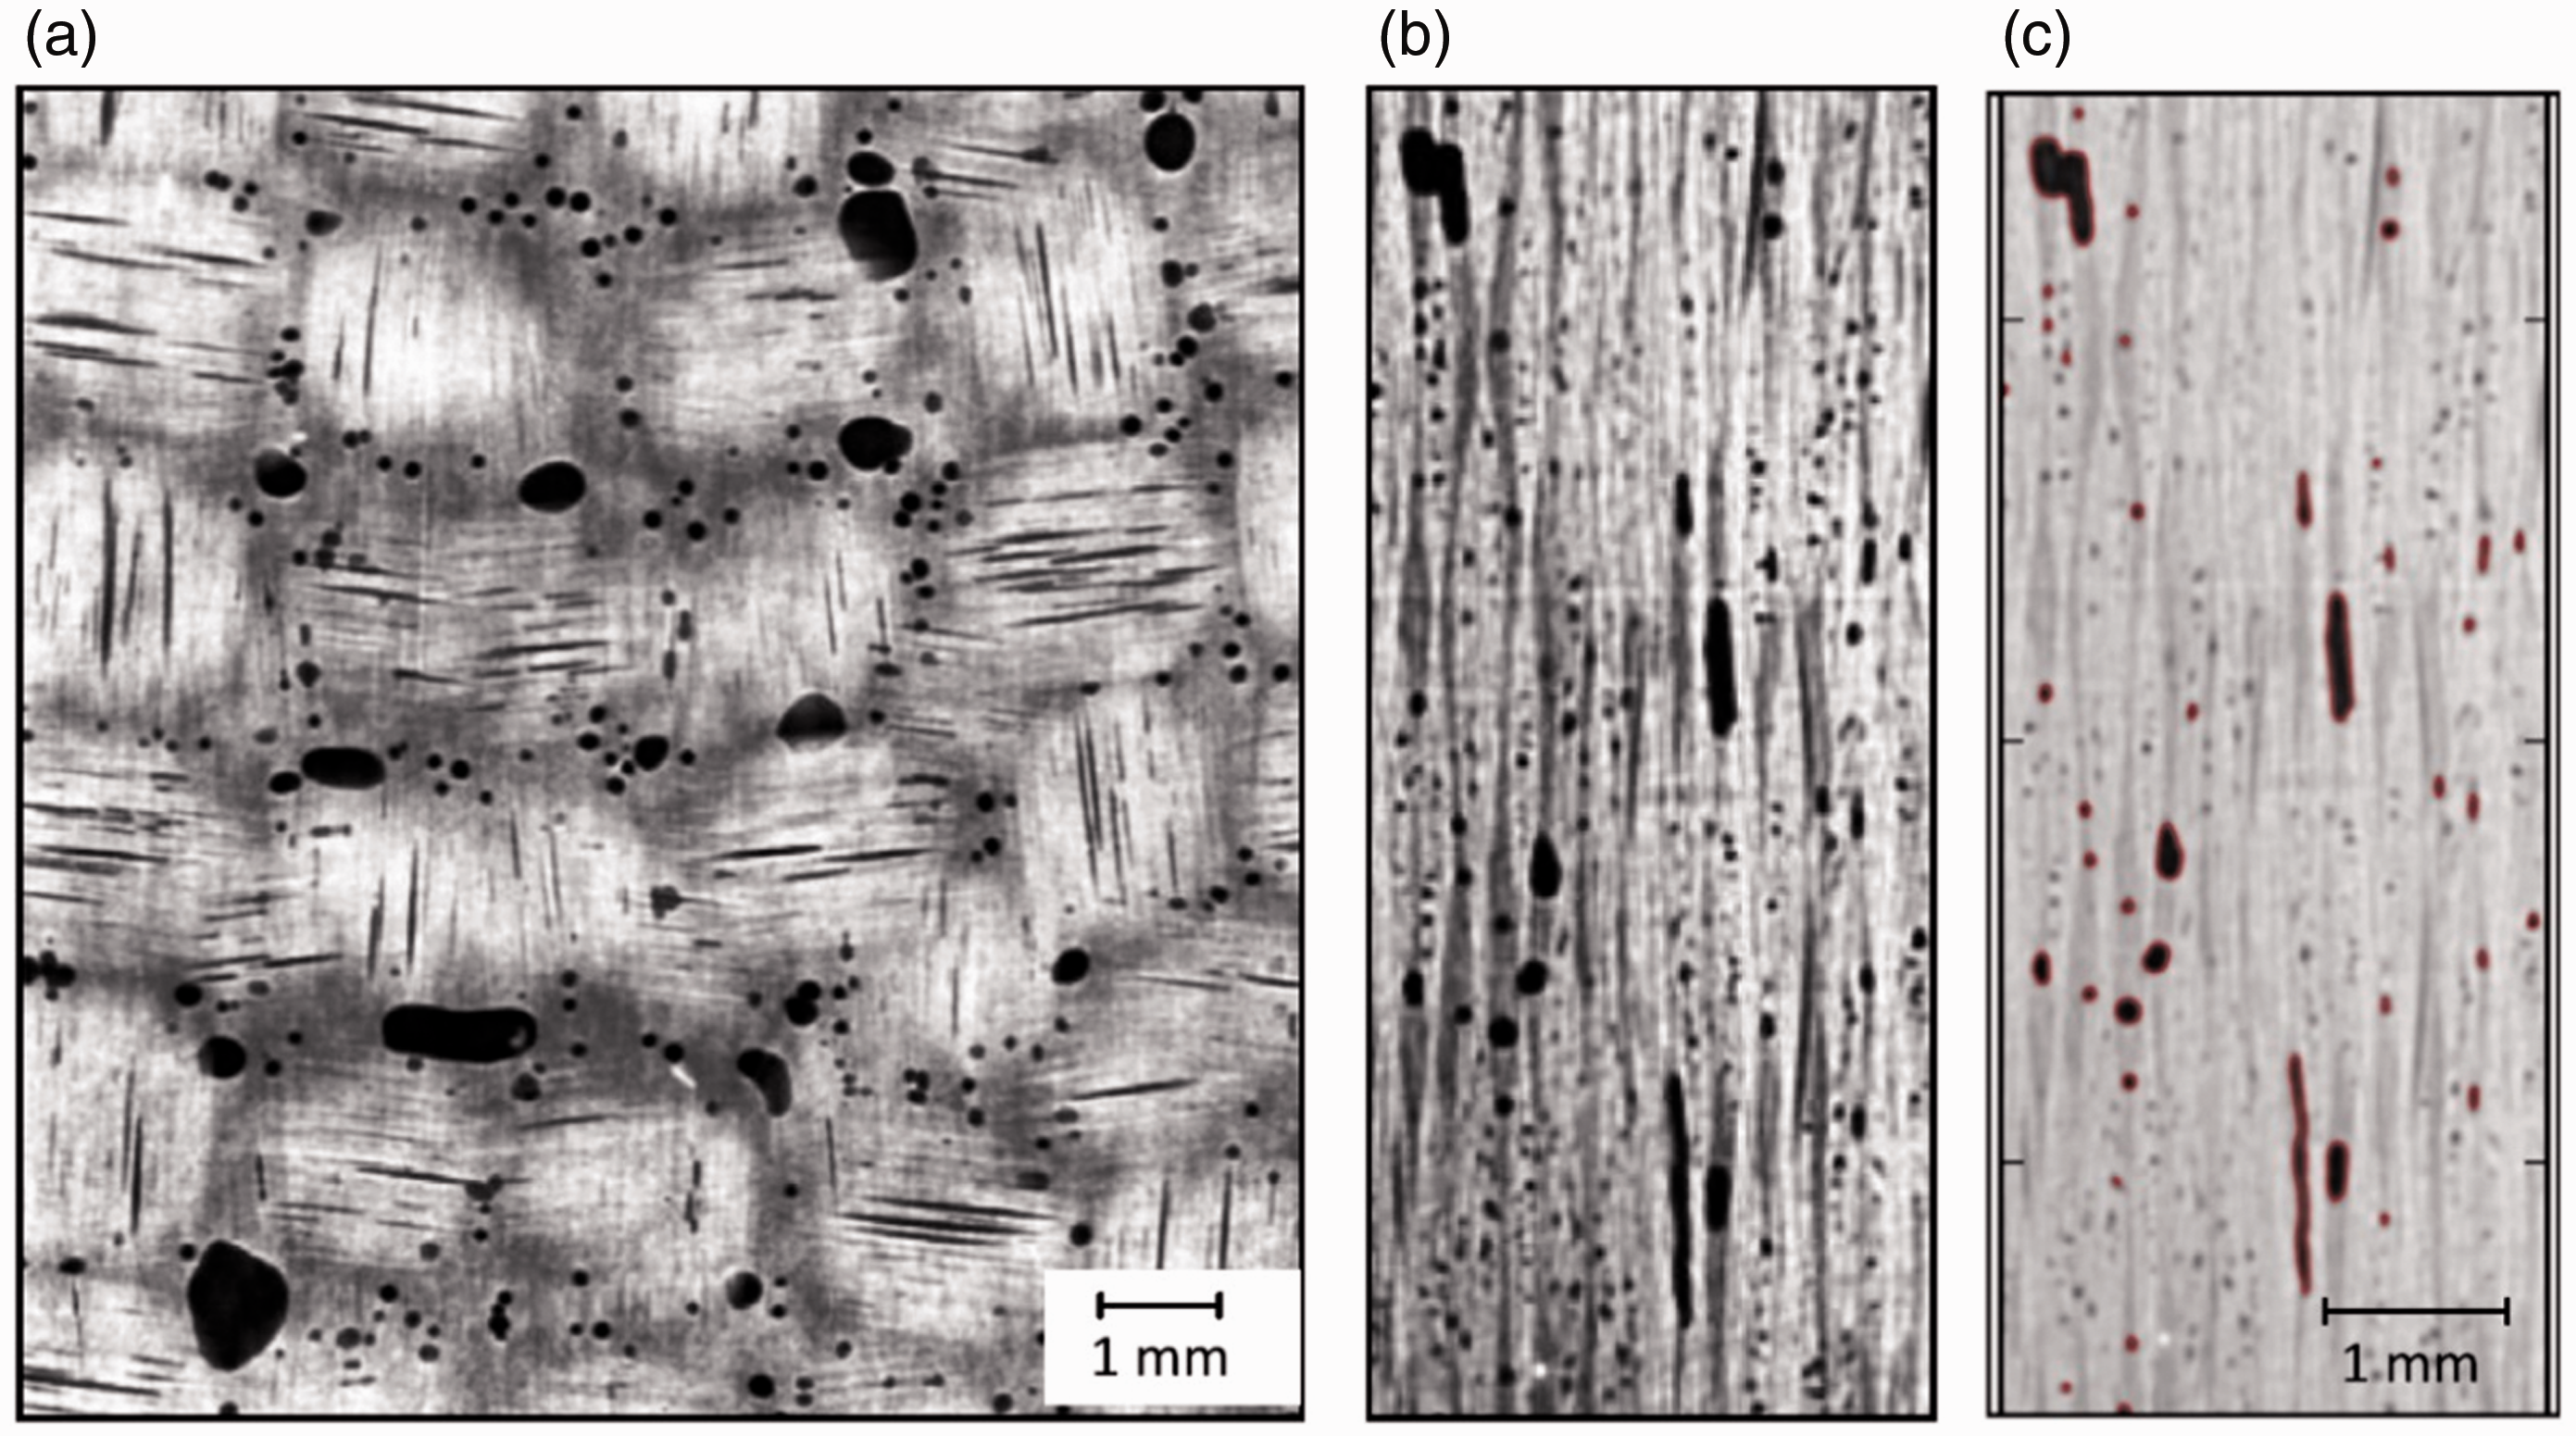
For a woven glass/thermoplastic composite, Madra et al. 141 conducted a micro-CT analysis of voids in three scales: composite bulk, a textile layer, and a single yarn. This required the development of a set of image processing algorithms and procedures. They claimed that for segmentation of the signal, being performed to discriminate between matrix, fibers, and voids, a standard thresholding method could not be used due to the low contrast. Instead, a learning algorithm developed for data mining was used, segmenting each image into three regions: matrix, fiber, and void. Thresholding was followed by median filtering to remove 1-pixel-size (salt and pepper) noise, arising during thresholding. They observed that the bulk analysis resulted in larger values for the void content than that obtained with the density determination (Archimedes) technique. This was attributed to the voids that were not accounted for (voids that are connected to the specimen s outer surface) in the latter approach.
Void characteristics of an RTM epoxy composite reinforced with UD carbon fiber tows, held together by woven glass fiber tows (quasi-UD NCF), was investigated by Sisodia et al. 48 at two different scales, using synchrotron radiation. To extract data from the 3D representation, a statistical two-point correlation was performed in MATLAB, which gave a contour map, representing the average shape of voids. Some results of these characterization studies are further discussed in the Void characteristics section.
More recently, Straumit et al.187 used the structure tensor method to build a voxel model with the fiber orientation data extracted from micro-CT images (VoxTex software). Using the k-means clustering algorithm, they could segment the voxel models into yarns, matrix, and voids, which can be used in creating realistic models of the composite. The voidage in tubular braided Kevlar/epoxy composites was evaluated using micro-CT by Melenka et al.188 They identified and quantified individual voids using MATLAB. A full analysis of void content, size (distribution), and location was performed, of which some results are presented in Void characteristics section.
The void content measured via micro-CT was compared with that determined via other techniques. In the analysis of a UD carbon/epoxy composite, using synchrotron micro-CT, Yang and El-Hajjar 152 manually separated individual voids after segmentation of voxels. They noted that below 6% of void content, 2D cross-sectional microscopy gives slightly higher values for the void content than those obtained from micro-CT. Above 6%, the results from the two techniques did not agree. They argued that this divergence is due to the section-bias error in optical microscopy, and could be even higher for multidirectional laminates. In an unconsolidated carbon/PEEK prepreg, Zhang et al. 118 found that 2D optical microscopy gives a higher void content than 3D micro-CT, attributed to the higher resolution of microscopy. With the same reasoning, the number of detected small voids increased with improving the resolution of micro-CT. However, for an NCF glass/epoxy composite, Abdelal and Donaldson 187 concluded that micro-CT could detect the high increase in void content with decrease in manufacturing vacuum, while the increase detected by “manual” tomography (explained in Void shape (morphology) section) and density determination techniques were less significant. They found the US technique incapable of identifying the voids in their case. For a woven carbon/epoxy composite, Di Landro et al. 188 reported a general trend: Similar void contents were measured with micro-CT and density determination, but the values measured with SEM were smaller. They observed a higher discrepancy between the results of the three methods at void contents above 5–6%, attributed to the void orientation effects.
Micro-CT studies for investigation of void formation, characteristics, and effects in different composites as reported in the literature.
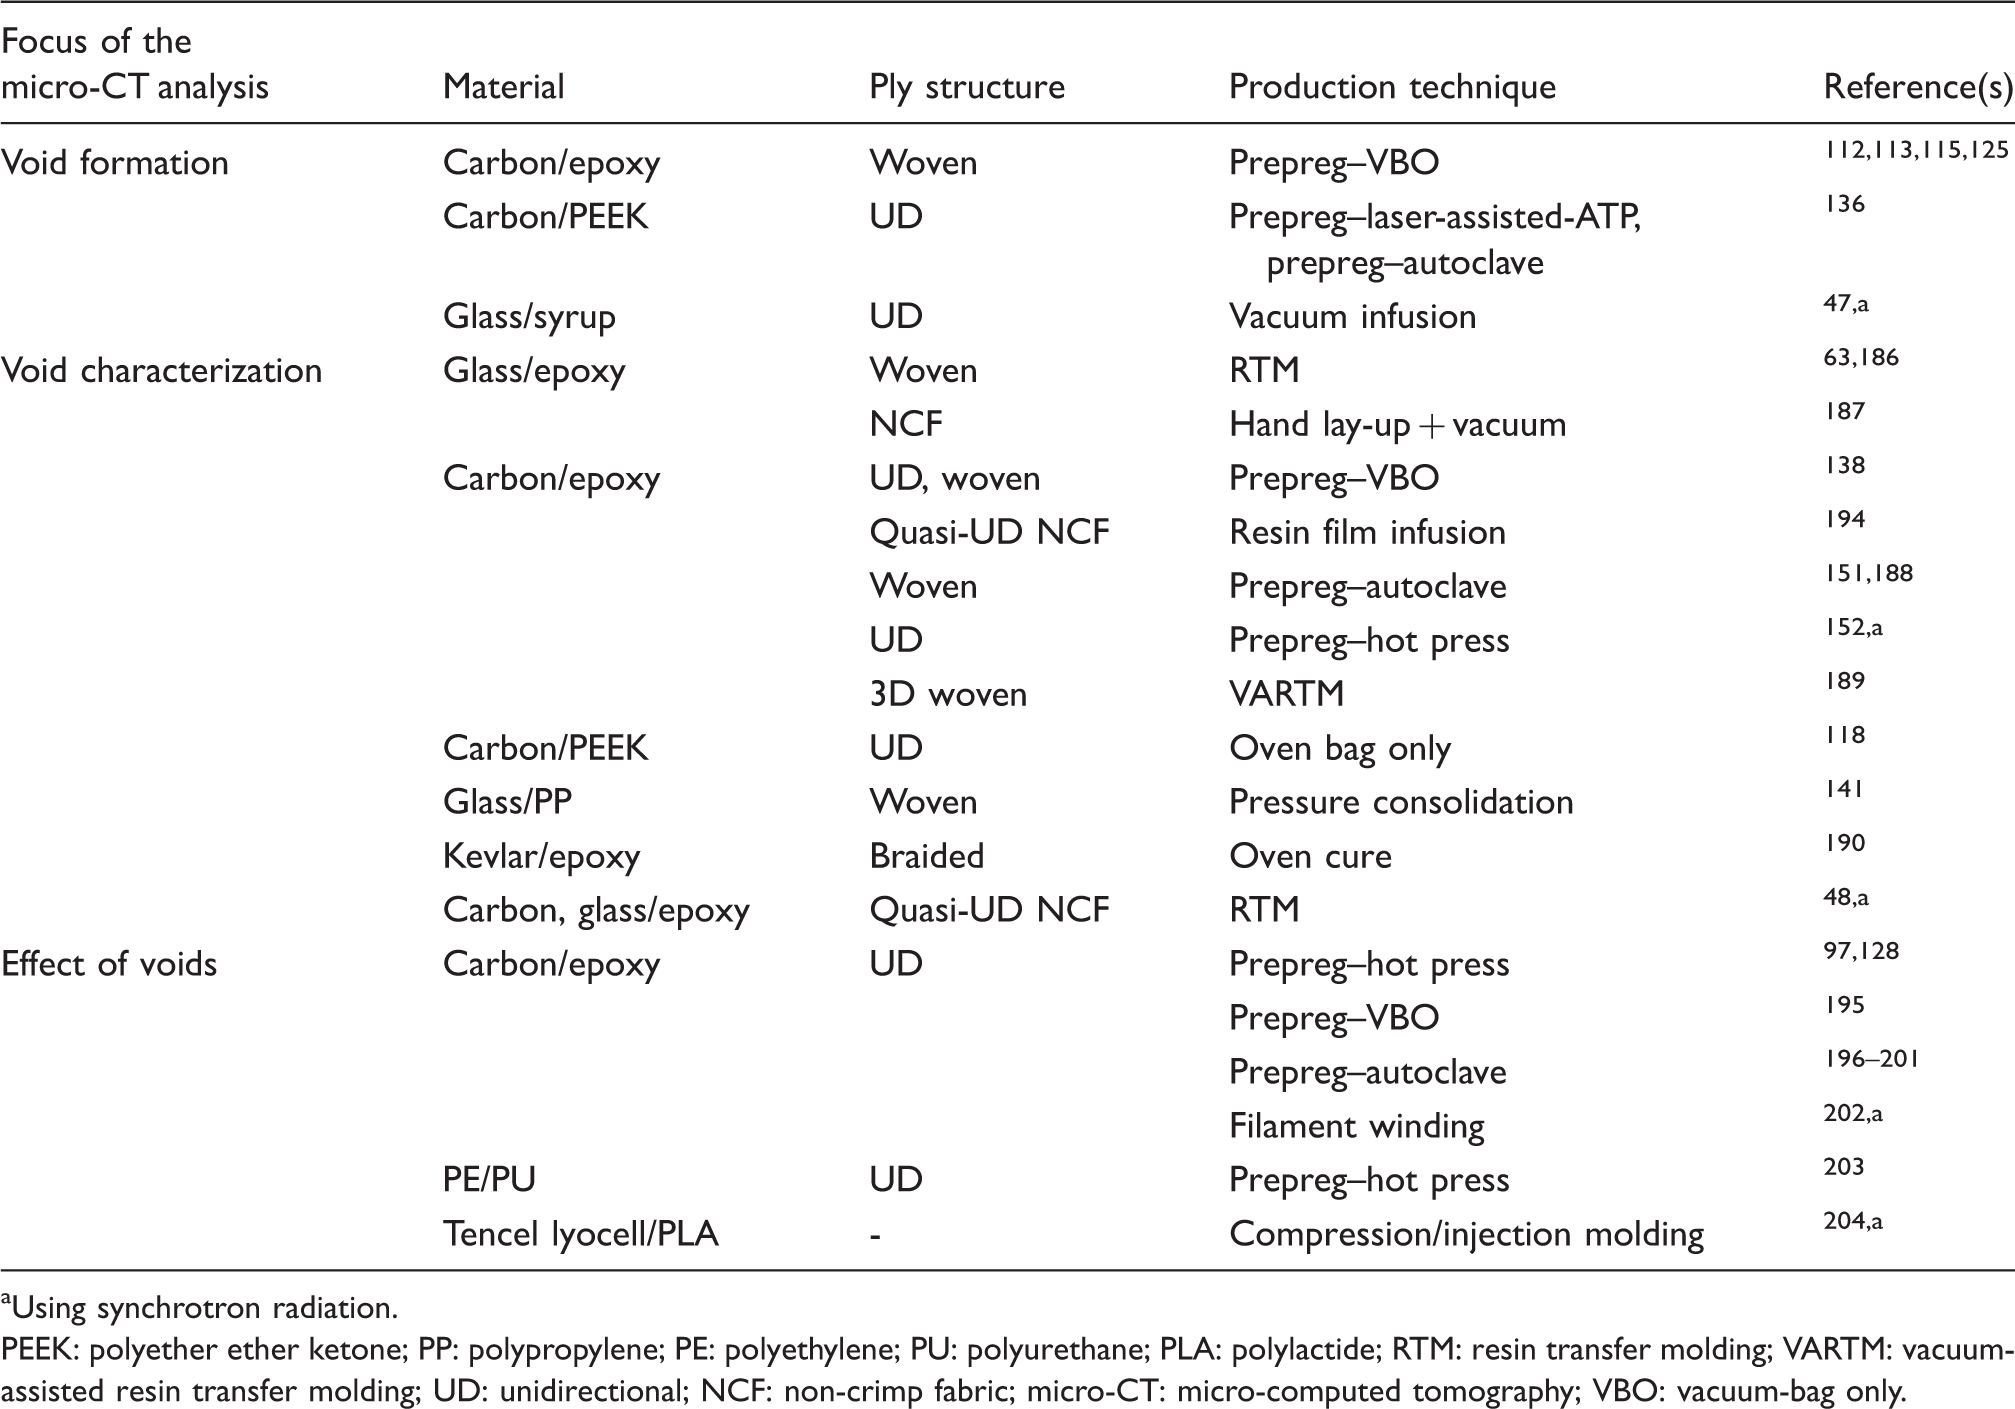
Using synchrotron radiation.
PEEK: polyether ether ketone; PP: polypropylene; PE: polyethylene; PU: polyurethane; PLA: polylactide; RTM: resin transfer molding; VARTM: vacuum-assisted resin transfer molding; UD: unidirectional; NCF: non-crimp fabric; micro-CT: micro-computed tomography; VBO: vacuum-bag only.
It needs to be noted that there are other tomographic approaches, for example, optical coherence tomography, which uses optical light instead of X-ray, and is applicable to optical scattering media like glass fiber composites. 193
Other void characterization techniques
X-ray radiography in contrast with X-ray micro-CT produces a 2D projection of a volume. Low-energy radiographic inspection of composites can reveal useful information about voids. 205 However, voids can be detected by X-ray radiography only through thickness137,191 and only if their size is appreciable in relation to the specimen thickness. 8 If a radio-opaque substance penetrates into the voids, due to improvement in the contrast, better radiographs can be obtained. 8 However, difficult penetration of large parts, and the effect of penetrant on the mechanical properties are the main drawbacks of this approach. 137
Thermography is a simple, fast, reliable, and non-contact technique to detect voids in large composite parts. 206 Heating is applied to the composite either directly or indirectly (for example, via cyclic stress 172 ), the temperature of the surface is monitored either on the same side or on the opposite side, and the anomalies in the temperature distribution are detected as they reveal the presence of defects such as voids that modify the apparent thermal diffusivity. It has been seen that for the samples with high voidage, smaller temperature rises were captured on the opposite side, requiring longer times to reach the maximum. 207 The conductivity and anisotropy of the composite, and the depth at which the defect is located are important. It has been shown that this technique is also applicable to natural-fiber composites (kenaf/polyurethane (PU)). 208 According to Meola and Toscano, 209 characterizing voids based on their thermal diffusivity in flash thermography can be used as an alternative for US techniques. Moreover, it is safe and independent of the surface finishing. High equipment costs and low sensitivity (in comparison to US techniques) can be counted as its drawbacks. 8
Shearography uses the strain concentrations induced by the defect to identify them. The strain concentrations are translated into anomalies in the fringe pattern, which reveal the presence of defects. Shearography is a full-field and non-contacting NDT&E method and does not require fluid coupling. 210 It is one of the laser-based NDT&E techniques, which requires a very high stability of the test piece and the inspection instrument in relation to each other. That is why it is rarely used in industry. 211
Terahertz (THz) time domain spectroscopy employs the terahertz domain of electromagnetic radiation to penetrate into the object for inspection purpose. Due to the lower THz absorption of air, THz radiation is suitable for detection of voids within a composite provided that THz waves can penetrate the part. Stoik et al. detected hidden voids in aircraft composites, using transmissive 212 and reflective 213 terahertz time domain spectroscopy.
Concluding remarks on void characterization
Advantages and disadvantages of the main techniques used for void characterization.
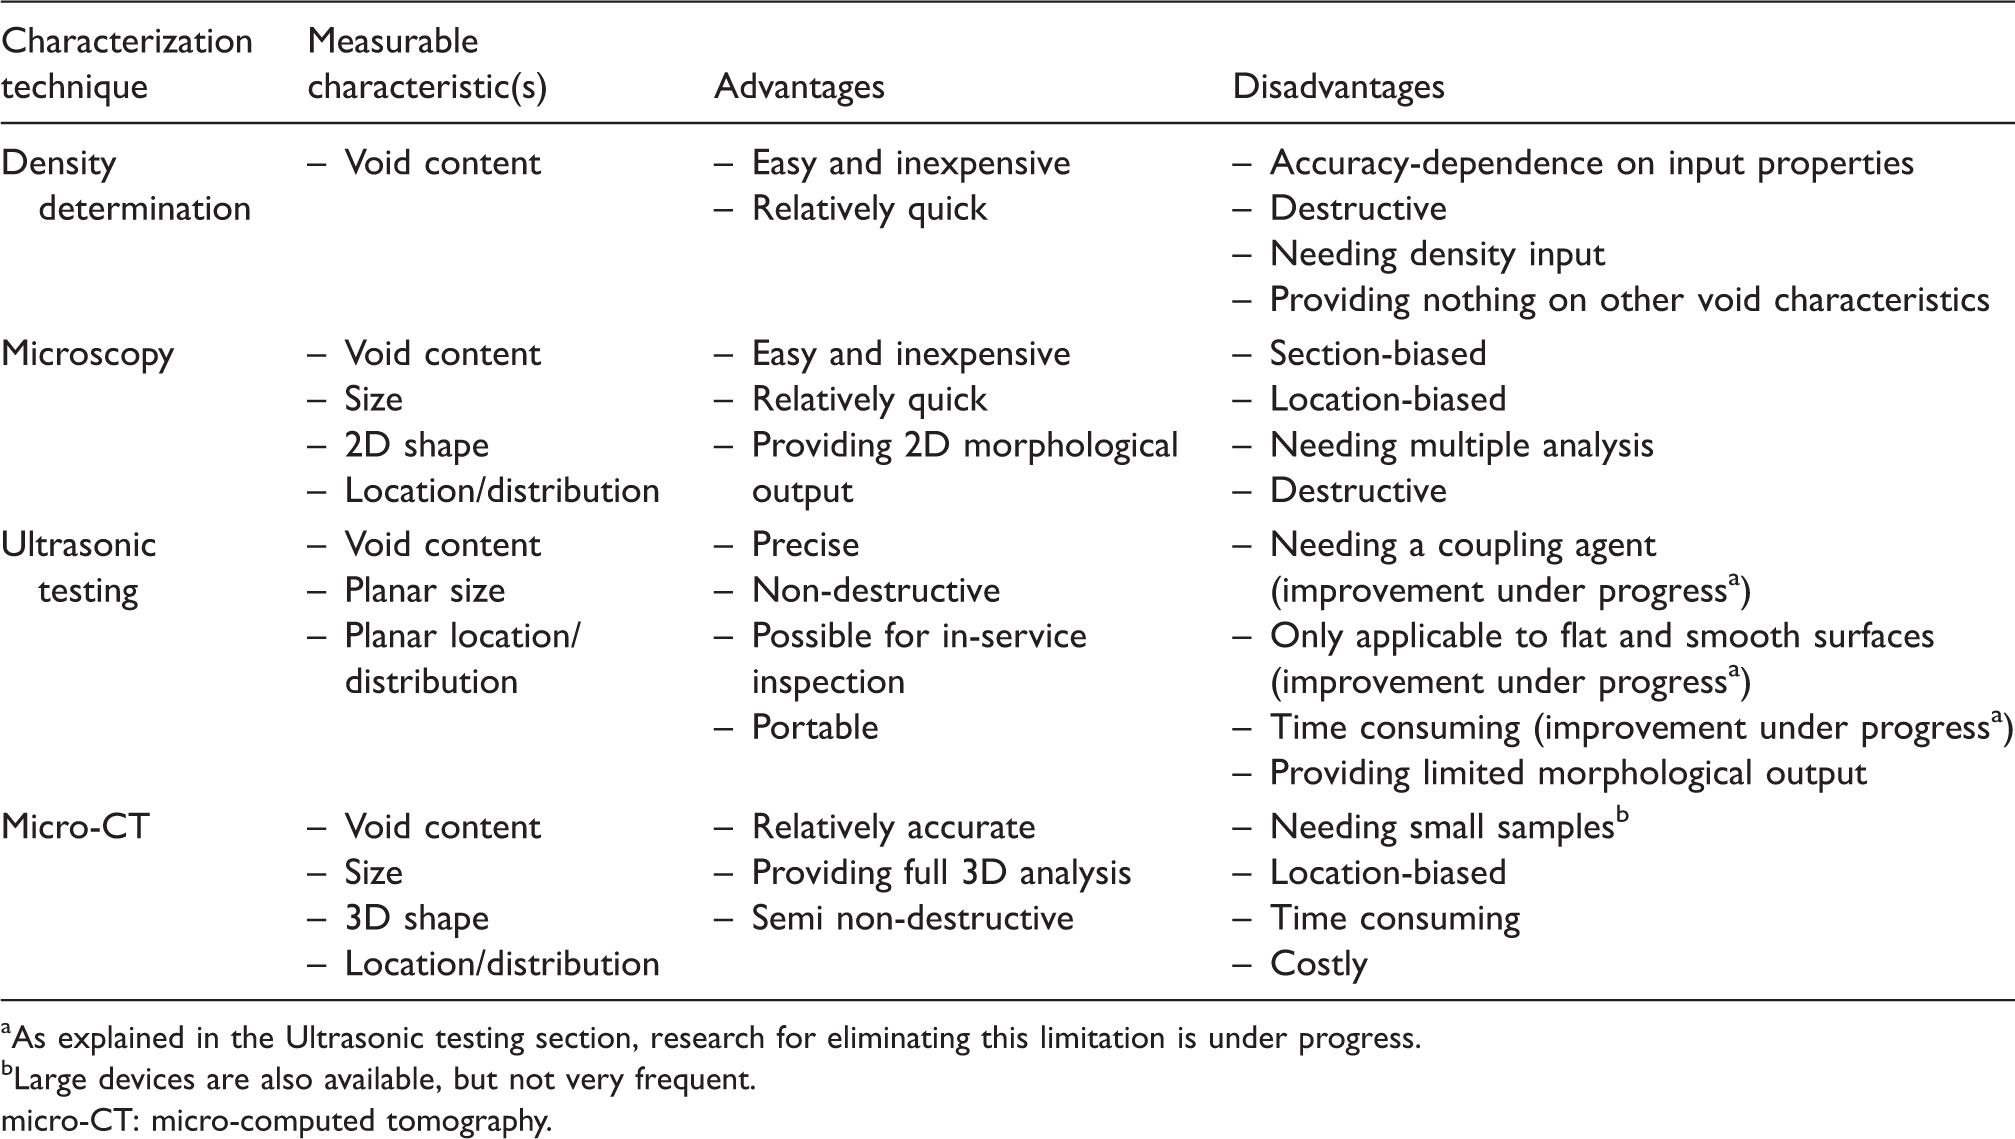
As explained in the Ultrasonic testing section, research for eliminating this limitation is under progress.
Large devices are also available, but not very frequent.
micro-CT: micro-computed tomography.
Ultrasonic testing remains to be the main industrial NDT&E tool for assessment of the void content and making a reject/accept decision, with mature and standardized industrial testing apparatus and procedures. The ultrasonic inspection, however, does not give accurate information on void morphology, size of individual voids (and statistical distribution of these parameters), and spatial distribution of the voids.
The most advanced and reliable, albeit expensive, tool for precise and detailed observation and investigation of voidage is micro-CT. Methods of quantification of the micro-CT images are emerging, but still are an active research subject and will probably be matured in the coming five years. High fidelity micro-CT is limited to specimens of small sizes.
Void characteristics
The main characteristics of voids in FRCs are void content, shape, size, location, and distribution. These characteristics can be very different, even in different locations of the same specimen. Void content and distribution in a specific FRC are influenced by material properties (e.g. polymer rheology, wettability of fibers by polymer, and volatile components in the polymer), and processing parameters (temperature, pressure, and time).7,82 Void shape, size, and location may be very different in different material systems and/or process types. 2 A general study can be performed on void characteristics, influenced by constituent materials, reinforcement structure, stacking sequence, and manufacturing process. It is worth noting that in most studies on void analysis, the voids are deliberately produced under specific production conditions, and hence the results may not reflect the void configuration in real manufacturing. Nevertheless, this artificially produced voidage can be representative, at least for those specific conditions. Furthermore, this seems to be the only way to allow systematic investigations of void characteristics.
Void content
Void content is the first and most frequently used characteristic in the analysis of voidage in composites. It is defined as the volume fraction of the voids in the composite, usually reported in percent. Void content can be measured through the methods discussed in the Characterization of voids section, of which the accuracies are different. Matrix material, 131 moisture and solvent content,88,108 stacking sequence, 97 and composite thickness 214 are some of the factors acting on void content in addition to the manufacturing technique and processing parameters.
In LCM, the void content can be controlled through optimization of the capillary number, injection pressure, and vacuum level. 11 In autoclave curing, the vacuum level and the pressure and temperature profiles mainly determine the void content. 93 For automated thermosetting lay-ups, prepreg variability, in terms of initial voidage, resin content, and surface roughness, is the dominating factor when they are autoclaved, 98 while compaction pressure and temperature also become significant once they are to be in situ consolidated at high pressure and temperature. 132 Void content in automated thermoplastic lay-ups can be controlled through control of the prepreg variables (e.g. void content, level of crystallinity, dimensional tolerance, and fiber volume fraction), the temperature, force, and contact time of the compaction rollers as well as by the cooling rate of the laid up part.133,134,136 In OoA prepreg-based processes, the degree of impregnation in the prepreg and rheological evolution of the polymer greatly influence the void content, 13 and processing cycles that do not provide enough time to evacuate voids result in high void contents.97,114 Additionally, the vacuum level (for VBO processes), resin moisture, initial degree of cure (or ambient out-time), fiber density of tows, and geometric complexity and size of the part play a substantial role in the formation and evacuation of voids.
Overall, composite parts with low void contents are easier (but not cheaper) to be produced through autoclave processing. That is one of the reasons why it has been widely employed in aerospace applications, where void contents above ∼1% are not tolerated. 140 In some other applications, void contents up to ∼5% are allowed. It will be explained in the Effect of voids on mechanical properties section that the void content is not an accurate measure for determination of the voidage significance.
Void shape (morphology)
The void shape in FRCs is influenced by the manufacturing process,147,215 reinforcement structure,89,147,216 stacking sequence,97,217 void location (i.e. in between the fibers or in resin-rich regions),151,218 and prepreg conditions. 104 Because of all these different influencing factors, it is difficult to expect a universal statistical database of void morphologies. 147 Nevertheless, similarities between void morphologies for different reinforcement structures and fabrication processes have been found.
The available techniques to explore void morphology are microscopy and micro-CT. As discussed, microscopy suffers from the section-bias and location-bias error, causing voids to appear with different morphologies (and size) in different 2D section views and different locations, which are not necessarily representative. However, most of the works where the void shape was analyzed through microscopy have used a transverse cross-sectional view, allowing a comparison of the same type of view of voids in different composites. Some studies combined both thickness and planar views to obtain a better visualization of the voids.32,150,219 In the current review, “cross-section” refers to the thickness view, which is perpendicular to the plies, unless otherwise specified. An accurate investigation of void morphology in composites can only be achieved through tomographic analyses, such as micro-CT, that so far has been performed for several material/processing systems, as summarized in Table 1.
UD-ply composites b
Void morphology in composites built up from UD prepregs has been studied the most. Stone and Clarke
99
reported a change in the void morphology with an increase in the void content, from small and spherical (volatile-induced) voids between plies to inter-laminar (air-entrapment) voids, which are “flattened and elongated”. Hsu and Uhl
147
carried out one of the first systematic studies on void morphology in UD-ply composites. They conducted a “manual” tomography by cutting consecutive thin slices perpendicular and parallel to the fiber direction, and performing microscopy and image analysis on them. It was observed that voids, which were mainly inter-laminar, do not have a circular cross-section, but mainly flat irregular cross-sections. The average height-to-width ratio of the voids was 0.35 (void size parameters are illustrated in Figure 14). Most of them were elongated in the adjacent fiber direction, and voids with large cross-sections were quite long (“needle-like voids”). The authors reported that there is a large length-to-width or length-to-height ratio (respectively ∼15 and ∼50) for inter-laminar voids between plies with the same as well as different orientation, which seems to be common for different volume fractions and manufacturing processes.
Schematic representation of typical void morphologies in: (a) UD-ply composites and (b) woven-ply composites, for which the micro-CT representations are shown in Figures 12 and 13, respectively.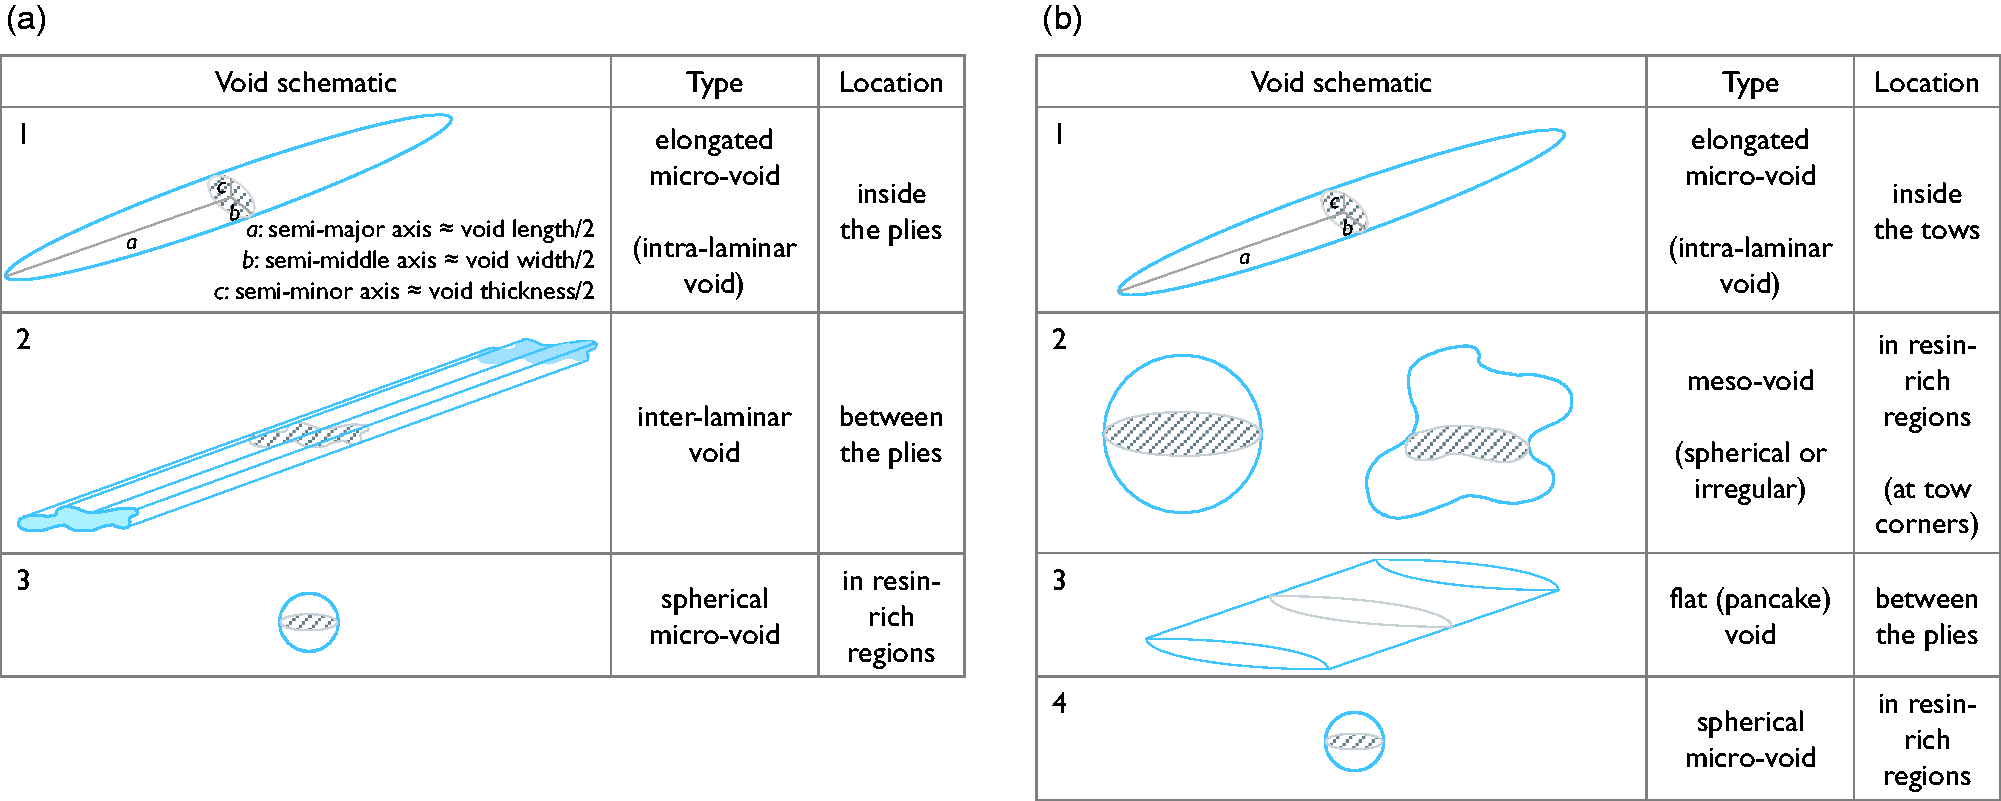
Gürdal et al. 144 observed that intra-laminar voids in each UD ply are also elongated mainly in the fiber direction. Their microscopy and image analysis results showed the voids have “cylindrical morphology and elliptic cross-section”, with an average length/radius ratio of ∼40. Rubin and Jerina 220 stated that inter-laminar voids in UD laminates have “airfoil cross-section” and run along the fibers. Using the manual tomography method, Olivier et al. 103 observed that no void developments had happened in perpendicular direction to fibers; larger voids were present mainly between the plies (inter-laminar), and the voids were in contact with the fibers, which caused local change in the distribution of surrounding fibers. The elongated morphology of voids in UD-ply composites is reported in many other studies and expressed with different terminology such as “elliptically cylindrical”, 89 “cylindrical inter-laminar”, 221 “cigar-shaped”,222,223 “large and long”, 224 “flat and elliptical in cross-section”, 146 “flattened”, 101 “rod-like shape”,97,128 and “cylindrically shaped”. 203
The change in the void morphology with the void content in UD-ply composites, reported by Stone and Clarke, 99 was endorsed by Stamopoulos et al. 198 through micro-CT analysis of voids, where the authors showed that the shape of the voids changed from “spherical” or “ellipsoidal” to a “needle-shape”, when the void content increased. This was related to the curing pressure by Liu et al. 101 and Guo et al. 225 They concluded that for high curing pressures (low void content), only small spherical voids in resin-rich regions may exist, while for low pressures (high void content), much larger, flattened, and elongated voids with elliptical or different irregular cross-section exist mostly at the ply interfaces. Li et al. 106 affirmed that “globular” (using their terminology) voids mainly result from resin volatiles and “columnar” shape voids are the result of gas entrapment during fiber impregnation or laying up.
For quasi-UD flax FRCs, Li et al. 226 observed that for low hot-press pressures, large and semi-spherical voids were mostly situated between the flax yarns and at the interface between fiber and matrix, whereas for high pressures, more microscopic voids were located inside the yarns. It was reported by Liebig et al.218,227 that intra-laminar voids between carbon fibers have a high length-to-width ratio (“wormhole” void), while inter-laminar voids with an irregular shape (“cumulus-clouds” voids) could be observed in resin-rich regions between plies. The typical morphologies of voids in UD-ply composites are schematically exhibited in Figure 14(a).
In a precise analysis of void morphology in UD laminates produced in a hot press with the identical constant pressure, but four different temperature profiles, Hernández et al.,
128
using micro-CT, observed that voids in the final part were mainly inter-laminar with a rod-like shape, resulting from air entrapment between the plies during laying up. They fitted each void into an equivalent elliptic cylinder with the same volume, centroid, and moments of inertia as those of the void (Figure 15(b)) and found that the maximum misalignment between the major axis of the cylinders and fiber direction was below ∼1.5°. Flatness ratio (f), i.e. the ratio between the transversal axes of the elliptical cross-section, was ∼1.5, regardless of the cure cycle (Figure 15(d)). They pointed out a dominant effect of the applied pressure on the cross-sectional shape of the voids. The elongation factor, i.e. the ratio between the major axis and the average transversal axis, increases with the volume of individual voids, however, with a deceasing increase rate. In other words, the larger the void, the longer it becomes. This affirms the existence of two different void sources: small voids, with more rounded shape, originate mainly from the prepreg itself, whereas large and elongated voids arise from air entrapment between the prepregs during laying up. In a later study, Hernández et al.
97
observed that in a quasi-isotropic (QI) laminate, voids are predominantly elongated in the fiber direction of their (adjacent) ply (Figure 16). Fitting them to an equivalent ellipsoid, it was observed that cure cycle did not change the morphology (which was determined by elongation and flatness factors) of the voids, but the laminate stacking sequence did.
(a) Micro-CT characterization of voids in the UD carbon/epoxy composites, manufactured through four different curing cycles C-1, C-2, C-3, and C-0; (b) a typical rod-like void displayed with its equivalent cylinder; (c) complex viscosity and temperature profiles in the four cure cycles – pressure was held constant (2 bars) during every cycle; (d) void content (Vf), flatness ratio (f), i.e. the ratio between the semi-axes of the ellipsoidal cross-section, and average distance between regions with high voidage along the width ( Void density (number of voids per mm
3
) versus the orientation of the major axis of the equivalent ellipsoid in the quasi-isotropic carbon/epoxy composites, manufactured through the three different cure cycles shown in Figure 15(c). The graph indicates that the voids are predominantly elongated in the fiber direction of their (adjacent) ply.
97
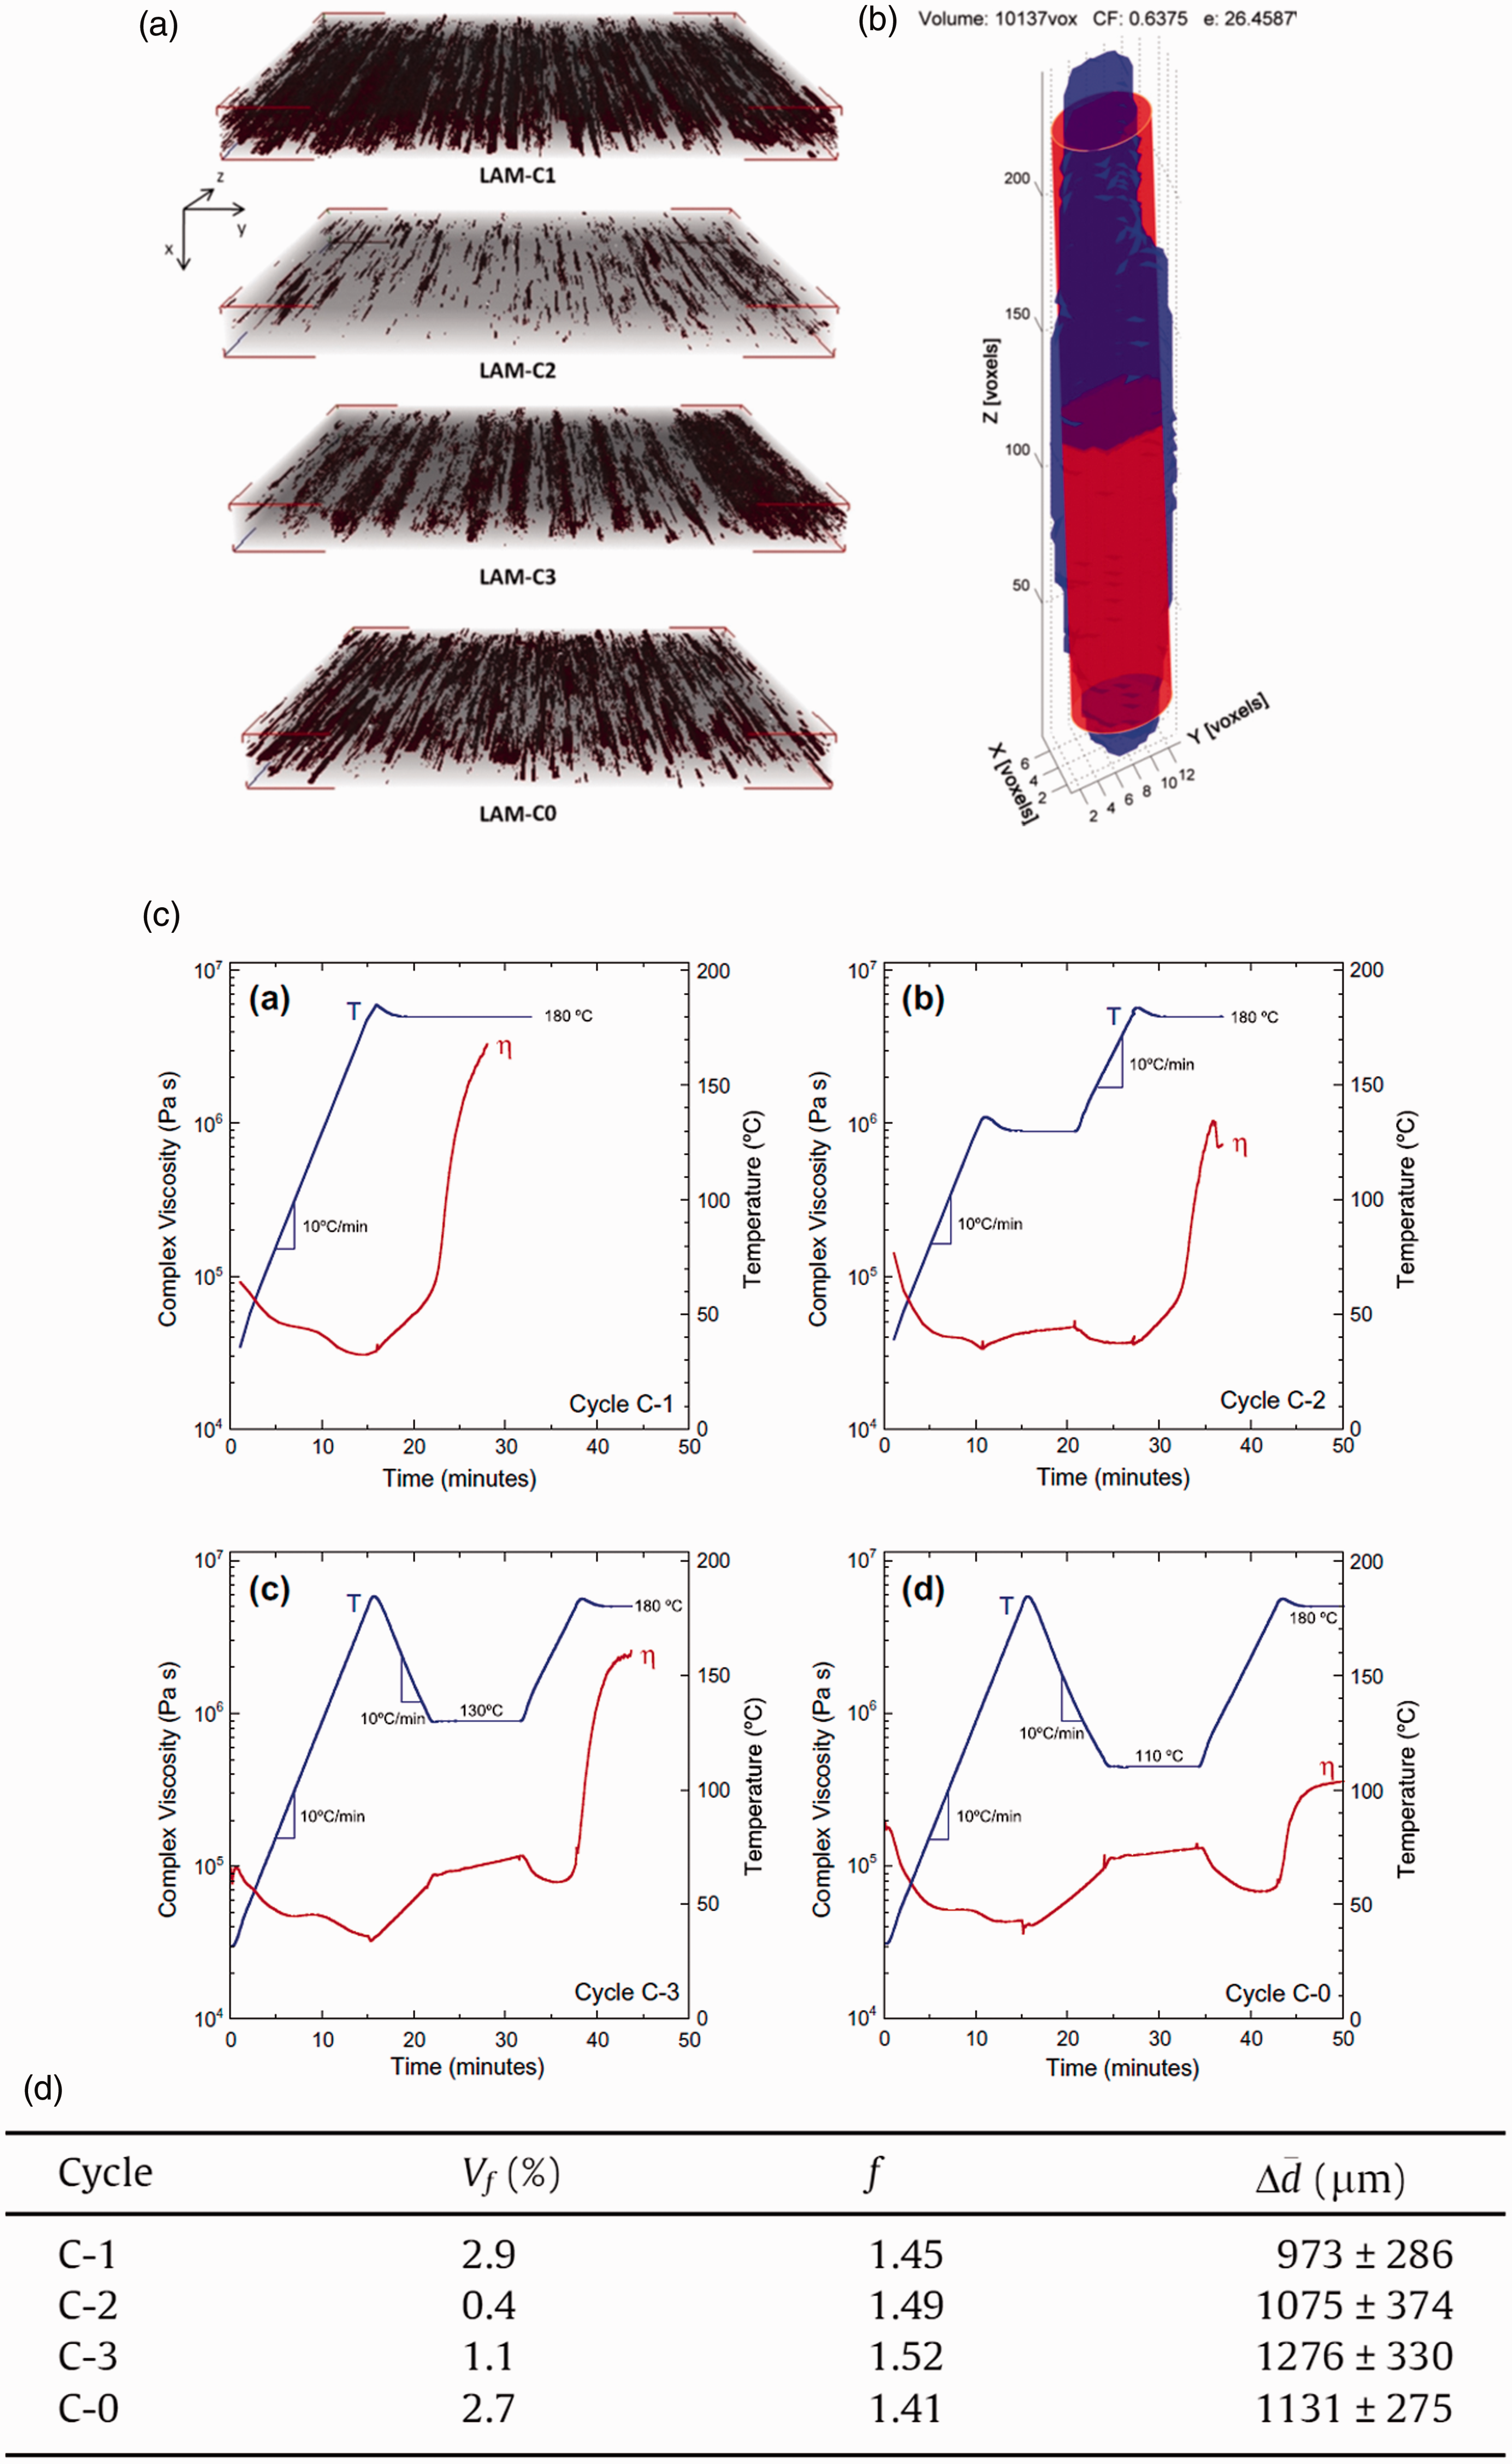
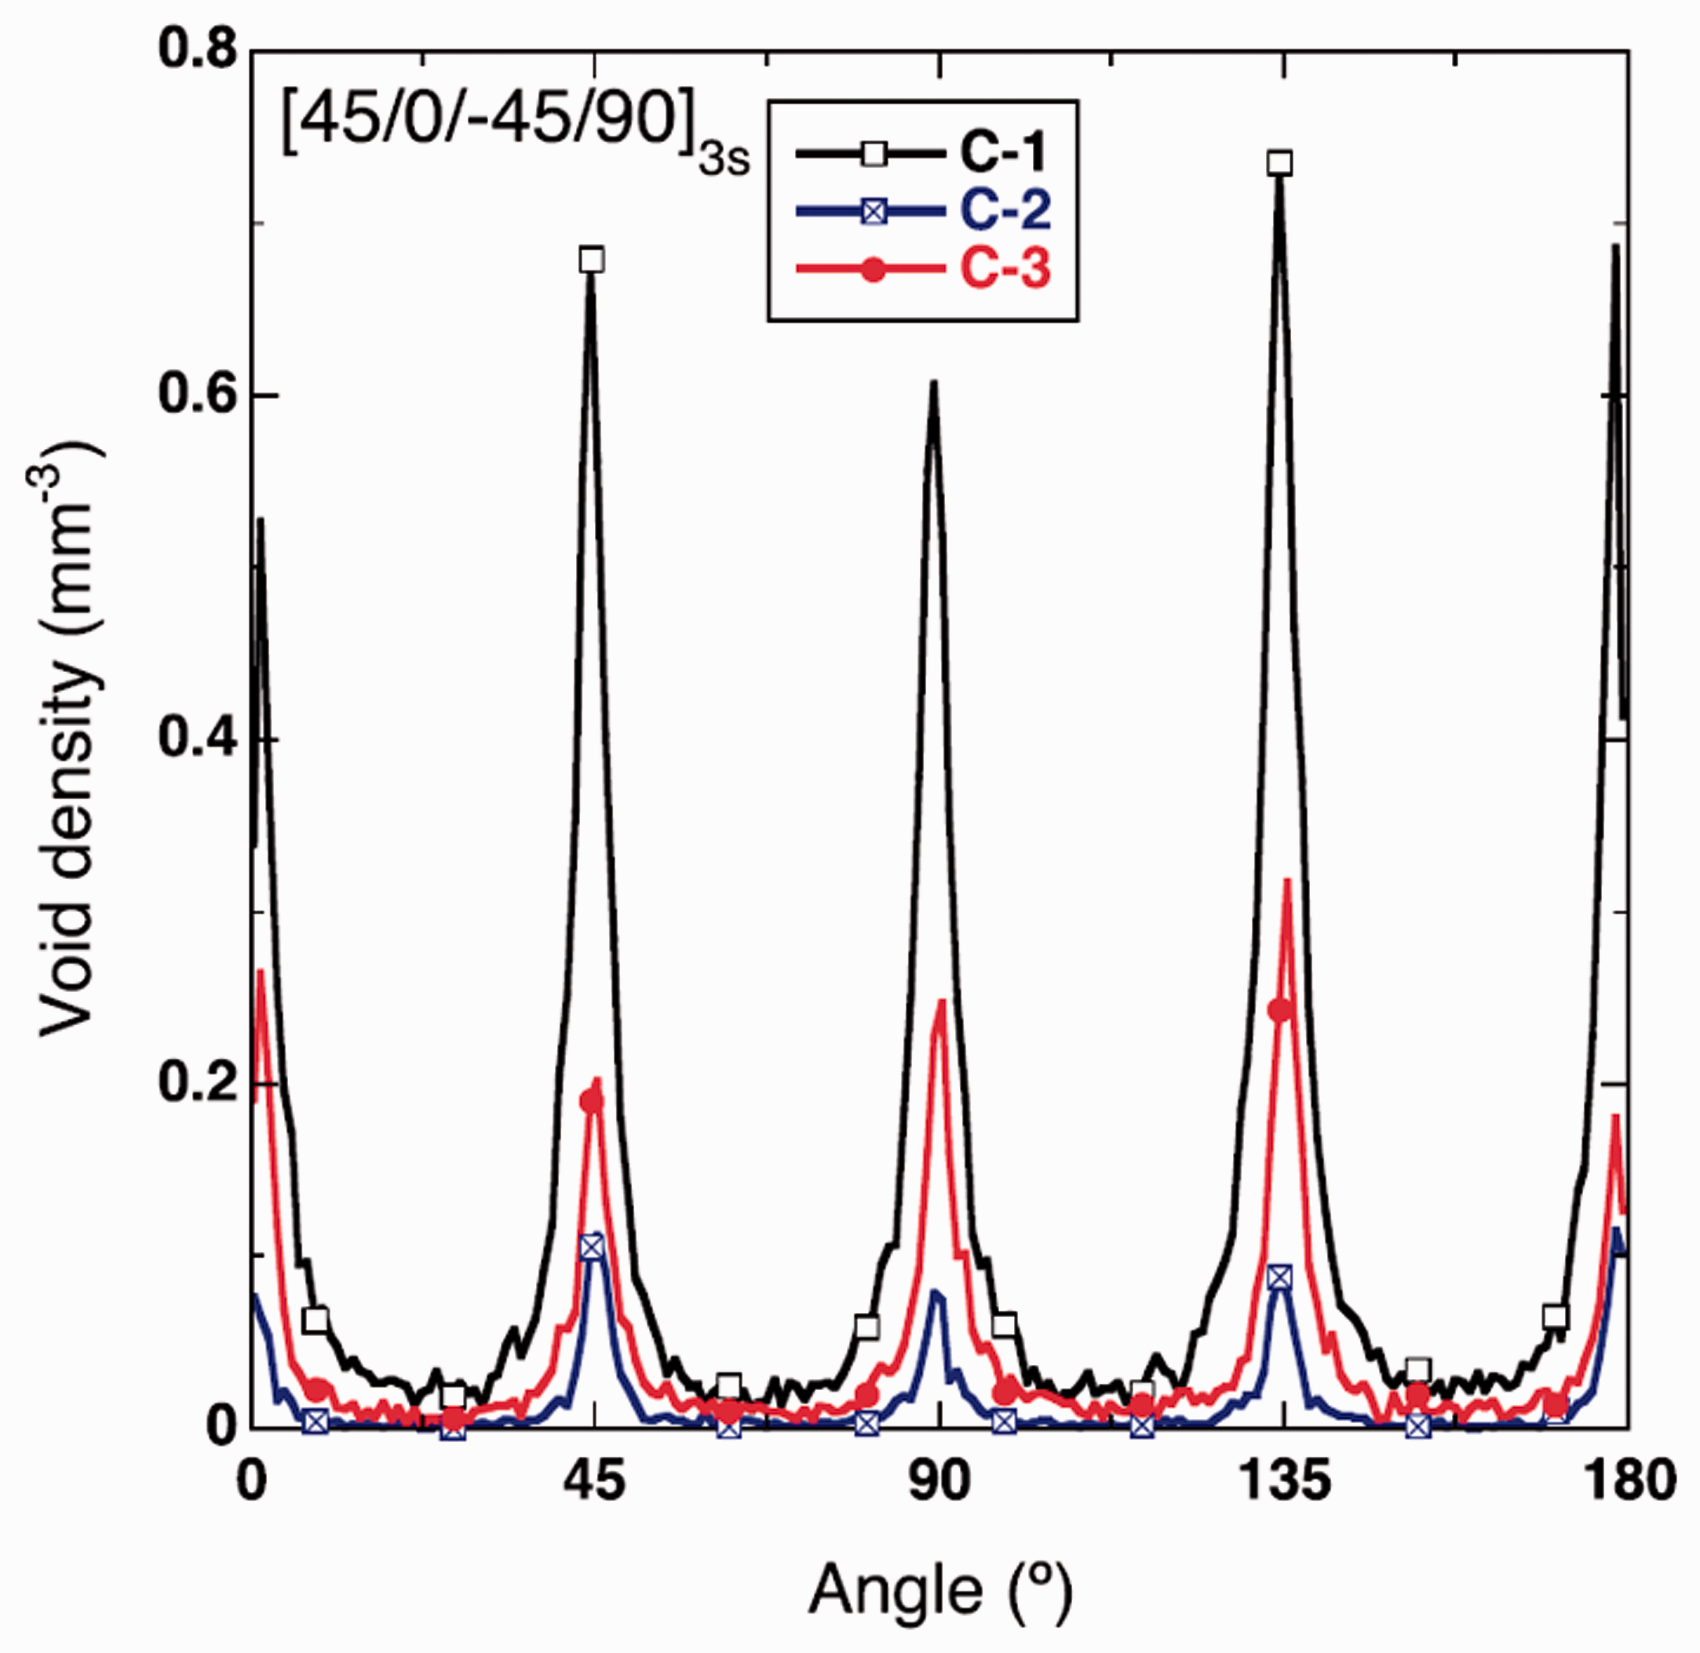
Little et al. 138 also performed void characterization by means of micro-CT, confirming the observations made by Hernández et al., 128 but measuring sphericity of voids, which is the inverse of their elongation. They observed that sphericity almost linearly decreased with an increase in the projected area diameter of the void, which indicates that a void becomes more elongated as its volume increases. In the absence of possibilities to evaluate the accurate void morphology, a similar conclusion was made, but with regard to the total volume of voids, the axial void length increases with the void content increase.89,147,224
Non-UD-ply composites
Void characteristics reported in the literature for different composites.
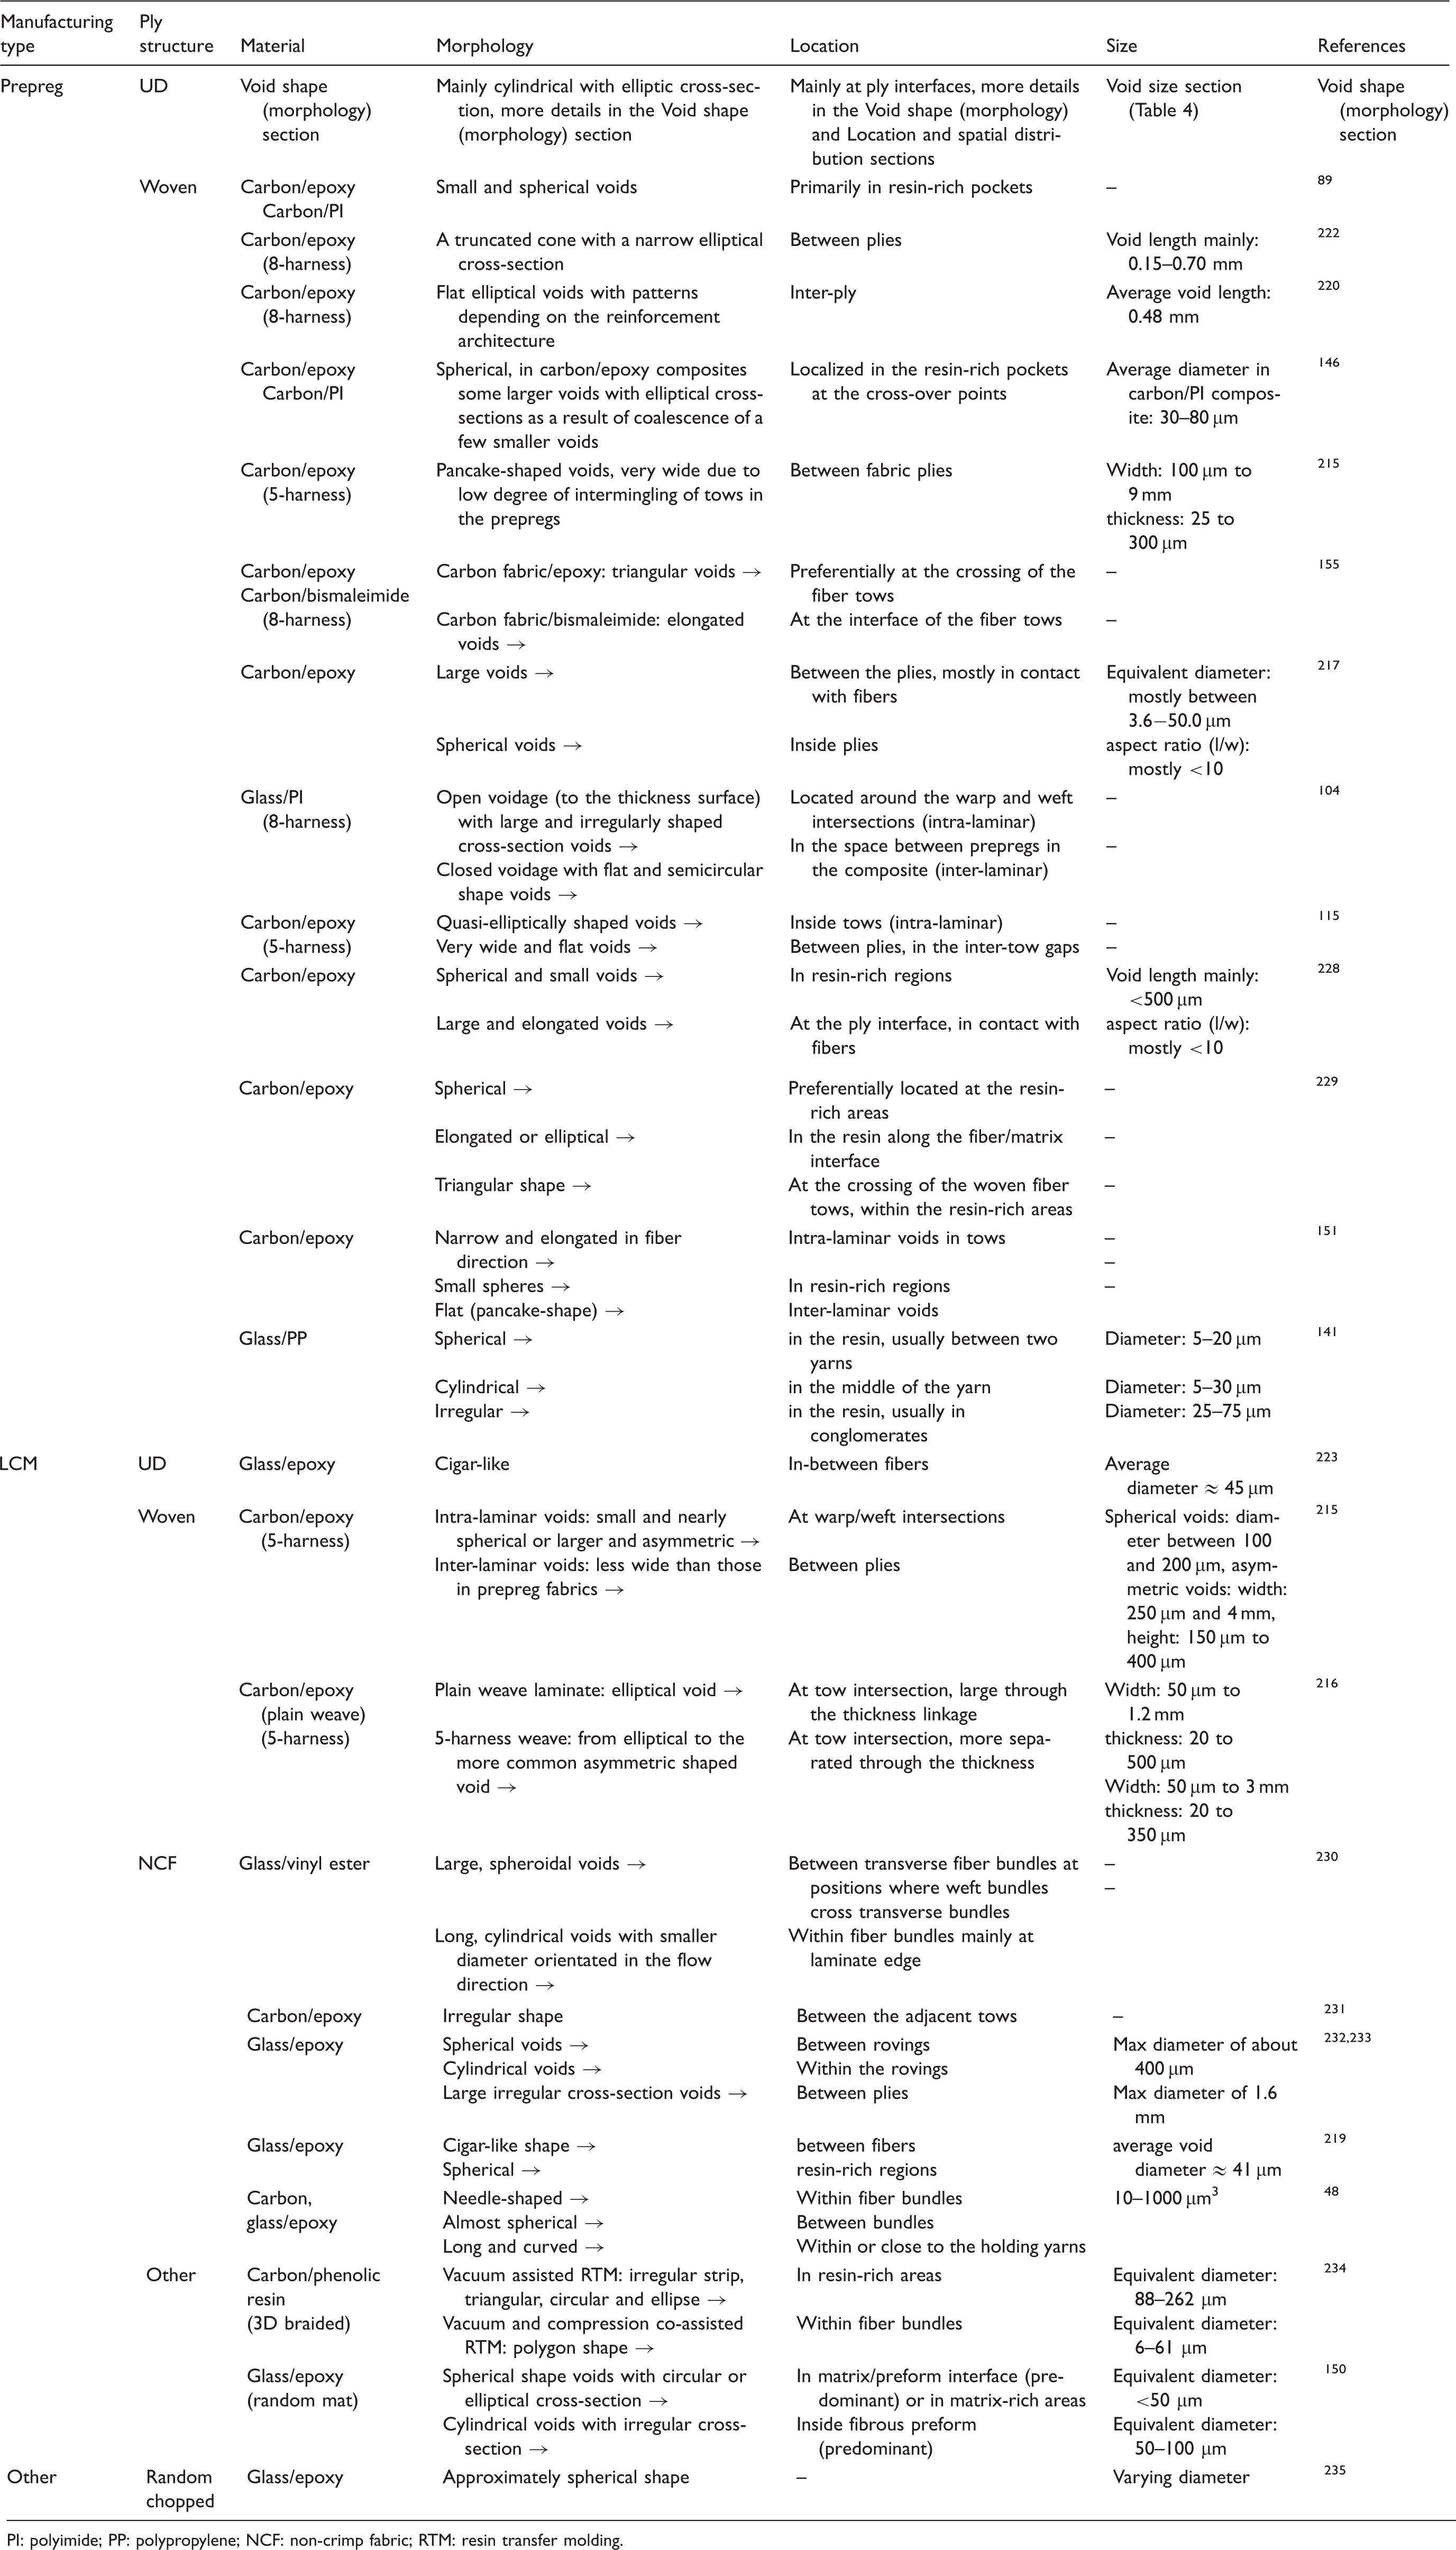
PI: polyimide; PP: polypropylene; NCF: non-crimp fabric; RTM: resin transfer molding.
Void size
Achieving a global understanding, systematization, and description of void size in FRCs is as difficult as doing the same for void morphology. This difficulty arises from four main reasons. Firstly, voids usually have a complex geometry, which cannot be characterized by one single number. Secondly, void size varies with processing parameters and internal structures. Thirdly, the size of the voids in one composite part (even neighboring voids) can be different. Finally, limitation exists in measuring the precise size of the voids. The last challenge is, however, addressed to some extent by application of the micro-CT technique. Nevertheless, a general analysis of the void size can be performed through some simplifications and assumptions. For instance, the elongated voids can be fitted to an equivalent elliptic–cylinder or ellipsoid, based on volume, centroid, and moments of inertia, with equivalent size parameters, i.e. width, height (thickness), and length (Figure 14), and irregular-shaped voids are to be fitted to circles (2D) or spheres (3D), with equivalent diameters, based on area or volume, respectively. Some works investigate void size by means of area of cross-section or volume. Overall, considering a distribution for void sizes rather than reporting ranges or average values is more accurate. What is reported in the following text about the void size is only applicable to the transversal void dimensions (for example, in the case of cylindrical voids, to the smaller axes dimensions), due to the common use of microscopy on transverse cross-sections, and is obtained through microscopy unless specified otherwise.
UD-ply composites
Distribution of (mainly inter-laminar) void size parameters in UD-ply carbon/epoxy composites.
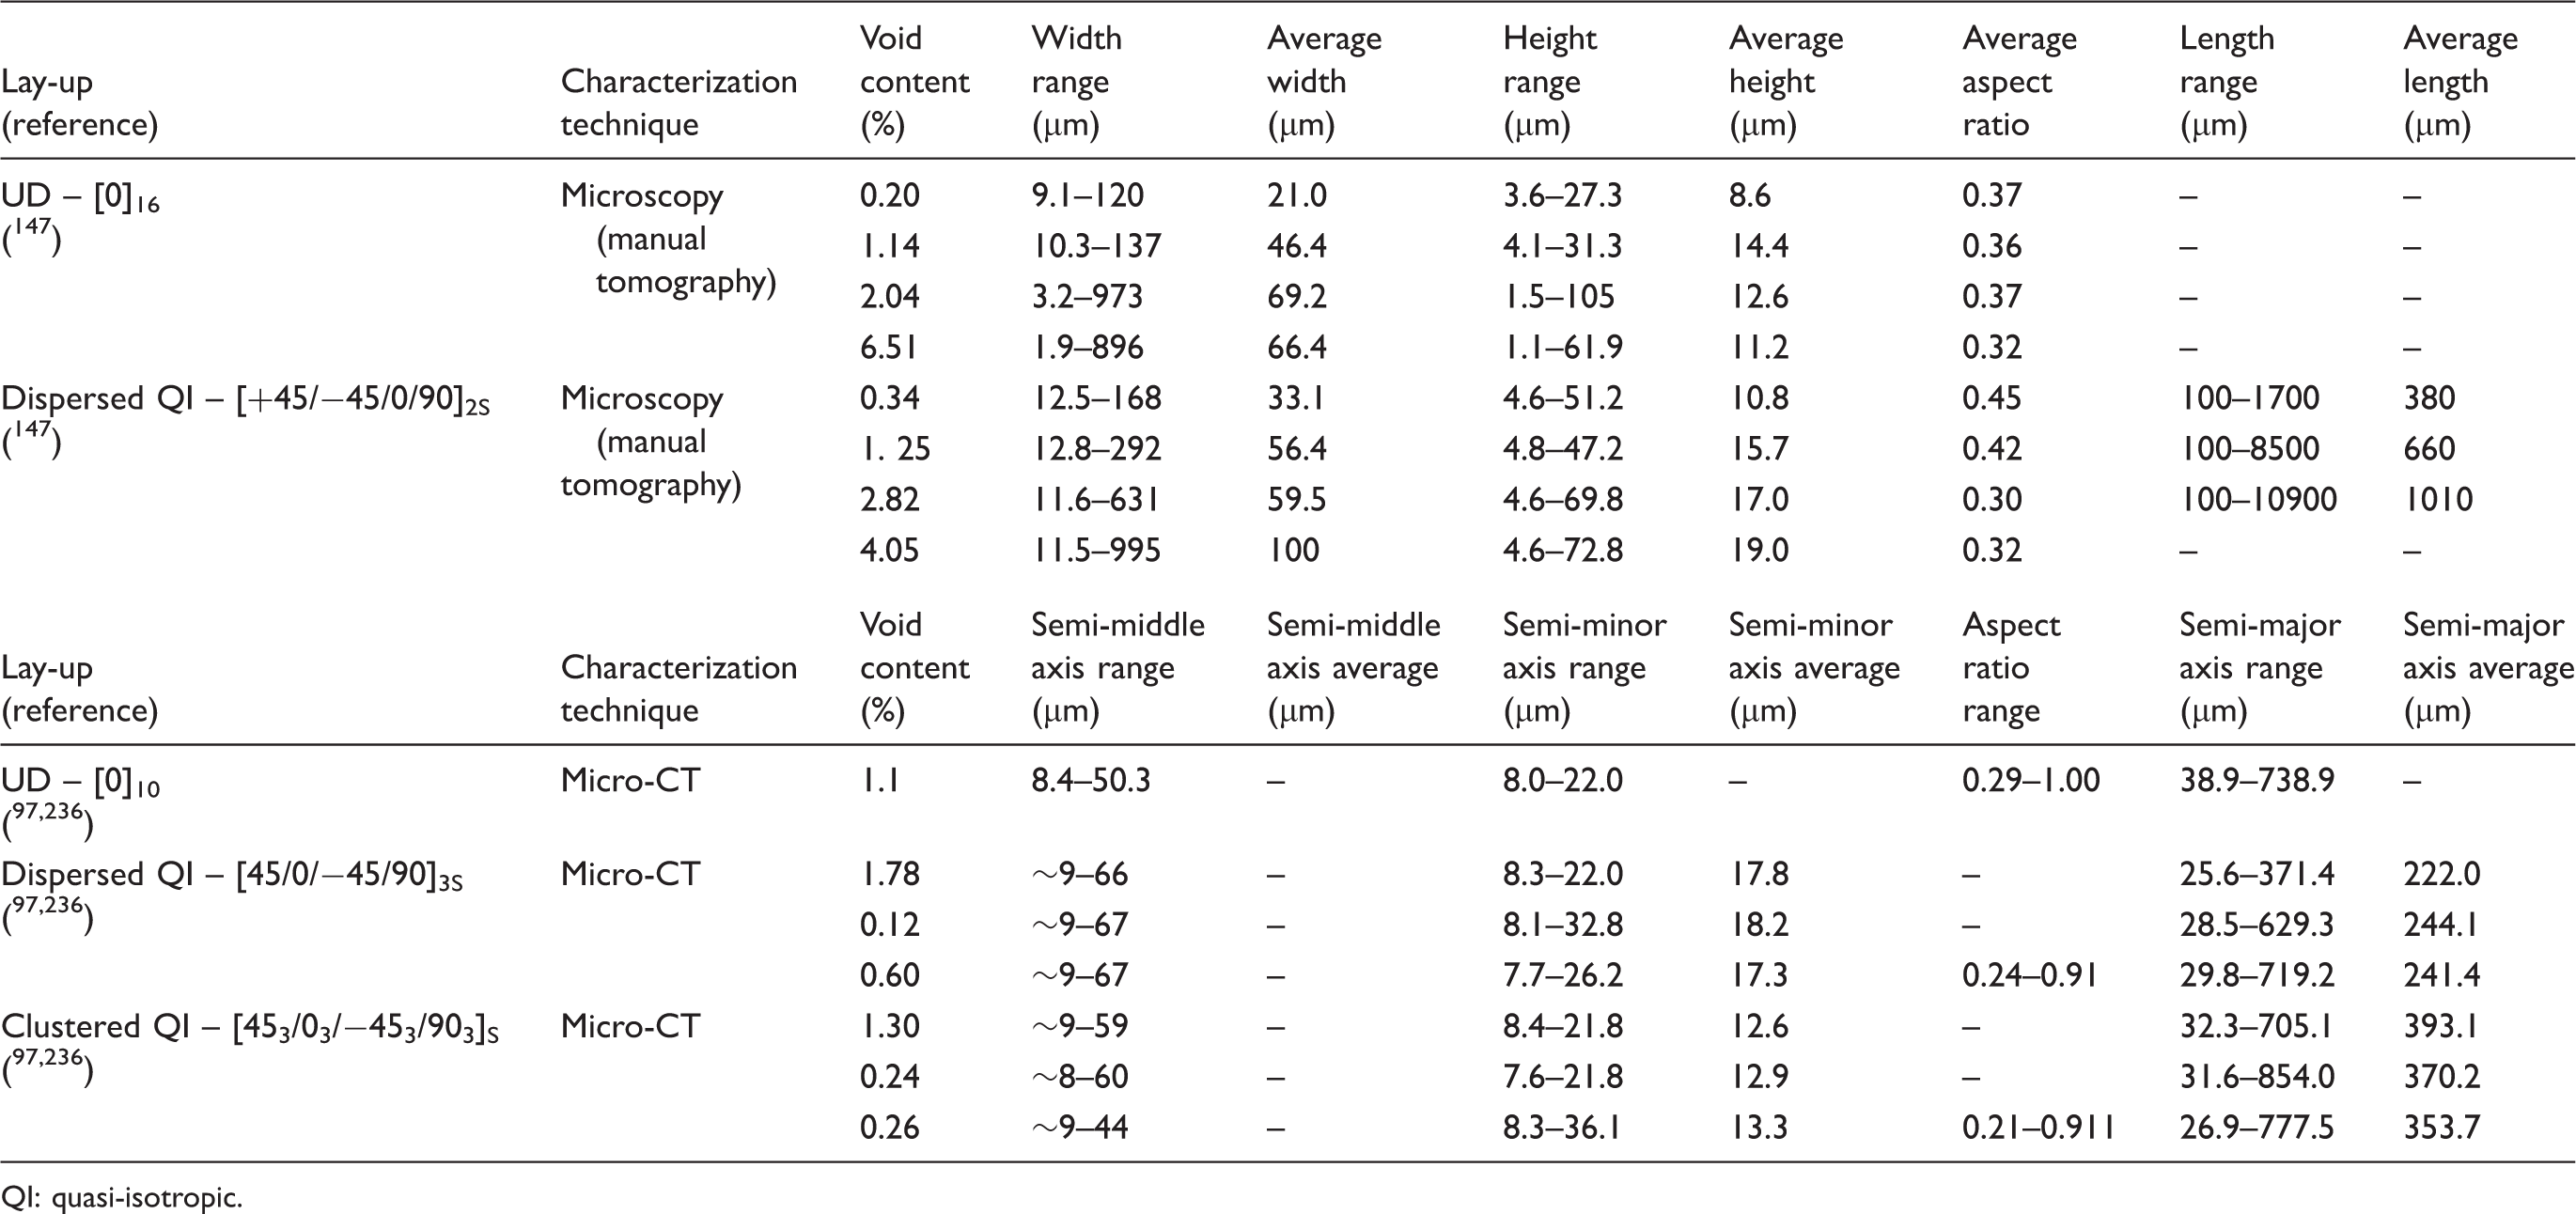
QI: quasi-isotropic.
Chambers et al. 153 classified voids in an OoA UD carbon/epoxy composite by their cross-section area into four size groups: 8–4000 µm2, 4000–10,000 µm2, 10,000–30,000 µm2, >30,000 µm2. Having a significant number of voids in the first size group, the number of voids in each size group decreased with the size increase. Agius et al. 108 reported similar observations for a different definition of size groups: <1000 µm2, 1000–2000 µm2, 2000–5000 µm2, 5000–15,000 µm2. Ledru et al., 3 by means of a visco-mechanical based void growth model, calculated that the radius of intra-laminar spherical voids in resin-rich regions would be around 3 µm and experimentally observed that ∼80% of the intra-laminar voids have a radius less than 3 µm. The frequency of voids decreased with the increase in their equivalent radius. However, de Parscau du Plessix et al. 96 claimed that this model does not provide acceptable results for the void size. Applying some modifications (explained in the Autoclave curing process section) to the void growth model, they predicted the radius of spherical voids to be within 30–80 µm, depending on the cure cycle.
Little et al. 138 presented statistical data on the size of mainly intra-laminar voids with the following interpretation. About 45% of the total number of voids have a projected diameter less than 50 µm, while only accounting for about 6% of the total void area fraction. And 1.5% of the total number of voids have a projected diameter larger than or equal to 200 µm, accounting for about 24% of the total void area fraction. Twenty percent of the total number of voids have a diameter below 20 µm, contributing less than 0.5% to the total void area. Hernández et al. 97 measured the major (length) and minor (height) axes of the equivalent ellipsoid for each void detected via micro-CT. The semi-major axis was below 900 µm, and the semi-minor axis was mainly between 8 and 30 µm. These data together with some results regarding the void size from the literature 236 are also reported in Table 4. The data presented in this table correspond mainly to inter-laminar voids. Through micro-CT analysis, Tserpes et al. 200 confirmed that UD composites with higher void contents have a higher number of large voids, and the larger the void, the longer it is. In a filament wound composite, Scott et al. 202 measured through synchrotron micro-CT, mean diameters of 12.3 µm and 9.9 µm in the two transverse directions and a mean length of 84.7 µm in the fiber direction for intra-laminar voids.
Non-UD-ply composites
For other composite systems, the available data on void size are summarized in Table 3. In woven-prepreg composites, large voids are observed in regions with both low and high void contents, whereas in RTM woven laminates they are only seen in regions with high void contents.
215
In woven-prepreg composites, the proportion of larger to smaller voids increases as the void content increases.
217
The average size of small and spherical voids located primarily in resin-rich pockets of woven composites varied with changing the void content, but did not monotonically increase as in UD laminates.
89
In NCF composites produced through liquid resin infusion, Maragoni et al.
219
found an asymmetrical distribution for the void cross-section diameter with an average of 41 µm. They also observed that half of the voids have an area (in top view) below 400 µm2. Bodaghi et al.
149
observed that in a woven carbon/epoxy composite with one type of reinforcing fabric, the void size has a bell-shape distribution for prepreg composites (produced via autoclave or VBO), but a right-skewed distribution for LCM composites (produced by high injection pressure RTM). This was attributed to the random nature of the void size in prepreg composites and its dependence on flow velocity and distance to the gate in LCM composites. Through synchrotron micro-CT analysis of an RTM quasi-UD NCF carbon/epoxy composite by Sisodia et al.,
48
the volume of voids was found to be within 10–1000 µm3 and suggested a bell-shape distribution. Melenka et al.
190
fitted the void volume distribution for a Kevlar/epoxy braided composite, measured through micro-CT, by a Weibull distribution, as presented in Figure 17. The mean void volume, obtained through the Weibull distribution was 7.4 × 106 µm3 with a variance of 7.3 × 104 µm3. The median void volume was found to be 3.3 × 106 µm3.
Weibull distribution fitted to the void volume probability density function for a Kevlar/epoxy braided composite, measured through micro-CT; smaller voids are more frequent, most of which have a volume smaller than 0.02 mm3.
190
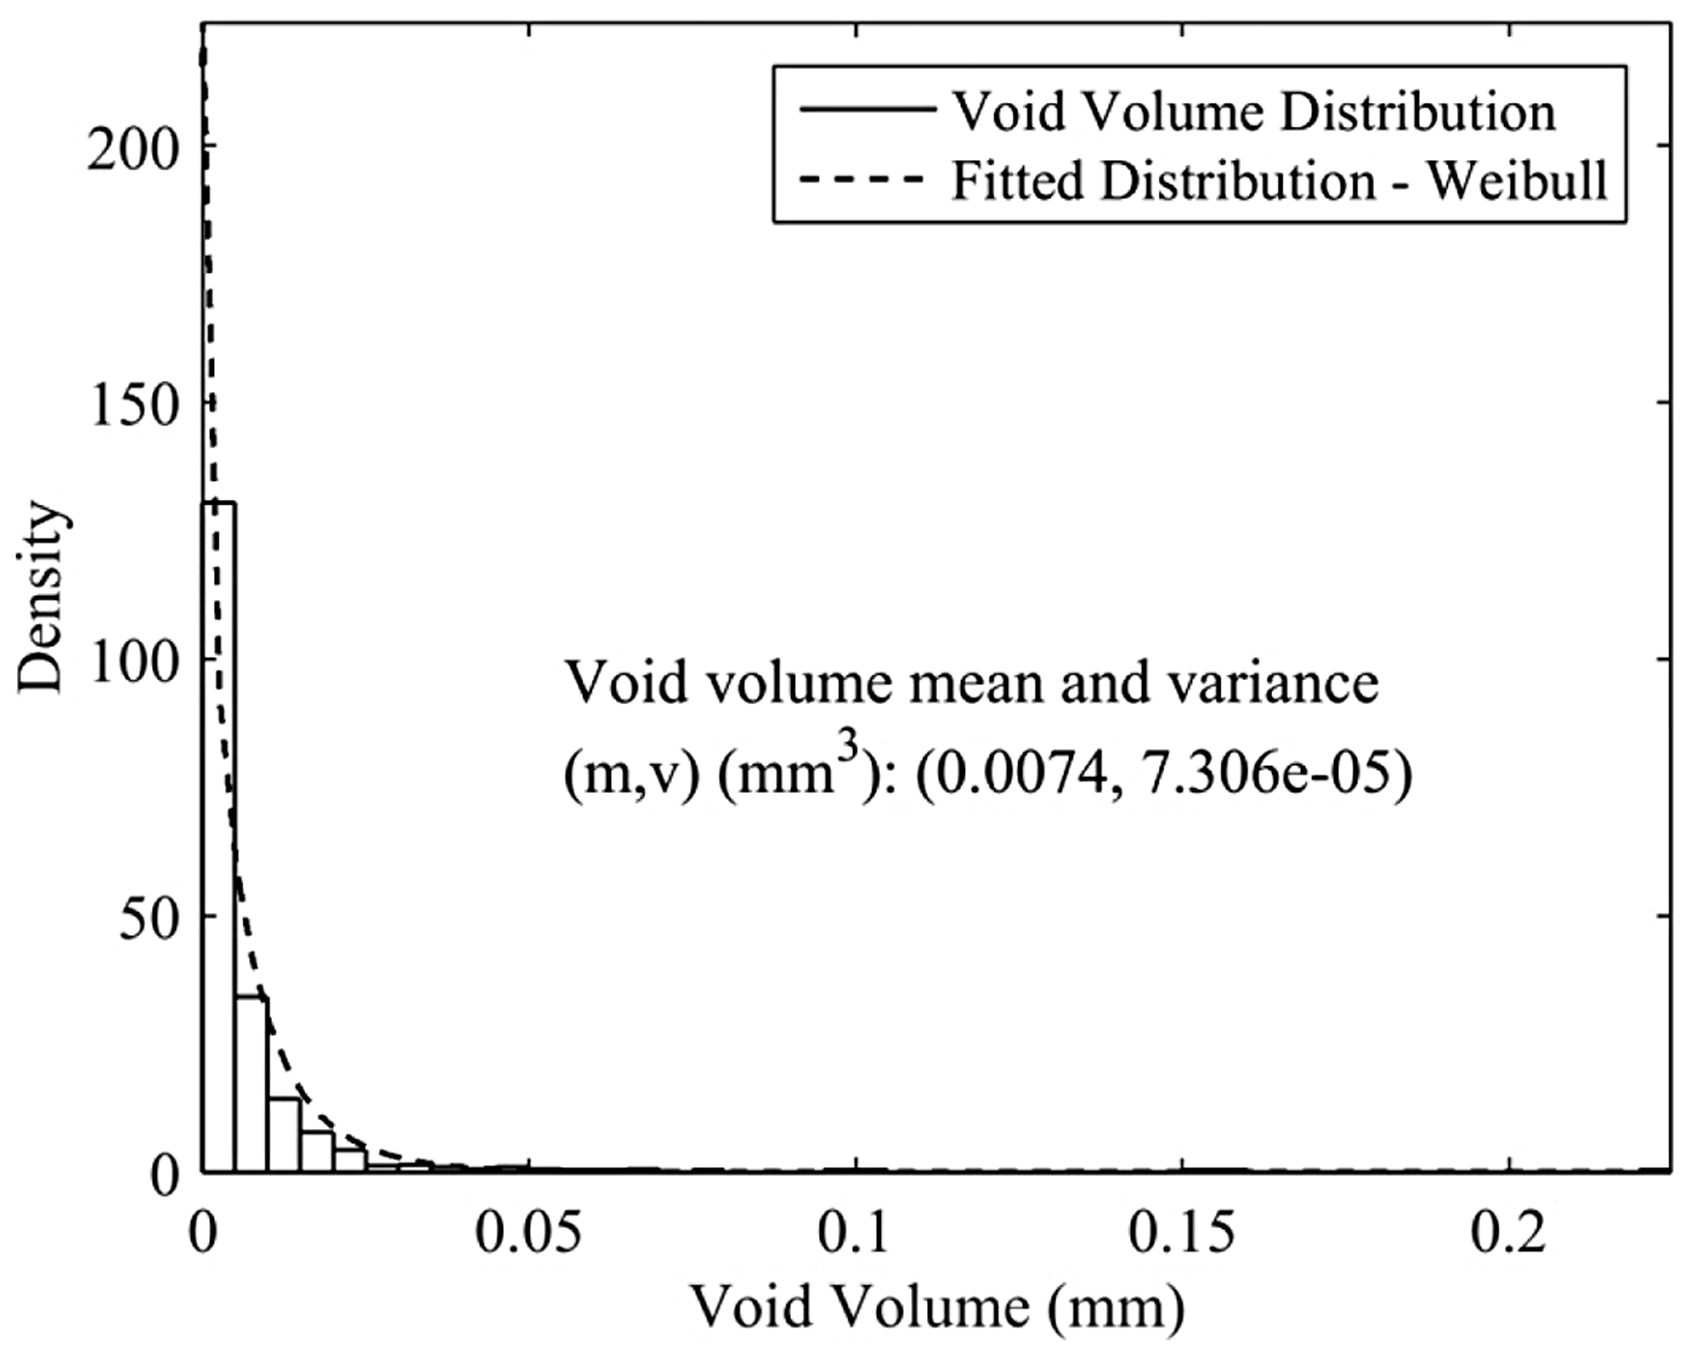
Location and spatial distribution
There is a general agreement that voids in composites built up from UD prepregs, particularly autoclave products, are concentrated at the ply interfaces.101,103,106,128,146,147,221,224,237 However, depending on the material system and processing, intra-laminar voids can also exist in autoclaved UD-ply composites, e.g. in the literature.96,107,144,199 In OoA manufacturing, void formation inside plies becomes significant as well.108,124,125 Moreover, in filament wound composites, elongated voids are located inside the plies. 202 For voids in woven-prepreg composites, as discussed, different locations are reported, as explained in the Void shape (morphology) section, and can be observed in Figures 13 and 14. Table 3 includes a summary on void location from studies on different composite materials.
In addition to the experimental observations, the void location is also investigated through modeling, especially for LCM processes. For instance, Hu et al. 53 showed that voids are mainly located close to the warp/matrix interfaces. DeValve and Pitchumani 36 could predict the location of entrapped air within and between fiber tows. Lundström et al. 67 developed a 3D numerical model for the impregnation of NCFs, based on a network model, considering also the flow through the bundles. With this model, they showed that common places of intra-bundle void creation are tiny gaps between the bundles, crossings, threads, and side walls of the system. Patiño Arcila et al. 66 numerically showed that the voids form where the resin leaves the transverse tows (wefts).
The spatial distribution of voids describes how voids are spread in different locations of the composite laminate. In UD-prepreg composites, the void distribution appears to become more homogeneous as the void content increases.
221
Huang and Talreja
2
attributed the random distribution of voids between the plies to the random nucleation sites at the ply interface. Chambers et al.
153
observed that the distribution of voids is not uniform along the specimen length. The spatial distribution in thickness and width direction was evaluated through micro-CT by Hernández et al.
128
Along the laminate width, the voids were distributed almost periodically. This was attributed to the cell structure made by fiber-rich zones. Voids were concentrated within resin-rich tubular domains, which were separated by UD fiber tows (forming a skeleton of fiber-rich zones), with a spacing close to the tow spacing (Figure 15(d)). The reason was explained to be a non-uniform distribution of the pressure that is less transformed into the resin domains because of the fiber-rich skeleton around the domains. The clustering of voids along the width was also observed in unconsolidated (carbon/PEEK) prepregs.118,119 Through the thickness, void content was maximum in the center and minimum (close to zero) near the upper and lower surfaces, both for unconsolidated (carbon/PEEK) prepregs
118
and consolidated (carbon/PEEK, carbon/epoxy) laminates.97,118 As can be noticed in Figure 18, the voidage in the center of the thickness of QI laminates was not as high as that in UD laminates.
97
This showed the interfaces between plies with different fiber orientation seemed to act as pathways for void migration during consolidation. In general, voidage of multi-axial laminates was lower than that of UD laminates for identical curing conditions. This is in agreement with the argument of Rubin and Jerina
220
that the void distribution in tape laminates is highly dependent on the laminate stacking sequence. Depending on the materials and processing, voidage can have peculiar distributions. For instance, Koushyar et al.
105
observed that by maintaining the vacuum throughout the cure cycle, voids appear in a cross-shape distribution in the plate.
Void distribution through the thickness of the carbon/epoxy composites, manufactured with the three different curing cycles shown in Figure 15(c), with the stacking sequence of (a) [45/0/−45/90]3S (dispersed QI), (b) [453/03/−453/903]S (clustered QI), and (c) [0]10 (UD); the voidage in multidirectional laminates was lower than that in UD panels for the same curing cycle.97,128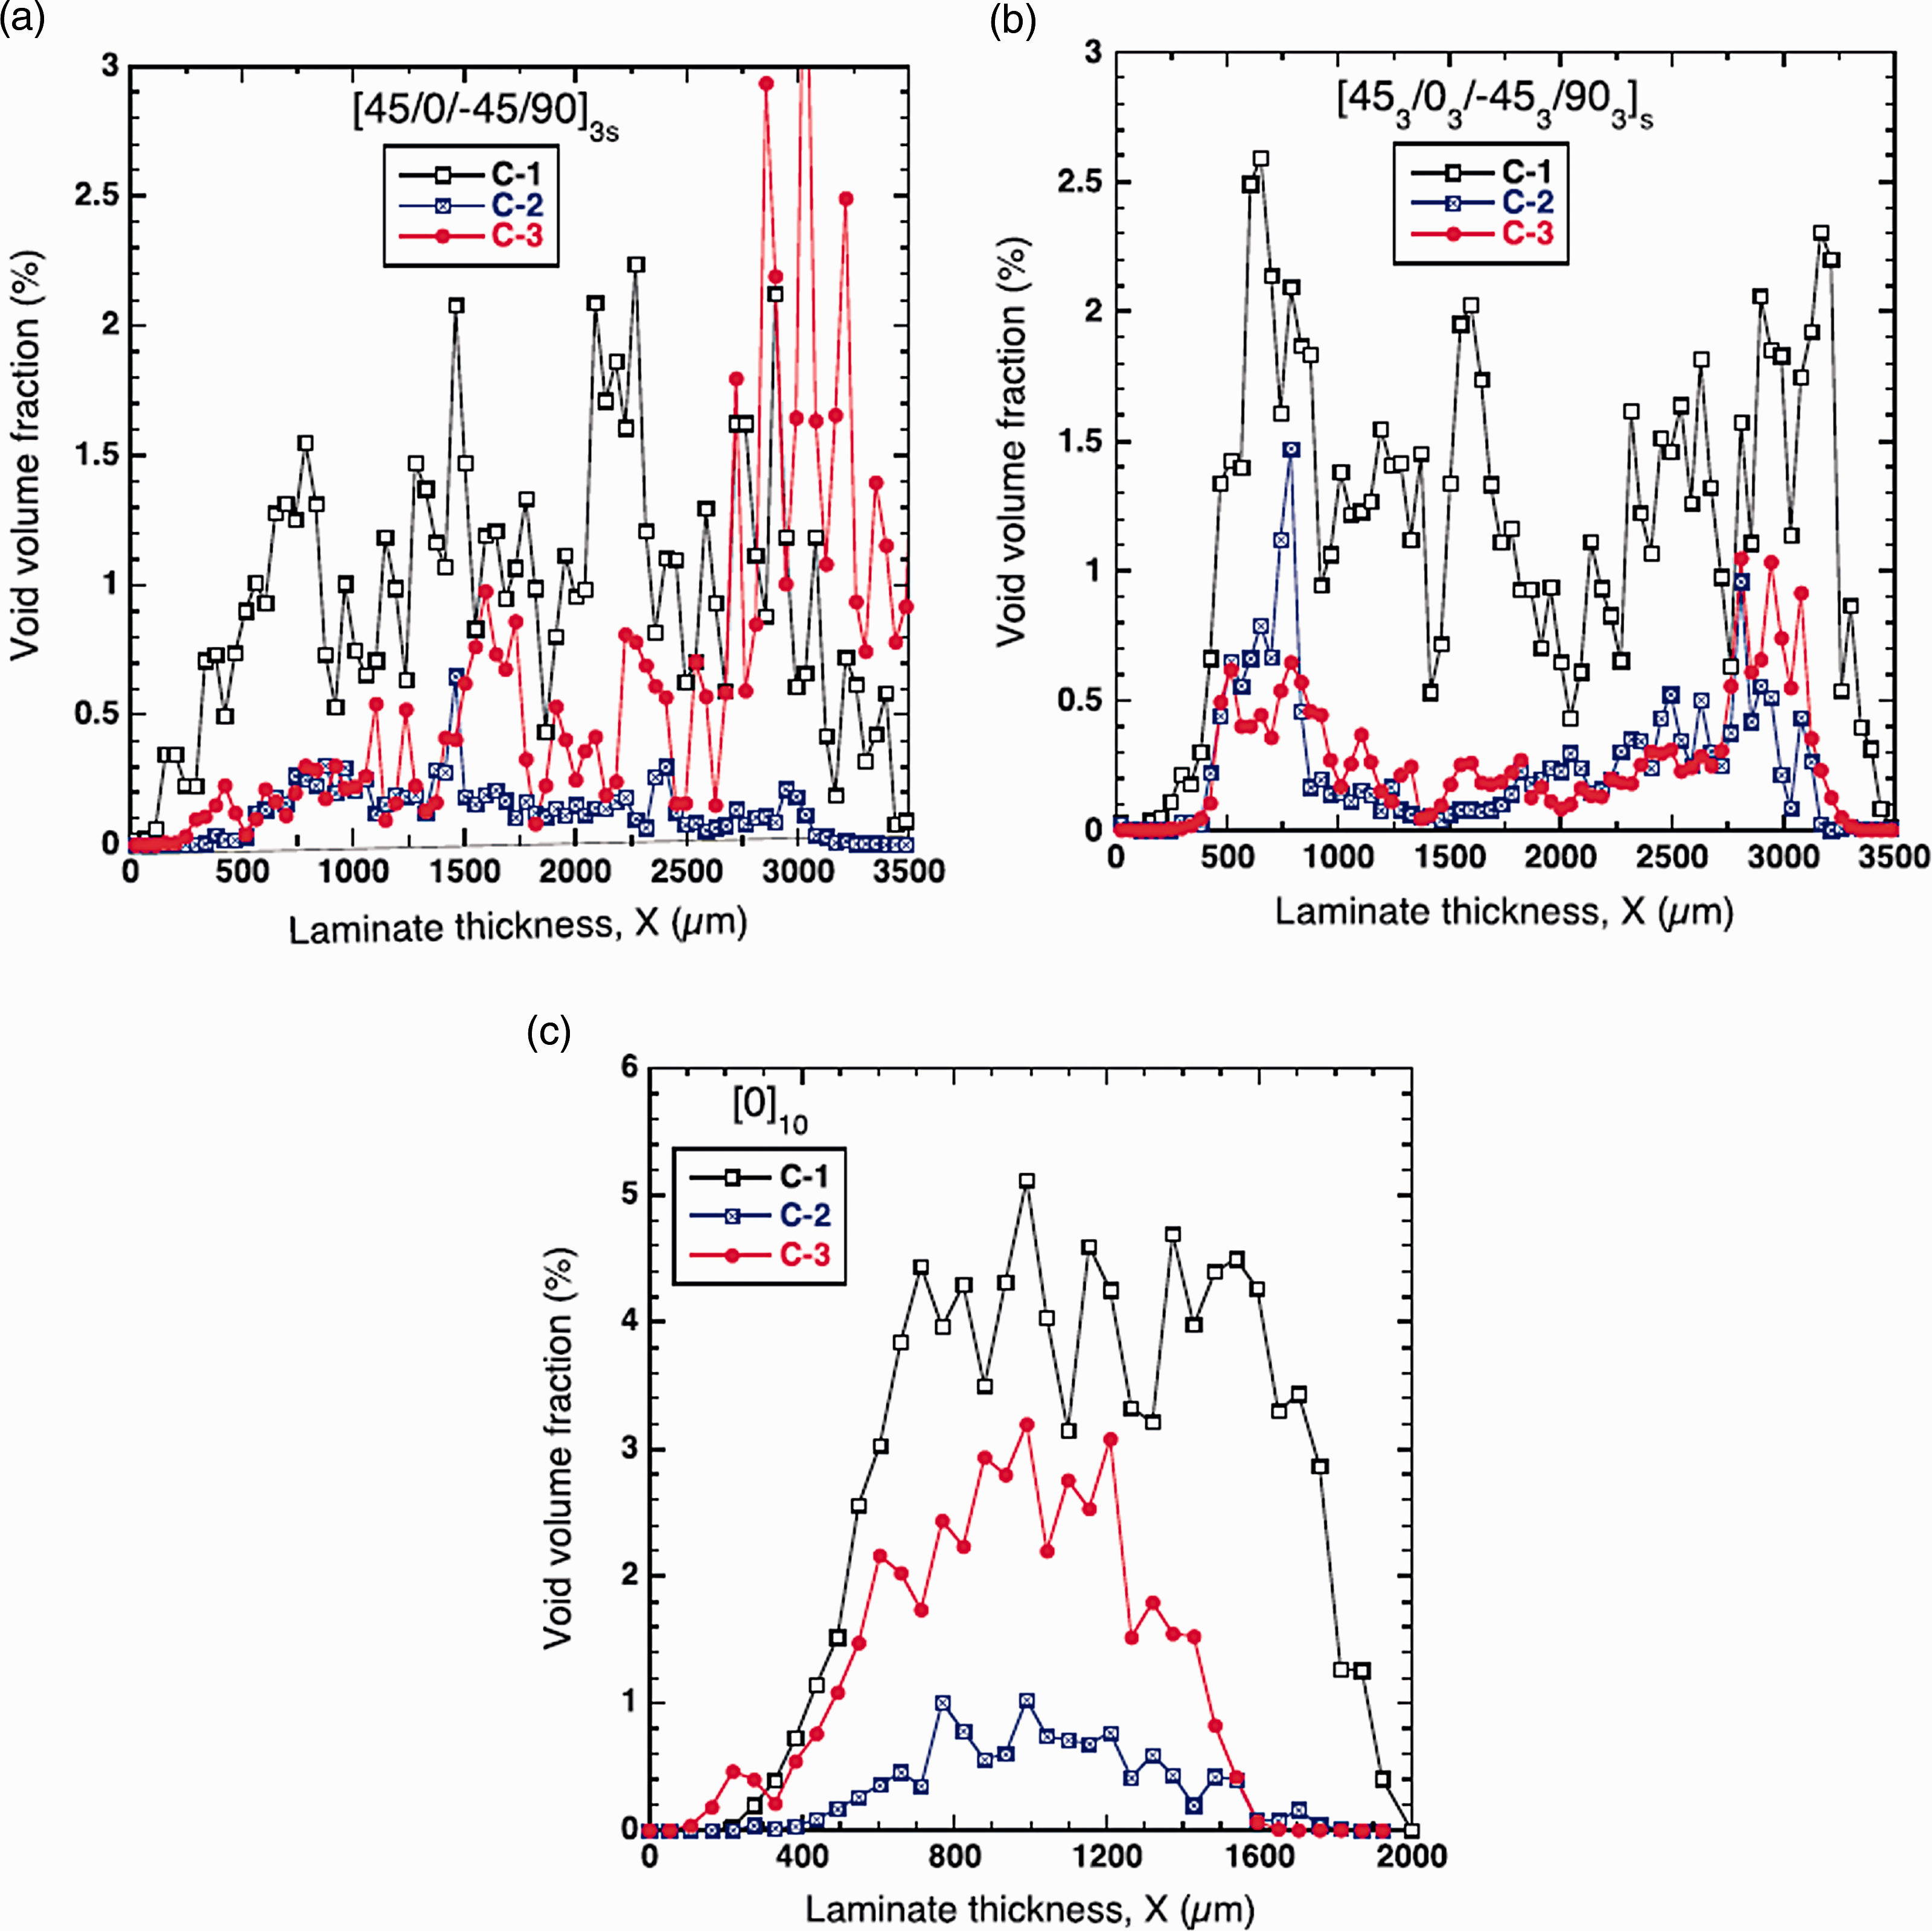
Similarly, void spatial distribution in other composite types is non-uniform. According to Rubin and Jerina, 220 void distribution in woven prepreg laminates is consistent, symmetric, and independent of ply orientation. However, similarly to UD laminates, more voids are trapped in the middle of the laminate thickness due to more difficulties to migrate to the edge during cure.220,222 It was observed by Howe et al. 215 that in woven composites the level of voidage was greater at the surfaces than that internally. This was attributed to the higher amount of free space (between the tows) at the surface, which is reduced inside the laminate by intermingling of fiber tows. In a glass/PP woven composite, Madra et al. 141 showed that the voidage is much higher inside yarns than that in the matrix. It also decreased through the thickness of the laminate toward the top layers that were subjected to pressure. The warp and weft yarns located at the same distance from the surface had similar levels of voidage. Moreover, the intersection regions of neighboring yarns had higher voidage.
According to synchrotron micro-CT results from Sisodia et al., 48 in a multidirectional laminate of quasi-UD NCF plies, the voidage increases with the angle of the plies relative to the flow direction. Through the thickness, the voids accumulated at the ply interfaces as well as along the fiber bundle surfaces. Along the width, the voids were almost periodically distributed in correspondence to the weaving yarns that trap bubbles. Similarly, in the micro-CT results of a quasi-UD NCF composite, Léonard et al. 194 observed that most of the voids were located around the binding yarns. Moreover, the voidage was concentrated in the middle of the panel thickness for the composite made from a high-viscosity resin (enhanced fracture toughness), while in the low-viscosity composite, voids were rather uniformly distributed throughout the thickness. They found that the equivalent diameter does not significantly differ in the two composites, but analysis of the void-to-yarn and void-to-edge distance distributions reveals the difference in their voidage.
Concluding remarks on void characteristics
Morphology of voids in laminates with UD layers and in textile composites is well described phenomenologically and qualitatively. What is lacking are generalizations and quantifications of these descriptions, which would allow building virtual representations of the morphology for modeling of voids and evaluation of their effects on the mechanical behavior of composites. The overview provided by Tables 3 and 4 can be a starting point for such a generalization.
Effect of voids on mechanical properties
The main interest in the analysis of voids in structural composites is quantification of their effect on the mechanical behavior. This has been studied broadly since the 1960s, and is still under exploration as an active research topic. It has been observed that voids in FRCs, even in small amounts influence the mechanical behavior, in particular matrix-dominated properties such as inter-laminar shear strength (ILSS), longitudinal compressive strength, and transverse tensile strength.
There are a number of difficulties that prevent simple micromechanics treatment of voidy composites, which would adequately quantify, let alone predict the effect of voids on mechanical properties. On one hand, the voidage is a stochastic phenomenon. Size, shape, and location of voids exhibit complex statistical distributions, and the influence of small and large, spherical and cylindrical, inter-laminar and intra-laminar voids should be concurrently accounted for. On the other hand, voidage is a local phenomenon. Therefore, they affect the composite response to loading via stress/strain concentration effects, and via local deterioration of the material or interface strength. This introduces a size effect, which is a consequence of adding a new length scale – void size and spacing – to the hierarchy of scales of the composite.
Experimental studies of the effect of voidage also suffer from its intrinsic stochasticity. To allow a systematic analysis of their effects, voids are usually introduced to the composite deliberately and in a controlled way. The artificial voids can be created by:
the choice of inappropriate cure pressure or vacuum,6,92,101,103,105–107,139,145,195,196,198–201,217,221,225,226,228,238 introduction of moisture or foaming agents between the plies during laying up,144,225,239 placing foreign objects such as polytetrafluoroethylene (PTFE) filaments in the lay-up,
224
following inadequate degassing prior to infusion,219,223,231 and
Analytical, statistical, and more recently numerical methodologies have been employed in the studies on voids' effects, while experimental works provide the largest contribution to this field. Many studies correlated the degradation of mechanical properties with the void content increase, and some of them92,146,154,155,222,225,239,243 reported a critical void content, below which the voidage has a negligible effect on the performance. However, in a number of studies,103,151,153,195,197,231,244 it was observed that the conventional void content parameter (volume fraction of the voids) is not sufficient in drawing accurate conclusions in regard to the effect of voids. Instead, the importance of other void parameters, such as shape, size, location, and spatial distribution was emphasized, arguing that they also need to be taken into account. Modern characterization and calculation techniques such as micro-CT and FE numerical modeling have had a remarkable role in achieving this conclusion.
The studies on voids' effects explore their influence on a variety of mechanical properties of composite materials with numerous material combinations, various reinforcement structures, and produced with different manufacturing techniques. Therefore, an intelligible appraisal of these studies needs to be properly categorized. In the present review, the first step of categorization is based on the “target” property, meaning that the research works on one mechanical property of interest in different composites are put together for evaluation and comparison of the effect of voids. Since most of these studies are performed on composites produced through prepreg processing, the manufacturing technique is specified only for studies with non-prepreg processing methods. The results of the studies including numerical modeling are reviewed in the Effect of voids on mechanical properties section, while their modeling approaches are explained in detail in the Numerical modeling techniques in studies on voids section. The order of subsections, dedicated to different mechanical properties, corresponds to the level of attention given to the effect of voids on these properties in the literature. Each section ends with a table, which summarizes the literature discussed in the section and allows an easy overview of the reported phenomena, void effect estimations, and its explanations.
Inter-laminar shear strength
Effect of voids on the ILSS of different composites as reported in the literature.
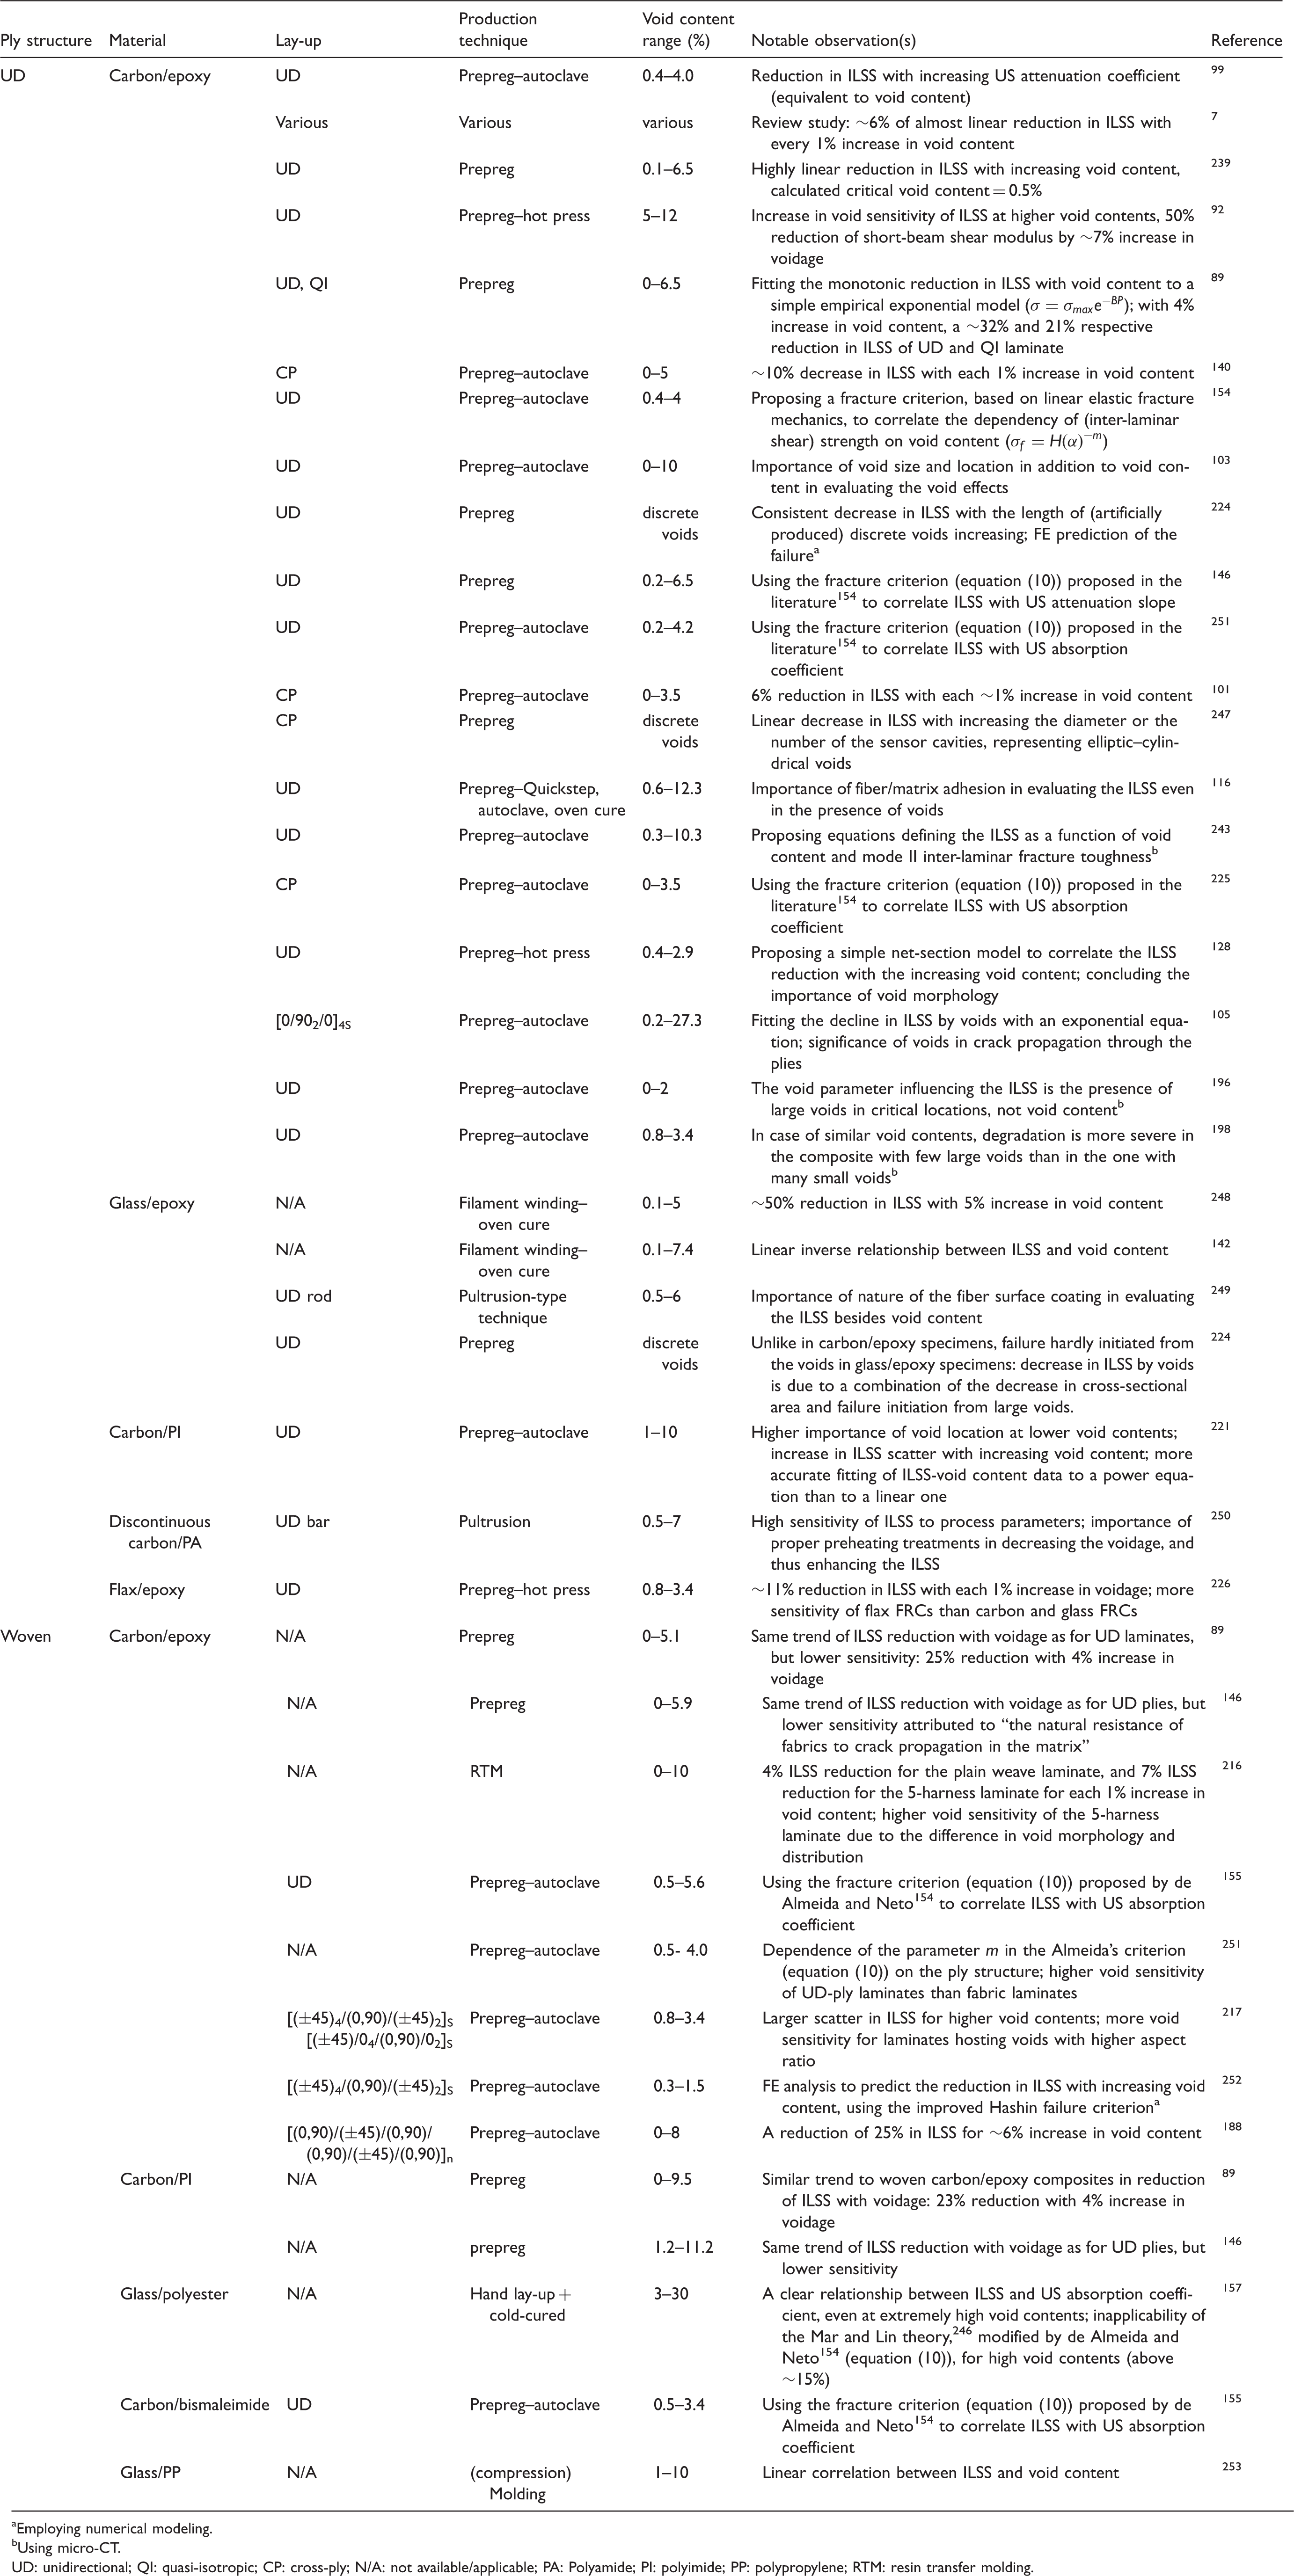
Employing numerical modeling.
Using micro-CT.
UD: unidirectional; QI: quasi-isotropic; CP: cross-ply; N/A: not available/applicable; PA: Polyamide; PI: polyimide; PP: polypropylene; RTM: resin transfer molding.
ILSS in UD-ply composites
Carbon/epoxy UD-ply composites: In one of the earlier works, Judd and Wright 7 conducted a review on the influence of voids on mechanical properties, in particular ILSS, of FRCs. They drew the conclusion that regardless of the constituent materials, ILSS reduces almost linearly by ∼6% for every 1% increase in void content, up to about 4% of void content, beyond which the reduction rate diminishes. Yoshida et al. 239 found an average coefficient of correlation of −0.84 that shows a highly linear relationship between ILSS and void content, with similar proportionality to that of the literature. 7 Using the analysis of variance technique, they calculated a critical void content of 0.5%, below which no significant change in ILSS is detected. According to Ghiorse, 140 each 1% increase in void content in the range of 0–5% leads to ∼10% decrease in ILSS, which is significantly higher than the value found in Judd and Wright. 7 He argued that a “significant decline” in properties happens in the presence of voids regardless of the constituent materials, the void characteristics, and the loading mode. Tang et al. 92 found an increase in void sensitivity of ILSS at higher void contents, which was also reported by Liu et al. 101 Although Liu et al. 101 attributed this to the decrease in ply interface area, this trend cannot be identified in their presented ILSS versus void content plot. Their observation of 6% reduction in ILSS with each 1% increase in void content is in line with the conclusion from Judd and Wright. 7
Uhl et al.
89
noticed a higher sensitivity of ILSS to the void content in UD laminates compared to that of QI laminates. A simple empirical exponential model, attributed to the literature,
245
was used by them to fit the monotonic reduction in ILSS with void content. According to this model, the strength (σ) at a void content of Vv (can be correlated to the US attenuation, as explained in the Ultrasonic testing section) can be calculated from the following equation, where 
In a step-forward research, de Almeida and Neto
154
used a fracture criterion, based on linear elastic fracture mechanics, analogous to the equation proposed by Mar and Lin246 for tensile failure of FRCs with holes, to correlate the dependency of (inter-laminar shear) strength on void content, or exchangeably US absorption coefficient of FRC laminates (see the Ultrasonic testing section). This criterion implies that the fracture stress 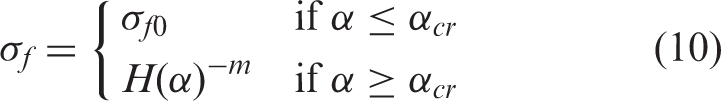
Recent research does not focus on void content anymore. Olivier et al. 103 attributed the high sensitivity of ILSS to voids to the fact that voids are mainly located between the plies, where failure in the ILSS test is triggered. Moreover, they showed that besides the void content, the size and location of voids play a role in the effect on ILSS. Wisnom et al. 224 performed a more systematic study on failure affected by voids, and observed that failure initiates from the (artificially produced) discrete voids for carbon/epoxy specimens. ILSS decreased consistently with the length of the voids increasing; more specifically, the increase of length from 0.28 mm to 3.00 mm led to a decrease of 23% in ILSS, with regard to the reference laminate without voids. It is not clear whether the void content was kept constant, when the void length was varied. They found out that linear elastic fracture mechanics could not properly predict the reduction in strength of specimens starting to fail form voids, since it does not deal with failure initiation. However, an FE method, including both a stress criterion for yielding and an energy release rate criterion for failure, worked very well in prediction of failure initiation and propagation, regardless of the shape of the void. 224 In addition to Olivier et al. 103 and Wisnom et al., 224 the effect of void size was also studied by Kousourakis et al. 247 Placing removable silicone tubes to create sensor cavities used for structural health monitoring, representing elliptic–cylindrical voids, at the mid-plane of the specimens, they found that ILSS decreases linearly with increasing the diameter or the number of the cavities. The cavities were aligned perpendicular to the direction of inter-laminar shear cracking.
Davies et al. 116 concluded that in the presence of voids, other parameters such as fiber/matrix adhesion can also influence ILSS. They presented peculiar results showing that despite a higher void content, Quickstep (OoA) cured panel exhibited an improvement in ILSS over the autoclave cured panel, but this was observed only for normalized (to a common equivalent fiber volume fraction) ILSS. The authors suggested that this could be due to enhancement in interfacial fiber/matrix adhesion. Olivier et al. 243 proposed equations defining ILSS as a function of the void content and Mode II inter-laminar fracture toughness. Koushyar et al. 105 witnessed a severe decline in ILSS by voids for contents above 1%. They fitted the decline with an exponential equation. In the post-mortem micrographs, the voids seemed to have a major role in crack propagation through the plies, and inelastic deformation was more pronounced for composites with higher void contents. Assuming that cylindrical voids are arranged in a regular square pattern, Hernández et al. 128 proposed a simple analytical net-section model to correlate the ILSS reduction with the increasing void content. One specimen, out of four, did not follow the model trend. As the nano-indentation and the push-in tests showed similar matrix and interface properties for specimens with different void contents, they concluded that the lower ILSS of that specific specimen, in spite of its lower void content, could be due to the void morphology.
In contrast to the previous studies, Nikishkov et al. 196 claimed that ILSS has a relatively low dependency on void content. Taking advantage of micro-CT as a precise characterization tool, they showed that the crucial parameter is the presence of large voids in critical locations. In their case of short-beam-shear specimen, the mid-section of the specimen was the critical location due to the inter-laminar shear stress concentration. The inter-laminar failure appeared as two cracks extending in half of the specimen length, where the critical void lay: one initiating at the critical void, and the second one immediately after the start of the first crack due to the reduction in the effective specimen thickness. Through a numerical methodology, employing a LaRC04 fracture toughness-based failure criterion, they could predict the load level and location of failure for laminates with significant voidage. Stamopoulos et al. 198 reported 11% reduction of ILSS for ∼3% of voidage. Similarly to Olivier et al., 103 they stated that the more severe effect of voids on ILSS, compared to other properties, is because many voids are placed between the plies. Furthermore, based on the pre-analysis of the specimens via micro-CT, they argued that for composites with similar void contents, the degradation of properties is more severe in the one with few large voids than in the one with many small voids. Thus, the insufficiency of the void content and the necessity of consideration of other void characteristics in the evaluation of composite properties, particularly ILSS, are endorsed by the use of micro-CT.
Glass/epoxy UD-ply composites: In one of the first studies on the effect of voids, Bascom and Romans 248 observed that reducing the void content from 5% to less than 0.1%, through control of the filament winding process, leads to a 50% increase in ILSS. In a similar and simultaneous work, Kohn et al. 142 indicated that a linear inverse relationship describes adequately the correlation between ILSS and void content. Thomason 249 showed that ILSS, besides linearly correlating with void content, depends enormously on the nature of the fiber surface coating.
Wisnom et al. 224 conducted a broad research on ILSS of glass/epoxy composites influenced by discrete as well as distributed voids. The discrete voids were artificially created by small PTFE inserts at the laminate mid-plane, and the distributed voids were produced by eliminating the positive pressure during cure. Unlike in carbon/epoxy specimens, failure hardly initiated from the voids in glass/epoxy specimens, even for those with discrete voids, in which the voids were large compared to the cross-section. Nevertheless, the failure initiated mostly above and below the void. In this case, the increase in stress due to the reduction in net cross-section seemed to play a critical role. Therefore, net section stress analysis would be more appropriate than the stress-based failure criteria, which predict the strength based on the stress concentration caused by voids. Through this analysis, Wisnom et al. concluded that the stress concentrations associated with the voids are less critical than might be expected. For the specimens with highly distributed voidage also, the failure was controlled mainly by the reduction in net cross-section. They suggest that the degradation of ILSS with increase in voidage is caused by a combination of the decrease in cross-sectional area and the failure initiation from large voids, as stress concentrators.
Other UD-ply composites: The influence of voids on ILSS in thermoplastic composites exhibits the same phenomena as in thermoset composites. Bowles and Frimpong 221 investigated carbon/polyimide (PI) laminates. They found that for low void contents, the ILSS depends on the location of the voids, such that voids closer to the inner, high-shear-stress areas of the specimen become more critical. The standard deviation of ILSS increased with increasing void content, attributed to the increase in randomness of void location, so that the chance that a void has a critical location to cause premature failure scatters. The relationship between ILSS and composite density was fitted with both linear and power relationship equations. The composite density was expressed in terms of the fiber volume fraction and void content. Although they observed that the power equation fits better to the measurements, the predictions were not highly accurate. According to de Almeida and Neto, 154 the reason can be that these equations neglect stress concentrations and material toughness, and assume non-realistic geometries for voids.
On a composite manufactured by pultrusion of a yarn, containing discontinuous fibers of carbon and polyamide, Wiedmer and Manolesos 250 concluded that ILSS is the most sensitive property to process parameters. Although a high pulling speed results in a high voidage and low ILSS, proper preheating treatments provided low-voidage composites, even at high pulling speeds.
The relationship between ILSS and voids in natural-fiber composites is also a point of interest. Li et al. 226 studied the formation of voids and their effect on the mechanical properties of quasi-UD flax/epoxy composites. They noted that with each 1% decrease in voidage, ILSS increases ∼11%, and concluded that flax FRCs are more void-sensitive than carbon and glass FRCs (5–8% ILSS increase with 1% decrease in voidage).
ILSS in woven-ply composites
Carbon/epoxy woven composites: Uhl et al. 89 and later Jeong 146 spotted the same trend of ILSS reduction for woven plies as for UD laminates, but with a lower sensitivity. The void sensitivity of woven composites was found to be between that of UD and QI laminates of UD plies. Jeong 146 suggested that the higher void sensitivity of UD laminates than that of fabric composites could be due to “the natural resistance of fabrics to crack propagation in the matrix”. One can understand it as reference to intermingling of woven plies, which affects the crack propagation. The reason might also be the difference in void morphology and location as he noted that UD laminates have mostly elongated voids at the ply interfaces, whereas the voids in woven laminates are more spherical and located in resin-rich pockets. Goodwin et al. 216 noted a difference in the dependency of ILSS on voids between plain weave and 5-harness fabric laminates, produced through RTM. For each 1% increase in void content up to 10%, the plain weave laminate showed 4% reduction in ILSS, while the 5-harness had 7% reduction. The higher sensitivity of the 5-harness laminate was attributed to the higher stress concentrations resulted from a higher level of asymmetric voids with corners of lower radii, higher stress intensification caused by the longer voids, and lower stress for crack initiation due to a higher population of voids throughout the laminate. Intra-laminar cracks were observed to initiate from voids, and to propagate to the ply interface, transforming into inter-laminar cracks. A reduction of 25% in ILSS of a woven carbon/epoxy composite was reported by Di Landro et al. 188 for ∼6% increase in void content.
Costa et al. 155 applied the fracture criterion (equation (10)) proposed in the literature 154 to find a correlation between the measured values of ILSS and the void content for a woven carbon/epoxy composite and could establish a reasonable fit. They noted that during short-beam-shear tests, intra-laminar transverse cracks emanate from the matrix voids. In a later study, 251 they also concluded that the slope parameter m is mainly controlled by the ply reinforcement structure. UD-ply laminates showed to be more void-sensitive than woven-ply laminates.
Zhu et al. 217 observed a higher scatter in ILSS with increasing void content, which was attributed to the shapes and sizes of voids as the initiation and propagation of cracks were affected by the voids. The ILSS of the laminates hosting voids with a higher aspect ratio was more sensitive to voidage. Zhang et al. 252 established a macro-level FE analysis to predict the laminate strength, including ILSS, in the presence of voids, based on the improved Hashin failure criterion, using the tensile, compressive, and shear strength values for plies with different void contents as input. Through this model, they could predict the decrease in ILSS of a laminate with increasing void content.
Other woven plies: Woven carbon/PI89,146 and woven carbon/bismaleimide composites 155 exhibited a similar trend to woven carbon/epoxy composites in reduction of ILSS with voidage. On an example of a woven glass/polyester composite, Mouritz 157 showed that although there is a clear relationship between ILSS and US absorption coefficient, even at extremely high void contents (up to 30%), the Mar and Lin theory,247 modified by de Almeida and Neto (equation (10)), 154 cannot correlate this relationship in FRCs with high level of voidage (above ∼15%). In case of a thermoplastic matrix, Bureau and Denault 253 showed that ILSS of glass/PP composites consolidated in different molding conditions is linearly correlated with their void content.
Concluding remarks on the effect of voids on ILSS
Table 5 makes a summary of literature treating the void effect on ILSS. As a general guidance, it can be accepted that 1% increase in void content in carbon/epoxy and glass/epoxy UD-ply and woven composites leads to 5–10% decrease in ILSS, with woven laminates showing a lower sensitivity than UD-ply. More detailed studies reveal dependencies on void configuration, laminate architecture, matrix toughness, etc., but generalization on these details does not seem feasible for the current state-of-the-art. The main mechanisms of the ILSS decrease are believed to be the reduced cross-sectional (“presented”) area because of the presence of voids at the inter-laminar interfaces and the stress concentrations around the voids. However, a full theoretical/modeling treatment of the ILSS in the presence of voids is still to be developed.
Only about 5% of all the studies dealing with the effect of voids on ILSS take advantage of modeling approaches. This is attributed to the lack of simulation tools that could predict composite failure by simultaneously modeling fibers and voids – features of distinctly different sizes and properties – which strongly interact.
Tensile properties
Tensile elastic properties
Engineering constants of UD composites, influenced by inter-laminar voids, were studied numerically by Huang and Talreja.
2
The normalized reduction of the in-plane moduli, i.e. longitudinal (Ex) and transverse (Ey) tensile and shear (
Tensile modulus: In an early study, Harper et al. 254 and later Olivier et al. 103 found that in UD-ply composites, fiber-dominated elastic properties, i.e. longitudinal tensile modulus and Poisson’s ratio, related to contraction in the fiber direction, are practically insensitive to voidage, but the matrix dominated moduli, i.e. transverse tensile and shear modulus, degrade significantly with voids. Liu et al., 101 Zhan et al., 106 and Stamopoulos et al. 198 for UD carbon/epoxy composites, and Li et al. 226 for quasi-UD flax/epoxy composites confirmed the low sensitivity of longitudinal tensile modulus to voids. Selmi 255 and Huang and Talreja 2 concluded the low sensitivity through analytical and numerical modeling. For quasi-UD NCF laminates (produced through RTM) also, the detrimental effect of voids on transverse tensile modulus was reported by Varna et al., 230 where 5% voidage caused ∼15% decrease. Experimental results of Gürdal et al. 144 showed that the out-of-plane tensile modulus is largely sensitive to voids such that 1% increase in void content leads to ∼10% decrease in out-of-plane modulus.
For woven composites, Farouk et al. 256 proposed an analytical model, based on Weng’s inclusion approach, and Ishikawa and Chou’s crimp method, for predicting the effect of void content as well as aspect ratio on the longitudinal modulus. They showed that the longitudinal modulus reduces negligibly with increasing void content. For a fixed void content, the longitudinal modulus increases with moving from oblate to prolate voids, and reaches a plateau at an aspect ratio around 1.5. Through a simple numerical methodology considering randomly distributed voids in the matrix, Van Den Broucke et al. 257 found that in a carbon/epoxy woven composite, produced with resin infusion process, 1% increase in void content results in a reduction of ∼5% for in-plane (because of the plate thickness increased with the voidage) and ∼7% for out-of-plane tensile modulus. Taking into account the real geometry of a woven composite, obtained via micro-CT, Choudhry et al. 258 presented an FE micromechanical approach, which accounts for the yarn volume fraction and the composite voids. The voids were taken into account by reducing the matrix properties, through simply multiplying them by a void compensation factor (explained in the Prediction of void effects in the elastic regime section). With this modification, the resulting tensile modulus in the warp direction and the in-plane shear modulus were decreased so that they matched the experimentally measured results.
Naganuma et al. 104 observed that the effect of voids on tensile modulus is dependent on the morphology of the voids in woven composites, as is the case for tensile strength (explained in the Tensile failure in multidirectional laminates section). When the residual solvent of prepreg is below 20 wt% (enough drying time), closed voidage (flat and semicircular voids between the prepregs) is prevalent (explained in the Autoclave curing process section), with almost no effect on tensile modulus. However, above 20 wt% of the residual solvent, open voidage (large and irregularly shaped voids around the bundle intersections, open to the thickness surface) become dominant, reducing the tensile modulus. The effect of voids can be dissimilar for different stacking sequences. Zhu et al. 228 showed that the 0°-tensile modulus of a lay-up of carbon/epoxy woven plies with a high number of ±45° plies decreases 14% by ∼8% of voidage, whereas the modulus of another lay-up with a high number of 0° plies is virtually insensitive to voids.
The void sensitivity of 3D braided carbon/epoxy composites is numerically explored by Xu and Qian. 259 In their model, some elements in both yarn and matrix regions were randomly selected to represent yarn and matrix voids, respectively. They concluded that for a given void content, the elastic properties are not sensitive to the random distribution of void. The reduction level of transverse tensile moduli with voids was larger than that of longitudinal tensile modulus. The effect on longitudinal tensile modulus (in the 0° direction w.r.t. the braiding angle) increases with increasing the braiding angle. In a similar study, the degrading effect of yarn and matrix voids on elastic properties (except on longitudinal Poisson’s ratios) of a braided carbon/epoxy was endorsed by Dong and Huo 260 through a two-scale numerical approach. They concluded that the effect of yarn voids is more remarkable than that of the matrix voids.
Effect of voids on the tensile modulus of different composites as reported in the literature.
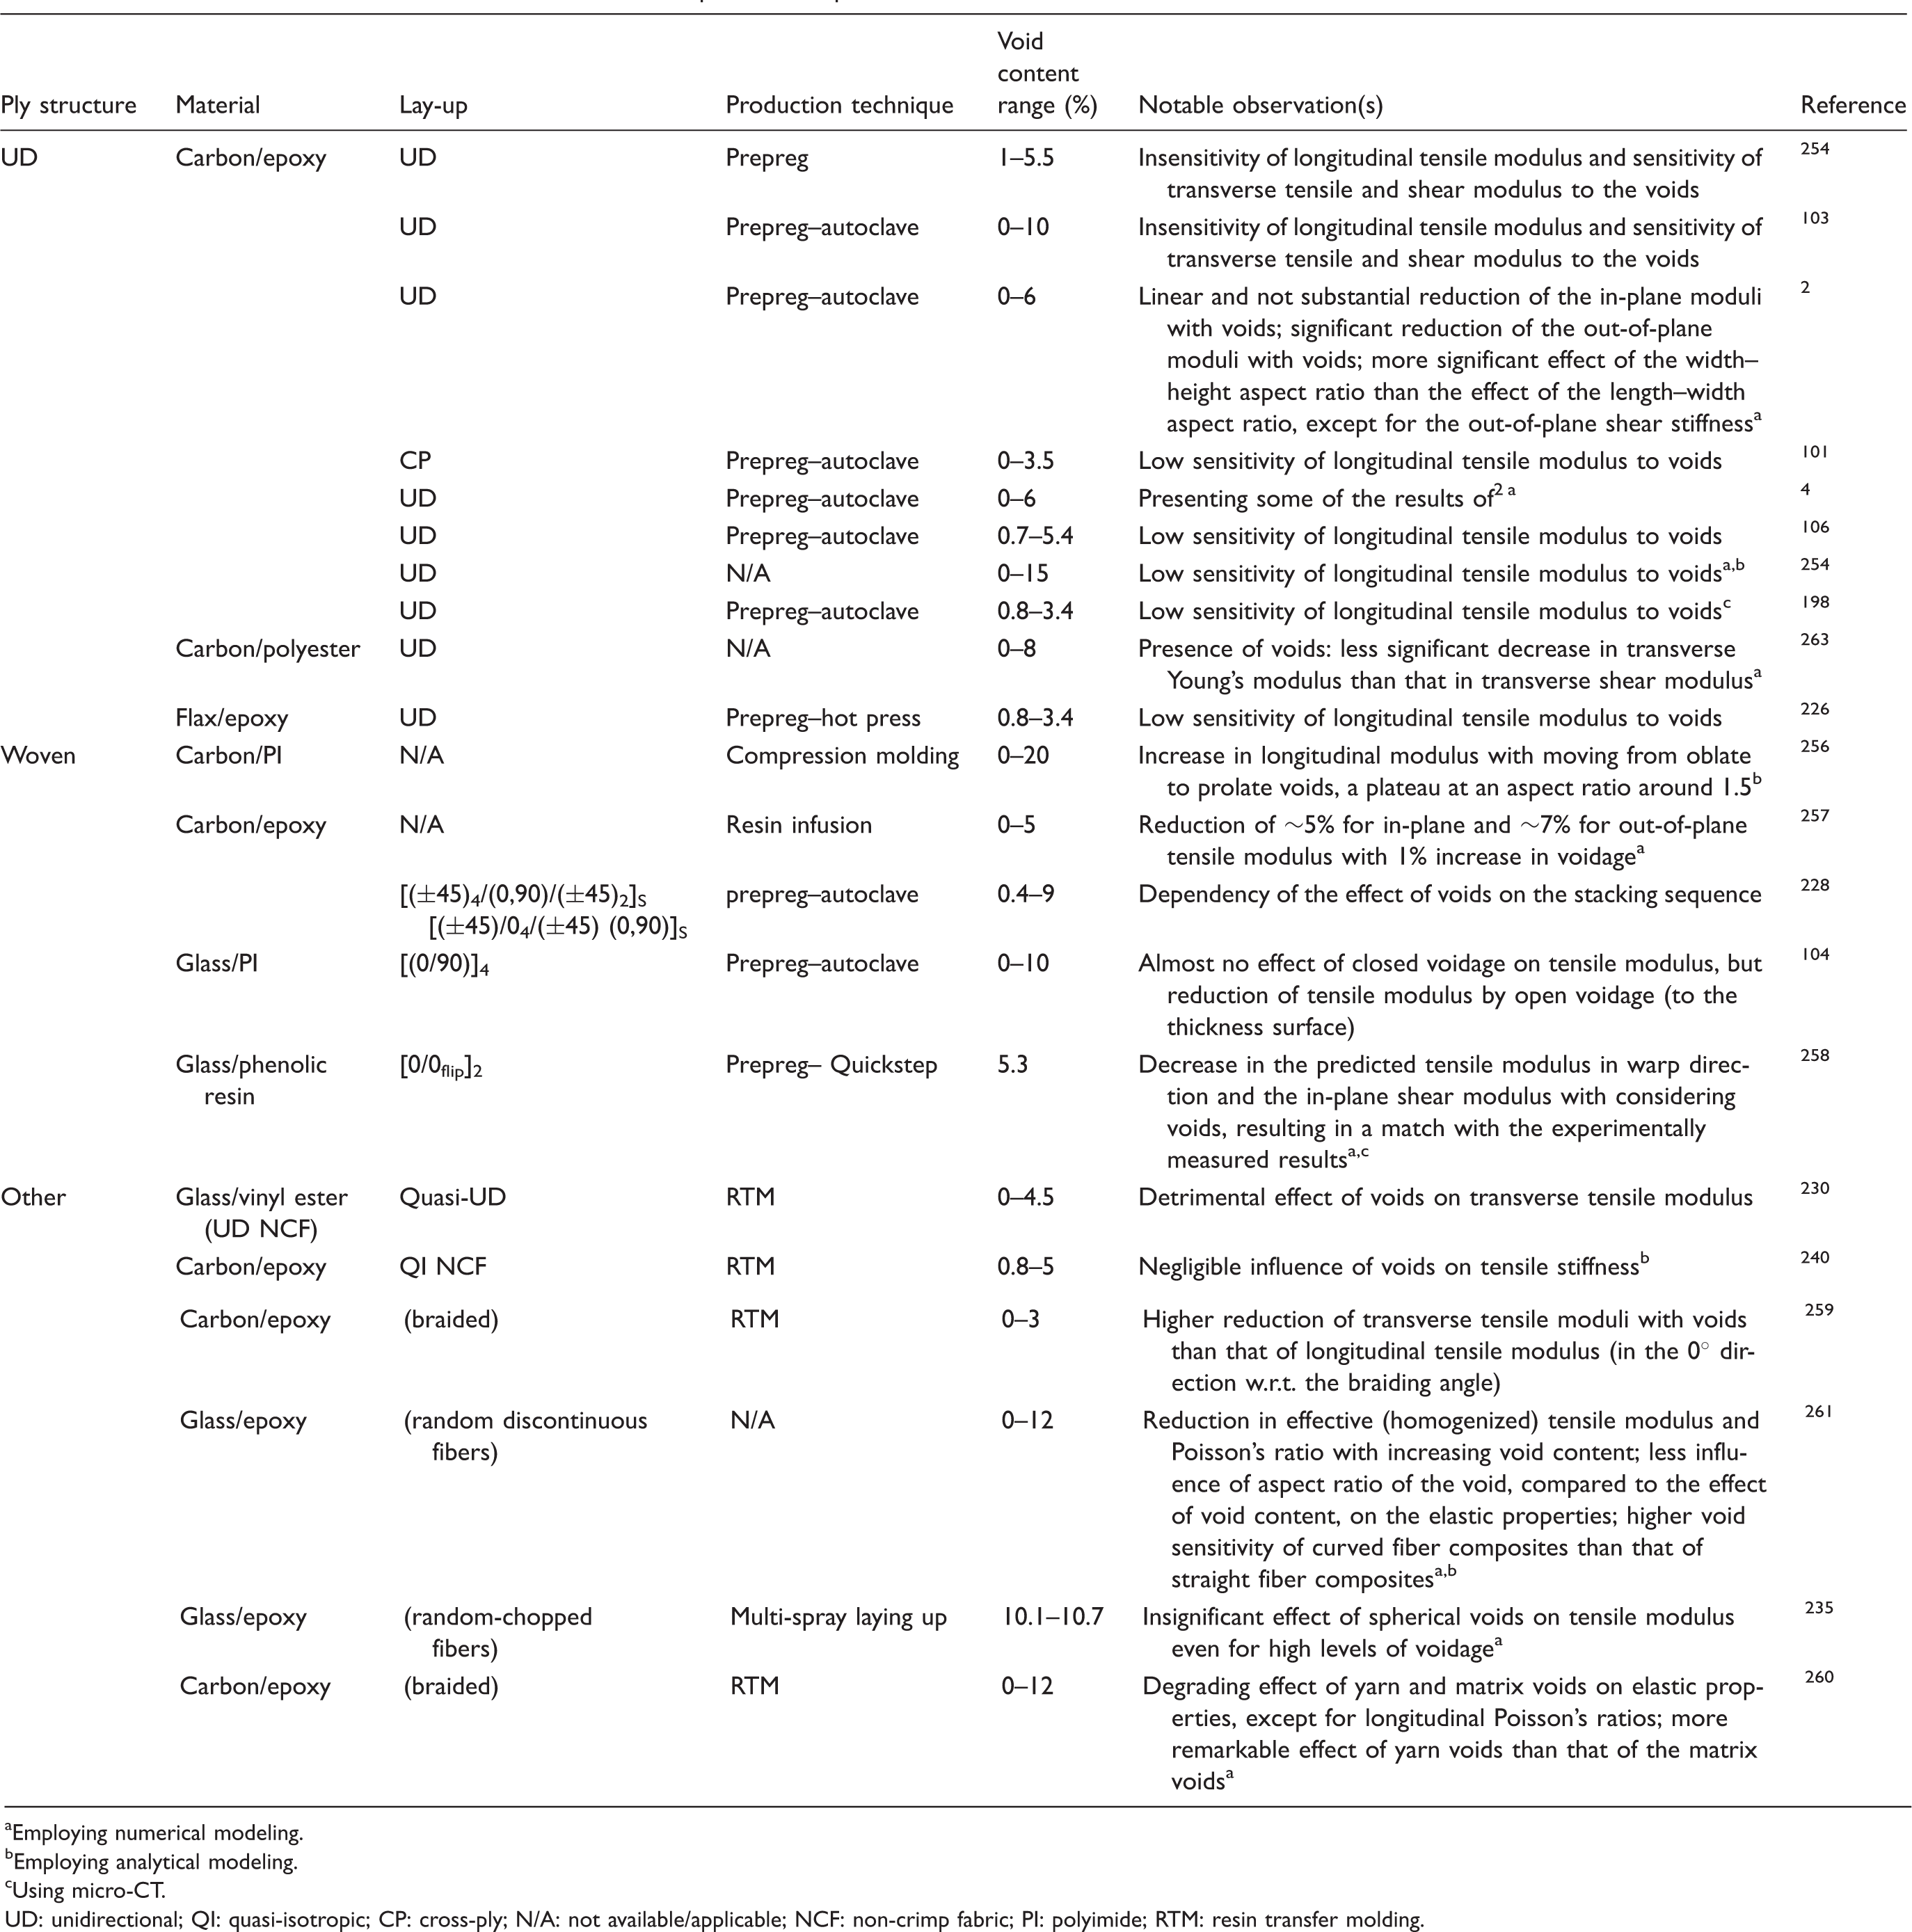
aEmploying numerical modeling.
Employing analytical modeling.
Using micro-CT.
UD: unidirectional; QI: quasi-isotropic; CP: cross-ply; N/A: not available/applicable; NCF: non-crimp fabric; PI: polyimide; RTM: resin transfer molding.
Shear modulus: Longitudinal shear modulus (
Rubin and Jerina 220 developed an analytical model to calculate reduced elastic properties, accounting for inter-laminar voids. Different ply interfaces were assigned to have a different length of the porous section, which was an input variable for the model. A linear correlation between US attenuation and the total inter-laminar void length to the ply thickness ratio was found. The compression and in-plane shear moduli, measured in the rail shear and open-hole compression tests, respectively, matched the analytical results. The rate of moduli reduction depended on the laminate type, laminate thickness, and stacking sequence. For a woven carbon epoxy laminate, the highest reduction rate of in-plane shear modulus was found for the lay-up with the minimum number of 45° plies. For UD laminates, the reduction rate for the shear and transverse compression moduli is much higher than that for the longitudinal compression modulus, and the reduction rate increases with the fraction of 0° plies.
Effect of voids on the shear modulus of different composites as reported in the literature.
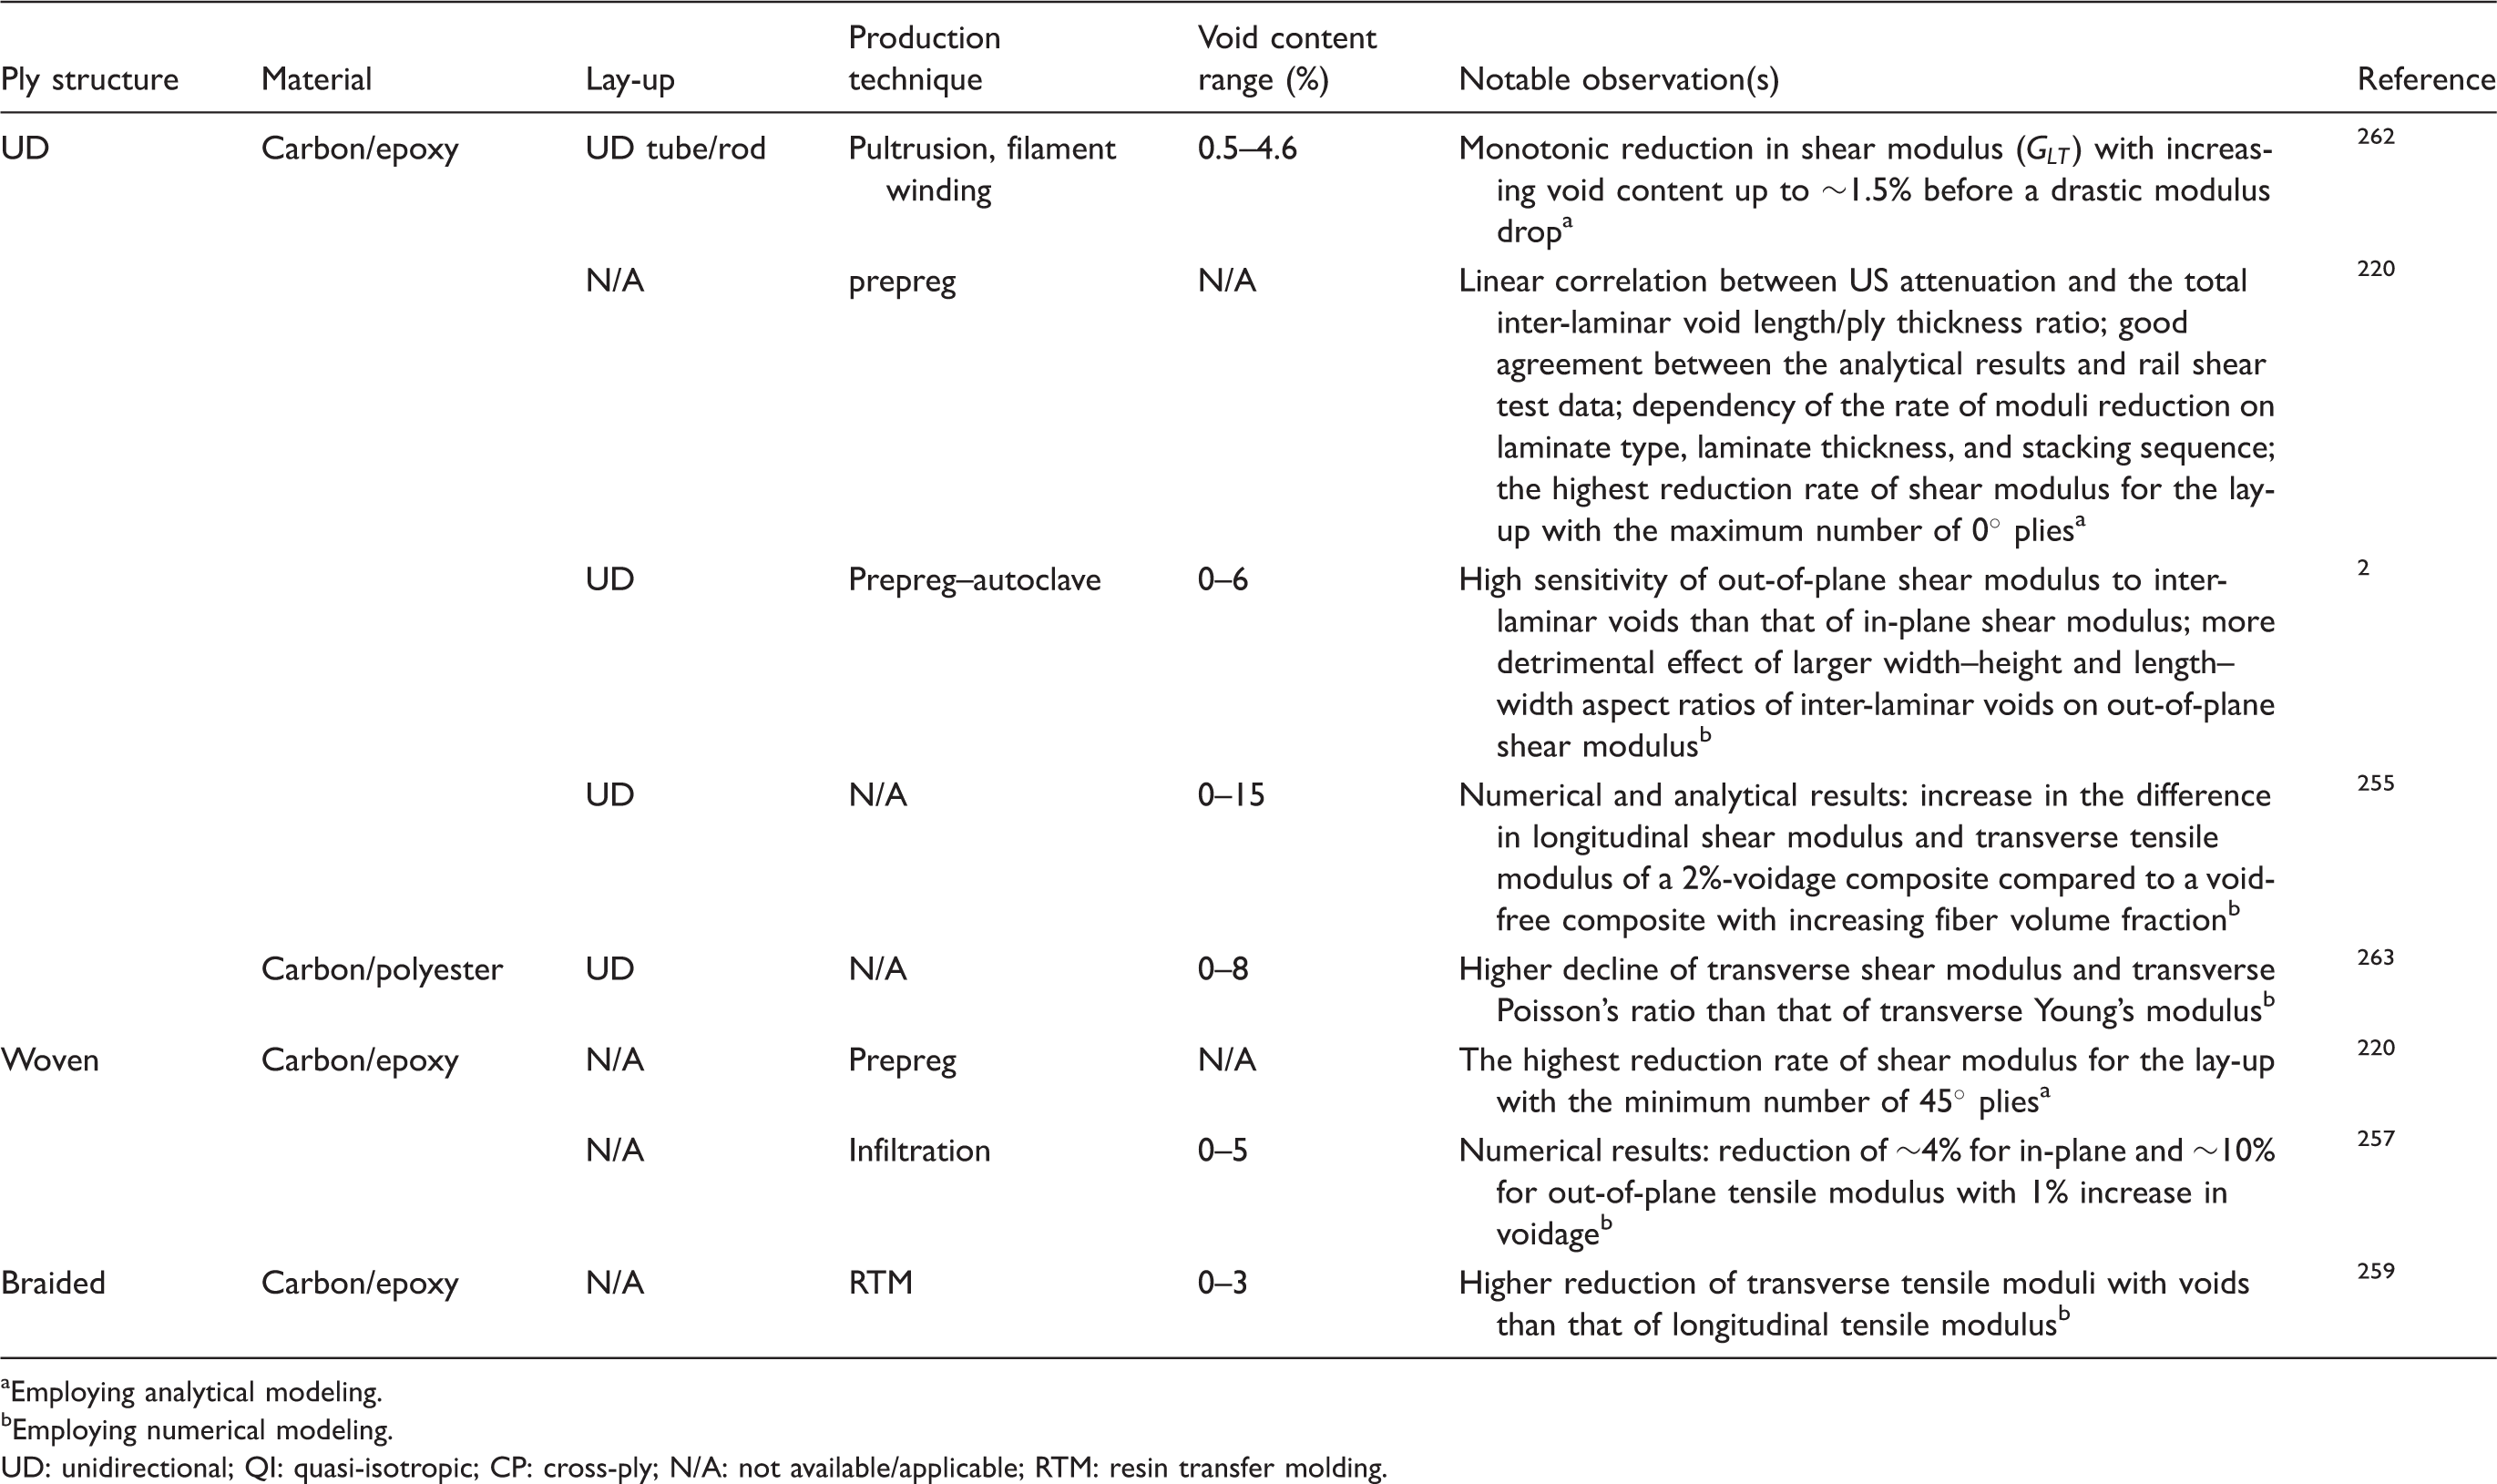
Employing analytical modeling.
Employing numerical modeling.
UD: unidirectional; QI: quasi-isotropic; CP: cross-ply; N/A: not available/applicable; RTM: resin transfer molding.
Tensile failure in UD laminates
The effect of voids on composite tensile strength in the fiber axial direction received less attention in the literature. Olivier et al. 103 noticed a very small reduction of longitudinal tensile strength, being ∼10% decrease with increase in void content from 0% to 10%. They explained that this reduction by the voids could be caused by local fiber deformations and micro-debonding between matrix and fibers.
In contrast, voids have a significant influence on the transverse tensile properties. In an analytical study, Greszczuk 264 derived a failure criterion for transverse tensile loading of UD composites, based on the Hencky-von Mises distortion energy theory, assuming a square array of cylindrical voids. The tensile strength was analytically evaluated as a function of the properties and volume fraction of the constituents, including voids, and the interaction between stress concentrations due to fibers and voids was taken into account. Olivier et al. 103 reported ∼30% reduction in transverse tensile strength of a UD carbon/epoxy composite with increase in void content from 0% to 10%. In a later study, 243 they fitted the reduction to a power–law relationship. Stamopoulos et al. 198 noted a considerable (∼15%) decrease in the transverse tensile strength with an increase of 3% in void content. The non-linearity of the reduction was attributed to the shape, size, and location of voids, evaluated via micro-CT. Unlike what is reported for the scatter of ILSS in UD 221 and woven laminates, 217 the scatter (standard deviation) for the transverse tensile strength was reduced at higher void contents.
Through a numerical analysis, Chowdhury et al. 265 investigated the local failure of a UD glass/poly(methyl methacrylate) (PMMA) composite, under transverse loading. Their model, explained in the Strength prediction with voids section, accounted for a rate-, pressure-, and temperature-sensitive behavior as well as for crazing in the matrix, and an energy-based debonding criterion for fiber/matrix interface. At low strain rate and room temperature, fracture started from the fiber/matrix debonding. The model with void showed higher macroscopic fracture strain. It might be due to some crazing that initiated and developed near the void before the main crack affected the void. Upon increasing the temperature, fracture initiated at the void, induced by crazing in the polymer. This was attributed to the thermal softening of the matrix and the decline in the crazing critical stress. Similarly, at high strain rates, the craze-induced damage initiated from the void edge. It should be noted that in spite of valuable results of this study, they are highly dependent on the input material properties. Moreover, the equality of fiber volume fraction and void content (modeling 2 circle quarters of the same size in the unit cell, one as the fiber and one as the void) as well as the large distance between fiber and void are too unrealistic in this numerical study.
The effect of very small inter-fiber micro-voids on the transverse strength properties of UD glass/epoxy composites was evaluated by Ashouri Vajari et al.,
266
using micromechanical models. This was accomplished through FE modeling, prescribing an isotropic modified Drucker–Prager model for the matrix and cohesive zone model for the fiber/matrix interface. Micro-voids were generated either trapped between fibers (irregular shape) or dispersed in the matrix (circular). The simulation results showed that voidage reduces the strength, but does not alter the dominant failure mechanism, which was interface debonding. The initial damage, and thus the strength, was governed by the trapped voids, but the circular voids could change the final crack path if they were large enough (Figure 19). It was shown that a small amount of micro-voids (1%) drastically reduces transverse tensile strength and the ultimate strain. Further increase of the void content up to 5%, however, does not lead to such significant degradation in strength and failure-strain. This is because only one or two trapped voids are sufficient to cause damage initiation, and hence reduction in strength. A good agreement was found between the failure locus of the composite lamina obtained from the micromechanical model and that predicted by the Puck’s model. The authors surprisingly attributed the lower transverse tensile strength of the composite, compared to the matrix tensile strength and the interface strength, to only the presence of micro-voids. It is known that even without voids, the transverse strength of a composite is lower than the strength of the matrix and interface, which is a result of stress concentrations generated by fibers. Figure 19 also highlights the necessity for modeling the stochastic nature of voidage. With only one realization of the placement of voids for each void radius, it seems that the ultimate strain increases with the increasing void radius; such an effect should be supported by considering a statistically representative sampling of the placement of voids.
Effect of the size of inter-fiber micro-voids on transverse tensile behavior of a numerical micro-model of a UD glass/epoxy composite with constant fiber volume fraction of 60% and void content of 1.5%: (a) homogenized transverse stress–strain curve; equivalent plastic strain fields at transverse strain of 0.009 for (b) void-free composite, composite containing voids with average radius of the circular voids (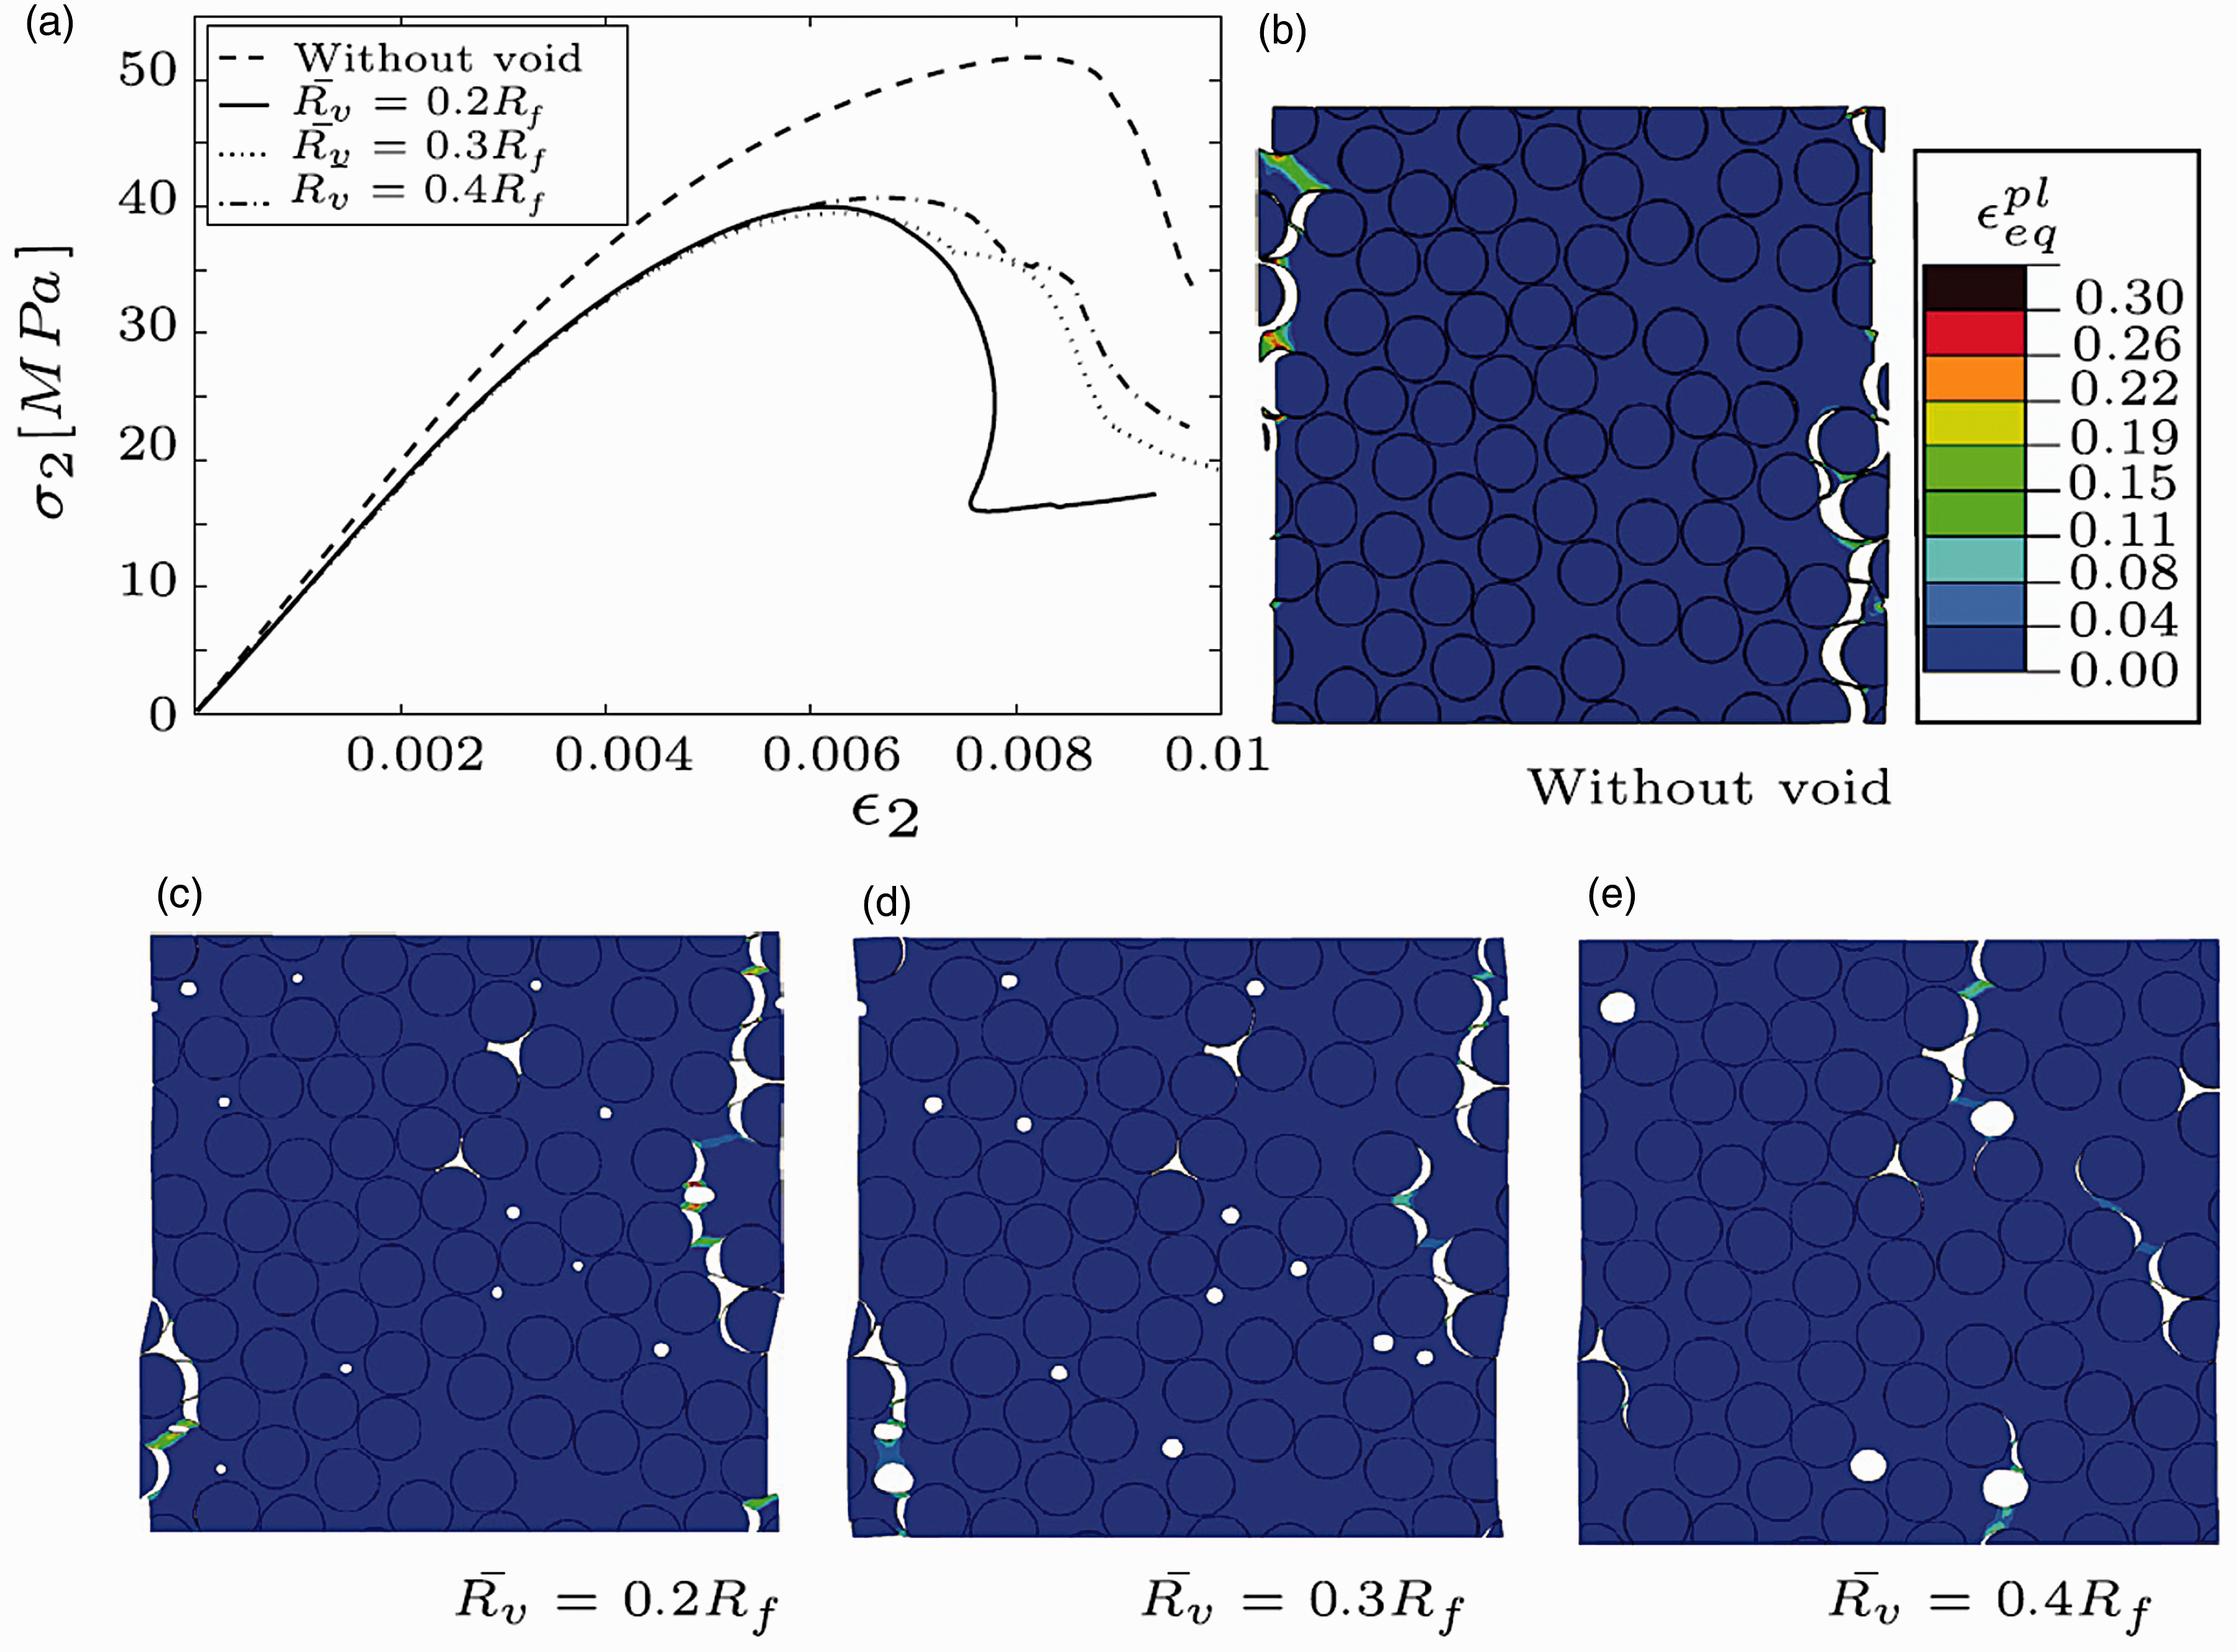
In a similar study, 267 it was found that the spatial distribution of inter-fiber micro-voids, with a fixed void content of 2%, can cause a 17% deviation in the transverse tensile strength. Furthermore, 1% voidage can decrease the strength by 25% under combined loading conditions of transverse tension and longitudinal shear loading.
Based on micro-CT analysis, Tserpes et al. 200 proposed a numerical methodology, which is performed in three consecutive scales. The results, falling within the range of experimental scatter, showed that the transverse tensile strength is highly void-sensitive. However, they claimed that the transverse tensile stiffness is negligibly sensitive to voids, even for void contents of ∼3.5%, which contradicts to the literature.2,103,254
Tensile failure in multidirectional laminates
In a quasi-UD NCF glass/vinyl ester laminate (5% of fibers in the transverse direction) produced through RTM, Varna et al. 230 found an insignificant effect of voids on transverse tensile strength. In contrast, the transversal strain-to-failure was much more sensitive to voids, increasing significantly with increasing void content. In specimens with a low void content, only a few large transverse cracks were found prior to failure, while high-voidage specimens had several large transverse cracks with irregularly shaped and numerous smaller cracks. They proposed a simple analytical model, based on the “shear lag” approach, to show that in laminates with a high void content, the stress level inside the small amount of weft bundles oriented in the loading direction is lower, compared to the laminates without voids (due to the irregular cracks). This could explain the higher strain-to-failure of laminates with voids. The negligible influence of voids on the tensile strength is also reported for QI NCF composites produced with (VA)RTM in the literature.233,240
In a cross-ply carbon/epoxy laminate, ∼15% reduction in tensile strength for an increase of 2.5% in voidage was reported by Liu et al. 101 In the literature, 225 the tensile strength of a cross-ply laminate was fitted with the failure criterion (equation (10)) proposed by de Almeida and Neto 154 for shear and flexural strength (explained in the Inter-laminar shear strength section). Fedulov et al. 268 used a simple numerical methodology to predict the influence of voids on the tensile failure load of cross-ply and QI laminates. The input strength parameters for an individual ply in the absence and presence of voids were estimated based on the (previously measured) experimental data. The void content was found to reduce the tensile failure load, which was a consequence of the shear strength reduction.
Effect of voids on the tensile failure of different composites as reported in the literature.
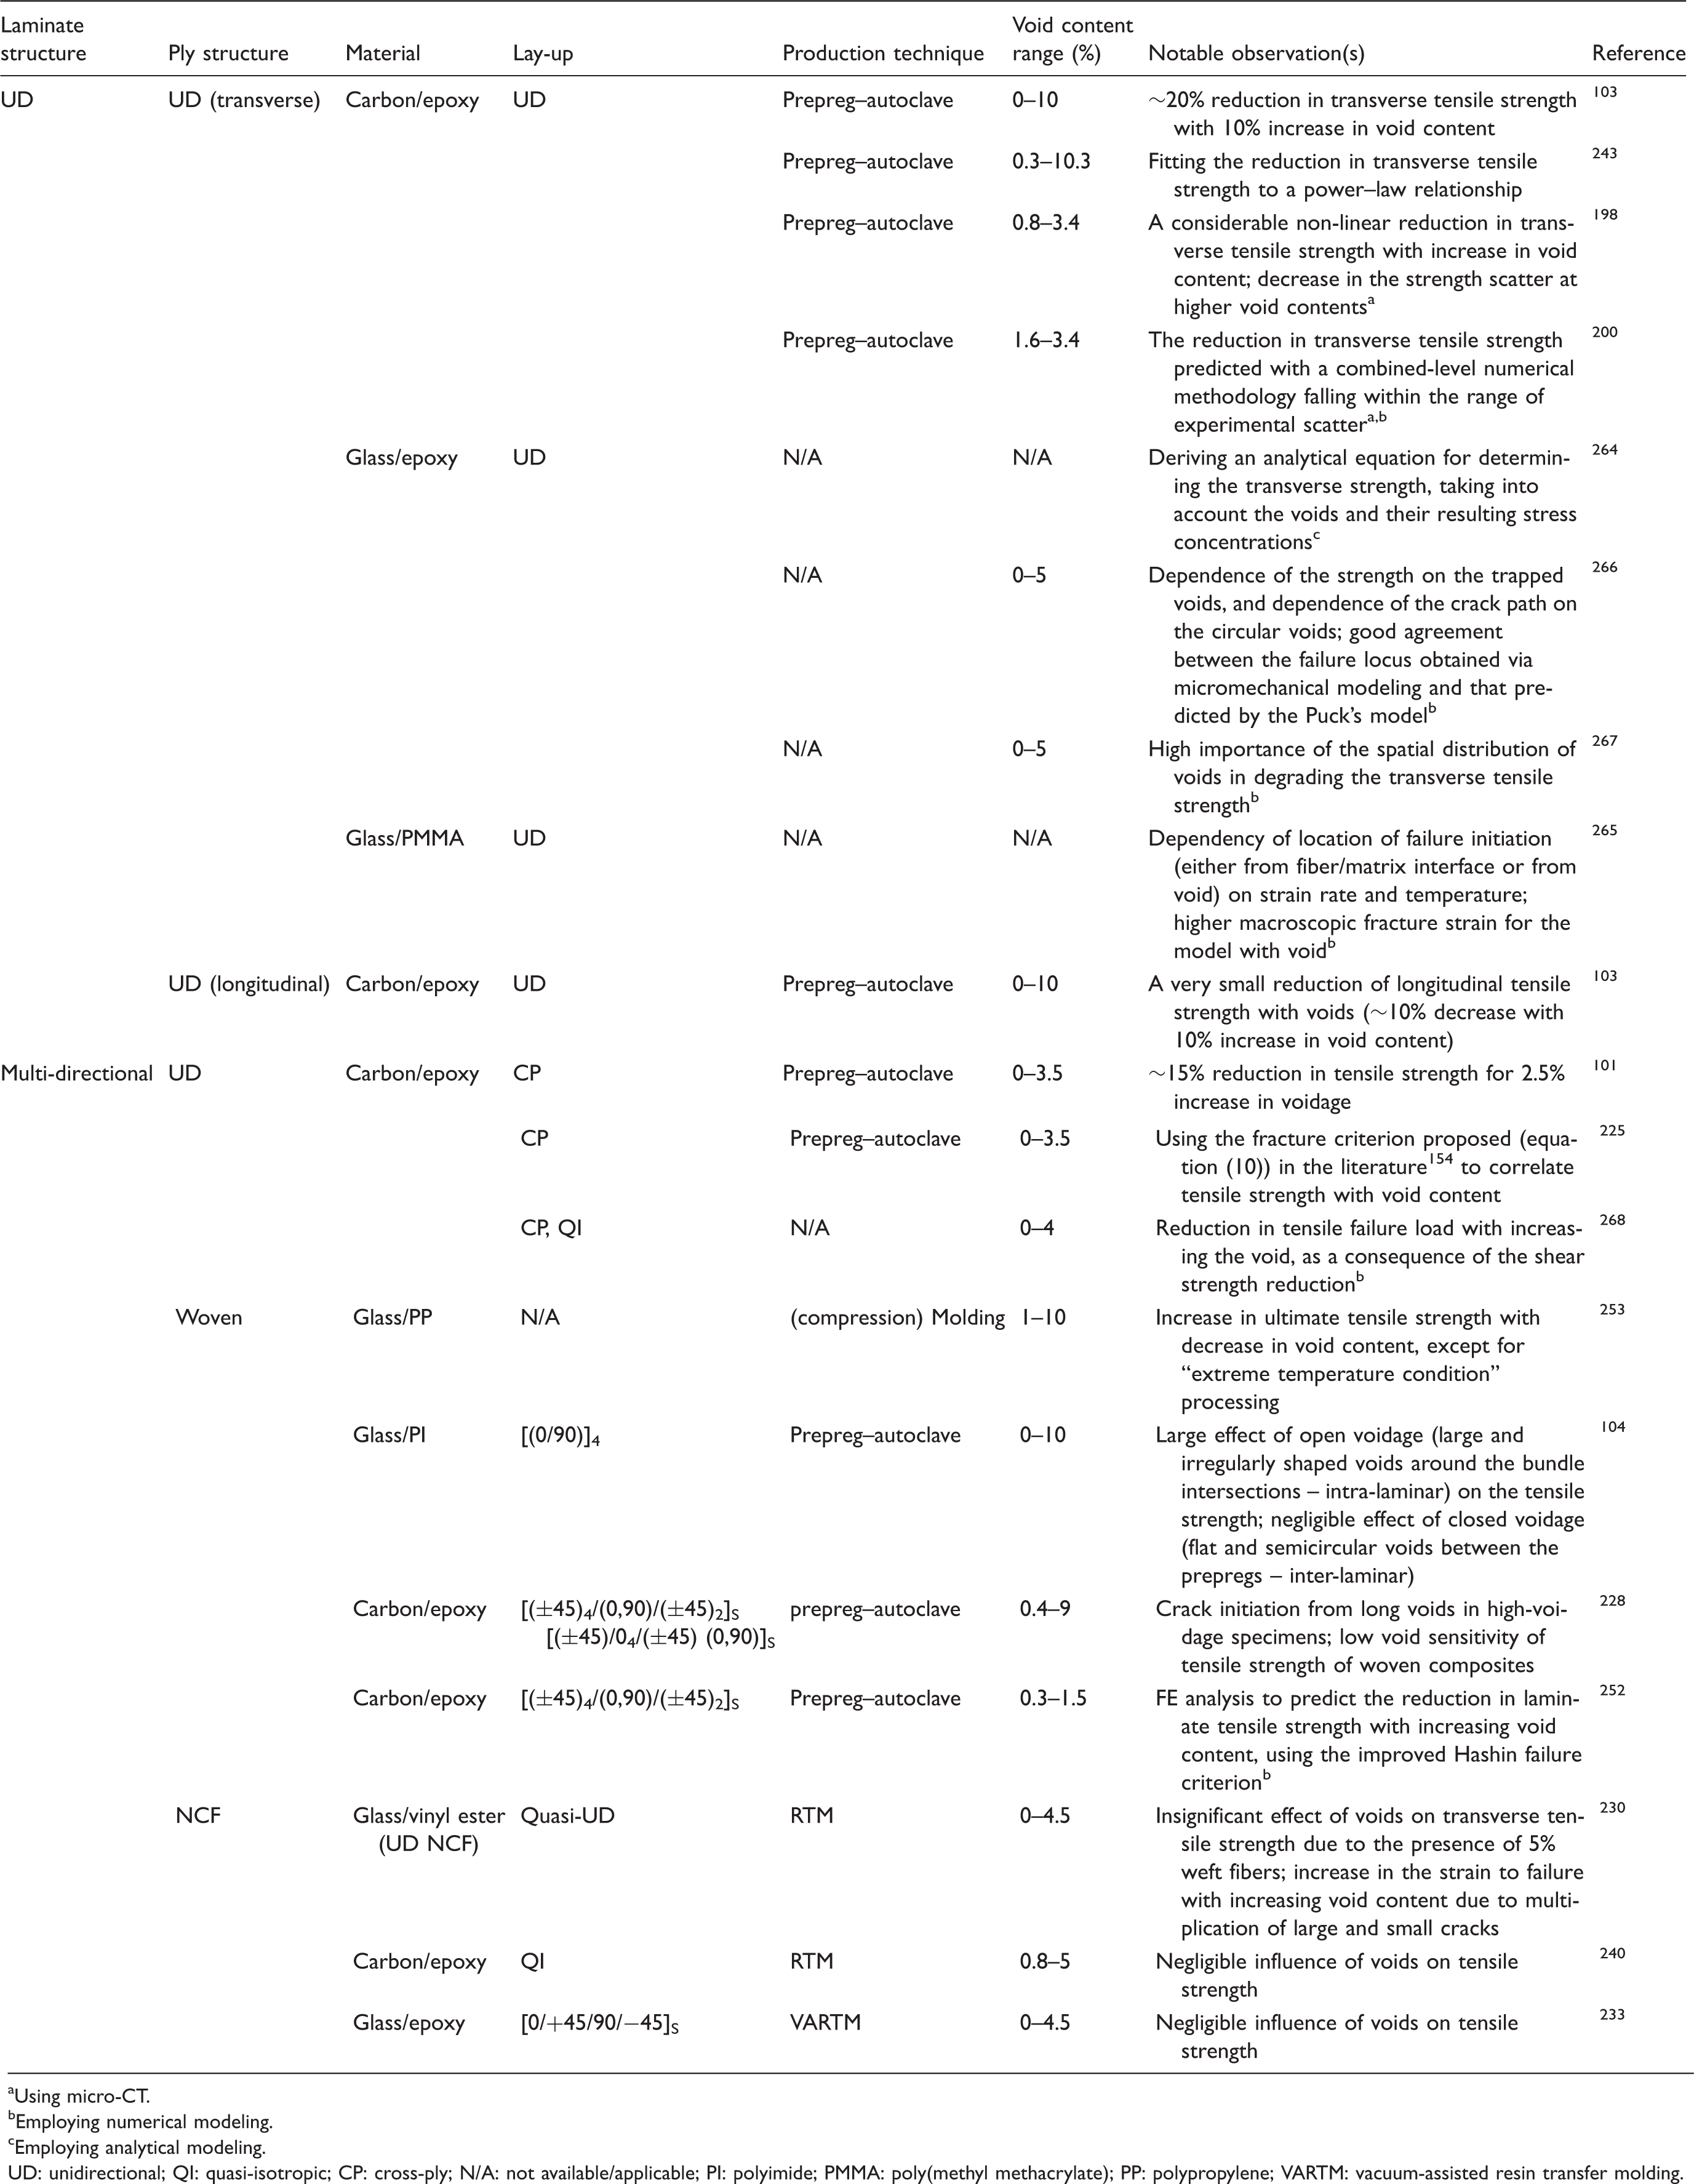
Using micro-CT.
Employing numerical modeling.
Employing analytical modeling.
UD: unidirectional; QI: quasi-isotropic; CP: cross-ply; N/A: not available/applicable; PI: polyimide; PMMA: poly(methyl methacrylate); PP: polypropylene; VARTM: vacuum-assisted resin transfer molding.
Concluding remarks on the effect of voids on tensile
Tables 6 to 8 make an overview of literature on the void effect on tensile properties. As far as stiffness is concerned, the voids affect stiffness of transverse and bias plies with few percent reduction per 1% increase of the void content. This leads to a small overall reduction of stiffness in cross-ply and QI laminates. Out-of-plane shear modulus can be substantially reduced because of void concentration at the inter-laminar interface.
Voids should affect strength of longitudinal plies because of the potential change in stress transfer and stress redistribution next to a broken fiber; there are experimental indications confirming this, but the phenomenon is not thoroughly studied.
Voids definitely affect strength of transverse and bias plies. The reduction in strength is as high as 10–20% per 1% of the void content increase. This reduction is much higher than what can be expected from the reduction of the effective cross-sectional area and is attributed to stress concentrations around the voids and easier crack initiation; these mechanisms are also revealed in the micro-level models. Transverse strength is related to the cracking of the transverse plies, which is the subject of the Transverse cracking section.
The reduced strength of transverse and bias plies is translated into a moderate decrease of the laminate tensile strength, few-percent reduction per 1% increase in void content. This is also true for woven laminates.
Compressive properties
Compressive elastic properties
The compressive modulus, influenced by voids, has not been widely studied. In QI laminates, Hernández et al. 97 found a small effect of voids on the compressive modulus, whereas Cinquin et al. 269 observed a linear reduction of the compressive modulus with increasing voidage for high void contents. In multidirectional NCF laminates produced with VARTM, according to Kosmann et al., 232 the compressive modulus decreased with increasing void content in specimens with distributed voids. This reduction was more than what is expected from the reduced cross-sectional area following the rule of mixture. It was attributed to local fiber kinking in longitudinal bundles in the vicinity of voids and to early micro-cracking due to stress concentrations.
Compressive failure
Longitudinal compressive failure, or shortly compressive failure, of UD FRCs is controlled by many factors including constituent properties, interfacial effects and internal structure. Voids as a part of the internal structure can influence the compressive failure since they cause misalignment of the fibers in their vicinity as well as variations in the local shear behavior of the matrix. 270 It is worth noting that in a number of recent investigations of compressive strength, influenced by voids, modern methodologies such as in situ microscopy, micro-CT, photoelastic analysis, and digital image correlation (DIC) are employed that are explained in the current section.
Uhl et al. 89 found the same monotonic trend in reduction of compressive strength with voidage as that of ILSS, for QI laminates with UD carbon/epoxy plies as well as for laminates with woven carbon/epoxy or carbon/PI plies. The degradation of the compressive strength with voidage was much less than that of ILSS, being attributed to the location and morphology of the voids. For a certain void content, the reduction of compressive strength was around two times higher in woven carbon/epoxy laminate than in QI carbon/epoxy laminate and in woven carbon/PI laminate. They fitted the results to the simple empirical exponential model of the literature, 245 explained in the ILSS in UD-ply composites section. Tang et al. 92 observed a ∼30% reduction in compressive strength by increasing the void content from 5% to 10%. The reduction rate increased with void content in their study, in contrast to the linear reduction in the literature. 89
Bazhenov et al. 271 found a square root relationship between the compressive strength and the void content in UD glass/epoxy composites. Their results showed that as the fiber diameter increases, the dominant failure mechanism changes from splitting (delamination) to micro-buckling, and the compressive strength becomes less void-sensitive. According to Lee and Soutis, 214 thicker compression specimens have higher void contents, which can cause damage initiation through triggering fiber micro-buckling, leading to strength reduction. For a QI carbon/epoxy laminate, Cinquin et al. 269 observed that intra-laminar voids are detrimental for compressive strength, causing a reduction of ∼16% with increase of 6% in void content.
Hapke et al. 270 conducted an in situ analysis of the sequence of events prior to and during compressive failure in the presence of voids, as one of the pioneer studies performing more than post-mortem analysis on voids' effects. For a void-free UD carbon/epoxy specimen, the failure development started by matrix plastic shearing and continued by kink band formation (no micro-buckling) and fiber fracture. In the void-containing specimen, besides the overall void content, the void location relative to the developing kink band seemed to play a significant role. In the case of a kink band propagating along a path above the void tip, the band orientation altered due to the change in the lateral support. In the case where a void was located with its center in front of the notch, the kink band was suppressed by propagating through the void. In both location-cases, fiber fracture did not happen along the entire band length, while it always occurred in void-free specimens after the kink band initiation.
With the help of micro-CT, Hernández et al. 97 could distinguish the effect of voids and of the stacking sequence on the compressive strength of QI carbon/epoxy laminates. Their compressive strength decreased with the void content increase and/or ply clustering. The effect of the latter is due to earlier onset of delaminations in laminates with thicker plies. The compressive strength after impact was also investigated and found to be insensitive to the voidage, which indicates that the damage produced during impact prevailed the effect of the voids.
In a number of recent studies, Liebig et al.218,227,242 explored the influence of voids on the compressive failure in a model composite containing a single void laying between two UD glass fibers embedded in epoxy matrix. Through a photoelastic analysis,
218
they observed that a high equivalent stress exists alongside the void, whereas close to the end caps of the void, the load is minimum (Figure 20). The length of the void had a vital influence on the compressive failure mechanism. The shorter the void, the smaller stress concentration appears alongside the void. The failure type for the case of a short/circular void was fiber/matrix debonding, while for the case of an elongated void, it was fiber buckling because of the only one-sided support for the fiber. Both types of failures happened in the zone influenced by the void where a high equivalent stress existed. The stress distribution together with the high stiffness mismatch between the fiber and matrix resulted in an overloading of the interface along the fiber close to the end cap of the void. This led to the interface debonding or fiber buckling.
(a) Isochromatic fringe pattern for a model composite (epoxy matrix containing two discrete glass fibers surrounding a void) under longitudinal compressive loading; (b) the equivalent stress map resulted from photoelasticity for the region below the void, exhibiting a high stress alongside the void.
218
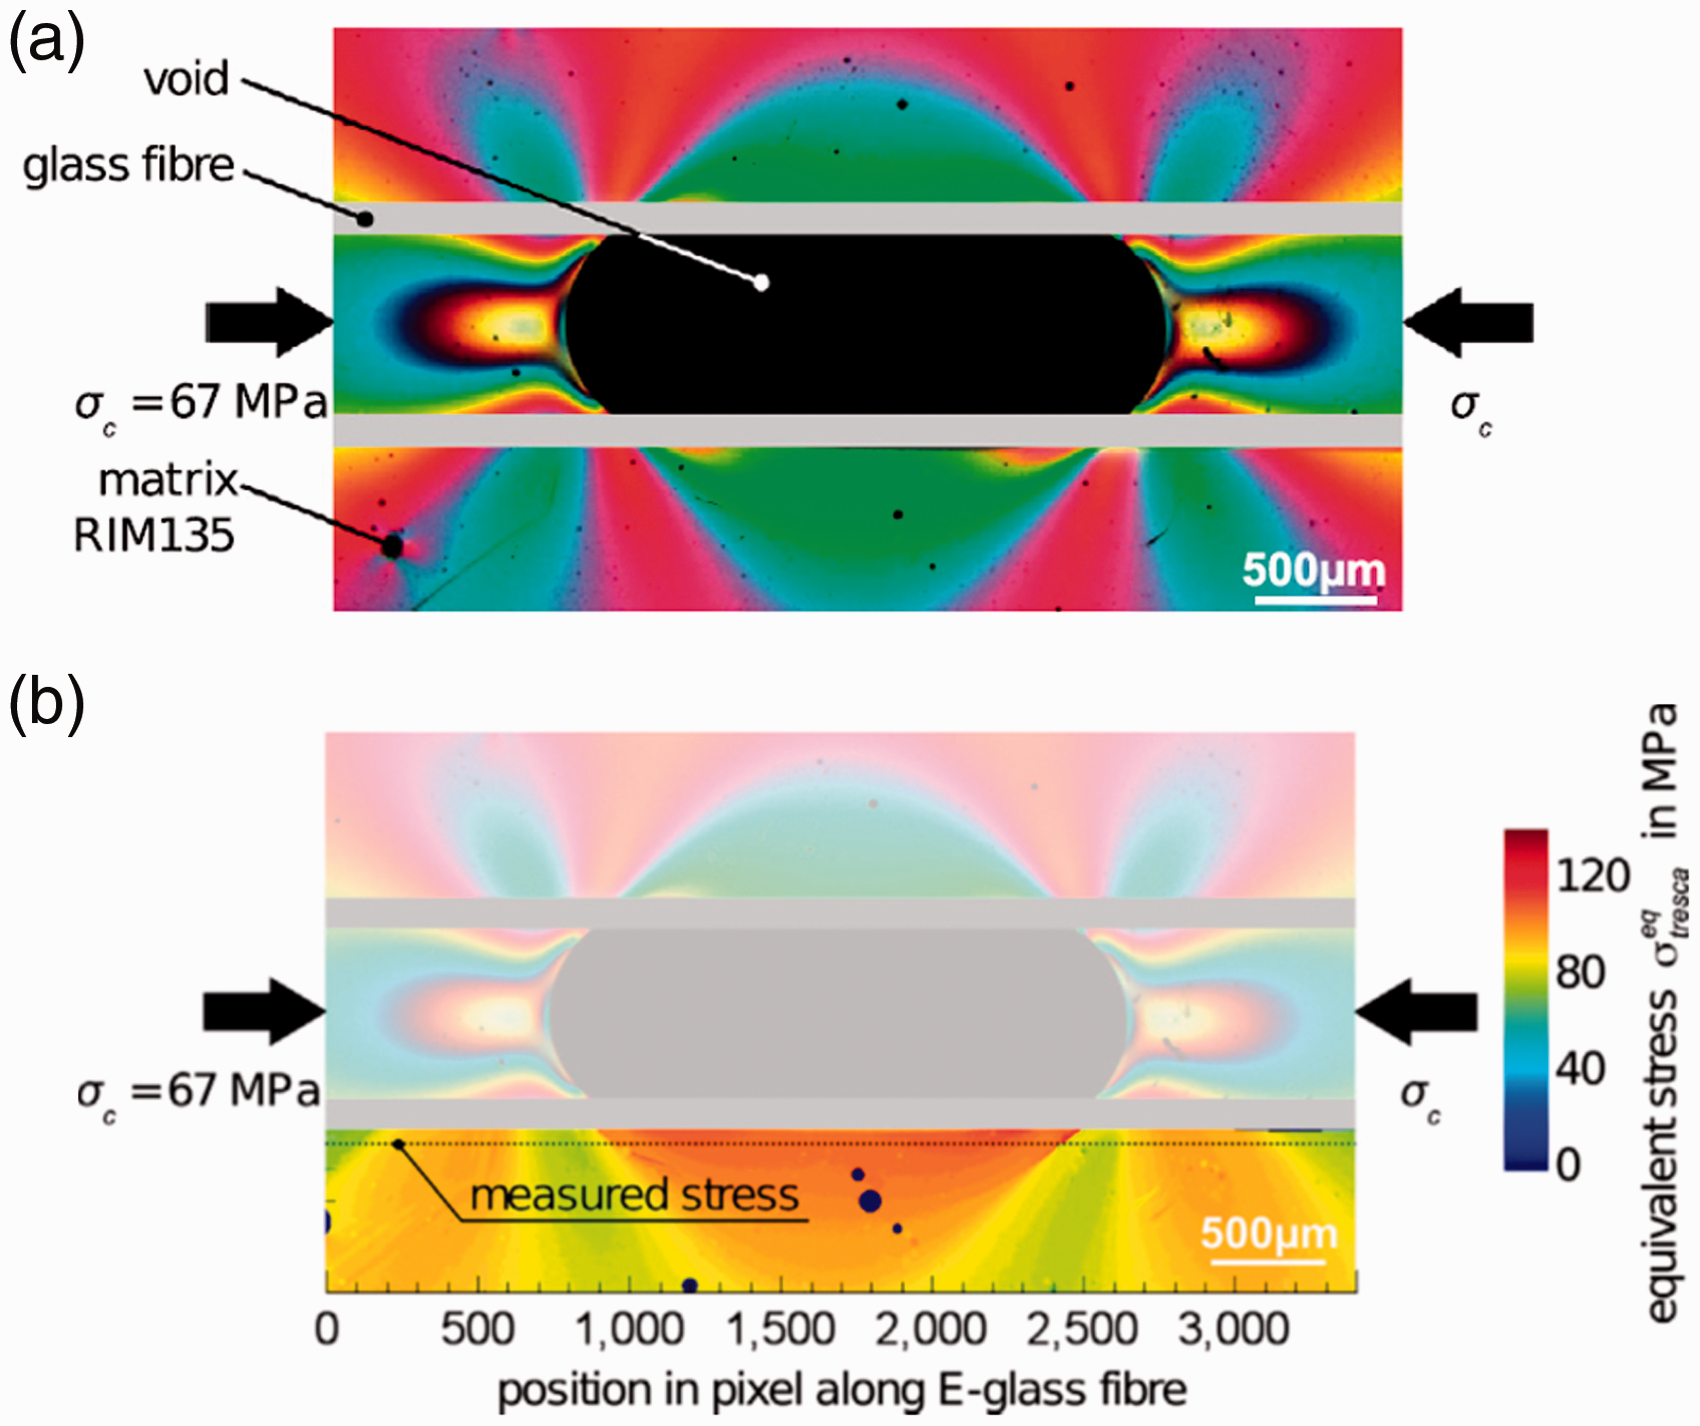
Later, they
227
performed a broader analysis on a model composite produced with discrete glass fibers as well as an extended model composite with glass rovings, both containing a single void. In the extended model composite, similarly to the model composite, the failure mechanism is: (1) fiber/matrix debonding, Euler buckling and failure of one fiber; (2) stress rearrangements, formation of a damage zone (3) failure of additional fibers, kink-band formation by the nearest fibers around the void; (4) propagation of the kink-band through the composite (Figure 21). Premature compressive failure of composites occurs in the presence of voids as an interaction between stress rearrangement alongside the void and fiber misalignment, which result in fiber/matrix debonding and local overloading of the fibers. This is followed by an ongoing loss in stability of the fibers, and finally fiber kinking. Through a numerical analysis with plasticity for the matrix and cohesive behavior for the interface, it was shown that the influence of fiber misalignment on the first fiber/matrix debonding is more significant than that of the aspect ratio of the void. Furthermore, in fractography of typical UD carbon/epoxy composite containing 8% of voidage, similar failure steps to those of the extended composite was observed.
Schematic of the failure mechanisms, influenced by a void, for the extended model composite (glass fiber rovings embedded in epoxy matrix with a void inclusion) under longitudinal compression at different steps: (a) unloaded, (b) longitudinal debonding, (c) fiber failure and initiation of damage zone, (d) failure of additional fibers and kink-band formation, and (e) propagation of the kink-band.
227
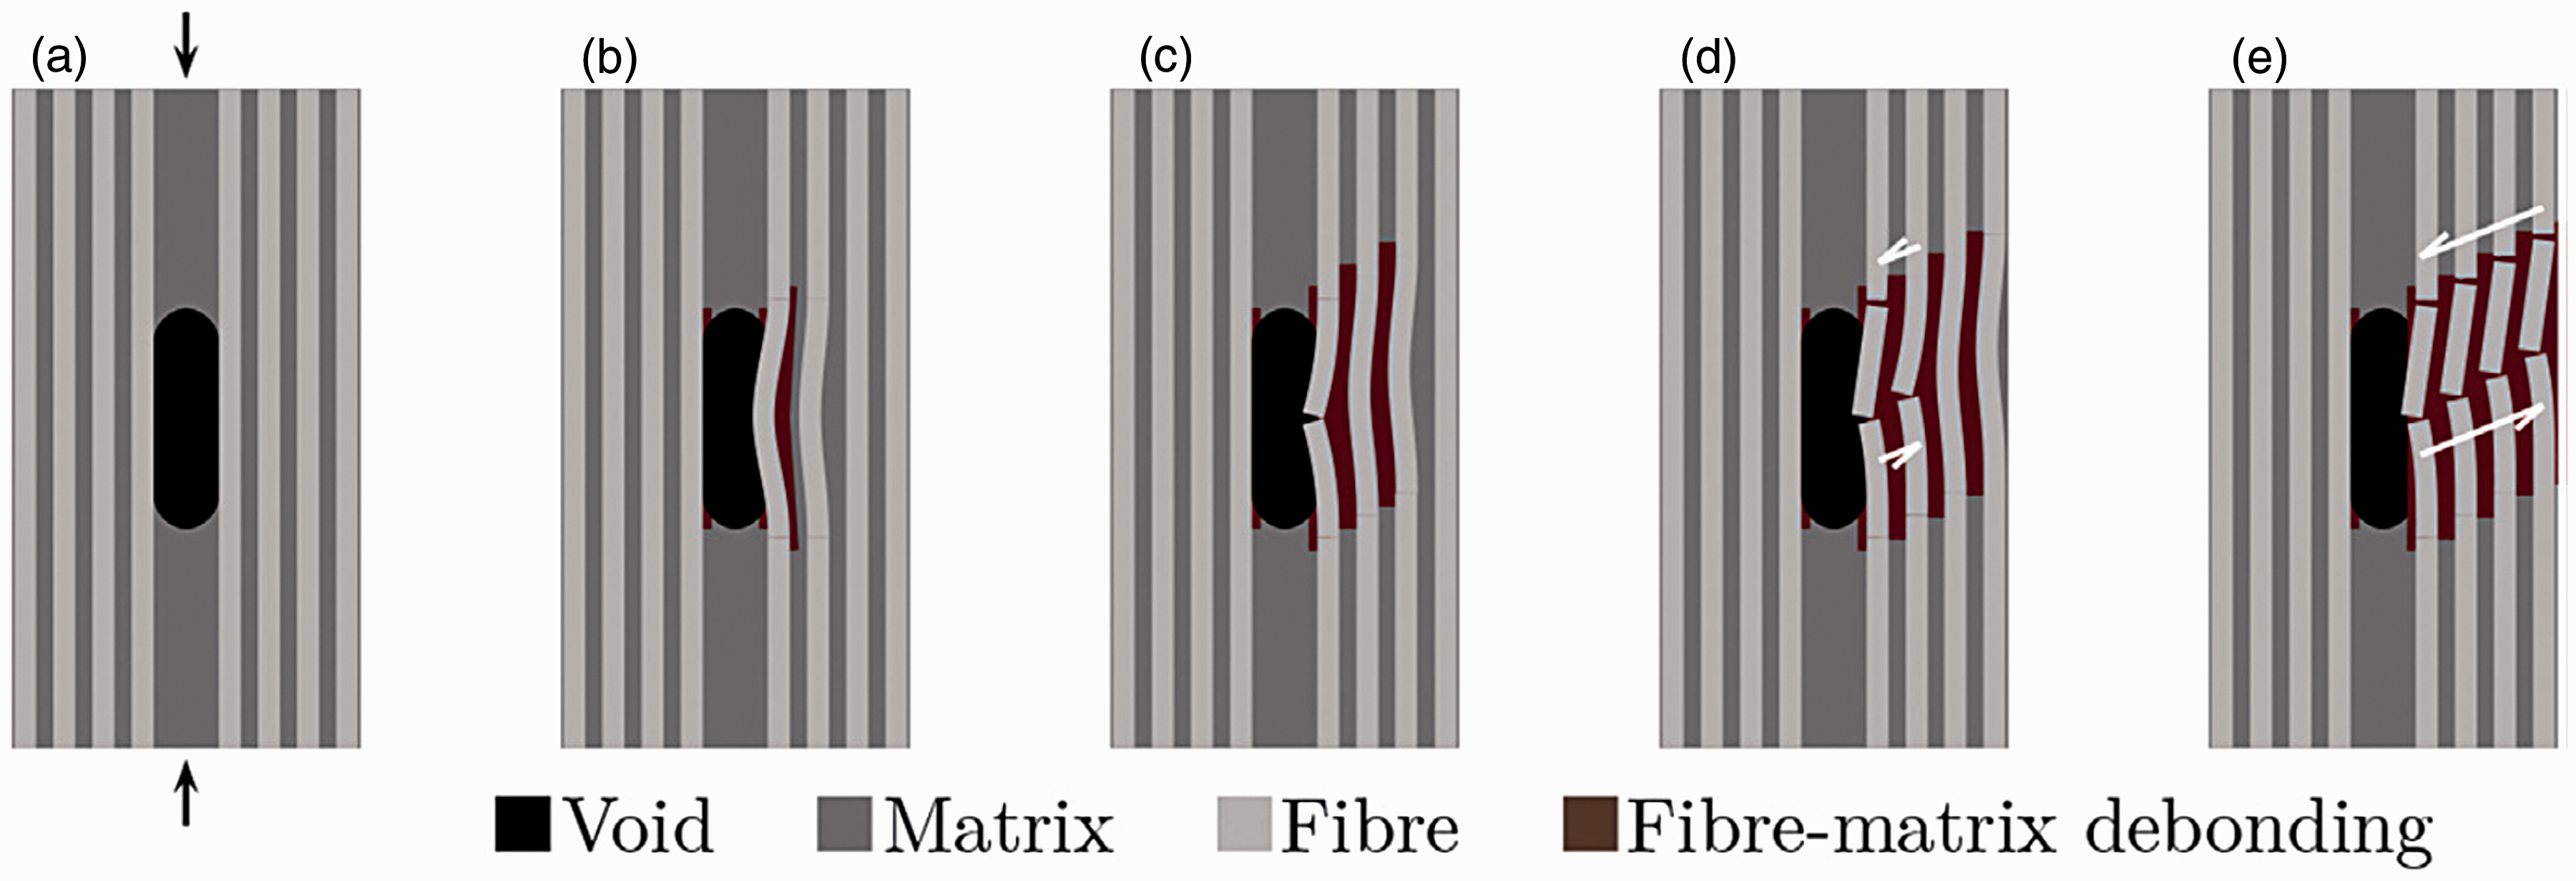
In a further study, 242 the authors showed that DIC indicates also minimum and maximum strains in the summit and in the middle of the void, respectively. The high strain alongside the void was linked to the fiber deflection into the void, which accompanies the non-linear deformation of the matrix. Using an analytical approach, it was also concluded that besides fiber misalignment, the central angle of the fiber sector embedded in the matrix influences the compressive strength in the presence of voids. Therefore, to estimate the compressive strength, the critical number of affected fibers by voids needs to be determined through a probabilistic approach, in addition to the void content. Although in contrast to the approach presented by Hapke et al., 270 the methodology investigated by Liebig et al.218,227,242 shows information also about failure initiation, it is still not representative of the compressive failure in real composites. This can be attributed to the lower fiber volume fraction, larger fiber diameter (∼70 µm), and larger size of voids (up to 3500 µm length and 800 µm height) compared with typical composites.
In NCF glass/epoxy composites produced through VARTM, Kosmann et al. 232 observed that a significant reduction of compressive Young’s modulus and compressive strength takes place in the presence of voids, whereas they do not influence the strain to failure. Acoustic emission results showed that under compressive loads (distributed), voids could cause a shift in the matrix damage initiation to much lower strains in comparison to the case without voids. For woven carbon/epoxy composites, Zhang et al. 252 numerically predicted the reduction of compressive strength as a function of the void content, using strength values for plies with different void contents as input.
Transverse compressive strength and its dependence on voids are less studied. Through numerical modeling, Ashouri Vajari 267 showed that 1% void content can decrease the strength by 15% in dominant transverse compression combined with longitudinal shear loading. In a rare study on through-thickness compressive strength of a cross-ply laminate with polyethylene fibers and a PU thermoplastic matrix produced in a hot press, O’Masta et al. 203 concluded that the load-carrying capacity in through-thickness compression mode is reduced greatly at the regions of high concentrations of voids. By accounting for load shielding within the high voidage regions (a simple statistical model), the large reduction in through-thickness compressive strength could be predicted.
Concluding remarks on the effect of voids on compressive properties
Effect of voids on the longitudinal compressive failure of different composites as reported in the literature.
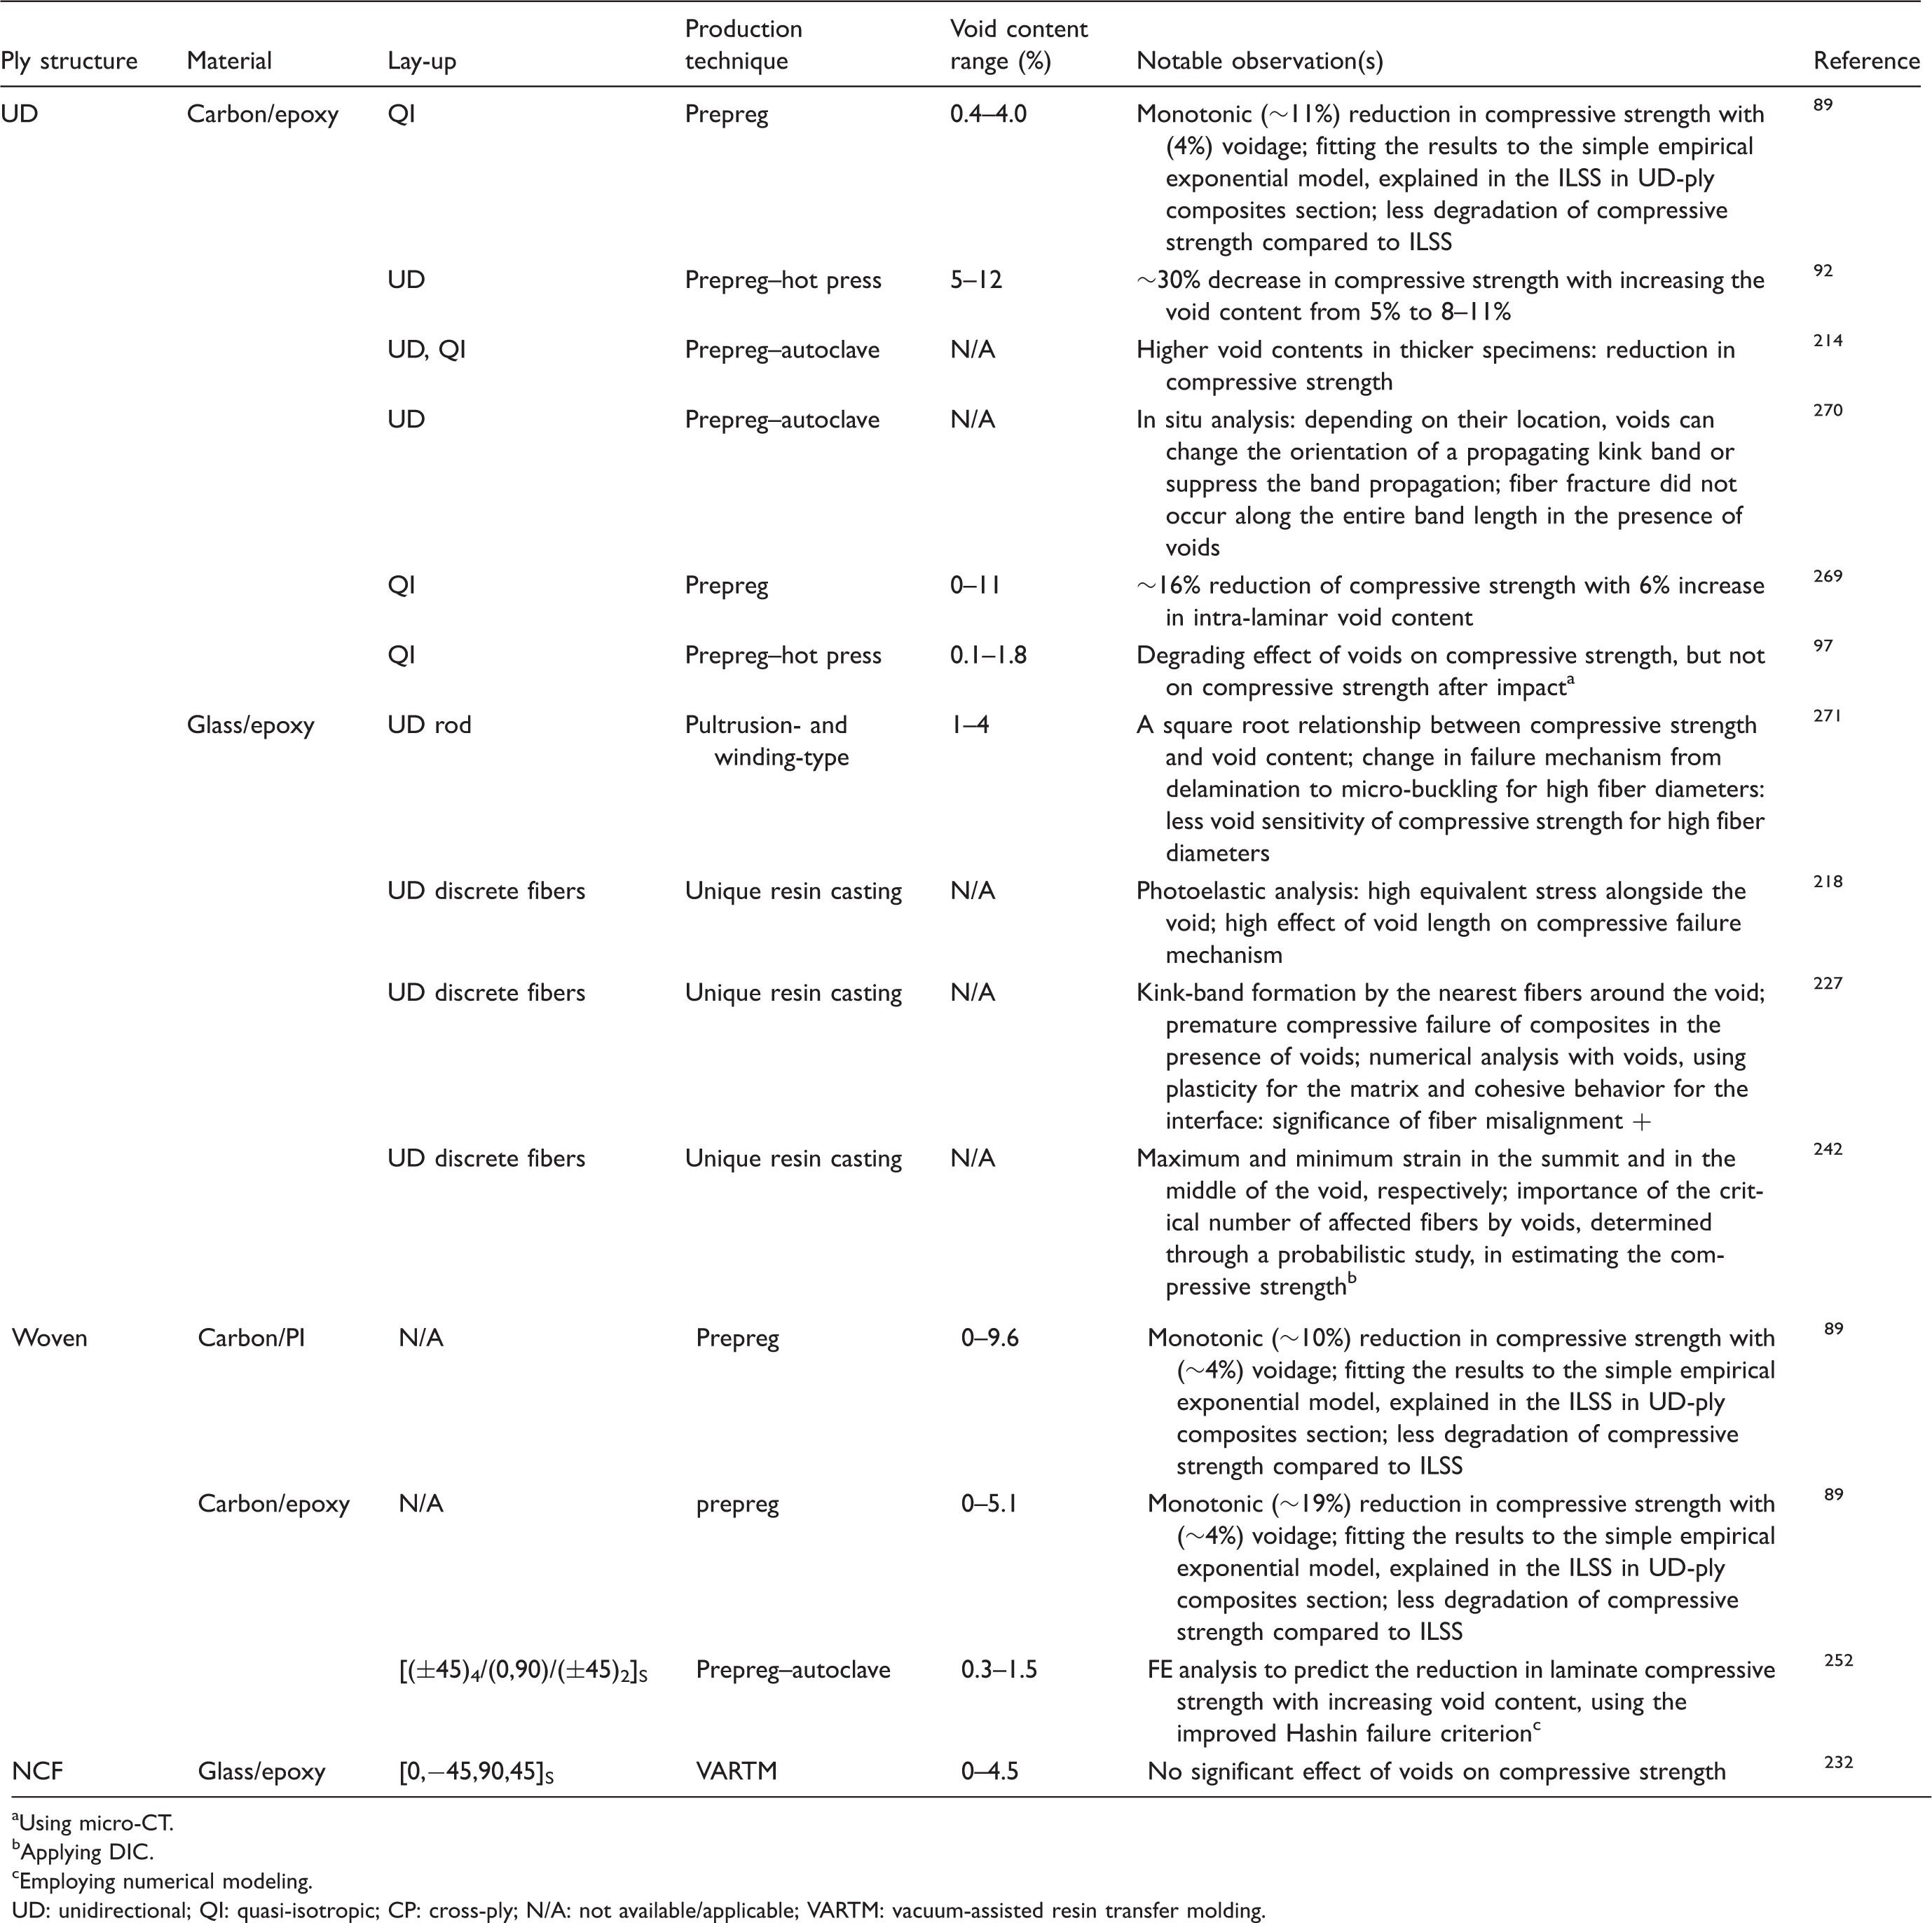
Using micro-CT.
Applying DIC.
Employing numerical modeling.
UD: unidirectional; QI: quasi-isotropic; CP: cross-ply; N/A: not available/applicable; VARTM: vacuum-assisted resin transfer molding.
Flexural properties
Flexural elastic properties
Ghiorse 140 observed a steady (in total 25%) decline in flexural modulus of a cross-ply carbon/epoxy composite with a void content increase from 0% to 5%. For a UD carbon/epoxy laminate, Olivier et al. 103 concluded that the reduction in flexural modulus is highly dependent on the shape and size of the voids, in addition to their volume fraction. According to Liu et al., 101 in a cross-ply laminate, the flexural modulus decreases significantly with voids (∼10% decrease with 1% increase in voidage), which is not the case for the tensile modulus. The degradation of flexural modulus with voidage was also reported by Stamopoulos et al. 198 for UD laminates, by Vergani et al. 272 for multidirectional NCF laminates produced through RTM, and by Hou et al. 273 for thermoplastic matrix composites with woven plies, produced by compression molding. The latter attributed the modulus degradation to the decrease in the load transfer efficiency caused by voids. For cross-ply and random-chopped-strand composites of carbon/PP, produced with molding, Hayashi and Takahashi 274 observed, respectively, ∼3% and ∼11% decrease in flexural modulus with 1% increase in void content.
Effect of voids on the flexural modulus of different composites as reported in the literature.
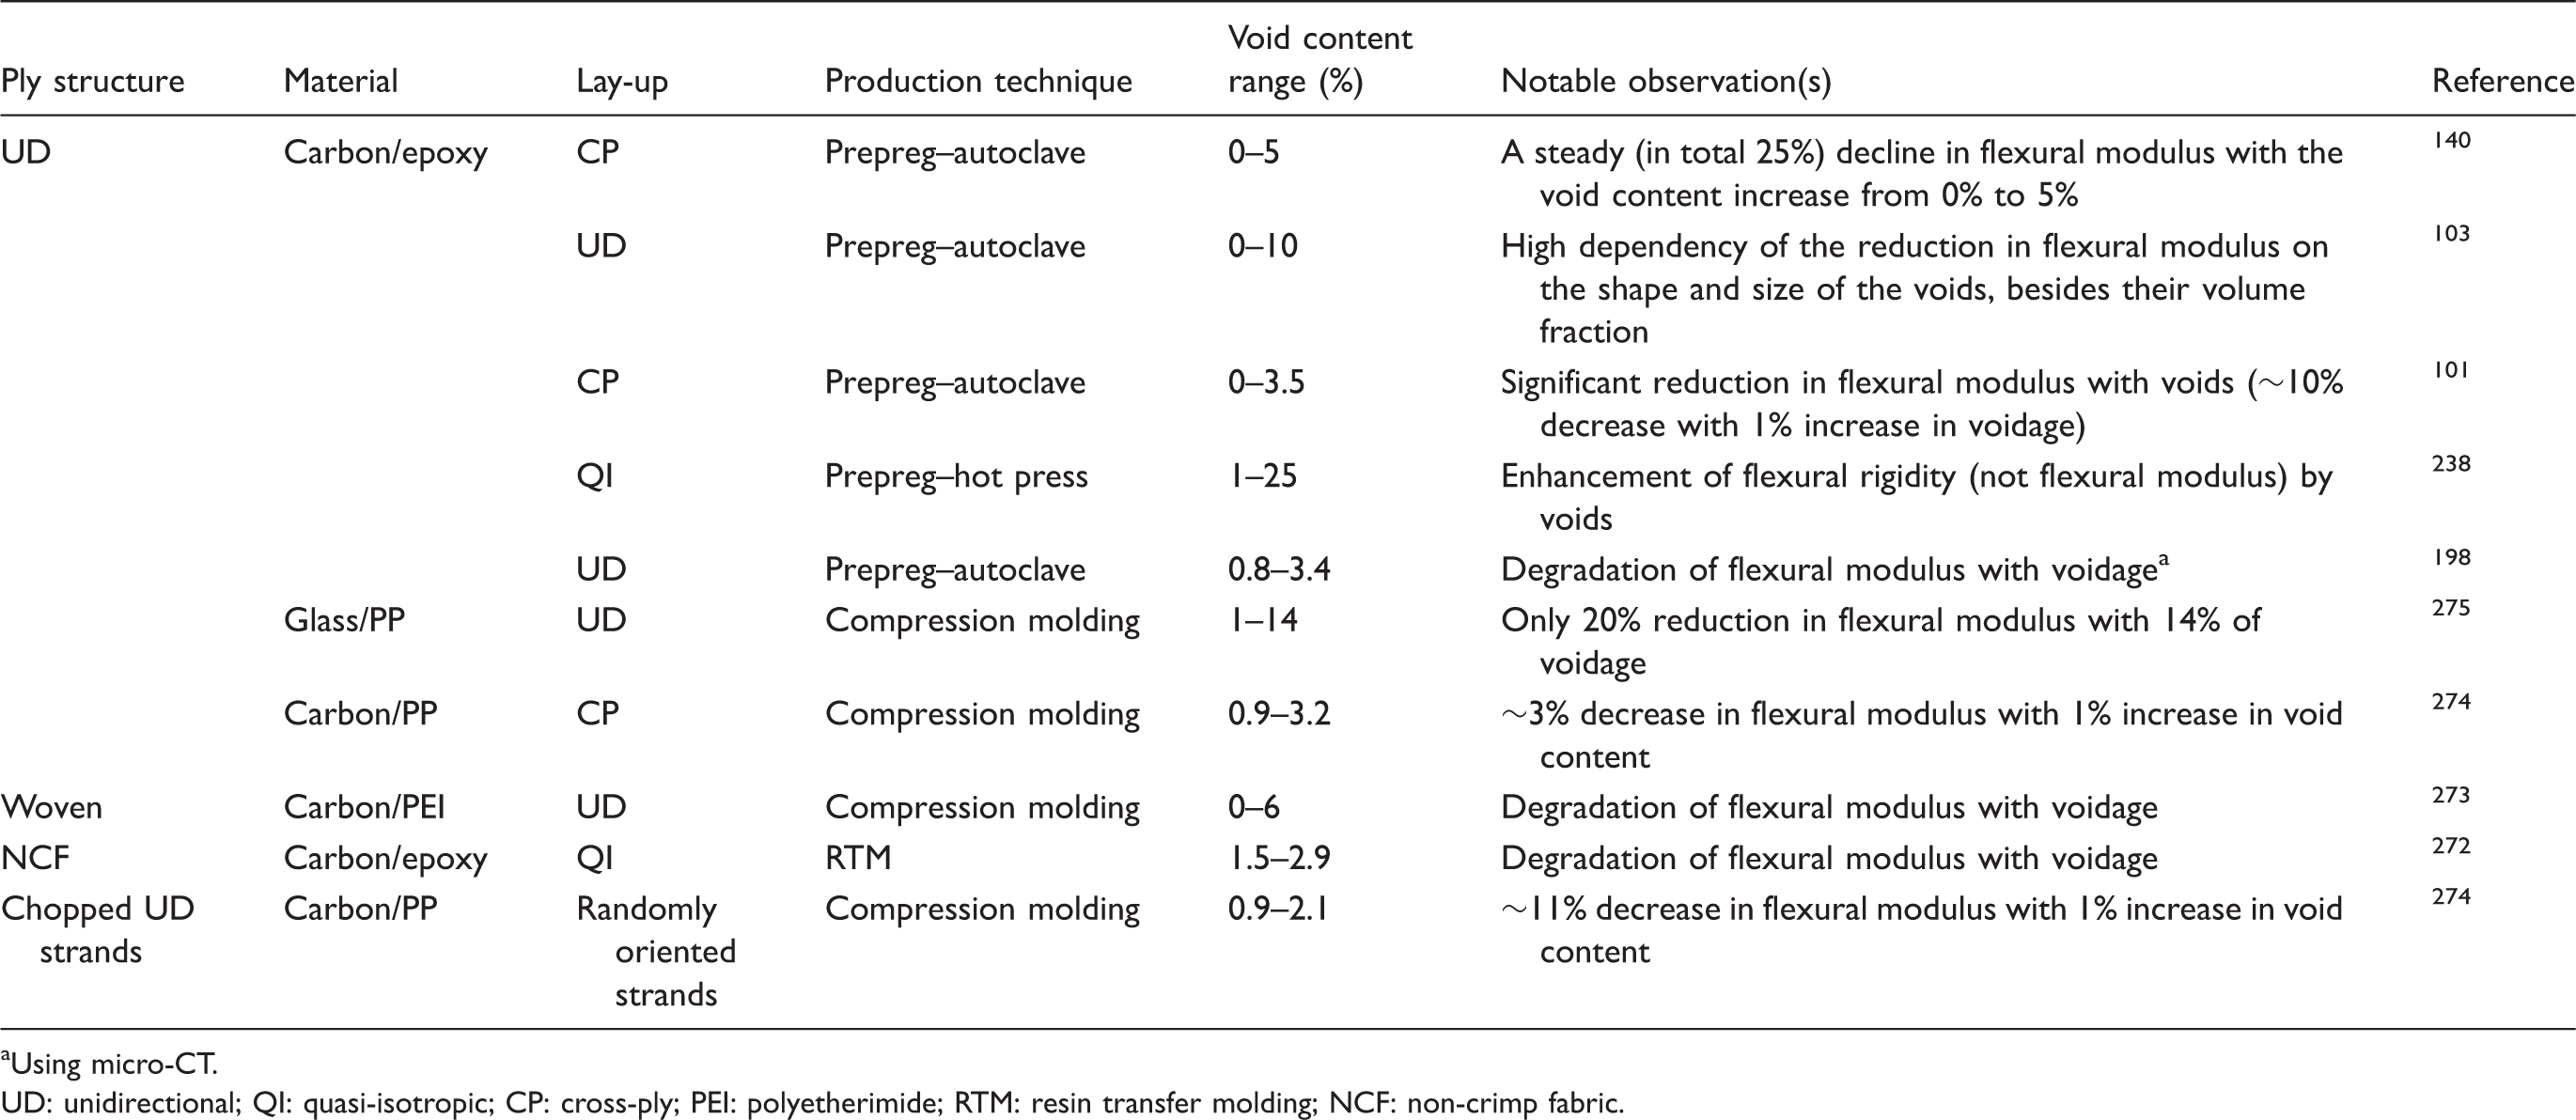
Using micro-CT.
UD: unidirectional; QI: quasi-isotropic; CP: cross-ply; PEI: polyetherimide; RTM: resin transfer molding; NCF: non-crimp fabric.
Flexural failure
Ghiorse 140 noted that the degradation of flexural strength in the presence of voids is as severe as that of ILSS. There is a steady decline of 10% in flexural strength with each 1% increase in void content, from 0% to 5%. Bowles and Frimpong 221 found a non-linear relationship between the flexural strength and ILSS in a UD carbon/PI composite. They suggest that the change in the flexural failure mechanism is the reason for the non-linearity. As the void content increases, ILSS decreases, and the flexural failure mechanism changes from tensile failure in the tension side of the specimen to compressive failure in the compression side. On an example of a UD glass/PP laminate with low fiber volume fraction, Hagstrand et al. 275 argued that voids can also have a positive effect on structural properties like flexural failure load due to the increase in beam thickness. This may occur only for extremely high voidage and/or very low fiber volume fractions (explained in the Flexural elastic properties section).
The flexural failure evolution of a UD carbon/epoxy composite was characterized in the literature 153 as: (1) matrix cracking (not originating from voids), compression damage underneath the roller; (2) linking of blunt intra-laminar and inter-laminar cracks by their propagation, which involves coalescence of large voids; (3) forming a through-thickness crack, final fracture on the tension side. With increasing void content, the mean flexural strength was found to decrease, while the standard deviation increased, indicating a dependency on the probability of voids of a critical size and shape being located in highly stressed regions. For a cross-ply carbon-epoxy laminate, Liu et al. 101 noted that the effect of voids on flexural strength is even more severe than that on ILSS. A reduction of ∼20% was observed with 2.5% voidage in a cross-ply carbon/epoxy laminate. For a UD laminate, Stamopoulos et al. 198 reported ∼17% reduction of flexural strength for 3% increase in voidage. The flexural strength of Quickstep (OoA) cured panels was lower than that of autoclaved panels due to higher void contents, according to Davies et al. 116 The influence of voids on flexural strength of molded carbon/PP composites was investigated by Hayashi and Takahashi. 274 They found that with 1% increase in void content, the reduction of flexural strength is drastic (∼35%) for cross-ply laminates, while it is less significant (∼15%) for random-chopped-strand composites, attributed to the higher ratio of carbon fibers oriented in the longitudinal direction in the cross-ply composite.
The effect of voids on the residual flexural strength of UD carbon/epoxy composites after a high-temperature impact was investigated by Kakakasery et al. 107 They concluded that the residual strength is slightly higher for a high-voidage laminate (e.g. the non-debulked one). This is because voidage may enhance the resistance to delamination, which is the predominant failure mode in post-impact flexural loading. Studying the residual flexural strength after low energy impact, Arthurs et al. 199 observed that delaminations, caused by intra-laminar cracking, could be suppressed by a group of large voids, which blunt the crack propagation path. In specimens with a high voidage, a multi-stage process was identified, in which delaminations deflected into intra-laminar and inter-laminar regions and were blunted by voids. These phenomena are further discussed in the Inter-laminar fracture toughness section.
Effect of voids on the flexural failure of different composites as reported in the literature.
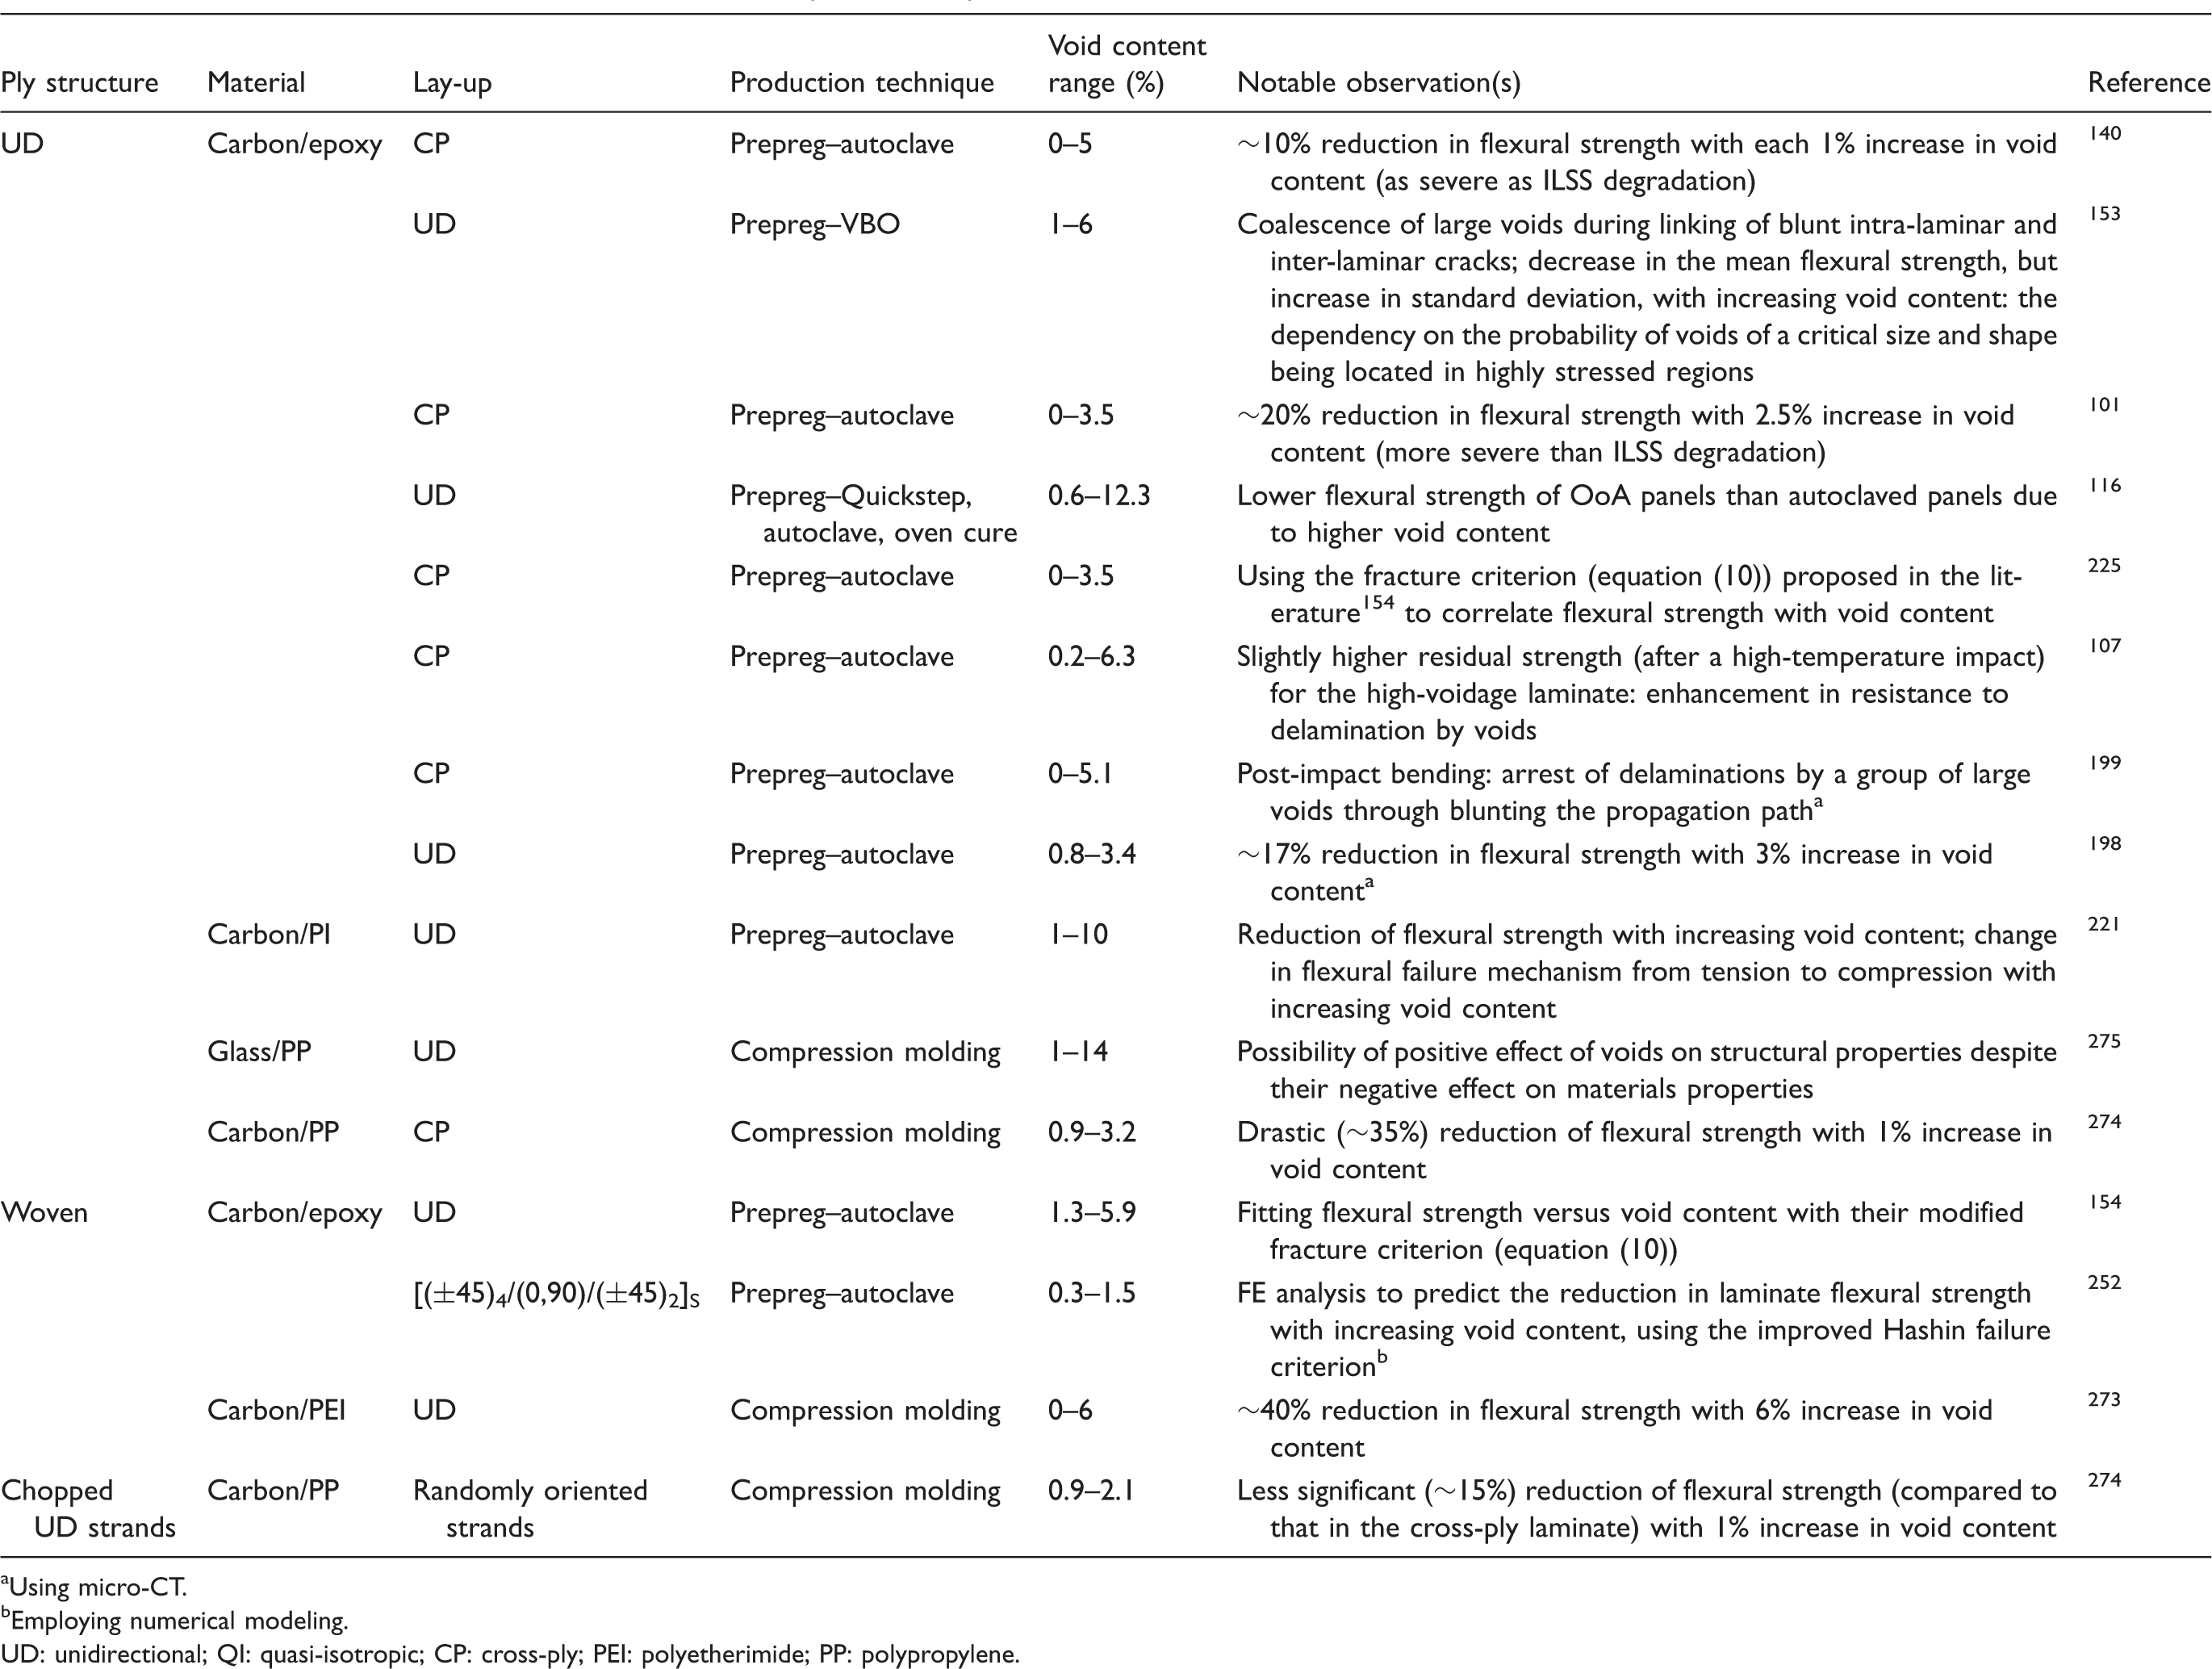
Using micro-CT.
Employing numerical modeling.
UD: unidirectional; QI: quasi-isotropic; CP: cross-ply; PEI: polyetherimide; PP: polypropylene.
Concluding remarks on the effect of voids on flexural properties
Tables 10 and 11 review the literature on the void effect on flexural properties. The voids' influence on the flexural load-carrying ability of the composites is a combination of their influence on ILSS, and tensile and compressive strength. Complex combination of these mechanisms makes it difficult to generalize the void influence. However, the sources agree on decrease of the flexural stiffness by a few percent and of the flexural strength by up to 10% per 1% of the void content increase.
Transverse cracking
Varna et al. 230 conducted one of the first studies on the effect of voids on the failure mechanism in transverse plies. They noted that in transverse loading of a quasi-UD NCF laminate with voids, produced with RTM, two types of cracks form. One type is large transverse cracks that propagate through the ply thickness. The other type is small cracks, which connect voids, forming the large transverse crack. Therefore, large transverse cracks in laminates with voids have more irregular faces than in void-free laminates. Composites with higher void contents have a higher maximum density of both small and large cracks. Moreover, the first transverse crack, corresponding to the composite in situ transverse strength, occurs at lower stress and strain levels in laminates with higher voidage. However, these laminates have higher strains-to-failure due to higher dissipated energy for initiation and propagation of a certain number of transverse cracks.
Through a broad statistical analysis, Huang et al.
6
explored transverse cracking in cross-ply laminates influenced by manufacturing defects, mainly voids. Four different carbon/epoxy plates were produced with four different curing conditions (described in Figure 22 caption). At the initial loading stage, transverse cracks were randomly distributed along the specimen, being initiated by random voids. The distribution became more uniform as the loading proceeded further. According to Talreja,
276
the decrease in the effect of voids on further cracking is because the non-uniform stress field, developed by interaction between two adjacent cracks, becomes increasingly interactive and takes the control of crack initiation. Huang et al.
6
found that crack density at a given applied strain or stress was higher for plates with voids. Using the local stress fields calculated by Hashin variational analysis, multiple cracking in the transverse plies was simulated, assuming a two-parameter Weibull distribution of the transverse tensile strength of the ply to represent the randomly distributed manufacturing defects. Hence, the static transverse strength of each element of a ply followed the Weibull distribution
(a) Crack density as a function of the applied stress, predicted through a statistical model and measured experimentally for four cross-ply carbon/epoxy composites with four different manufacturing processes: with vacuum-with pressure (V-P), with vacuum-no pressure (V-NP), no vacuum-with pressure (NV-P), and no vacuum-no pressure (NV-NP); (b) statistical distribution of static transverse strength of the four composites.
6
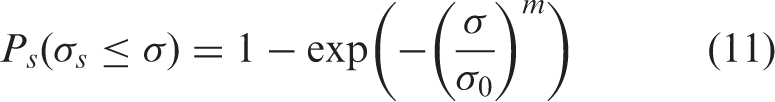
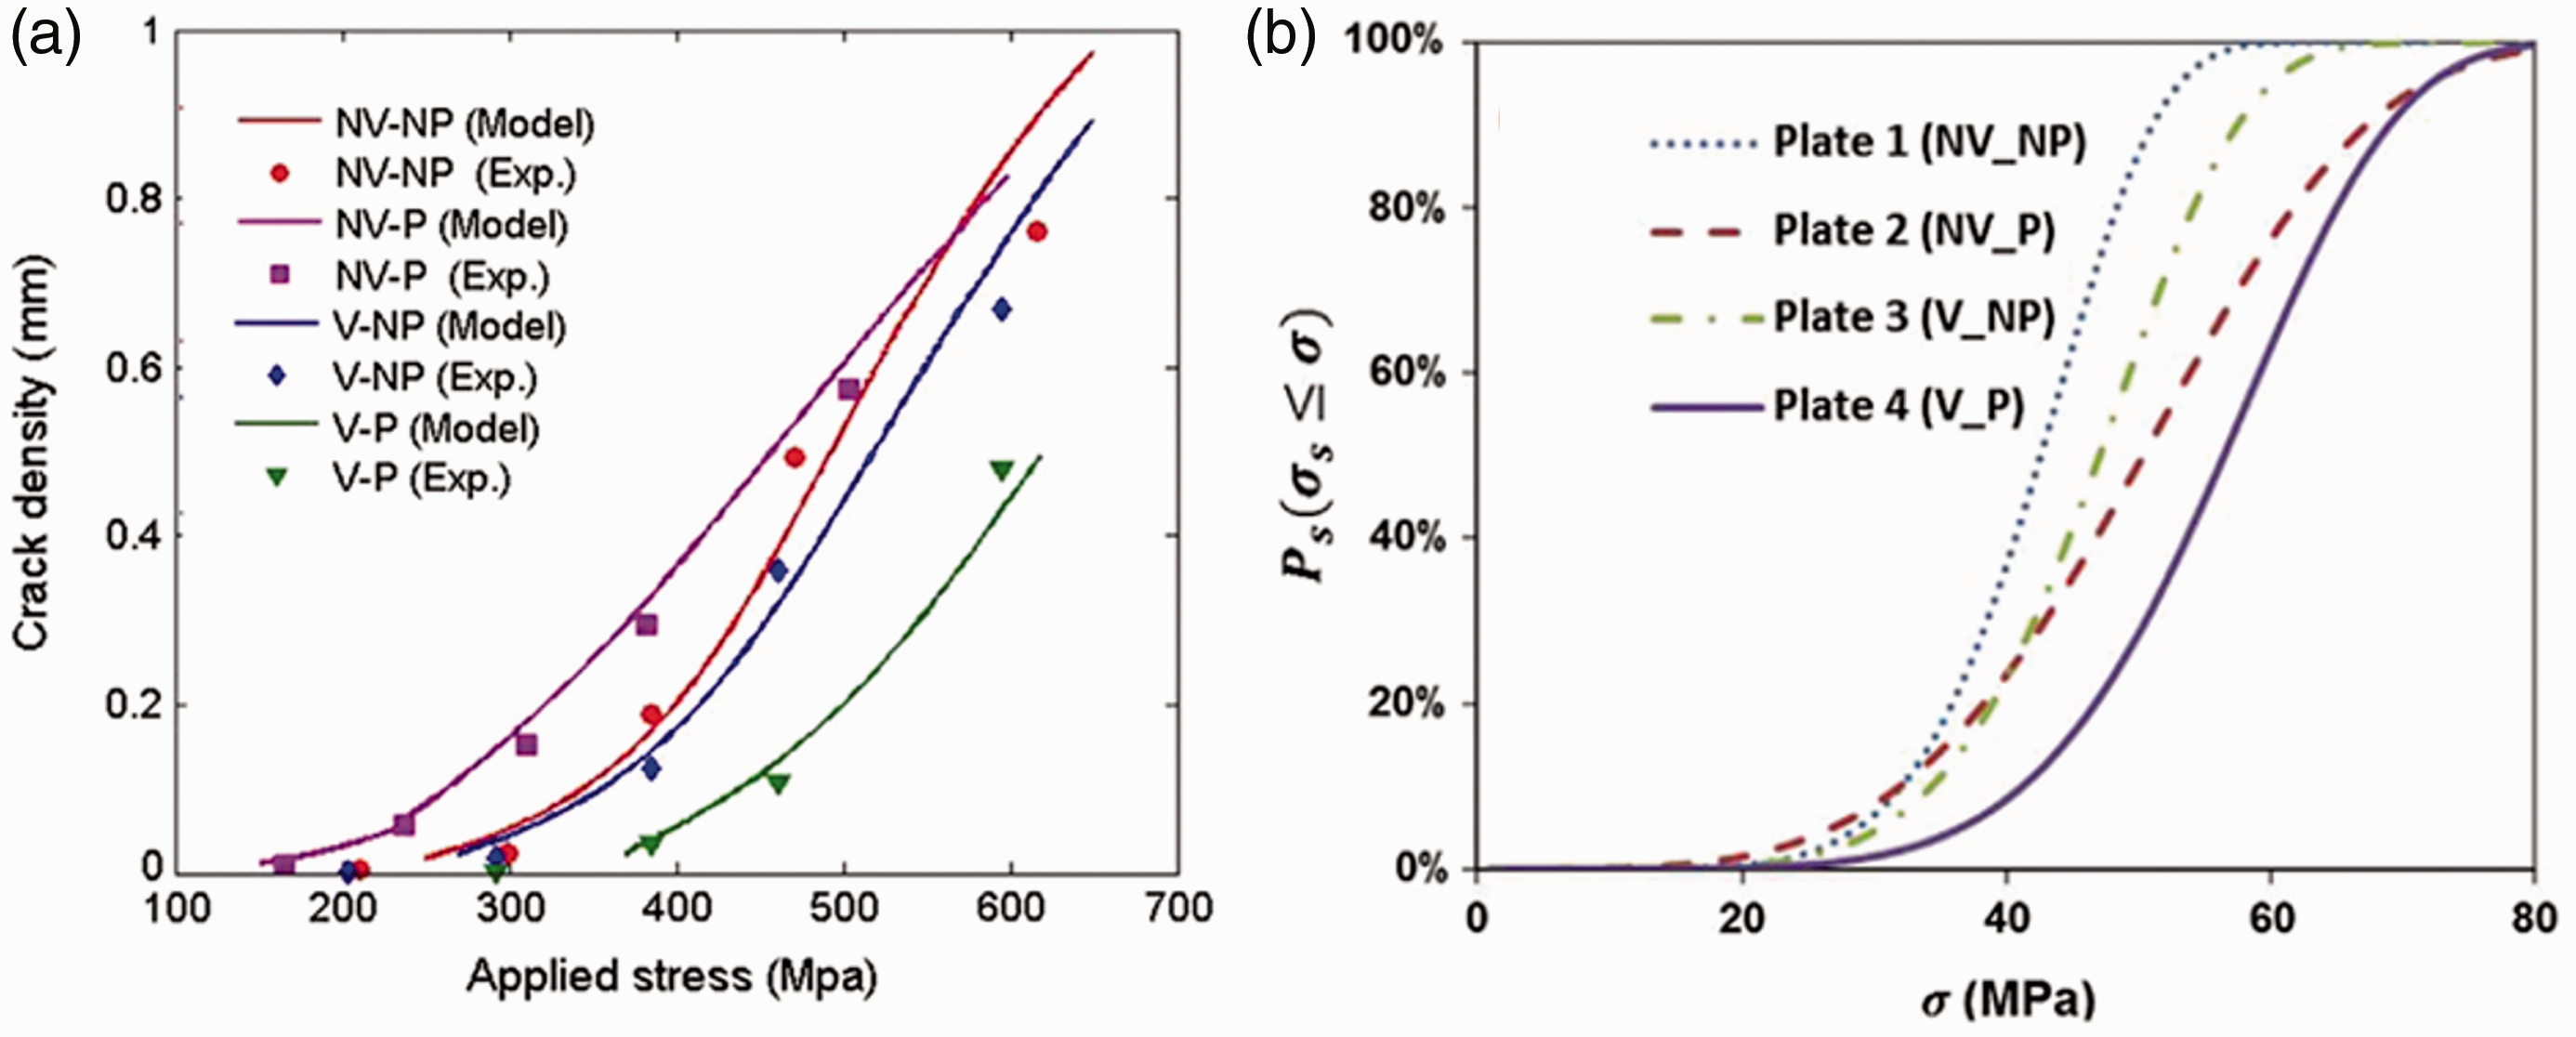
The influence of voids on initiation of transverse cracks in cross-ply carbon/epoxy laminates was studied by Aratama et al. 201 at the micro-scale. They performed an in situ analysis of a small region in the transverse outer ply during three-point bending inside SEM. The strain to the first transverse crack decreased with increase in void content. The transverse cracks tended to run through the voids, suggesting that voids, similarly to non-uniform fiber distributions and resin-rich regions, change the microscopic strain distribution and can cause crack initiation. Applying DIC with “feature-based” matching, they observed that voids induce strain concentrations, which leads to local plastic deformation of the matrix at lower global strains, and earlier initial failure (lower strain to first transverse crack). The post-mortem micro-CT analysis also confirmed that transverse cracks run through the voids.
In woven composites, the initiation of transverse cracks from voids was reported by Costa et al. 155 For carbon/epoxy NCF laminates, Sisodia et al. 240 confirmed that voids influence the initiation of transverse cracks, but not the saturated crack density (similar to findings of Talreja 276 and Huang et al. 6 ). Therefore, crack density is void-sensitive only at low strains, at least for studied composite systems. They explained that considering the size and location distribution of voids, transverse cracking in areas of high density of large voids starts earlier, usually connecting voids. However, at high strains, cracking mainly takes place in void-free areas, causing the saturated crack density to be less dependent on voids. They observed that in QI laminates, 90° plies are more brittle and have a more void-sensitive transverse cracking compared to the 45° plies. Furthermore, QI laminates with higher void content had higher stiffness degradation during loading, which was not captured well by the authors’ analytical model based on classical laminate theory. 240
Carraro et al. 231 found that in a cross-ply NCF laminate produced with RTM, transverse cracks initiate always at the void locations. The voids in a non-degassed specimen reduced the strain to first crack by 20% relative to a degassed specimen. Furthermore, for a given strain level, the crack density was much higher for the non-degassed specimen. They also performed a statistical analysis similar to the one in Huang et al., 6 but for the distribution of the strain to crack initiation instead of that for strength. No clear correlation between Weibull global parameters and void content could be found. No correlation could be established between the applied strain to crack initiation and the void area and/or section reduction, either. Nevertheless, the global strain to crack initiation had a good correlation with the strain concentration factor (the peak strain at the void surface divided by the global strain), which was calculated using an FE model, placing voids with their real geometry in homogenous and orthotropic plies. They argued that because the local shape was found to play a significant role, global parameters such as void content are not adequate in the analysis of effect of voids on crack initiation phenomena.
In a recent study, Mehdikhani et al.
277
applied DIC to investigate the effect of voids in composites at three length scales: micro-scale (ply level, hundreds of micrometers), meso-scale (laminate level, millimeters), and macro-scale (specimen level, tens of millimeters). The strain mapping at the macro- and meso-scale allowed semi-automatic detection of matrix cracks and quantification of their density evolution as a function of the applied strain. The micro-scale examination provided additional insights into the failure mechanisms (Figure 23). The laminates for this study contained ˜1% of voids and were produced intentionally by lowering the autoclave pressure and the cure temperature. As a result, the crack density decreased dramatically compared to the material without defects. Moreover, DIC on the macro-scale surface-view images revealed irregular crack propagation through the specimen’s width in the laminate with defects, compared to the one without defects.
(a–c) SEM micrographs of the study zone in the three-point bending test on imperfect specimen in the first step, one middle step, and the final step, respectively – each step corresponds to 0.05 mm applied displacement and in total the loading is applied in 35 steps; (d–f) the corresponding strain profiles in Ply3 from DIC with the detected peaks as the transvers cracks; (g) DIC strain map of the last step, showing the transverse cracks with their order of appearance – the white line in (g) is the line along which the strain profiles are extracted.
276
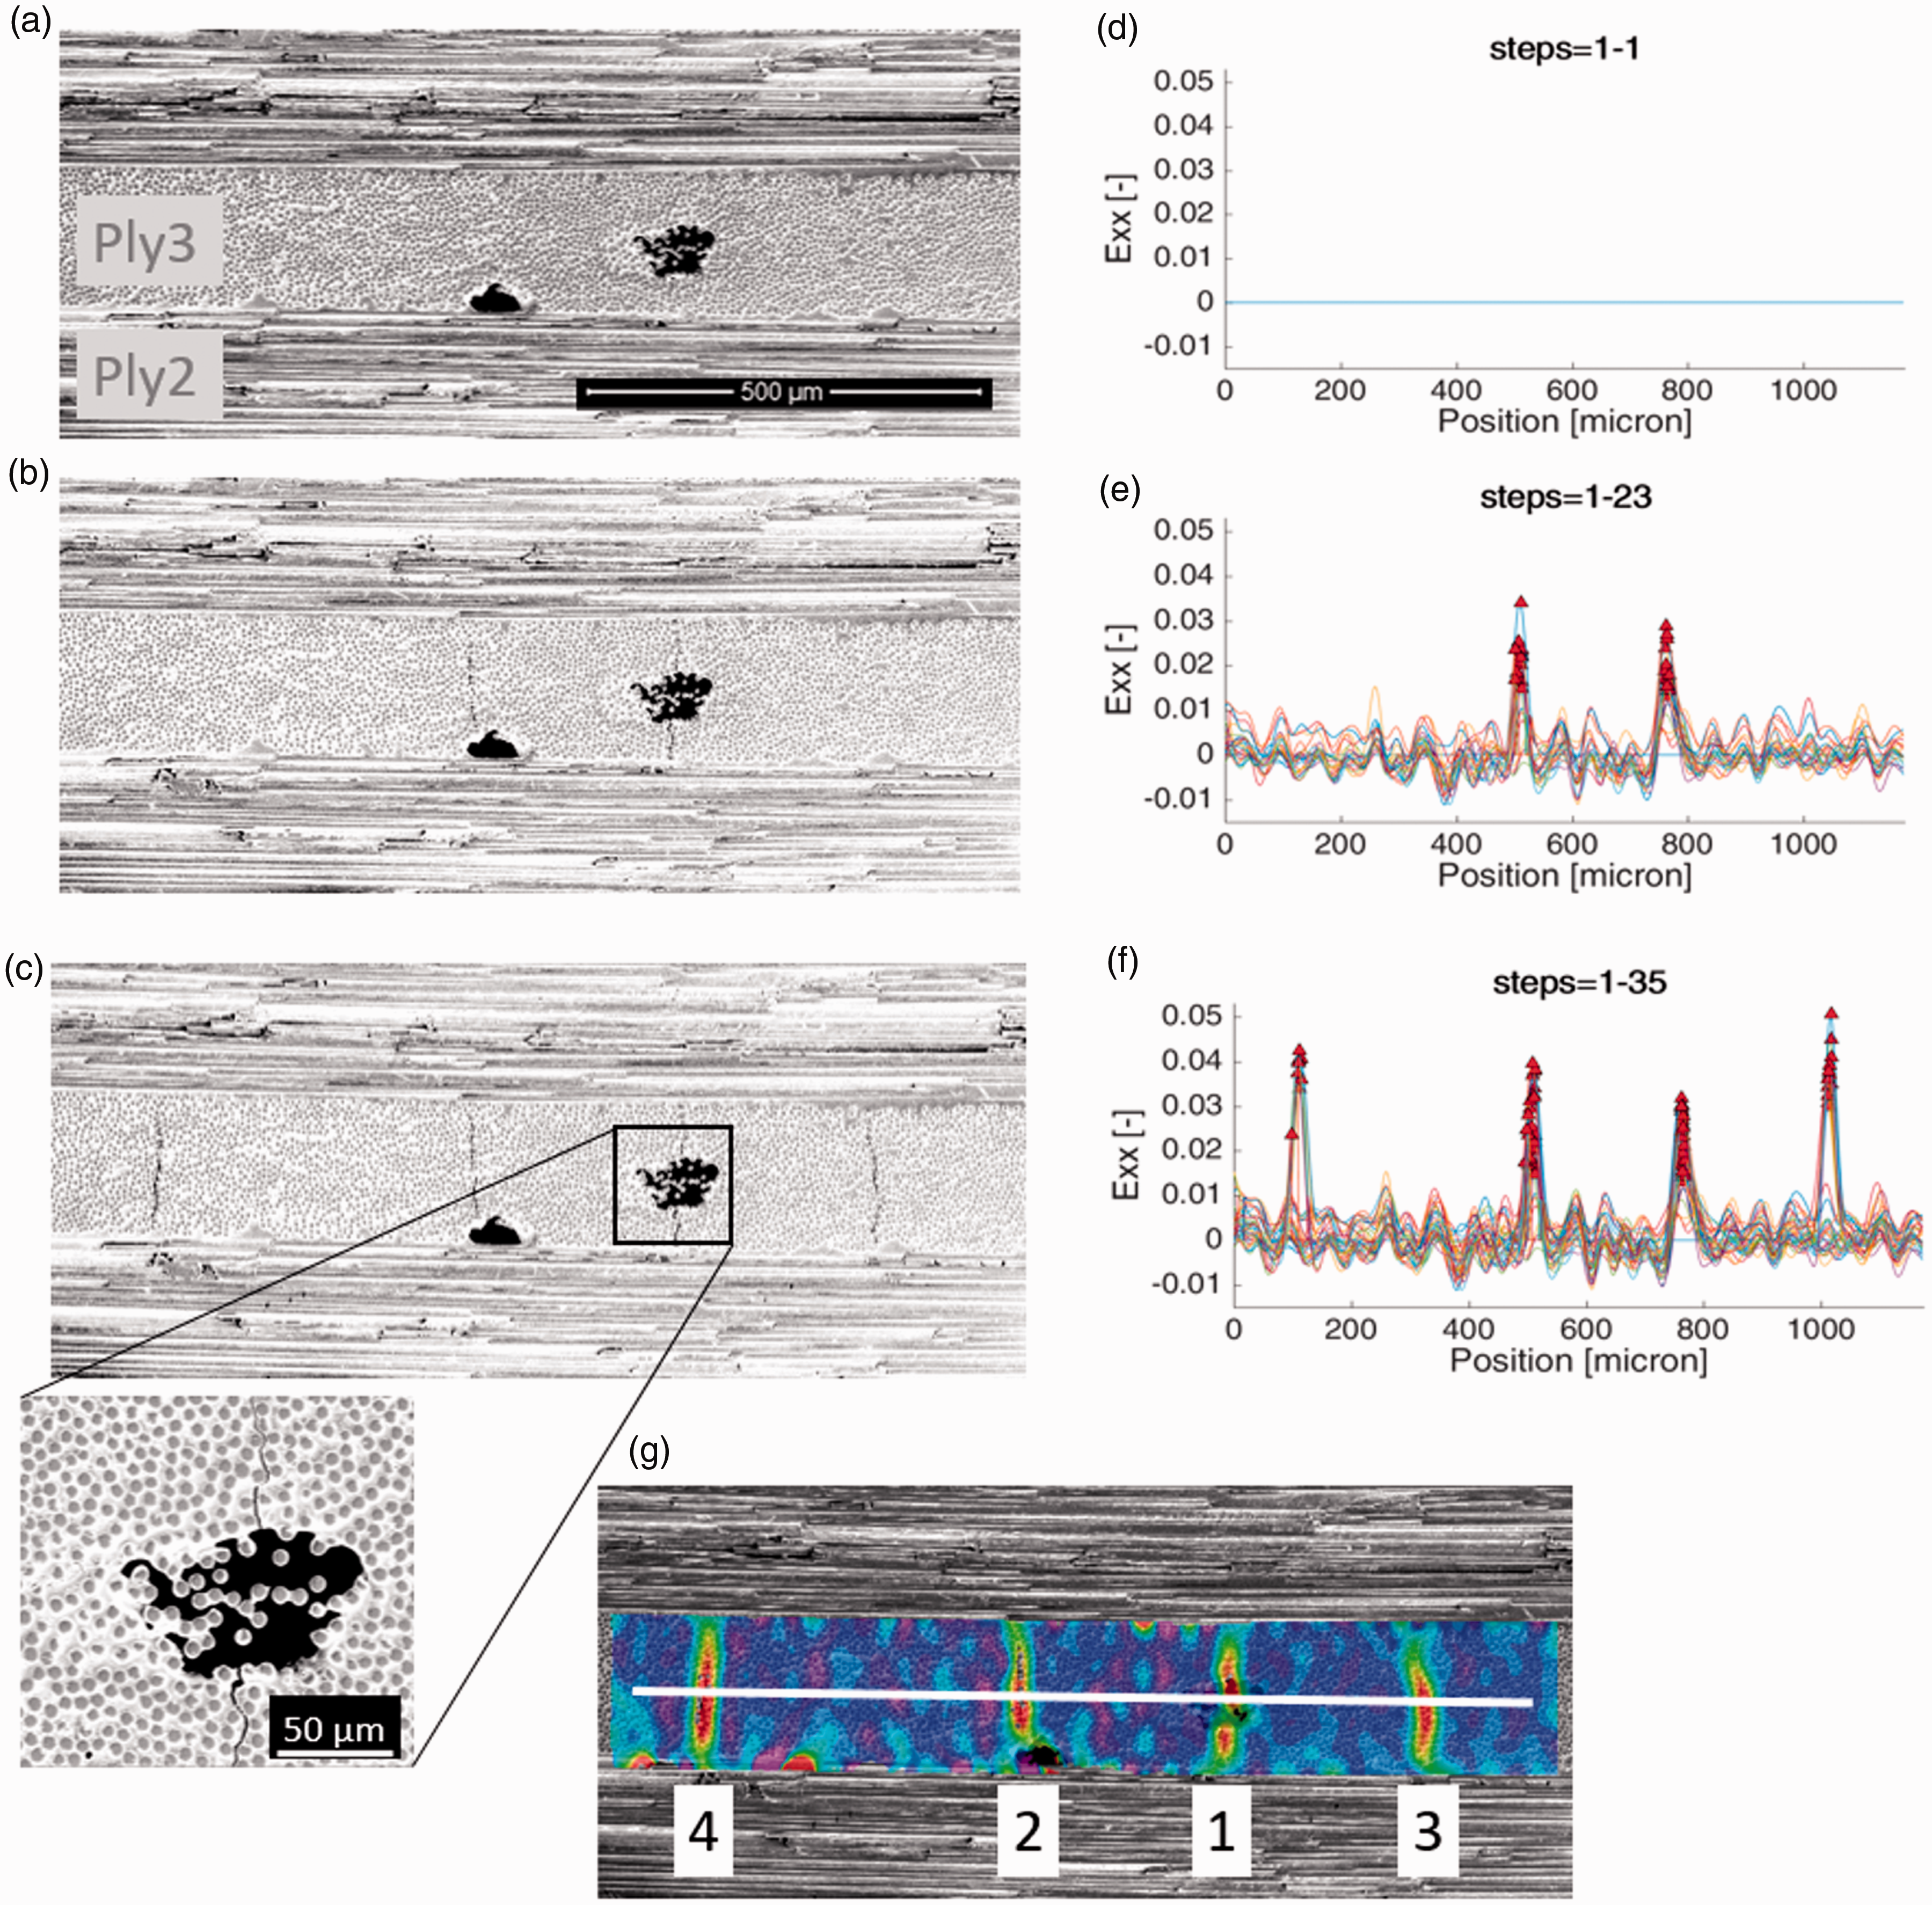
Mehdikhani et al. 278 also studied the effect of voids on transverse cracks by means of a numerical approach combining the micro- and meso-scales. Using computational micromechanics, they calculated the stiffness, strength, and fracture toughness, degraded by voids, and used these parameters as input for a ply-level model, based on extended FE method. The results showed influence of voids on transverse cracking, especially on the cracking onset. The influence was more pronounced in the case with the highest number of voids, where void agglomeration occurs significantly. It was concluded that the developed two-level methodology is a promising technique to evaluate this influence.
Concluding remarks on the effect of voids on transverse cracking
Effect of voids on transverse cracking in different composites as reported in the literature.
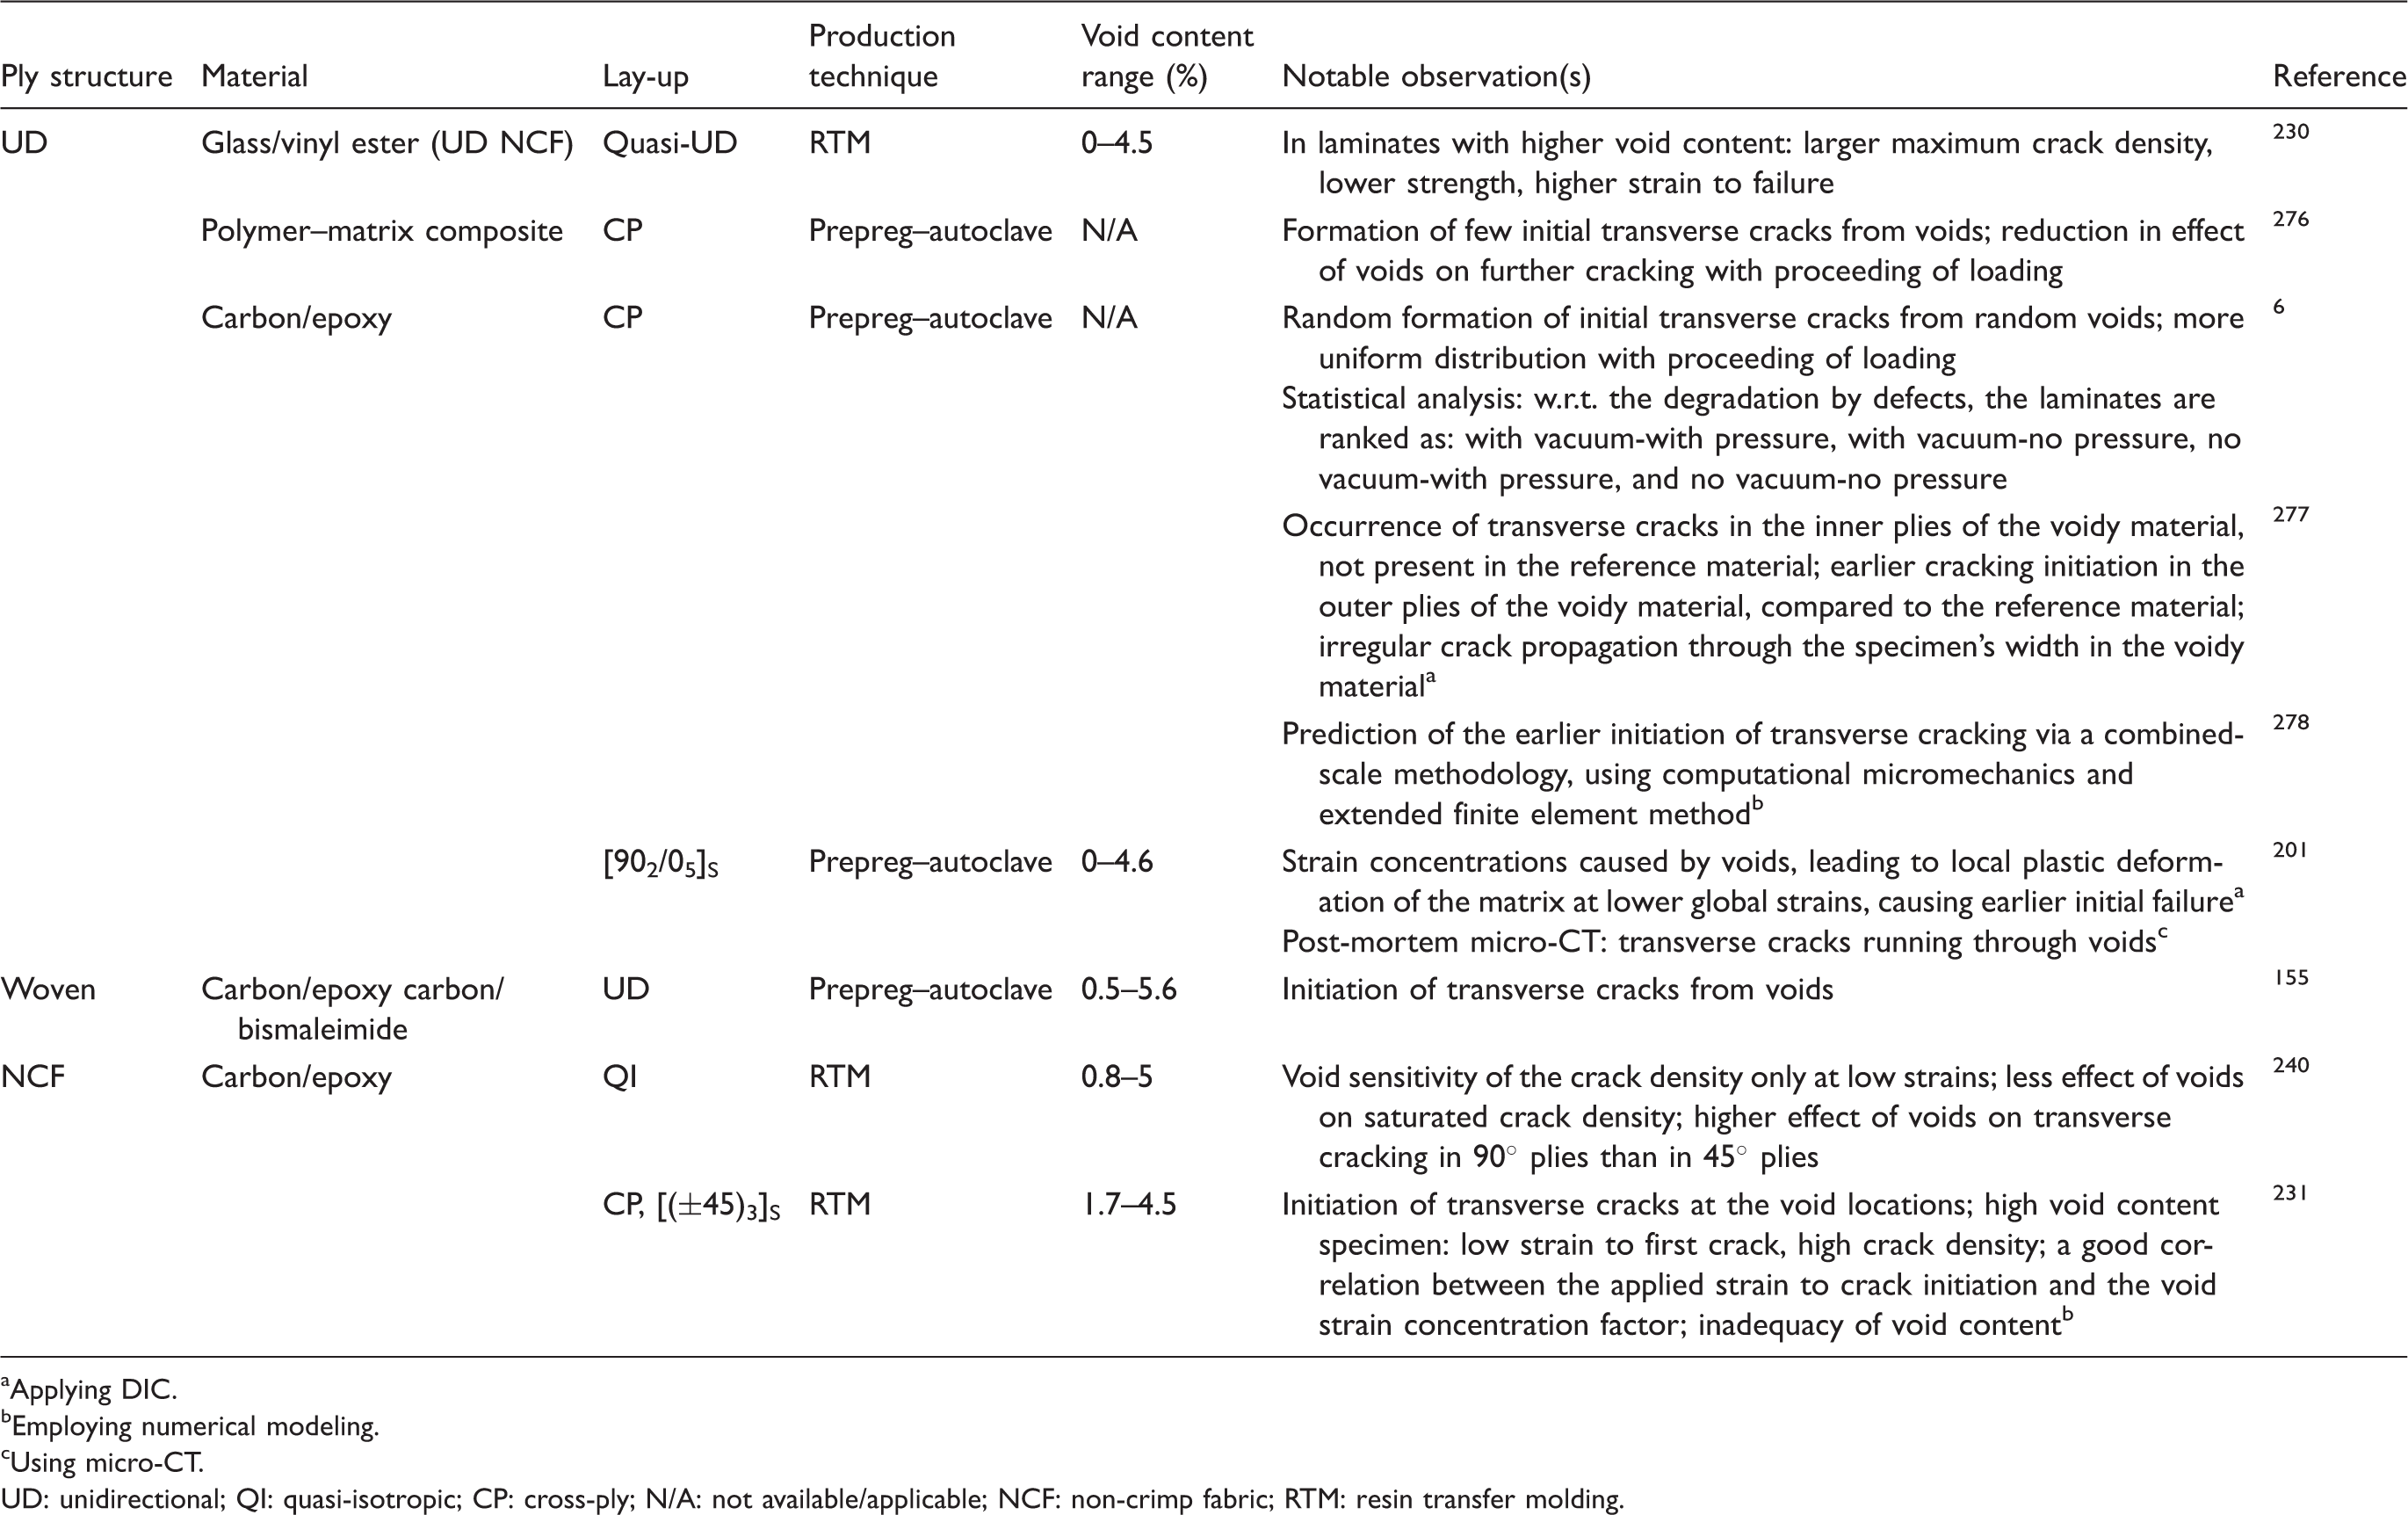
Applying DIC.
Employing numerical modeling.
Using micro-CT.
UD: unidirectional; QI: quasi-isotropic; CP: cross-ply; N/A: not available/applicable; NCF: non-crimp fabric; RTM: resin transfer molding.
Inter-laminar fracture toughness
Inter-laminar fracture toughness is the energy required to create a new unit of surface area during delamination. In some studies, it is referred to as delamination toughness, or as critical strain energy release rate (SERR) for delaminations. Inter-laminar fracture toughness in Mode I, Mode II, and mixed mode delamination is usually measured through double cantilever beam (DCB), end notch flexural, and mixed mode bending tests, respectively. Mostly, inter-laminar fracture toughness is measured for delaminations between UD-plies, with cracks growing in the 0°-direction, but this is not at all representative for real delaminations, because they (almost) never grow between similarly oriented layers.
In a study on UD carbon/epoxy composites by Asp and Brandt, 279 it was found that the voids had either deleterious or no effects on the fracture toughness at crack initiation, in all three modes. However, Mode I inter-laminar fracture toughness at propagation increased strongly in the presence of voids, which is a result of change in failure mechanism, where ply splits were found to bridge the crack as the crack tip locally leaps between plies during propagation. The laminate void content was 0.9%, and the inter-laminar void content at the position of the starter crack was 1.4%. The increase in Mode I fracture toughness at propagation with this level of voidage was around 75%. While Mode II fracture toughness was slightly decreased by voids, mixed mode fracture toughness increased with the presence of voids. They explained this increase by multiple crack formations at the front of the crack tip, propagating in one interface, which absorb extra energy.
Kousourakis et al. 247 noticed a toughening effect when the sensor cavities, used for structural health monitoring, representing elliptic–cylindrical voids, are aligned normal to the direction of the crack growth in the DCB test. The enhancement of Mode I inter-laminar fracture toughness was because of the crack tip blunting when it entered the hole as well as the increased size of the plastic zone at the crack tip due to the increase in the thickness of the resin-rich inter-ply layer. With this toughening mechanism, the inter-laminar fracture toughness increased with the cavity diameter increase up to a critical diameter, above which the effect was not significant anymore. The increase was ∼60% with the increase of cavity diameter from 0 mm to 0.7 mm. The diameter of the sensor cavities was in millimeter order, which is larger than the size of voids in composites. Olivier et al. 243 reported a decrease of 22% in Mode I inter-laminar fracture toughness with 5% increase in void content.
In a woven carbon/PEI composite (thermoplastic matrix) produced through compression molding, Hou et al. 273 evaluated the voids' effects on Mode I and Mode II inter-laminar fracture toughness. Similar to UD-ply composites, the Mode I fracture toughness at propagation was higher for DCB specimens with higher voidage. This was attributed to a significant fiber/bundle bridging due to the fact that the inter-laminar voids caused “multiple-cracks” in different planes, dissipating more energy. However, Mode I and Mode II fracture toughness at crack initiation as well as Mode II fracture toughness at propagation decreased with increase in void content. In NCF composites produced with RTM, Carraro et al. 231 observed a slightly higher Mode I inter-laminar fracture toughness (both for crack initiation and propagation) for laminates with higher voidage, which was attributed to more diffused damage, in particular diffused fiber bridging, and the consequent increase in crack propagation energy.
In contrast to the previous studies, on a cold-cured laminate of woven glass/polyester plies, Mouritz 157 observed that Mode I inter-laminar fracture toughness at both crack initiation and propagation reduced rapidly with increasing voidage up to ∼15%, and then remained fairly constant at higher voidage levels. He explained that branching at the crack tip in the presence of voids was not extensive enough to cause the delamination to jump between plies. Therefore, not much energy was dissipated by the voids. Instead, they promoted the initiation and growth of the delamination, resulting in a lower fracture toughness. It was also observed that there is a clear non-linear relationship between the inter-laminar fracture toughness and the US attenuation coefficient, even at extremely high void contents (∼30%).
Concluding remarks on the effect of voids on inter-laminar fracture toughness
Effect of voids on the inter-laminar fracture toughness of different composites as reported in the literature.
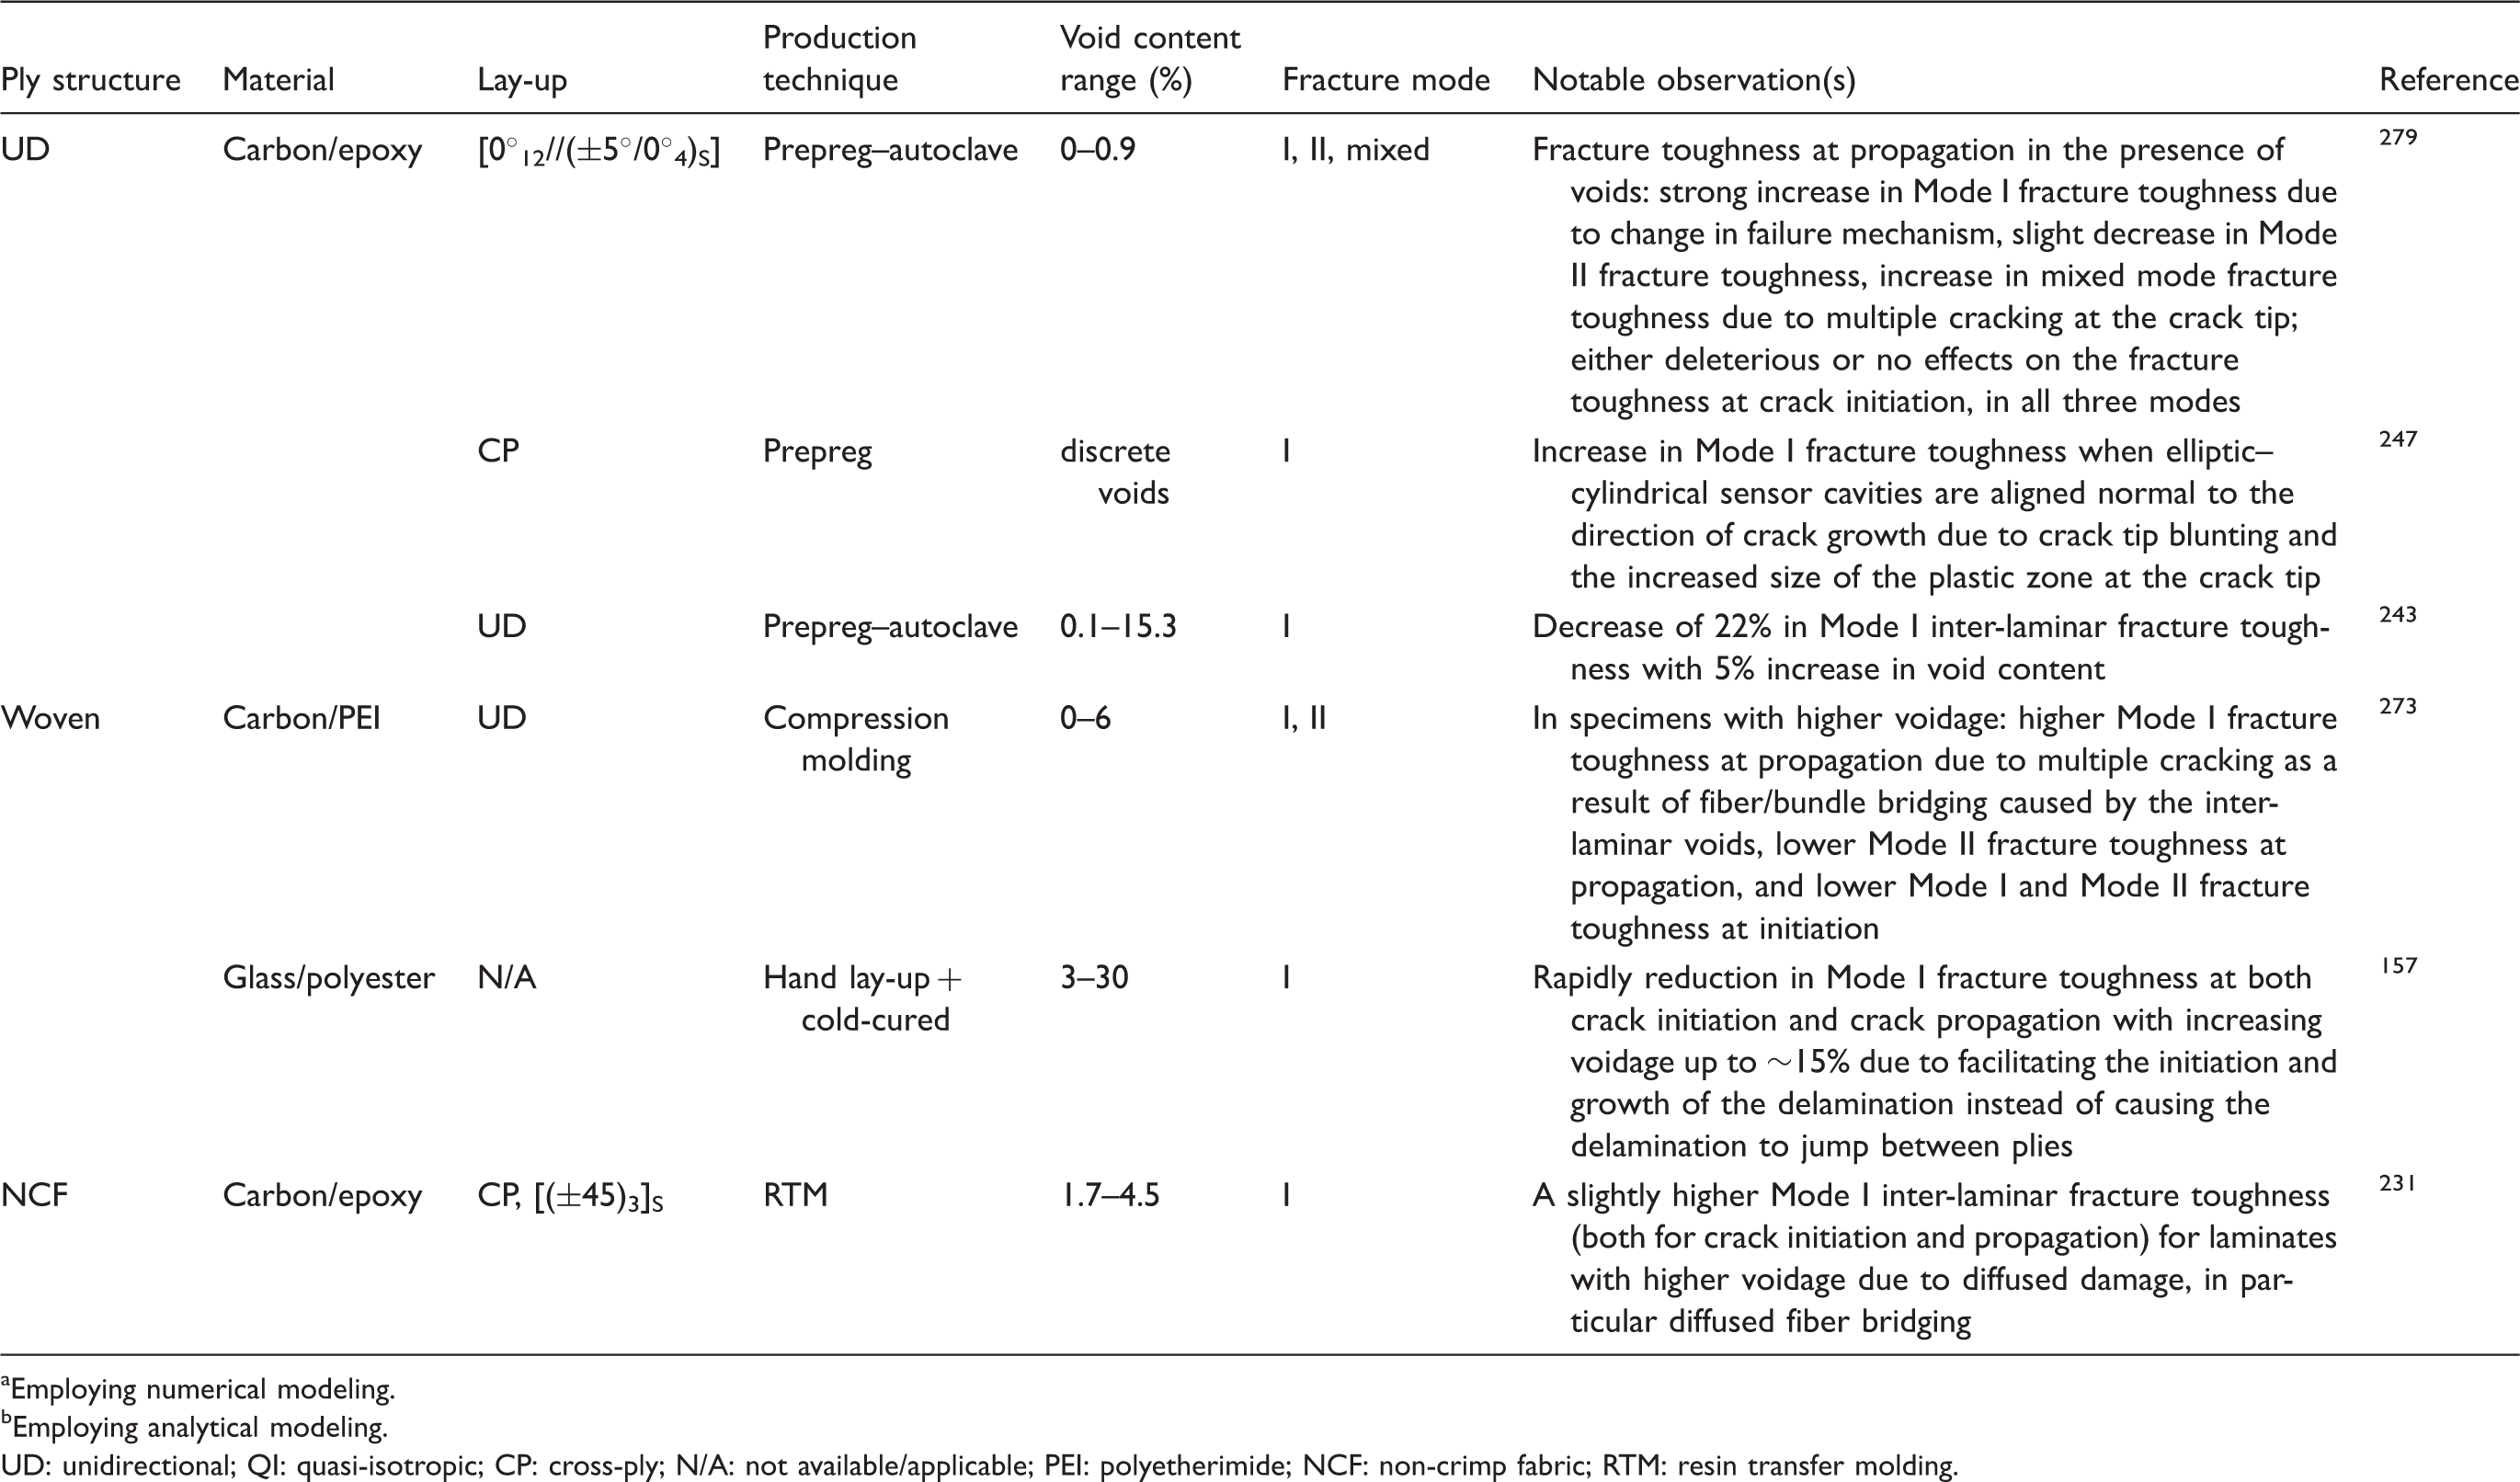
Employing numerical modeling.
Employing analytical modeling.
UD: unidirectional; QI: quasi-isotropic; CP: cross-ply; N/A: not available/applicable; PEI: polyetherimide; NCF: non-crimp fabric; RTM: resin transfer molding.
Effect of voids on inter-laminar fracture toughness (increase or decrease) in different modes as reported in the literature.
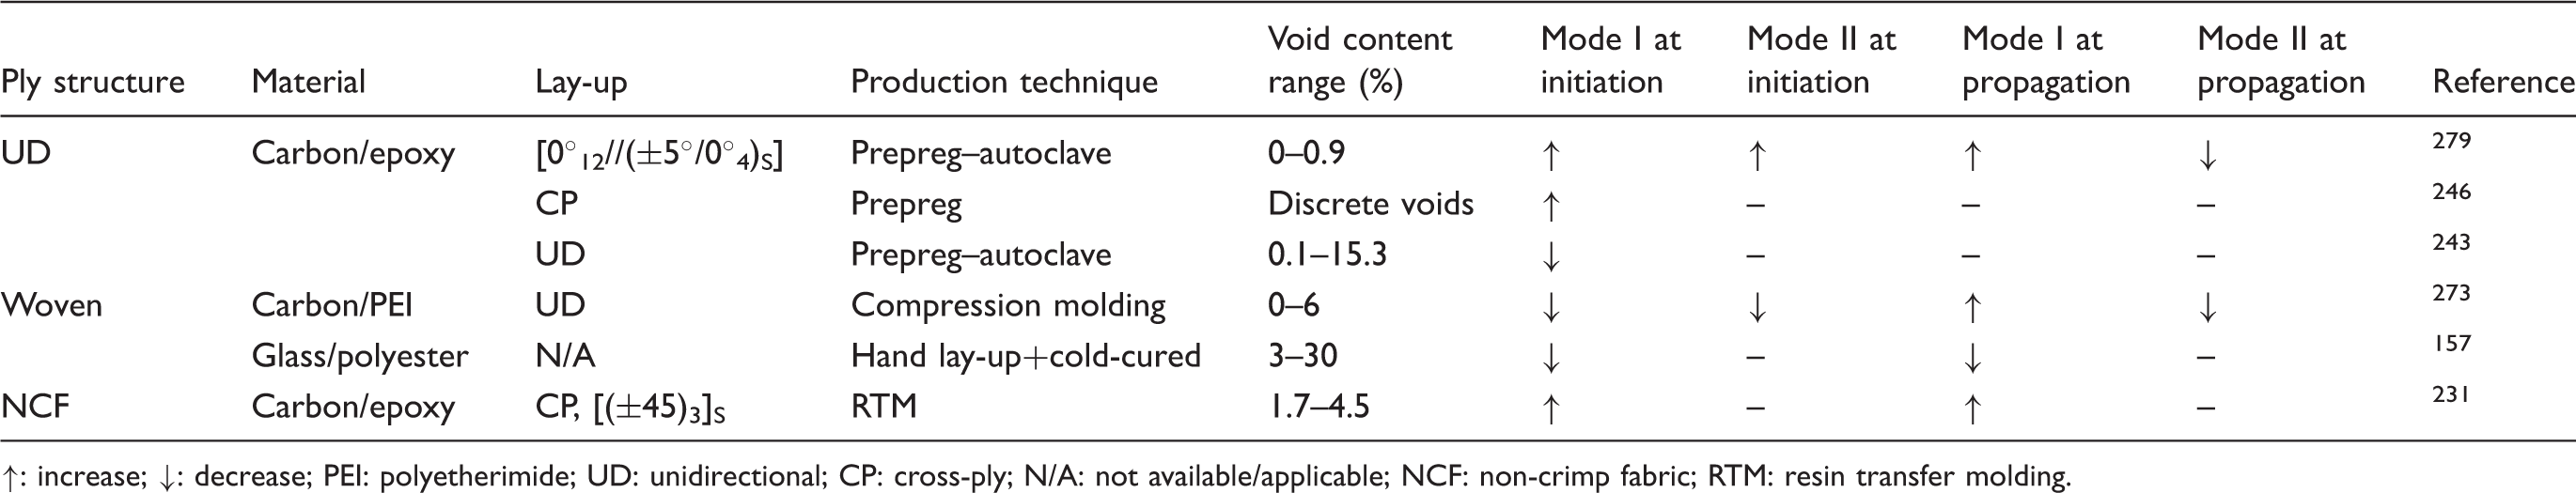
↑: increase; ↓: decrease; PEI: polyetherimide; UD: unidirectional; CP: cross-ply; N/A: not available/applicable; NCF: non-crimp fabric; RTM: resin transfer molding.
Impact performance
The resistance of a composite against impact is evaluated by the amount of energy that is dissipated/absorbed in an impact test. In a Charpy-type impact test (ASTM D256) on woven composites, Hou et al. 273 observed that the energy dissipation for breakage of specimens with higher voidage is slightly higher. On UD-ply composites, Kousourakis et al. 247 performed a low-energy impact test by means of a falling dart (ASTM D5628) on the specimens with health monitoring sensor cavities. They found that the toughening effect for inter-laminar fracture toughness caused by the elliptic–cylindrical cavities, which is mainly crack tip blunting (explained in the Inter-laminar fracture toughness section), takes place also under impact, impeding the growth of impact delaminations normal to the direction of cavities.
Using Fractovis falling weight impact tower, Kakakasery et al. 107 explored the low-energy impact behavior of high-pressure-cured laminates with low void content (Vv = 0.2%), and low-pressure-cured debulked, and low-pressure-cured non-debulked laminates with high voidage (Vv = 4.7% and 6.3%, respectively) in four different temperatures. The absorbed energy in ambient-temperature impact was almost double for the high-voidage specimen as that for the low-voidage one. Increasing the impact temperature, the absorbed energy for the low-voidage specimen increased, while it reduced for high-voidage specimens, so that in 90℃-impact, the absorbed energy for the low-voidage specimen became almost double as that for the high-voidage specimen.
Arthurs et al. 199 investigated a carbon/epoxy laminate, using US C-scan as well as micro-CT, after a low-velocity impact test using a falling weight. They identified a dual effect of voidage. Voids could be the point of crack initiation and contribute to crack propagation, whereas they could also induce a kind of damping effect by arresting the propagation crack.
Effect of voids on the impact resistance of different composites as reported in the literature.
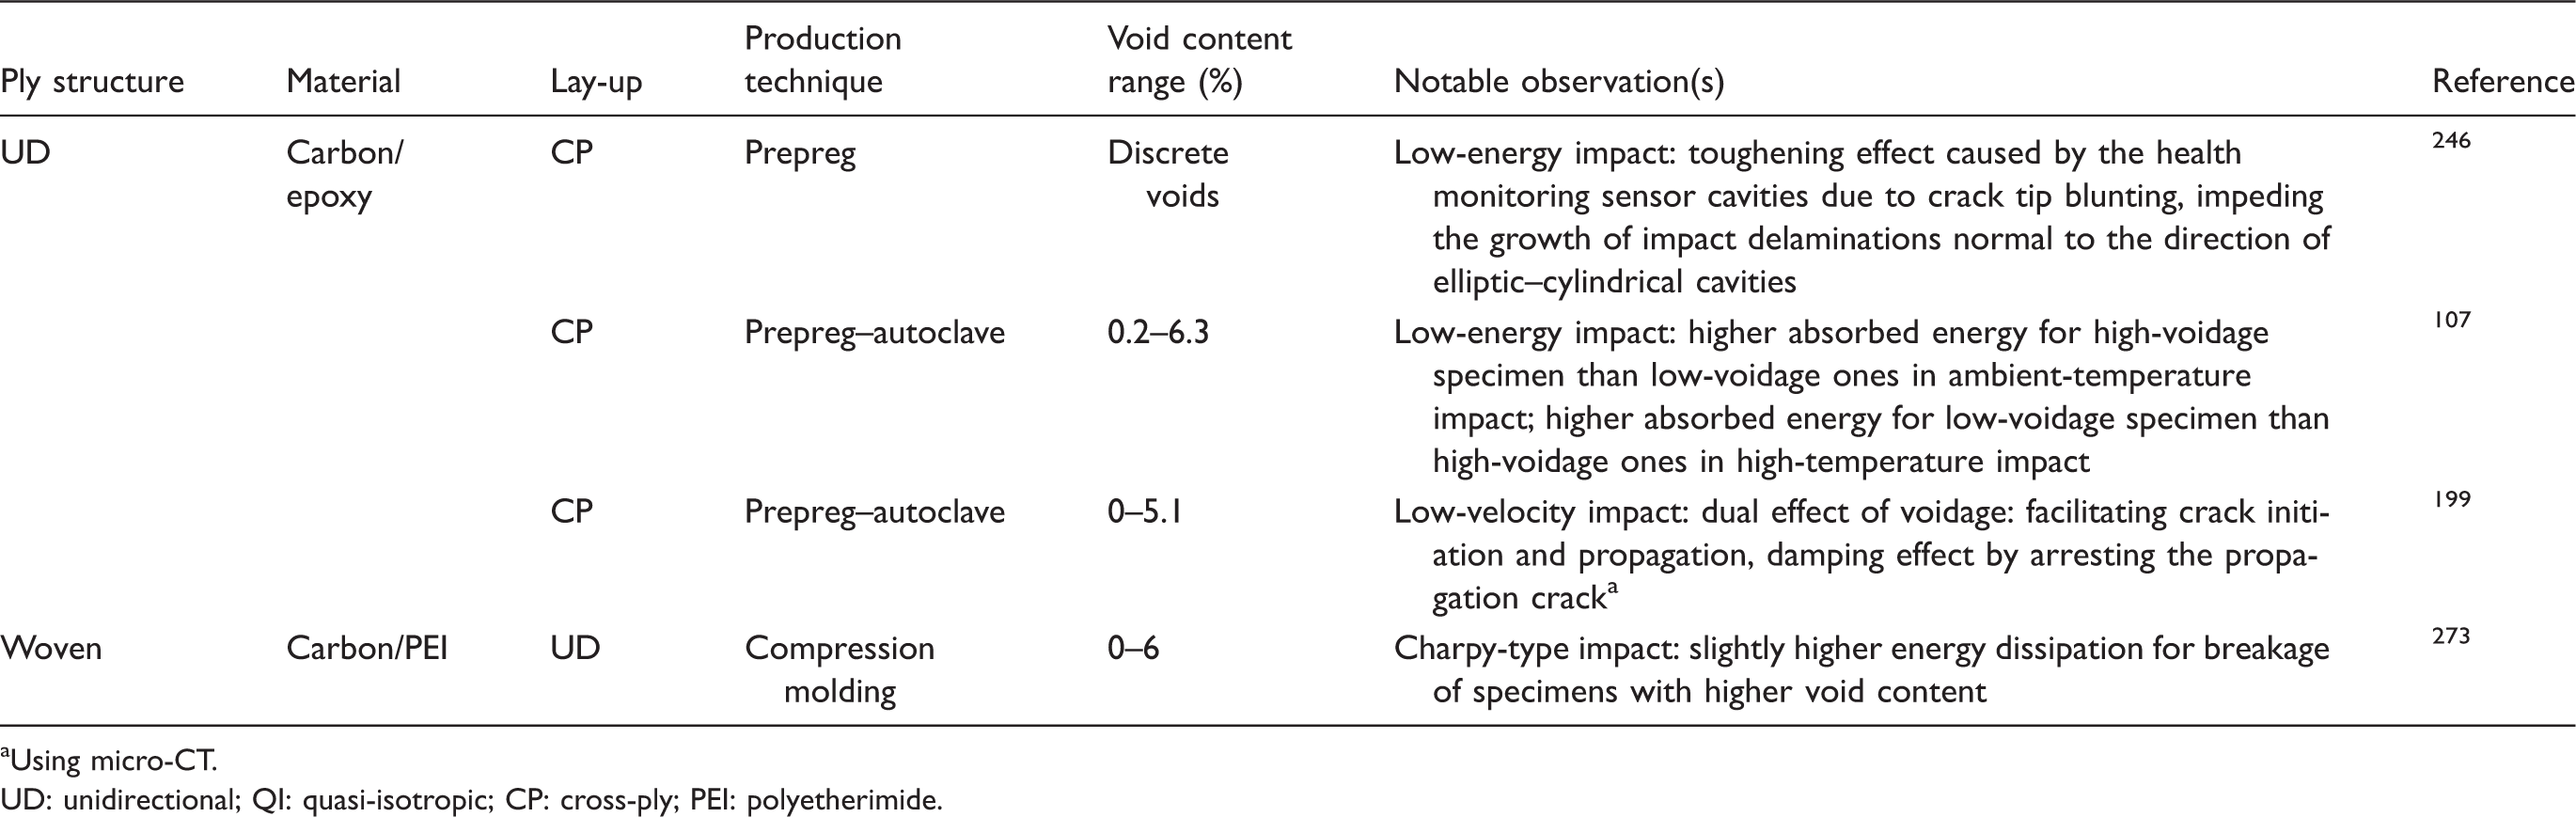
Using micro-CT.
UD: unidirectional; QI: quasi-isotropic; CP: cross-ply; PEI: polyetherimide.
Fatigue behavior
The void-dependency of fatigue behavior, a loading scenario reflecting an important aspect of the real service of structural composites, has been explored for different cyclic loadings and different composites. For axial loading of UD composites, in one of the first studies, Prakash 280 reported the presence of voids on the fractured surface of carbon/epoxy specimens after tension–compression fatigue tests. He claimed that since voids reduce the local heat conductivity and cannot transfer the produced heat during cyclic loading, they cause local heating, which results in matrix softening, and thus local buckling of the adjacent fibers. Furthermore, voids are potential heat accumulation sites that can trigger crack initiation. There was no quantitative analysis performed in this study, nor was the hypothesis confirmed later.
In the fully reversed axial fatigue of a UD carbon/epoxy laminate with fleece-reinforced interlayers, performed along with in situ micro-CT, Lambert et al.
195
could not find a correlation between fatigue life and any of the parameters of global void content, total number of voids, average void size, and spatial population distributions. However, a correlation could be established between fatigue life and the volume of the largest single void in critical damaged layers (Figure 24). Accordingly, it was concluded that the void size in conjunction with its critical location in the specimen is the key parameter in analysis of fatigue life influenced by voids.
(a) Micro-CT reconstructed view of a tested carbon/epoxy [0/+45/−45]3S specimen in the initial stage of tension–compression fatigue (where transverse matrix cracking happens), exhibiting a transverse matrix crack (in red) and (b) with the matrix material digitally removed to show the voids (in yellow) – there is a “fleece” resin-rich layer with randomly oriented fibers adjacent to each [0/+45/−45] ply group.
195
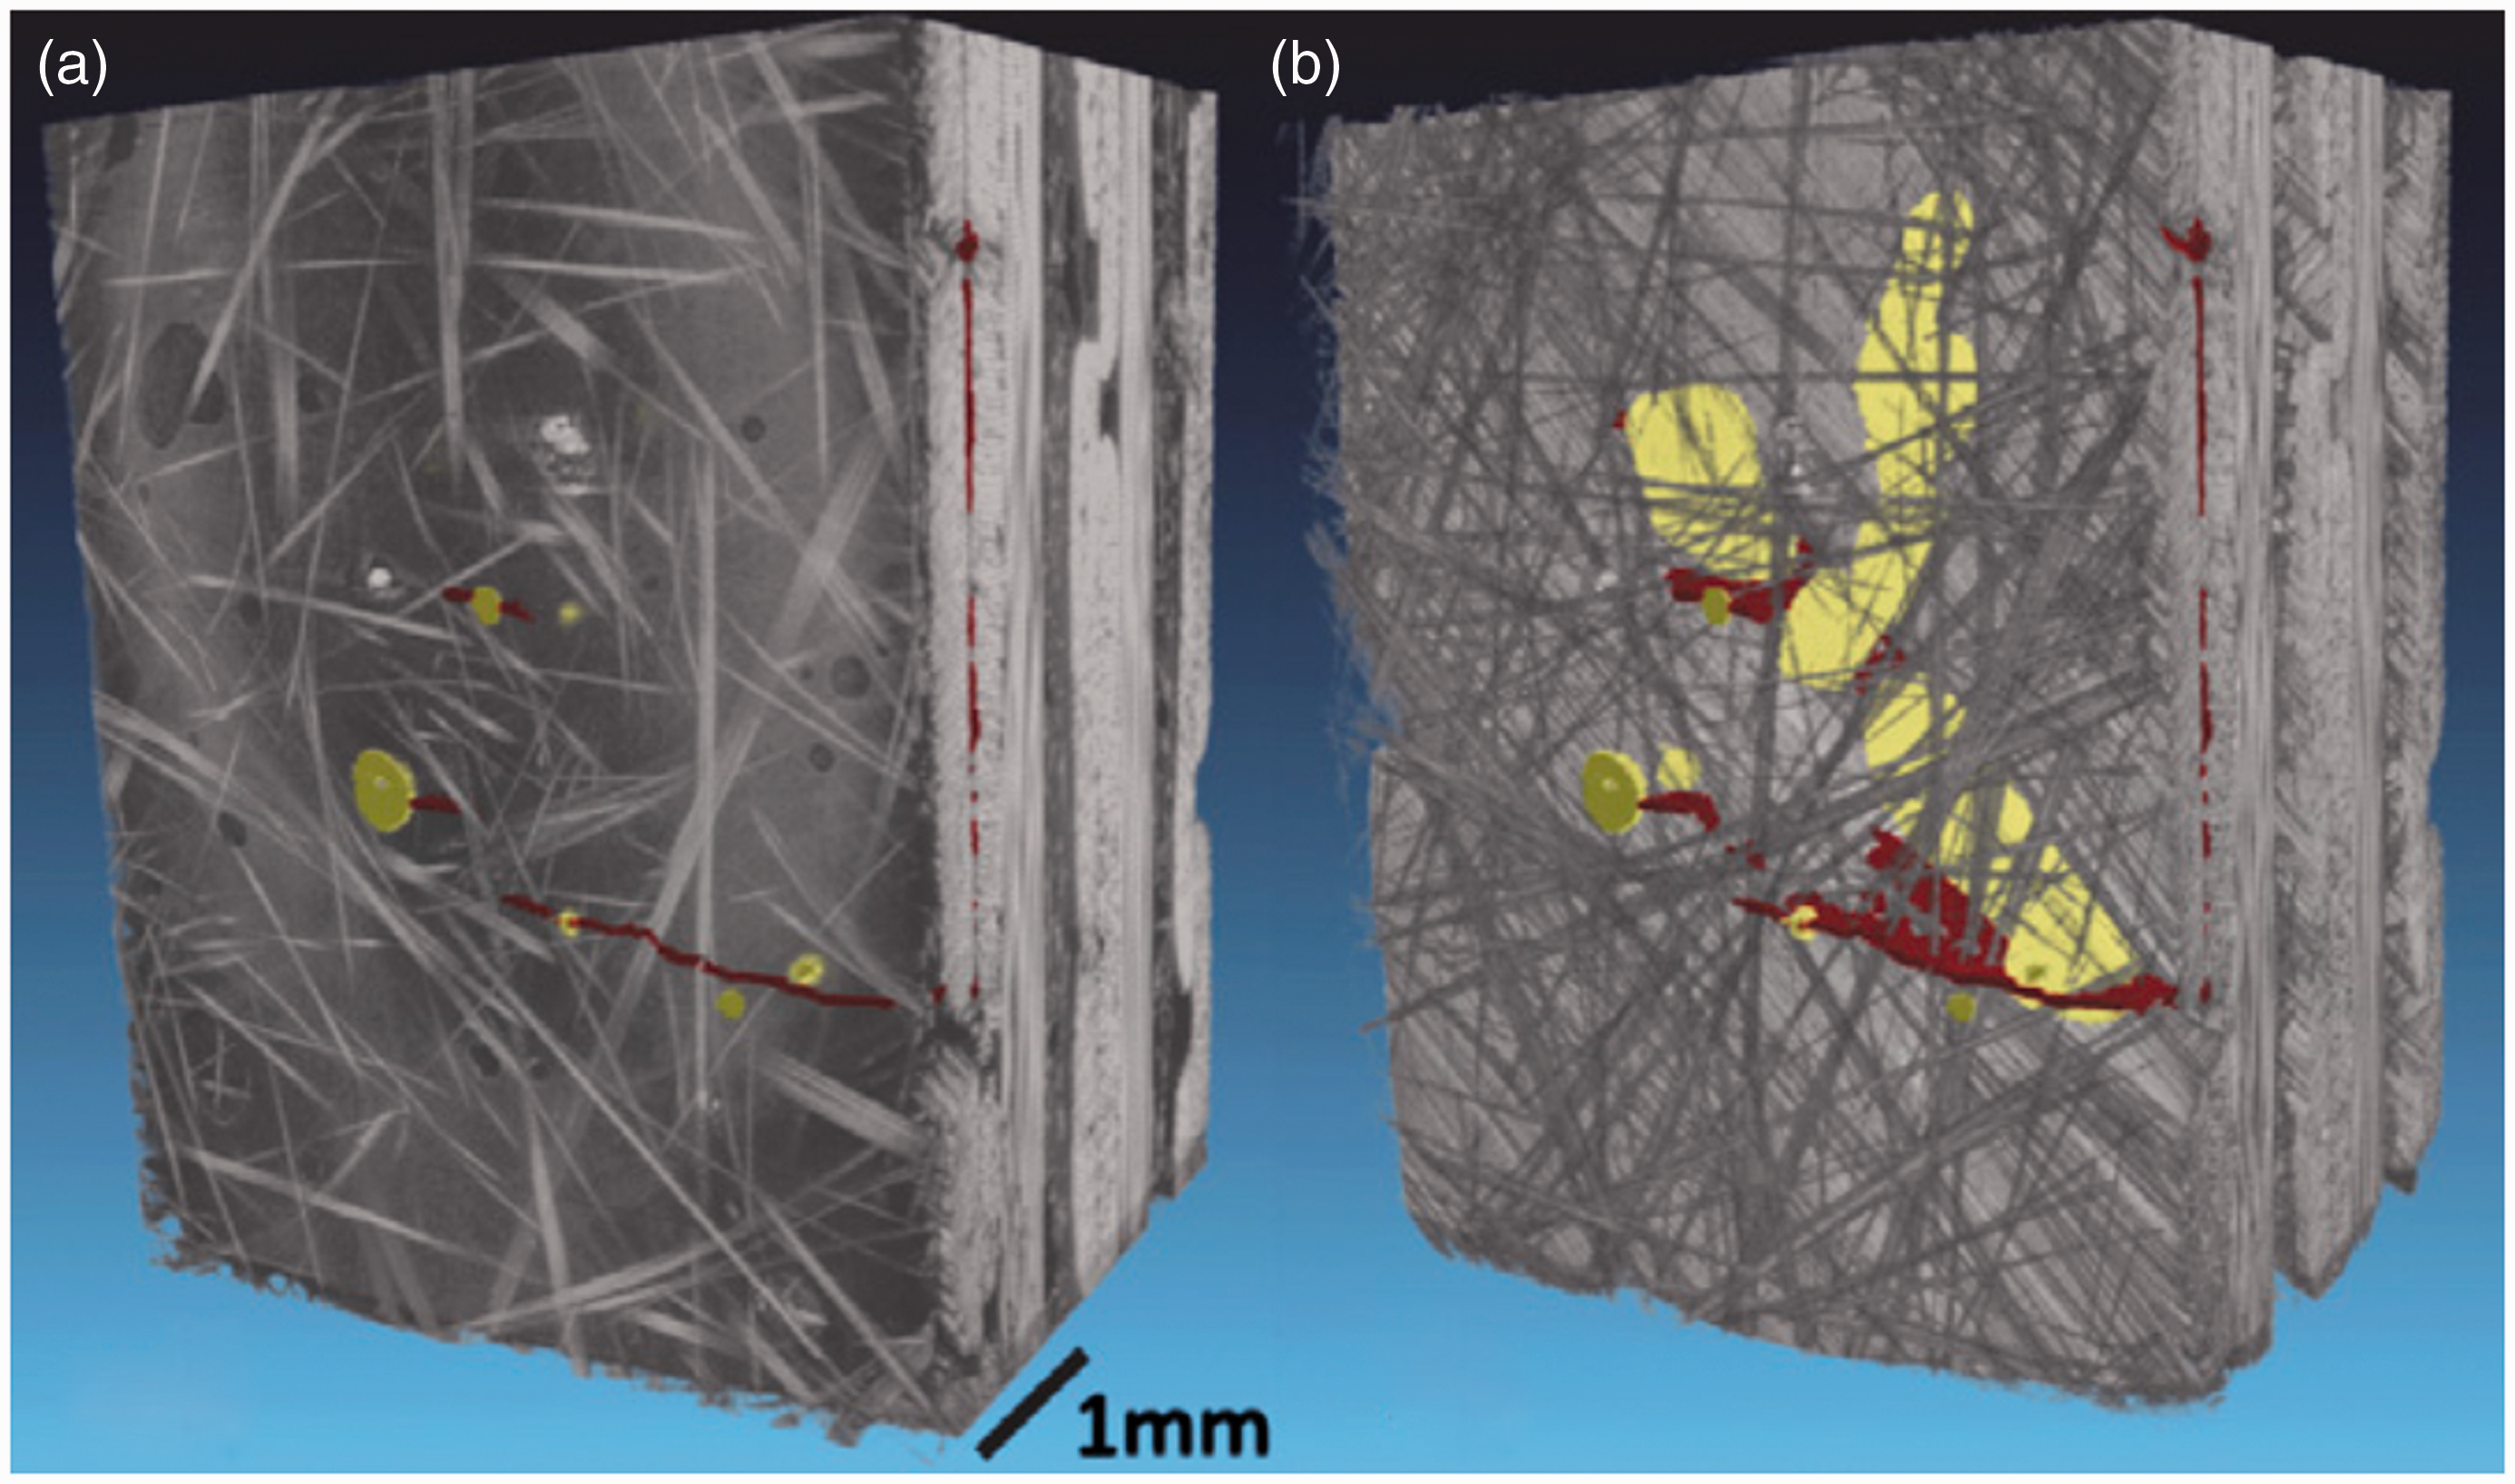
For glass/epoxy laminates with two different stacking sequences produced with VARTM, Maragoni et al.
223
found that under axial tension cyclic loading, both the life to crack initiation and the crack growth rate are dramatically influenced by voids. Defining the void area fraction as the total area of voids divided by the composite area observed in microscopy, the life to crack initiation was reduced by 80% for a void area fraction of 0.34% in the [0/902]S, and by 65% for a void area fraction of 1.07% in the [0/452/0/−452]S. On the other hand, the crack growth rate was increased by 75% for a void area fraction of 0.34% in the [0/902]S, and by 60% for a void area fraction of 1.07% in the [0/452/0/−452]S. The crack density in the 90° ply was markedly influenced by voids in the [0/902]S as they were homogeneously distributed along the specimens length (Figure 25). This was not the case in the [0/452/0/−452]S, where the crack density evolution and the stiffness drop was influenced by voids only in the beginning of fatigue life. The authors endorsed the necessity of a suitable micro-scale model for analysis of damage initiation and evolution, which can take into account the synergistic effect of void parameters.
Micrographs of the edge of the (a) [0/902]S and (b) [0/452/0/−452]S glass/epoxy composites with off-axis cracks, starting from/passing through voids.
223
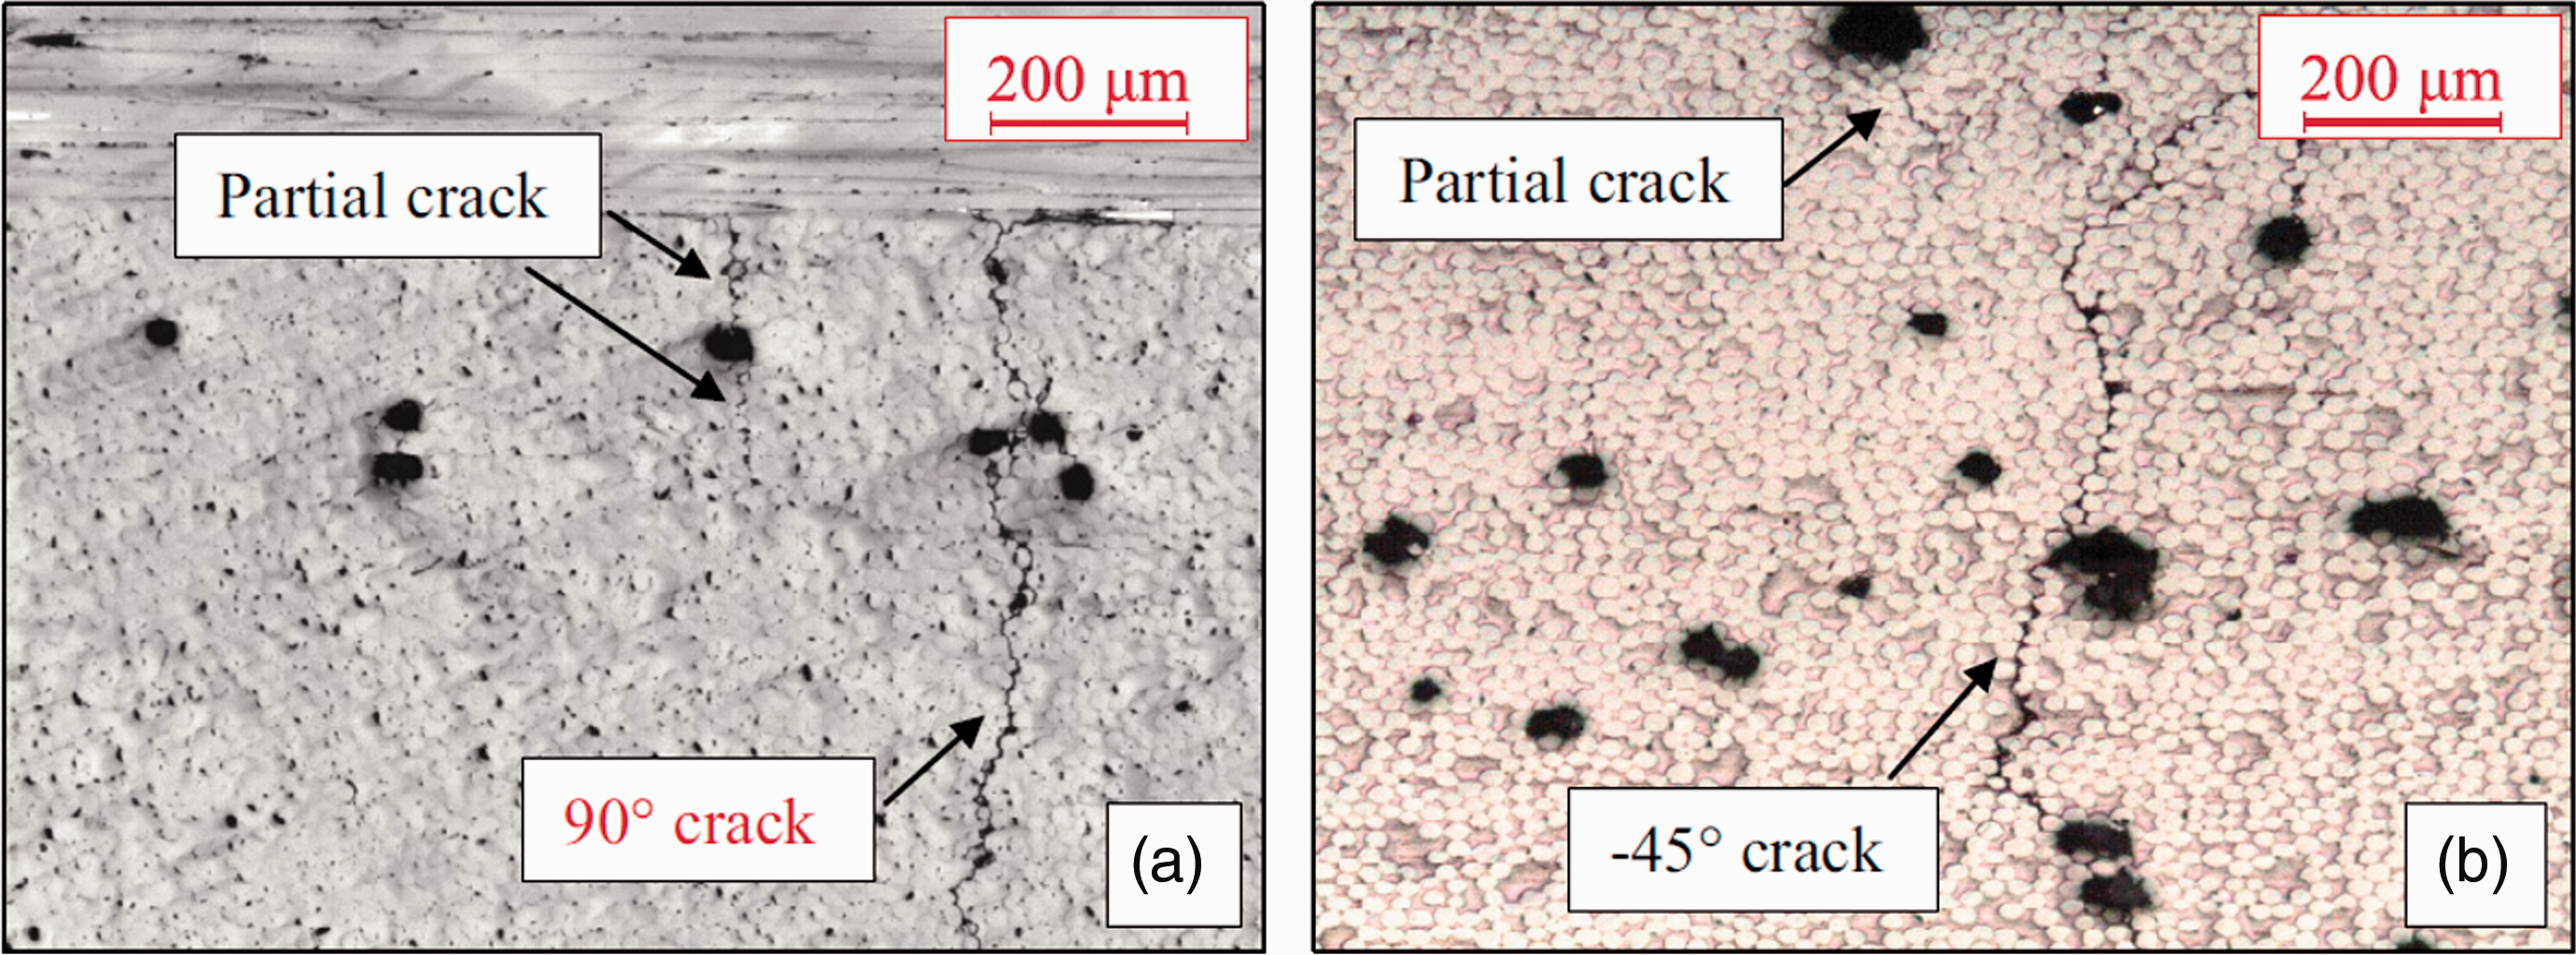
For woven glass/epoxy composites, Dill et al. 145 attributed the drop in tension–tension fatigue strength, which was higher than the drop in static (tensile) strength, to the stress concentration around the voids. This was supported by observation of cracking around the edges of the void in fractography of the fatigue specimens. This premature matrix cracking was less at lower load levels, which might be because stresses concentrations around the voids were not large enough.
Axial fatigue behavior of NCF glass/epoxy composites, produced with VARTM, were investigated by Gehrig et al. 241 in different types of cyclic loadings. Under tension–tension fatigue, the presence of voids led to a shorter fatigue life. This was attributed to a high crack density already in the early stages of fatigue due to the voids, which caused earlier delamination. The large scatter of the results was linked to the scatter in the void size in each specimen. Voids had a less pronounced effect on compression–compression fatigue behavior. The effect was explained by the reduction in the composite shear stiffness as well as the support loss from the neighboring layers, which triggered premature kinking initiation. Surprisingly, in tension–compression fatigue, voids extended fatigue life. The reason was explained to be a drastic decrease in inter-laminar cracking by voids. Unlike Gehrig et al., 241 Protz et al. 233 noted little sensitivity of fatigue life and stiffness degradation to the void content for tension–compression fatigue of NCF glass/epoxy composites produced with VARTM.
In another study on NCF glass/epoxy composites produced with RTM, Schmidt et al. 172 noted a slightly higher degradation of Young’s and shear moduli in biaxial cyclic loading for specimens with voids than those without voids. This was linked to the earlier development of delaminations, resulting in a shorter fatigue life. The difference became more significant for higher biaxiality ratios (shear-dominant loading). The stiffness degradation for specimens with distributed small voids was more or less the same as that for specimens with large accumulated voids. Even a low content (∼1%) of either kind of these voids shortened the fatigue life of the composite. Although crack initiation and propagation might be affected in the vicinity of the voids at the beginning of the lifespan, the average crack density was observed to be unaffected by voids. Therefore, the reduction of the fatigue life cannot be related to the number of matrix cracks. In the specimens with large clustered voids, early formation of delaminations induced by voids resulted in catastrophic and premature failure. This could be monitored via air-coupled guided waves (Ultrasonic testing section). In the specimens with small evenly distributed voids, after 90% of lifespan, critical delaminations produced a high thermal activity region (hot-spot), from which the final failure started. The hot-spot region could be detected via thermography.
Sisodia et al.
240
showed that in the tension–tension fatigue of an NCF carbon/epoxy composite, fatigue life severely reduces for higher void contents, such that for 20% of void content, fatigue life degrades by three orders of magnitude (Figure 26), in contrast with the much weaker influence of the voids on the quasi-static strength. Voids influenced the initiation of micro-cracks during multiplication of transverse cracking in 90° plies in fatigue, while they had negligible effect on cracking in 45° plies. Similarly to what was reported by Schmidt et al.
172
for fatigue, the difference between crack densities in high-voidage and low-voidage specimen is more significant at a lower number of cycles. This was because cracks initiate mostly from voids in the first cycles, but at higher cycles, cracks have to start in void-free areas, and thus this effect diminishes. This behavior is analogous to what was explained in the Transverse cracking section for transverse cracking in quasi-static tests.6,240,276
(a) Normalized quasi-static strength and stiffness and fatigue life versus void content for a QI NCF carbon/epoxy composite, showing a much higher influence of voids on fatigue than on quasi-static properties.
240
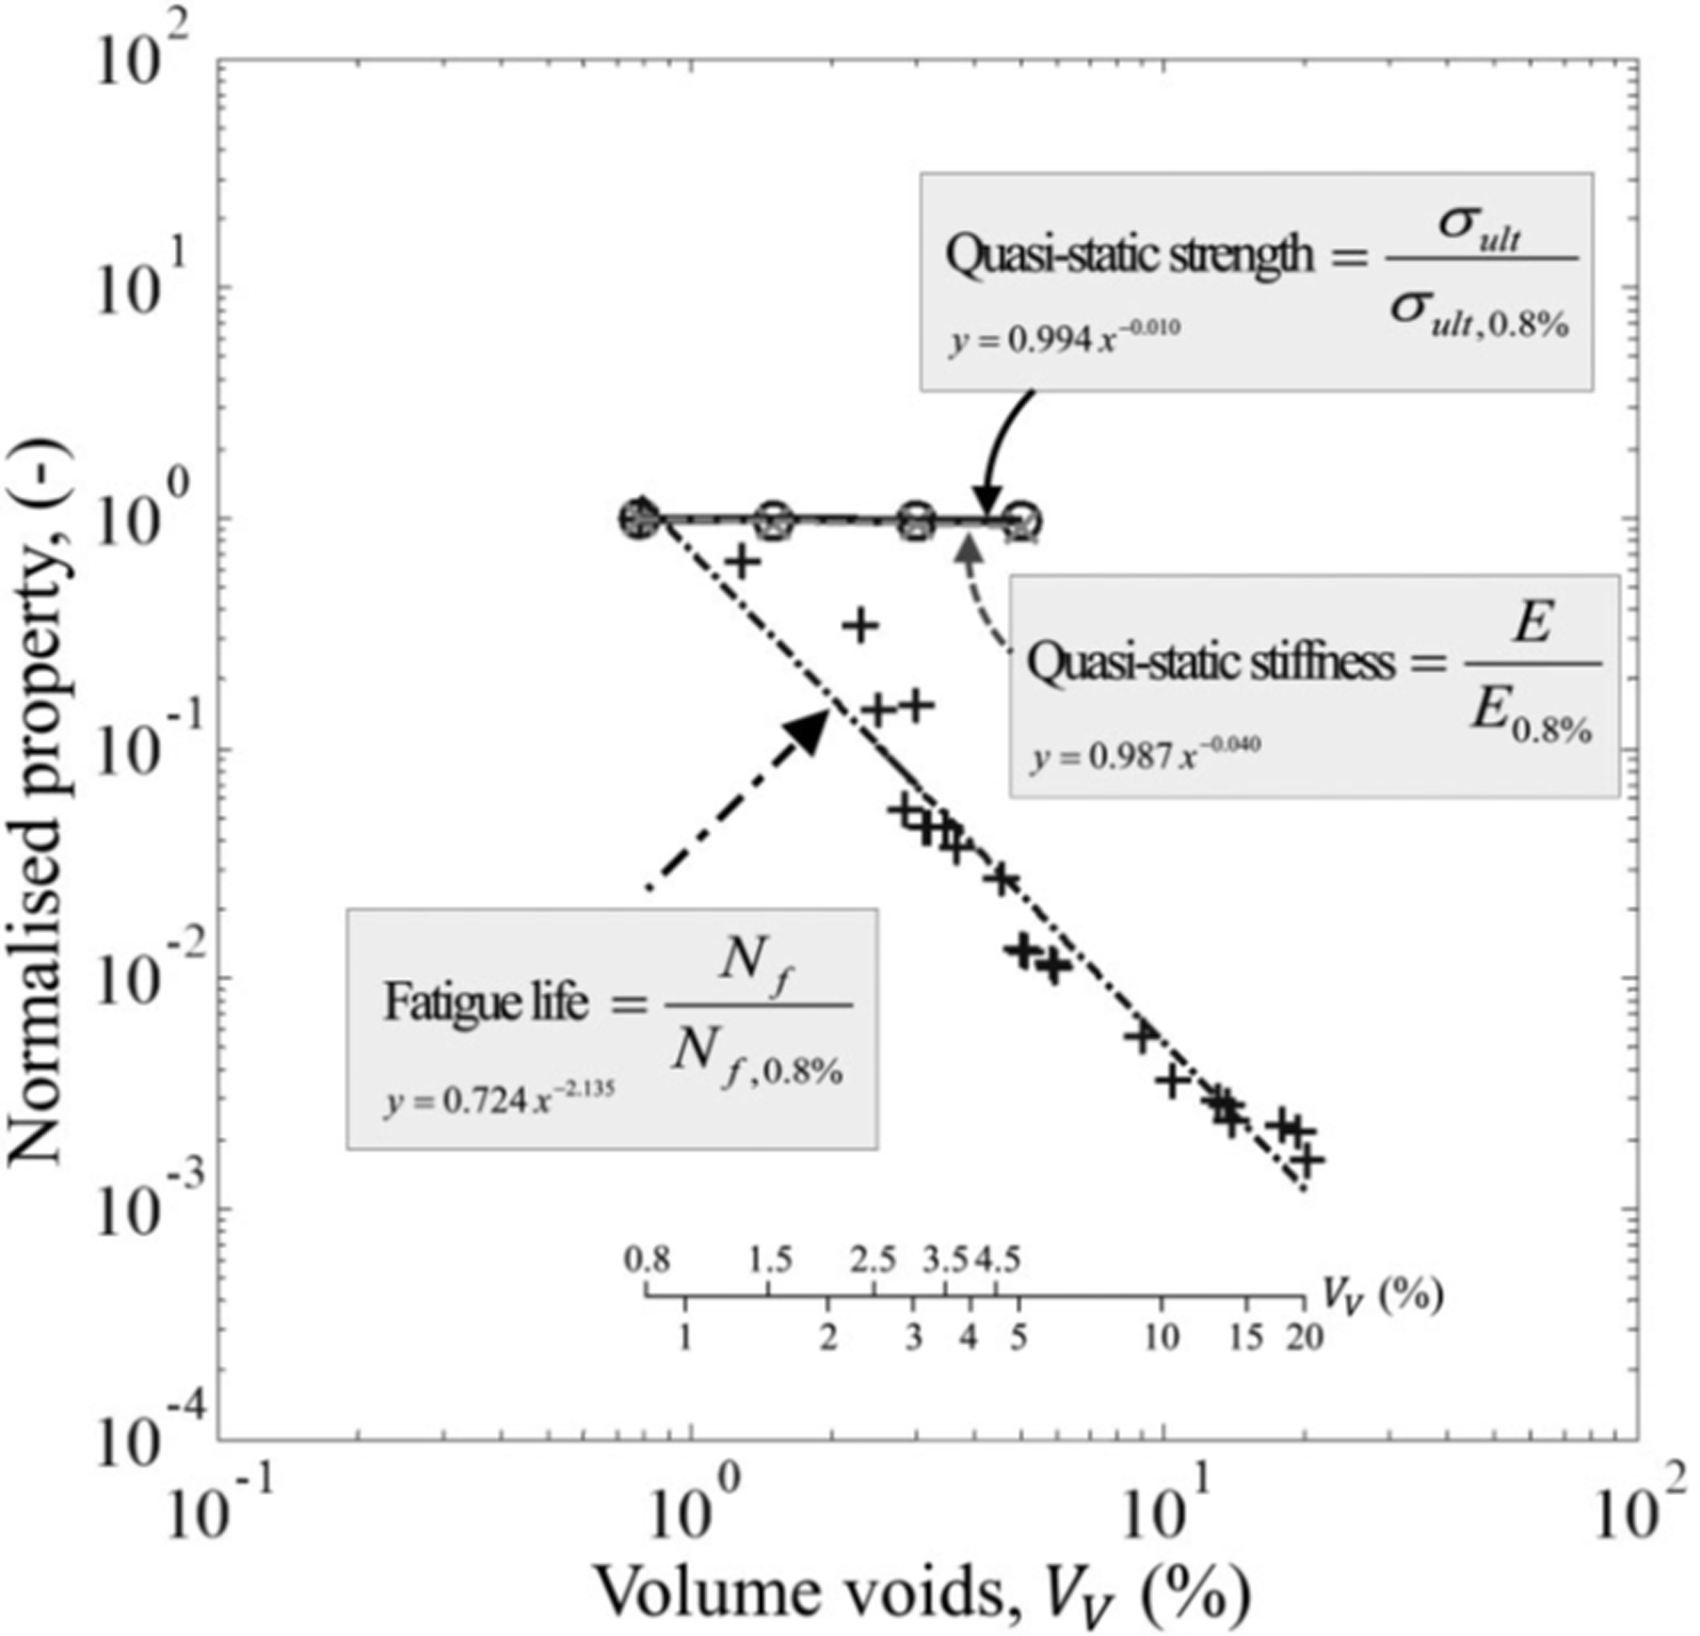
In the tension–tension fatigue test of a glass/epoxy laminate, produced by resin infusion, including NCF off-axis plies, Maragoni et al. 219 concluded that the mechanisms leading to the formation of an off-axis crack, i.e. initiation and coalescence of matrix micro-cracks, are not qualitatively influenced by voids. This conclusion was made based on the good match between the numerically predicted and actual orientations of the local fracture plane (i.e. the plane on which a micro-crack lies) in the presence of voids. Nevertheless, quantitatively, a lower number of cycles for the initiation of off-axis cracks were registered in the presence of voids. It was explained that due to the stress concentration around the voids, they are preferential sites for initiation of the micro-scale damage, and thus they increase the micro-scale damage evolution rate.
For flexural fatigue loading, de Almeida and Neto
154
found that the degradation of fatigue life of a woven composite due to voids is more severe than that of the static strength. The detrimental effect on fatigue life was observed only if the void content was above a critical level. Bureau and Denault
253
explained the effect of voids on flexural fatigue behavior of a woven composite by its dependency on flexural strength and ILSS. Considering the Basquin’s equation, i.e.
For inter-laminar tensile fatigue, Seon et al. 197 verified the importance of the critical size and/or location of voids, as noted by Chambers et al. 153 and Lambert et al. 195 The place, where the inter-laminar tensile delamination was initiated in a UD curved-beam specimen, was found to be related to an individual void at a critical location. The micro-CT measurements were automatically transferred into a 3D FE model, similar to Nikishkov et al., 196 and stress-based failure criteria were utilized to predict the stress concentrations at the critical voids. The results revealed that the maximum inter-laminar shear stress occurs at the tip of the tri-axial ellipsoidal void, and the maximum inter-laminar tensile stress appears to happen at about mid-length of the void. Taking into account the critical voids detected by micro-CT in the FE model, the scatter in the curved-beam fatigue test data could be reduced, and a reliable inter-laminar tensile S–N curve was obtained.
For inter-laminar (DCB) fatigue test of NCF composites produced with RTM, Carraro et al. 231 found no difference in Paris-like curves of specimens with and without voids. They concluded that the crack growth rate is independent of voids since secondary cracks and fiber bridging were not present in fatigue tests, whereas they were observed in static loading.
Concluding remarks on the effect of voids on fatigue behavior
Effect of voids on the fatigue behavior of different composites as reported in the literature.
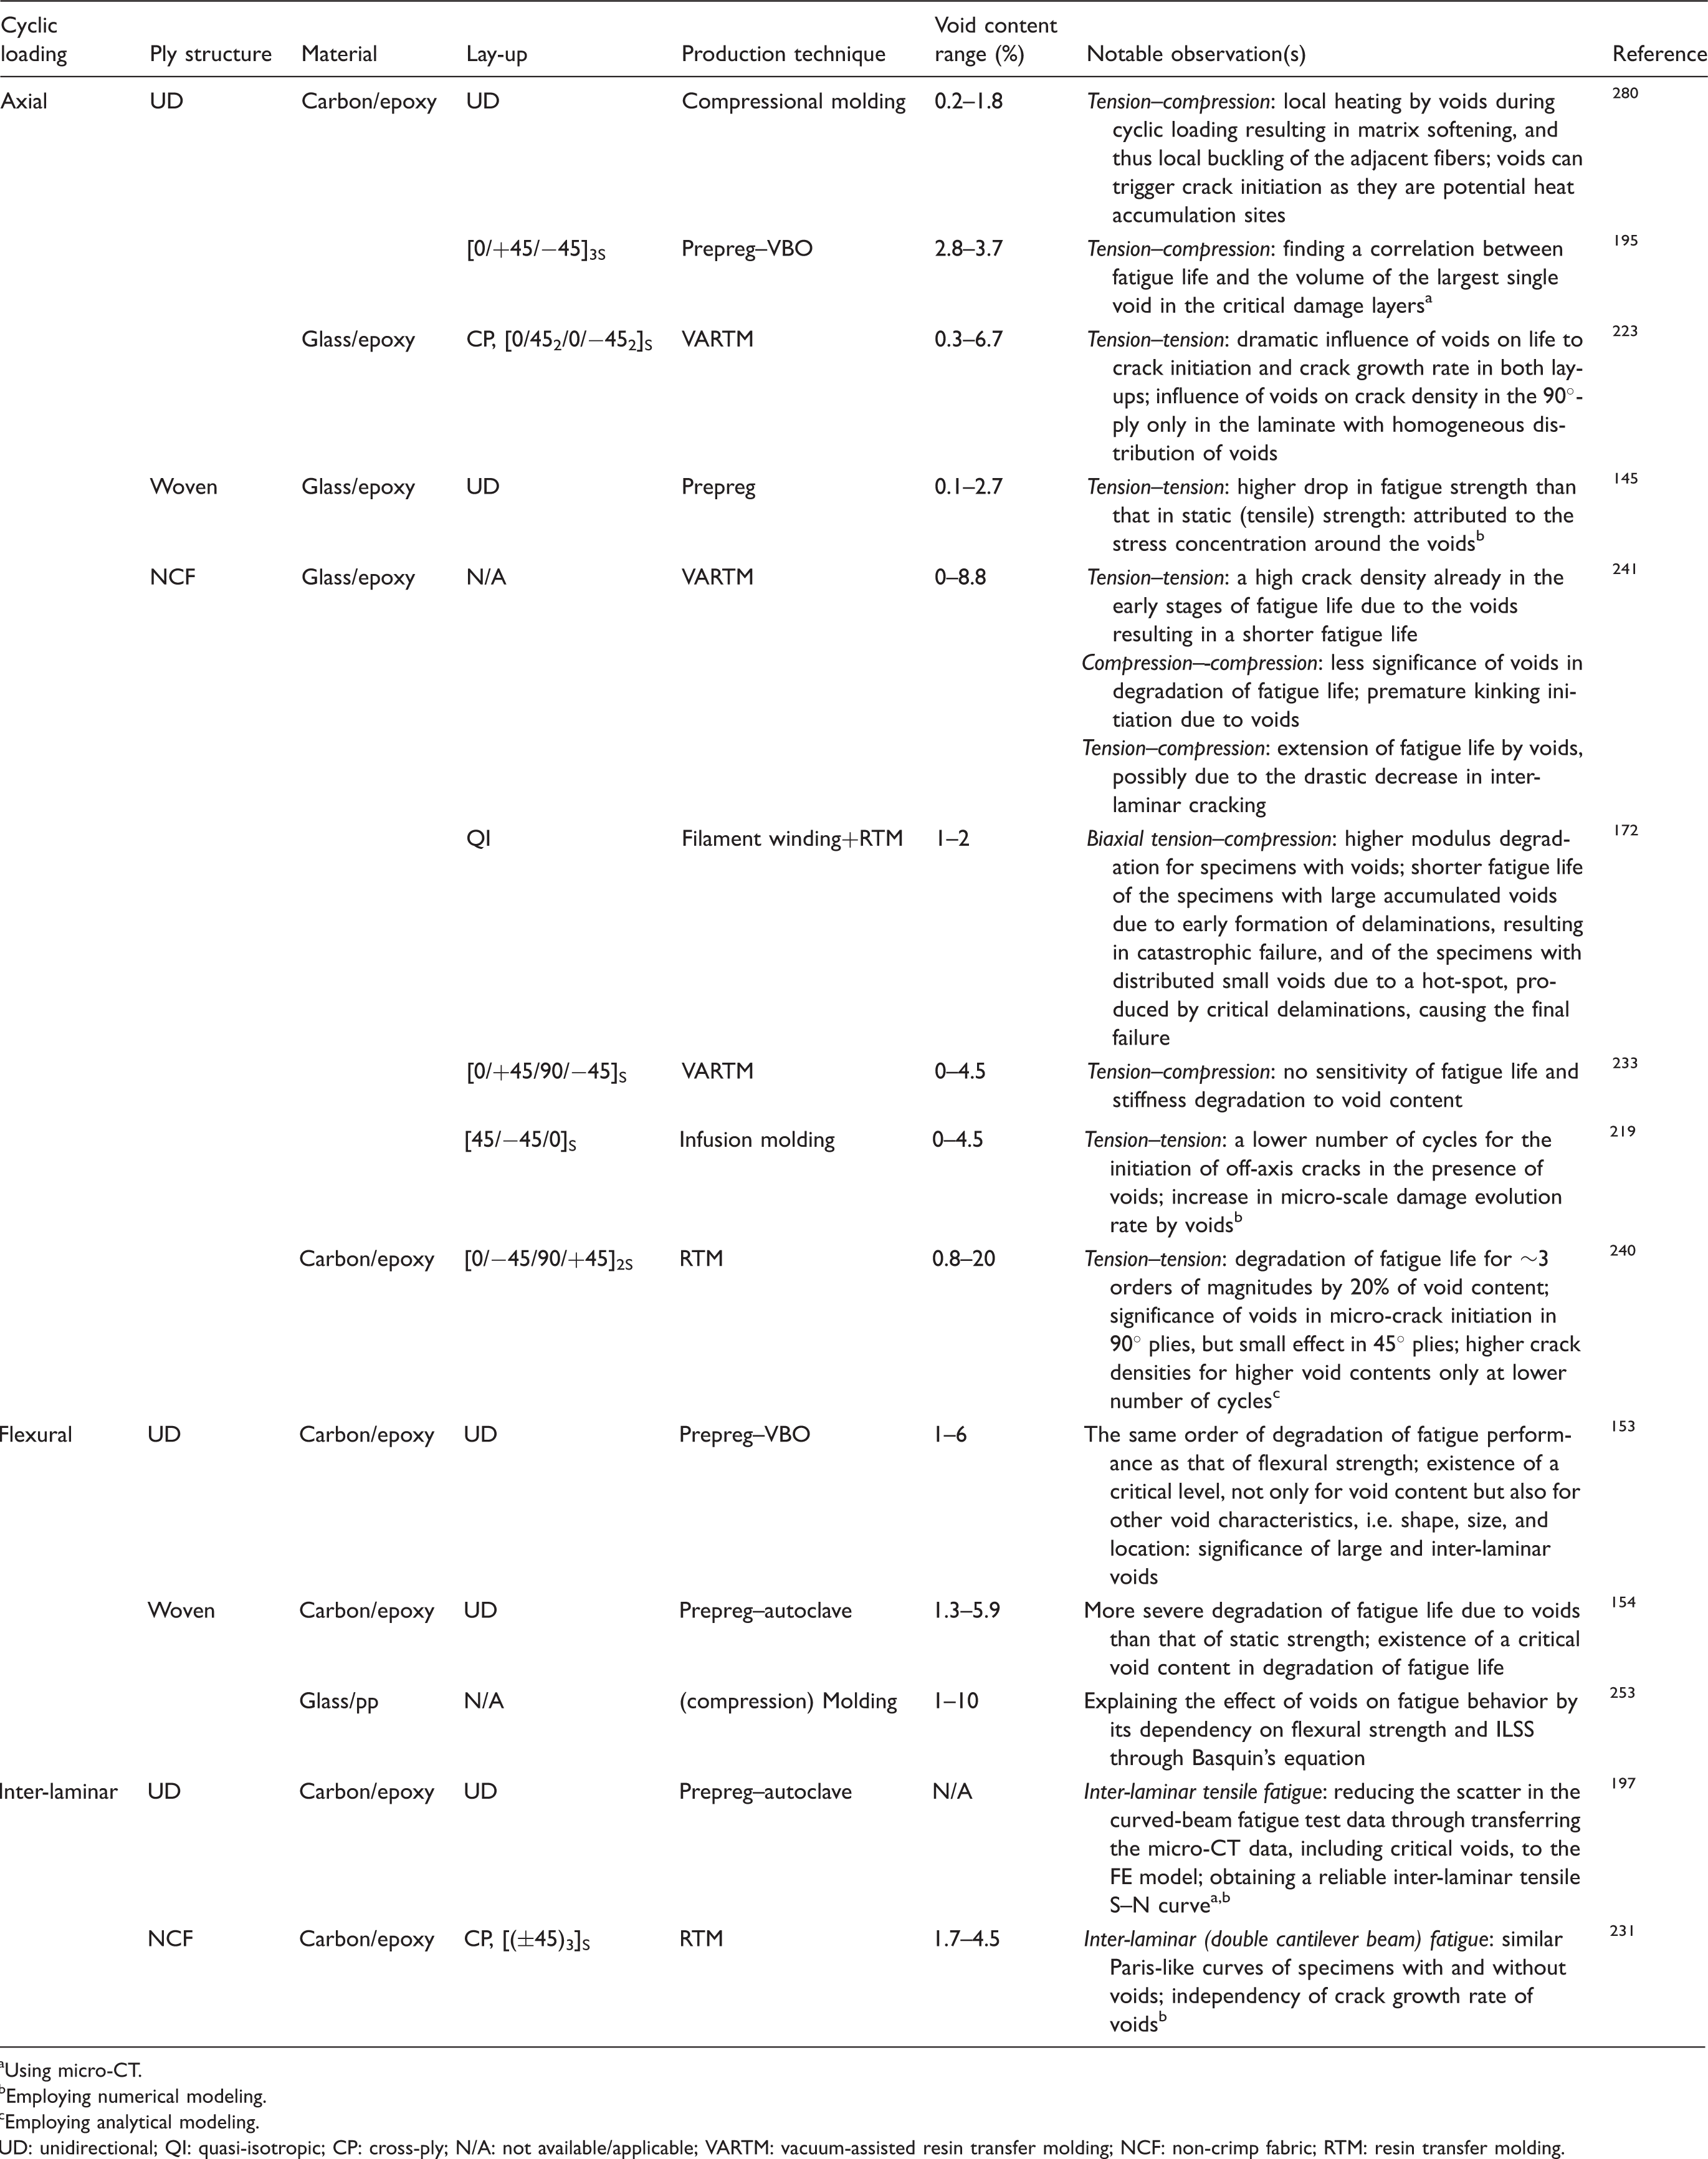
Using micro-CT.
Employing numerical modeling.
Employing analytical modeling.
UD: unidirectional; QI: quasi-isotropic; CP: cross-ply; N/A: not available/applicable; VARTM: vacuum-assisted resin transfer molding; NCF: non-crimp fabric; RTM: resin transfer molding.
Hygrothermal effect on mechanical properties
Hygrothermal conditioning is exposing a material to both humidity and heat, which may influence its mechanical properties. In the current section, it is investigated how voids influence the hygrothermal properties, and how the effect of hygrothermal conditioning on mechanical properties varies in the presence of voids. On an example of a UD carbon/epoxy composite, Harper et al. 254 found that the rate and the equilibrium level of moisture absorption (saturation moisture content) depend on void content. The moisture diffusion followed the classical Fickian behavior for specimens with a low void content, while some non-Fickian diffusion anomalies were witnessed for high-voidage specimens. The authors warned on possible synergistic effects of voids and moisture on mechanical properties. Thomason 249 found void content to be the key factor in moisture absorption of glass/epoxy composites. The extent of the absorption (saturation moisture content) increased significantly with the void content increase. An almost linear correlation between the rate of absorption in the initial stages and void content was found. The non-Fickian diffusion behavior of composites with a high level of voidage, also reported in Harper et al., 254 was confirmed by Choi et al. 281 The measured diffusion coefficient of composites with voids reached a minimum at 2–3% of void content. Using a self-consistent model, Youssef et al. 282 obtained the homogenized hygroscopic expansion coefficient of a ply, accounting for fibers, matrix, and voids. The result was that unlike the transverse effective diffusion coefficient, the hygroscopic expansion coefficient decreases with the void content increase. Additionally, a strong interaction between voidage and humidity was found. For instance, the increase in void content may alter the homogenized compressive hygro-elastic stress to tensile stress.
Costa et al. 251 concluded that the hygrothermal conditioning of composites influences the same properties affected by the void content, i.e. matrix-dominated properties, amplifying the effects of voids. They argued that the absorbed moisture brings about plasticization of the matrix, which in combination with heat conditioning causes substantial changes in the matrix toughness, influencing the laminate strength. It was found that the effect of voids on the consequences of hygrothermal conditioning regarding the strength properties (and equivalently regarding the fracture criterion (equation (10)) parameters in de Almeida and Neto 154 ) is dependent on the reinforcement structure, fiber and matrix material, and loading mode. For instance, regarding ILSS, this effect was higher for woven carbon/epoxy composites than for woven carbon/bismaleimide and UD carbon/epoxy composites. The compressive strength of the woven carbon/bismaleimide composites in the presence of voids is more sensitive to hygrothermal conditioning. They also warned that moisture absorption creates hygro-elastic internal stresses arising from the intrinsic heterogeneous nature of composites.
In a Kevlar/epoxy woven laminate, Allred 283 observed that there is almost no effect of voids on the flexural strength at 21℃. They suggested that this unusual insensitivity could be because of the toughness of the Kevlar fibers or the distinctive failure modes that they create. However, at 150℃, a voidage level of 2–4% induced a 20% loss of the flexural strength. Furthermore, freeze-thaw cycling of the high voidage specimen containing moisture reduced the composite flexural strength. This could be due to crack initiation at voids during the freezing phase.
Zhang et al. 229 performed compression, three-point bending, and inter-laminar shear tests on woven carbon/epoxy specimens, subjected to three different conditions before loading: ambient conditions (unaged specimens), hygrothermal conditions: heating plus immersing in water c (aged specimens), and thermal conditions: heating the aged specimen (dried specimens). Prior to the tests, microscopy revealed a larger number of matrix cracks and interfacial cracks in the aged specimens compared to the unaged specimens, for the same level of voidage. The strength values decreased with void content and/or immersion time, and the highest decrease was for ILSS and compressive strength. It was argued that this is because ILSS and compressive strength are controlled by the behavior of the matrix and the fiber/matrix interface, which are affected by hygrothermal conditioning. The specimens with the same void content were ranked with respect to their compressive strength and ILSS as aged, dried, and unaged (low to high). The hygrothermal conditioning led to plasticization of the matrix, changing its toughness, and to stresses arising from dimensional changes, degrading the interfaces. These effects were recoverable to some extents by drying. With regard to the bending strength, the specimens were sorted as unaged, aged, and dried. The hygrothermal conditioning reduced the compatibility between fibers and matrix, weakening the interfacial adhesion. The enhancement of the bending strength with drying was explained as drying can cause an increase in the curing degree, reducing the residual stresses and improving the fiber/matrix interfacial adhesion.
Nevertheless, de Almeida and de Mas Santacreu 284 found contrary results for ILSS of a woven composite. They showed that high-voidage composites have less sensitivity to the test environmental conditions, i.e. high humidity and high/low temperature. Moreover, the composite was less sensitive to the void content at elevated temperatures. In the fracture criterion (equation (10)) proposed by de Almeida and Neto, 154 the empirical factor H, which was claimed to be linked to the composite toughness, was higher in a more humid environment, and lower at higher temperatures. Reversely, the critical void content in the fracture criterion decreased by increasing humidity and increased by increasing temperature. It was also concluded that exerting a few thermal shock cycles might have beneficial effects on ILSS in room conditions for laminates with moderate levels of void content.
Concluding remarks on hygrothermal effect on mechanical properties
Influence of voids on the hygrothermal effects in different composites as reported in the literature.
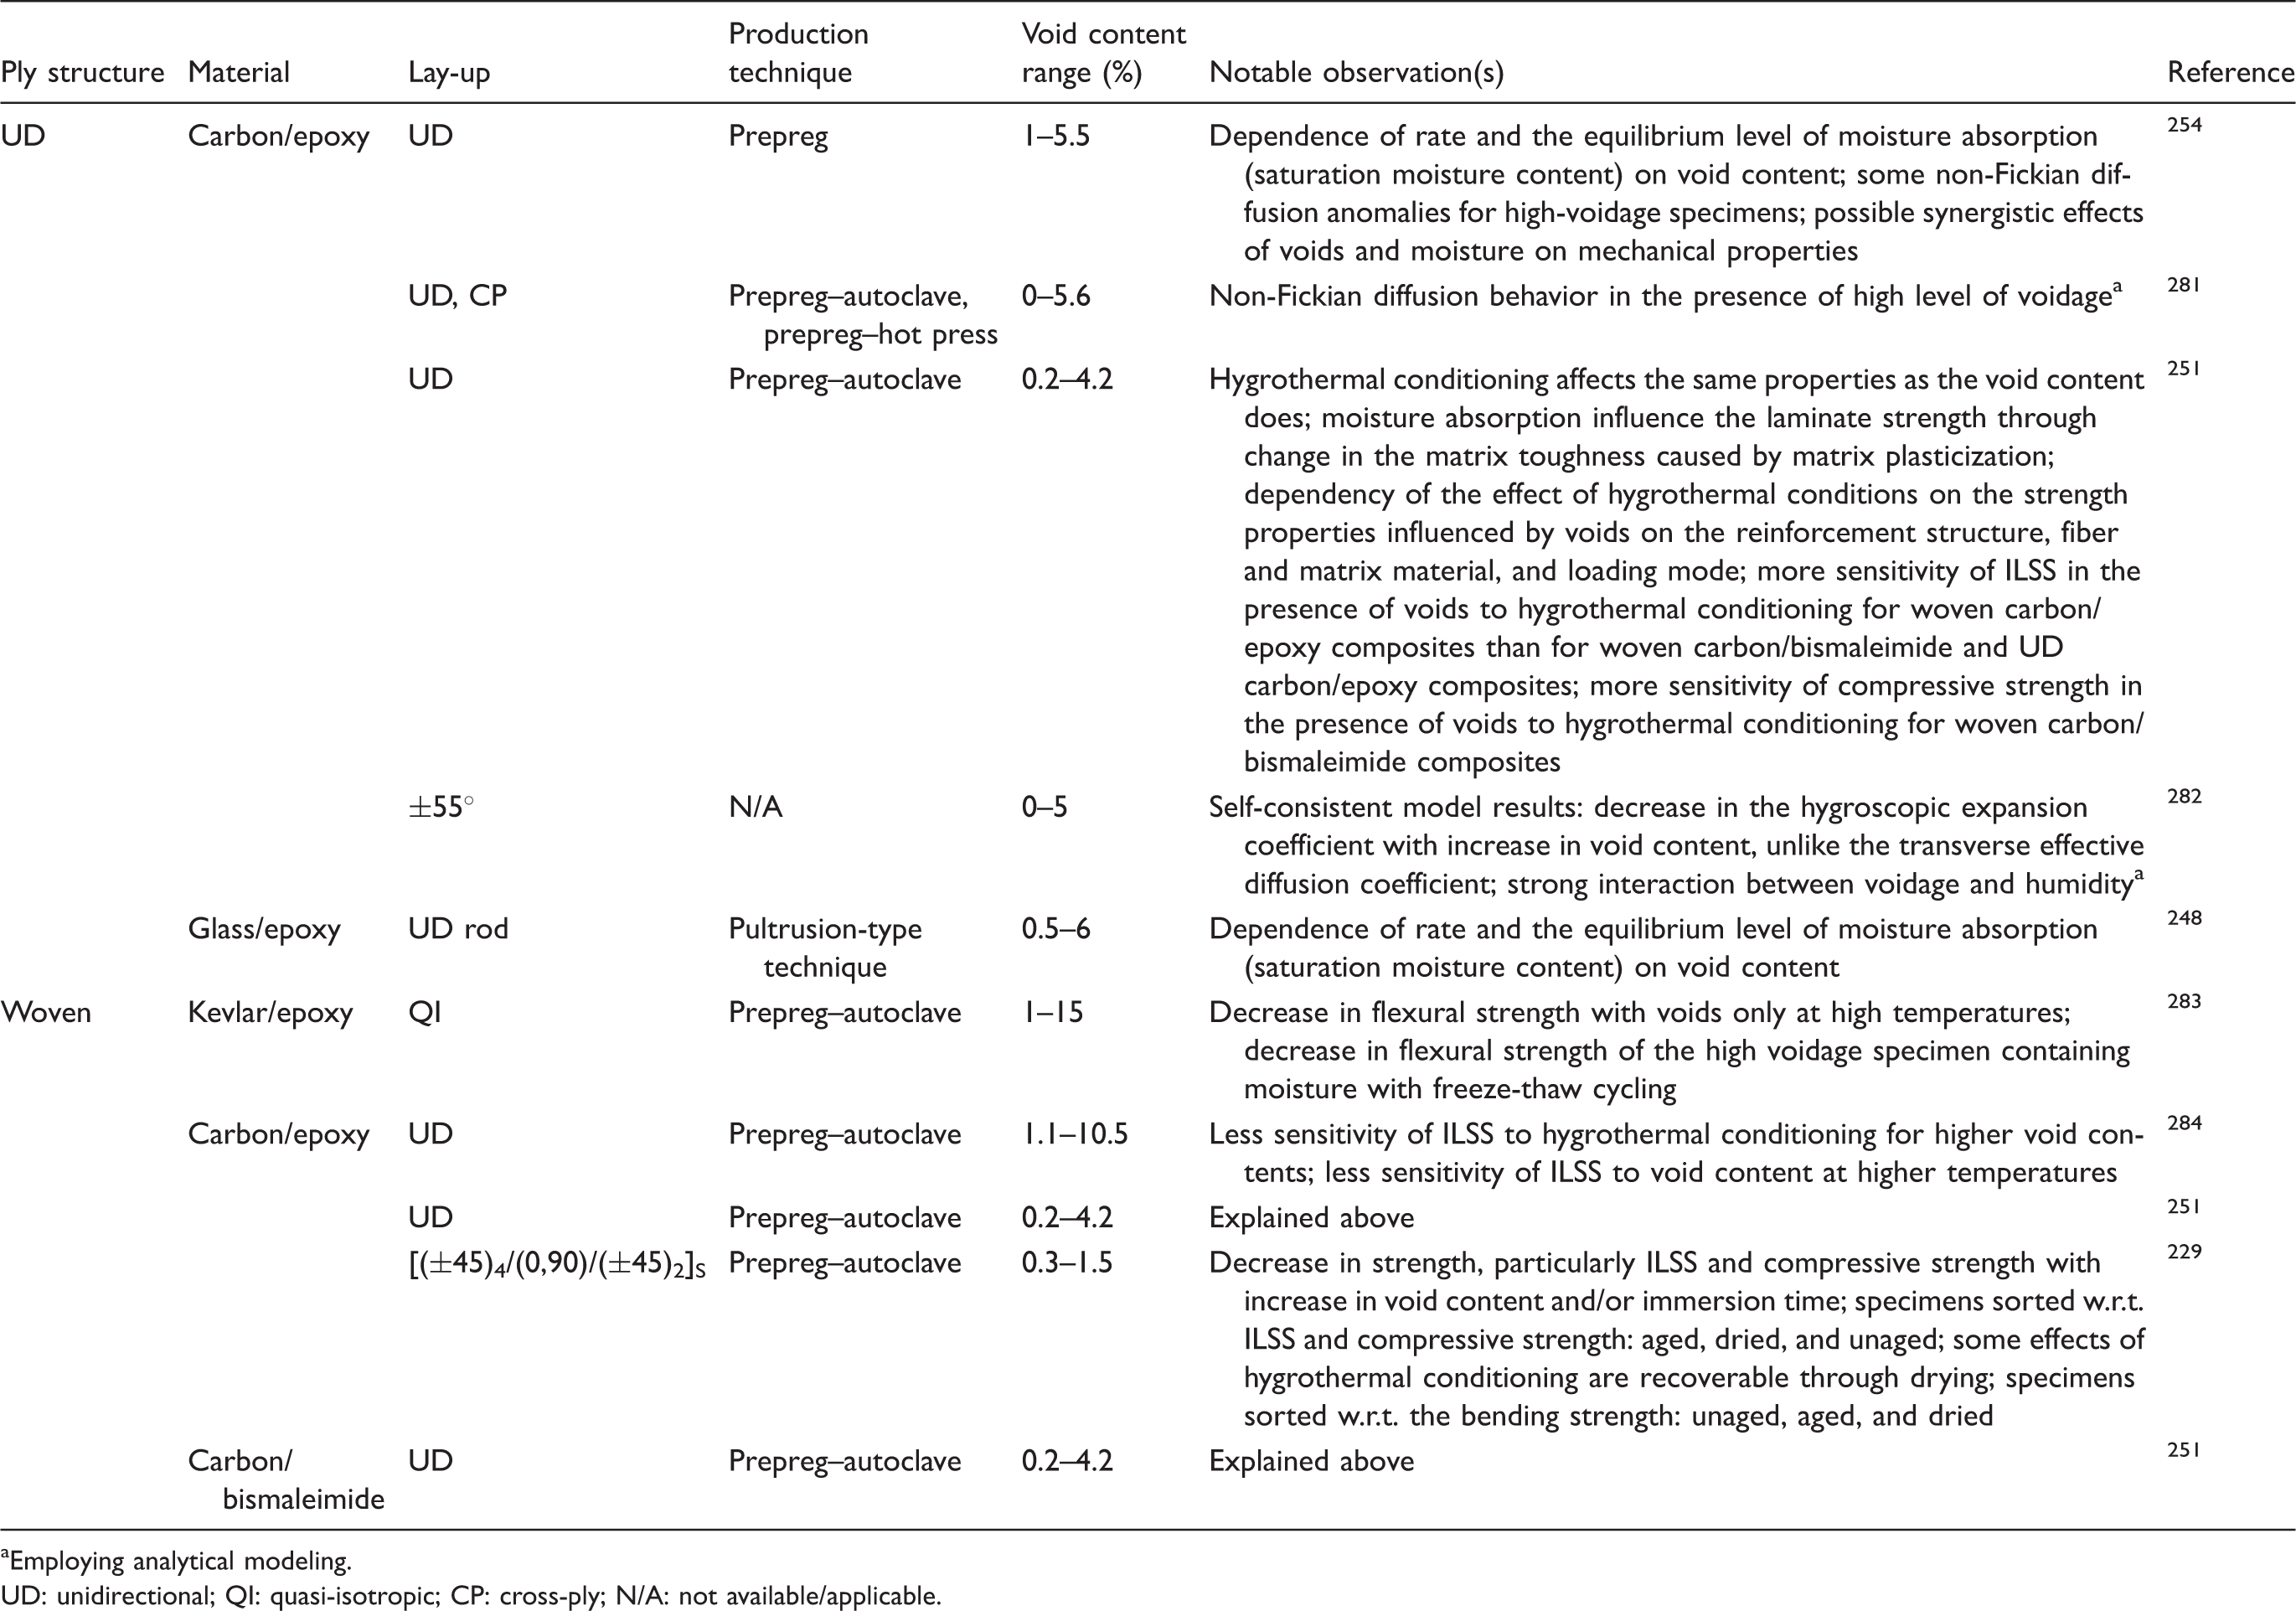
Employing analytical modeling.
UD: unidirectional; QI: quasi-isotropic; CP: cross-ply; N/A: not available/applicable.
Other properties
There are sporadic studies on other mechanical properties influenced by voids, which will be briefly reviewed here.
Hancox 262 investigated the longitudinal shear properties through torsion tests and witnessed the same trend of decrement in the shear strength as that in shear modulus. He suggested that the drastic drop of ∼50% at ∼1.5% void content might be due to shear cracks, starting at the surface and passing through areas of high void concentration. Void concentrations meeting the surface are even more harmful, providing an ideal plane of weakness for longitudinal shear failure. Gürdal et al. 144 performed out-of-plane tensile loading for obtaining inter-laminar normal strength of laminates with different voidage levels. The inter-laminar normal strength decreased with increasing void content. The scatter in the strength results was attributed to the size and distribution of the voids. Rubin and Jerina 222 plotted strength ratio from an open-hole compression test versus US loss and obtained a similar trend to what de Almeida and Neto 154 later explained with their fracture criterion (equation (10)), i.e. reduction of strength above a critical void content. Examining the effect of filament winding pattern on the damage behavior, Rousseau et al. 148 realized that inter-laminar voids concentrate in the undulation regions. These voids were found to be crack initiation sites, intensifying damage and increasing the possibility of leaking in high interwoven structures.
For a woven composite, Ricotta et al. 244 presented an analytical (1D) model to investigate Mode I SERR in a DCB test in the presence of voids, validated by a 2D FE model using the virtual crack closure technique (VCCT). Their methodology employs the beam-on-elastic-foundation approach, refined to include transverse shear effect and material orthotropy, considering the equilibrium, constitutive, and compatibility equations. The analytical model showed that Mode I SERR increased in the presence of a single void located near the crack tip. This increase was higher for a void with larger diameter and/or located closer to the crack tip. The influencing size parameter of a circular or elliptical void was the horizontal dimension (in the interface plane), not the vertical one. Some additional results were acquired from the FE analysis as well. Multiple aligned voids in front of the crack tip increased SERR to a larger extent than one single void did. The first two voids close to the crack tip seemed to have a dominating influence. The maximum enhancement of SERR occurred for a characteristic distance between the first two voids. This study again showed the importance of other void characteristics (i.e. size, shape, and location) besides void content. The results of this work are restated in the literature.4,5,276
The effect of voids on post-buckling delamination growth, i.e. on SERR and transverse (buckling) displacement, was numerically examined by Zhuang and Talreja 285 using the VCCT. One delamination and one elongated void ahead of each delamination front were modeled in a 2D FE model of a plate, under axial compression. There was a small effect of voids on the buckling displacement. Mode II SERR increased when the size of the void increased and the distance from the delamination front decreased. Mode I SERR exhibited a maximum at the end of the opening stage of delamination. This maximum value was lower for larger void sizes, whereas the effect of void position on the maximum value was not monotonic. Furthermore, in the presence of voids, a thicker delaminated plate would have an easier growth of delamination than a thinner one during local buckling.
McMillan 286 argued that the predictive method for finding the critical void content proposed by de Almeida and Neto 154 assumes voids only at the fiber/matrix interface to cause failure, and thus does not account for the effect of voids in resin-rich regions. Therefore, they performed a numerical analysis to explore the influence of voids in resin-rich regions on the local stress concentration and knock-down strength. Voids were modeled as idealized elliptical holes in a 2D cell of homogenous matrix. As long as voids had a finite distance from each other, an increase in the number of voids caused a rise in the maximum stress concentration. If they were close to each other, voids tended to shield each other, hence reducing the high stress concentrations. Using statistics, the dependency of strength to voids can be determined, in which void spacing distribution is a key parameter. However, for an accurate analysis, data sets taking into account the close-to-reality distribution of voids are required. In general, this study is more useful for analysis of pure polymer materials and lacks the interaction of fibers, voids, and damage, although it aims to predict the knock-down strength of composites. In a similar study for a (natural-fiber) wheat straw/PP composite, Kern et al. 287 built an FE model including short non-aligned fibers dispersed in the matrix containing spherical voids (microcells). They noted that strain and stress localization happen in the vicinity of voids, which reduces the stress near the fiber ends, causing a lower stress increase rate in the stress–strain curve. The distribution of voids also caused a shorter fracture path in comparison to the case without voids.
Inter-laminar tensile strength (ILTS) of composites with voids was investigated by Nikishkov et al. 196 through “curved-beam” test. They found that ILTS is even more dependent on void content than ILSS. It was observed through micro-CT that long voids in the area of inter-laminar stress concentration in the middle of the curved part are critical for failure (initiation). The undamaged micro-CT data were automatically transferred to an FE model for failure prediction. A global model with voids as degraded elements, using a modified fracture toughness-based failure criterion could predict the location of failure, but not the failure load. That is why they developed a local model for the voids, of which the criticality was determined through the global model. Using point-damage and average-damage methods, the local model provided accurate predictions for the failure load in determination of ILTS. It was also concluded from the local model that the failure of the curved beam is dominated by the inter-laminar tension initiating along the void.
Taking advantage of high-resolution synchrotron micro-CT, Scott et al.
202
analyzed the void effect on the damage behavior of a filament wound composite circumferential structure under hydrostatical loading (pressurized to near failure). Matrix cracks in the longitudinally wound plies were observed to intersect with intra-laminar voids, but fiber break in the circumferential layers was the prevailing damage mechanism. Fiber break density made no first-order correlation with either void content or void size. However, a tessellation technique proved that there is a clear correlation between the location of the voids and the nearest neighboring fiber break, such that up to five times more fiber breaks occurred immediately adjacent to a void than that estimated for a uniform random distribution of the same number of breaks (Figure 27). In a numerical study of a filament wound cylinder under internal loading, Ellul and Camilleri
288
took into account the inclusion of imperfections based on the void content of the specimens. With this modification, the progressive failure analysis was significantly enhanced, owing to prediction of the instable region.
Synchrotron micro-CT reconstructed view of a filament wound (∼20/90°) carbon/epoxy specimen after being pressurized to near failure, representing the micro-scale cracks (green) and voids (blue) in the longitudinal layer – the composite material has been digitally removed to reveal these features.
202
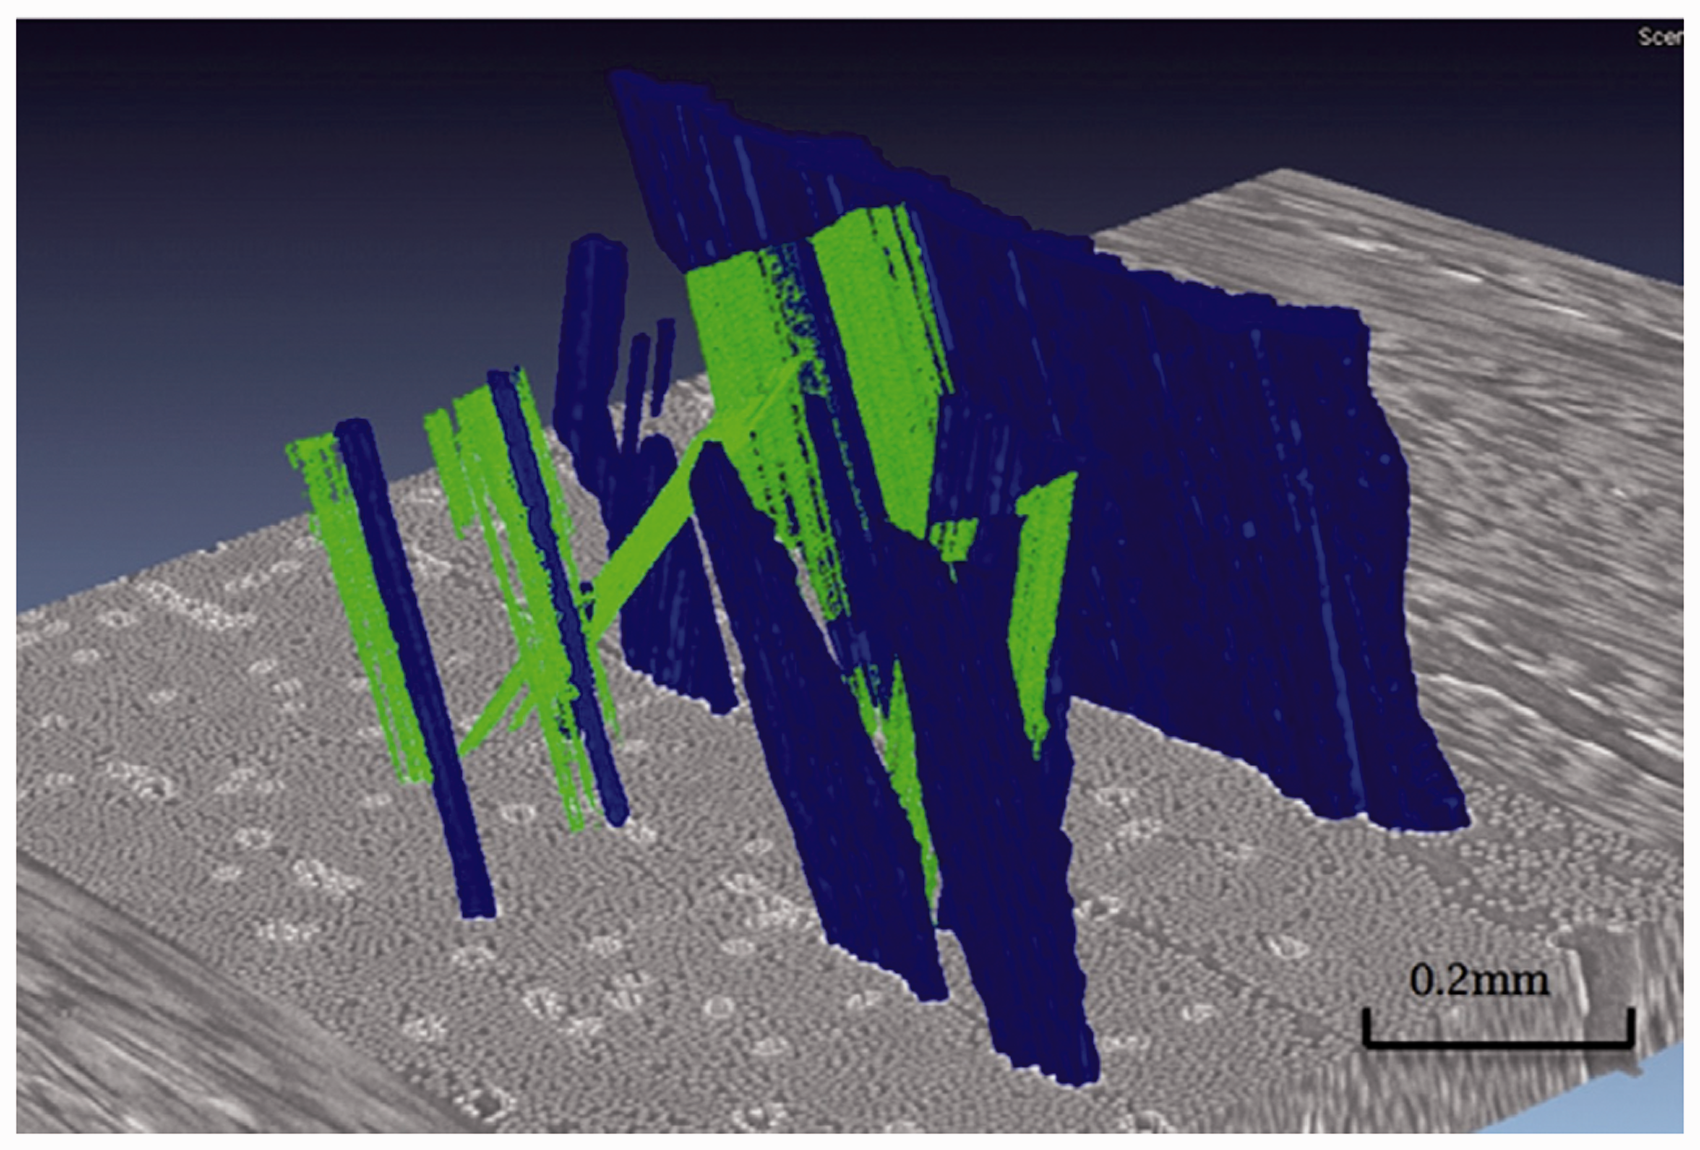
Effect of voids on other mechanical properties of different composites as reported in the literature.
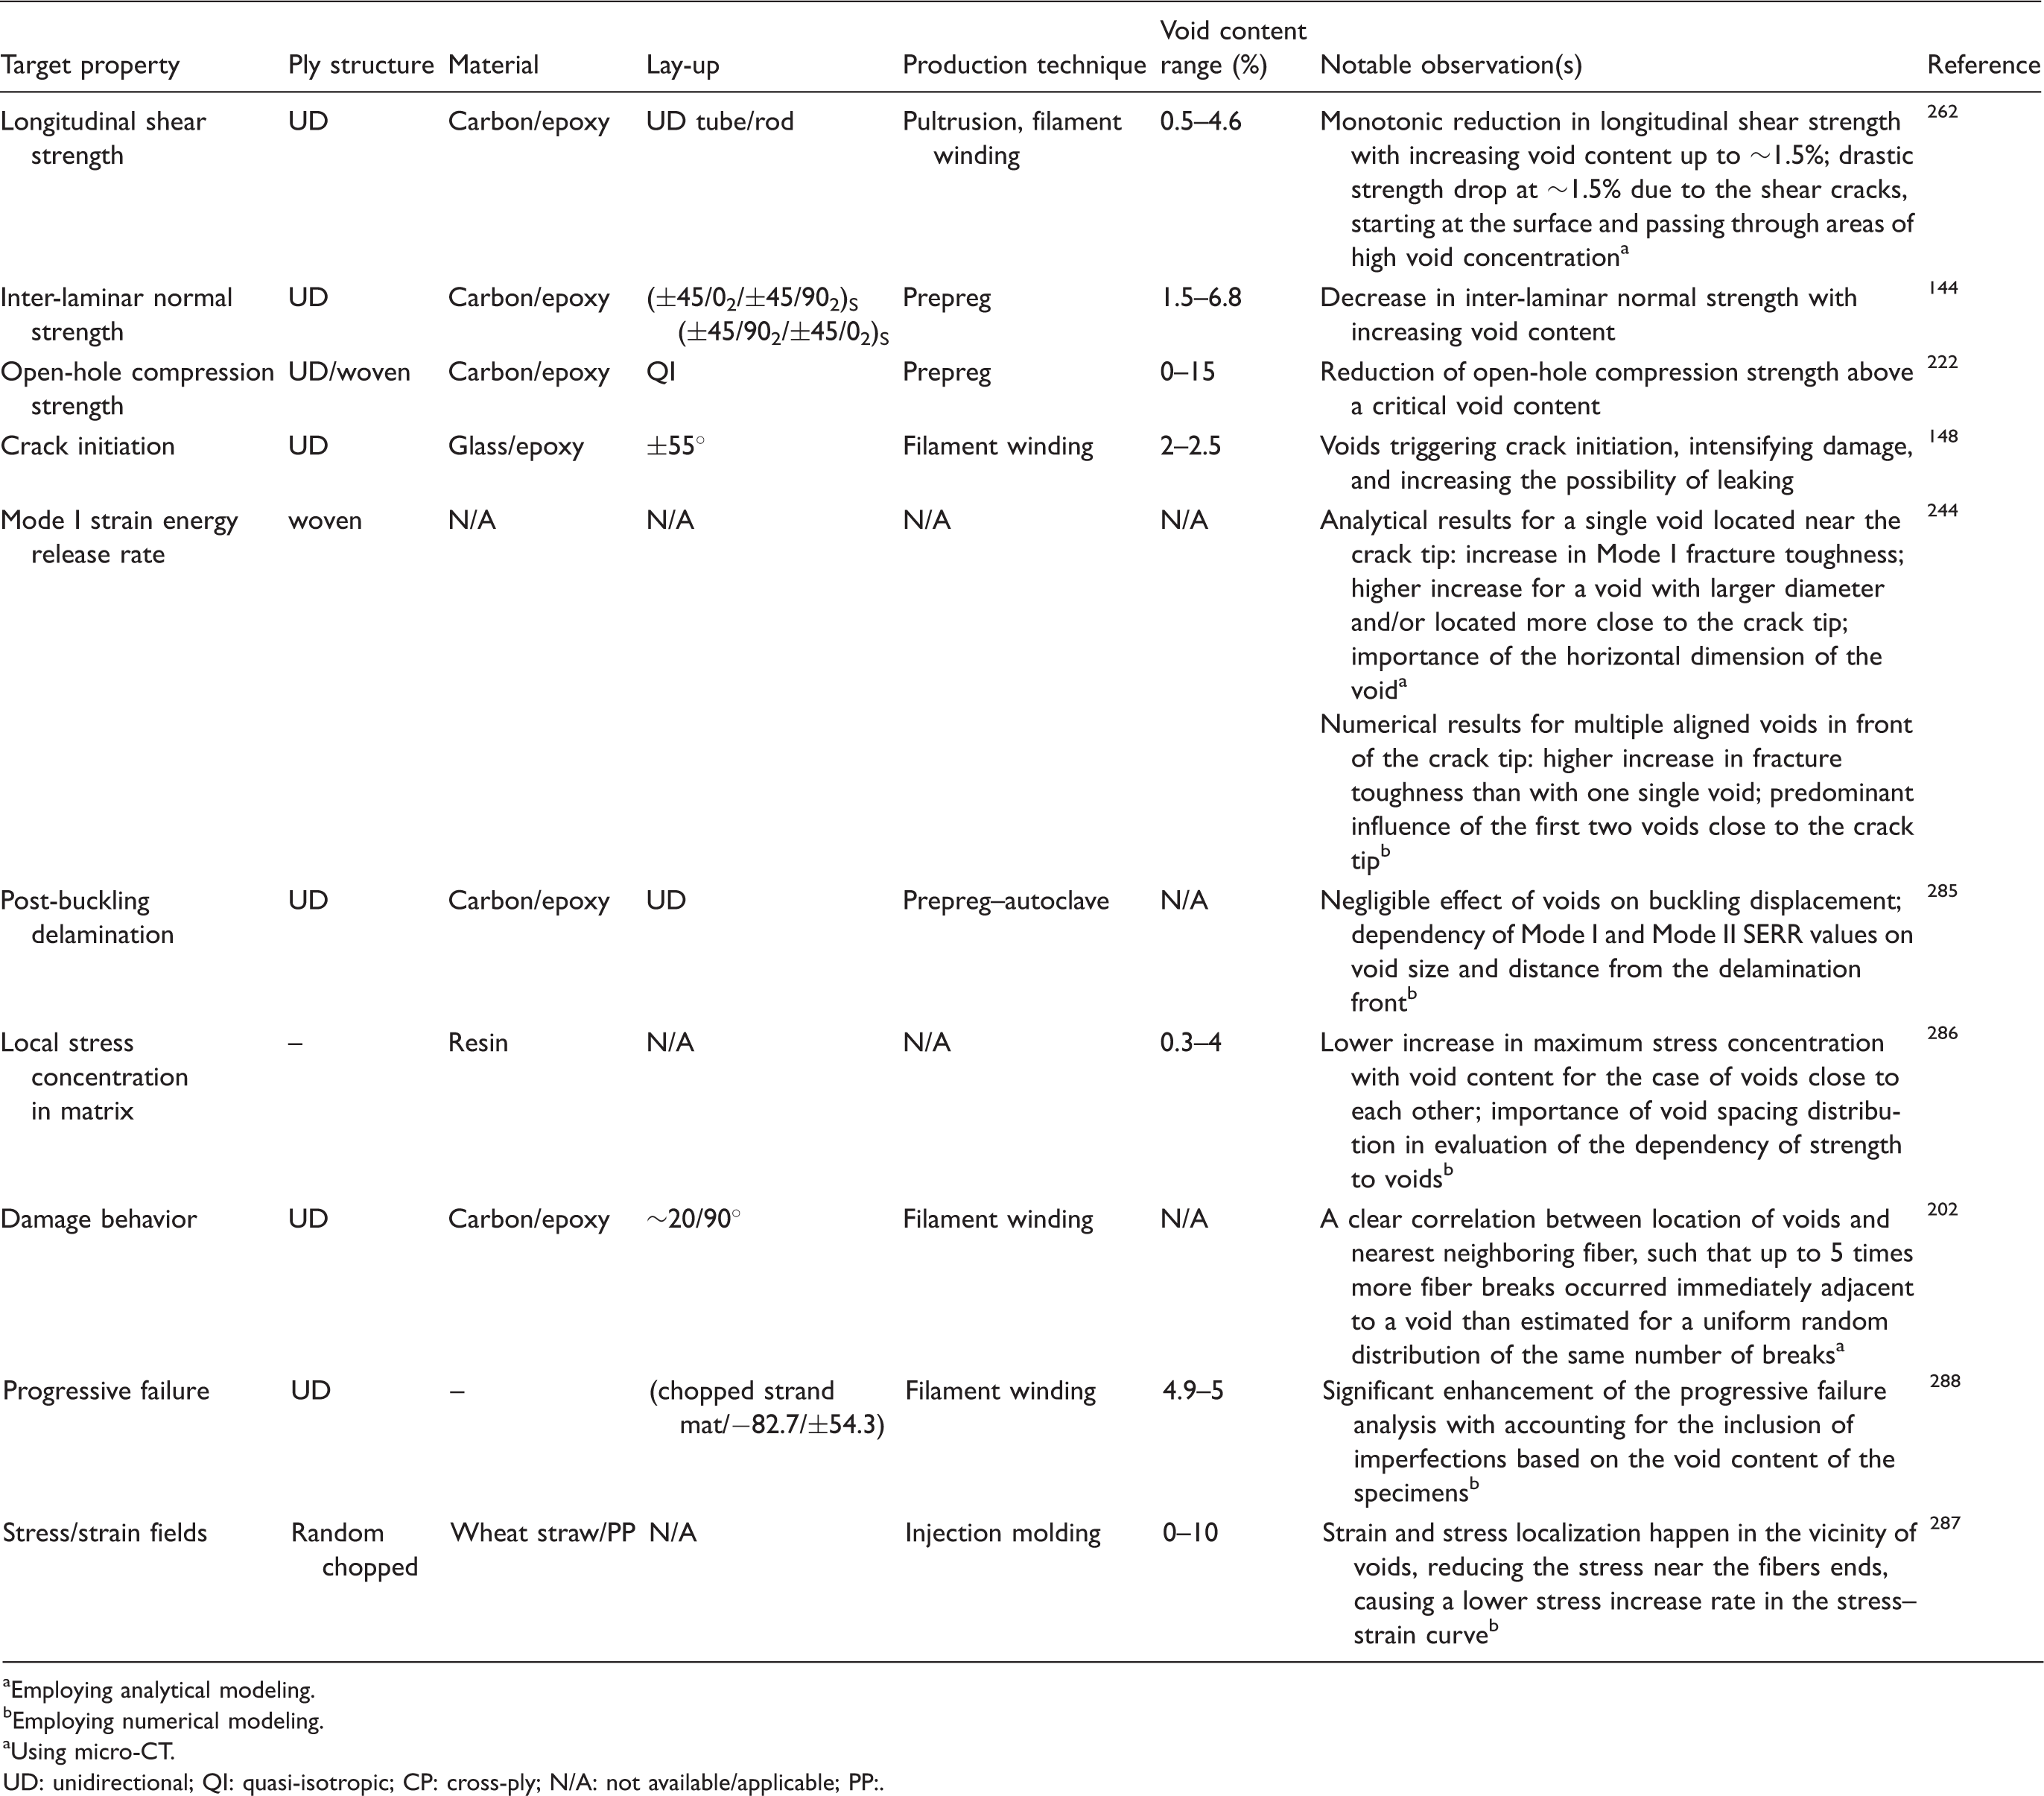
Employing analytical modeling.
Employing numerical modeling.
Using micro-CT.
UD: unidirectional; QI: quasi-isotropic; CP: cross-ply; N/A: not available/applicable; PP:.
Concluding remarks on the effect of voids on mechanical properties
There exists a vast pool of information on the effect of voids on mechanical properties of composites. The mostly affected properties are inter-laminar shear, compression, and transverse tensile strength, and fatigue life. These properties are affected with the deterioration up to 10% per 1% of the void contents increase, or even more for fatigue life. The experimental data in the literature allow a rough estimation of the loss of the load-carrying ability of a composite material due to voidage and the necessary modification of the design stress values or safety coefficients.
Although recent literature highlights the importance of analysis of all void characteristics (size, morphology, location, and spatial distribution, and not only void content) in investigation of effect of voids, there is a lack of quantitative generalizations of the voidage-related effect of defects in dependency on the void characteristics. For example, it is clear that the effect of voids on the transverse strength of a ply and the transverse crack density is caused by stress/strain concentrations around the voids. This effect manifests itself in change of the strength of laminates in the presence of voids and most notably in fatigue life of composites with voids. However, this understanding has not yet led to comprehensive models, which could link the deterioration of properties to the void characteristics, hence to the manufacturing conditions.
Numerical modeling techniques in studies on voids
For the prediction of the mechanical effects of voids, various empirical (e.g. in the literature 245 ) and analytical models (e.g. in the literature2,128,220,222,238,240,242,244,255,256,263,275,289) have been proposed. Recent progress with numerical techniques and increase in computational power have enabled researchers to increasingly employ numerical modeling, in particular the FE method, for investigation of the effects of voids in composite materials. In this regard, although few works have been carried out in the 1990s and 2000s (e.g. 2,145,224,257), most of the research on numerical modeling of materials with voids has been performed after 2012. In the current section, the studies are reviewed with the focus on the “techniques” and “considerations” in modeling of composites with voids. The “results” of these studies are stated in the Effect of voids on mechanical properties section. Abaqus FEA and ANSYS are two commonly used FE packages.
Prediction of voids' effects in the elastic regime
In one of the first studies, Dill et al. 145 used elastic FE simulation in order to determine the stress concentration factor caused by voids. They modeled a small disk void at the center of a laminate, consisting of orthotropic plies. A stress concentration factor of 1.85 was obtained at the void edge, which was close to the fatigue strength reduction factor for the specimens with voids. In the first numerical investigation of the influence of void morphology, Huang and Talreja 2 placed flattened cylindrical voids at the interfaces of a UD composite in a representative volume element (RVE) of eight-node hexahedral solid elements with homogenized properties and calculated the effective elastic moduli of the orthotropic laminate under periodic boundary conditions. The homogenized properties were calculated from a generalized self-consistent model, which could account for the higher fiber fraction around voids, resulting from voids pushing the surrounding fibers aside.
Van Den Broucke et al.
257
generated a woven geometry using the WiseTex software module and transferred it into an FE model by the tool FETex to make an 11-layer laminate. Assuming a linear increase in laminate thickness with voids as well as presence of voids in resin-rich regions between the yarns, they developed a tool for random selection of matrix elements to assign them as voids. For modeling the effect of voids on elastic properties of woven composites, Choudhry et al.
258
created their model based on the real geometry of the material, characterized by micro-CT. They accounted for the voids through multiplying the matrix input properties by a void compensation factor, i.e.
In a 2D plane-strain FE simulation for obtaining the transverse elastic properties of UD composites in the presence of voids (2D plane normal to the fiber direction), Nikopour 263 generated representative area elements with the fiber area fraction of 66% and void fractions of 0% and 8%. Fibers had a square array distribution and perfect bonding with the matrix, and voids were modeled as empty circles in the matrix in between the fibers. The models were meshed using the four-node bilinear quadrilateral elements. It should be noted that modeling 2D RVEs with voids under plane-strain conditions is only valid when dealing with elongated voids in the fiber direction. In a similar way, but with a 3D formulation, a hexagonal array of fibers, and using linear tetrahedral elements, Selmi 255 predicted the elastic properties of a UD composite.
In modeling of braided composites, Xu and Qian 259 developed a meso-FE-model of a 3D four-directional rectangular braided composite including randomly distributed voids in both the yarns and the matrix pockets. This distribution was based on a probability model to choose randomly a number of elements to represent voids. Thus, tetrahedron elements were used to provide as much similarity as possible to voids in terms of shape and size, as explained by the authors. With this formulation, four types of component materials were present in the model: pure matrix (isotropic), yarn (Chamis’s model), yarn voids (Chamis’s model with very low modulus and Poisson’s ratio for the matrix), matrix voids (very low modulus and Poisson’s ratio). The effective elastic properties were calculated by applying periodic boundary conditions in a homogenization approach for five different random void distributions and two different braiding angles. In a similar study, Dong and Huo 260 developed a two-scale approach, in which for a braided composite, the elastic properties of yarns and composite containing voids were calculated from a micro- and meso-scale RVE, respectively.
Srinivasulu et al. 261 used an automation program called ArtiComp to generate RVEs of discontinuous FRCs, containing randomly oriented fibers and voids. Voids were created by removing spheres or spheroids from the RVE, based on parameters such as the number, content (volume fraction), aspect ratio, and size distribution.
For calculating the strain concentration factor (ratio between the peak strain at the void surface and the global strain) in NCF composites, Carraro et al. 231 created 2D FE models of irregularly shaped voids in the 90° plies of a cross-ply laminae (2D plane normal to the 90° plies). The plies were modeled as a homogeneous and orthotropic material. The geometry of voids was extracted from micrographs through a MATLAB code, which also created the FE model automatically. The plies were meshed with eight-node plane elements, and displacement boundary conditions were exerted to simulate tension on the laminate. They argued that because the voids are elongated in the fiber direction it is reasonable to model them in 2D plane-strain conditions. Such a homogenized approach may not be correct for predicting the effect of voids on fiber-dominated properties. Maragoni et al. 219 generated a 2D FE model of a circular void lying beneath the top surface of a ply, including a hexagonal array of fibers (2D plane normal to the fiber direction) in order to obtain the orientation of the local nucleation plane (i.e. the plane on which a micro-crack lies) in the presence of voids. The multi-axial stress state was simulated with transverse and shear stresses, and periodic boundary conditions were applied along the fiber direction.
Strength prediction with voids
To estimate the effect of void length on ILSS, Wisnom et al. 224 used an FE approach, considering non-linear interfaces with both yielding and failure. Assuming yielding to be localized at the interfaces, the interfaces were modeled with non-linear spring elements, including a stress criterion for yielding and an energy release rate criterion for failure. With this modeling approach, they could overcome the incapability of linear elastic fracture mechanics in predicting failure.
In order to study the effect of voids on local failure of woven composites, Ricotta et al. 244 developed a 2D FE model to explore Mode I inter-laminar fracture toughness in a DCB test in the presence of voids of different dimension, shape, and distribution with regard to the crack tip (2D plane normal to the crack width). The plane-strain FE model considered the woven plies as a transversely isotropic material and employed the VCCT technique for delamination. The elements in front of the crack tip had a regular shape and a size of 1/20 of the void radius. A similar approach was employed by Zhuang and Talreja 285 for numerical analysis of the effect of voids on post-buckling delamination growth. They developed a 2D FE model of a plate, containing one delamination and one elongated void ahead of each delamination front, loaded under axial compression (2D plane normal to the crack width). Voids were modeled as through-width cutout regions parallel to the delamination, having the shape of a rectangular with semi-circular caps at the ends. The VCCT technique was employed in order to obtain the fracture toughness values.
McMillan 286 conducted a 2D numerical investigation on knock-down strength of resin-rich areas, where idealized elliptical voids were modeled as holes in a homogenous matrix. In a similar approach, but including short non-aligned fibers, Kern et al. 287 modeled spherical voids distributed in the matrix.
In order to model the voids as distributed in real composites, Nikishkov et al. 196 developed 3D FE models of short-beam-shear and curved-beam specimens, produced with automatic transition of micro-CT data including voids. In a global model, elements that overlap with a void were degraded by significantly reducing their inter-laminar tensile stiffness and inter-laminar shear stiffness. A modified LaRC04 fracture toughness-based failure criterion was employed. The global models of short-beam-shear and curved-beam specimens had respectively 42 and 31 linear eight-node reduced integration elements through the thickness. Assuming frictionless contact with the loading rollers, the material behavior was introduced through a User-defined MATerial model (UMAT). In order to predict accurately the failure load level of curved-beam specimen, a local model was developed for the critical voids identified with the global model. The local model had a more accurate geometry (3D ellipsoid) of the voids, around which mesh refinement was defined. In order to assure a precise failure prediction, point-stress and average-stress methods were combined with the LaRC04 failure criteria, denoted as point-damage and average-damage methods. The model was discretized with linear eight-node reduced integration elements, and displacements from the global model were exerted as the boundary conditions. This methodology was also used by Seon et al. 197 for analysis of inter-laminar tensile fatigue behavior.
For random-chopped FRCs, Yang et al. 235 derived a micromechanical constitutive equation considering voids based on the effective stiffness tensor of the composites containing UD fibers, using orientation averaging. The composite was assumed to consist of six elastically distinctive phases: (0) matrix, (1, 2, 3, and 4) discontinuous randomly oriented fibers with different levels of damage, and (5) voids. They implemented this micromechanical model through a UMAT into an FE model of a coupon-shaped tensile specimen.
In a simple numerical methodology, Fedulov et al. 268 incorporated the change in strength values of a ply in the presence of voids, which was estimated based on the experimental data. A smooth defect-dependence curve for first-ply-failure versus void content was obtained by varying the void content from zero to a chosen maximum for several FE simulations. The ultimate strength of laminates with voids was predicted using Zinoviev’s damage model. In a macro-level FE analysis, Zhang et al. 252 predicted the strength of a laminate including voids, using the improved Hashin failure criterion. As the ply-level input, they prescribed the tensile, compressive, and shear strength values for different void contents. However, the measurement of the input strength values as a function of void content is not explained well.
Chowdhury et al. 265 generated a 2D FE model with one-quarter of fiber and one-quarter of void in the corners (2D plane normal to the fiber direction). The polymer matrix was modeled with an improved macromolecular physics-based model, accounting for rate-, pressure-, and temperature-sensitive yielding, isotropic hardening before peak yield, intrinsic post-yield softening, and rapid anisotropic hardening at large strains. In addition, a crazing model was incorporated, accounting for craze initiation, craze growth, and craze breakdown. An energy-based debonding criterion was used for the fiber/matrix interface. The fiber was modeled with glass fiber properties and the matrix with those of PMMA. The fact that fiber volume fraction and void content were equal as well as the large distance between the fiber and the void is too unrealistic to link the modeling results to the composite global properties.
In a computational micromechanics study with voids and damage development, Ashouri Vajari et al. 266 modeled micro-voids in two types: trapped between fibers – irregular shape, and dispersed in matrix – circular, inside a 2D periodic RVE of UD fibers and matrix. While the fiber volume fraction was fixed to 60%, RVEs with the void content of 0%, 1%, 2%, and 5%, and the average void radius of 0.2, 0.3, and 0.4 of the fiber radius were generated. Fibers were modeled with isotropic and elastic properties of glass fiber, whereas for the matrix an isotropic modified Drucker–Prager model with epoxy properties was employed. The fiber/matrix interface was modeled by a cohesive zone model, using a trilinear traction–separation law. Fibers and matrix were meshed with three-node isoparametric triangles, while four-node interface elements were used for discretization of the interfaces. The focus was the effect of voids randomly distributed in the matrix. In a later study, Ashouri Vajari 267 used the same methodology, but for 3D RVEs with small thickness, where interface elements were modeled with 3D bilinear cohesive formulation.
For analysis of transverse tensile strength, Tserpes et al. 200 developed a multi-level numerical approach, in which voids were modeled in two consecutive levels: RUC1, accounting for voids with less than 1 mm maximum size, which are spherical and randomly distributed in pure matrix; RUC2, considering voids larger than 1 mm, which are clustered into one large cylindrical void inside pure matrix. Both modeling levels employed an isotropic hardening model and Christensen failure criterion, but RUC2 uses the resulting stress–strain curves of RUC1 as the input. Finally, for modeling the macro-specimens, the material properties of UD plies with voids were calculated using analytical micromechanics (Chamis’s formulas) with matrix properties obtained from RUC2 as the input.
For modeling of the compressive failure affected by voids, Liebig et al. 227 generated a 3D longitudinal FE model of a quarter of the model composite (see the Compressive failure section), considering discrete fibers, among which a single void was placed. Non-linear behavior for the matrix was implemented using stress–strain data points of a compression test. The fiber/matrix interface was modeled with four-node cohesive elements with a bilinear law. Fibers and matrix was meshed with eight-node solid elements. A constant displacement is applied to the outer surface of the model to simulate the axial compression.
For simulation of the effect of voids on transverse cracking, Mehdikhani et al. 278 developed a combined-scale approach. At the micro-scale, a single void was modeled among hundreds of fibers randomly distributed in a 3D RVE with small thickness. Transverse tension was applied to the micro-model, which considers plasticity and pressure-dependent damage for the matrix. The resulting transverse stiffness and strength as well as fracture toughness, degraded by the void, were assigned to the void regions that were randomly distributed in a meso-level model of a cross-ply laminate, using extended FE method. The approach allowed investigation of crack density evolution with the applied strain.
Concluding remarks on numerical modeling techniques in studies on voids
Detailed numerical models of voids in FRCs are emerging in the last decade, taking advantage on the advanced characterization methods such as micro-CT (increasing the reliability of the geometrical input), progress with numerical methods of damage modeling in composites, and a leap in the computing power, which allows handling of large problems with heterogeneities and non-linearity routinely.
The detailed models deal with isolated voids and concentrate on the “short range” effect of a void on the stress–strain state, which allows creating a damage map around the void. How this damage affects the behavior of the composite in larger volumes, for example how the overall strength or fracture toughness changes, can be called the “far range” effect. Another complication is the presence of void assemblies, which are characteristic especially for voids at interfaces and which can seriously affect the “short range” damage development. The “far range” effects and void assemblies will get in the focus with advancement of (preferably non-local) damage models and computational power: damage models will allow physically sound calculations of homogenized damage parameters in the presence of not-fully-periodic damage, and computational power will enable calculations with micro-models including thousands of fibers, which will bring in the scale of inter-void distance.
An important limiting factor in the reliability of the models is the identification of the damage-controlling input parameters at the micro-scale, for example, the parameters for the cohesive zone model being used at the micro-level, which must use SERR, measured in a test on micrometer scale.
Conclusions
Intensive research on voids in fiber-reinforced polymer composites – formation, characteristics, and effects on the composite mechanical performance – is driven by industrial relevance of the effect-of-defects. This relevance is boosted by a rapid influx of composites in new application areas and fast growth in composites production volumes, which makes the quality requirements decisive in competition and success of applications. The advent of OoA manufacturing, which is more prone to voidage, also pushes the interest in better understanding the effect-of-defects.
Five decades of research on voidage have created a plethora of experimental data on all aspects of the problem and certain level of understanding, generalization, and modeling capabilities for the formation, morphology analysis, and effects of the voids. It is definitely possible to have estimations on the effect of the given void content on mechanical behavior and choose, according with this estimation, design limits and criteria which treat the material “as manufactured”. This opens way to “manufacture-aware design for performance” of composite parts.
However, this understanding of the void formation and effects and predictive capabilities (as opposite to evaluations) of modeling tools are still far from maturity. With a push from industry for more robust manufacturing processes, for less variability of properties, and for more reliable, safe, and sustainable design, the studies of voidage will for sure be sustained and most probably intensified in the near future.
Footnotes
Acknowledgements
SV Lomov is Toray Professor for Composite Materials at KU Leuven; the support of the Chair of the work reported here is gratefully acknowledged. Moreover, the constructive feedback of Dr Helge Pfeiffer on the Ultrasonic Testing Section is appreciated.
Declaration of Conflicting Interests
The author(s) declared no potential conflicts of interest with respect to the research, authorship, and/or publication of this article.
Funding
The author(s) disclosed receipt of the following financial support for the research, authorship, and/or publication of this article: The authors gratefully acknowledge SIM (Strategic Initiative Materials in Flanders) and VLAIO (Flemish government agency for Innovation and Entrepreneurship) for their support of the IBO project M3Strength, which is part of the research program MacroModelMat (M3), coordinated by Siemens (Siemens PLM Software, Belgium). They also acknowledge the KU Leuven Research Council for the C24/16/021 funding, supporting the “open access” publication of the article.