
Abstract
Resin transfer moulding is one of several processes available for manufacturing fibre-reinforced composites from dry fibre reinforcement. Recently, dry reinforcements made with Automated Dry Fibre Placement have been introduced into the aerospace industry. Typically, the permeability of the reinforcement is assumed to be constant throughout the dry preform geometry, whereas in reality, it possesses inevitable uncertainty due to variability in geometry. This uncertainty propagates to the uncertainty of the mould filling and the fill time, one of the important variables in resin injection. It makes characterisation of the permeability and its variability an important task for design of the resin transfer moulding process. In this study, variability of the geometry of a reinforcement manufactured using Automated Dry Fibre Placement is studied. Permeability of the manufactured preforms is measured experimentally and compared to stochastic simulations based on an analytical model and a stochastic geometry model. The simulations showed that difference between the actual geometry and the designed geometry can result in 50% reduction of the permeability. The stochastic geometry model predicts results within 20% of the experimental values.
Keywords
Introduction
Automated methods of fibre deposition are in high demand by the composites industry owing to their ability to reduce waste and increase deposition rate when compared to hand lay-up.
1
Automated Fibre Placement (AFP) and Automated Dry Fibre Placement (ADFP) are designed to place several narrow fibre tows (prepreg slit tapes or dry fibre slit tapes with a binder) simultaneously by applying heat to the tows and consolidating them with a roller.
1
An inherent feature of AFP and ADFP preforms is the presence of gaps and overlaps between the tows. Gaps and overlaps can be considered to be defects as they introduce resin-rich or fibre-rich areas and can lead to reduction of mechanical properties of the composite.
2
In some preforms, gaps are deliberately introduced to avoid overlaps, which are caused by variable tow width, defects in ADFP process or tow steering. The programmed gaps can also be used to control permeability and resin infusion as implemented in production of wings and wingbox of MS-21 aircraft.
3
However, presence of variability in the ADFP lay-up and gap widths in particular, which is clearly visible in a sample lay-up shown in Figure 1, results in uncertainty in the permeability of the preform. This uncertainty in the permeability is known to propagate into variability of the fill time as well as to be the source of the defects such as dry spots or incomplete impregnation.4,5 For preforms manufactured with ADFP, no data are available on the variability of either the preform geometry or the permeability. This article presents the first detailed study of an ADFP preform geometry with a particular focus on variability of gap width and associated variability of permeability.
Programmed and unintended gaps in ADFP preform. ADFP: Automated Dry Fibre Placement.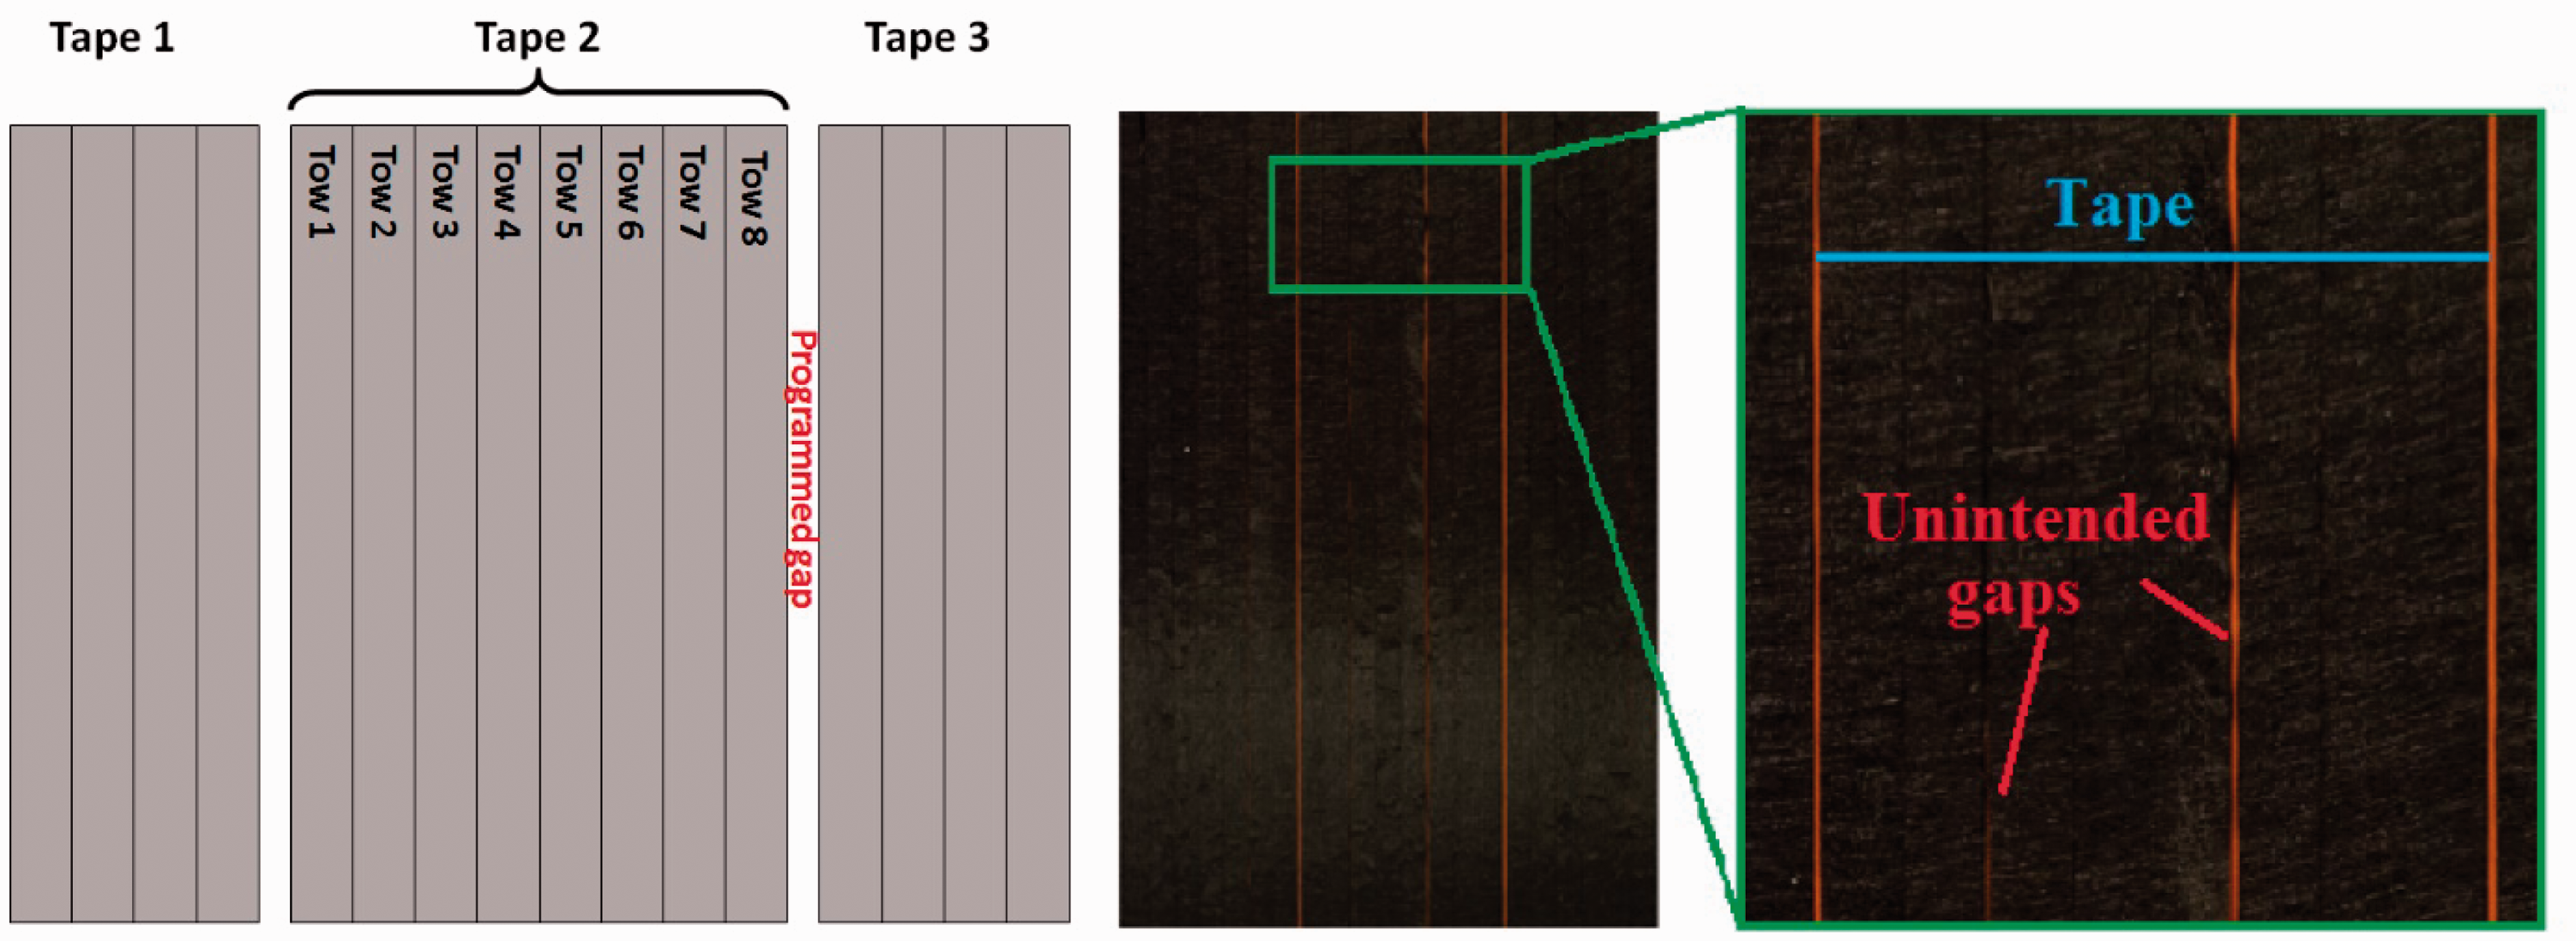
The key objective of resin injection is to achieve the complete impregnation of a preform with no dry spots within the target time. 4 Costly ‘trial and error’ procedures can be avoided and the scrap rate can be reduced by employing numerical simulations for the optimisation of the filling time, pattern and design of resin injection strategies, i.e. position of vents and gates. However, practical experience of composite manufacturing shows that the time to fill the preform and outcomes of resin injection can be variable even for a single geometry and injection strategy, owing to uncertainty of the preform and the process. The uncertainty of permeability can be attributed to the imperfect lay-up, race-tracking, variability within the preform and human errors. 6 While all of these sources of variability remain relevant for composite manufacturing, this article focuses on variability of preform permeability owing to geometrical variability. The variability of geometry of a non-crimp fabric 7 and various woven textiles8–15 has been studied by means of image analysis. Most of those studies attempted to describe the amplitude and the correlation length of the variability. Experimental data from those studies were used in the models of textile reinforcements with variability in the geometry and used for prediction of probability of draping outcomes, 8 distribution of mechanical properties 12 and permeability.7,16–20 In particular, it was demonstrated that the mould fill time can be several times longer than the fill time in the deterministic case. 18
The geometry of a dry reinforcement can be described by a model where tow position, tow width and other details are described by a set of random variables, which may be mutually independent or can be correlated. Both uncorrelated and correlated models of the geometry variability have been used to predict distribution of permeability of dry reinforcements.7,17–21 The uncorrelated model of the geometry used by Wong et al. 19 predicted the coefficient of variation (CoV, the ratio of the standard deviation to the mean value expressed as a percentage) of permeability to be 3%, which is lower than the variability observed in experiments. However, for the case of a non-crimp fabric, it was shown that the correlation length of the yarn path has a significant effect on the average permeability as well as its variability. 7 It was shown that the average permeability can be significantly different from the permeability of an idealised reinforcement. Similar conclusions were drawn by Park and Tretyakov 20 for the 2D flow through reinforcement with variability in permeability. In addition, it was shown that the shape of the correlation function also has an effect on the fill time and its variance. It can be concluded that characterisation of the geometry of a reinforcement is required before permeability can be reliably predicted. The detailed characterisations of textile reinforcements, including correlation lengths, can be found in the literature.8–12,14 However, no such data are available for ADFP preforms which are inherently different from woven reinforcements.
This work presents statistical characterisation of ADFP cross-ply preforms including acquisition of meso-scale geometry, experimental characterisation of permeability and stochastic modelling of the permeability. The article aims to understand the relationship between the variability of the meso-scale geometry and the permeability of the preform. ‘Characterisation of ADFP preform’ section presents manufacturing and data acquisition methodologies, the statistical description of the ADFP geometry and permeability experiments. Since the geometry of the ADFP preform is relatively simple when compared to a woven preform, the problem reduces to characterisation of the flow channels, or gaps, between the tapes. This assumption is used in ‘Permeability modelling’ section where an analytical permeability model of a deterministic ADFP geometry, based on the available models,22–24 is described. The model simplifies the problem of the flow through the ADFP preform, utilising the concept of parallel-series connections. This permeability model is then used in ‘Variability modelling’ section as the basis for Monte Carlo simulations of permeability of ADFP preforms with geometry variability using the statistical geometry descriptions from ‘Characterisation of ADFP preform’ section. In ‘Discussion’ section, modelling results from ‘Variability modelling’ section are compared with the results of permeability experiments, limitations of the considered model are discussed and special attention paid to practical aspects of the design of ADFP preforms. Conclusions are given in the final section.
Characterisation of ADFP preform
Materials and experimental programme
The material used in this study was dry 24 K carbon fibre tows with areal weight 194 g/m2, width 6.35 mm and nominal thickness 0.25 mm. The tows are coated on one side with a proprietary thermoplastic binder. This material was used to produce two fibre preforms as described in ‘Experimental setup’ section. The manufactured preforms were characterised by moulding several small samples and taking micrographs of their cross-sections. The preforms were also characterised during the manufacturing process by taking optical images of every layer (‘Optical characterisation of preform geometry’ section) and analysing its statistical properties (‘Statistical properties of preform geometry’ section). Finally, the permeability of the preforms was measured as well (‘Experimental characterisation of in-plane permeability’ section).
Experimental setup
Two identical dry fibre ADFP preforms were manufactured using a Coriolis AFP machine using the dry tows described before. The machine was set to lay down straight tapes of eight tows each of 1-m length and with a programmed gap of 1 mm between tapes to avoid possible overlaps. The tapes, when laid parallel, formed layers which formed a preform. A cross-ply design of 16 layers (0°/90°)8 was chosen for ease of manufacturing, characterisation and modelling. Each layer had a regular shift of 3.5 tow widths relative to the previous layer of the same direction as shown in Figure 2. Thermoplastic binder on tows was melted using a laser system mounted on the lay-up head and tows were consolidated with 200 N force applied via a soft roller. The laser power was set to 800 W which gave a surface temperature of around 200℃ at lay-up speed of 0.8 m/s and around 320℃ at lay-up speed of 0.4 m/s. The first layer of each preform was laid down at a speed of 0.4 m/s to ensure good tack and conformance between the tapes and substrate. All other layers were laid down at 0.8 m/s (except layers 2, 3 and 4 in Preform 1, which were laid down at 0.6 m/s). The effect of the lay-up speed is not studied in this article. The size of the two preforms was 1 × 1 m which ensures that a sufficiently large part of the lay-up is free from edge effects.
Typical cross-section of RTM sample in the 0° direction (top); an example of overlap between two tows in vacuum bagged sample (bottom). RTM: resin transfer moulding.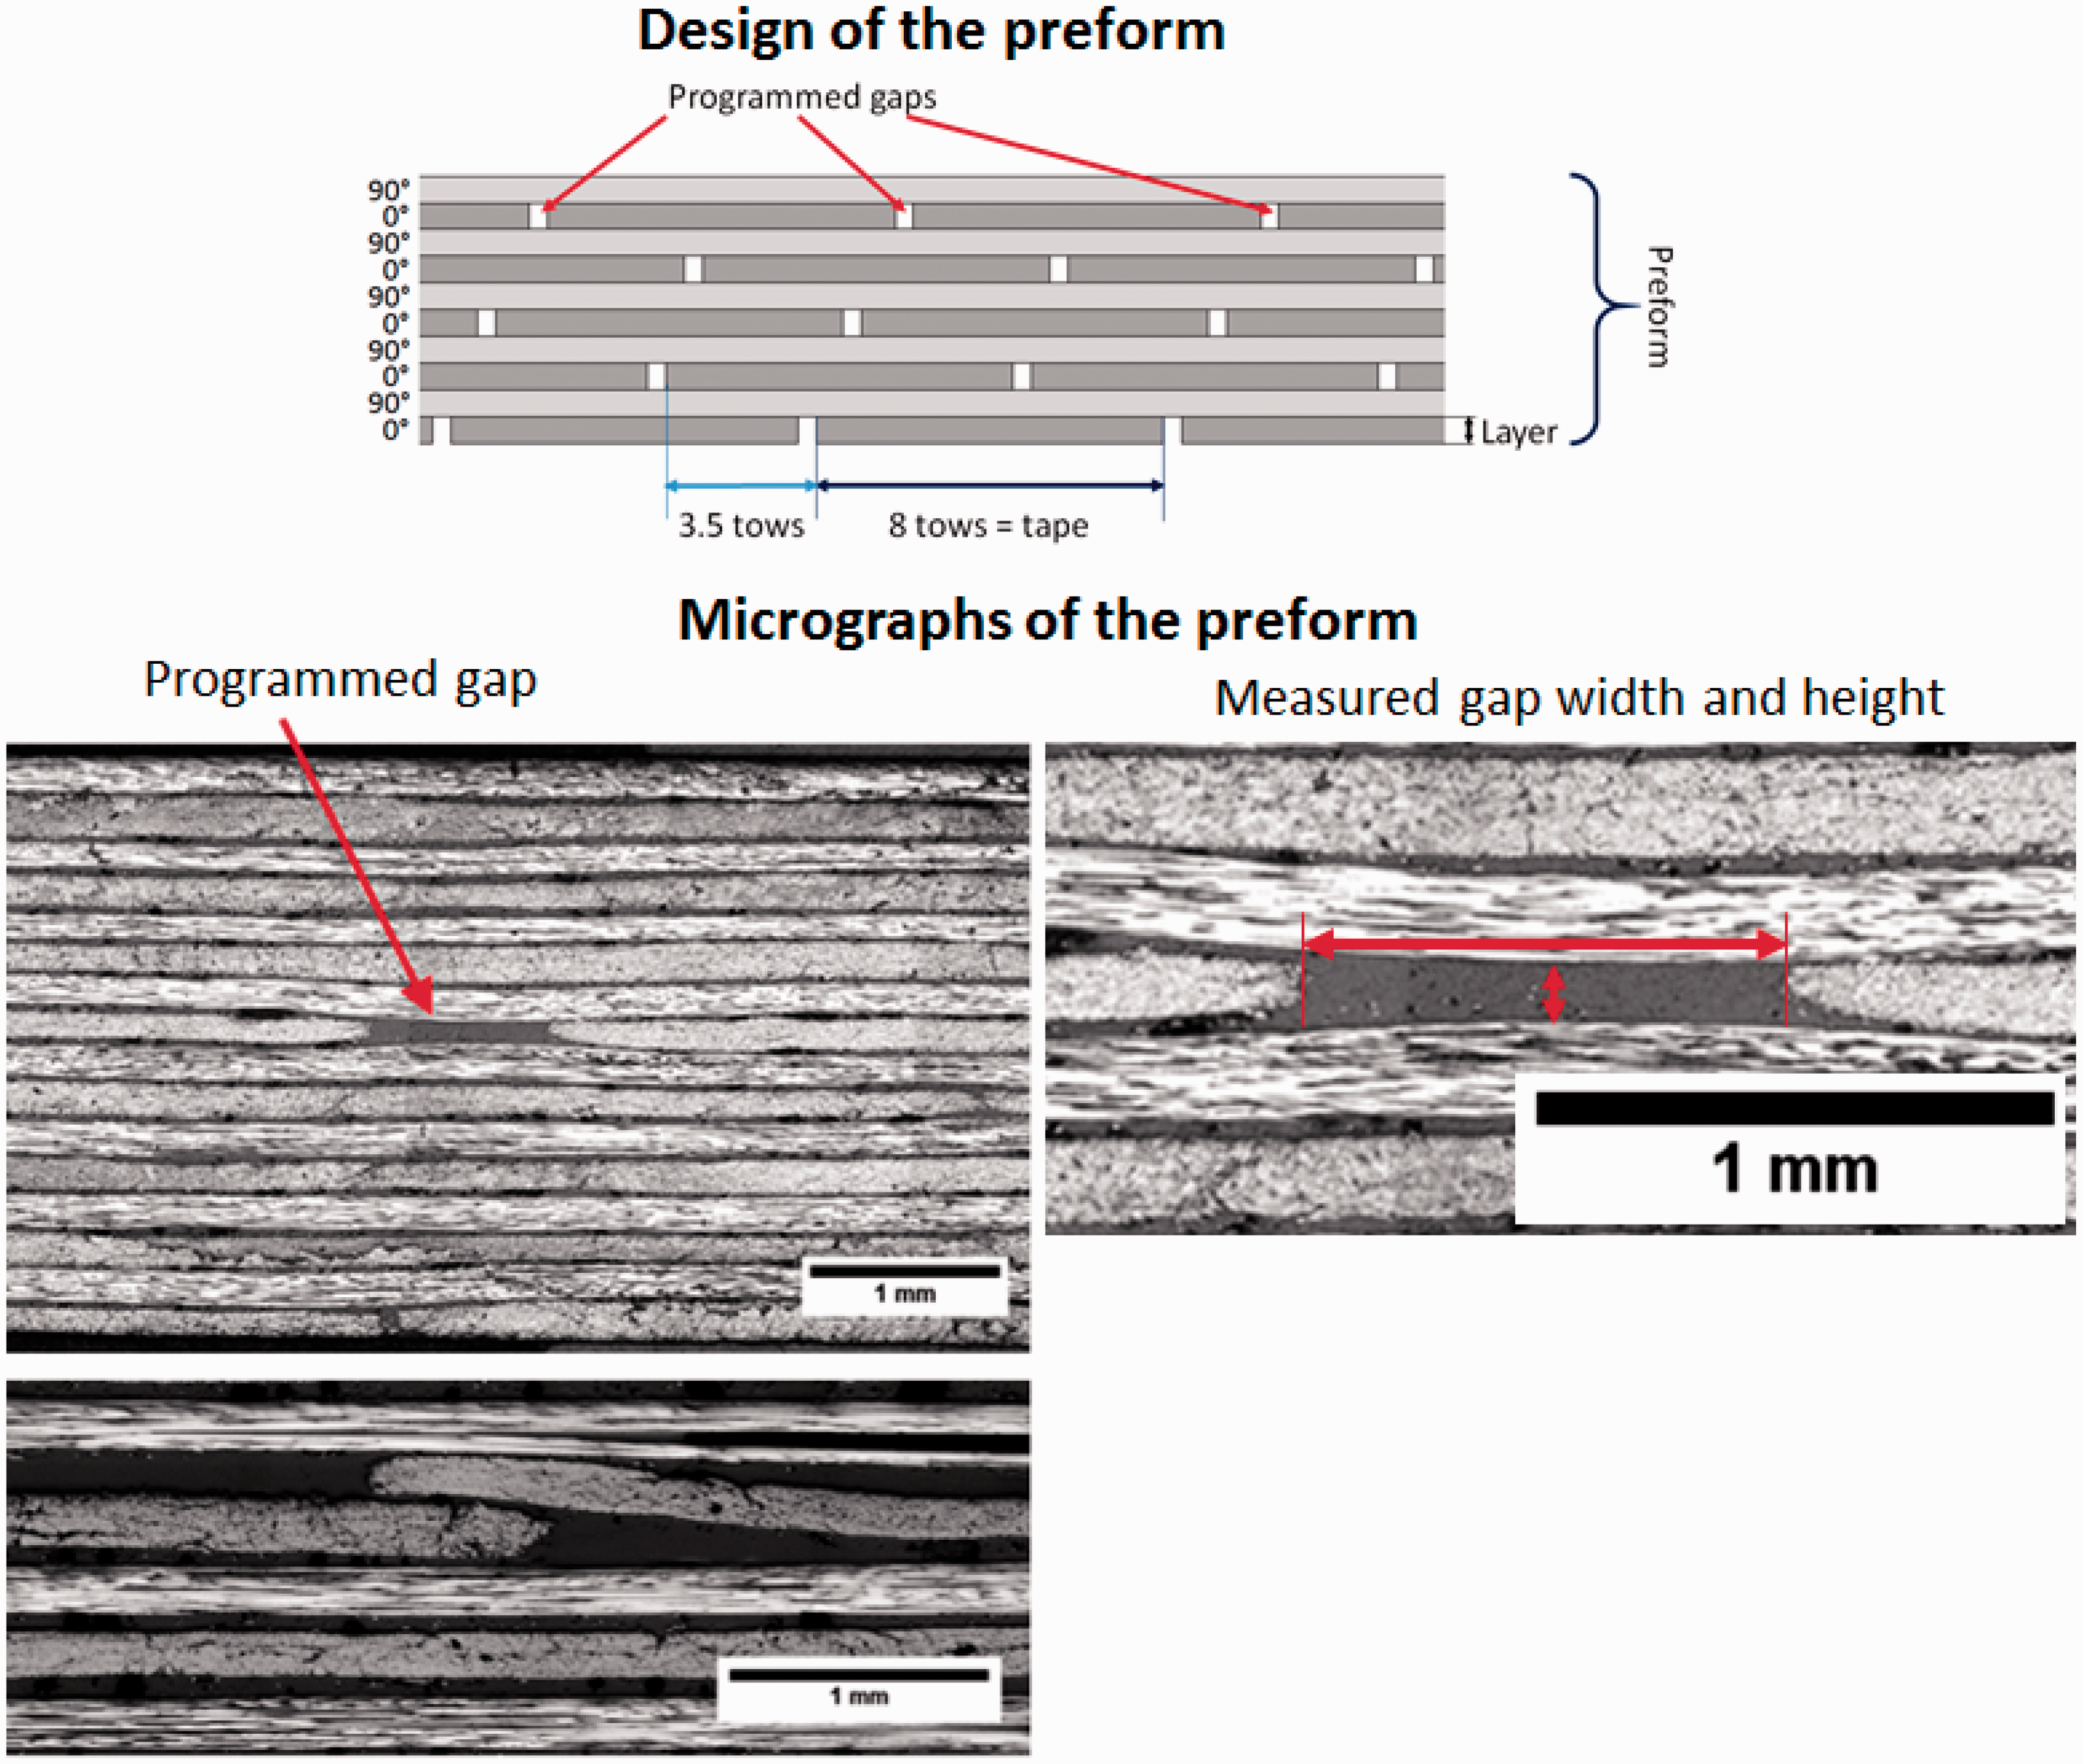
Optical characterisation of preform geometry
Samples from Preform 1 were infused with Prime 20 LV resin using resin transfer moulding (RTM), cast into polyester resin and prepared for optical microscopy. Distinctive programmed gaps, small gaps between tows within tapes and an unintended overlap of tows can be seen in Figure 2. Note that the programmed gap has a height lower than the tow thickness due to compaction of the material into the gap. The gap height was measured at the minimum distance between the tows in the gap and the average of the 25 measurements resulted in an average gap height of 0.16 mm. A scatter plot of the gap height against gap width as measured on the micrographs is shown in Figure 3. It can be seen that there is a tendency for wider gaps to have lower gap height but some of the narrow gaps also exhibited low gap height. It can also be noted that the variance of the gap height seems to be larger for narrow gaps. The absence of more detailed data makes it difficult to assume an adequate mathematical model for the gap height.
Scatter plot of gap width against gap height.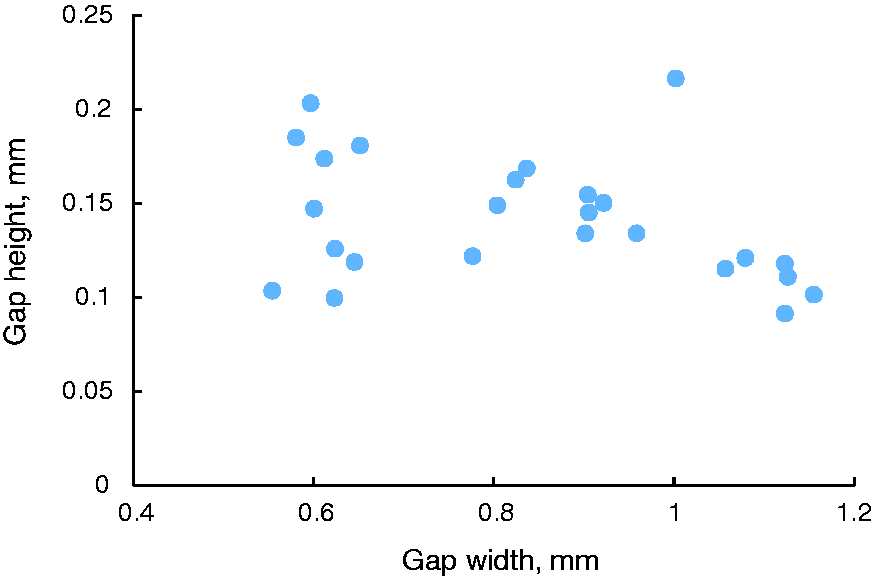
Characterisation of geometry of fibre reinforcement can be performed using various methods such as optical imaging. A detailed image of each layer of both preforms was acquired by pausing the AFP machine, mounting a 24 MPix DSLR camera on a robotic arm and taking 84 images covering the entire area of the 1 × 1 m preform with some overlaps. Resolution of raw images was around 35 µm per pixel. The first image of each sequence included an image of a coordinate marker (checkboard pattern fixed at the lay-up table during all experiments) and the calibration target with checkboard pattern. After images of the layer surface were acquired, the AFP lay-up process was continued until the next layer was finished.
Characterisation of the geometry of textile reinforcement preforms has been performed using various methods, e.g. microcomputed tomography (micro-CT) for smaller samples when high precision is needed
15
and optical imaging for large samples.
11
Development of the high-rate deposition processes such as AFP/ADFP require faster inspection techniques for online evaluation of the layup quality, e.g. laser profilometers and video-optical methods.
25
However, an optical imaging technique was selected as neither profilometers nor video-optical measurements provide greater precision and might require longer calibration. The images of the preform were used to extract exact positions of the tape edges in order to measure the gaps between them. Raw camera images were processed using a range of MatLab tools. The processing algorithm for images of each layer was as follows:
Remove lens distortion from all images;
26
Calibrate images in each layer into a plane parallel to the tool surface using the calibration target and calculate the scale of each layer; Find exact image overlaps, i.e. relative shifts using Fourier correlation of images; Perform edge detection algorithms11,12 on each image separately to extract tape edges; Combine detected tape edges together using information from Step 3.
An example of the image and automatic detection of the gap edges is shown in Figure 4. The contrast between tows belonging to current and previous layers was achieved by placing a powerful source of light perpendicular to the fibre direction in the current layer. However, binder veil, which is used for tow coating, reflects light in every direction, so adjacent tows blend together on the images. Therefore, precise detection of the edges between adjacent tows was not possible. Owing to the use of the directed light sources, the images had significant non-uniformity of brightness, which resulted in systematic variation of the gap width measurement. The regions obscured by systematic errors or susceptible to large errors were discarded, still leaving a large set of data for the analysis.
Example of the gap edge detection using automatic image analysis system.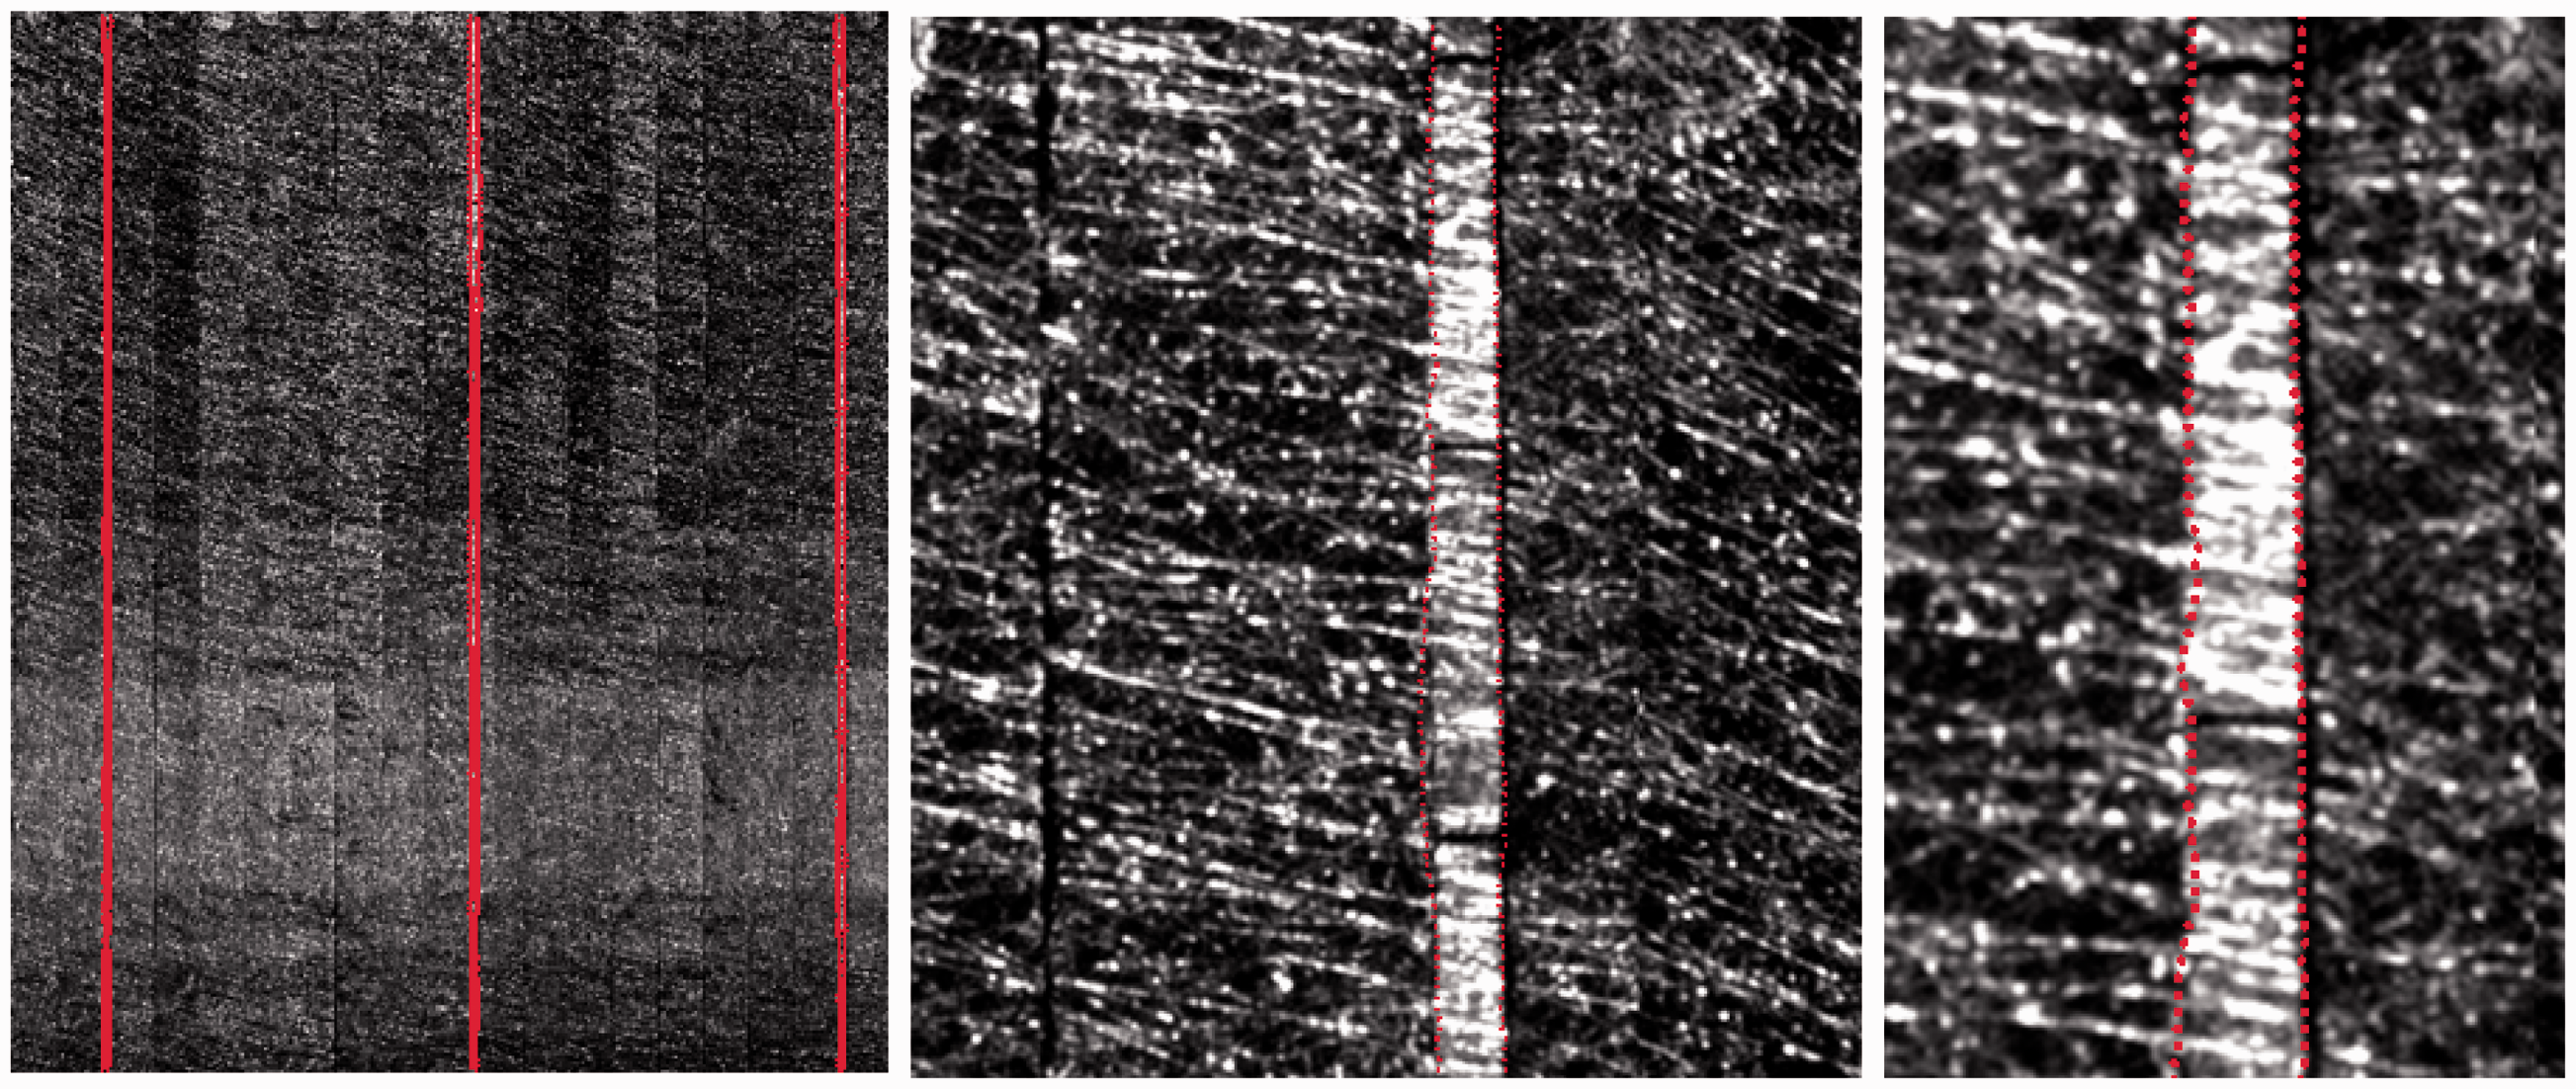
Statistical properties of preform geometry
It was noted in ‘Introduction’ section that the permeability of a preform is affected mainly by the width of the channels within the preform as it affects porosity, which is related to permeability as described by the Kozeny-Carman model.
27
The gap width registered within the ADFP preform represents the cumulative variability of the tow width, unintended gaps between tows and imprecision of the lay-up. Two representative layers from each of the two ADFP preforms are considered. Layers of the preforms are referenced as PkLl-m, where k is the preform number (1 or 2), l is the layer number (1 or 3) and m is a subset (corresponds to a column of images) within the layer. A diagram of the images and subset positions is shown in Figure 5. The data set for each layer consists of seven subsets with measurements of width of 17 gaps with 80-mm length each.
Scheme of the images and subset of images for characterisation of preform geometry.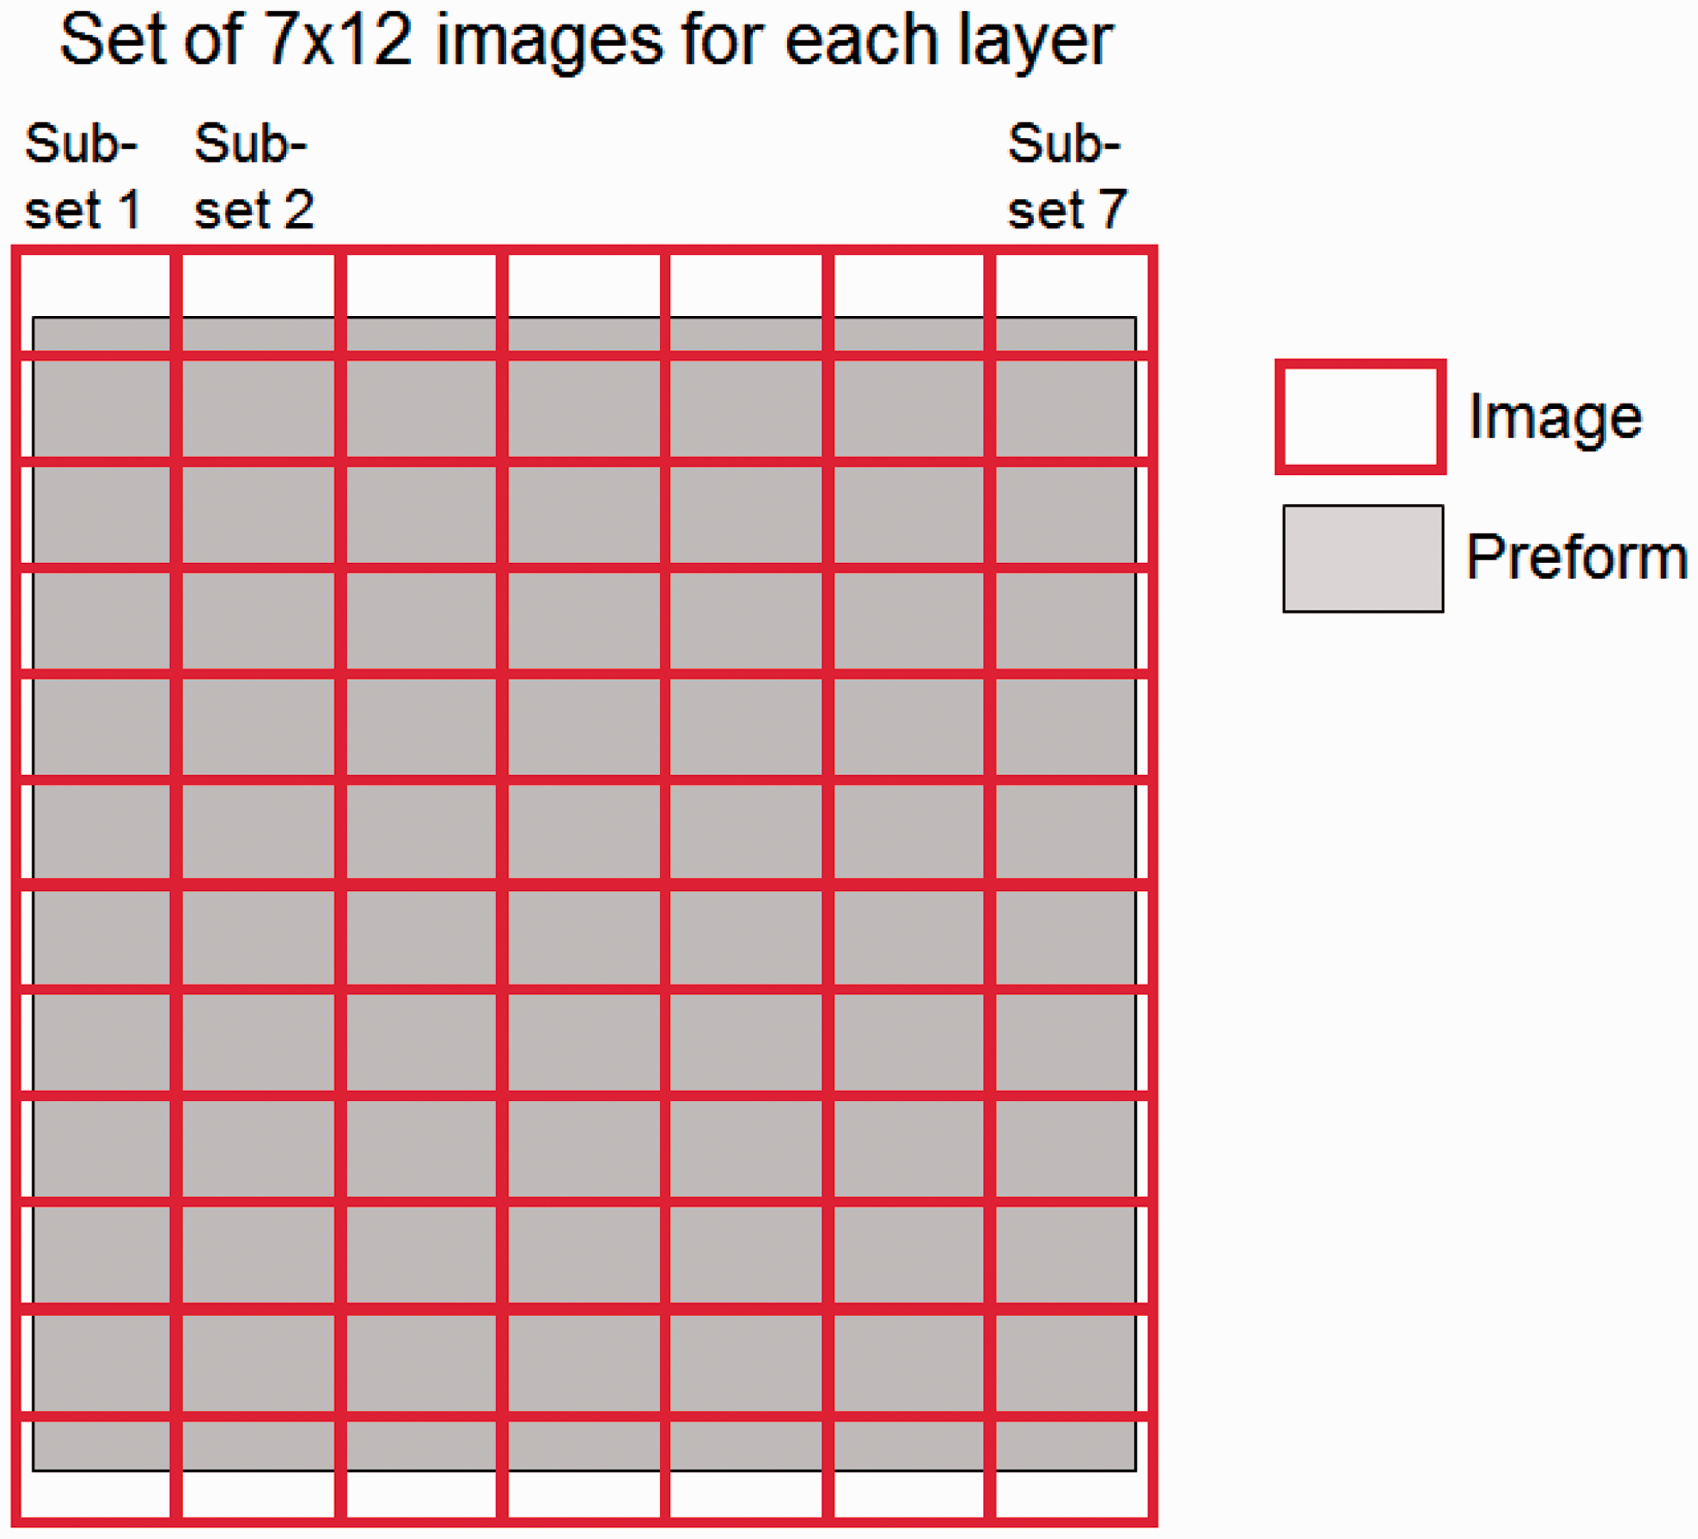
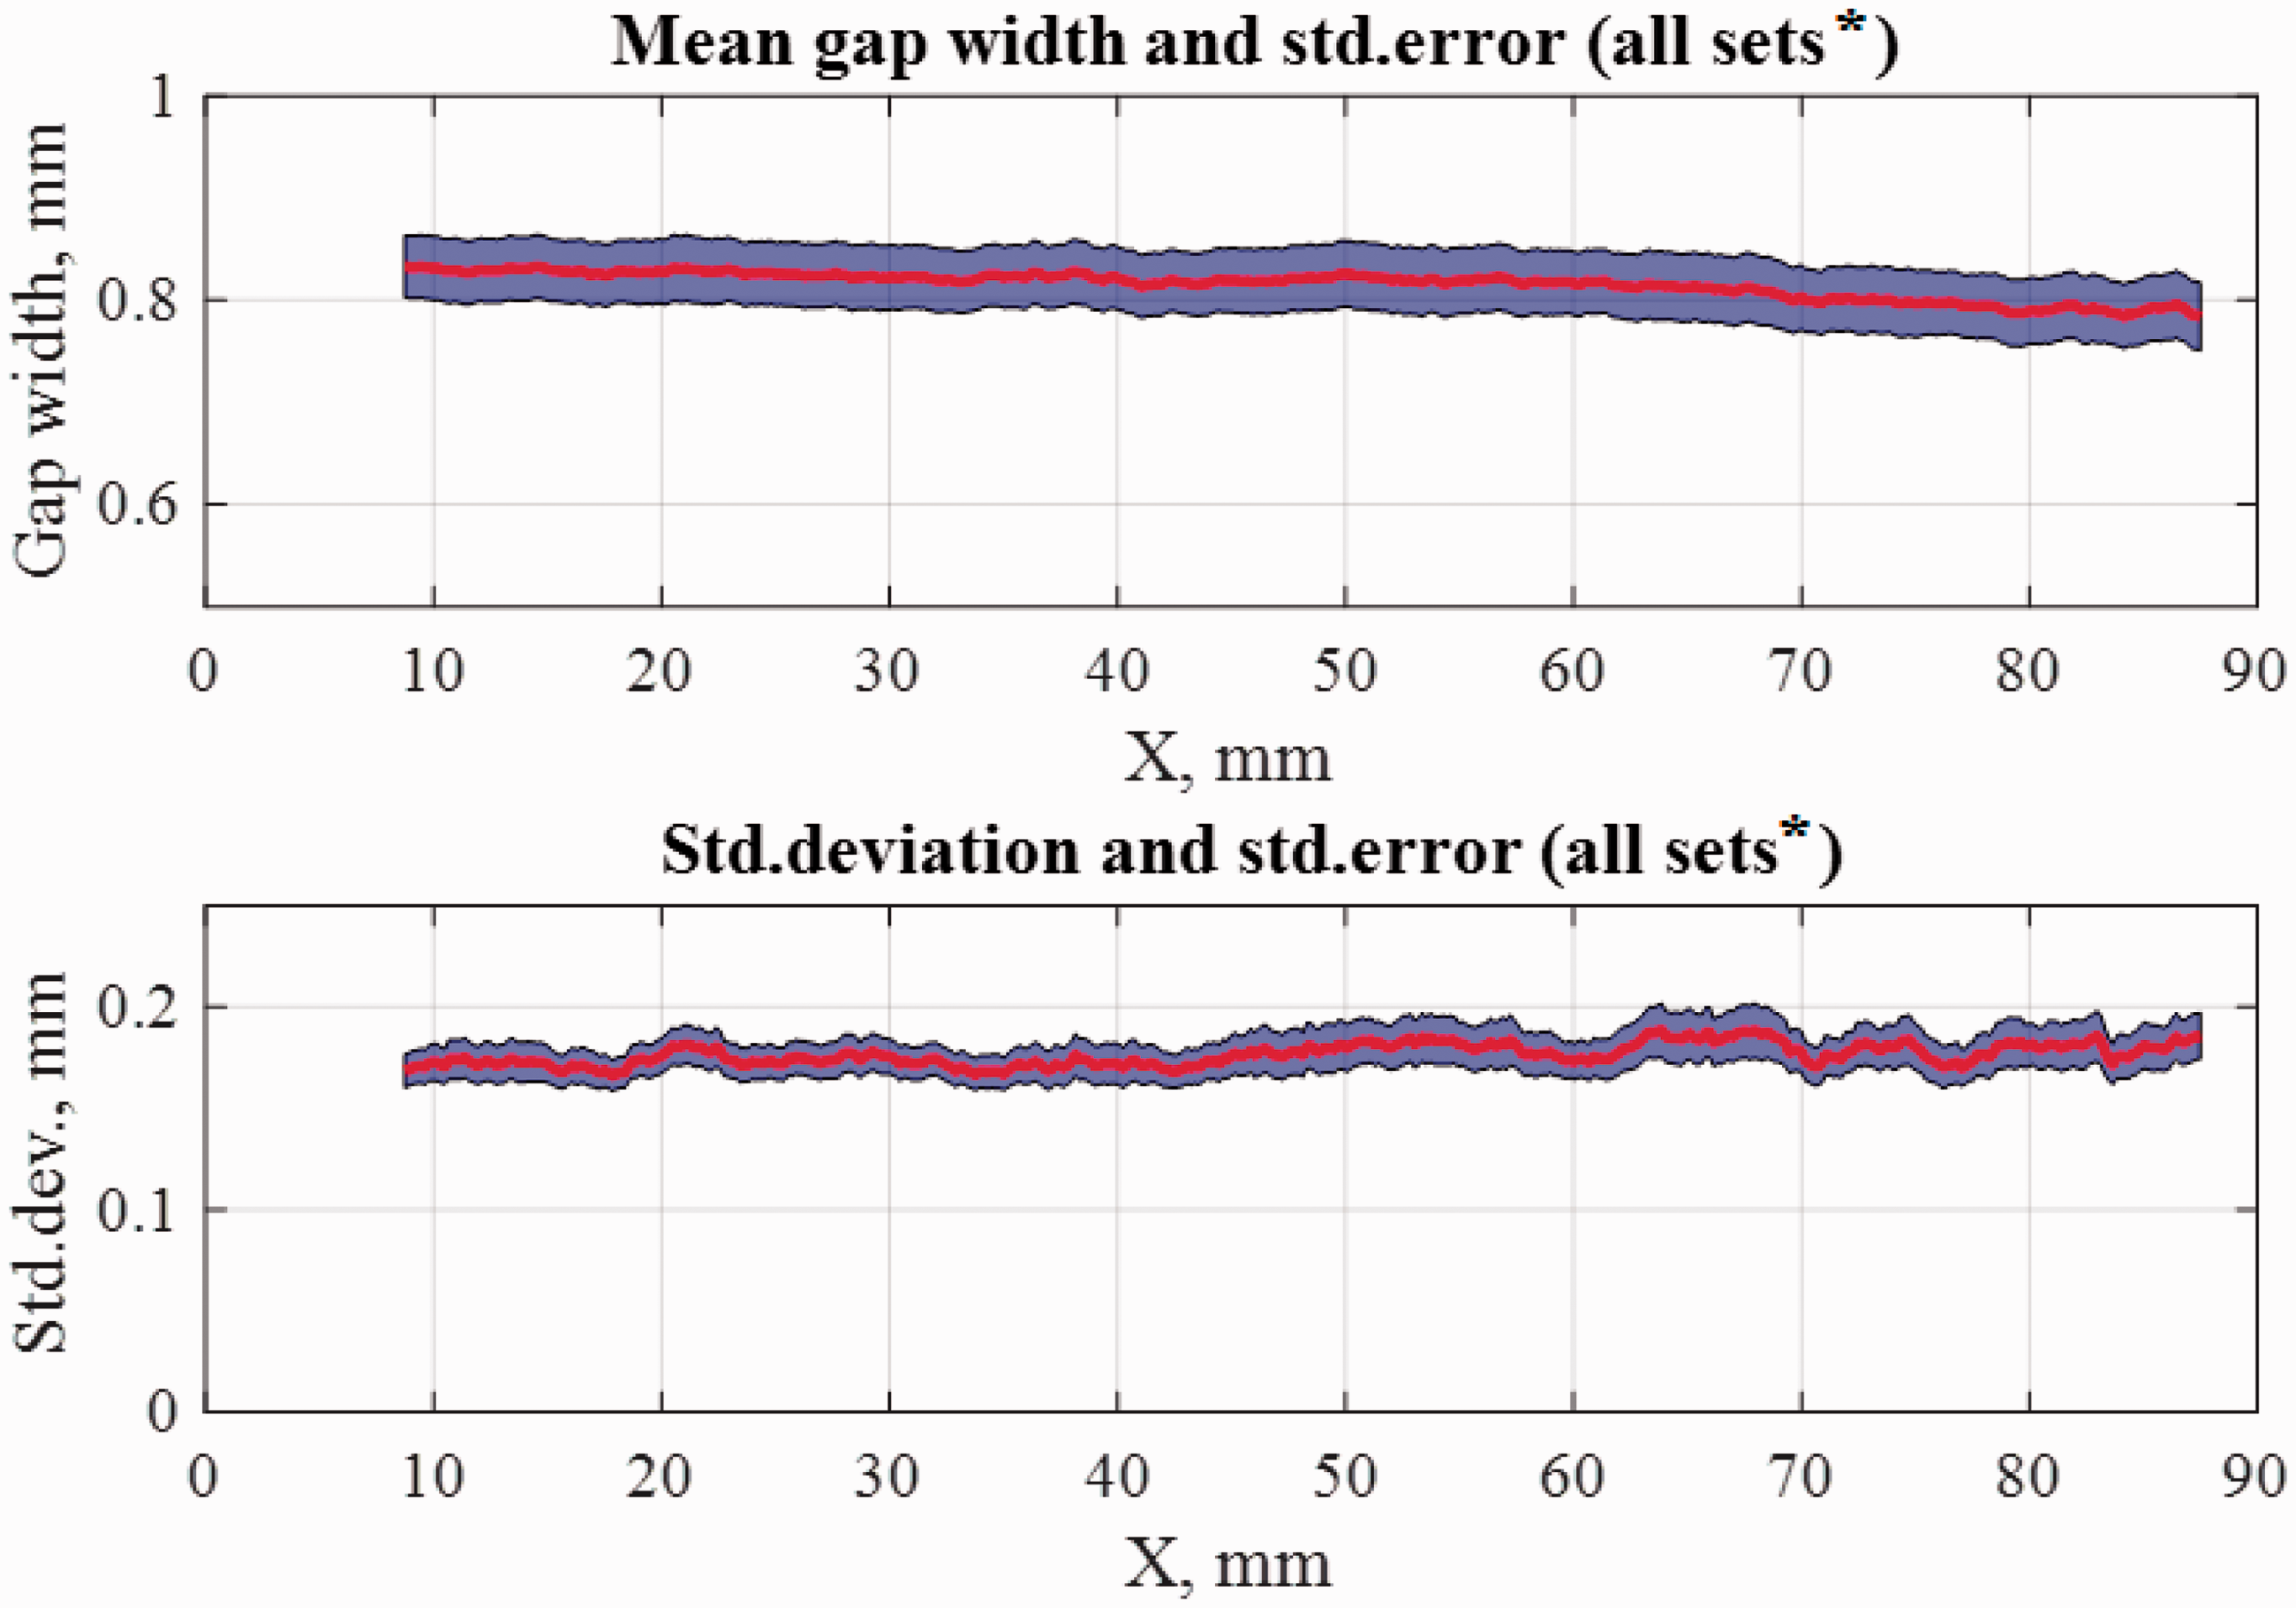
The mean and standard deviation of gap widths within two of the subsets of set P1L1, together with standard errors, are given in Figure 6. Note that the asymmetric confidence intervals of standard deviations are a consequence of the fact that, for an independent sample of size n, Gap widths in set P1L1 (shaded areas corresponds to 95% confidence interval). Average gap width, standard deviation of gap width (shaded areas corresponds to 99% confidence interval), ‘all sets’ consist of subsets P1L1-2–P1L1-6, P1L3-2–P1L3-6, P2L1-2–P2L1-6, P2L3-2–P2L3-6.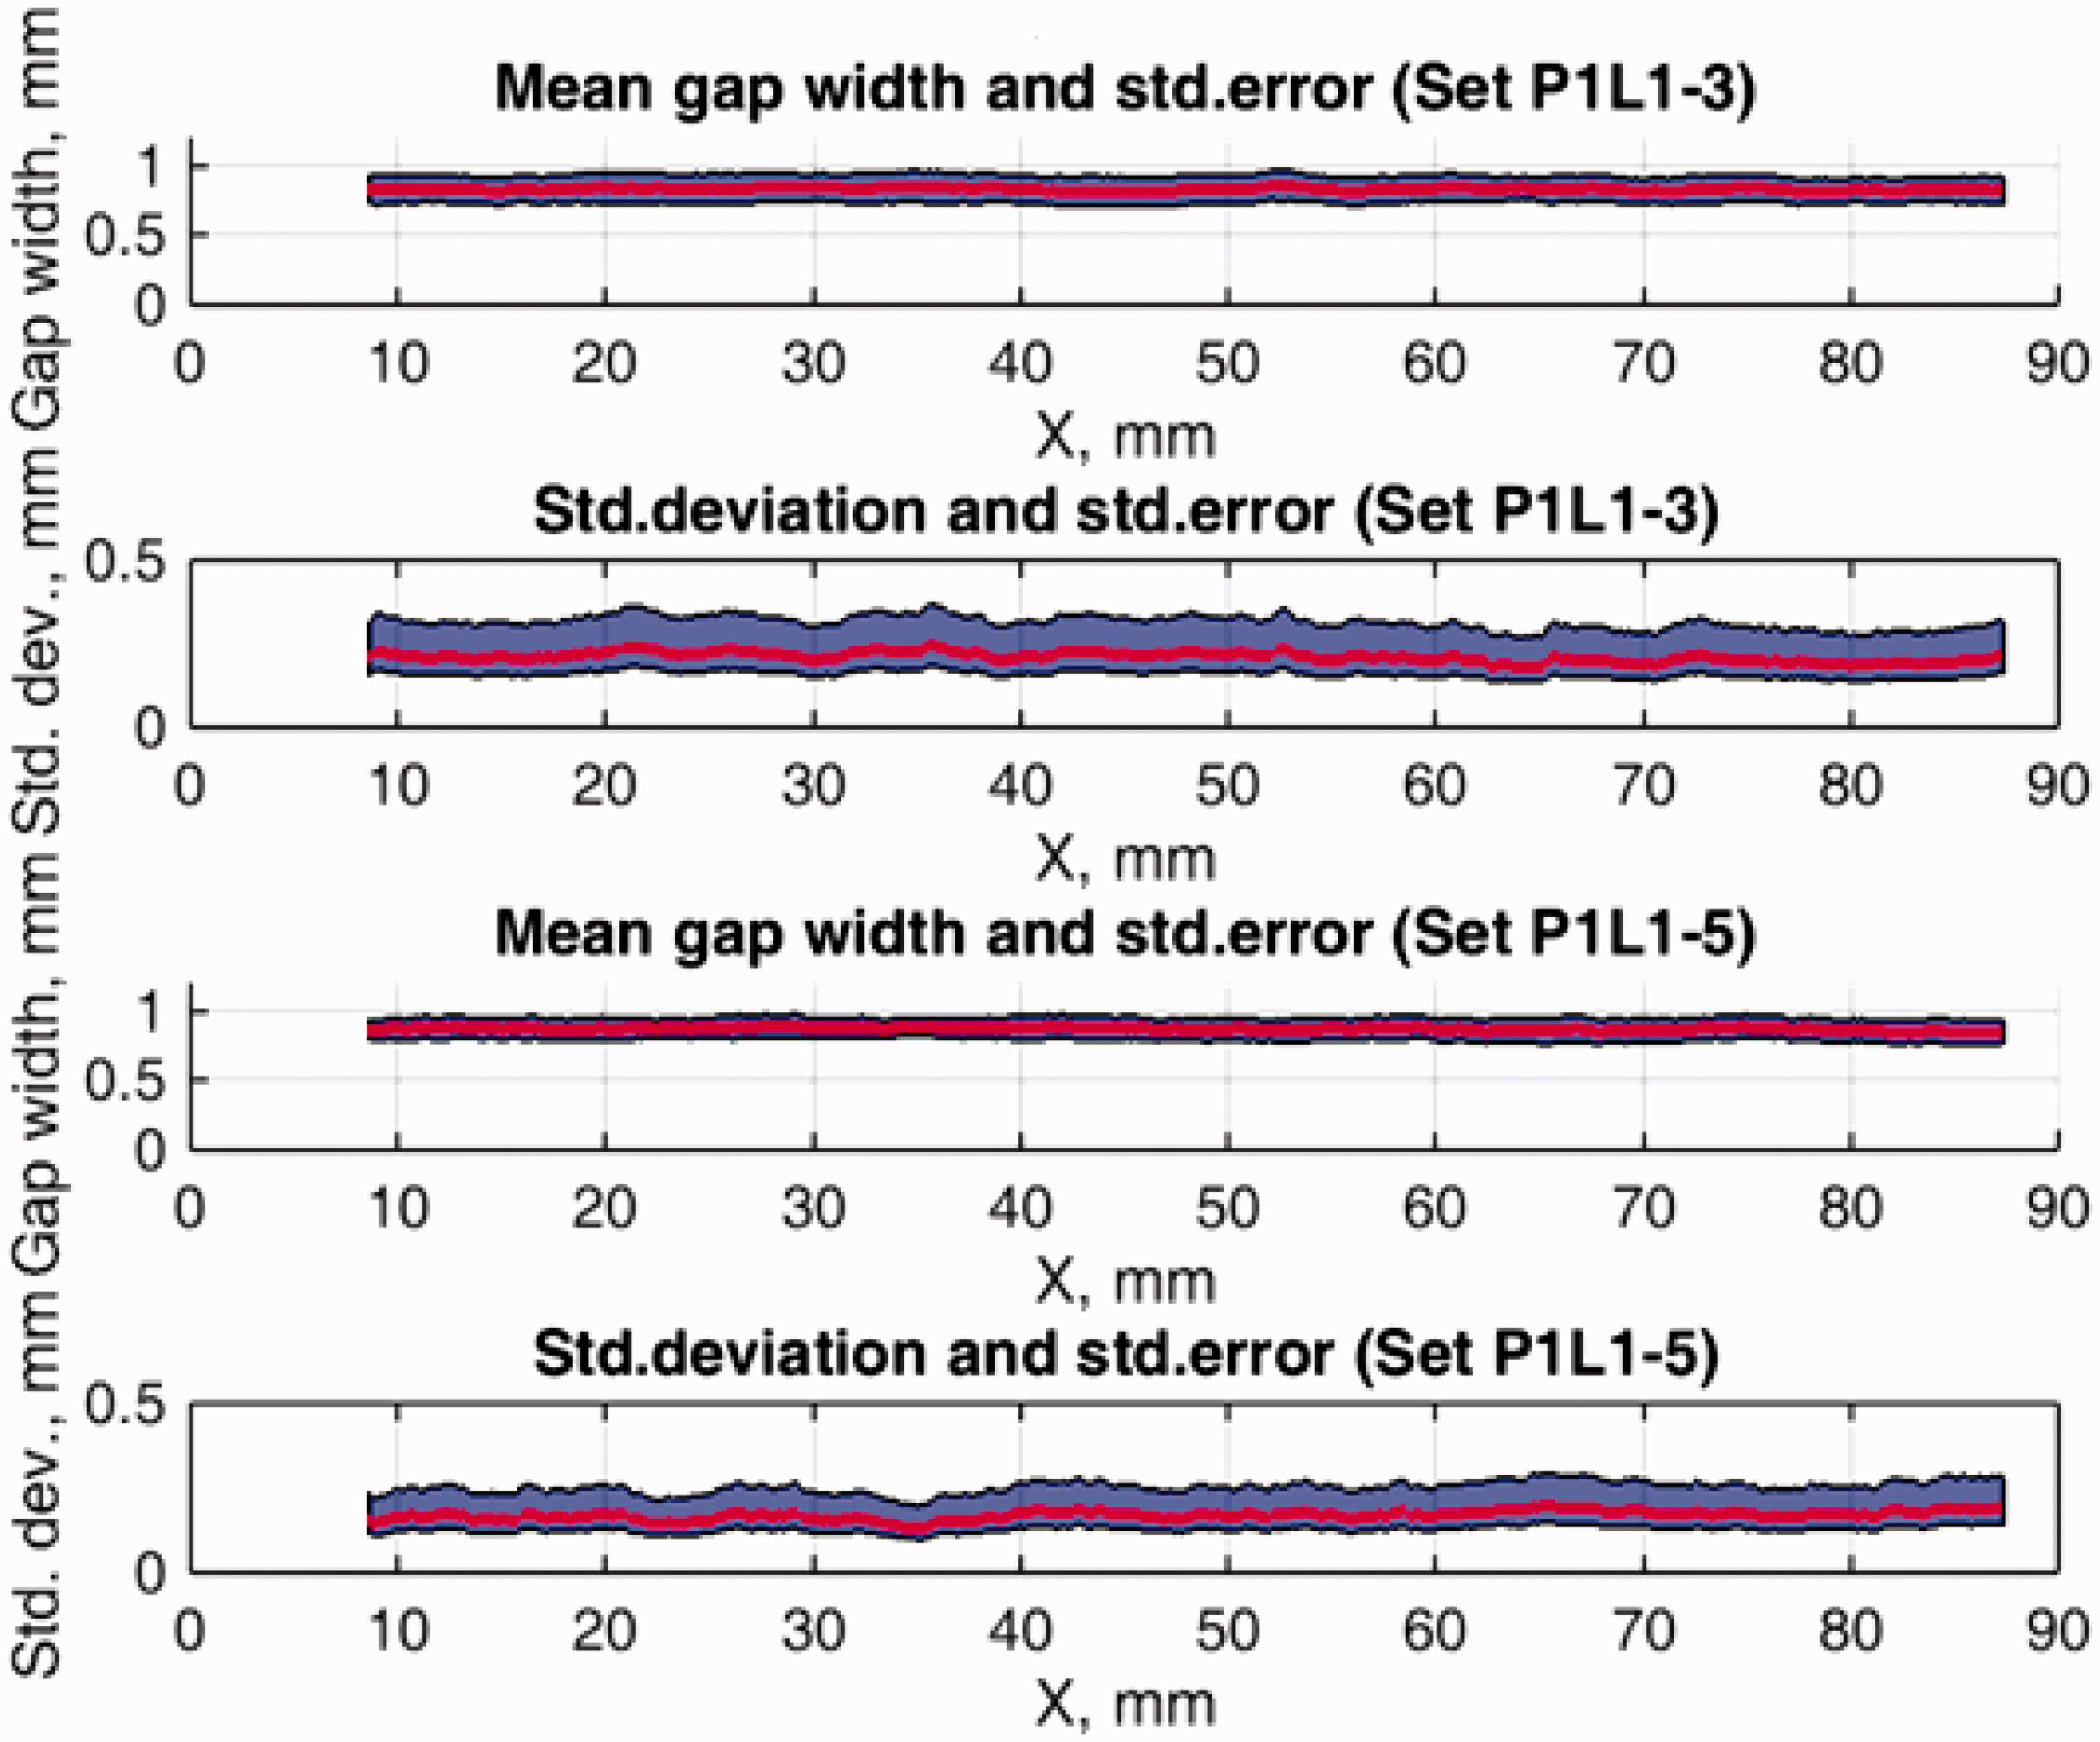
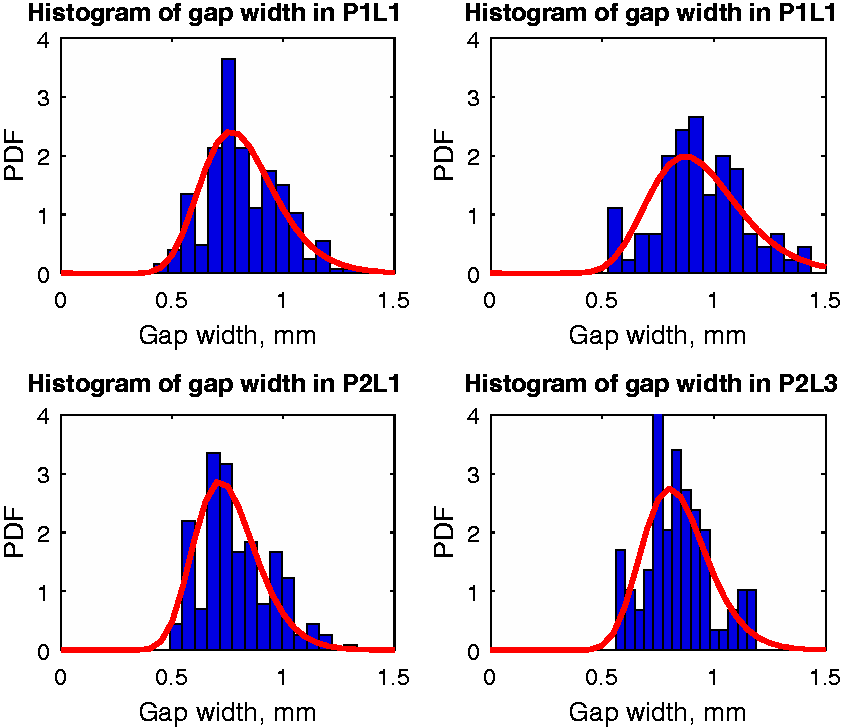
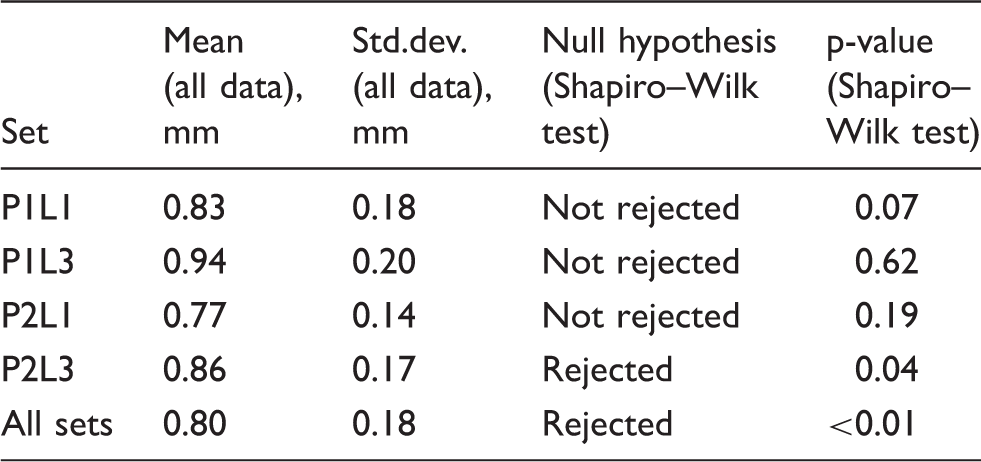
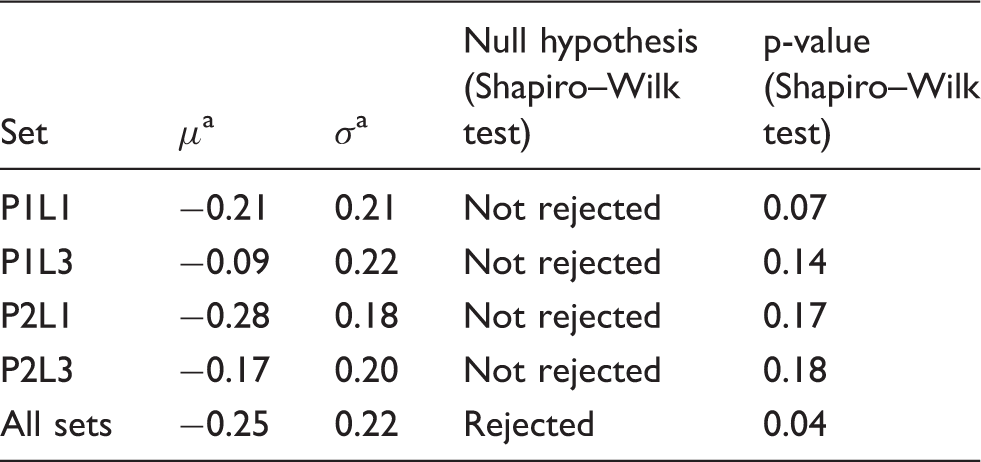
Probability distributions of the gap width distributions in the data sets are shown in Figures 8 and 9, together with normal and lognormal fits for which parameters are given in Tables 1 and 2, respectively. The Shapiro–Wilk test
28
did not reject (at the 5% significance level) the hypotheses of the data being from these distributions for most of the data sets. From these two distributions, the lognormal distribution was selected for the description of the gap width since, by contrast with the normal distribution, lognormal random variables take only positive values.
Histogram of gap width in the data sets (normal distribution fitted). Histogram of gap width in the data sets (lognormal distribution fitted). Results of the Shapiro–Wilk test assuming normal distribution, significance level 5% (only section at x = 10.5 mm and x = 72 mm were used for the tests of experimental distribution). Results of the Shapiro–Wilk test assuming lognormal distribution, significance level 5% (only section at x = 10.5 mm and x = 72 mm were used for the tests of experimental distribution). These values correspond to the mean and std.dev. from Table 1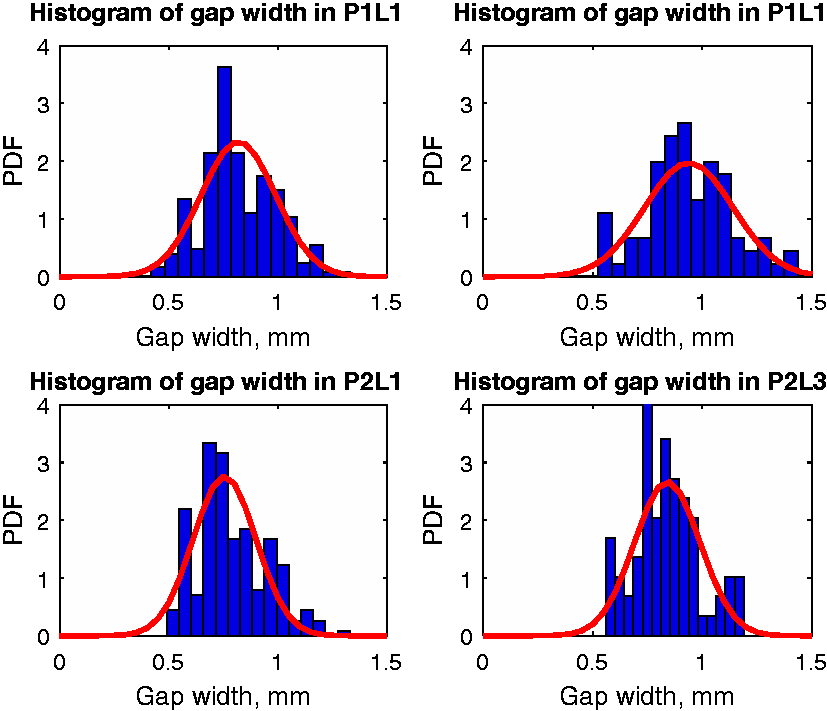
Representative autocorrelation functions (correlation along the length) of gap widths after removing the linear trend, using the MatLab function ‘detrend’, are shown in Figure 10, along with the average autocorrelation and its error bounds. The average autocorrelation function exhibits some oscillations and is negative in some regions. Instead of exponential approximation, as was performed in other studies,8,9,11,12 the autocorrelation function was analysed using the power spectral density of the detrended series and extracting frequencies corresponding to its peaks.
29
The detrending was required to avoid zero frequency which appears due to either decreasing or increasing trends in the measured gap widths. The power spectral density of the gap width from the data sets is given in Figure 10. This function has several peaks which correspond to frequencies present in the measured gap widths. The most powerful peak corresponds to a wavelength of 40.7 mm, and the next major frequency has a wavelength of 16.3 mm. Other peaks correspond to shorter wavelengths and have lower power. The longest autocorrelation length of 40.7 mm corresponds to the lower end of the range of correlation lengths reported for textile composites, 30–120 mm,8,14 and is likely to be related to behaviour of the dry tows as elastic beams, which respond to perturbations. Furthermore, this can be related to the spring back effect owing to the dry tows being uncoiled from a spool onto a flat surface. Visual examination of the ADFP preforms suggests that the second representative wavelength of 16.3 mm corresponds to waviness of the tow edges, which is probably related to tow slitting.
Autocorrelation (detrending applied), shaded area shows 95% confidence interval (left); power spectral density of gap widths (right).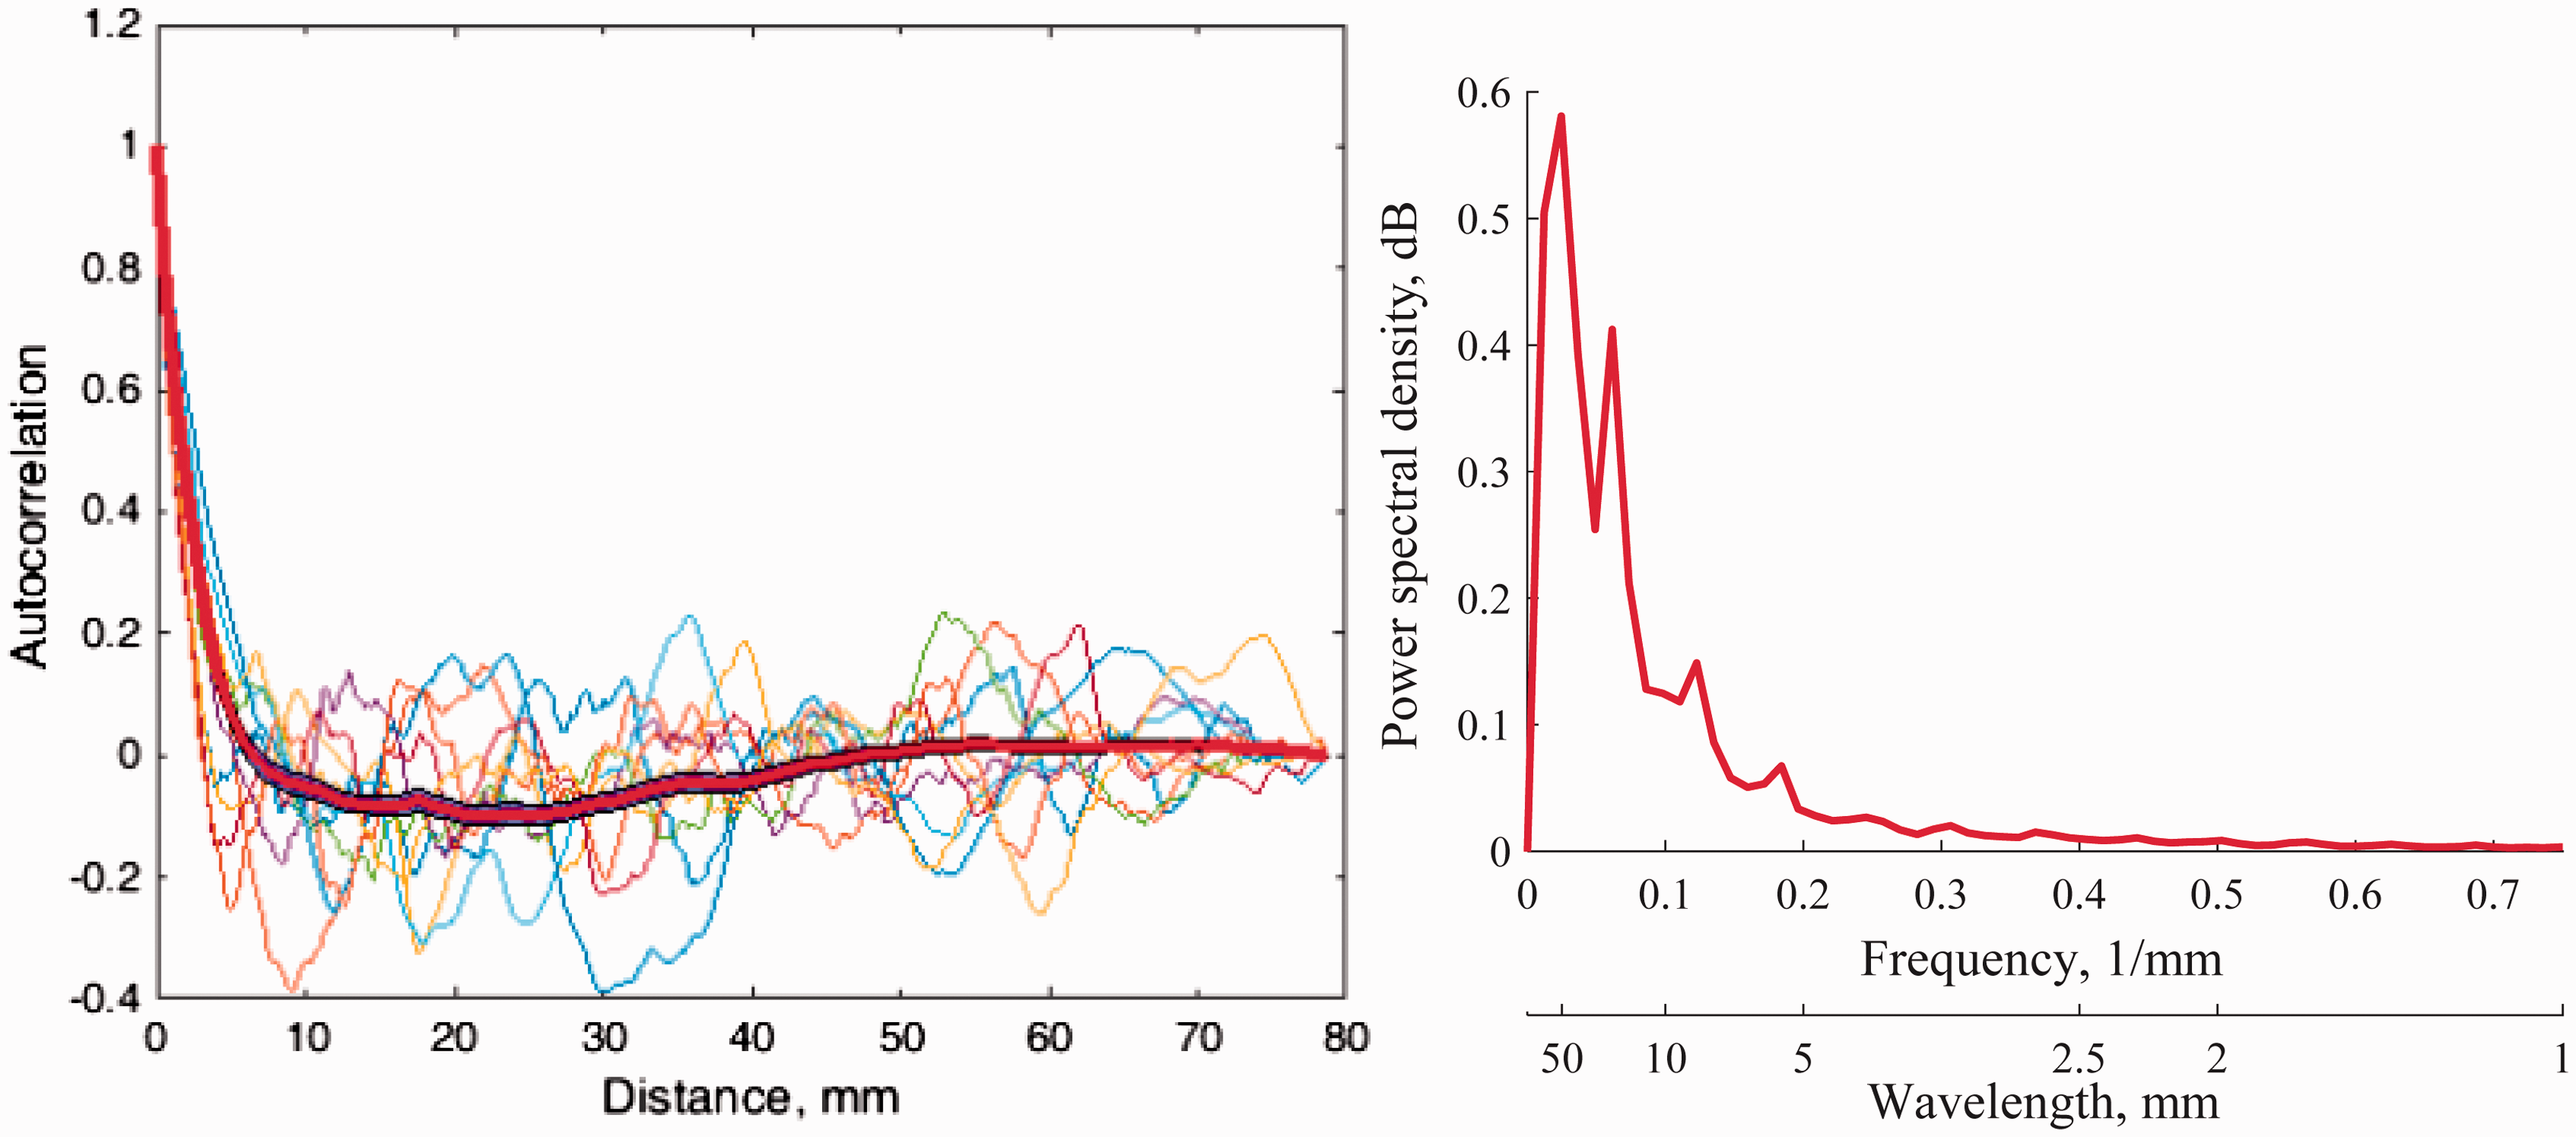
The average autocorrelation function also indicates the appropriate size of representative volume element (RVE), which should be used for the variability study. It can be seen that the autocorrelation function reaches a value near zero for a length greater than 60 mm, which means that there is no long-range correlation of the gap widths. The value of 60 mm was chosen as the minimum size of RVE for subsequent studies.
Dependence of the gap width in the other direction, i.e. between adjacent gaps, was also analysed. It was expected that adjacent gap widths would be strongly correlated because a large gap between two tapes might result in the next gap being smaller. However, a runs test, 30 which tests the hypothesis that values from a sequence are independent, on the gap widths showed that the independence hypothesis cannot be rejected at the 5% significance level for any of the data sets, making it is plausible to assume that adjacent gaps are independent.
Experimental characterisation of in-plane permeability
Permeability of the preforms, described in ‘Experimental setup’ section, was measured using an experimental setup, which simulates linear flow in a preform during RTM as proposed in Vernet et al.
31
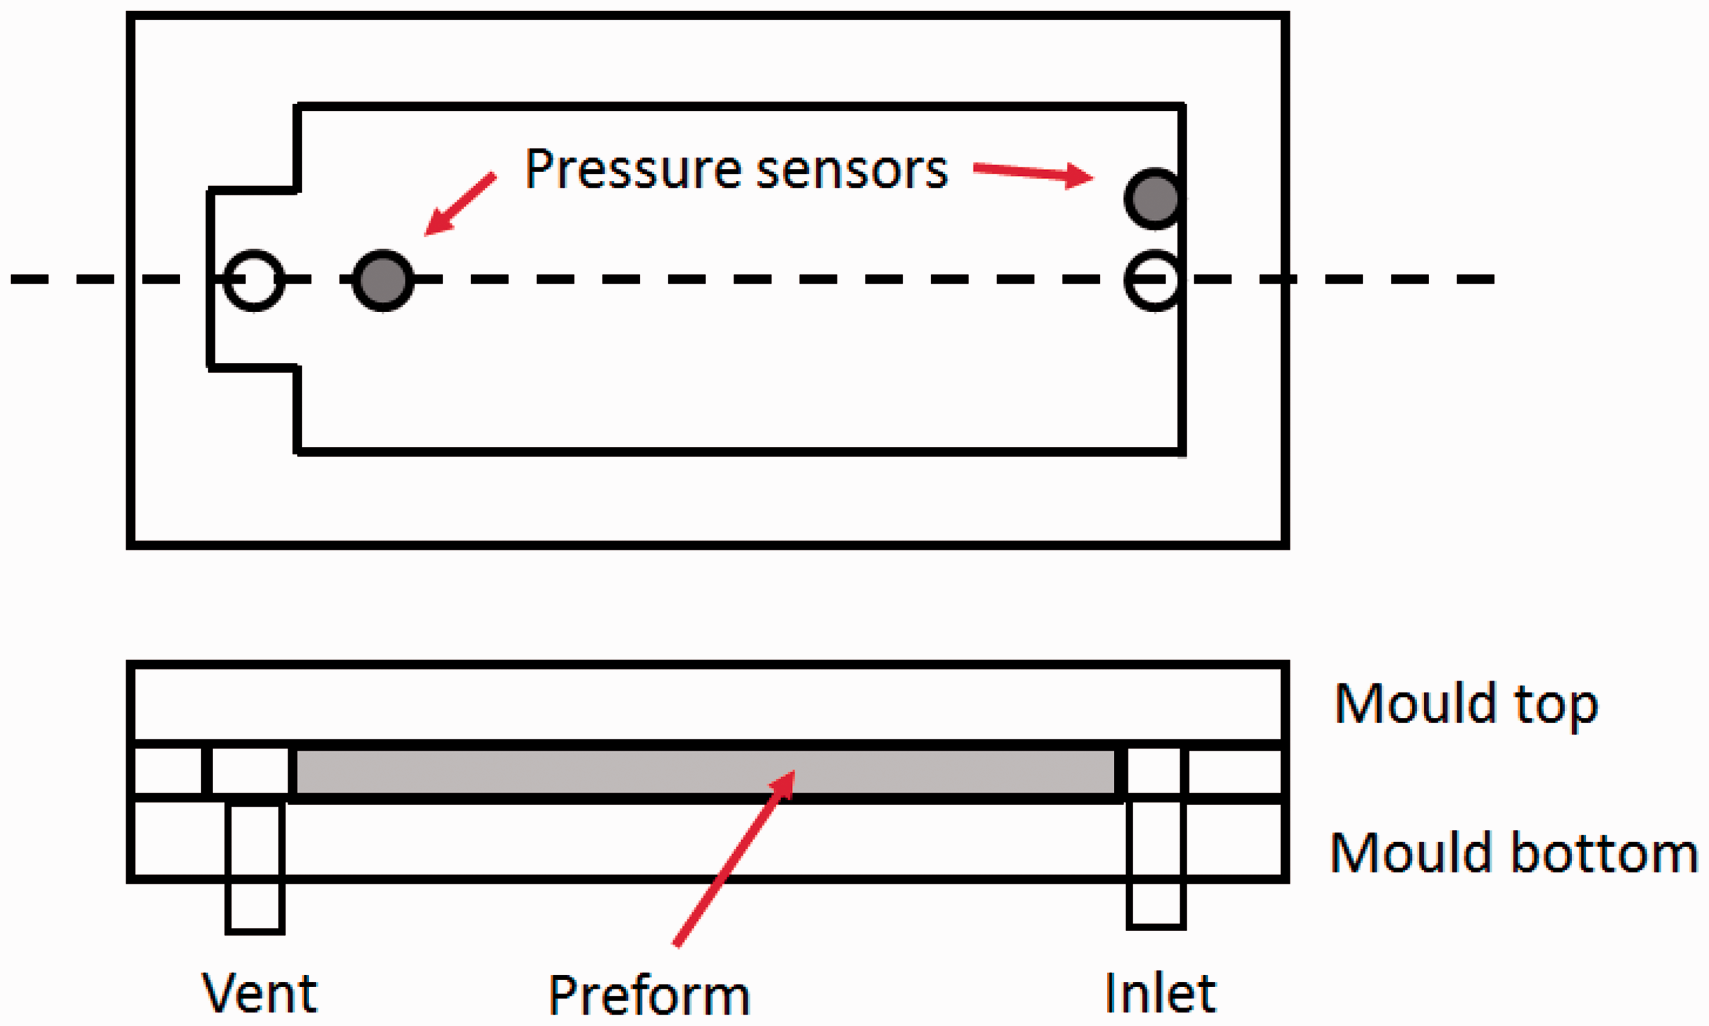
with a sample size of 290 × 115 mm (Figure 11). The size of the samples required for the testing and the desirability of obtaining as many samples as possible from a square preform were among the reasons for choosing a rectilinear flow testing rig instead of a circular flow rig as the latter requires larger samples. Specimens were cut in two orthogonal directions coinciding with the fibre orientations, which were assumed to be the principal flow directions owing to the simple geometry of the preform. The rig was fitted with two pressure sensors, one at the gate and another at the vent. Specimens were placed into the cavity of 3.2 mm depth, closed with a transparent mould top, made of 25-mm Perspex sheet, and injected with synthetic Trent oil at a constant pressure and temperature 18 ± 1℃. The fluid viscosity μ is 0.115 Pa·s at 18℃. The pressure at each sensor was recorded during the entire experiment. The arrival time was defined as the instant when pressure at the second sensor exceeded the pressure threshold Scheme of the experimental rig.
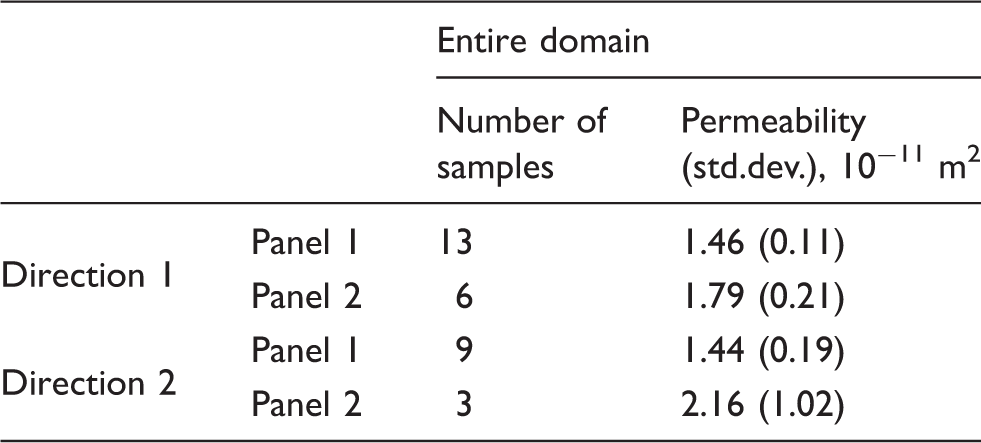
Results of permeability measurements.
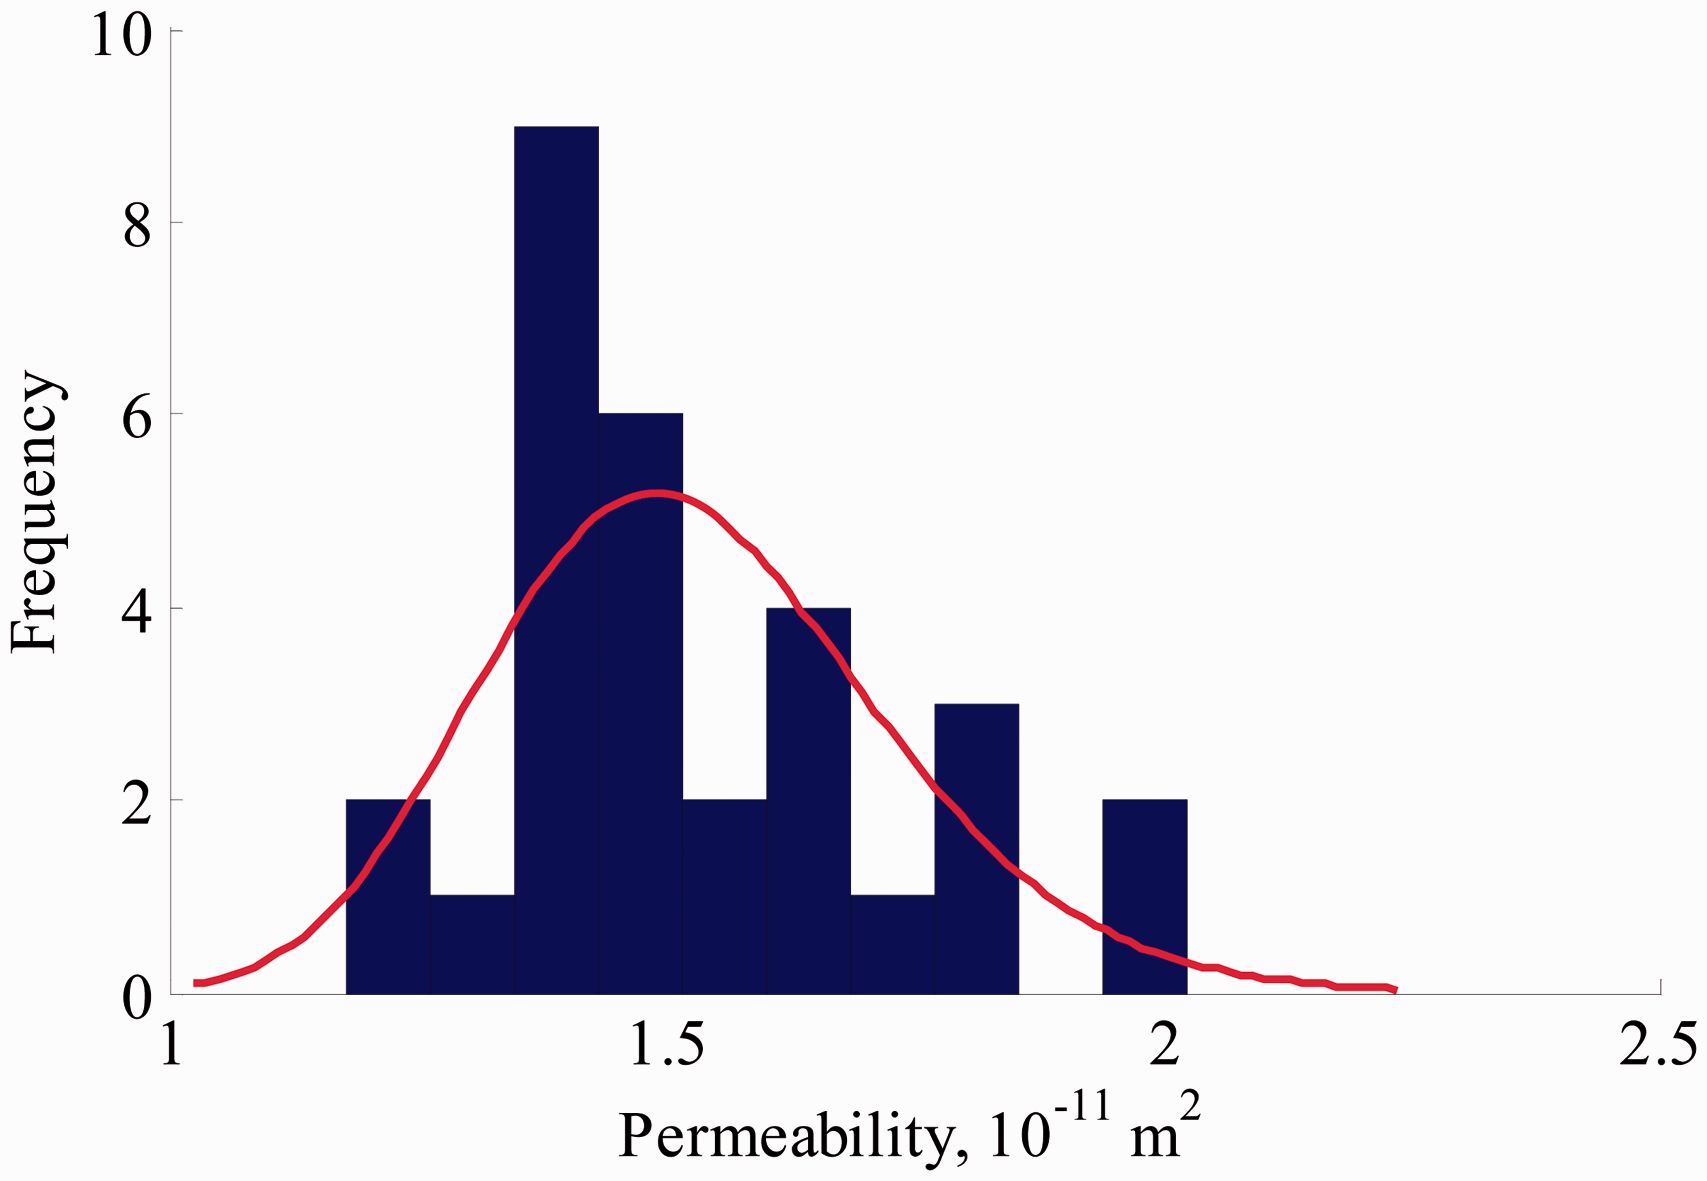
Distribution of measured permeability, lognormal fit in red.
Examples of the flow patterns, observed in the preform and recorded using a video camera, are shown in Figure 13. As expected, the flow in the gaps was faster than the flow in the tapes, which greatly distorts the flow front. However, the gaps did not act as race-tracking channels owing to the complexity of the geometry of preform where the gaps are placed in the staggered pattern and form a network of the channels. This network of the channels homogenises the flow and as a result creates a more uniform flow front than in the case of pure race-tracking.
Flow patterns in ADFP preform. ADFP: Automated Dry Fibre Placement.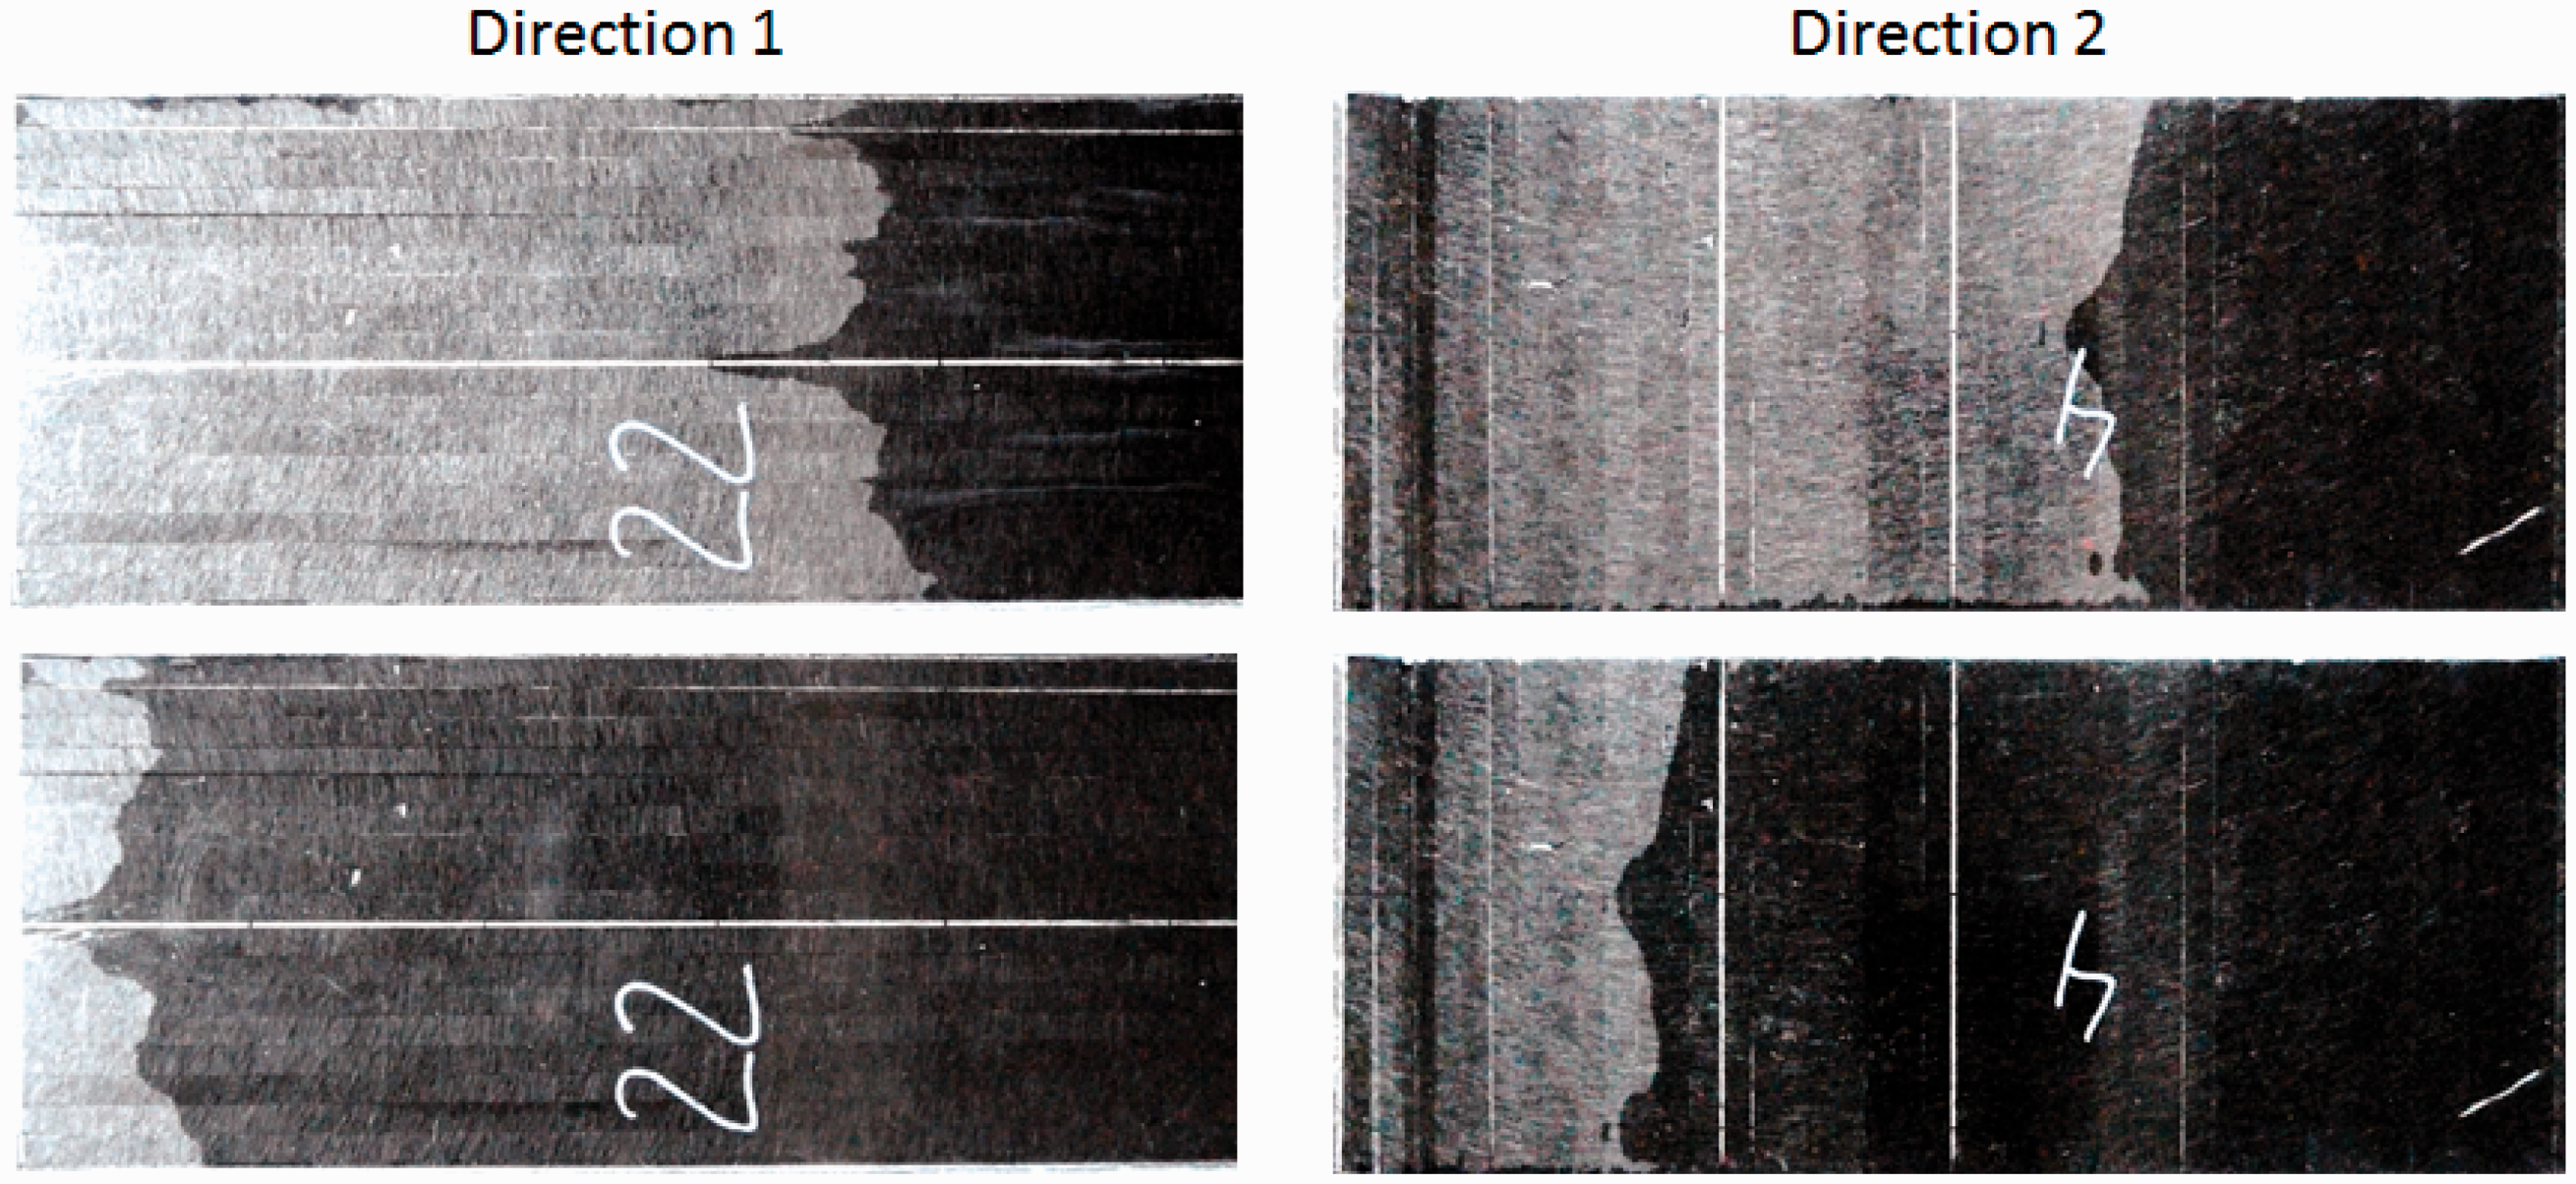
The distorted flow front observed in the experiments also introduces error in the permeability measurements. In the present experimental setup, the arrival time is measured by a single pressure sensor placed at the centreline of the tool close to the vent. Therefore, the positions of gaps in the bottom layer affect the registered arrival time, e.g. by triggering early arrival when the entire mould is not yet filled, resulting in overestimation of the permeability. These overestimated values contribute to the right tail of the distribution shown in Figure 13. The effect of the flow front unevenness can be reduced by performing the saturated flow experiments by measuring the flow rate after the porous medium is fully saturated. It is expected that this would reduce the error and also yield permeability values slightly higher than those measured with the present setup.
The other source of uncertainty in the experiments is related to the potential deformation of the mould top. The effect of this uncertainty was kept to a minimum by using a low injection pressure. It was estimated that deflection of the mould top was up to 0.15 mm according to the plate theory, 33 resulting in a fibre volume fraction change of 3%.
Permeability modelling
A fibre preform during resin injection is often assumed to behave as a saturated porous medium and flow through it is described by Darcy’s law. Most of the approaches for permeability prediction7,19,23,24 are based on the multi-scale homogenisation procedure, which assumes separation of the scales to simplify the modelling of the flow, e.g. flow in a unidirectional (UD) fibre bundle (micro-scale) is considered separately from the meso-scale flow and then homogenised. Then the homogenised permeability of the micro-scale fibre bundles is implemented intro the meso-scale model. Homogenisation approaches have proved their effectiveness and accuracy for various reinforcements. For example, analytical homogenisation of flow was applied to predict the permeability of UD multi-layer preforms, 22 plain weaves 23 and multi-layer triaxial braid. 24 All approaches divided the geometry of reinforcements into elementary volumes and channels, which are then reconnected assuming series and/or parallel flow. The same approach is chosen here given the simple meso-scale geometry of the ADFP preform. In this case, the geometry at the meso-scale is viewed as a layered structure with each layer consisting of homogeneous tapes with rectangular gaps between them. The homogenisation procedure for the saturated permeability of the preform becomes viable because of the distributed nature of the gaps, which create a more uniform flow as discussed in ‘Statistical properties of preform geometry’ section. It should be noted that this approach of modelling a layered structure neglects the through-thickness fluid exchange by the adjacent layers. This assumption is based on the consideration that individual layers are relatively thin and the flow front in a layer with lower permeability is levelled out by two adjacent layers each with a higher permeability. In addition, the design of the ADFP preform contains a limited number of gaps and the remainder of the preform consists of densely packed fibres, which makes difference between the local permeabilities of adjacent layers relatively insignificant.
The homogenisation procedure for the ADFP preform is shown schematically in Figure 14. The homogenisation starts by defining the permeabilities of its simplest sub-structures: tows and gaps. Permeability of tows (i.e. dry fibre bundles) are homogenised using the Gebart formulae
34
for direction along, Homogenisation approach.

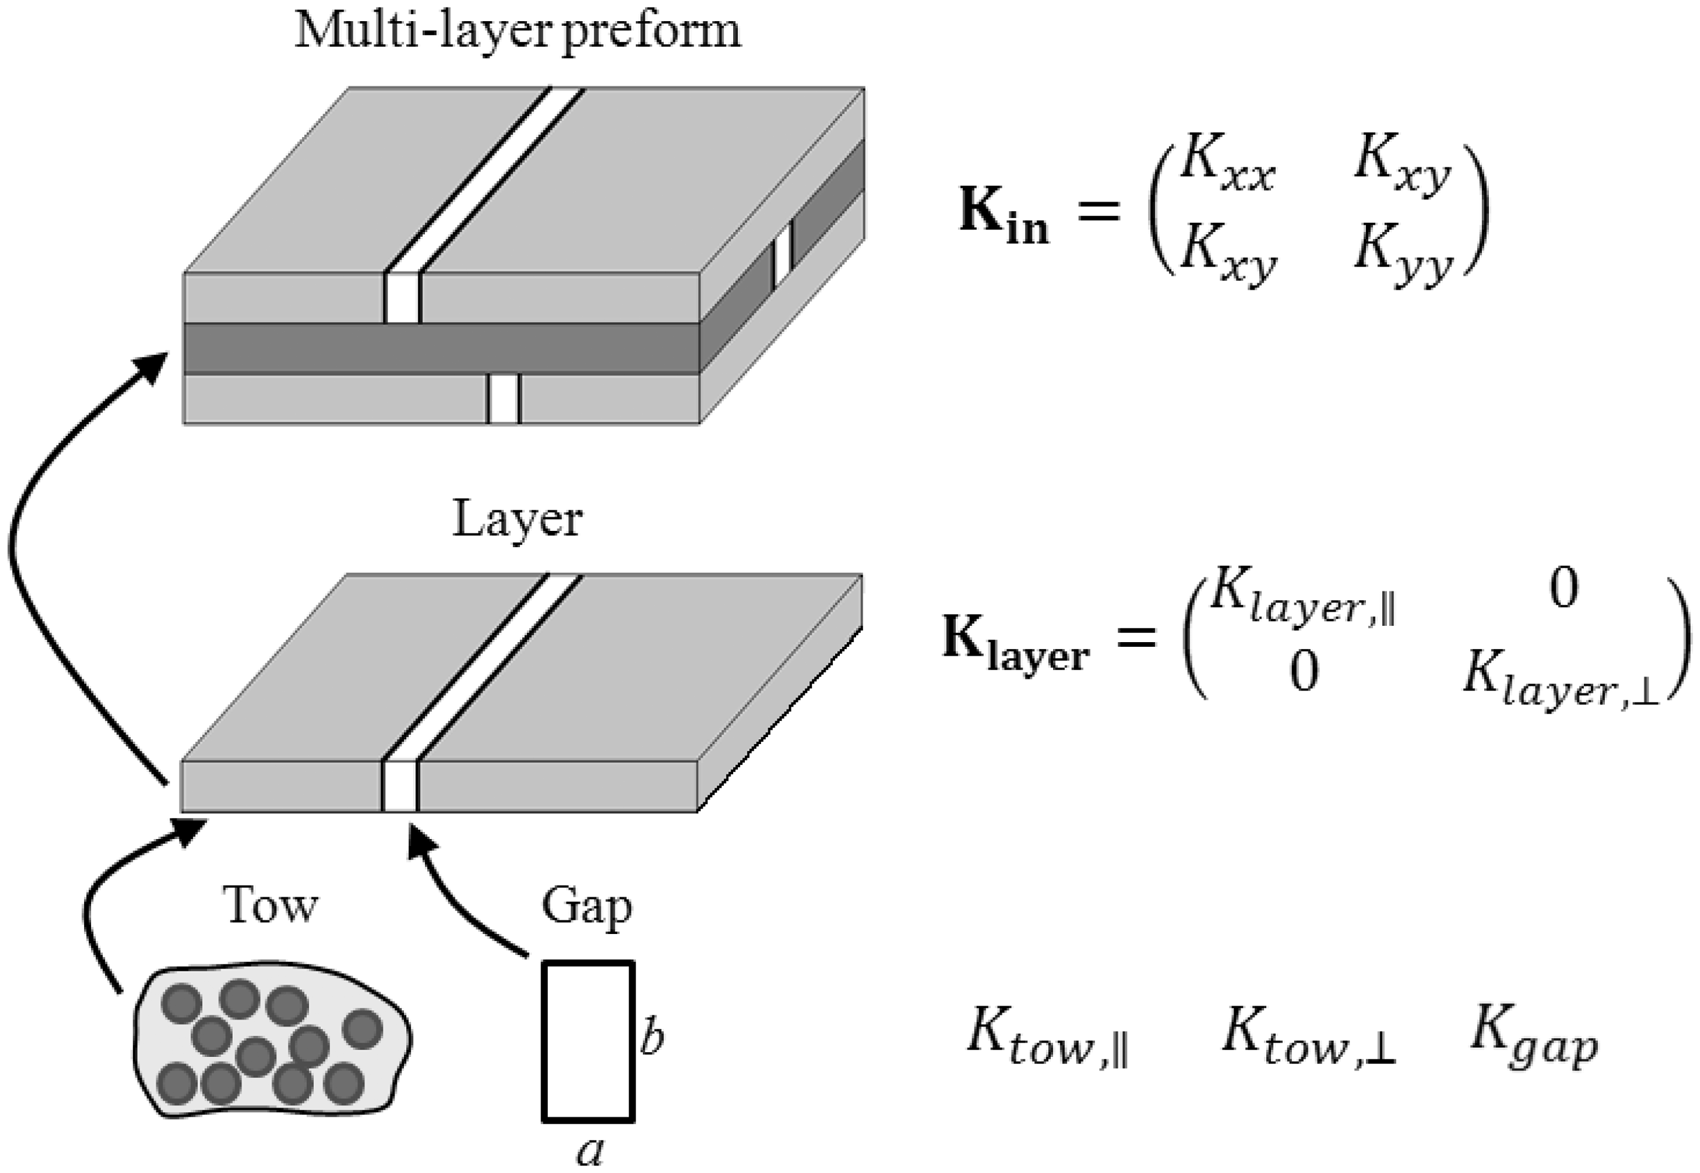
The permeability of a gap along its length, 
The permeability of a single layer along the fibre direction can be calculated using a weighted averaging approach,
24
assuming parallel flow in the gaps and tows

Assuming that flow across the gaps makes a negligible contribution to the total flow, the transverse permeability of a single layer can be calculated using weighted averaging

Using the derived values of the permeability along and across the fibres, the permeability tensor of a layer, 
The flow in a multi-layer preform is represented as a number of parallel flows through the layers. Then the overall in-plane permeability of the preform can be written as

The proposed model for saturated in-plane permeability was validated by fluid dynamics simulation performed in ANSYS CFX using a model for a steady-state flow in four orthogonal gaps (i.e. four-layer preform) shown in Figure 15. The analytical in-plane model yielded results within 10% of the numerical model for all the considered cases as shown in Figure 15. The closest agreement was achieved for the models with low porosities, when the approximation of the gaps as slender non-interacting channels is most reasonable.
Model of four orthogonal gaps (left); comparison of theoretical and numerical predictions of in-plane permeability of a four-layer orthogonal preform (right).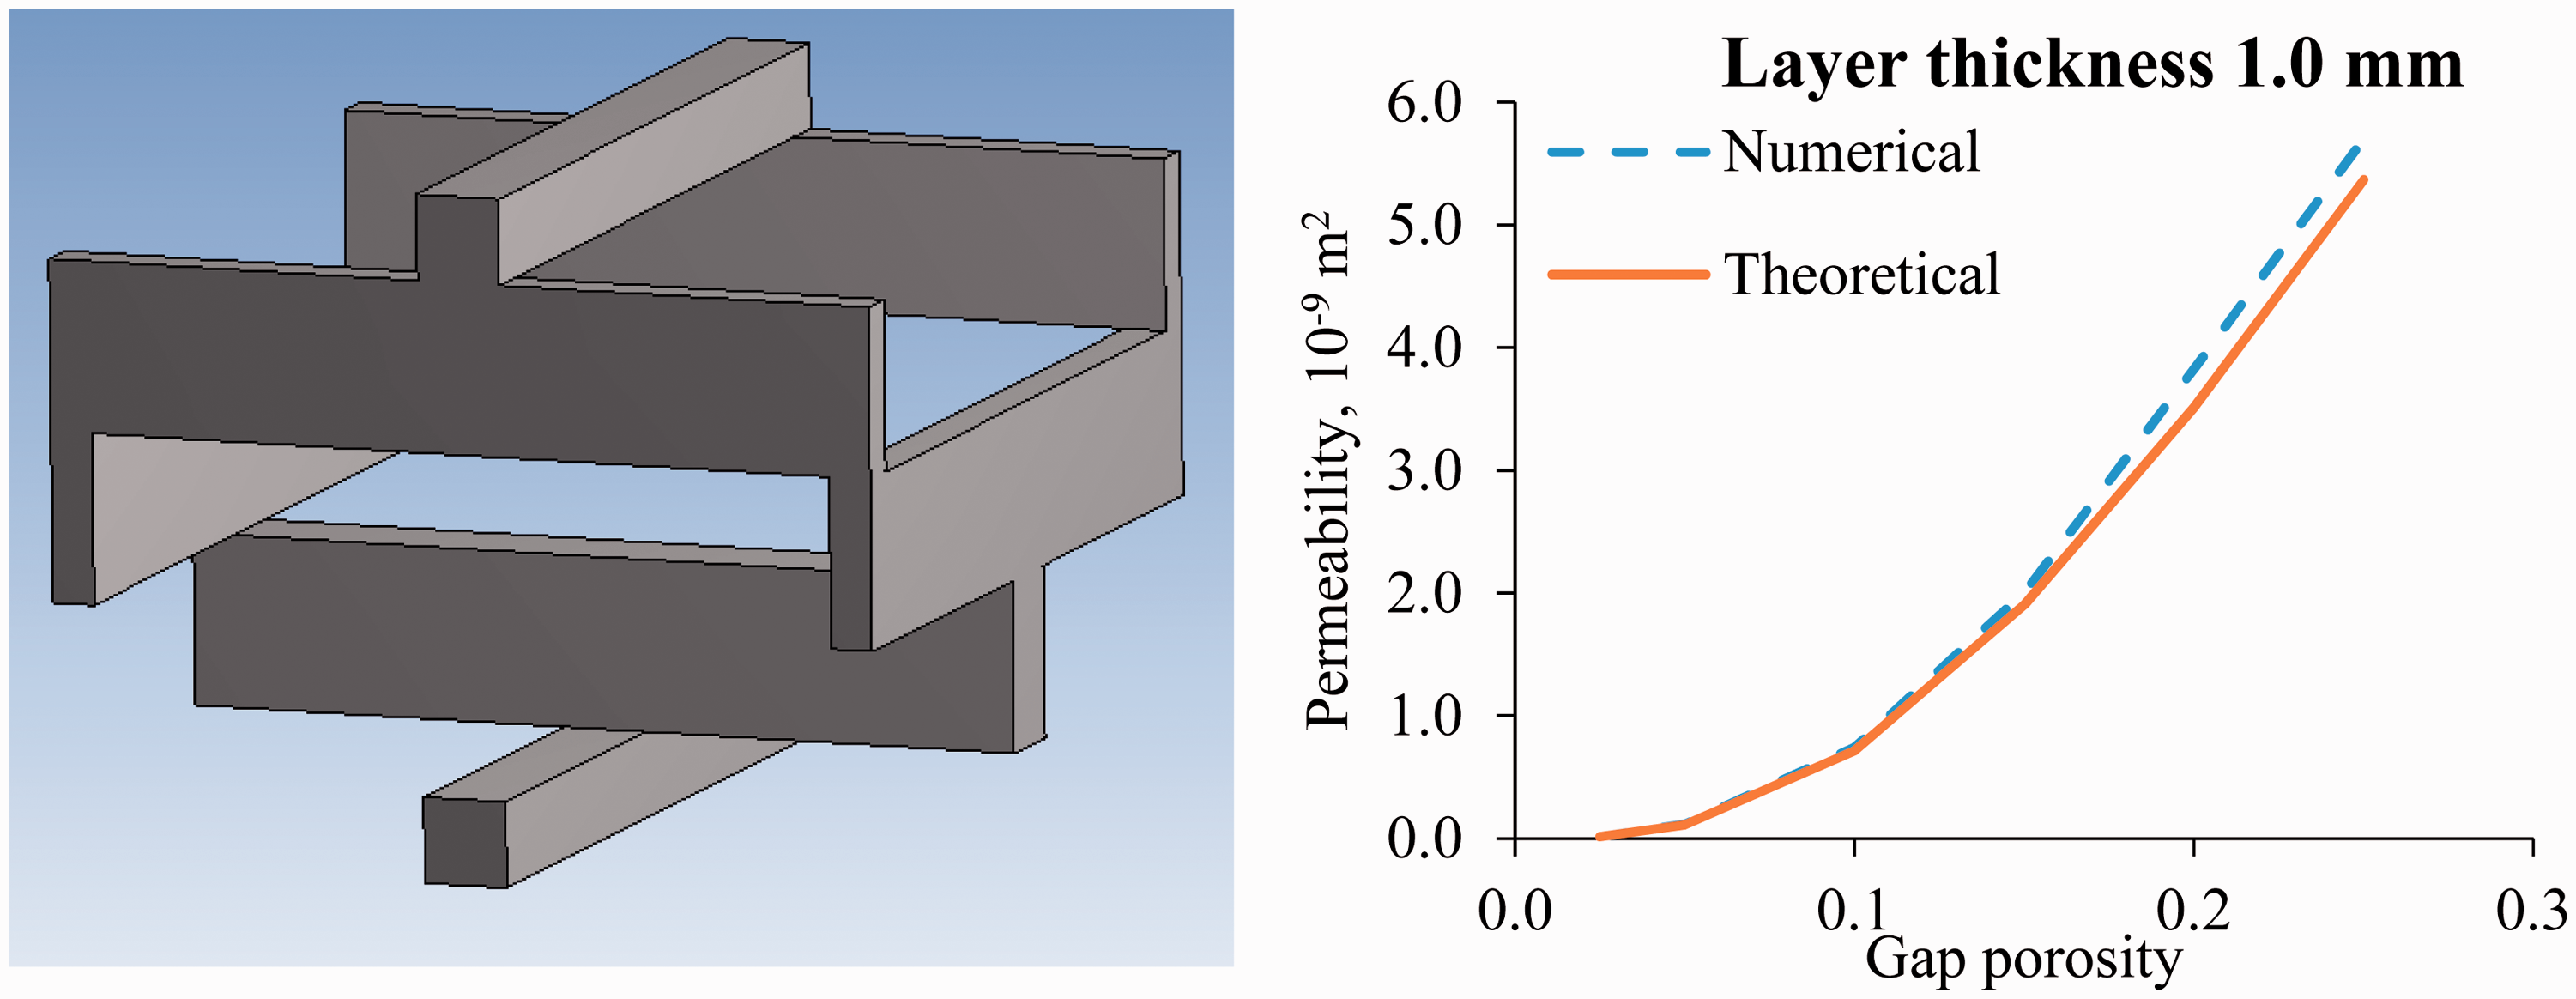
Geometrical parameters of the permeability model.
The permeability model with the more precise geometry of the ADFP preform, which accounts for the reduction of the gap width and height, predicts permeability which is in good agreement with the experimental results but does not provide any information on the variability of the permeability. In the next section, the preform model with variability of the gap width is described.
Variability modelling
The gap widths and correlation properties measured, described in ‘Optical characterisation of preform geometry’ section, can be implemented into a preform model with randomly variable gaps. Prior to the use of the experimental data described in ‘Optical characterisation of preform geometry’ section, several assumptions need to be made. It should be noted that the width of the gaps was measured during the lay-up stage, which is then followed by a compaction before RTM. The compaction can introduce variations to the measured geometry, e.g. it is known that the compaction of 3D woven textile reinforcement can distort gap measurements significantly. 36 However, in the case of preforms manufactured by ADFP, prior to the lay-up each tape is already compacted to a high fibre volume fraction and then further compacted by a roller during the lay-up stage. This, together with the binder activated during the lay-up stage, creates a preform which is denser, and much more rigid and stable, than conventional dry reinforcements. Research on consolidation of prepregs and prepreg AFP tapes has shown that the tapes with low thickness to width ratio do not exhibit squeezing flow and do not fill the gaps. 37 These considerations allow us to assume that the tows are not significantly disturbed during the compaction phase. The other possible change of the geometry is lateral expansion of the compacted tows. However, the overall change of thickness during compaction was no more than 5% and this process is expected to increase of the fibre volume fraction within the tows rather than cause lateral expansion. These arguments make it possible to assume that the width of the gap measured on a dry non-compacted preform is still applicable to the compacted preform during the RTM stage.
The permeability of the preform with randomly variable gaps can be calculated by extending the model presented in ‘Permeability modelling’ section. Each variable channel in the model is assumed to consist of many sections, each having its own constant channel width and height. These sections are then assumed to be connected in series and the total permeability of a gap is given by
The model of the ADFP prefrom geometry with variable gaps is based on the assumptions that a gap width along the fibre direction, x, is modelled as a stationary lognormal random function, 
Here μ and σ are the sample mean and standard deviation from Table 2,
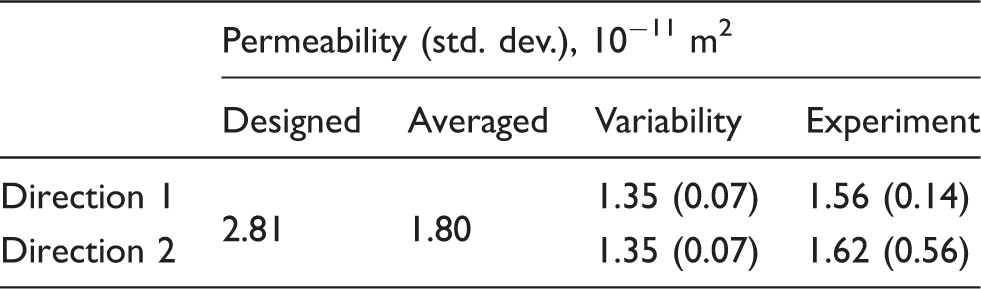
Permeability results.
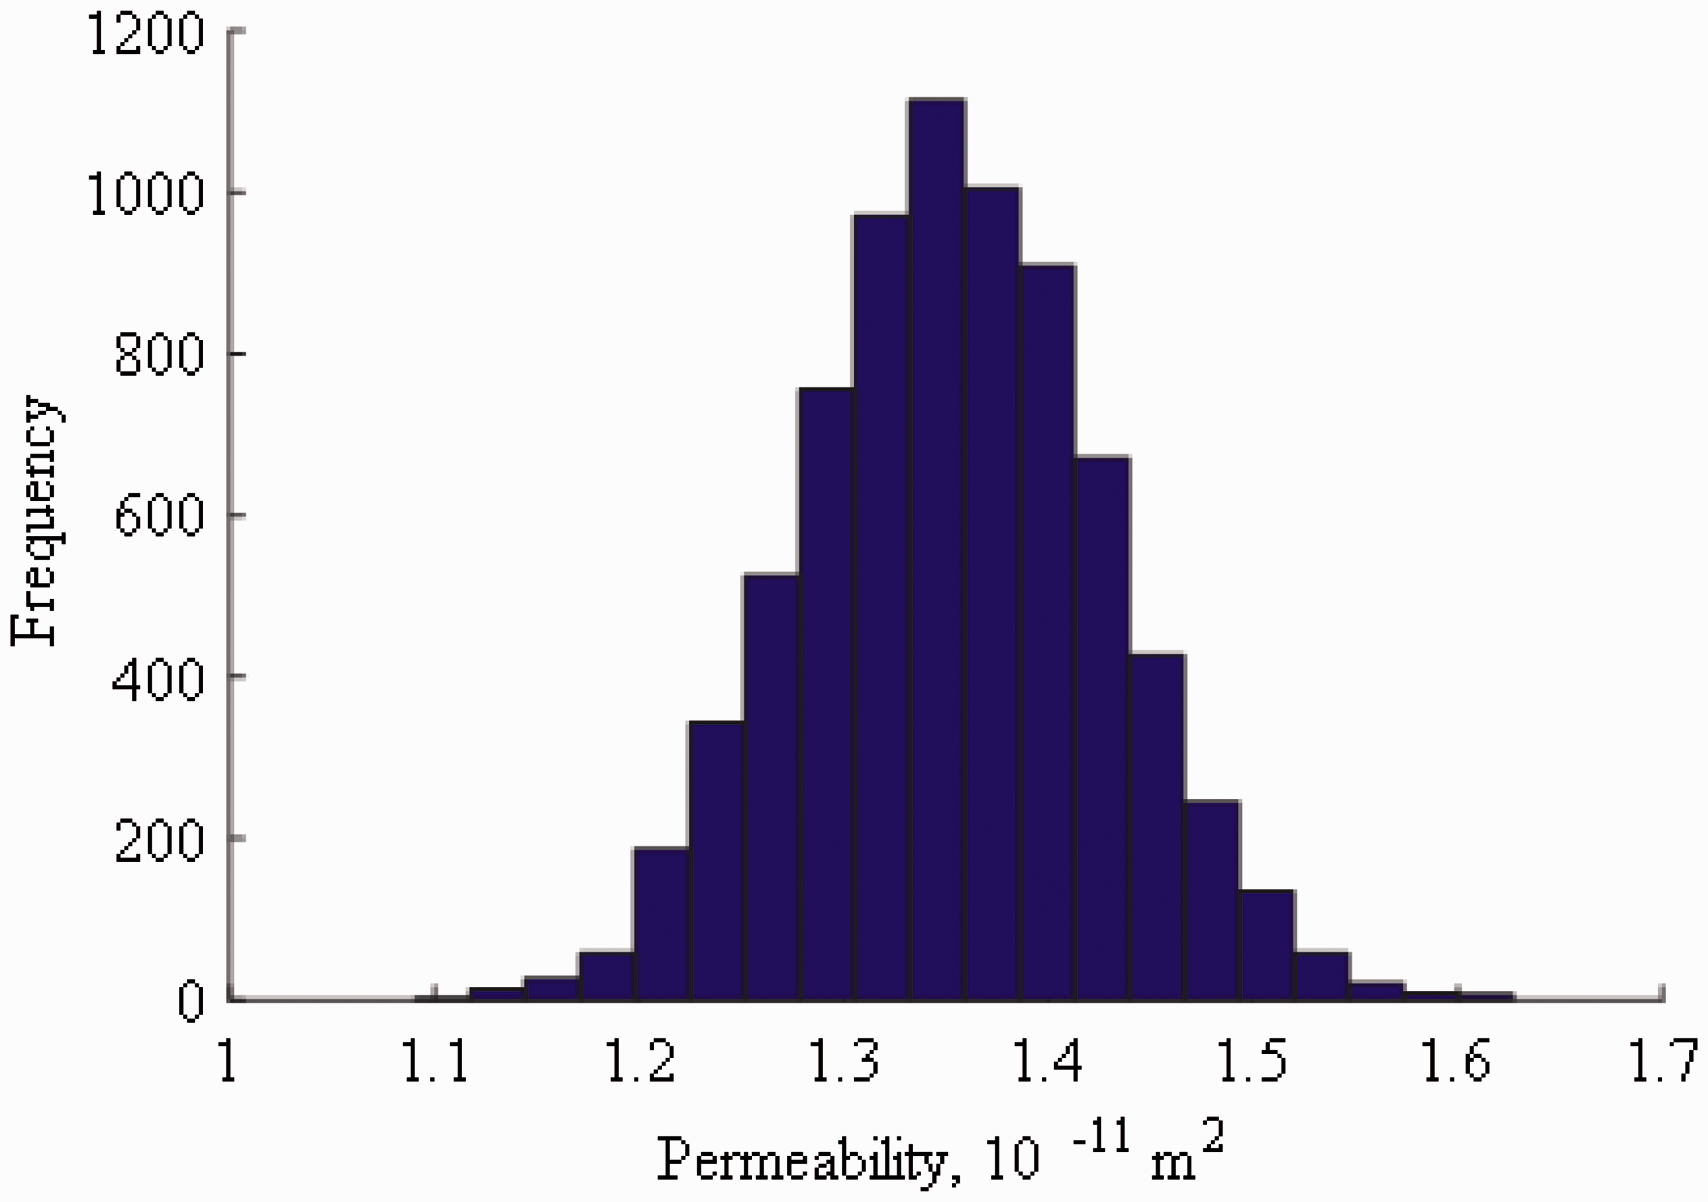
Simulated distribution of permeability for RVE length of 63 mm. RVE: representative volume element.
Discussion
The detailed image analysis of the geometry of manufactured ADFP preforms resulted in several findings. The average gap width is 20% lower than the designed value and its CoV is up to 25%. Micro-imaging of RTM samples of the ADFP panels showed that the gap height is lower than the layer thickness owing to compaction effects. Sources of the variation of the gap width include precision of the lay-up, variability in tow width, presence of unintended gaps between tows and possible measurement errors which stem from the imaging and image analysis. The total of the measurement error is estimated to be within 1–2 pixels on the original image (0.035–0.07 mm) and is several times lower than amplitude of the measured variations. With edge defects from tow cutting excluded, the gap width was weakly stationary within the resolution of the images. The gap width could be represented by either a normal or a lognormal distribution as the corresponding statistical hypotheses were not rejected. The lognormal distribution was chosen because gap width cannot take negative values. The correlation function of gap widths obtained from the data was found to be different from the correlation functions of the woven textiles presented in other studies.9,11,14 In particular, several oscillations are clearly visible in the present correlation function, indicating the presence of several meso-scale variabilities. The largest wavelength, 40.7 mm, of the corresponding power spectral density was close to the correlation length found in textile reinforcements with tight weaving. The following mechanistic explanation can be proposed. Variability in the textiles is more likely to be introduced by the weaving process, i.e. shuttle movements. Variability in the ADFP preforms is introduced by either vibrations of the robotic arm, spring back effect of the uncoiled tows or variability of the material, i.e. non-straight tows or variability of the tow width. In both cases, longer correlation lengths can be related to mechanical constraints – yarns in tight weaving are restricted from movement by other yarns (by both friction and compression mechanisms) and tows in an ADFP preform are restricted from movement by the binder. The second wavelength in the correlation function for the ADFP preform is related to the wavy edges of the tows (which are produced by slitting wide tapes).
The stochastic modelling and permeability experiments yielded mean values of permeability, which are 14% lower that the experimental mean value and within its 99% confidence interval. This, however, does not apply to the standard deviation of the permeability, which was found to be two to five times lower than the experimental standard deviation. Distributions of the permeability measured from the samples and predicted with the stochastic model were also significantly different. The experimental distribution is close to a lognormal distribution and has a right tail with several high values of permeability. However, the simulated distribution of permeability was almost symmetric (though a right tail was present). These discrepancies stem from several assumptions in both modelling and experiments.
The stochastic model of the ADFP preform included only variability of the gap width, while the gap height is also variable and its effect is quite important as can be seen from comparison of the models of as-designed and averaged geometries. The measurements obtained from the micrographs showed that there is a weak correlation between the gap width and gap height but no mathematical model can be assumed at present. Possible underestimation of the gap height, as well as absence of unintended gaps between the tows, explain the absence of high values of permeability in the simulated distribution (Figure 16). In order to address these issues, further improvements to the model are planned for the future.
As for possible experimental errors, the ADFP preform could have non-uniform thickness and hence fibre volume fraction. The lower thickness could result in additional artificial flow paths. Furthermore, the permeability rig was intended to replicate linear flow in the closed RTM tool with constant cavity depth while the top mould could have deflection of up to 0.15 mm as discussed in ‘Optical characterisation of preform geometry’ section. Both of these factors can be a source of high permeability values observed in experiments. Another possible source of error, the race-tracking effect, was ruled out by discarding relevant samples after observing the flow front through the transparent top of the mould. This observation revealed the error in the permeability measurements owing to the flow front distortion and sensor position. It is of interest for future research to estimate the measurement error and reduce its significance. Finally, the differences between the modelling and experiments include the model assumption of in-plane flow with no coupling between the layers and the saturated flow while the experiments were performed for unsaturated media. The shape of the flow front for multi-layer preforms and accuracy of the presented homogenisation procedure were shown to be dependent on the ratio of through-thickness and in-plane permeability. 38 However, it is expected that the difference between the permeabilities in this preform is of an order of magnitude everywhere except for the programmed gaps, which should not result in more than 10% difference between the presented model and more refined models.
The experimental data presented in this article are more applicable than merely to this single design of a preform. The variability of the gap width is invariant of the programmed gap width, because the tapes are placed individually, one by one. Therefore, it is possible to estimate the effect of variability on preforms with an arbitrary gap width and, importantly, to use the width of the gap as a tool to mitigate the effects of its own variability. For example, consider a preform with a programmed gap width of 2 mm whose variability is identical to the one measured in ‘Characterisation of ADFP preform’ section. Repeating the procedures described in ‘Variability modelling’ section, reveals that the permeability of the preform with variability is only 12% lower than that of the as-designed preform with ideal geometry. However, increase of the gap width should be carefully considered as it can lead to the higher distortion of the flow front similar to race-tracking, which can reduce the robustness of the process. The outlined idea is an important step towards fully engineered materials, which combine both design for performance and for manufacturing approaches.
Conclusions
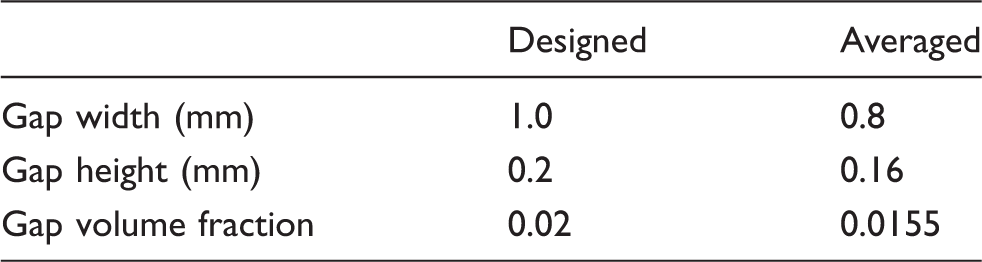
For the first time, the geometry of the ADFP preforms was studied in detail by means of image analysis. The average gap width was 20% lower than the designed gap width (0.8 mm instead of 1.0 mm) and the CoV of the gap width was up to 25%. Therefore, the use of the as-designed geometry for modelling purposes is unacceptable.
Experimentally measured permeability was found to be marginally more than half the predicted permeability of the designed preform. Permeability of the ADFP preforms was found to have a lognormal distribution with CoV of up to 15%. The permeability predicted using the averaged geometry parameters and the average permeability predicted with stochastic models were within one standard deviation of the experimental results and within 20% of their mean values. Predicted CoV of the permeability was found to be only 3.5%. The presented data on geometry of the ADFP preform and its permeability can be used for resin injection simulations to predict the mould filling time and flow patterns. Such simulations are of interest for future studies.
The model presented includes only one type of variability, the width of the programmed gaps between the tows, while in practice, the height of the channel is also variable and other sources of variability are present. Furthermore, the flow through the preform was homogenised using assumptions of series and parallel flow. There is therefore scope for further study of the ADFP geometry by detailed numerical simulations of mould filling. This work demonstrates the importance of considering the real geometry of the fibre preform. It shows that even small deviations from the designed geometry can result in large deviations of the permeability. At the same time, this gives opportunity to mitigate the variability by changing the programmed gap width as outlined above.
Footnotes
Acknowledgements
The authors would like to express their gratitude to the National Composite Centre (NCC), Bristol, UK, for help with experimental ADFP trials and Dr Andreas Endruweit (University of Nottingham) for help with permeability experiments.
Declaration of Conflicting Interests
The author(s) declared no potential conflicts of interest with respect to the research, authorship, and/or publication of this article.
Funding
The author(s) disclosed receipt of the following financial support for the research, authorship, and/or publication of this article: This work was supported by the Engineering and Physical Sciences Research Council [grant number: EP/K031430/1], through the “Robustness-performance optimisation for automated composites manufacture” project.