
Abstract
Automated image analysis of textile surfaces allowed determination and quantification of intrinsic yarn path variabilities in a 2/2 twill weave during the lay-up process. The yarn paths were described in terms of waves and it was found that the frequencies are similar in warp and weft directions and hardly affected by introduced yarn path deformations. The most significant source of fabric variability was introduced during handling before cutting. These resulting systematic deformations will need to be considered when designing or analysing a composite component. An automated method for three dimensional reconstruction of the analysed lay-up was implemented in TexGen which will allow virtual testing of components in the future.
Keywords
Introduction
The properties of a composite component are greatly influenced by the orientation of the fibre reinforcement. 1 Aligning the fibres precisely in the loading direction yields optimal properties. For instance, a deviation of just 2.5° reduces the compressive strength by10%. 2 Weaving fibre bundles into fabrics for easier handling, for example, introduces fibre crimp which reduces the mechanical properties of the reinforcements. 3 Other textile variabilities such as varying yarn spacing,4,5 yarn path waviness 6 and wrinkling 7 can also significantly influence subsequent properties. Effects of variability due to randomness of the filament arrangement within fibre bundles are ignored in this work.8,9
Ignoring these intrinsic variabilities when using a unit cell modelling approach will lead to over- or underestimation of the material behaviour such as stiffness or damage. 10 During the stacking process additional misalignment can be introduced between layers. In the example of stacked plain weave unit cells it was demonstrated numerically and experimentally that different configurations of stacking will influence the resulting mechanical properties differently.11,12 Compaction during mould closure and layer nesting will introduce additional variabilities and ultimately affect subsequent properties of a composite component. 13
It is known that different types of variability can affect the composite properties, but their characterisation is challenging. Composite variability is usually determined subsequent to manufacture of a component using either conventional optical microscopy of sample surfaces 14 or non-destructive microcomputed tomography.15,16 These data then allow yarn paths to be described in three dimensional space and the path variability to be quantified. The poor image contrast due to low X-ray absorption or the similar atomic structure of the polymer matrices when analysing carbon fibres using microcomputed tomography 17 makes automated image processing difficult. Therefore, slices of volume images are often analysed manually by drawing envelopes 18 or fitting ellipses 19 around yarn boundaries. Analysing the image anisotropy it was shown that automated image analysis is feasible.20,21 These test methods are, however, restricted in size and only small samples can be analysed which makes them unsuitable to assess the variability at the component scale.
In this work, the fabric variability in layers of a 2/2 twill weave were determined by automated analysis of optical images taken during the lay-up process on the component scale. There is no need for transmissive light to determine bundle spacing, which necessitates a transparent mould tool and is only applicable for the study of a single textile layer. 22 The proposed analysis of yarn edge detection is limited to sample surfaces only; however, the limited thickness of the yarns allows out-of-plane paths to be estimated. The implemented image analysis process enabled intrinsic misalignment such as varying in-plane waviness and handling induced shearing, both of which affect the fibre angle, to be quantified. Tedious and time consuming manual determination of bundle edges23,24 is overcome. Automatically analysing edges of visible, small bundle segments in this work allows in-plane bundle waviness and small local width changes to be determined. Methods which fit higher order polynomials to the determined edges of longer bundle lengths25,26 may not capture these small changes. The implemented analysis method of the spatial domain provides detailed information on local yarn path orientations and yarn width changes which cannot be determined when analysing images in the frequency domain, e.g. Fourier analysis of larger images of textile reinforcements. 27
The image processing approach in this study does not depend on a known fabric unit cell. This is in contrast to other techniques proposed in the literature, for example, to determine deformed unit cells in a reinforcement by correlating local Fourier spectra of images to nominal dimensions. 28 A similar approach was used to specify the weave repeat in a textile layer, combining spatial and frequency domains of images. 29 Another employed a Gabor filter, based on a representative set of fabric unit cells with varying dimensions selected from a textile layer, to determine fabric distortions in an image of a textile layer. 30 These methods do not, however, allow determination of individual yarn path variabilities and only provide information on deviations from nominal values. Using different illumination patterns and analysing bi-directional reflectance distributions of carbon fibre bundles, it was possible to determine local yarn orientations in images. 31 It was not feasible, however, using this method to determine localised effects such as local yarn spacing variations.
The analysis in this work also made it feasible to reconstruct a geometrical model of the fabric in TexGen. 32 Determination of the textile variability for every individual layer after placement in the mould tool will allow virtual testing of a component with its specific characteristics while it is still being manufactured.
Materials and data acquisition
Materials and manufacture
The geometric variability within a carbon fibre 2/2 twill weave (Figure 1) was studied. In total, 20 fabric samples were cut from a fabric roll and analysed after placement in a rectangular mould tool with dimensions of 250 mm × 250 mm × 2 mm. The nominal yarn directions were oriented parallel to the mould tool edges with warp and weft directions being kept constant between different layers. The positions and orientations of the layers cut from the fabric were recorded and controlled throughout the experiments (Figure 2). Distortion of the cut fabric samples during handling and placement in the mould tool was minimised as far as possible. After mould closure, the lay-up containing five layers was impregnated with an epoxy resin by vacuum pressure driven resin transfer moulding.
Idealised unit cell, created using the open source software TexGen (http://texgen.sourceforge.net), of the 2/2 twill weave fabric (Product TC4111250) supplied by Sigmatex Ltd. Areal density, Af = 380 g/m2, Warp and weft yarns: T700SC 12K 50C. Schematic of the layer positions cut from the supplied fabric roll.
Image acquisition
Available analysis techniques, such as microcomputed tomography, allow visualisation of the internal structure of textile reinforcements. These studies are, however, restricted to small areas
15
and are applicable only after completion of manufacture of the part. Optical images of the surface of every reinforcement layer were captured immediately after placement in the mould tool. This allowed determination of fabric distortions and quantification of the degree of intrinsic misalignment during the composite manufacturing process. A specialised transparent mould tool for image acquisition is not required.
22
The images of the fabric were taken using a standard SLR camera (Sony DSLR-A200) equipped with a N50 lens. Using an inexpensive conventional camera rather than a scanner
25
will allow extension of the image acquisition method to the general three-dimensional case in the future. To achieve a sufficiently high image resolution, six overlapping images were taken at a high magnification using a positioning frame.
33
The average resulting pixel size was determined to be 0.04 mm. The lens distortions were determined prior to the test and the individual images were adjusted accordingly.
34
The camera was positioned perpendicular to the flat mould tool. Possible misalignments due to unintentional camera rotations and translations were corrected before the images were tiled
35
and cropped to the cavity size (Figure 3). The use of directional lighting from the sides increased the contrast between horizontal and vertical yarns, thus improving the subsequent image analysis.
Tiled and cropped image of a 2/2 twill weave (layer a3 in Figure 2). The contrast of warp and weft yarns is increased by use of directional lighting form the sides. Estimated centre lines for selected warp and weft yarns are indicated. The inset shows a local magnification and the determined bundle section outlines and yarn centre paths after image analysis.
Image analysis
The fabric mesostructure was determined automatically by a morphological analysis technique (Appendix) implemented in a purpose developed Matlab program.
33
This image analysis method is based on the determination of colour gradients
36
of visible individual yarn sections. Of course this method requires that neighbouring yarns can be differentiated. Yarn variabilities such as local bundle widths and orientations can be measured in a time efficient manner. The analysis time for each yarn section (Figure 4) was estimated to be about 0.1 s on a standard desktop computer.
(a) Determined horizontal and vertical edges of a yarn section. (b) A four sided polygon is fitted through selected edges and displayed on the original image. The width, w, the distance between centre coordinates on the short edges, d, and the angle, ϕ, are shown.
Initially, approximate centre positions of all bundle sections were determined by simple thresholding of the original image. A predefined stencil, larger than the expected maximum bundle section dimension, was centred on each of these positions and subsequently local image analysis was performed. Horizontal and vertical edges were determined separately (Figure 4(a)) from the thresholded morphological reconstruction of the original image. Rules were defined to identify which edges in the image belong to the outline of a visible yarn section based on combined edge lengths and relative positions. A four sided polygon was then fitted to the selected edges (Figure 4(b)) which was considered to be a sufficiently good approximation of the shape of individual yarn sections. All bundle outlines were checked and the possibility of manual reselection of bundle outlines was implemented. The error as a result of the image processing was estimated to be approximately±1 pixel.
As a result, data such as the height, width and orientation of a bundle section as well as the relative position within the layer were obtained. Connecting adjacent bundle sections in the direction of the bundle path enabled the reconstruction of entire fibre bundles. Assuming continuity of the yarns, hidden bundle sections were approximated by a linear fit between visible sections.
Fabric mesoscale variability in single layers
Yarn width variability
The average bundle section widths in the warp and weft directions are significantly different, despite the same type of yarn being used (Figure 5). The distribution of bundle segments in warp direction follow a bell shaped curve with a mean of 3.89 mm. The weft yarns show a right tailed distribution with a mean of 3.14 mm. The upper and lower limits of the bundle width distributions are, however, similar for both directions.
Yarn segment width, w, distributions for (a) warp and (b) weft yarns. The average width distributions for all 20 layers containing 18,116 warp and 18,404 weft yarn segments are shown as red dotted lines and the mean and standard deviations are plotted in the figure.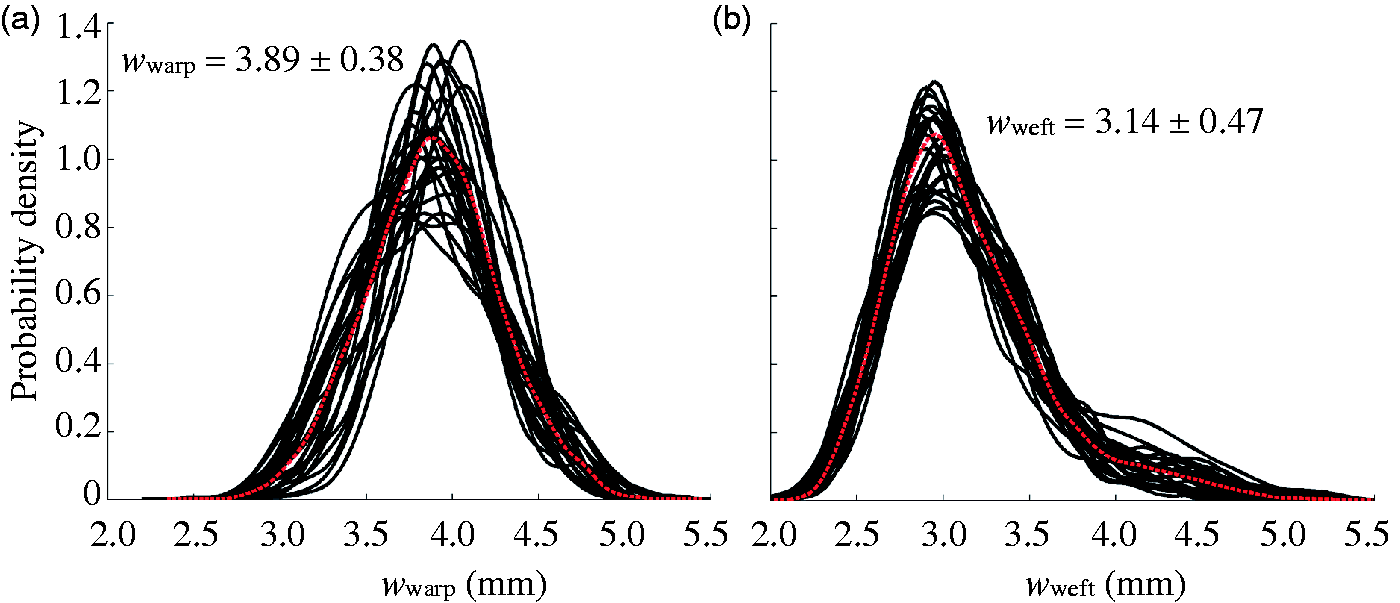
If the relative position of the bundle sections in the mould tool is combined with the known position of the layer in the original fabric roll, it is possible to visualise the bundle width change as a function of the yarn position (Figure 6). The gaps between different layers are a result of the image processing where yarn sections at the boundaries are ignored. In addition, the edge of the cut fabric layers can fray during handling. The differences in width between warp and weft yarns are clearly visible (Figure 6(a) and (b)). The tail present in the width distribution of weft yarns (Figure 5(b)) is a result of a few wide yarns and may be caused by the weaving process.
Measured (a) warp and (b) weft yarn width, w, in single fabric layers (250 mm × 250 mm) after placement in the mould tool in respect to the position cut from the fabric roll. Every point corresponds to a yarn segment.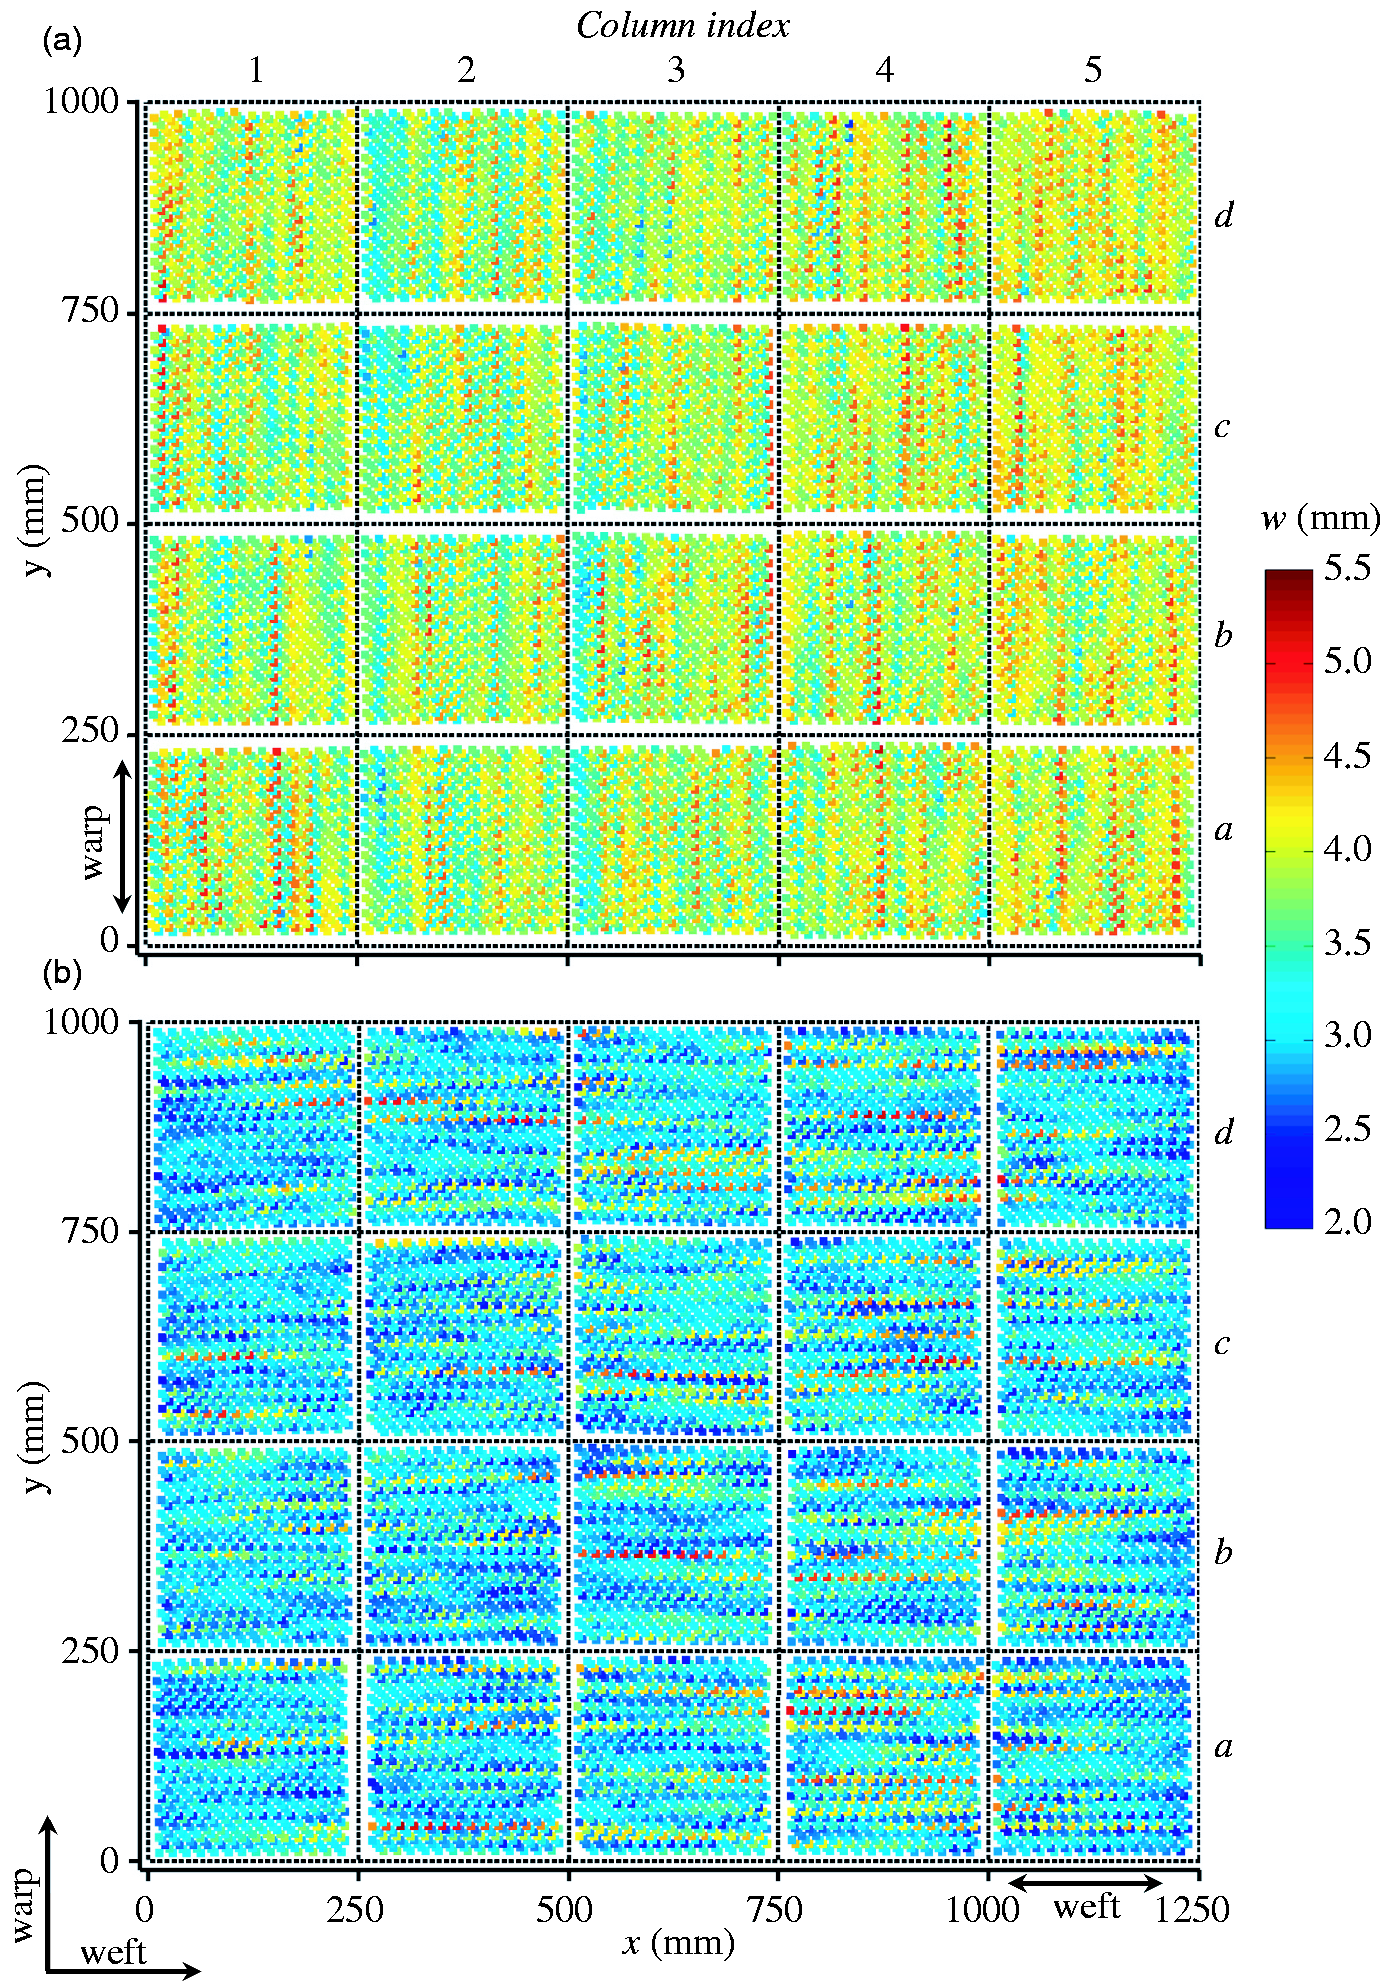
Yarn orientation
Similar to the local yarn width (Figure 6), the orientations of individual yarn sections with respect to the mould tool were determined and plotted at the corresponding positions in the original textile sample (Figure 7). As care was taken to minimise the distortion during handling, the local bundle orientations correlate between adjacent layers. This is especially noticeable for the orientations of weft yarns (Figure 7(b)).
Orientations of the (a) warp and (b) weft yarns measured after placement in the mould tool in respect to the position cut from the fabric roll. Every point corresponds to a yarn segment. The positions where the majority of force was applied to unroll the fabric are indicated by the hands and the arrows illustrate local yarns directions.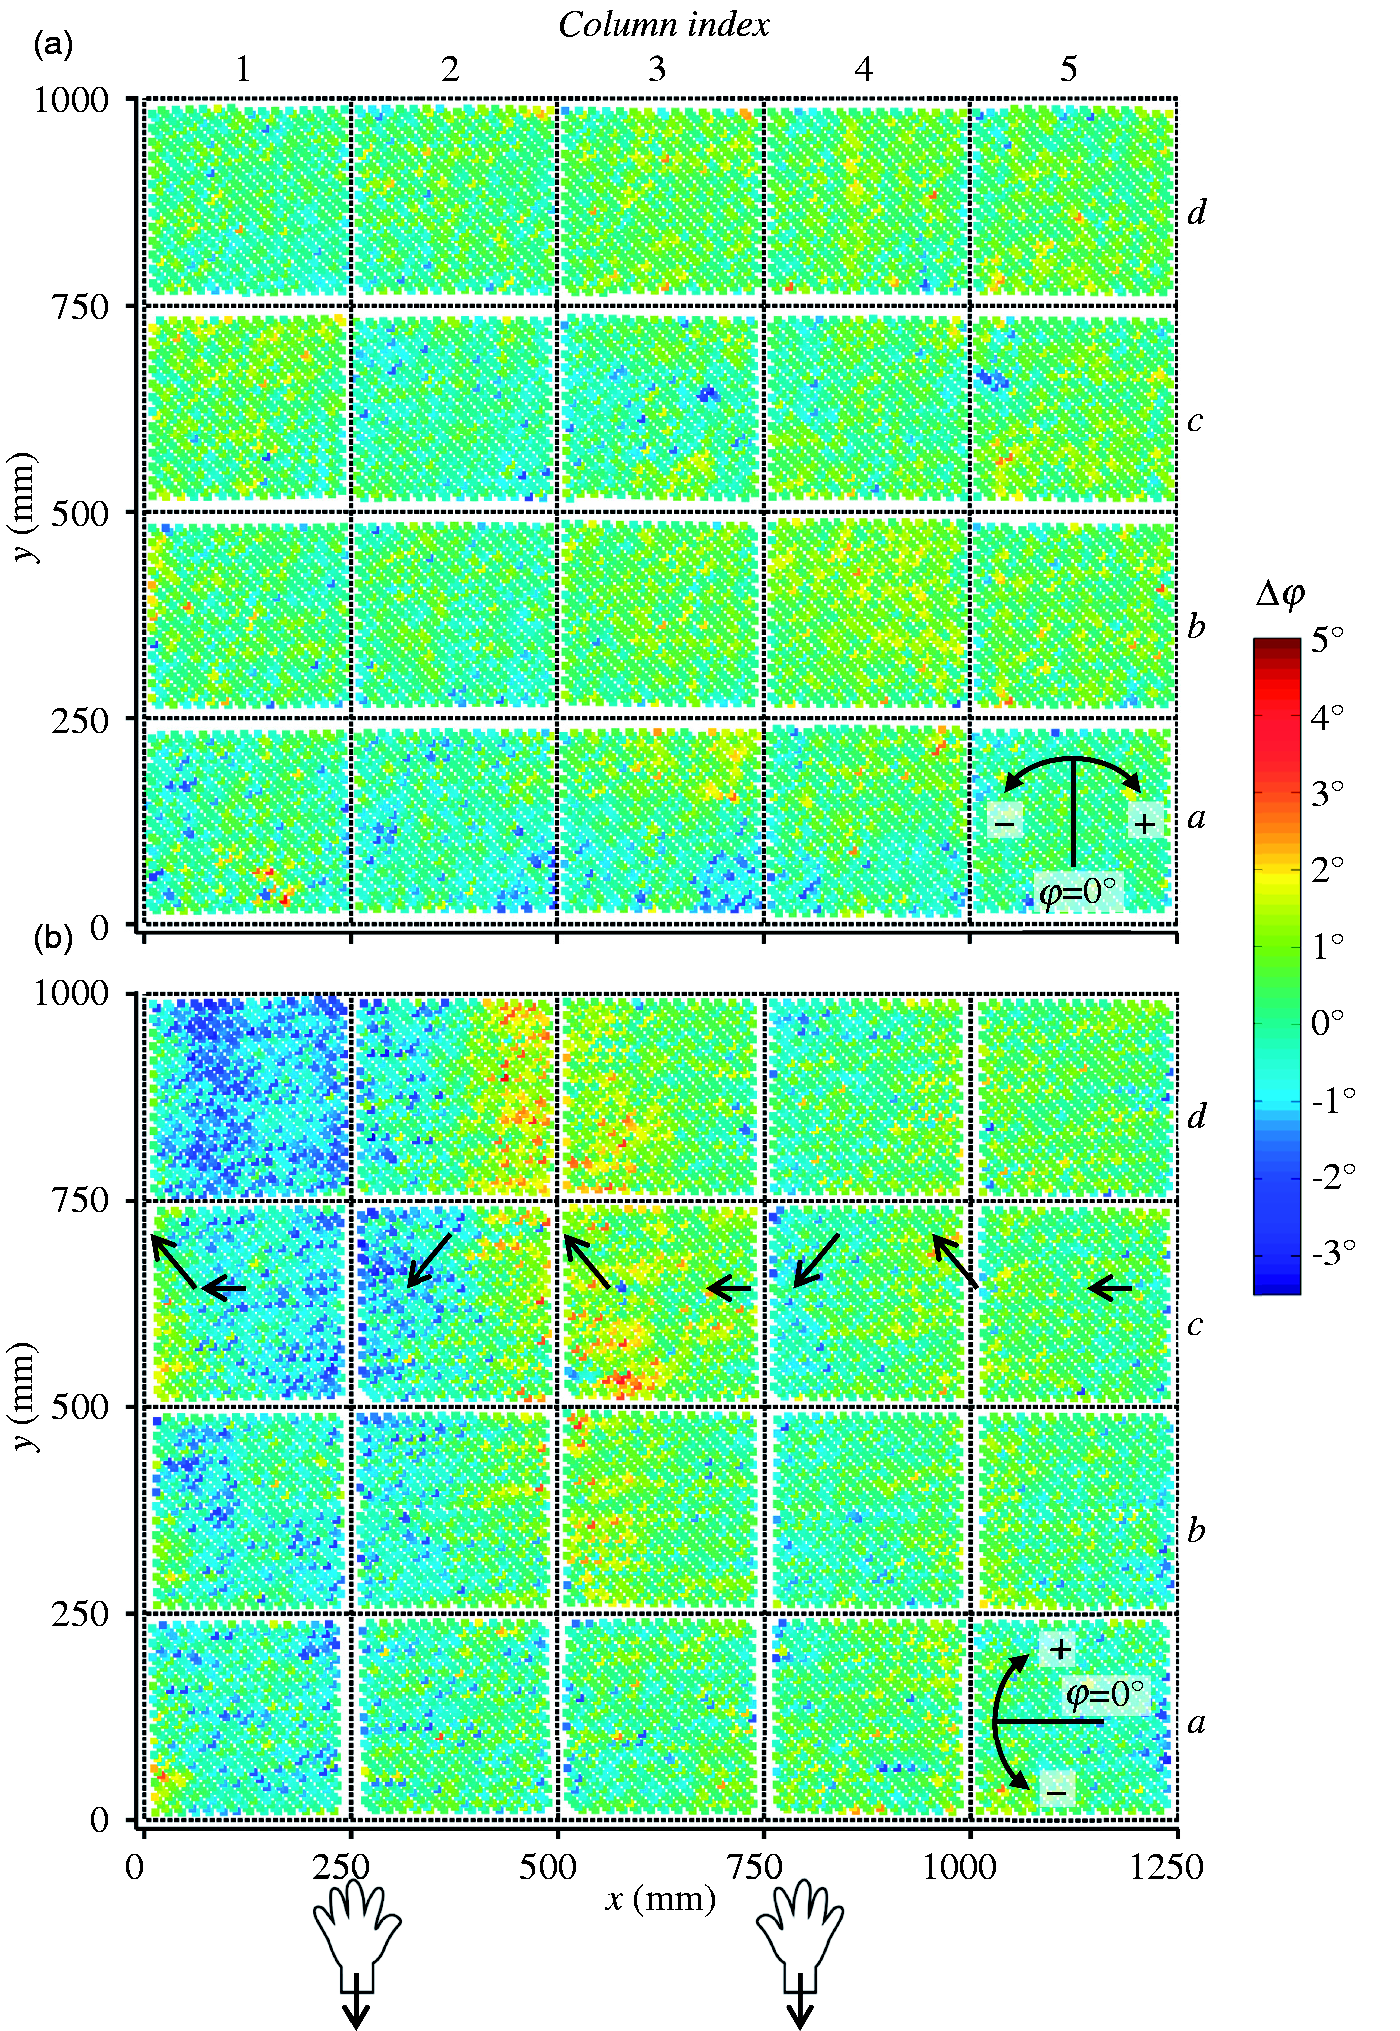
The fabric was first unwound by about one revolution and then pulled manually from the roll. Before cutting, the fabric was aligned on the cutting table. The orientations of weft yarn sections in the bottom row (row a) of cut layers therefore exhibit similar orientations. Advancing further into the fabric (rows b–d) an area of strong positive orientation of the weft bundle sections in the fabric centre (columns 2–3) develops. In addition, a distinct area of strong negative orientations to the left (columns 1–2) and a small area of slightly negative orientations to the right (columns 3–4) of the strong positive orientation is visible. These areas of negative orientation of the weft yarn sections correspond to the pulling direction, being formed where hands are positioned as they pull the fabric off the roll. The area of strong positive orientation is developed as a result of this pulling process in between the points where force was applied.
The more distinct area of small positive weft yarn orientations to the right of the fabric (columns 4–5) is probably also caused by this unwinding process. This area is less distinct than the one in the centre as the pulling force is located more towards the left of the fabric. The small areas of strong positive weft yarn orientations at the left edge of the fabric are probably caused by the presence of the stitch yarn, stabilising the fabric at the sides and resisting the pulling force. The deviations in yarn orientation at the edge of the individual layers may also be formed by the handling of the fabric after placement in the mould tool. The data in Figure 7 suggest, however, that the largest amount of yarn misalignment in the analysed fabric is caused by the unwinding process. The handling after cutting and placement in the mould tool may have only caused minor distortions.
As a result of the fabric deformation before cutting, the individual layers exhibit different types of misalignment after placement in the mould tool. Layers c2 and d2, for example, have strongly curved weft bundles. Combining the information from the warp and weft yarn orientations it is possible to identify the fabric shear present in, for example, layers d1 and b4. All of these deformations will affect the subsequent properties of the composite and may influence these differently depending on their combination in a lay-up.
Yarn waviness
Contrary to the common assumption in geometric representations of a weave the yarn paths are not straight, due to the weaving process, storage or deformation of the fabric. The changes in a yarn path can be described in terms of a harmonic signal (in terms of sine and cosine functions). Such wave functions have, for example, been used to describe paths of individual filaments in fibre bundles 37 or to describe the yarn waviness induced by the weaving process 14 when analysing micrographs. The description of waviness in this way is beneficial when employing analytical solutions to determine composite properties 38 or to generate input for numerical models. 4 In this work, coordinate positions along the longitudinal yarn axis are treated as being equivalent to a time signal and the change in position transverse to the yarn as an amplitude. This enables the use of the discrete Fourier transform (DFT) to determine the frequency, amplitude and phase shift of a yarn path.
From the analysed fabric samples, approximately 13 yarn sections were determined over the length of a yarn (Figure 3). For each yarn section, the midpoints on the short edges were used as input (Figure 4). This resulted in an average sampling frequency (number of samples per metre) of 130. The average spacing between different samples is about 8 mm, which determines the maximum frequency resolution of the analysis.
The determined positions along the yarn path, N, are not equally spaced as required by the DFT and small variations are therefore corrected by piecewise polynomial interpolation. The transverse coordinate positions are subtracted by the respective mean position of the yarn to normalise the data and are used as amplitudes (Figure 8(a)). To adjust for the influence of possible fabric shear on the analysis of the yarn waviness, all yarn data are rotated by the mean angle with respect to the mould tool before analysis.
(a) Determined yarn paths normalised by the average position of selected weft yarns indicated in Figure 3. (b) The corresponding frequency spectrum determined by DFT. The red triangles indicate the largest magnitude peak which corresponds to the main frequency.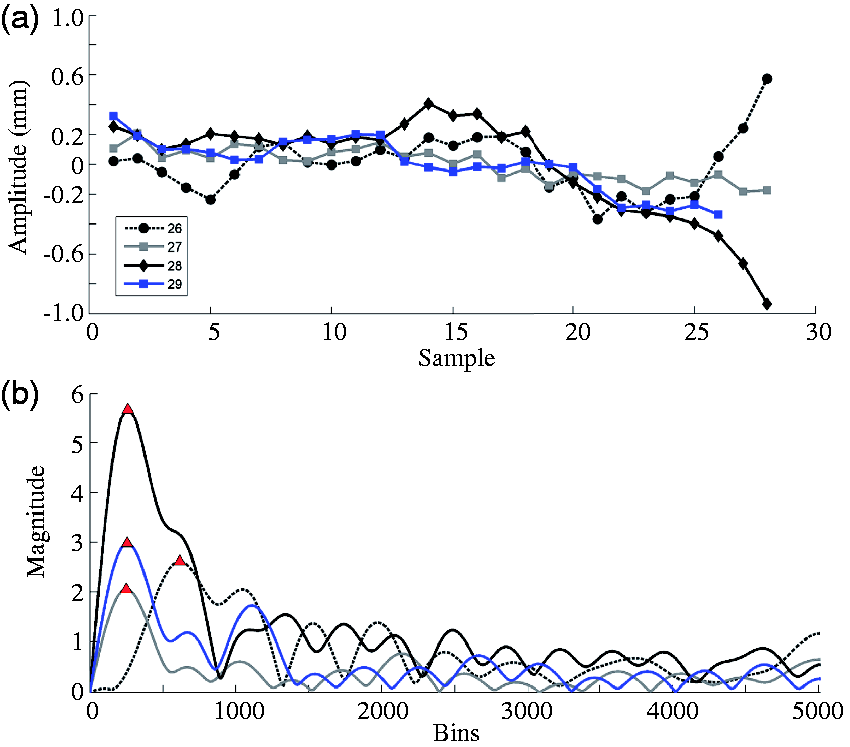
The DFT returns bins and magnitudes, which correspond to wave frequencies and amplitudes, respectively (Figure 8(b)). The bin numbers from 0 to N/2 − 1 correspond to the number of oscillations of the waves. Because the fibre bundles do not follow a perfect wave form or have an integer number of cycles, no single peaks are visible but rather large lobes. This effect is known as spectral spreading. The bin position of the maximum magnitude value of all lobes of a yarn corresponds to the main frequency. In order to better determine the peak positions of the main lobes, the initial input data are padded with a large number of zeros (10,000 were chosen) which increases the number of frequencies the DFT is able to fit (increase in N). It was refrained from using a window function 39 to adjust for the discontinuity of the signal before zero padding because of the limited number of data points, as this reduces the frequency resolution.
Individual yarn path waviness
The weft yarn waviness parameters of the determined harmonic functions for a cross-section of the fabric (column 2 in Figure 7(b)) are shown in Figure 9. The data points reflect the determined main frequencies only and possible smaller frequencies are ignored and probably smaller than the accuracy of the image processing. The minimum accuracy of the amplitude is estimated to be approximately 0.08 mm which is equivalent to a 2 pixel deviation (±1 pixel). Data points marked in red are not significant as their determined yarn path deviations are below this limit.
Main frequency amplitude and phase shift for all 271 weft yarn paths in the layers of column 2 in Figure 7B (x = 250–500 mm). The analysed yarn lengths are approximately 200 mm. Data points in red have amplitudes lower than the image processing accuracy of 2 pixels (±1 pixel).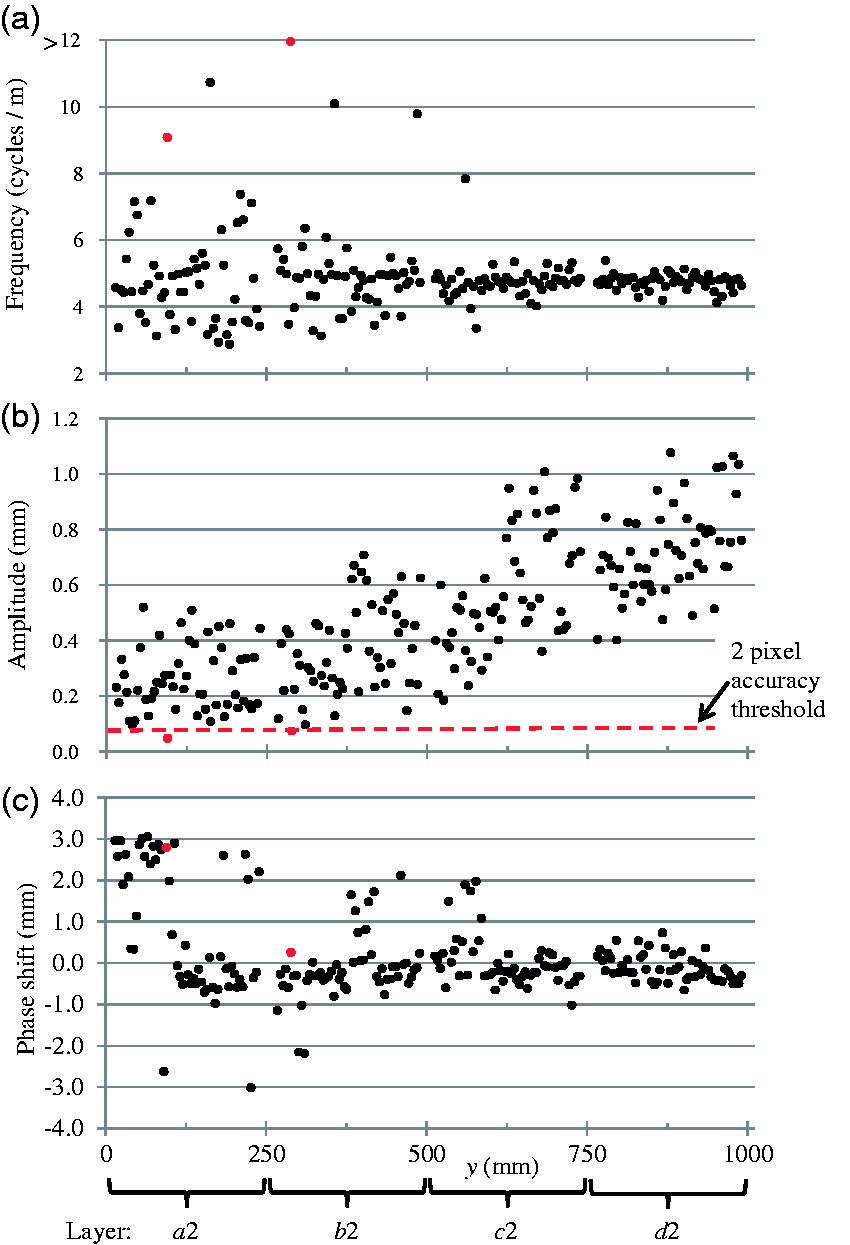
The scatter in weft yarn frequency reduces (Figure 9(a)) with an increase in deformation. This increase in deformation is also visible as an increase of amplitude (Figure 9(b)). The average frequency does, however, remain fairly constant and changes from 4.88 ± 1.57 cycles/m to 4.74 ± 0.26 cycles/m (layers a2 to d2) only. This corresponds to a wavelength of about 205–211 mm which is similar to the fabric sample size and also to the roll diameter of 203 mm at which the corresponding piece of textile was stored.
The average weft yarn frequencies for the different layers in Figure 7(b) range from 4.20 cycles/m to 5.36 cycles /m which corresponds to an average wavelength of 204 mm. If the yarn paths are described in terms of autocorrelation, it is expected that this will be insignificant after the inflection point of ¼ of the wavelength. This is approximately after 3 unit cell lengths for the analysed fabric. This is of the same order as reported weft yarn autocorrelation lengths of 4.6 unit cells for a 6K 24 and 3–4 unit cells for a 12 K 2/2 twill weave. 18 The sample size in these studies was similar to that used in this work; however, the very limited number of samples in these studies may not allow a generalisation of the trend.
The determined average warp yarn wavelength (Figure 7(a)) in this work was 203 mm (4.91 cycles/m) and is similar to the weft yarn frequency. The lower and upper limits of the average fabric layer wavelengths are 3.56 cycles/m and 6.62 cycles/m, respectively. The average amplitude of 0.19 mm in this case is however rather small. The more tightly packed warp yarns (Figure 3) do therefore appear more straight and uniform than the weft yarns. The reported autocorrelations for the warp yarns in other twill weaves were about the same 18 or twice as large as the weft yarn autocorrelation. 24 The data for the ¼ warp wavelength in this work does lie in between these two studies. As the warp yarns in the fabric used are fairly closely packed and the gaps between yarns are small, the observed value is closer to the tighter weave. 18
Correlations between neighbouring yarns
The cross-correlation between yarns may be a function of the weave density. 18 The tighter the weave, the more the distortion of one yarn influences neighbouring ones. The phase shift between the main frequencies of yarns can be used as a measure of cross-correlations. The weft yarn phase shift seems to be largely constant for the examples shown in Figure 9(c) (625–1000 mm) which is in the area of large yarn path deviation (samplesc2 and d2 in Figure 7(b)). The yarn path deviations are pronounced enough for the neighbouring yarns to be affected. This leads to a largely constant phase shift between neighbouring yarns.
Scatter in phase shift is visible in the range of 0–625 mm (Figure 9(c)). This suggests that individual yarns may not necessarily influence neighbouring yarn paths due to larger spacing or smaller local deformations. The average cross-correlations between yarns of a tight weave are therefore very large 18 or about the length of a single unit cell for a less tight weave. 24 It should be noted that even on the small number of samples scatter was observed, depending on the location of the yarns. Analysing a larger number of samples in this work it was found, however, that a single cross-correlation or a correlation distribution is not applicable for the entire fabric but that this depends on the position and amount of local deformation in a fabric. The maximum difference in phase shift is, however, bound as a result of yarns being interwoven and of the stiffness of the bundles which will only allow a certain amount of waviness.
Geometric reconstruction of a textile layer
The image analysis data can be used to reconstruct the geometry of a textile layer. Alternatively, the measured data may be used to create statistically equivalent yarn arrangements as input for a numerical model. For the reconstruction of the three-dimensional geometry in Figure 10, the intersection points of the yarn centre lines are calculated from the analysed images giving a set of x and y coordinates. Two nodes are specified at each of these intersection points with z coordinates being specified as ±one quarter of the average weave thickness, t = 0.6 mm, from the weave mid-plane. These nodes are used to create yarn paths in TexGen. An elliptical cross-section is specified at each node using the widths extracted from the image data, thus enabling the variation in both yarn path and width to be modelled accurately. The local height, h, of the assumed elliptical yarn cross-sections was estimated based on a determined empirical relation to the widths, w, for the analysed textile following: h = −0.0342·w + 0.3511.
(a) The imaged surface of a twill textile layer and (b) the two- and (c) three-dimensional view of the reconstructed TexGen model.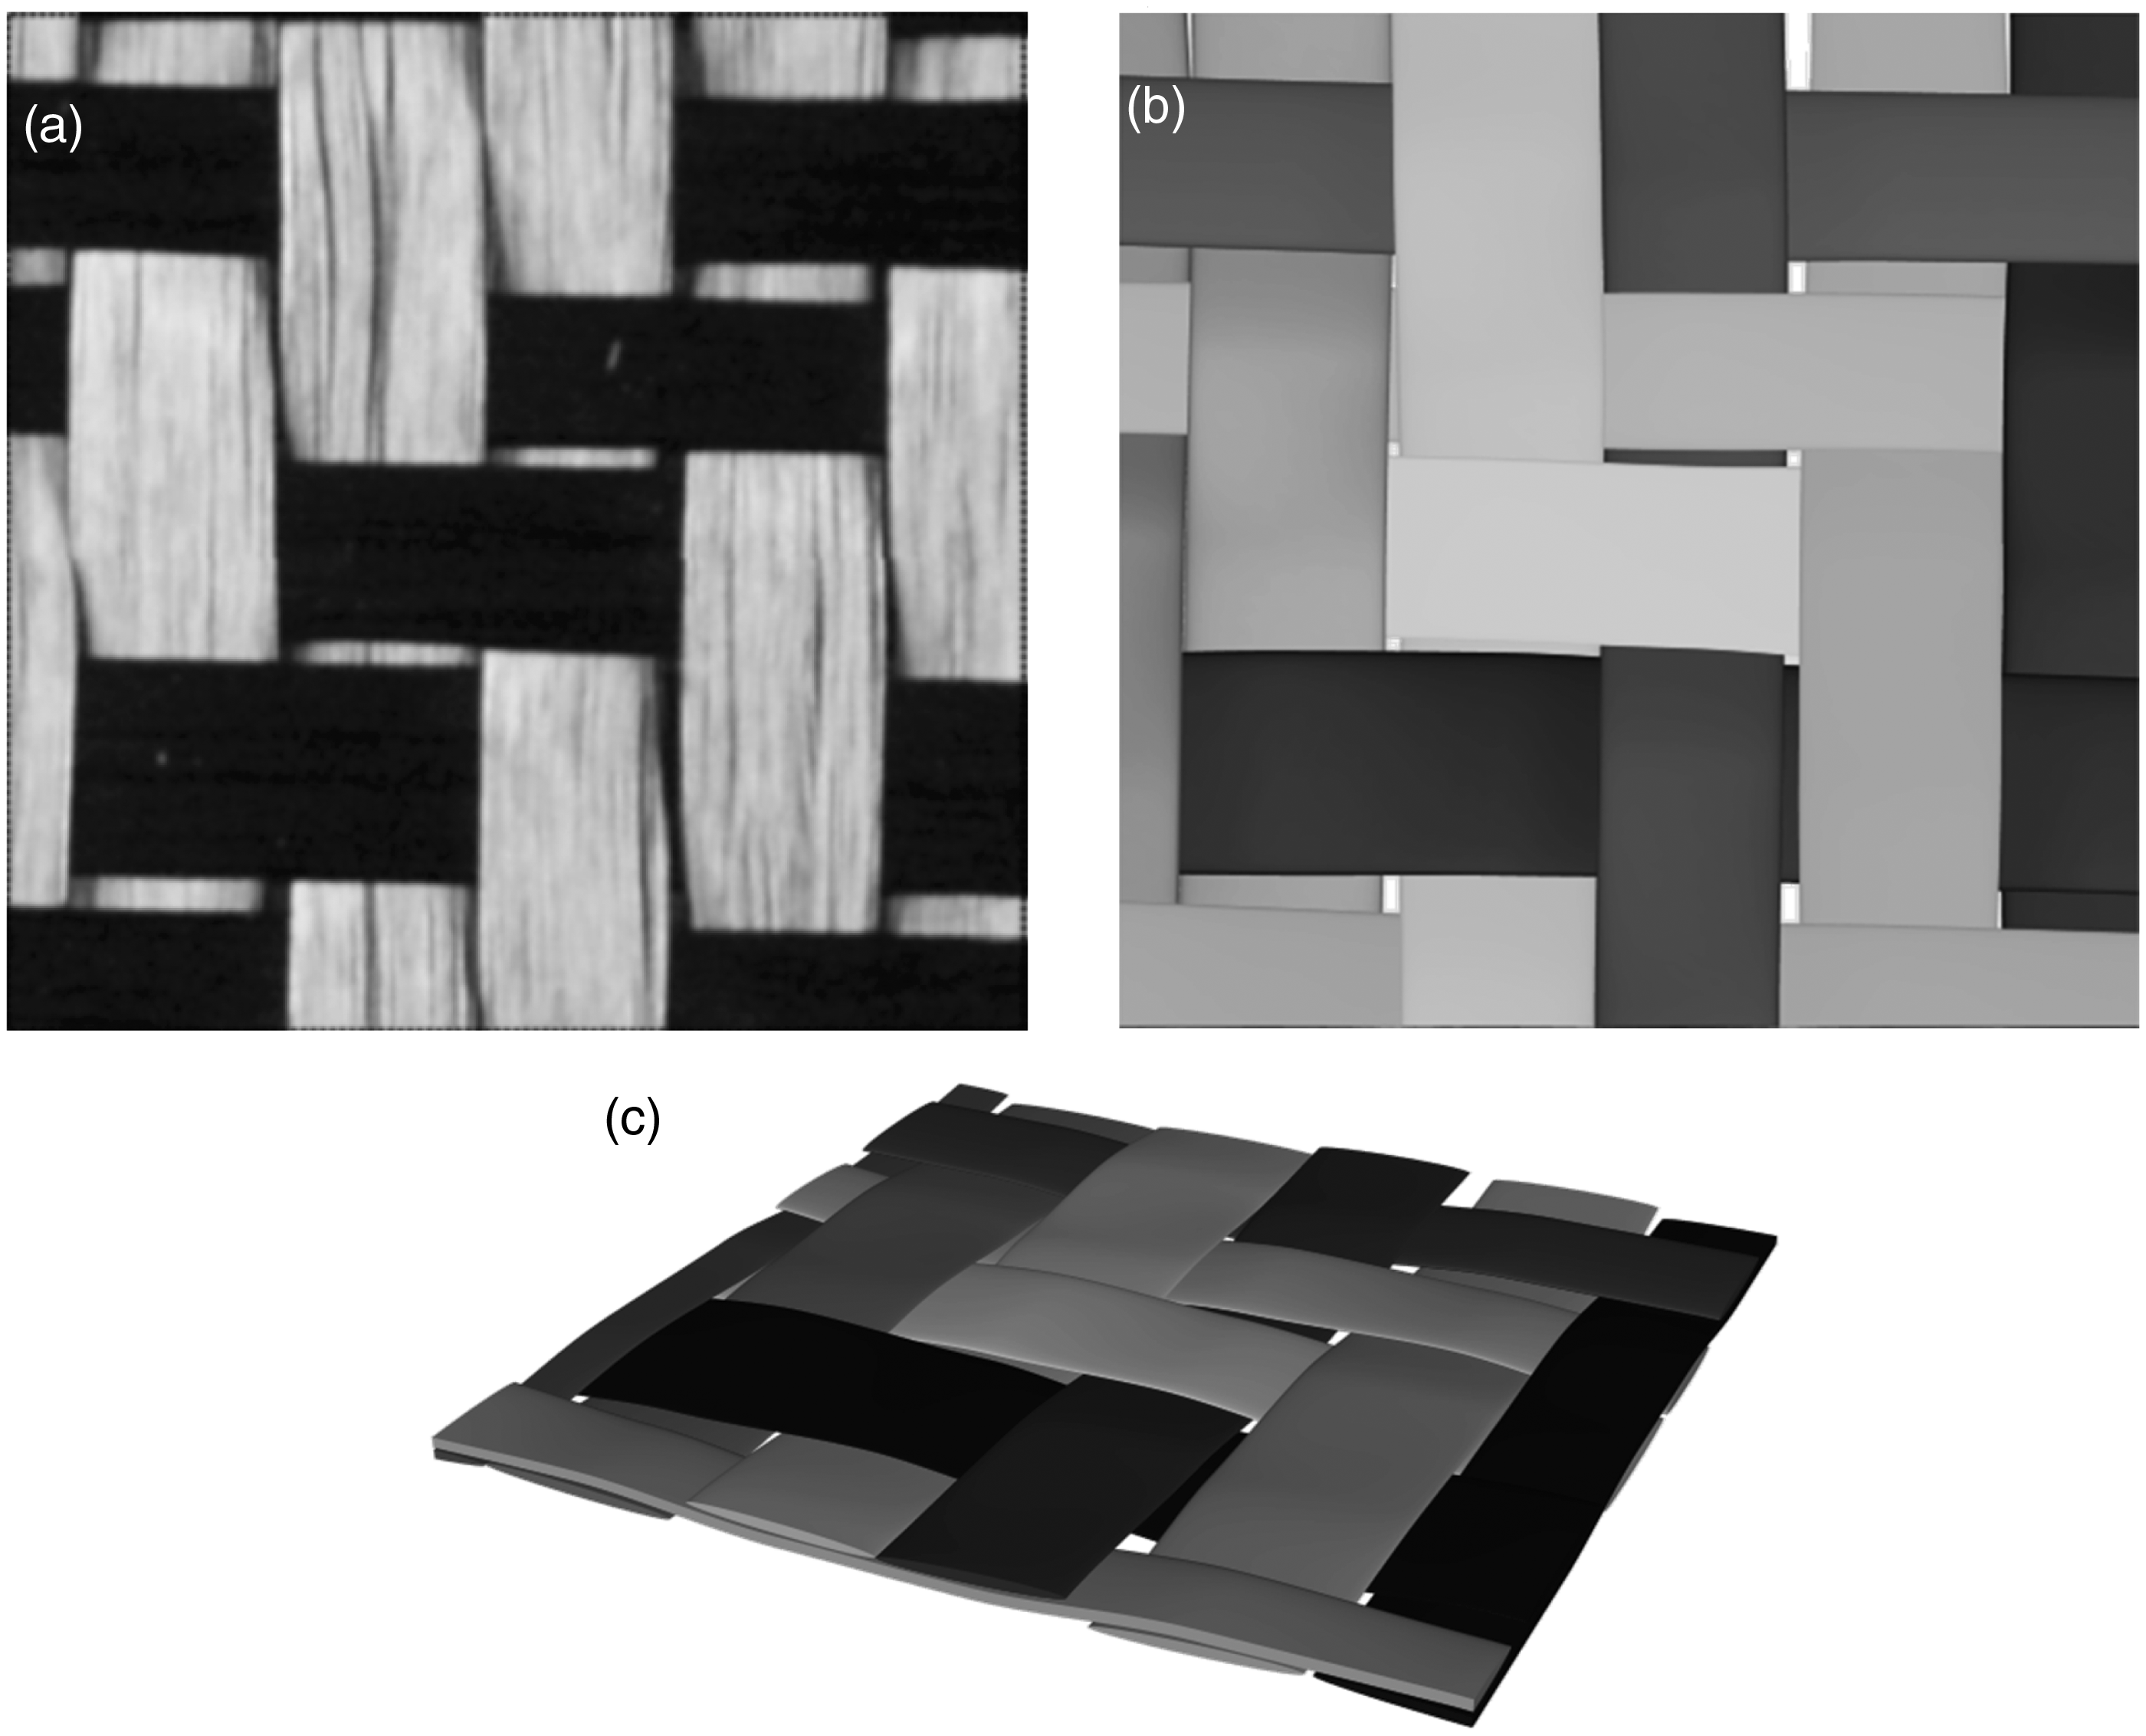
Small intersections were present in the model between some of the adjacent parallel yarns, possibly due to the limits in image processing accuracy. An intersection correction algorithm was added to TexGen to eliminate these yarn intersections and will be available with the next release (http://texgen.sourceforge.net). The width of each intersecting yarn is reduced by half of the amount of the intersection and the cross-section nodes are moved by one quarter to preserve opposite yarn edges. In addition, refinement options are available which will rotate yarn cross-sections and ensure that interwoven yarns are not intersecting in the geometrical model. The resulting TexGen model is in good agreement with the input data (Figure 10(a) and (b)). In order to take bundle shape changes into account when compacting the fabric in a mould tool, 40 the generated TexGen model of the uncompacted fabrics can then, for example, be used in compaction models to predict bundle deformations.41,42
Concluding remarks
The image analysis implemented in this work enabled local yarn variabilities of a balanced twill weave fabric after placement in the mould tool to be quantified. A significant difference in warp and weft yarn widths was observed which will have a strong influence on subsequent processing properties such as permeability. For example, knowledge of these details during the manufacturing process will enable injection strategies to be improved.
It was found that the warp and weft yarn in-plane waviness, characterised by the frequency, are similar and in a fairly narrow range independent of the amount of deformation of the analysed fabric samples. It is therefore likely that the yarn waviness is an intrinsic fabric property. This may be the result of the weaving pattern, the weaving loom or the fabric storage at a certain roll diameter. However, as the frequencies are similar in warp and weft direction, the yarn waviness is probably already introduced during yarn manufacture, when the yarns are tightly wound and stored on bobbins before further processing. This will introduce a permanent curvature which is not eliminated by the yarn tension during the weaving process.
Yarn path deformations were found not to change the main wave frequencies significantly but increase their amplitudes. This may, however, be related to the type of deformation and can be different for others. The majority of fabric deformation was related to handling of the material before cutting which introduced local yarn path deformations. Fabric layers are therefore not necessarily random but may exhibit correlated yarn paths, depending on their relative positions before being cut from a continuous textile sheet. When layers are combined with the same nominal yarn orientation but with distorted yarn paths in opposite directions locally, this will lead to local stress concentrations in the finished part. For the numerical analysis of a lay-up, the combinations of layers depending on their initial positions in the fabric need to be considered. This will improve the model accuracy by incorporating systematic fabric deformations which may be introduced during the handling process in addition to random variabilities.
The determined in-plane yarn waviness was found to have a similar magnitude compared to the out-of-plane waviness introduced when interlacing the yarns. From the reconstructed textile geometry in TexGen, a maximum out-of-plane misalignment in the fabric thickness direction of about ±6° was found. Whereas the out-of-plane misalignment is a localised effect, intrinsic to the weaving process, the measured in-plane waviness will affect the entire lay-up. These two types of misalignment may, however, affect the composite properties differently. For example, the localised out-of-plane yarn crimp will result in local stress concentrations whereas the in-plane yarn waviness is thought to have a stronger effect on the inter-laminar shear properties.
The fabric variability measurements in this work were obtained during the lay-up process. The implemented transfer of data from image processing to a geometrical textile model will, in the future, allow virtual testing of a component with its specific intrinsic variabilities before the part is actually produced.
Footnotes
Declaration of conflicts of interest
The author(s) declared no potential conflicts of interest with respect to the research, authorship, and/or publication of this article.
Funding
The author(s) disclosed receipt of the following financial support for the research, authorship, and/or publication of this article: This work was supported by the Engineering and Physical Sciences Research Council (grant number: EP/IO33513/1), through the EPSRC Centre for Innovative Manufacturing in Composites (CIMComp) and by an EPSRC Doctoral Prize award hosted by the University of Nottingham.