
Abstract
In the present paper, the torsion and compression behaviors of lattice structures were studied. The PLA (Polylactic Acid) materials were used in assembly and produced by additive manufacturing method. The structure and lattice behaviors were investigated by Digital Image Correlation (DIC) system during experimental study. Models created using three different unit cell model as Trunch Octa Dense, Trunch Octa Light, Body Diagonals With Nodes and two different, 70 mm and 140 mm, total length size. The influence of the unit cell model, cell size on the strength of the structure were studied by compression and torsion experiments. The maximum compressive stress and maximum torsion were obtained and their deformations were presented. The highest maximum torque was determined in Body Diagonals With Nodes cell model and 140 mm due to the fact that the cell model structure compatible with torsion. The highest compressive stress was determined in Trunch Octa Light cell model and 140 mm cell length.
Introduction
Lattice structures produced by additive manufacturing methods have superior features compared to solid structures produced by traditional methods. Features such as lightness, design originality, high strength, energy absorption have led to the use of lattice structures in many industries; aviation, automotive applications, construction, biomedical applications. Manufacturing is an essential factor in getting the desired mechanical properties of the composite. Upon this, examination of the mechanical behaviors as torsion and compression is very critical for an effective design. The post-production use of lattice structures and their deformation behaviors depend on design parameters such as the struts forming the lattice, cell size, and unit cell geometry. There are various methods, including structure and material optimization, selection of manufacturing technologies, to improve the mechanical properties of lattice structures produced by additive manufacturing, such as energy absorption, compression behavior or stiffness. 1 Various design parameters of the lattice structure, such as relative density, wall thickness, cell size, cell pattern or strut diameter, need to be considered to improve the mechanical properties of lattice structures. As the design parameters change, the response of the lattice structures to mechanical tests changes. For example, buckling in truss structures subjected to a certain load under compression testing is a critical problem that causes failure in engineering structures. 2 Lattice designs with unsuitable pore distributions can cause serious engineering problems such as crack formation.3,4 By changing the lattice structure design parameters, the effects on the strength of the structure and the hardness of the material can be investigated 5 and thus a design with the desired properties can be obtained. Most of the studies on lattice structures are based on the investigation of the properties of various lattice morphologies under compression tests. 6 However, studies on the effect of unit cell shape and size on torsional load are very limited. Therefore, an experimental study is required to analyze the torsional behavior of structures with different unit cell sizes. Considering the studies in the literature on this subject; Hallu et al. designed three different structures as gyroid, primitive and vertically inclined in their cylindrical structured models and produced them using MultiJet fusion technology. To examine mechanical properties such as torsional stiffness, energy absorption, torsion tests were performed until the models were completely deformed. Experimental results showed that gyroid structures have superior torsional stiffness, energy absorption capacity compared to vertically inclined structure. 7 Mittag et al. conducted studies that torsional load is one of the important load components and found that tubular closed structures have strong strength during torsion. 8 In a similar way Concli et al. performed several micro-scale simulations, including torsion, to fully understand the response of cells exposed to different loading conditions, in addition to compression testing to investigate the ductile behavior of rigid structures. 9 Raghav Sharma investigated the stiffness response of periodic and stochastic truss structures for bending, torsion and tension/compression loading conditions using lattice design optimization software. In the results of study found that stochastic shapes (shape structure formed by irregular unit cells) have the potential to generate the highest stiffness-to-weight ratio in test environments. 10 Behrmann et al. developed a measuring setup to determine the bending and torsion properties of two ice hockey sticks of similar hardness and length during bending and torsion tests. Three different loads of 150, 200 and 250N were applied to the hockey sticks along their length in 10 test positions. When the same torque is applied in the same position, the angle of twist of rod A is twice as high as that of rod B. 11 Sakaguchi et al. prepared PLA screws in a number of ways, including compression molding, extrusion, twist orientation, and forging, and measured their mechanical properties, such as shear and torsional strength. They obtained the maximum torsional strength at 45° helix angle and 8° extrusion ratio. 12 Zhu et al. performed a tensile and compression test including the effect of printing speed, layer height and fill rate on mechanical properties. When the layer height is 0.15 mm, the filling density is 100% and the printing speed is 30 mm/s, the tensile strength and compression strength of the model produced were measured as 58.25 MPa and 86.11 MPa, respectively, and it was found that it reached the most comprehensive mechanical properties compared to other models. 13 Tang et al. studied buckling analysis of bidirectional porous struts. The results showed that the effect of pore distribution in the thickness direction is more dominant compared to the effect of pore distribution on buckling load, and the porosity may lead to greater buckling load as it approaches the strut edge. 14 Puzovic et al. studied the consequences of including a centered hole line in an elastic column under axial loads. They found that regular spherical hole lines added to the struts can prevent lateral buckling. 15 Cheng et al. studied the method of calculating the critical buckling load of simply supported cellular struts when subjected to force about the major axis. The formula they obtained for the calculation of the critical buckling load was verified by using the results of the finite element analysis. 16 Hunt et al. worked on generating a mathematical variation to determine the post-buckling states of axially compressed cylindrical structures under displacement. It has been observed that the structures tend to oscillate as the applied load changes between the maximum and minimum values. 17 Johnson et al. studied the deformation responses related to buckling in elastic columns containing a series of holes. They explained the roles of hole-scale and column-scale buckling and how they coexist and interact with Euler buckling modes. 18 Taghipoor et al. investigated the tensile strength of polypropylene-based biocomposites reinforced with natural kenaf fibres, basalt fiber and nanographene. They used reaction surface methodology to investigate the behavior of biocomposites and analyzed the behavior of the samples using tensile testing. The results showed that the maximum tensile strength was 30.9481 MPa and the lowest showed that the optimal state of the bio-composite sample with a weight of 15% kenaf fibers and 0.862% graphene nanoparticles. 19 Niyaraki et al. investigated the mechanical properties of hybrid polypropylene and ethylene-propylene-monomer based nanocomposites reinforced with graphene nanolayers, nanoclay and glass fibers. A mixer and a hot press machine were used to prepare samples containing 10 and 20 glass fibers and 0.5 and 10 wt% ethylene-propylene-monomer samples. They performed tensile tests to determine tensile strength and impact tests to evaluate impact strength. Results showed that adding lower weight graphene nanosheets increased impact strength, tensile strength and tensile modulus by 23%, 46% and 16%, respectively. In addition, the use of nanoclay at low weight percentages increased the tensile strength by 21%, while the use of high weight percentages weakened the mechanical properties. 20 Taghipoor et al. focused on a new geometry of trapezoidal cores and their configurations. Therefore, five corrugated sandwich panels were experimentally tested under quasi-static axial compressive load and then simulated with ABAQUS software. In addition, further simulations were performed to further investigate the effect of foam density, core type and thickness. As a result, it has been seen that the energy absorption rate of double core sandwich panels not filled with foam is better than single trapezoidal core sandwich panels, and this rate is around 70%. The best performance was obtained from the pure foam core sample without any trapezoidal core structure. 21 Albooyeh et al. investigated the effects of the addition of hydroxyapatite and silica airgel nanoparticles on the density, stretch, Izod effect and morphological properties of epoxy using Response Surface Methodology (RSM). The simultaneous effects of two parameters, including hydroxyapatite content and silica airgel content, on mechanical properties were evaluated. Results from the tensile and Izod impact tests showed that the combination of hydroxyapatite and silica airgel nanoparticles led to improvement in the tensile properties and energy absorption of the epoxy matrix. The maximum tensile strength of 86.9 MPa was achieved with a hydroxyapatite content of 2.38% by weight and a silica airgel content of 4% by weight. 22 Taghipoor et al. investigated the energy absorption and collapse behavior of composite coated corrugated reinforced cylindrical absorbers. The composite coating of the cylindrical absorbers was made with carbon filaments using the filament winding method, and the graphs of the force-displacement curves and the fundamental indices of the energy absorbers under static axial loading were developed experimentally. Energy absorbers are manufactured in two different diameters, with four groove arrangements on the absorber surface, including longitudinal, semi-longitudinal, transverse and combined arrangements. The effect of the number of longitudinal grooves on the energy absorption and collapse behavior was evaluated and it was found that the composite coating could increase the energy absorption by up to 44% by delaying the initial peak force. 23 Eyvazian et al. investigated the crush response and impact resistance properties of vertical corrugated and non-corrugated aluminum circular pipes. Crashworthiness characteristics and collapsing behaviors of these structures were analyzed. Under quasi-static axial compression, high diameter tubes showed higher crash index values compared to small diameter tubes. It is concluded that the energy absorption capacity can be increased by the combination between the small diameter and the number of vertical gres. 24 Taghipoor et al. investigated the mechanical and morphological properties of polypropylene (PP) based nanocomposites reinforced with basalt fiber, graphene nanolayers and polypropylene grafted maleic anhydride (PP-g-MA). Using mixer and hot press, reinforcements are added to the matrix in three ways: 0.75% and 1.5% by weight graphene nanolayers, 0, 7.5 and 15% by weight basalt fibers, and 0.3% and 6% by weight PP-g-MA. The fiber length was determined as 5 mm for all samples. The samples were tested in tensile, bending and impact tests to obtain optimum reinforcement levels. The results showed that using 1% by weight of graphene nanosheets improved the tensile, bending and impact strength by 15%, 11% and 16%, respectively, while adding 1.5% by weight of graphene nanosheets. Revealed that these properties were weakened. Addition of graphene nanolayers at a rate of 1.5% by weight increased the elastic modulus by 69%. The addition of basalt fibers to 15% by weight increased the elastic modulus, tensile, flexural and impact strength by 27%, 85%, 10% and 8%, respectively. The addition of PP-g-MA increased the adhesion, dispersion and compatibility of the graphene nanolayer/basalt fiber to the matrix, and increased the tensile strength and elastic modulus by 18% and 71%, respectively. 25 Taghipoor et al.investigated the energy absorption and strength of fibrous reinforced concrete materials under penetrating impact loading. In order to investigate the effect of fiber percentage on impact properties, 16 samples in single and hybrid groups were subjected to experimental tests. The results showed that the strength and energy absorption of hybrid fiber reinforced concrete increased by 45.3% and 49.7%, respectively, compared to single fiber reinforced concrete. 26 Eyvazian et al. Experimental and numerical investigations of wavy square absorbers were made in their work. Numerical simulations were made on 36 wave absorbers with LS-Dyna software and their crushing properties were extracted and compared with the simple one. Effect of different parameters including wave height, wave depth and wave type; the crushing properties were also investigated internally and externally. Since the first samples were brittle, they were subjected to heat treatment and annealing in order to gain the necessary ductility for forming with mandrel and matrix. As a result of the experiment, annealing of the aluminum shells resulted in a 76% increase in final strains and a 60% and 56% reduction in yield and ultimate stresses, respectively. 27 Taghipoor et al. in their study, the performance of sandwich beams with expanded metal sheets as cores was investigated under transverse impact loading. Relationships between force and displacement at the midpoint of sandwich beams were obtained by experiments. Numerical simulations were performed using ABAQUS/EXPLICT. The results showed that up to three times increase in core layers increased energy absorption by 33.88%. 28 Taghipoor et al. In their study, they examined the performance of a sandwich structure consisting of expanded metal sheets as a core under axial breaking and transverse impact bending. Numerical simulations were performed using ABAQUS/EXPLICIT and the results were compared in detail with experimental results. Cell orientation has been shown to be a critical parameter affecting the failure mode and energy absorption ability, leading to an increase in peak load and specific energy absorption during axial fracture tests. The results showed that an increase in cell angle up to ϴ = 90 increased energy absorption by 624.4%. 29 Taghipoor et al. In their study, quasi-static three-point bending tests were performed on sandwich beams with expanded metal sheets as cores. Numerical simulations were performed using ABAQUS/EXPLCIT and the results were compared in detail with the experimental results. For experimental design techniques and finite element modeling, a parametric analysis was made using Box-Behnken design (BBD) and then the effect of core layer number, cell size and substrate thickness was investigated. The results showed that a reasonable range increase in the size of the expanded metal cell is required to improve the performance of the structure under flexural collapse. 30 Taghipoor et al. In their study, they examined the effect of lattice-core geometry on sandwich panels. The relationship between force and displacement in breaking the panels was obtained using experimental results. Three types of steel lattice cores with different dimensions were analyzed under axial impact loading. Then, effect parameters such as specific energy absorption are investigated by numerical analysis. According to the results obtained, it has been observed that there is a good agreement between the experimental results and the numerical simulation results, and the specific energy absorption capacity of the sandwich panel can be increased up to 246% with the appropriate core selection in axial impact tests. 31 Taghipoor et al. in their study, they investigated the behavior of thin-walled shock absorbers with different circular and square cross-sections under the low velocity impact test. Then, the tests continued by creating surface defects that would reduce both the total weight of the structure and the initial peak load. All samples are made of 1100 series aluminum. The results were found in the circular beam and simple square beam models of the highest absorbed energy and the highest impact force efficiency. 32 Taghipoor et al. in their study, energy absorption and collapse behaviors of rigid polyurethane foam filled sandwich beam containing expanded metal sheets as core were investigated. Three types of steel lattice cores, both unfilled and foam filled, were subjected to the quasi-static three-point bending test. The force-displacement relationships, the collapse modes of the beam and the impact parameters including absorbed energy, impact force efficiency and Specific Energy Absorption (SEA) were studied in detail. The results found that the polyurethane foam reinforcement can increase the energy absorption of the sandwich beam by up to 80%. 33 Ge et al. In their study, experimentally derived hysteresis loops from roller impact and quasi-static compression tests were used to determine the specific damping capacities for the 3D printed photopolymer. It has been found that “sticky” rubber, such as 3D-printed photopolymers based on the repeated pattern of Kelvin cells, can dissipate close to 100% of its energy in roller impact tests and still return to its original dimensions after impact. 34 Wickeler et al. In their study, the configurations of three mosaic geometries with triangular base, rectangular base and square base were tested. Due to their geometric complexity, multiple configurations of these mosaics were printed from a rubber-like material using an inkjet printer of two different thicknesses (2 and 4 mm), and the ability of these samples to absorb impact energy was compared to a non-patterned inkjet printing paper. Due to the special structure, the impact test has shown that single-layer boards are more effective at absorbing impact loads and are subject to less deformation than their two-layer counterparts. 35 Paget et al. In their study, they focus on hollow foam made from soft-shell polymer microspheres embedded in a polyurethane matrix. Compression tests were performed using a capillary rheometer and a PVT. accessory for hydrostatic compression and a more conventional apparatus for limited compression. The experimental results were compared with De Pascalis’s pressure/volume model predictions using the Seal and Allwright model to determine the critical buckling pressure of the microspheres. The model proved to be quite accurate at low and high pressure, despite a significant deviation in the medium pressure range. 36 As seen in the literature, most of the previous studies on lattice structures were conducted to investigate mechanical properties such as compression and buckling properties. However, many materials are subject to torsional moments during use. For this reason, it is necessary to examine the torsional behavior of materials. This paper focused on produced of the new three-dimensional PLA Lattice structures by the additive manufacturing method and investigation of the mechanical behaviors under torsion and compression. Since it is important to determine the damage status of the lattice structures beforehand, the behavior of torsion was monitored using the Digital Image Correlation (DIC) system. Six different lattice structures were used in the experiment. Models created using the Trunch Octa Dense unit cell model showed strength up to the maximum torsional moment value of 0.5 Nm, and did not show any permanent deformation or rupture below this value. Likewise, models created using the Trunch Octa Light unit cell model showed the same results. This situation is alike in other sizes and cell models. The models created using the Body Diagonals With Nodes unit cell model showed strength up to the maximum torsional moment value of 1.2 Nm, and the biggest role among the reasons for this is the improvement made with cubic struts in the lattice geometry in the structure. As a result of the addition of cubic struts, the maximum torsional moment that the structure can bear has increased by a remarkable 4 times.
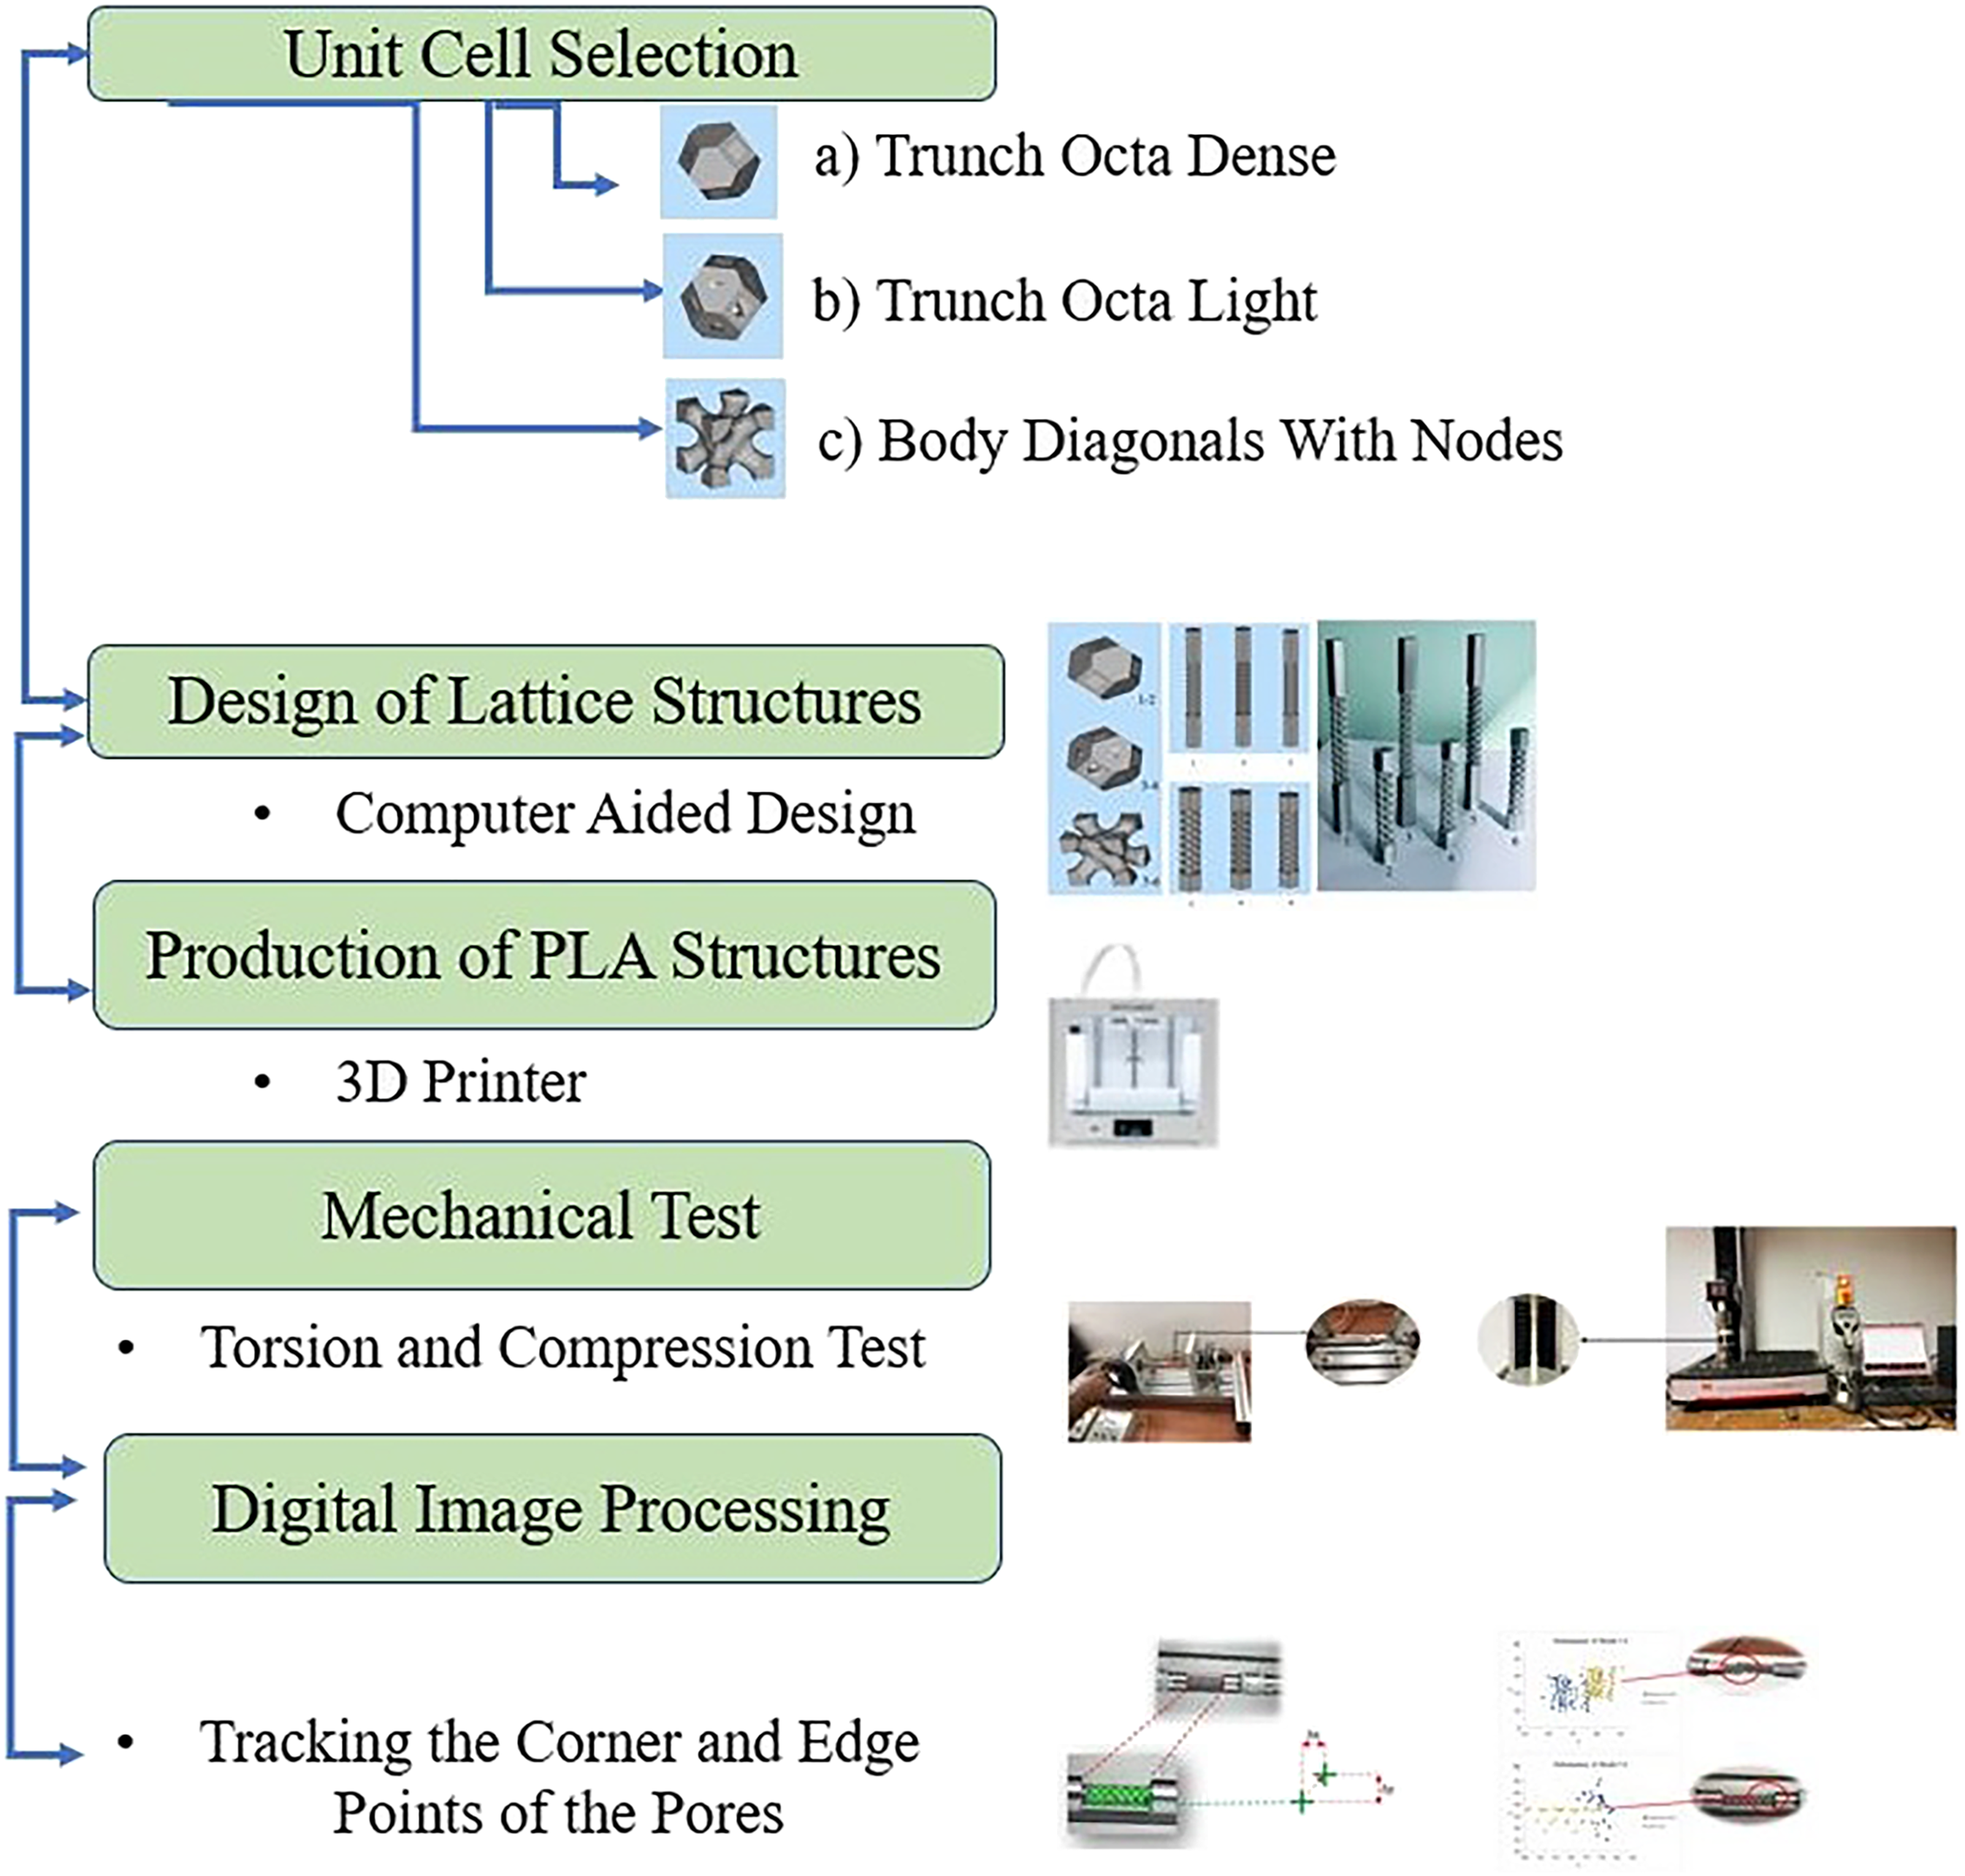
Material method
Performing 3D modeling
Using a computer aided design program, six porous lattice models were designed and saved in Stereolithography (STL) format. An example of the general drawing with the dimensions of the designed porous lattice structures is shown in Figure 1. General drawing example of the torsion test sample.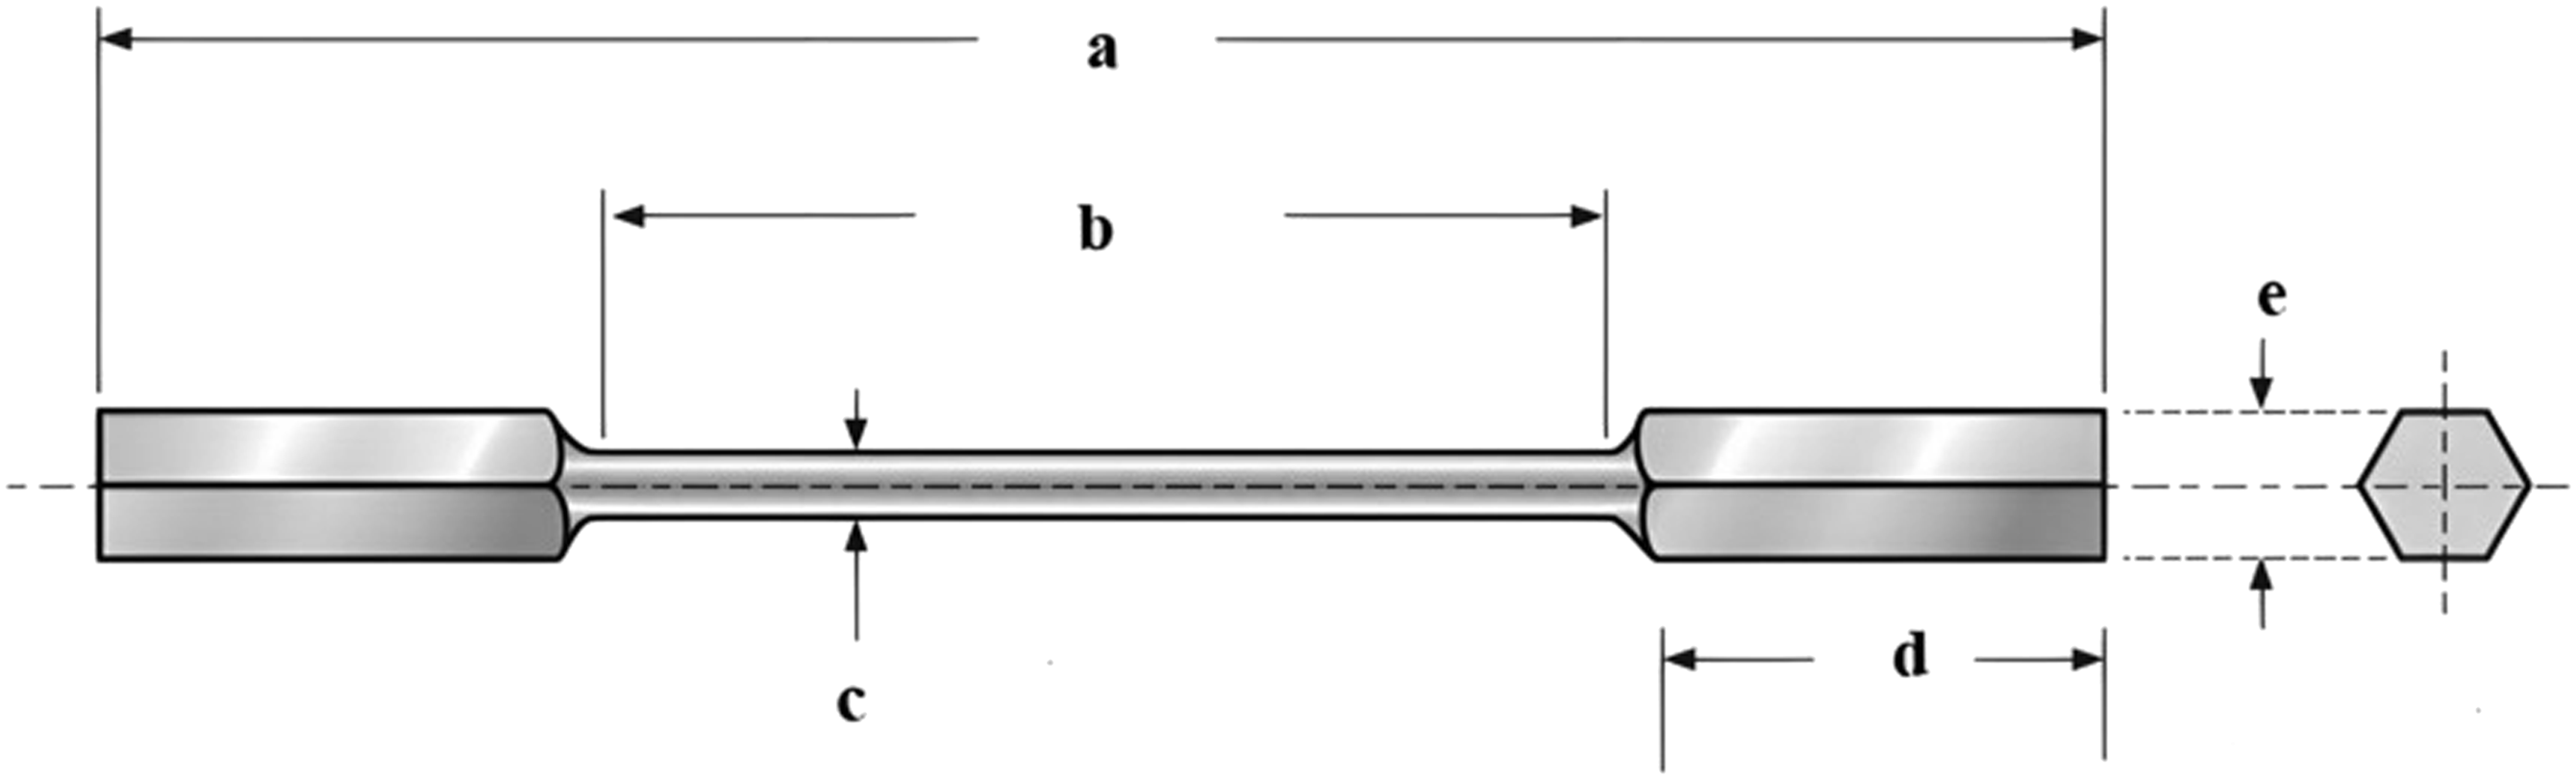
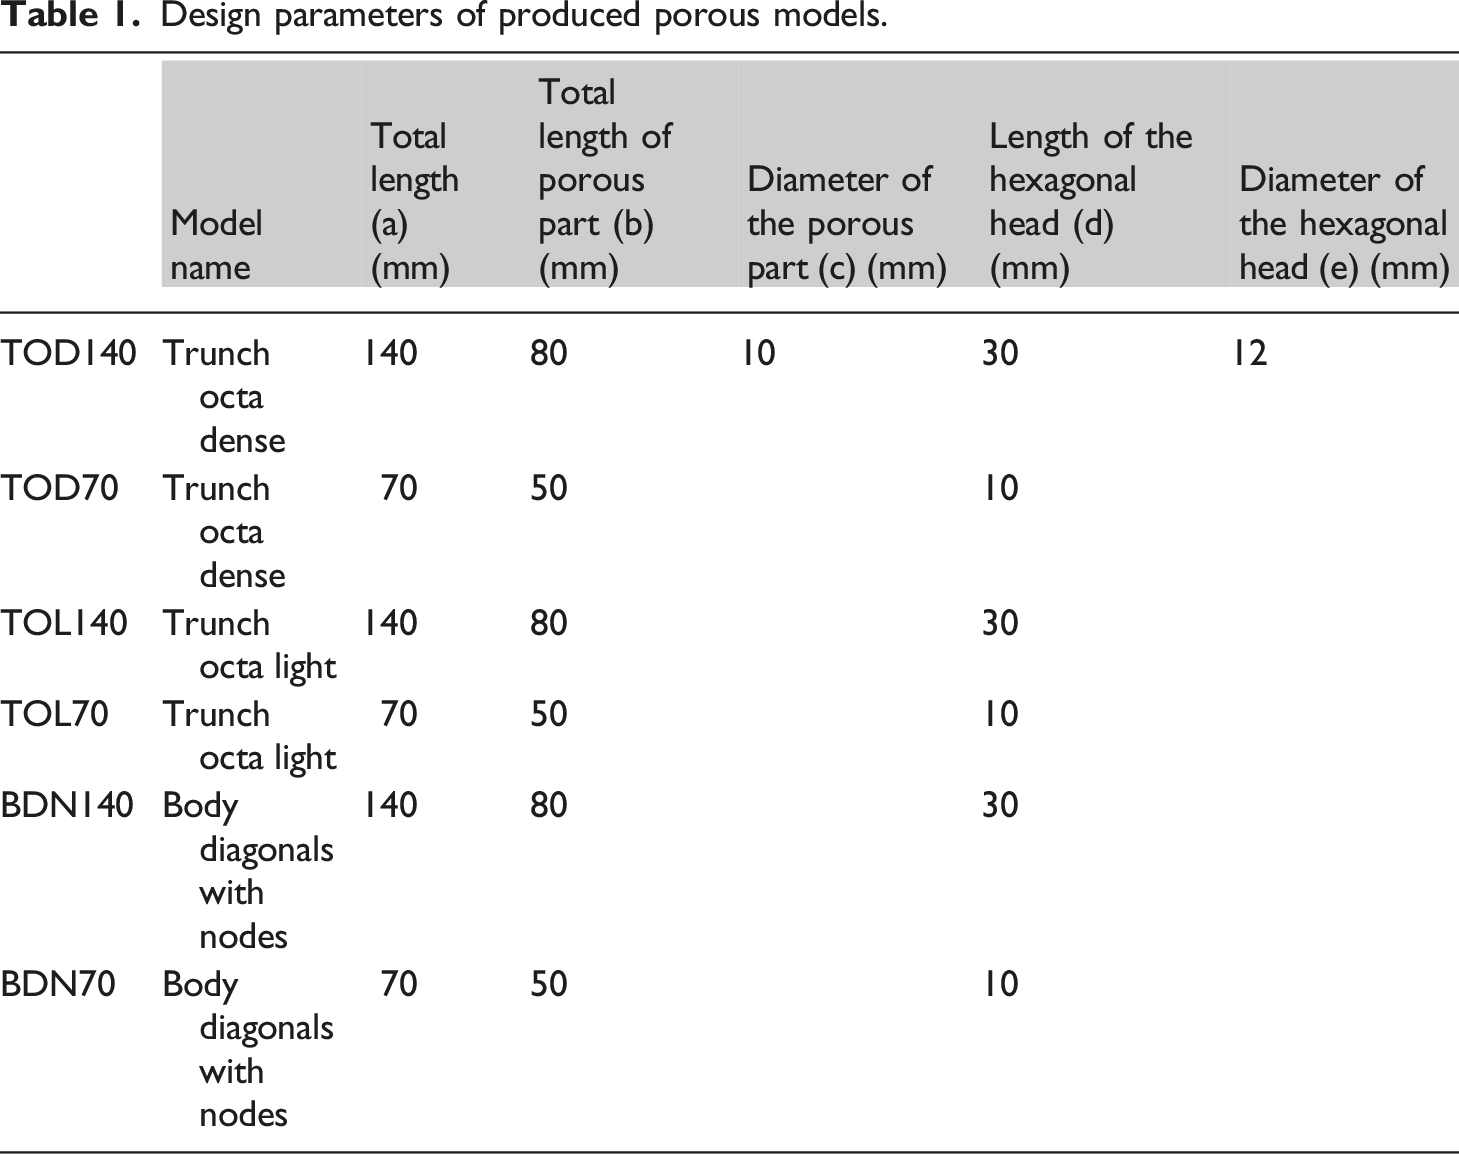
Design parameters of produced porous models.
Unit cell CAD images of the 3D porous models are given in Figure 2(a), the CAD images of the entire design of the 3D porous models are given in Figure 2(b) and the images of the produced porous models are given in Figure 2(c). The dimensional accuracy of the produced models was checked using a digital micrometer and it was seen that there was a 1.6% difference between the designed value and the produced value. Unit cell, CAD and post production images of porous models (a) Unit cell models (b) CAD images of the design of models (c) Post-production images of models.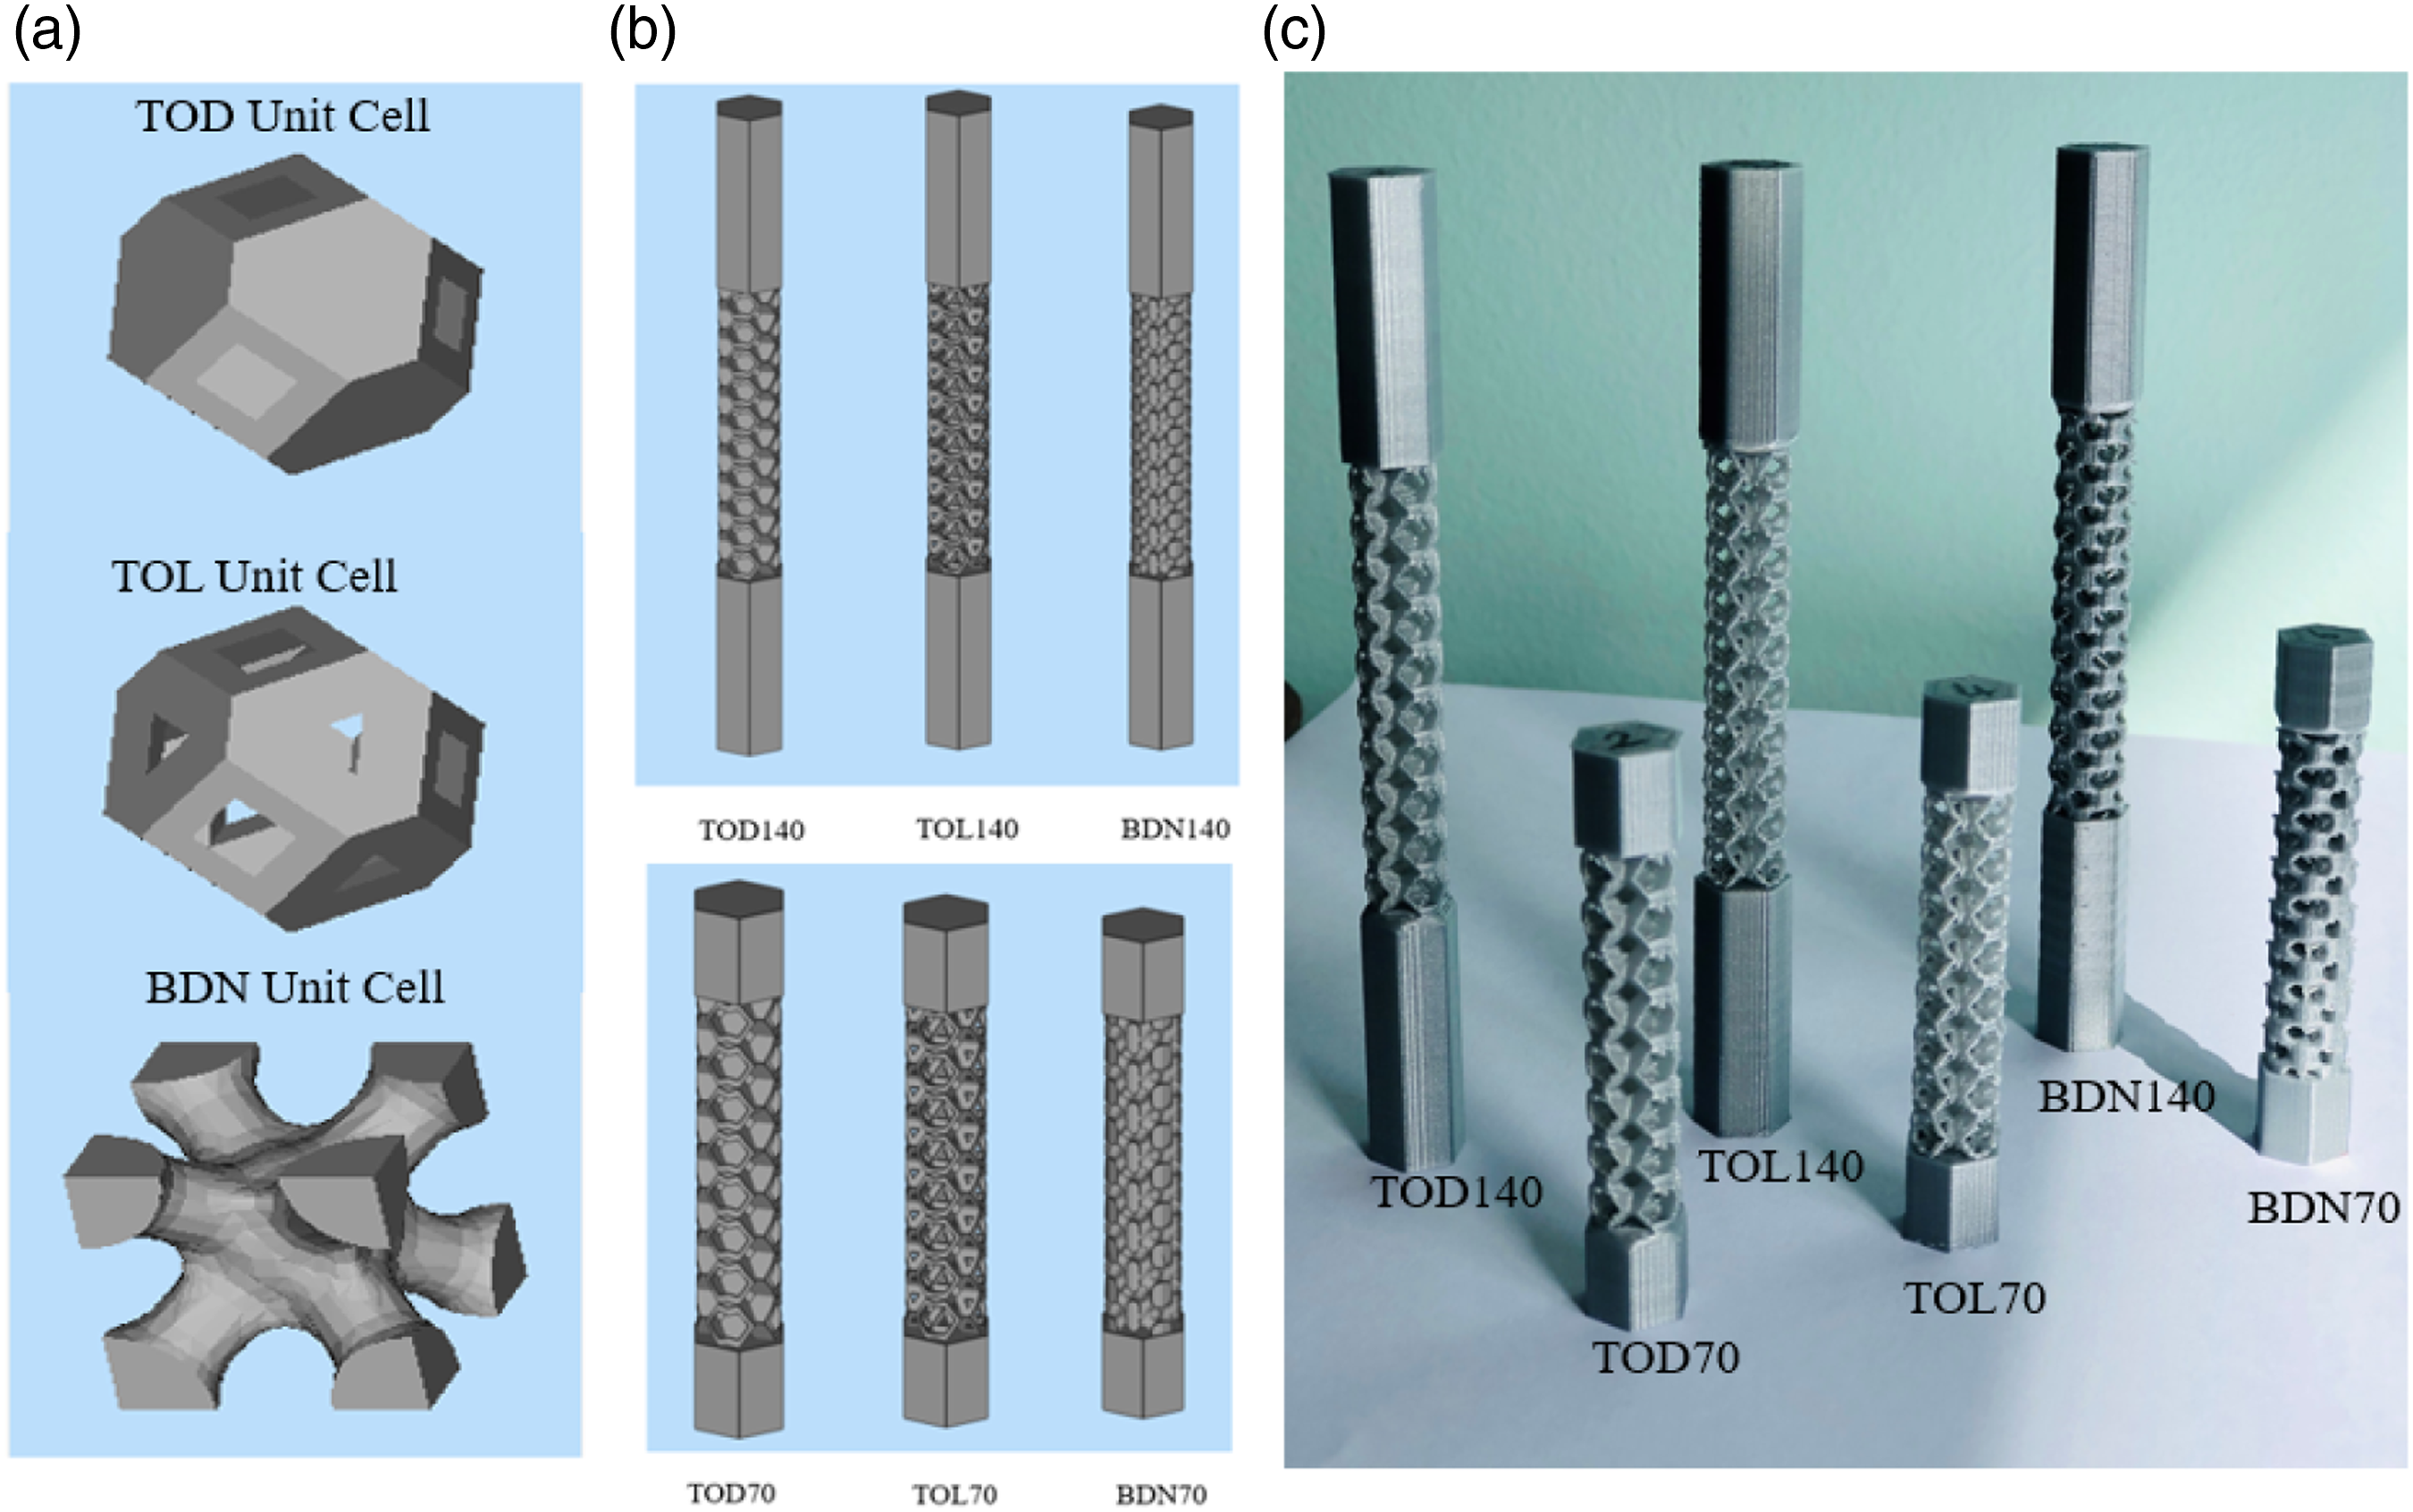
Torsion test
After the design and production phase, the torsion test phase was started. The experiments were carried out using the SM1001 30 Nm Torsion Testing Machine, which was produced by TecQuipment and working with VDAS software.
37
The torque sensor side of the experimental setup is fixedly mounted so that the produced models can be placed easily (Figure 3). Experimental setup and sample test specimen.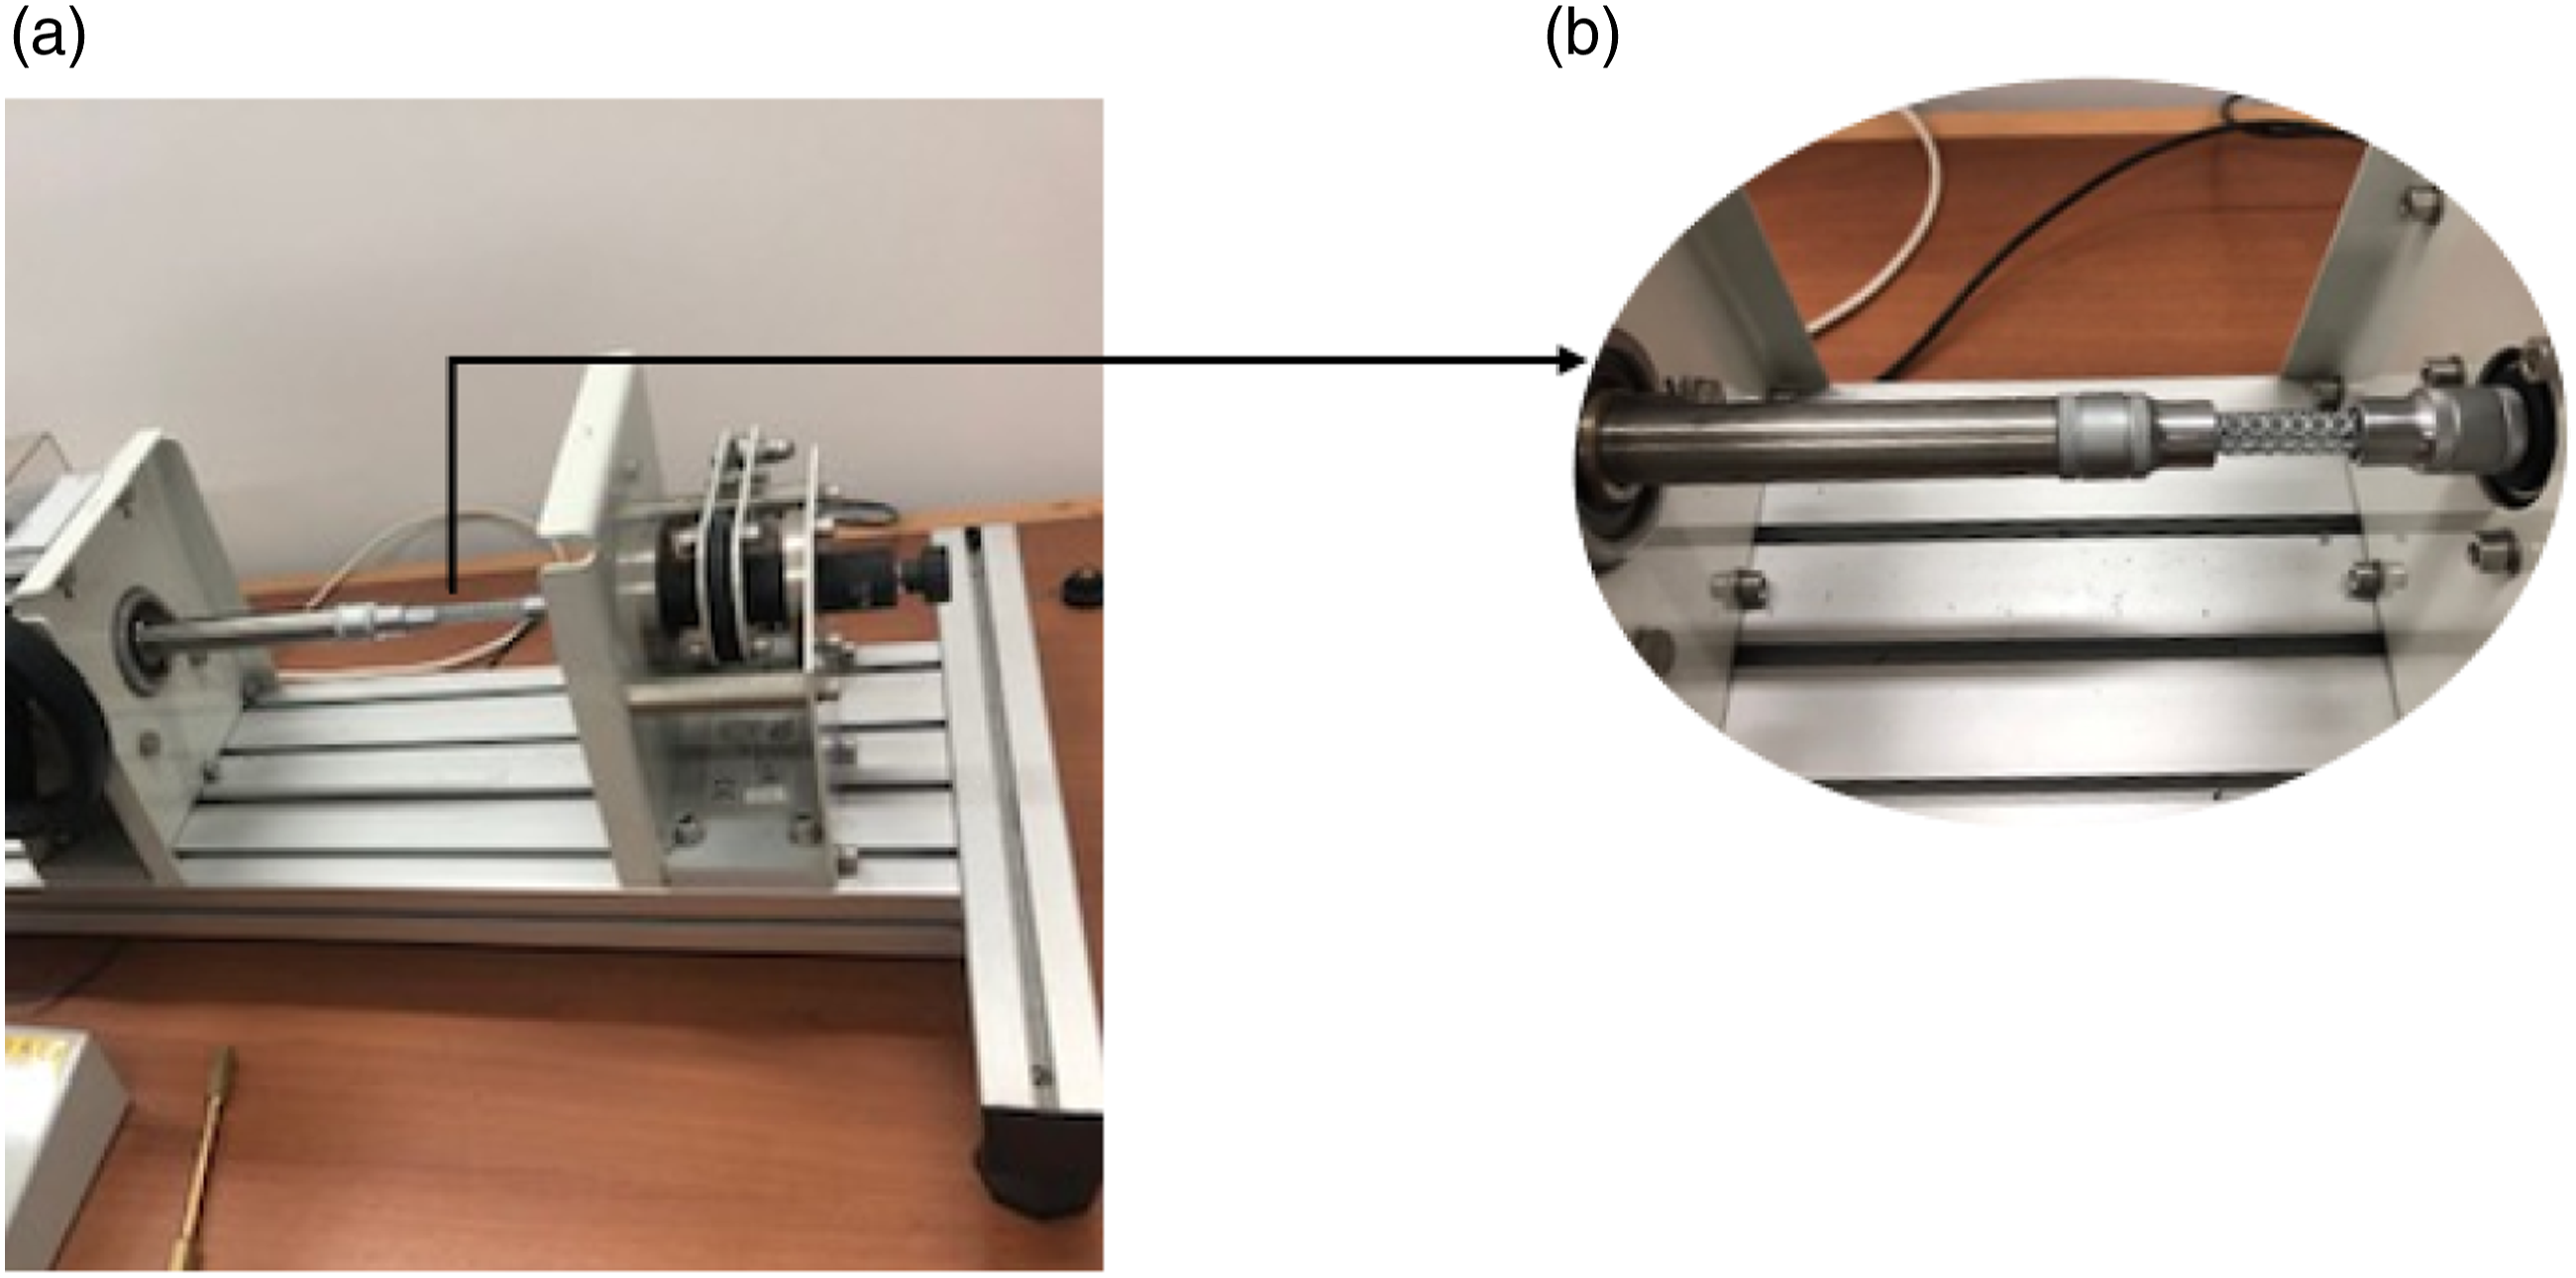
To prevent any strength-related issues during the experiment, the porous models were produced with a high infill density. The device was calibrated (as recommended in the device’s manual) with 6 kg and a reading of 29.04 Nm. The test specimens were placed between two clamps and subjected to the torsion test. Experiments were started with long samples. The compression ratio was set at 0.1 mm/min so that the torsion was slow enough to be considered quasi-static. Each model was placed in clamps, and the vertical distance between the upper and lower jaws was controlled and kept at an equal measurement length. To ensure the same test setup and conditions for all models, all tests were performed on the same machine on the same day without interruption. During the experiment, time (seconds), torsion angle (rad and also degrees) and torque (N.mm) values were recorded continuously and automatically on a computer directly connected to the test machine.
Compression test
Compression tests were conducted to investigate the deformation behavior of each model. MTS Criterion Model 42 device was used to perform the compression tests (Figure 4) The compression speed was set as 10 mm/min and the ramp speed of the machine was set as 0.50 mm/min. Compression tests were carried out until the force decreased with increasing displacement. In order to minimize the friction force on the contact surfaces of the porous models, a flat plate is placed on the unit to be tested. Porous models are placed in the middle of the plate to ensure that the displacement is applied evenly. MTS criterion model 42 compression test machine and sample test specimen.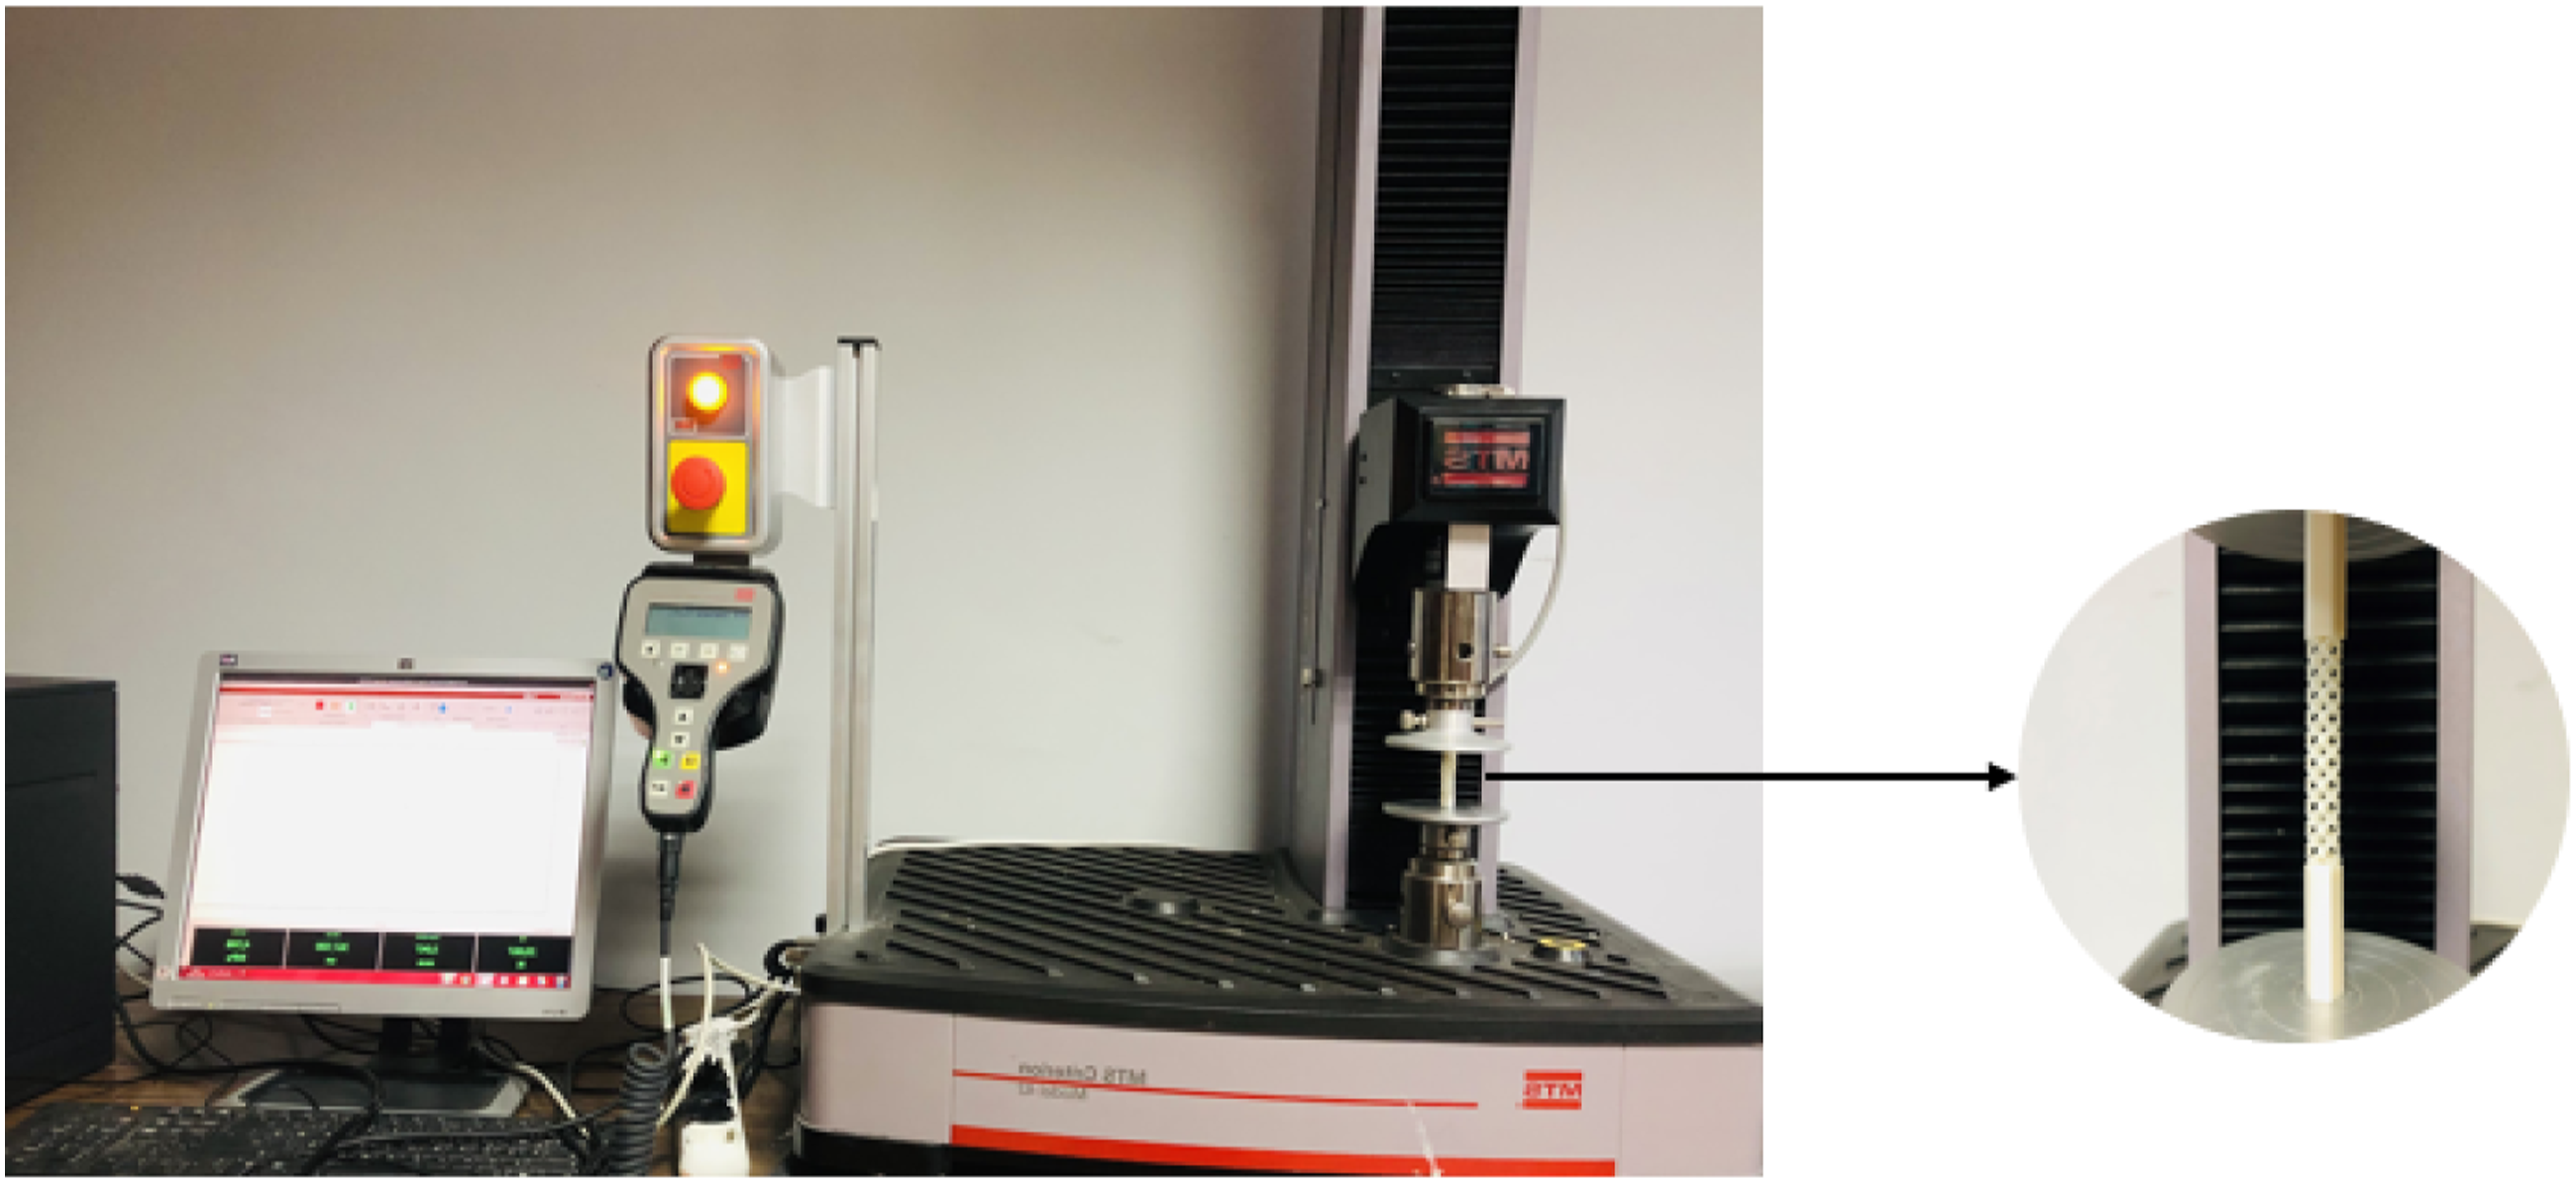
The lattice deformation was characterized using an image processing method used to track the displacements of predefined points on the models. Images were recorded with an ELP brand eight MP camera. The camera is positioned at a distance of 80 mm from the workpiece and fixed focus. Load-displacement curves were analyzed to compare the deformation behavior and yield points of the porous models during the compression test. Condensation zones formed by porous structures stacked on top of each other during the compression test were defined as the location where adjacent buttresses started to come into contact with each other. Data from the compression test were exported and analyzed in Microsoft Excel.
Digital image correlation
In digital images, each pixel consists of f (x, y) position information and some attribute values such as color, density, tone. In digital images, each pixel consists of f (x, y) position information and some attribute values such as color, density, tone Pixels, which form the smallest part of the total image, are classified and recorded according to their characteristics. DIC is a method that examines and follows the affinity starting from the nearest neighbor pixel with the change of these recorded attribute values. DIC generally consists of image development and restoration, segmentation and pinpointing, correlation and follow-up (Figure 5). DIC implementation process.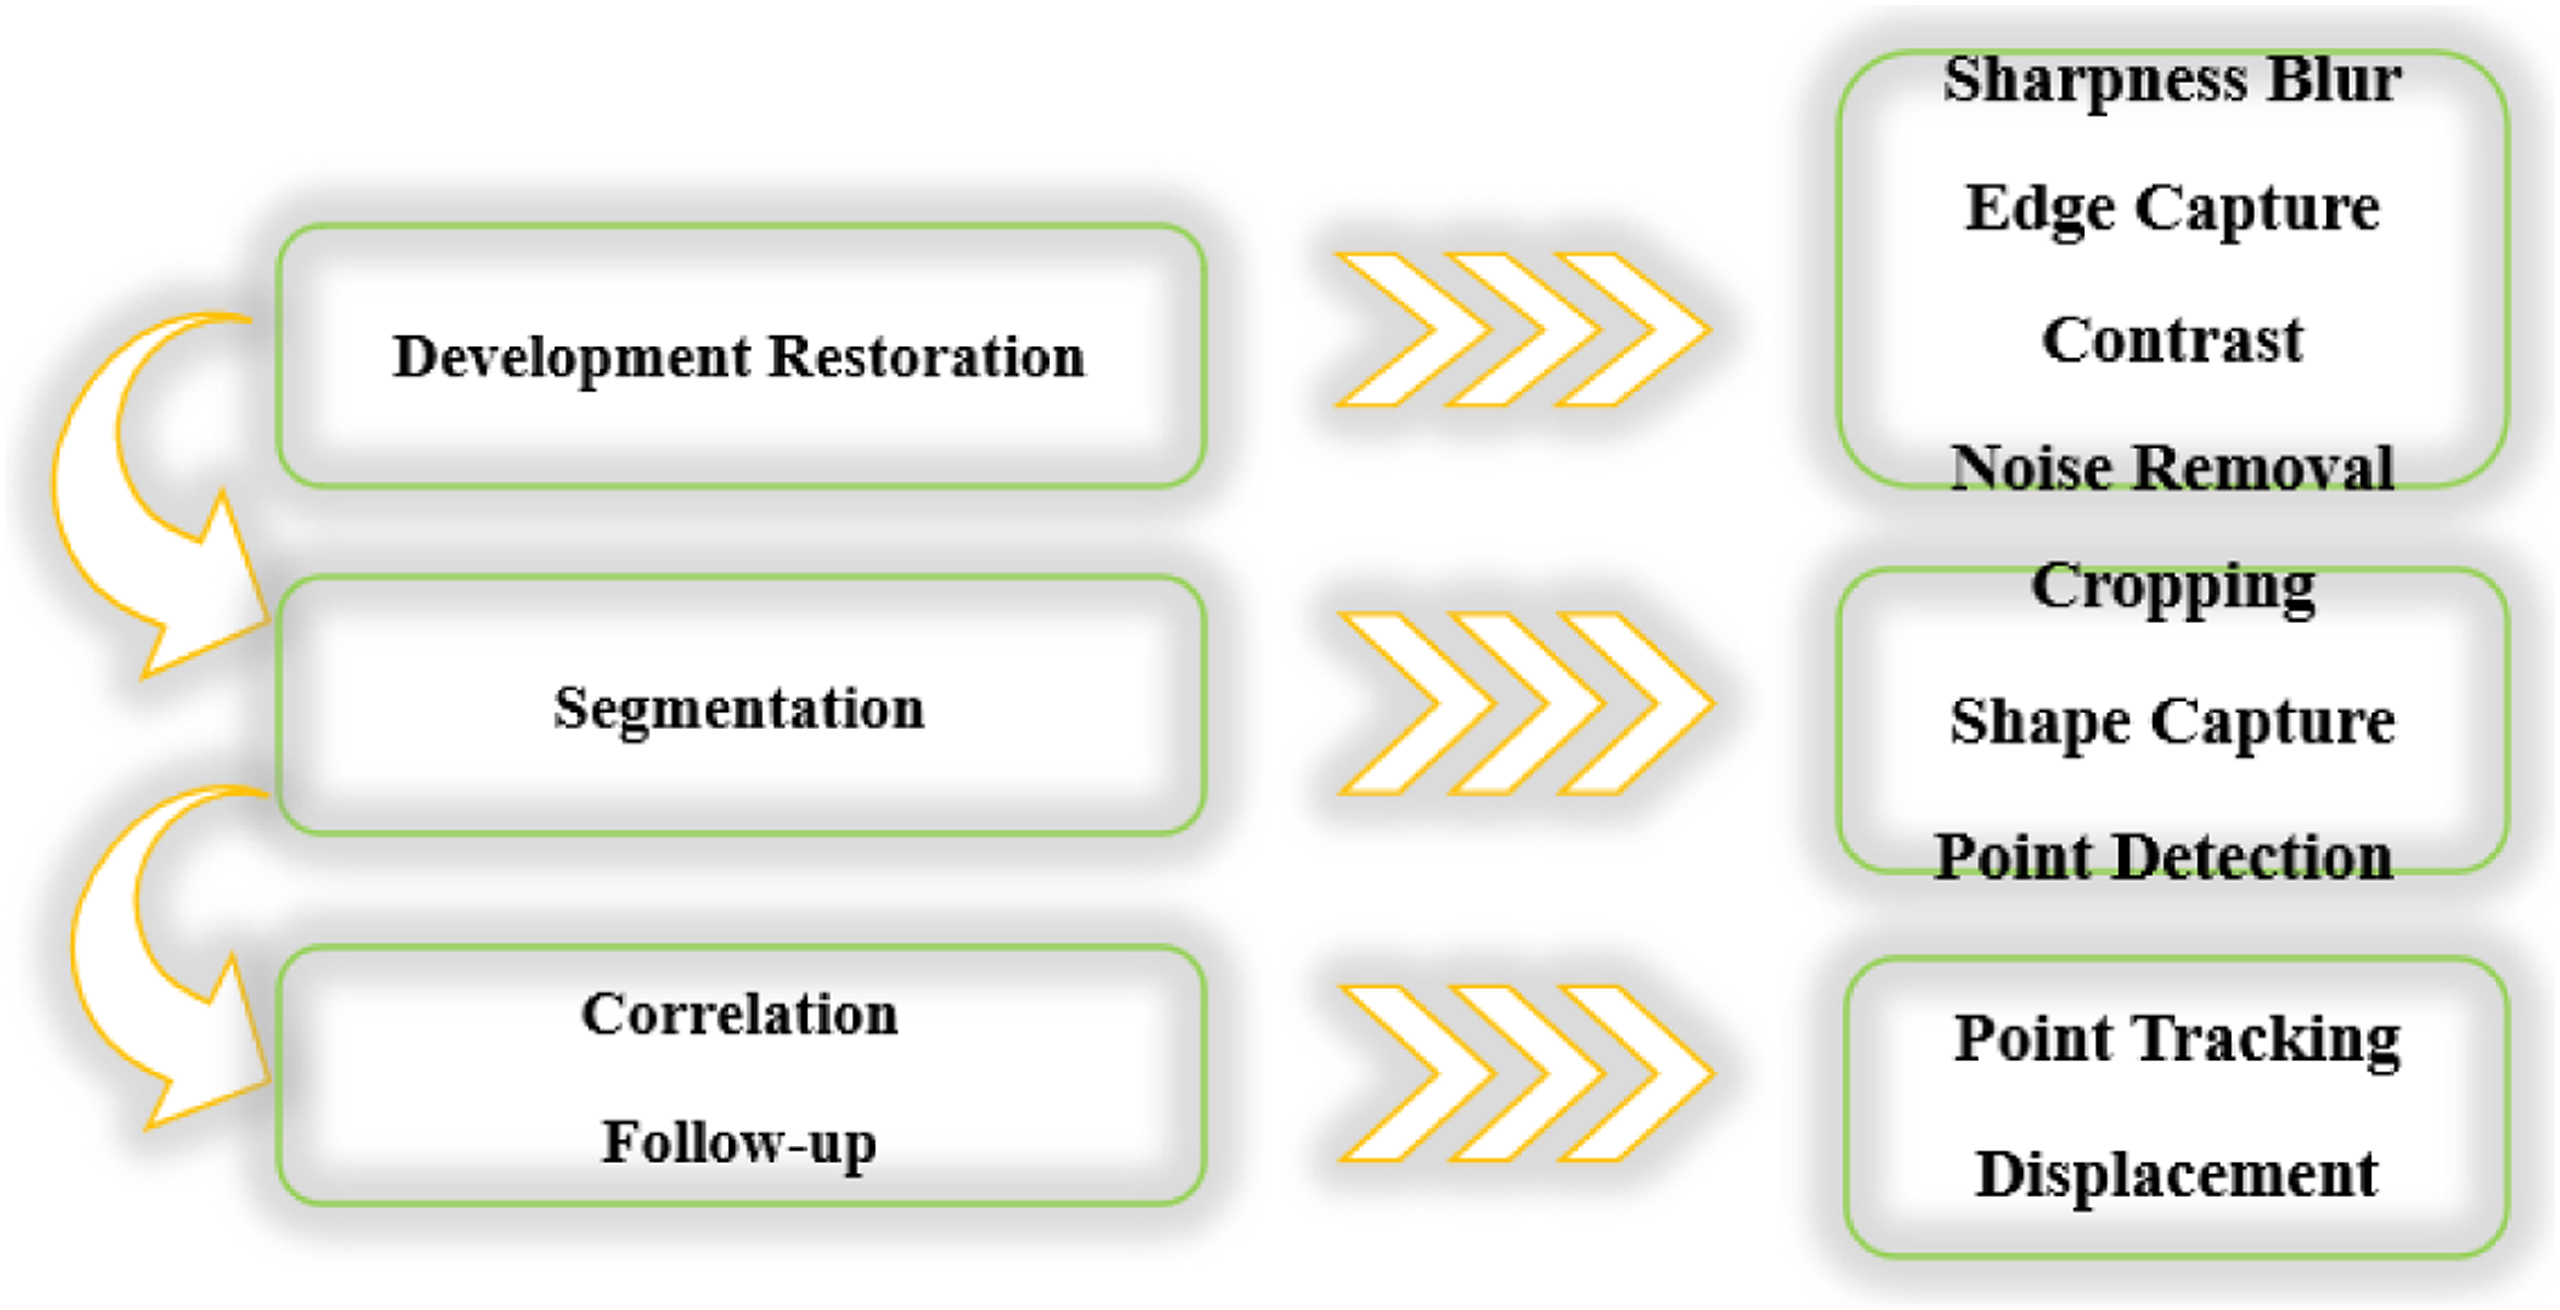
In the study, points were determined on the models, especially at the pore junctions (Figure 6). These determined points were followed throughout the experiment and the pixel changes were recorded. Intersection points in lattice structures are important points. An intersection point was determined as the origin, that is, the reference point for the digital image acquisition process. During the torsion test, relative displacements delta x and delta y were measured instantaneously according to the reference point obtained by taking continuous measurements. Point tracking.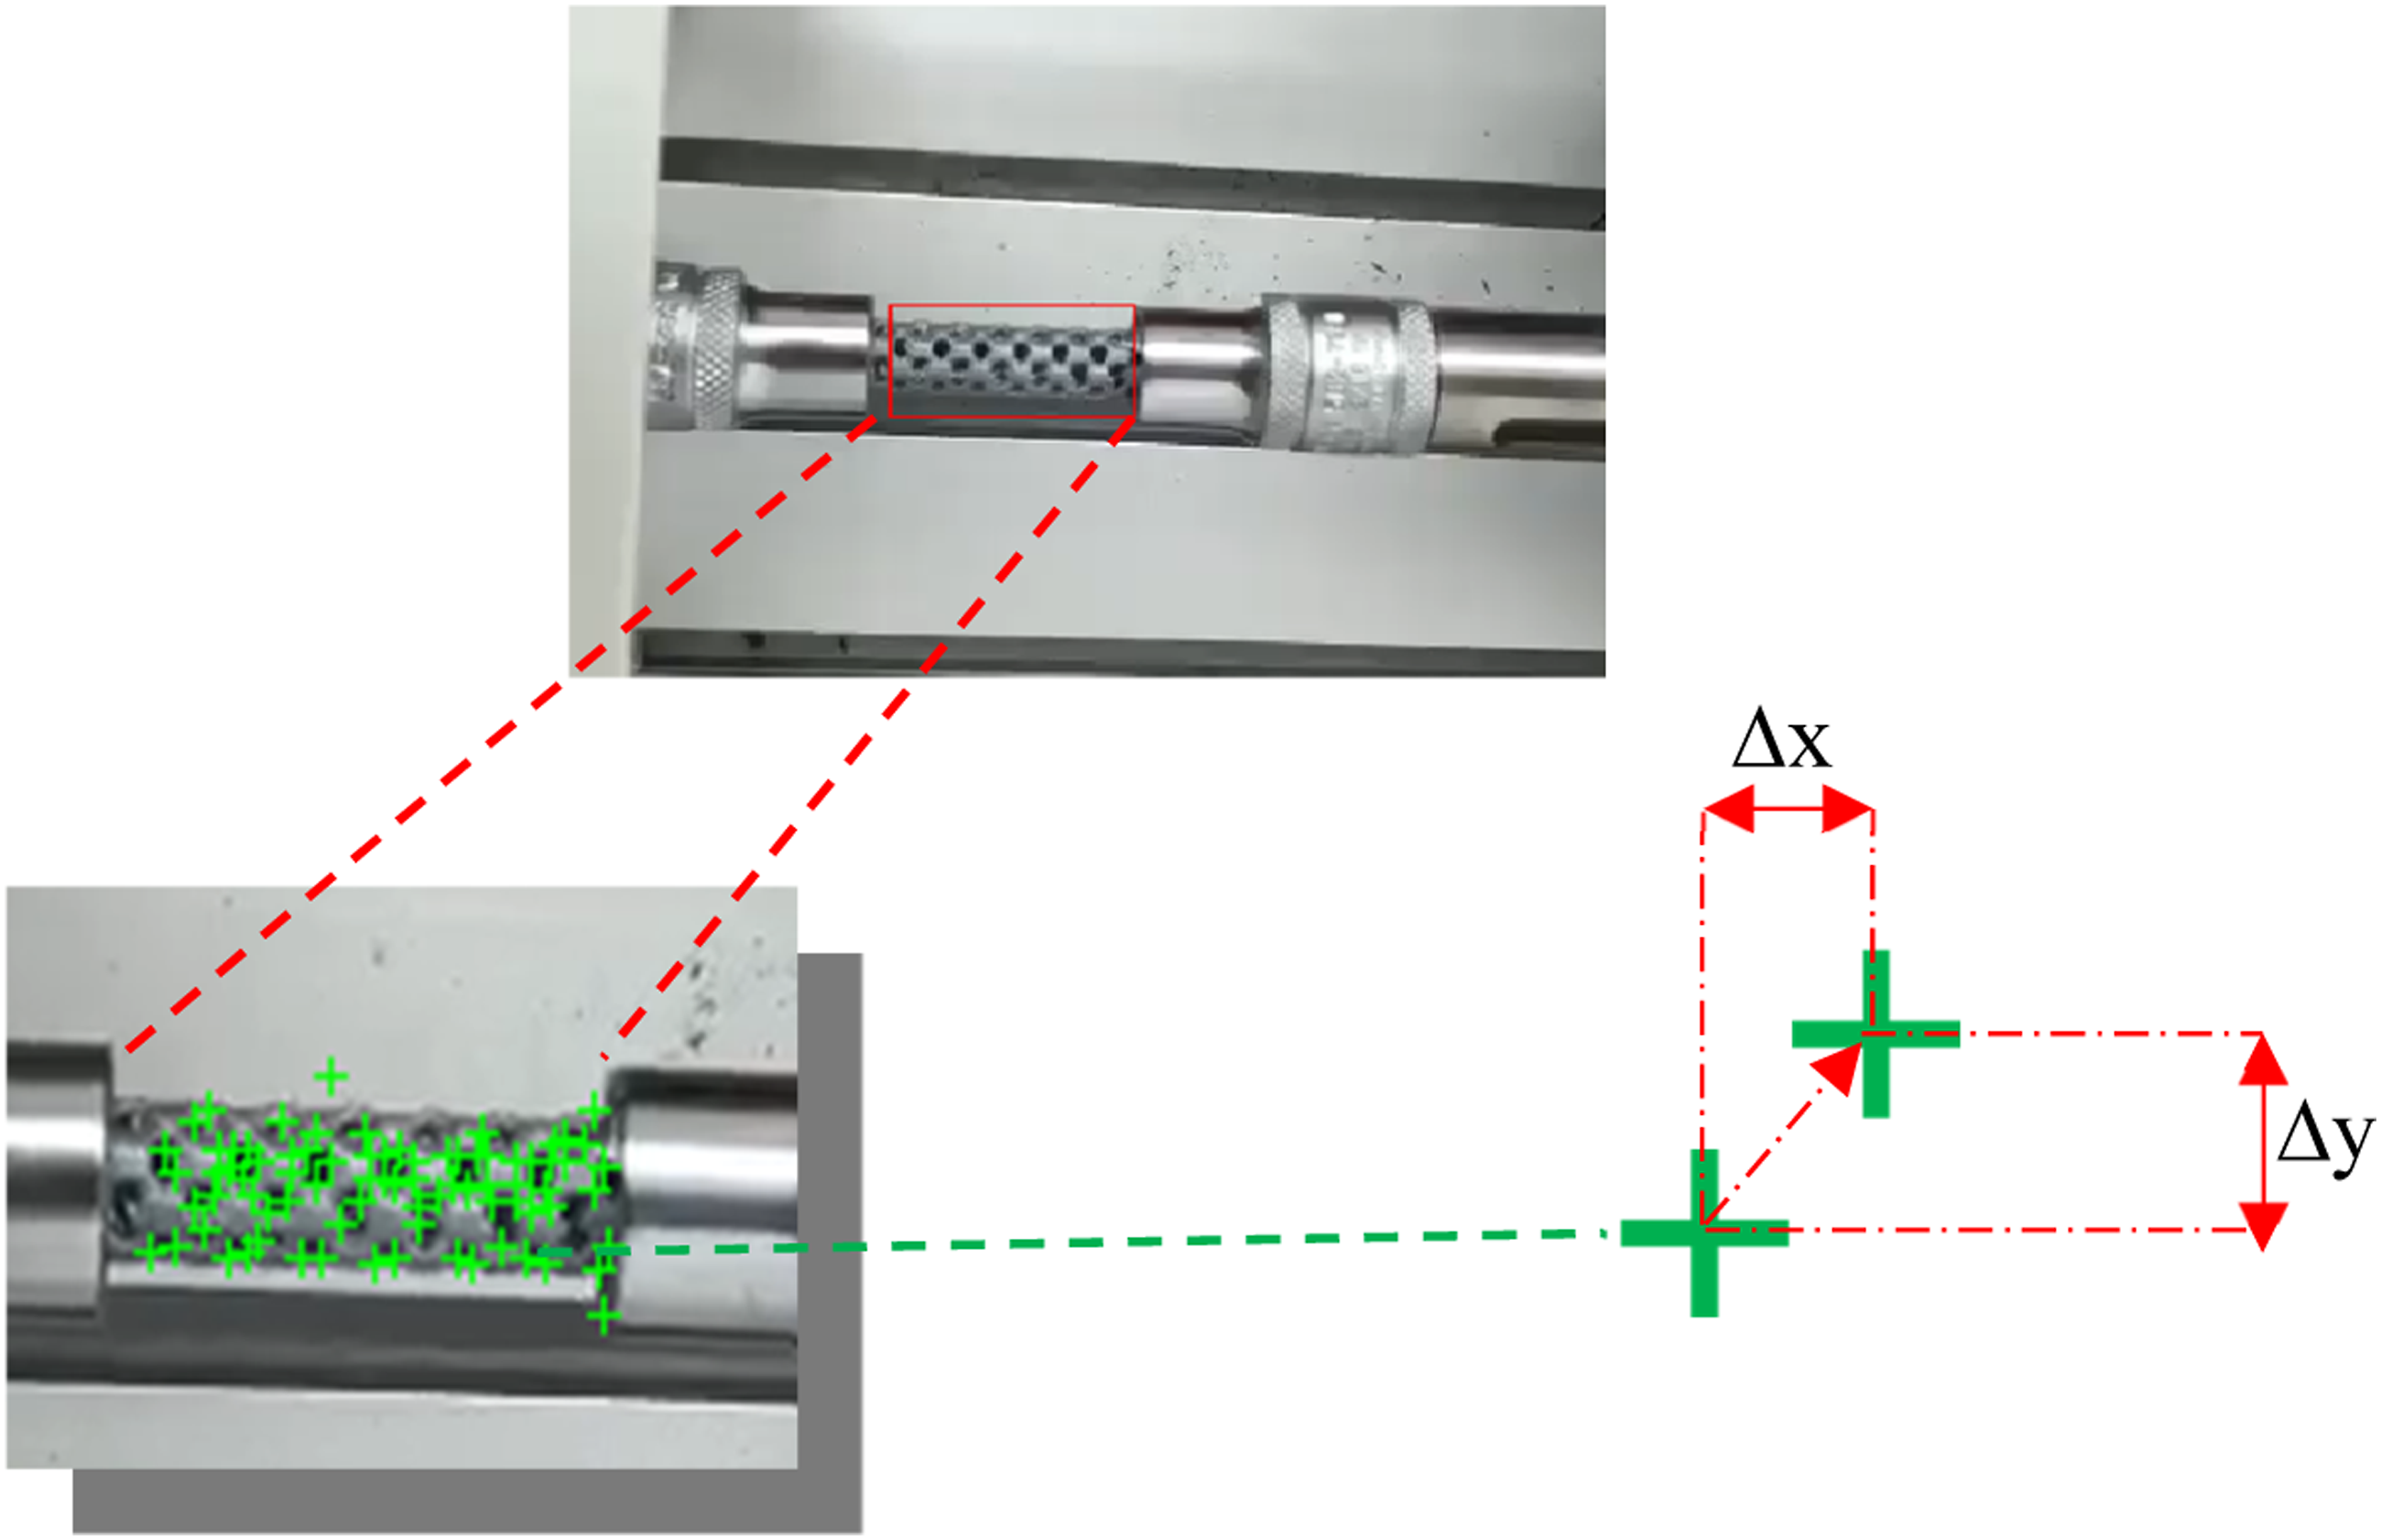
In this way, both instantaneous and average displacement values for the intersection point in the lattice structure could be measured accurately. When the crack starts and progresses, high rates of increase in the relative displacements begin to be seen and reach the maximum value when the fracture occurs. As a result of the fracture, the total and average displacement of the tracking points were calculated.
Discussion and results
Torsion test and DIC results
It has been revealed that the vertical, horizontal and inclined beams used in the unit cell design affect the torsional strength of the porous structure.
38
The graph showing the torsion angle and torque values is given in Figure 7. Graph of force change in models during torsion test, according to angle.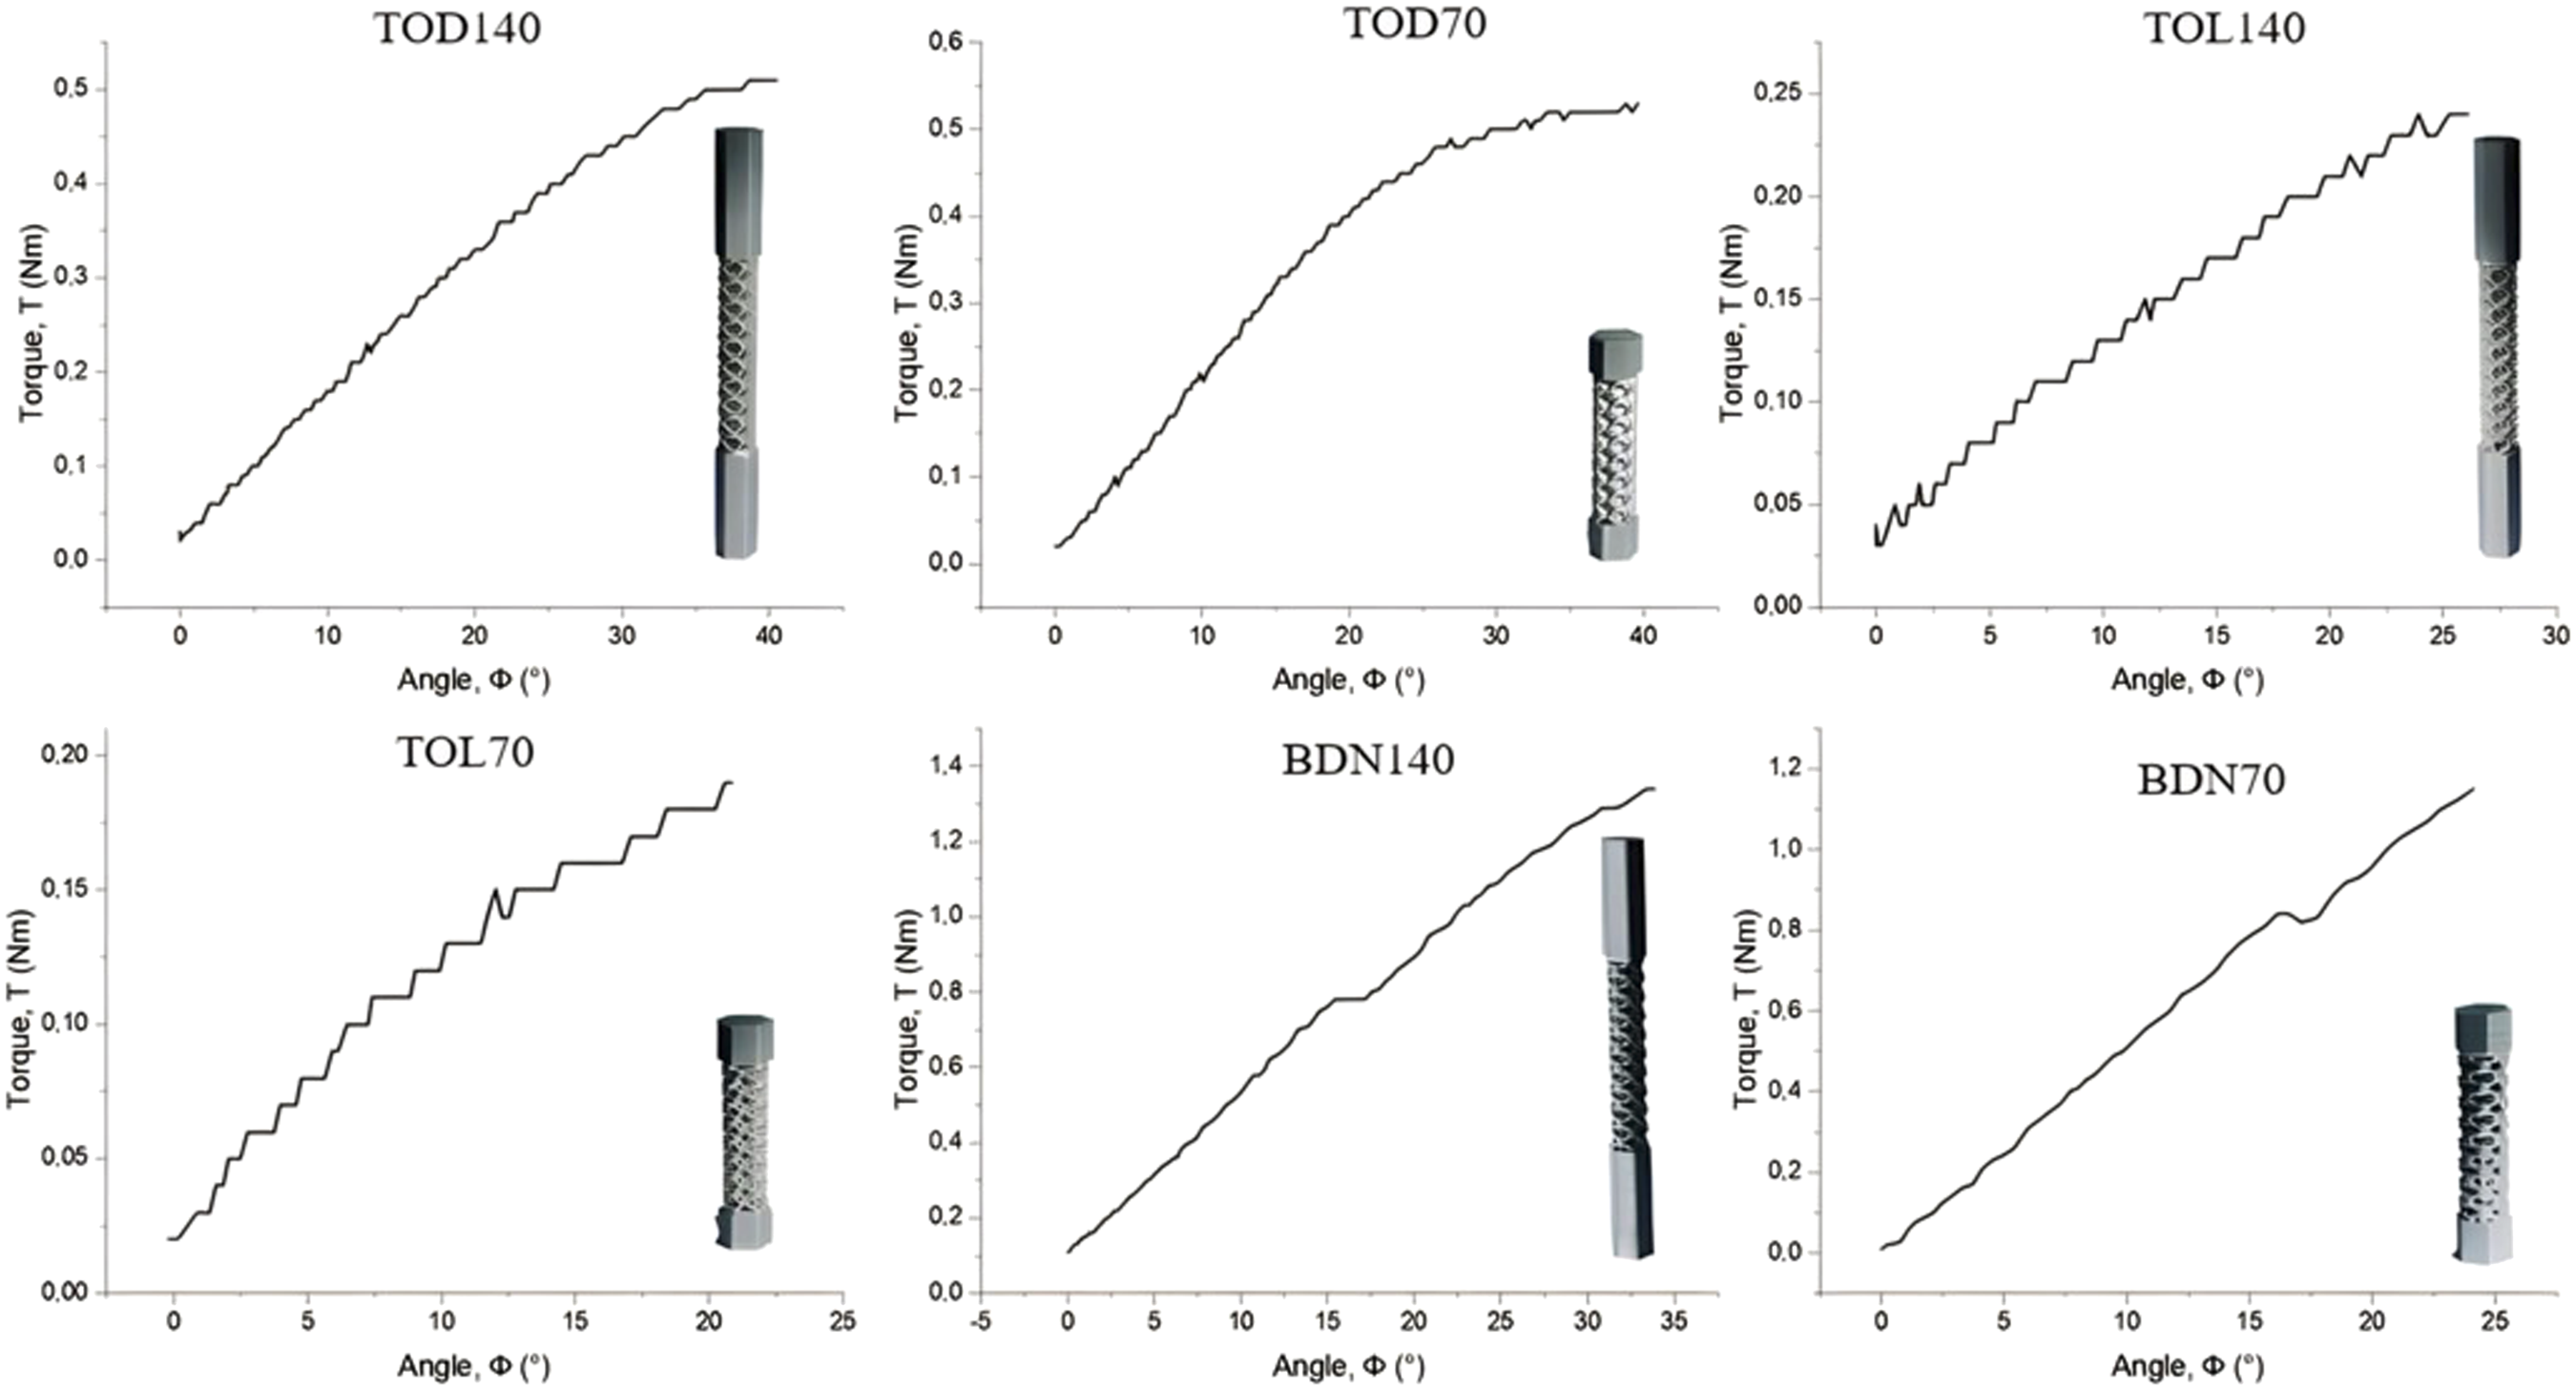
From the results, it was observed that there were fluctuations in the linear elastic region. It is thought that this is due to the fact that the models produced are not filled cylinders, as is the case in the literature, and are caused by microcracks caused by the small pores on the surface of the models.
7
When the torsional yield strength is exceeded, the relationship between the torque value and the torsion angle ceases to be linear and the shear stress distribution from the center axis of the models towards the surface becomes non-linear.
39
Torsional moment loading is complex compared to compressive and tensile loads because the direction of the load is constantly changing as the load is applied. Another reason for the differences in the graphs drawn after deformation is that deformation hardening exhibits different behaviors. Here, it is thought that the most important concept is the occupancy rate in the unit cell in lattice structures. In addition, the instabilities in the core layers of the lattice structures were effective in changing the deformation behavior. With a possible collapse of the top or bottom layer due to the higher stress distribution in this area, the deformation progresses through the layers near the slip bands, resulting in a fracture at a later stage. Fracture starts from the top layer, where the stresses are slightly higher, and the fractures proceed to the lower layers in a sequential manner. All the unit cells of the upper layer collapse at the same time, causing the voltage to drop. When the collapsed layer comes into contact with the next layer, the stress begins to increase again. More compression results in a layer-by-layer crushing and collapse mechanism of the lattice structure. In general, structures with properly connected struts (BDN140, BDN70) (Figure 8) in and out of the plane were found to have a better advantage over applied torsional moment. (a) Body diagonals with nodes −140 mm design (b) Body diagonals with nodes −70 mm design (c) Body diagonals with nodes unit cell model.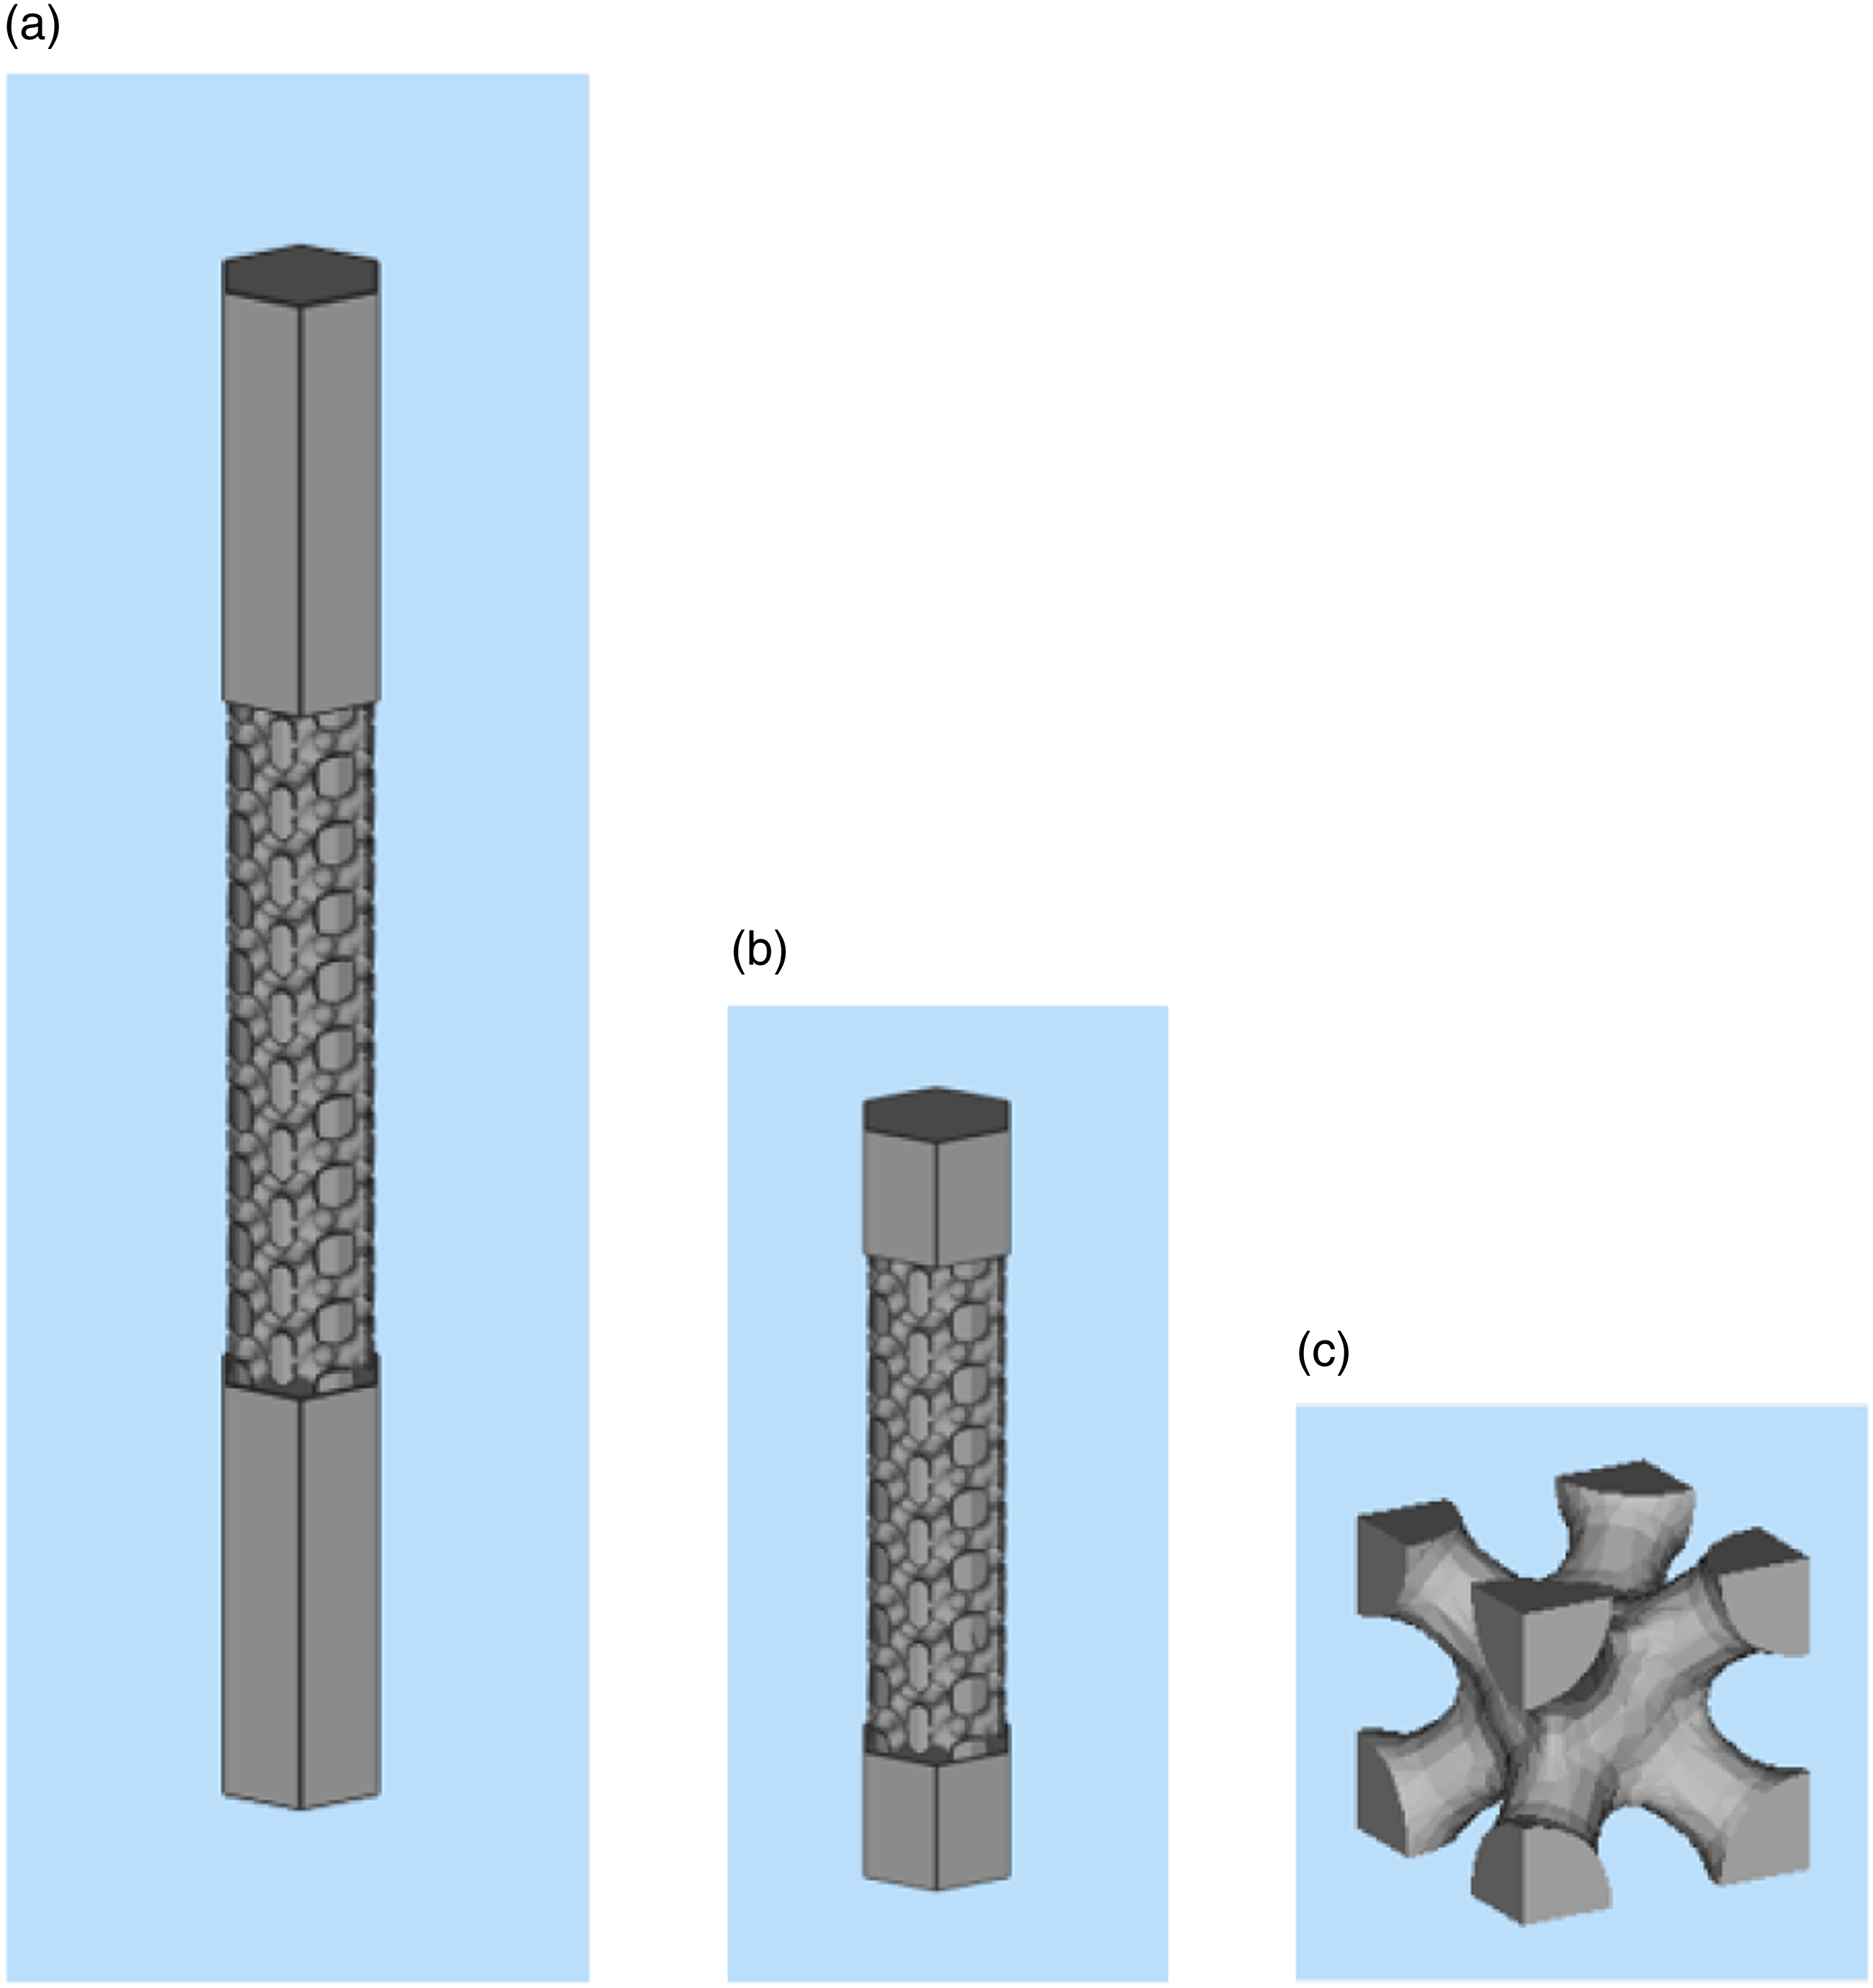
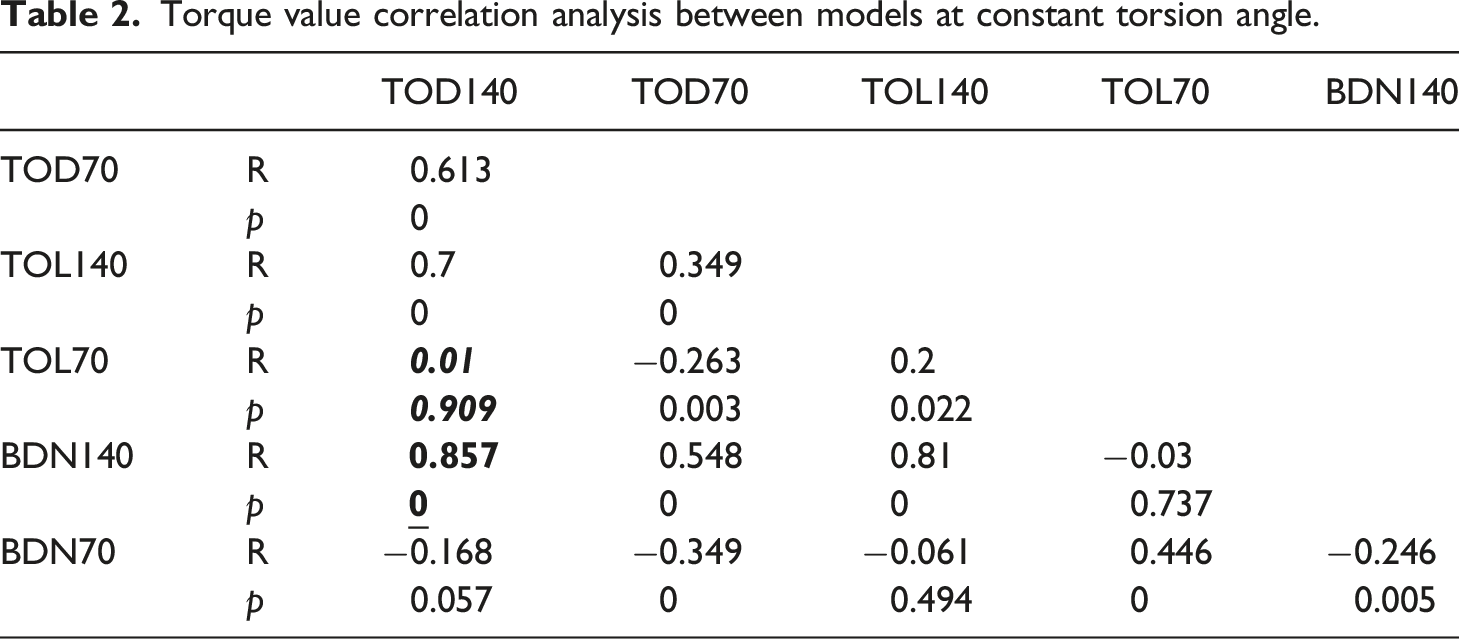
Torque value correlation analysis between models at constant torsion angle.
Digital image correlation application gives results that support this situation. Figure 9(a) shows the cellular displacement graph of TOD140, TOD70, TOL140, and TOL70. In these models, the fracture occurred in the middle regions of the sample. The cellular displacement amounts of the models at the end of the experiment ranged between 130,000 and 140,000 pixels. On the other hand, in the DIC cellular displacement graph of BDN140 and BDN70, it is seen that there is breakage at the ends and cellular displacement occurs less than other structures. The cellular displacement in BDN140 and BDN70 ranges from 40,000 to 50,000 pixels. (Figure 9(b)) Torsion test digital image processing deformation graph. (a) Deformation of TOD140-TOD70-TOL140-TOL70, (b) Deformation of BDN140-BDN70.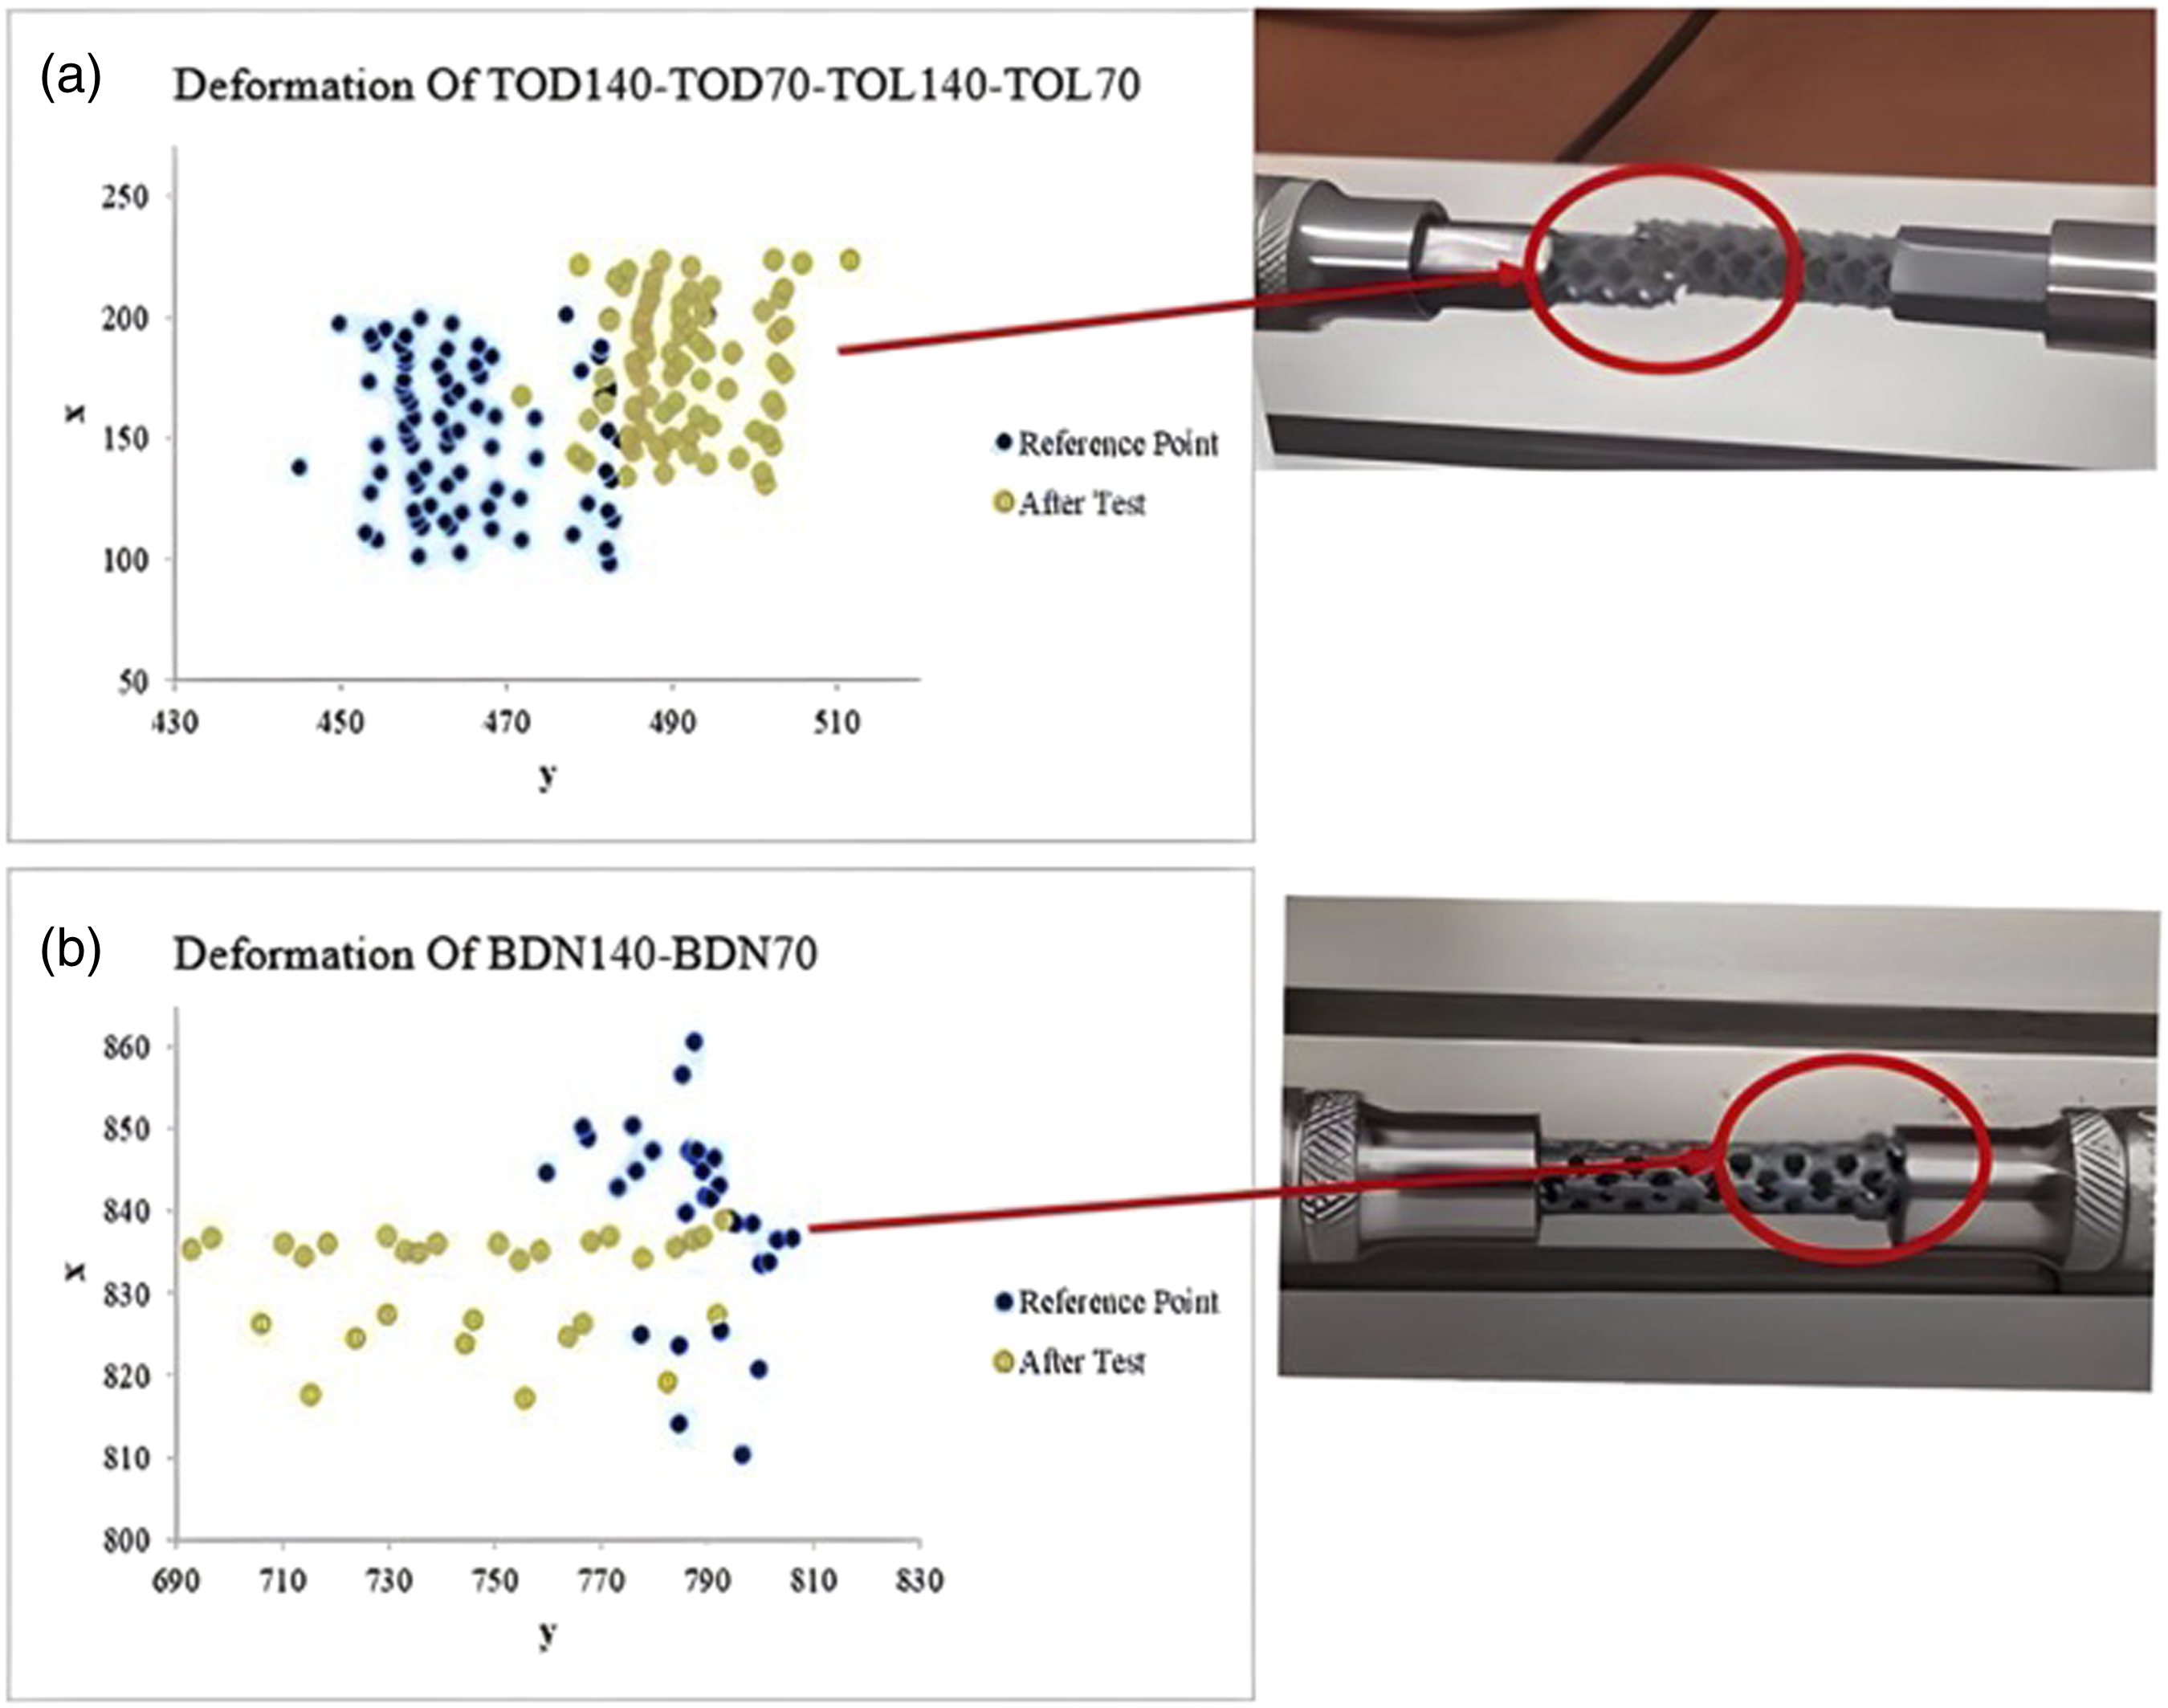
In structures with horizontally inclined beams (TOL140 and TOL70), since the force is transmitted vertically down, the vertical members are compressed and fracture has occurred. The struts with cubic structure (BDN140 and BDN70) showed fracture under higher torsional moment, and this is supported by the literature.40–42
Structures with vertically inclined (TOD140 and TOD70) and horizontally inclined (TOL140 and TOL70) struts were pushed outwards by the effect of the pressure force coming from the sides and were exposed to more than one stress at the same time, and they showed fracture under lower torsional moment. This situation is affected by the moment created by the effect of rotation. In cubic strut structures (BDN140 and BDN70), when the right struts are twisted, the left struts connecting it at the top give a downward bending response, thus creating two opposite bending moments in the opposite right and left struts. 43 The samples with cubic strut structure (BDN140 and BDN70) included in the test samples were the structures that were exposed to the most composite stress during the torsion test. An important result of the experiments is the observation that the torsional behavior of the samples is independent of the strut length. It is hoped that this important detail will help in future studies and applications involving geometric optimization and design. In addition, literature is presented that the torsion behavior changes according to the unit cell geometry and is independent of the strut length. 44 After the torsion tests were completed and the critical loads were calculated compression tests were performed to determine the deformation responses of the structures to the compression test. Stress states in the material at critical load were evaluated and the results were discussed.
Compression test results
The stress-strain curves of six different PLA models after compression tests are shown in Figure 10. Stress-strain curves of six structures were evaluated as three different regions. In all models, the stress increased linearly in the first region in the elastic range, and then the stress-strain curve deviated from the linear response and entered a nonlinear state, and the stress increased continuously until the maximum stress peak was reached. This is also supported by the literature.45–47 When the stress reached its peak in the second region, the onset of deformation started to appear as an arc-shaped curve in the TOD140, TOL140, TOL70 and BDN70 model. The stress in the TOL140 model are evenly distributed throughout the model and have a better load carrying capacity (approximately 55%) compared to the BDN140-TOD140 models. According to the results, the models show more deformation due to the increase in the length of the models. Stress-strain graph of all models.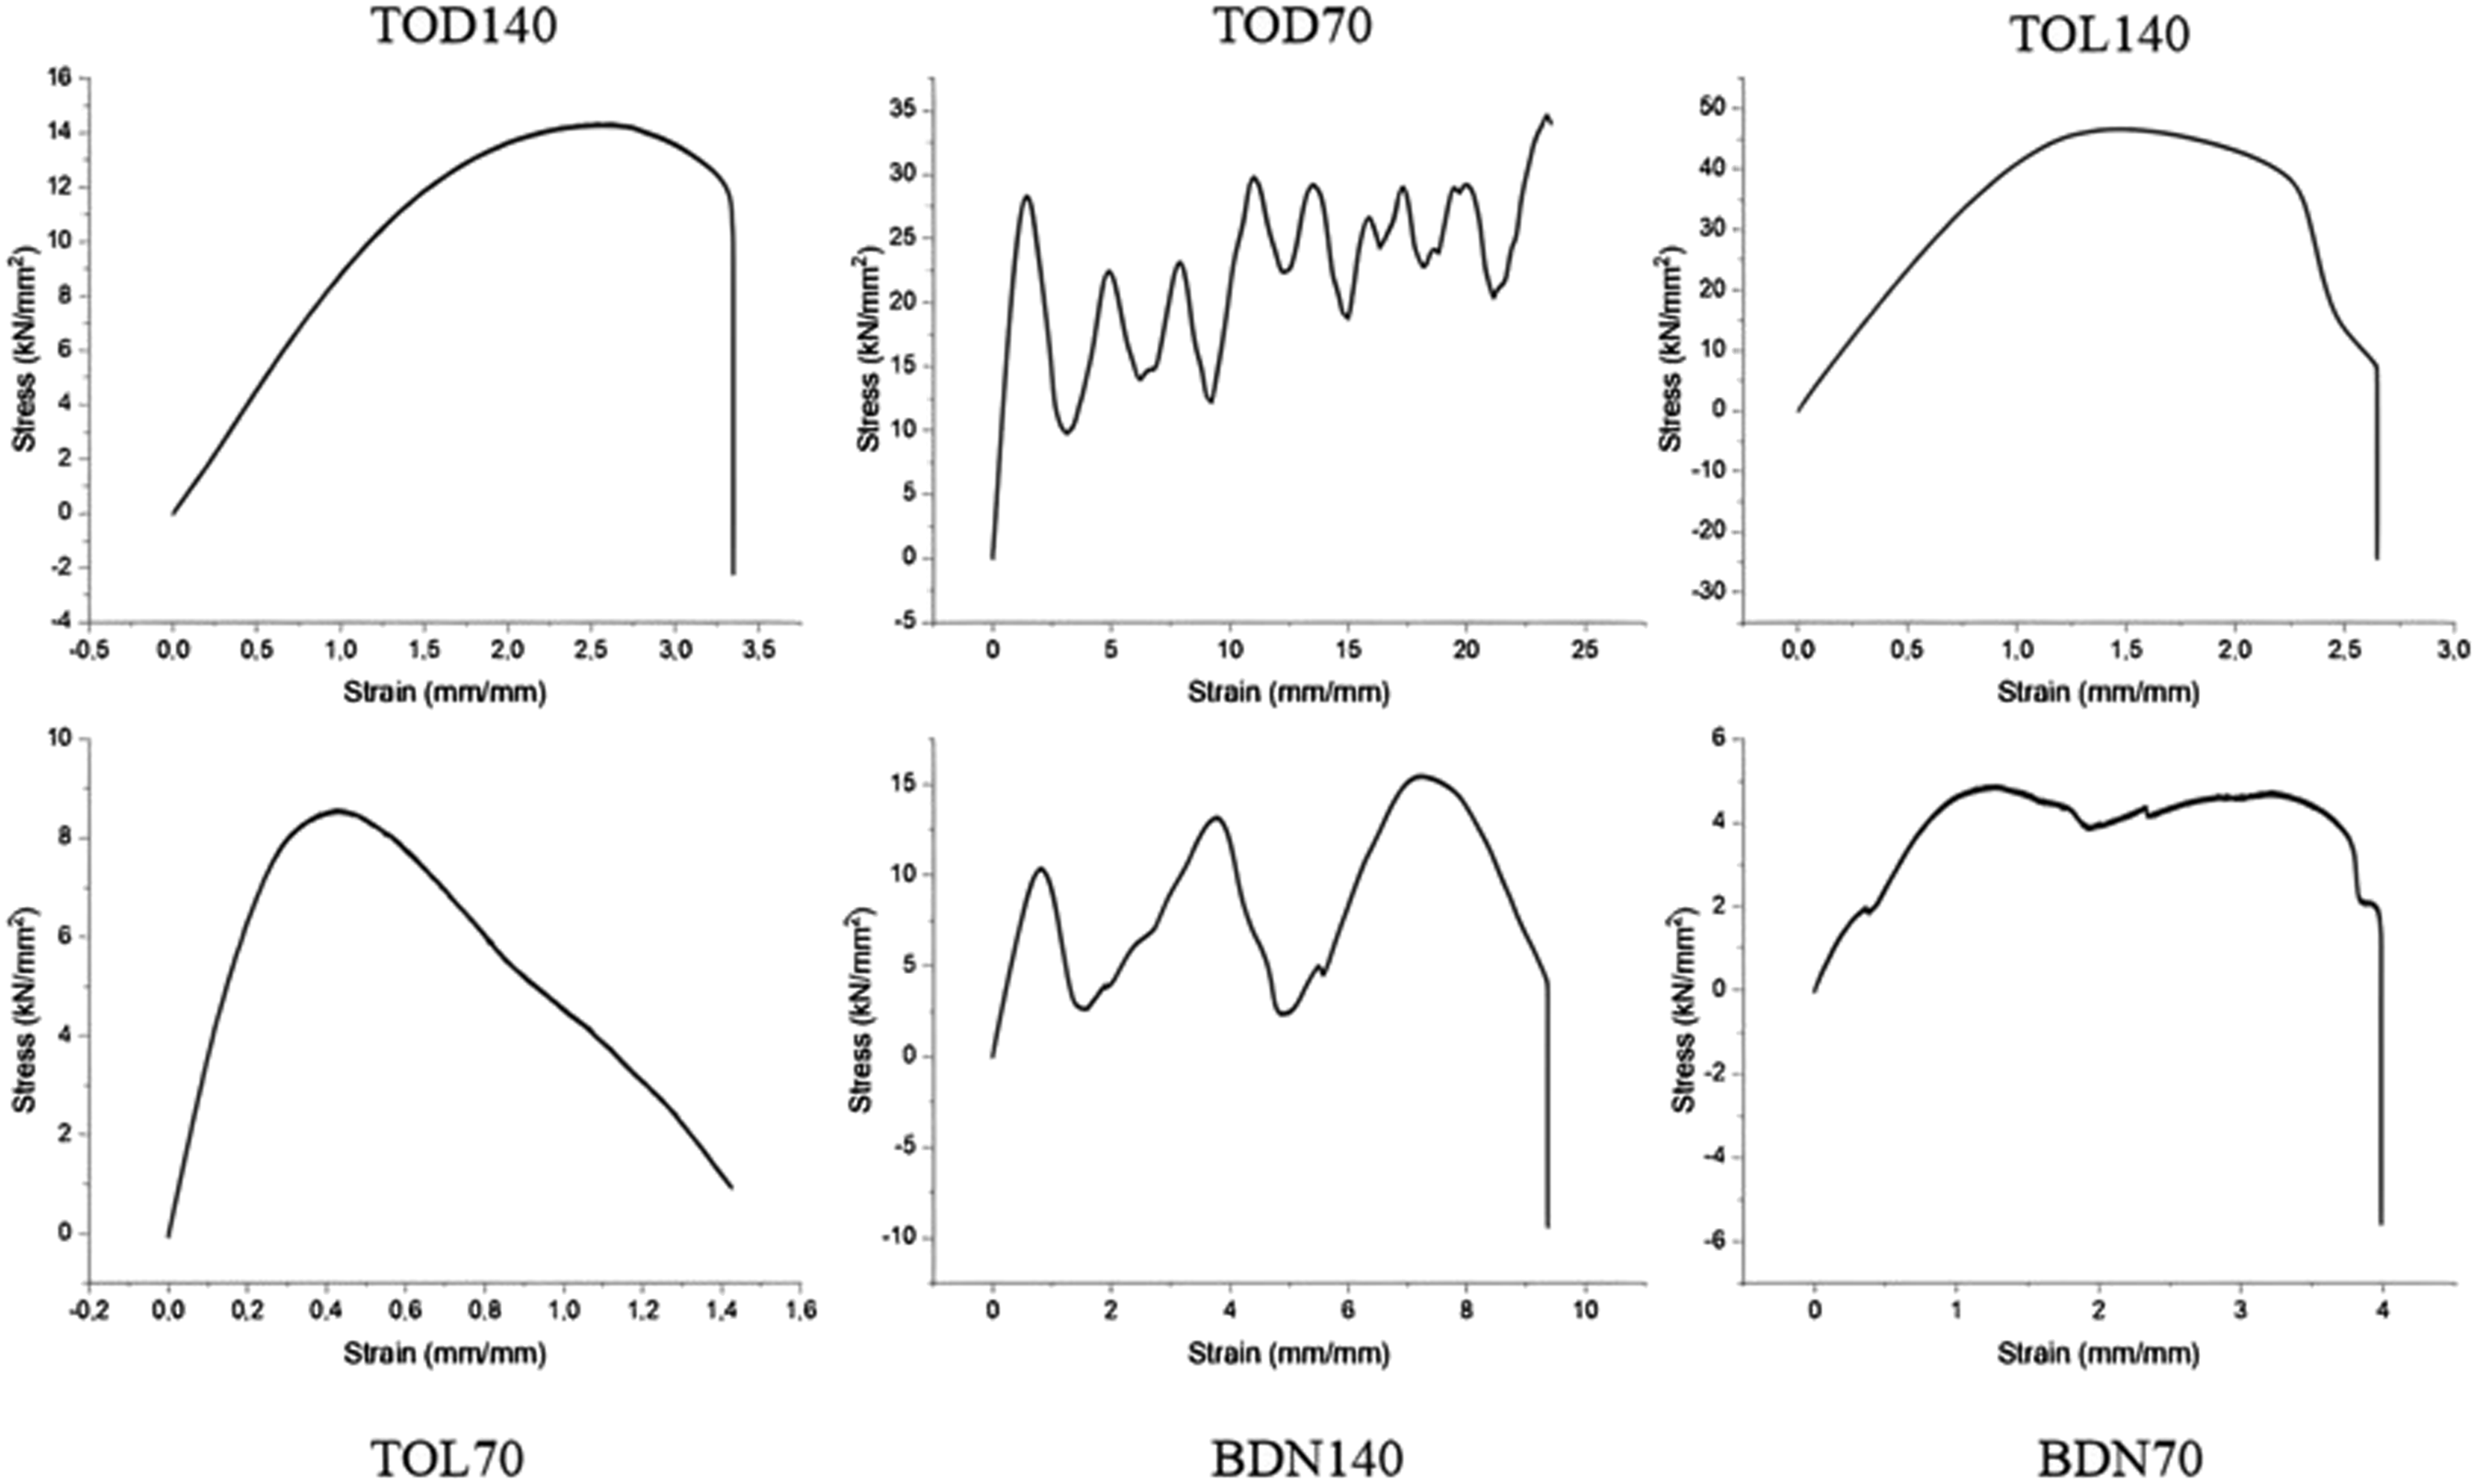
Finally the yielding stage is realized, in which the part continues to deform until the structure is completely destroyed. Because of this situation, the elongation continued to increase while the tension changed very little. It was observed that the TOD70 and BDN140 models did not directly break under the compression test and there was a break in the transitions between the uprights. In the compression test, there were sudden fluctuations in the compression stress results due to the increase in the cross-sections of the models towards the end of the plastic deformation.
In the compression tests, it was observed that the stress increased with the increase in the number of unit cells and the strut diameters, and cracks occurred when a 45-degree inclination occurred after the test, and this situation was also supported by the literature.48–50 Comparative results of all models according to compression test results are given in Figure 11. Among all models, maximum compressive stress was achieved in TOL 140 model. Compression test results of all models comparative graph.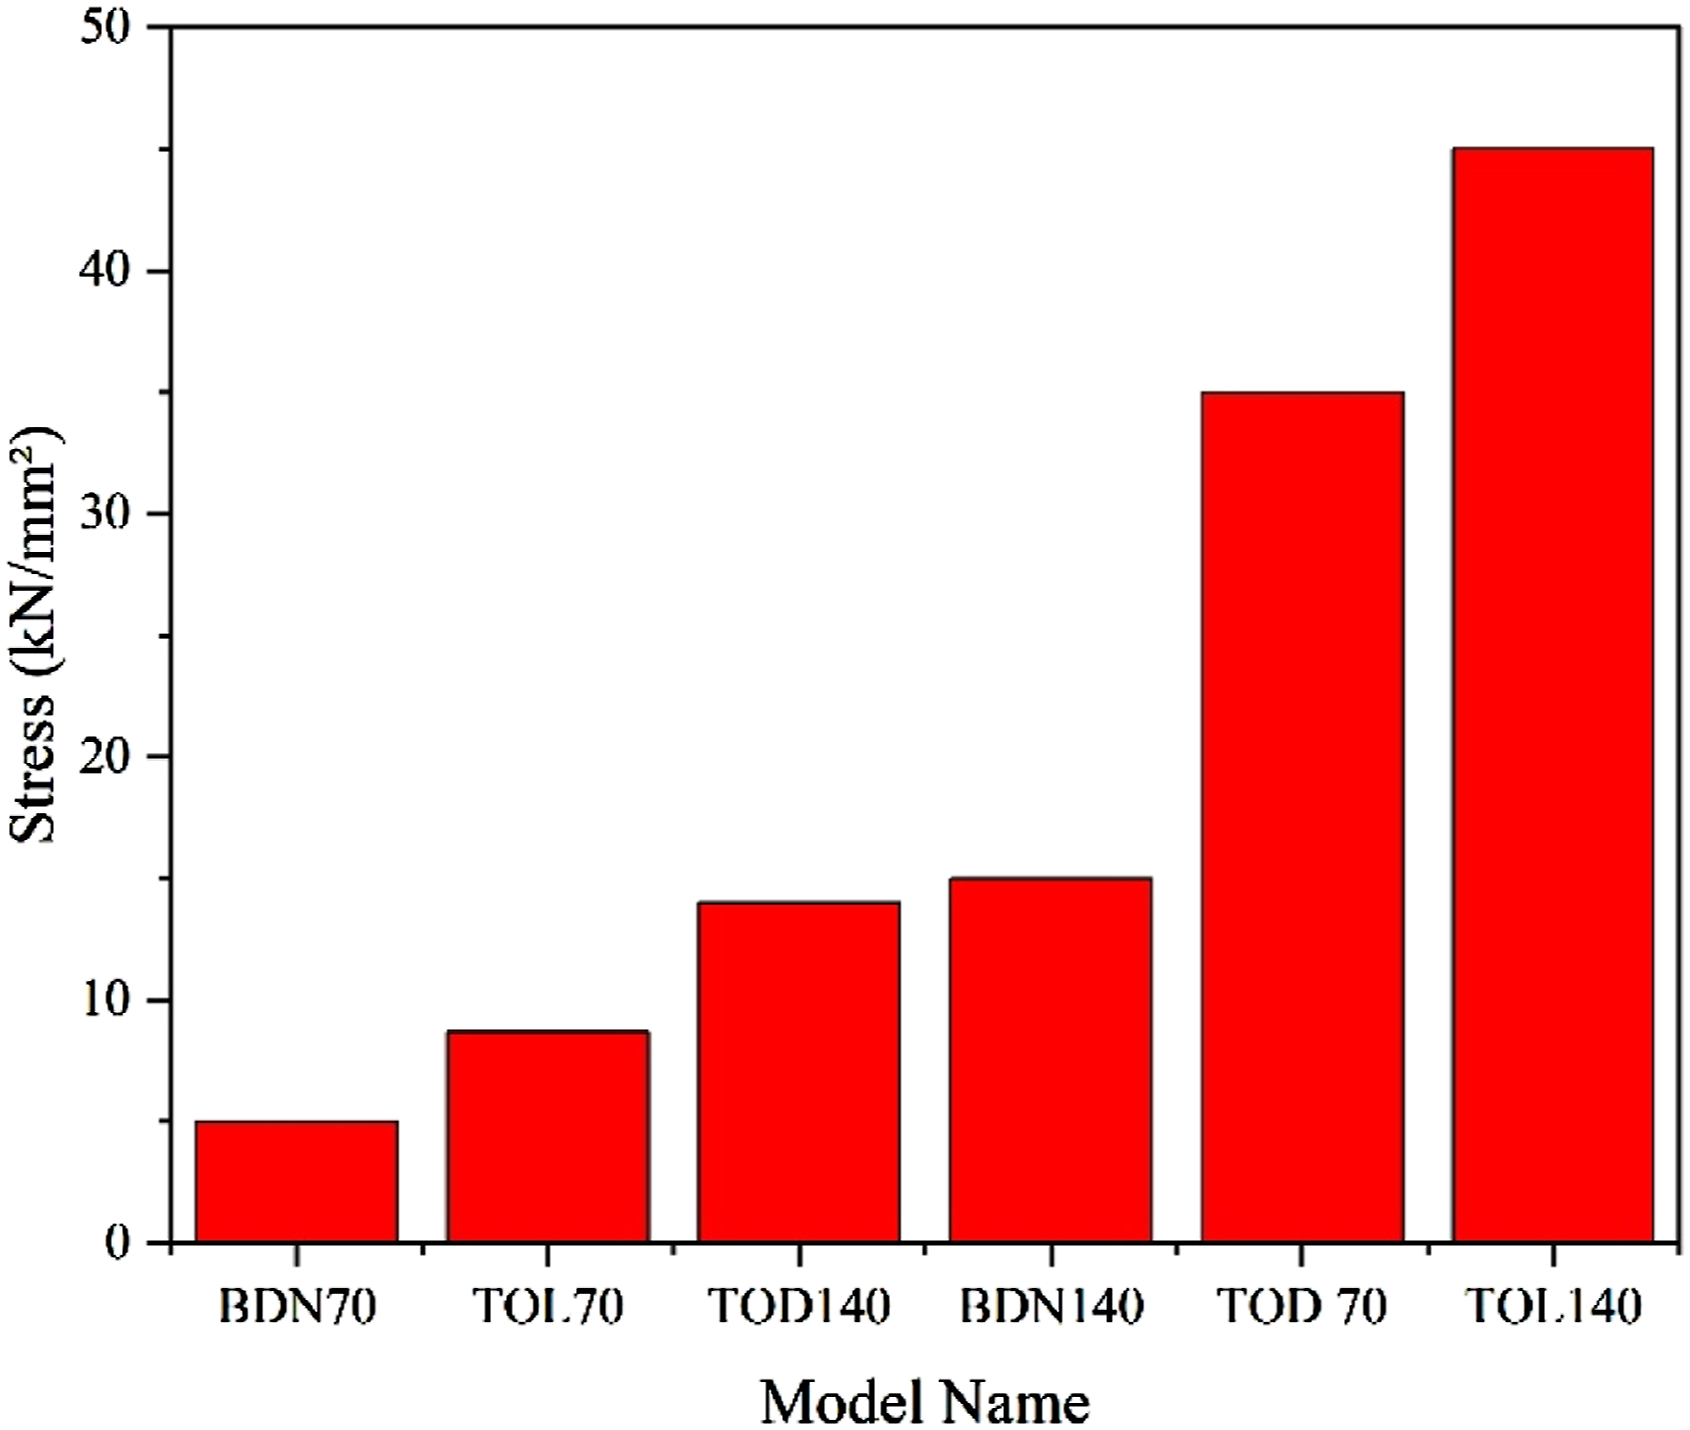
Conclusion
Six different 3D assembly made using PLA material were produced and their mechanical behaviors were examined under torsion and compression tests. It has been observed that the mechanical behaviors are highly dependent on the unit cell models. The mechanical properties as well as the deformation points shown under the compression test also varied depending on the size of the model. In the structures created using Body Diagonals with Nodes (BDN170, BDN70) the torque reached 1.3 and 1.4 Nm, respectively and it was approximately four times higher than the models with vertically inclined Trunch Octa Dense (TOD140, TOD70) horizontal Trunch Octa Light (TOL140, TOL70) struts. Therefore, the breaking points differed under the torsion test. In vertical (TOD140, TOD70) and horizontally (TOL140, TOL70) inclined models, as the size changes, the breaking point is observed in the head of the models while the breakpoints in the cubic structure (BDN140, BDN70) are observed in the midpoints of the models. In case torsion, models with cubic cell structure (BDN140, BND70) are more important than vertical (TOD140, TOD70) or horizontal (TOL140, TOL70) structures; however, the material distribution in the vertical or horizontal direction is also critical, as the cubic structures support it to act as a single body to bear the torsion load.
The fact that the models with horizontal-vertical inclined beam structures were partially empty caused rapid deformation in mechanical tests. Both compression and torsion tests were performed and completed iteratively to determine whether the designed models were feasible, mainly because an ideal experiment should contain at least three repetitions.
From the test results obtained after the compression and torsion test, it was concluded that the deformations depend on the unit cell and strut lengths forming the models and can significantly change the strength. The most important conclusion to be drawn from this in terms of design parameters is that experimental research studies should be conducted on the progress of materials produced by additive manufacturing. Experimental studies can be developed after determining a set of design factors that may be effective for future studies.
Footnotes
Declaration of conflicting interests
The author(s) declared no potential conflicts of interest with respect to the research, authorship, and/or publication of this article.
Funding
The author(s) received no financial support for the research, authorship, and/or publication of this article.