
Abstract
New polystyrene (PS) foams with submicron pore sizes and open pore structure are introduced as potential cores for vacuum insulation panels (VIPs). Measurements of the thermal conductivity λ of the air-filled and evacuated PS foams, the influence of temperature T, opacifiers as well as gas pressure p on the thermal conductivity λ are presented. First results of the foam microstructures, as visualized by electron microscopy, confirm that pore sizes below 1 µm can be achieved. Thermal conductivity values of advanced samples in vacuum of about 7 mW/(m·K) were measured.
Keywords
Introduction
Energy supplies and global warming are two of the most important challenges that the world will face in the years to come. Aware of future sustainability, the European Union has set roadmap targets to reduce CO2 emissions by 80–95% below 1990 levels by 2050. 1 In Europe, buildings account for almost 40% of total energy consumption 2 with the majority being consumed by the household sector (heating, air conditioning, refrigeration). To increase building and appliances’ thermal efficiency, insulation standards can be obtained by using cheap conventional materials (e.g., mineral and glass fibres, polystyrenes (PS), polyurethanes (PUR)) but at large thicknesses due to their thermal conductivities λ > 30 mW/m·K. Therefore, advanced thermal insulation products provide an essential contribution to improve energy efficiency and conservation of valuable resources.
Vacuum Insulation Panels (VIPs) are currently the most effective solution. By offering up to ten times higher thermal insulation than traditional materials of the same thickness, VIPs need much less space. Besides the high insulation capacity, the high volume reduction by VIPs increases usable space, eases waste disposal, lowers extra logistic costs and transport emissions while reducing the energy needed to keep the temperature at a desired level.
VIPs for buildings have more stringent requirements then the ones used for appliances due, for instance, the higher expected service life time of at least 25 years. The general choice for core materials for this application is most often fumed silica, since it can maintain a stable thermal conductivity for pressures up to about 10 mbar and a centre of panel thermal conductivity of about 8 mW/m·K at 100 mbar. This gives VIPs with silica cores a higher expected lifetime which is a major concern for this application. Glass fibre and PUR foam cores have an expected lifetime considerably lower due to their much coarser pore structure. 3 However, the use of fumed silica has also some drawbacks, considering its high price (accounting for up to 50% of the end user price) and relative high density (typically 180 – 200 kg/m3).
Commercial polystyrene (PS) foams, produced by expansion (EPS) or extrusion (XPS) process, are very cost-effective and light-weight. But the inner structure has big and practically closed pores of about 100 µm–200 µm that makes it not suitable for vacuum insulation purposes. The search for lightweight, nanometric, pore materials at low production costs and with suitable mechanical properties has been a challenge for the scientific community.4–12 Nanostructured foam materials can efficiently suppress gas conduction (by the so called Knudsen effect 13 ) thus being less sensitive to the inherent internal gas pressure increase in VIPs. The recent development of polymeric foams has yielded results especially in terms of cell size reduction, but its corresponding foam densities still remain too high. On the other hand, the production of nanocellular foams with expansion ratios larger than 10 is extremely difficult due to the high chance of enlarging cell sizes. 5 , 7
Wong and Hung 6 tried to make evacuated PS foams using CaCO3 to open the pores. However, the PS foam had cell sizes of about 200 µm. Depending on the foaming temperature and on the LDPE content, foams with different open-cells content and cell structures were produced. For the foam with open-cells content < 50%, the thermal conductivity as VIP was measured as 27 mW/m·K; for the foam with appr. 70% open-cells, the thermal conductivity decreased to 20 mW/m·K and for higher open-cells contents up to 98 %, thermal conductivity as low as 6.5 mW/m·K was measured. The decreasing thermal conductivities of the foams are attributed to differences on void fraction, cell sizes, cell walls and possibly gases trapped within remaining closed pores. Therefore, the morphology of the PS foams has to be carefully optimized to be used as core material for VIPs. But, according to the Knudsen effect, it should contain much smaller cell sizes, preferably in the sub-micrometer range. If both conditions are met, 1) the gas inside the foam can be evacuated to very low gas pressures and 2) a lower sensitivity of the thermal conductivity to the rise of gas pressure, producing VIPs with longer life-time, can be achieved.
But, merely reducing the cell size of polymer foams do not guarantee a super insulation performance. 8 There is a significant increase of thermal radiation heat transfer in nanocellular foams due to reduced reflectance of the cell walls to the infrared electromagnetic waves. In order to increase the IR absorption capacity in nanofoams, Gong et al. 7 , 10 developed a PS foam with multi-walled carbon nanotube (MWCNT), achieving a bimodal PS/MWCNT 1 wt.% foam system with a 28-fold expansion ratio and 5.8 µm secondary cell sizes. With this advanced bimodal foam system, a decrease of radiative heat transfer by 8.5 mw/m·K was attained. Also, the supercritical CO2 (sCO2) foaming used by them is being considered as a promising method to produce eco-friendly thermal insulation materials with smaller cells compared to conventional foams. 7 , 10
However, not only the precise control of making light, high porosity foams with very small cell sizes with the desired characteristics is challenging, but also the technology to manufacture quantities beyond the ones possible at laboratory scale. Recently, the company SUMTEQ GmbH 14 surpassed these challenges. They developed a cost-effective and more eco-friendly production route of open pore PS with pore structures from 0.01 µm to 10 µm and wall thickness of the webs between the pores in a range from 5 nm to 50 nm. 15 The process is based on solvent exchange of PS gels in supercritical CO2 and expanding/removing the gas by dropping the gas pressure. Foam densities in a range from 30 kg/m3 to 200 kg/m3 can be achieved. The higher the density, the smaller are the pore sizes. This completely novel open pore PS material has been tested and optimized in order to use it as core material in VIPs. The objectives are combining high insulation performance with low density, good handling and durability.
In this work, the physical characteristics and thermal properties of preliminary sub-micron size PS foam will be presented in terms of density, pore sizes, morphology, infrared extinction and thermal properties. The stages of development of the PS foams are categorized as: 1st generation, related to non-opacified foams of different pore sizes/densities and 2nd generation, related to opacified foams with lower infrared radiation transmission. Its suitability for VIPs will be discussed based on the evaluated properties.
Thermal conductivity of PS foams
Thermal conductivity is the major property of an insulation material and is the sum of the individual modes of heat transfer that, in VIP, is given by
13
:

Solid conductivity happens through the core skeleton, so it is a function of the material structure and density ρ. According to Fricke et al.,
13
solid conductivity scales with density ρ of the material by the following relation:

Gaseous thermal conductivity in porous materials depends on the ratio of mean free path of gas molecules and structural pore sizes, (Knudsen effect
13
). The relationship, known as Sherman interpolation,
16
can be written as:
Radiative heat transfer is the net exchange of energy between absorbing, scattering and emitting materials of different temperature through electromagnetic waves. Radiation heat transfer within porous materials is a diffusion-like process via scattering, absorption and emission of infrared radiation. It strongly depends on the temperature T, the materials type and density ρ. The radiative conductivity, λr, can be expressed as
19
:
The equations above will be employed to analyse the thermal conductivity values of the new PS foam.
Materials and methods
Production of the foams and VIP preparation
The polystyrene (PS) based foams were developed by R. Oberhoffer 20 and A. Müller 21 with different expansion ratios. A complete description of their invention can be found in the patent. 15 In summary, the process steps are: a) modification of polystyrene beds using additives; b) swelling of the polymer using a plasticiser agent forming a gel; c) introduction of the foaming agent (supercritical CO2) under high pressure and d) release of the pressure causing the expansion of the polymer, whereby the porous material solidifies. Material and process parameters such as: base molecular weight of the co-polymers; additives content; ratio of polymer to plasticiser; autoclave pressure and temperature are all carefully selected to allow a one-phase mixture between foaming agent and plasticiser. Also a fast diffusion process of the foaming agent into the polymer gels is considered.
Non-opacified white foam (here called 1st generation) of different densities was developed by SUMTEQ GmbH and tested for its suitability as VIP cores. In order to reduce its radiative thermal conductivity, a 2nd foam generation was created by incorporating opacifier material like TiO2, Al2O3, graphite and carbon black into the polymerization step. Disk-like samples of 60 mm and 100 mm diameter with 15 mm to 20 mm thicknesses were produced out of the expanded PS beds and its density determined by measuring geometrical dimensions and mass for each sample. Representative samples of the 1st and 2nd generation PS foams are visualized in Figure 1.
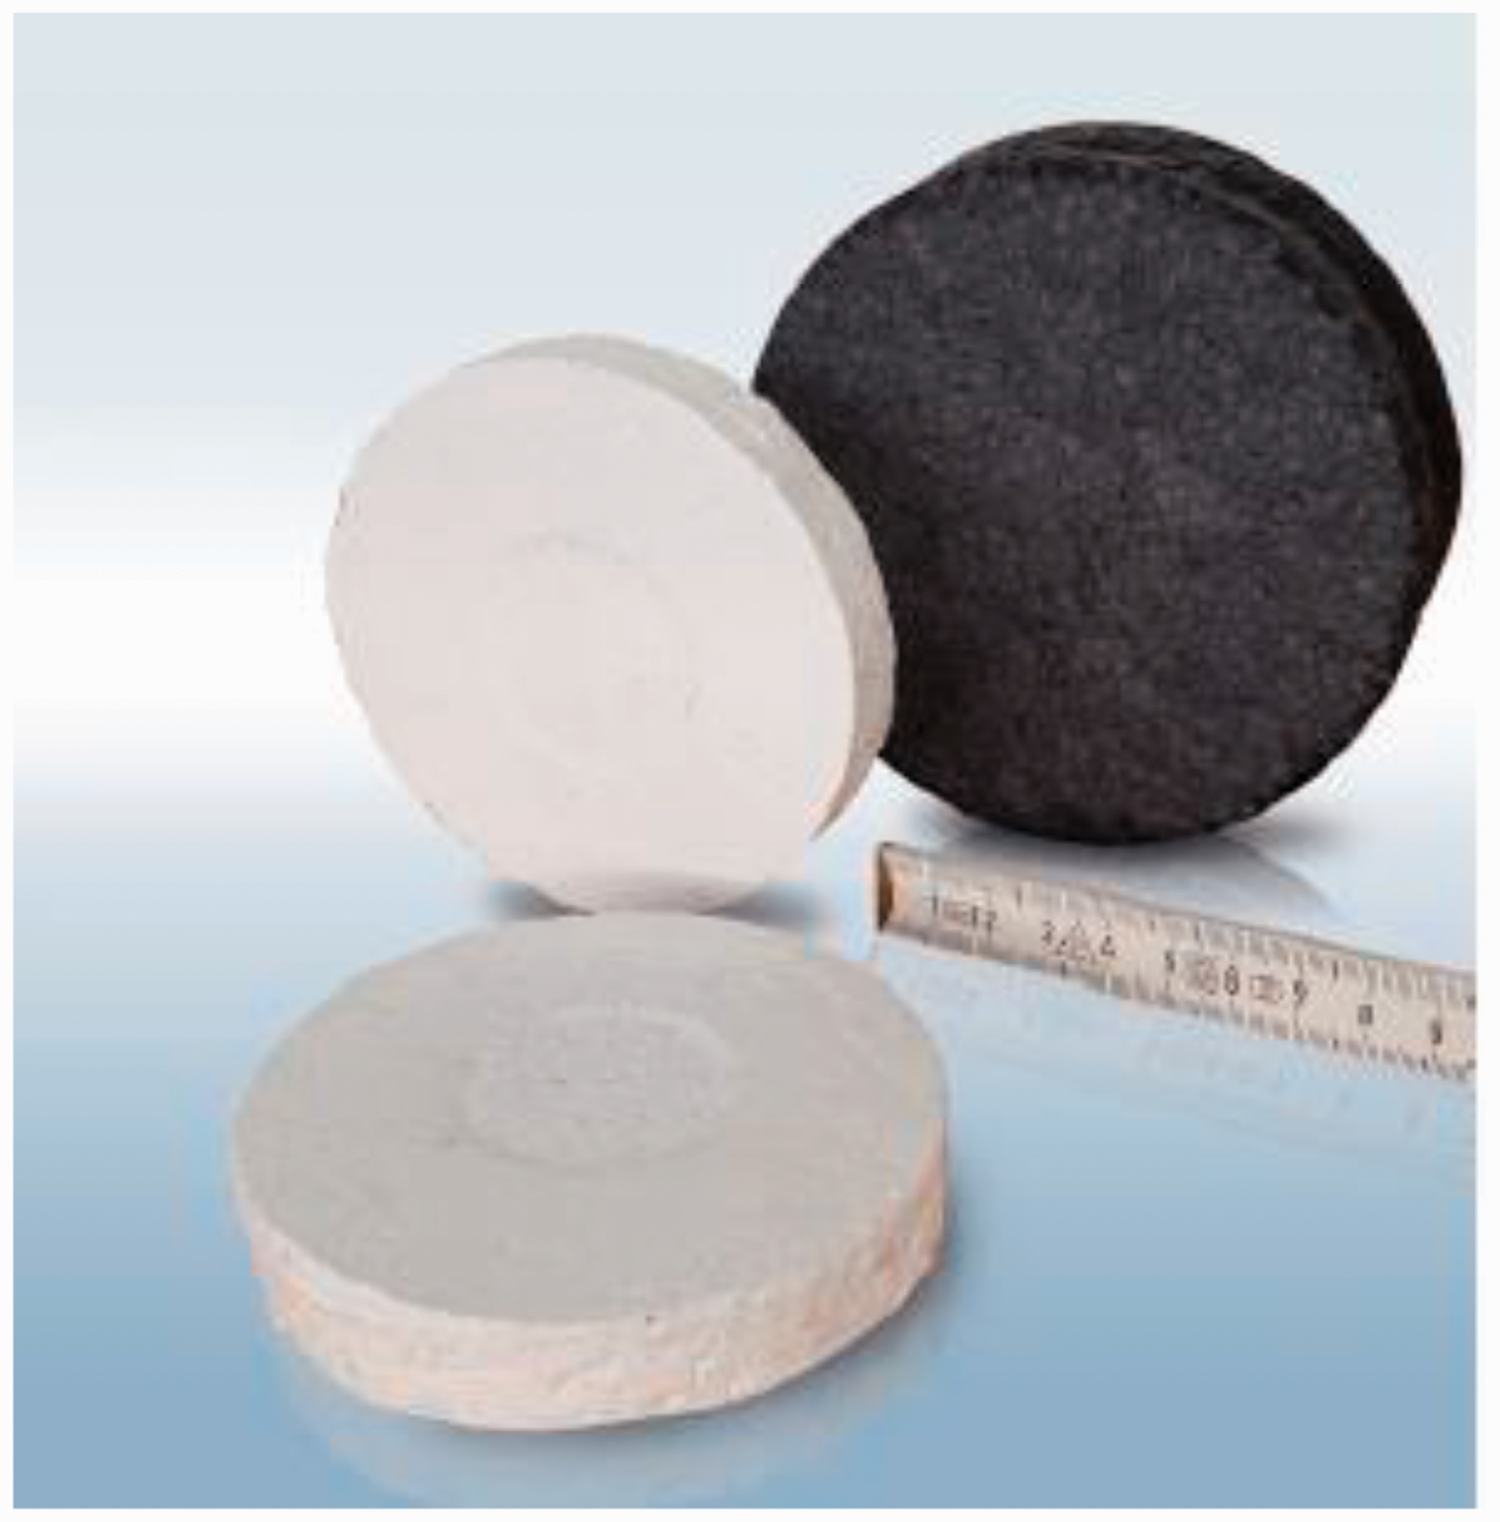
PS-based cores: non-opacified (white, 1st generation) and opacified (black, 2nd generation).
VIPs based on the different PS foams were produced following a standard VIP production procedure: the samples are placed into metallized high barrier envelopes, evacuated to pressures below 10–2 mbar within a vacuum chamber and then the inner PE layers are sealed by a heating bar before the chamber is vented to atmospheric pressures. At this stage of research, no getter or dryer material were inserted. To check for the inner gas pressure, an internal vacuum sensor was used (“va-Q-check” 22 ).
Characterization of the samples
Foam microstructure
Scanning electron microscopy (Supra 40VP from Zeiss) was used to observe the cellular morphology of the foamed polymer granules. The samples were fractured in liquid nitrogen to generate a breaking edge, fixed onto a sample holder using silver paste, and finally coated with a thin film of gold to eliminate local charge effects of non-conducting samples. The sputtering process was performed using a deposition chamber K950X with a sputter supplement K350 of Emitech.
Thermal conductivity
Thermal conductivity evaluation of the foams in air and in vacuum was made using in-house built equipment following the ASTM C518 standard as guideline, where two precision heat flux sensors are placed on each side of the testing panel to measure heat fluxes across the sample thickness at 10°C mean temperature, in steady state conditions. To study the influence of gas pressure on thermal conductivity, a dedicated set-up was developed where the metallized envelope containing the sample is connected to a pump through a pipe and positioned in between the hot and cold plates of the thermal measurement apparatus. For this specific gas pressure dependence on thermal conductivity measurement, the mean temperature was kept at 20°C. A pressure gauge is placed near the pipe and the data is collected simultaneously with the voltage signals of the heat flux sensors. Figure 2(a) presents the schema of the set-up and Figure 2(b) presents the samples placed into the thermal conductivity apparatuses. The measurement procedure starts by evacuating the sample to gas pressure below 10–2 mbar and measuring the thermal conductivity in the equilibrated state. Then the pressure is increased in several steps up to the vented state at atmospheric air pressure. By fitting the results of the thermal conductivity vs gas pressure to equation (3), the typical gas pressure p1/2 is calculated, from where the pore size dp can be estimated by applying equation (4). The accuracy of the calculated values for the structural parameter p1/2 after several measurements of the same type of commercial silica core is estimated to be about 15%, which limits the uncertainty of the results for the pore diameter dp up to about 20% from the mean value.
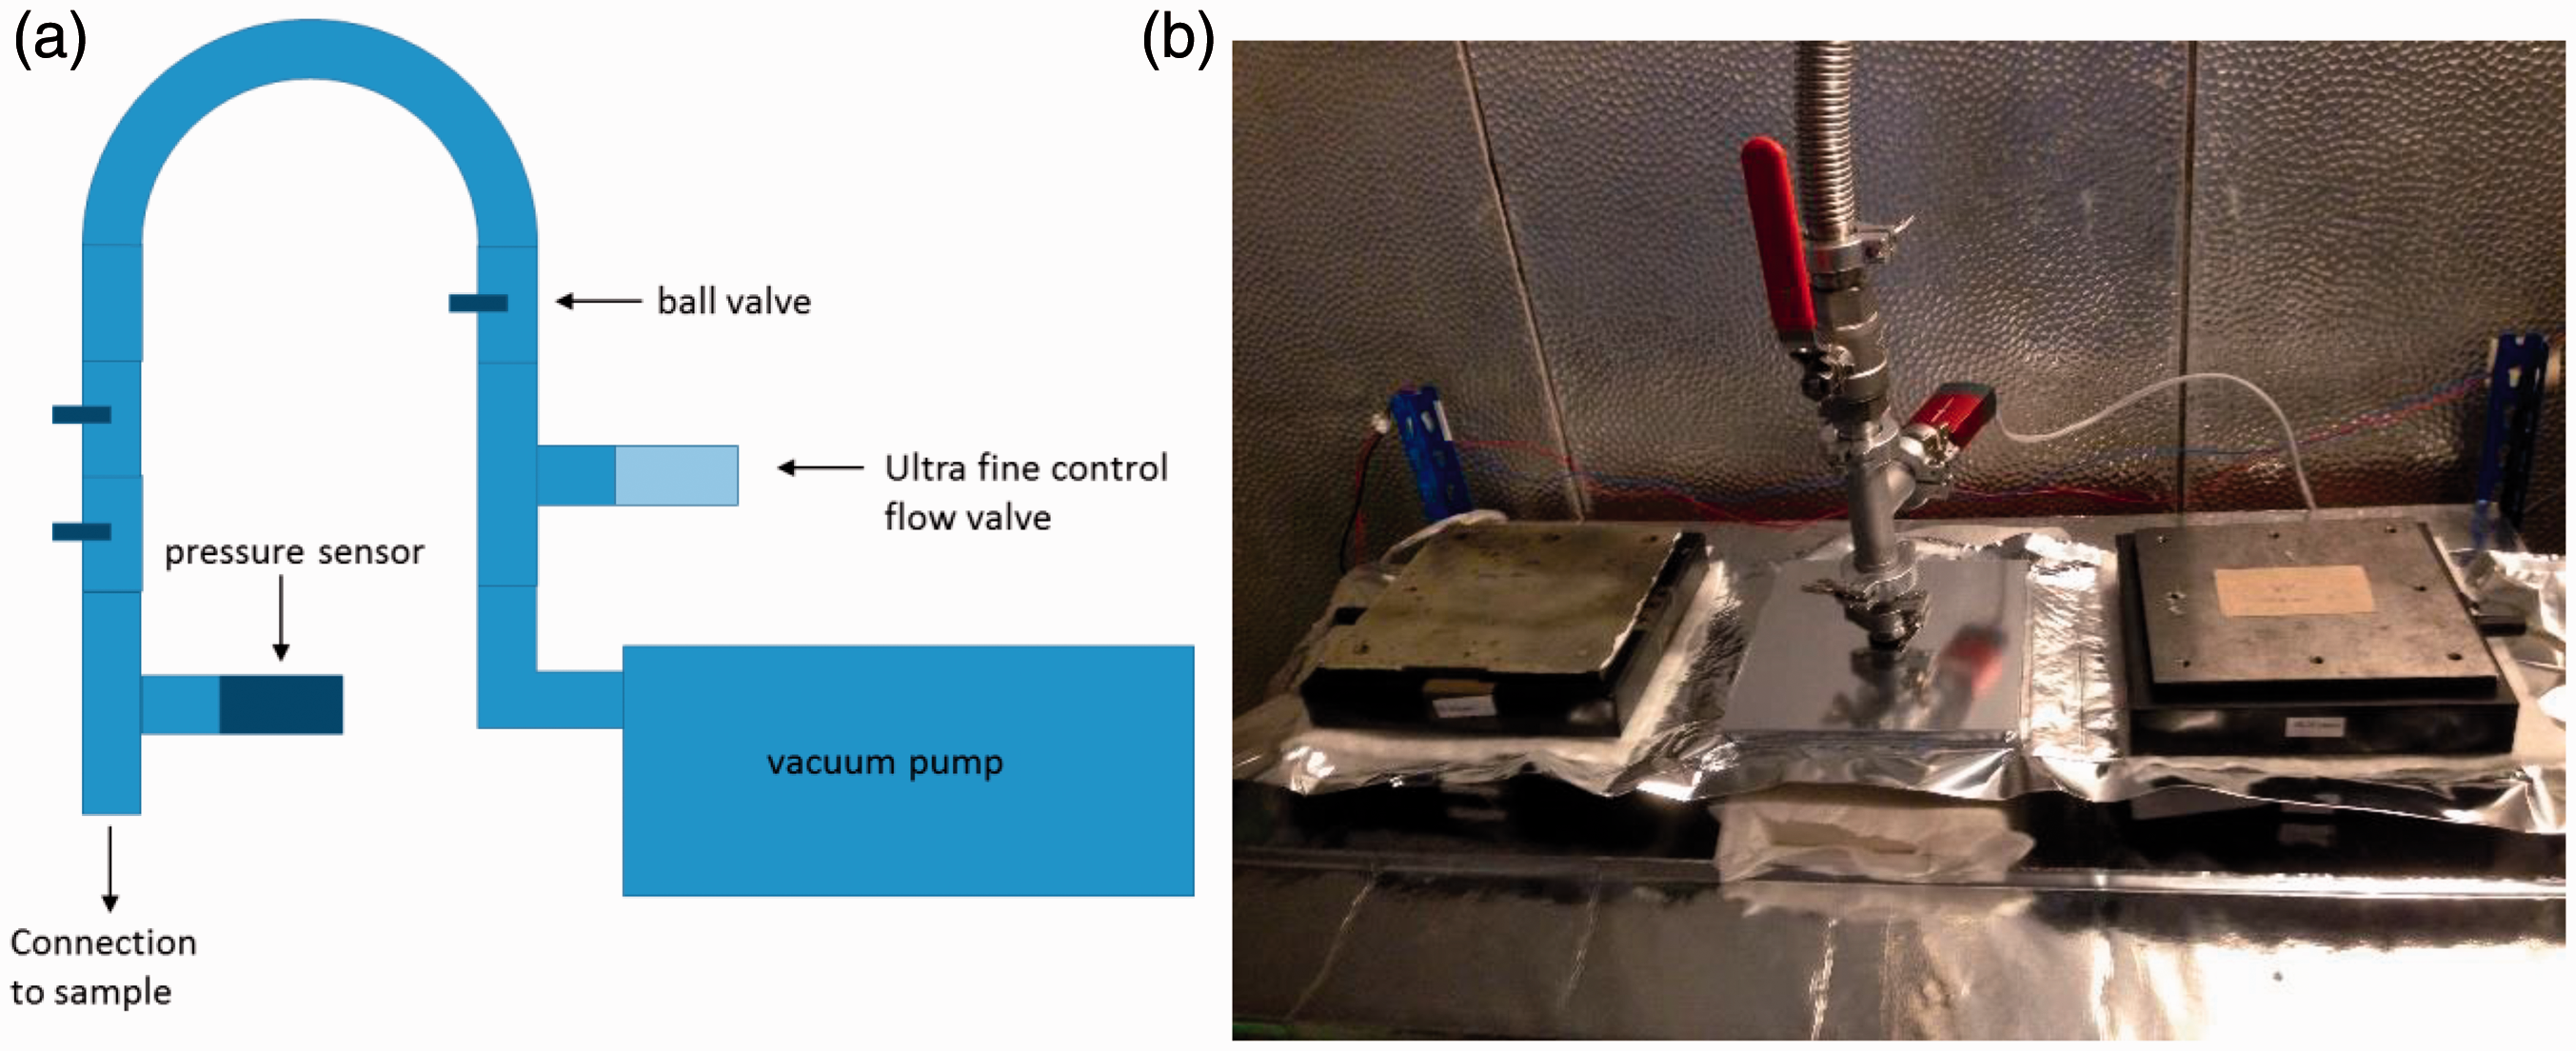
(a) Vacuum set-up for the measurement of thermal conductivity as function of air pressure; (b) positioning of the samples between the two hot and cold plates of the thermal conductivity apparatuses (left and right).
The radiative properties of the PS foams were estimated by evaluating the effect of four different mean temperatures (0°C, 10°C, 20°C and 30°C) on the thermal conductivity values of the fully evacuated sample. The measured values are plotted as function of the cube of absolute temperature (T3) from where a linear relationship is obtained. The extinction coefficient E of the foam can then be calculated using equation (5). As long as the solid thermal conductivity λs and the radiative extinction E do not strongly depend upon temperature, experimental determination of the solid conductivity λs can be performed by extrapolating the linear fit of thermal conductivity as function of T3 to T = 0 K. The radiative contribution λr at temperature T can then be calculated using equation (5) or subtracting the solid conductivity λs from the total thermal conductivity λ of the evacuated sample at temperature T (equation (1)).
Results and discussion
White, 1st generation PS foam
The key achievement of the 1st generation PS foam was the ability to produce open-cell structured foam with cell (pore) sizes well below 1 µm and sample sizes typically of 100 mm diameter and up to 20 mm thickness. Here, PS foams of several volume expansion ratios (rendering different foam densities) were produced, tested and characterized for its suitability as core for VIPs. Scanning electron micrographs of their inner structure can be seen in Figure 3. Generally, the higher the foam density, the lower is the pore size, varying roughly from about 5 µm for the foam with 72 kg/m3 density (Figure 3(a)) to around 200 nm - 500 nm for the foam with density of 177 kg/m3 (Figure 3(d)).
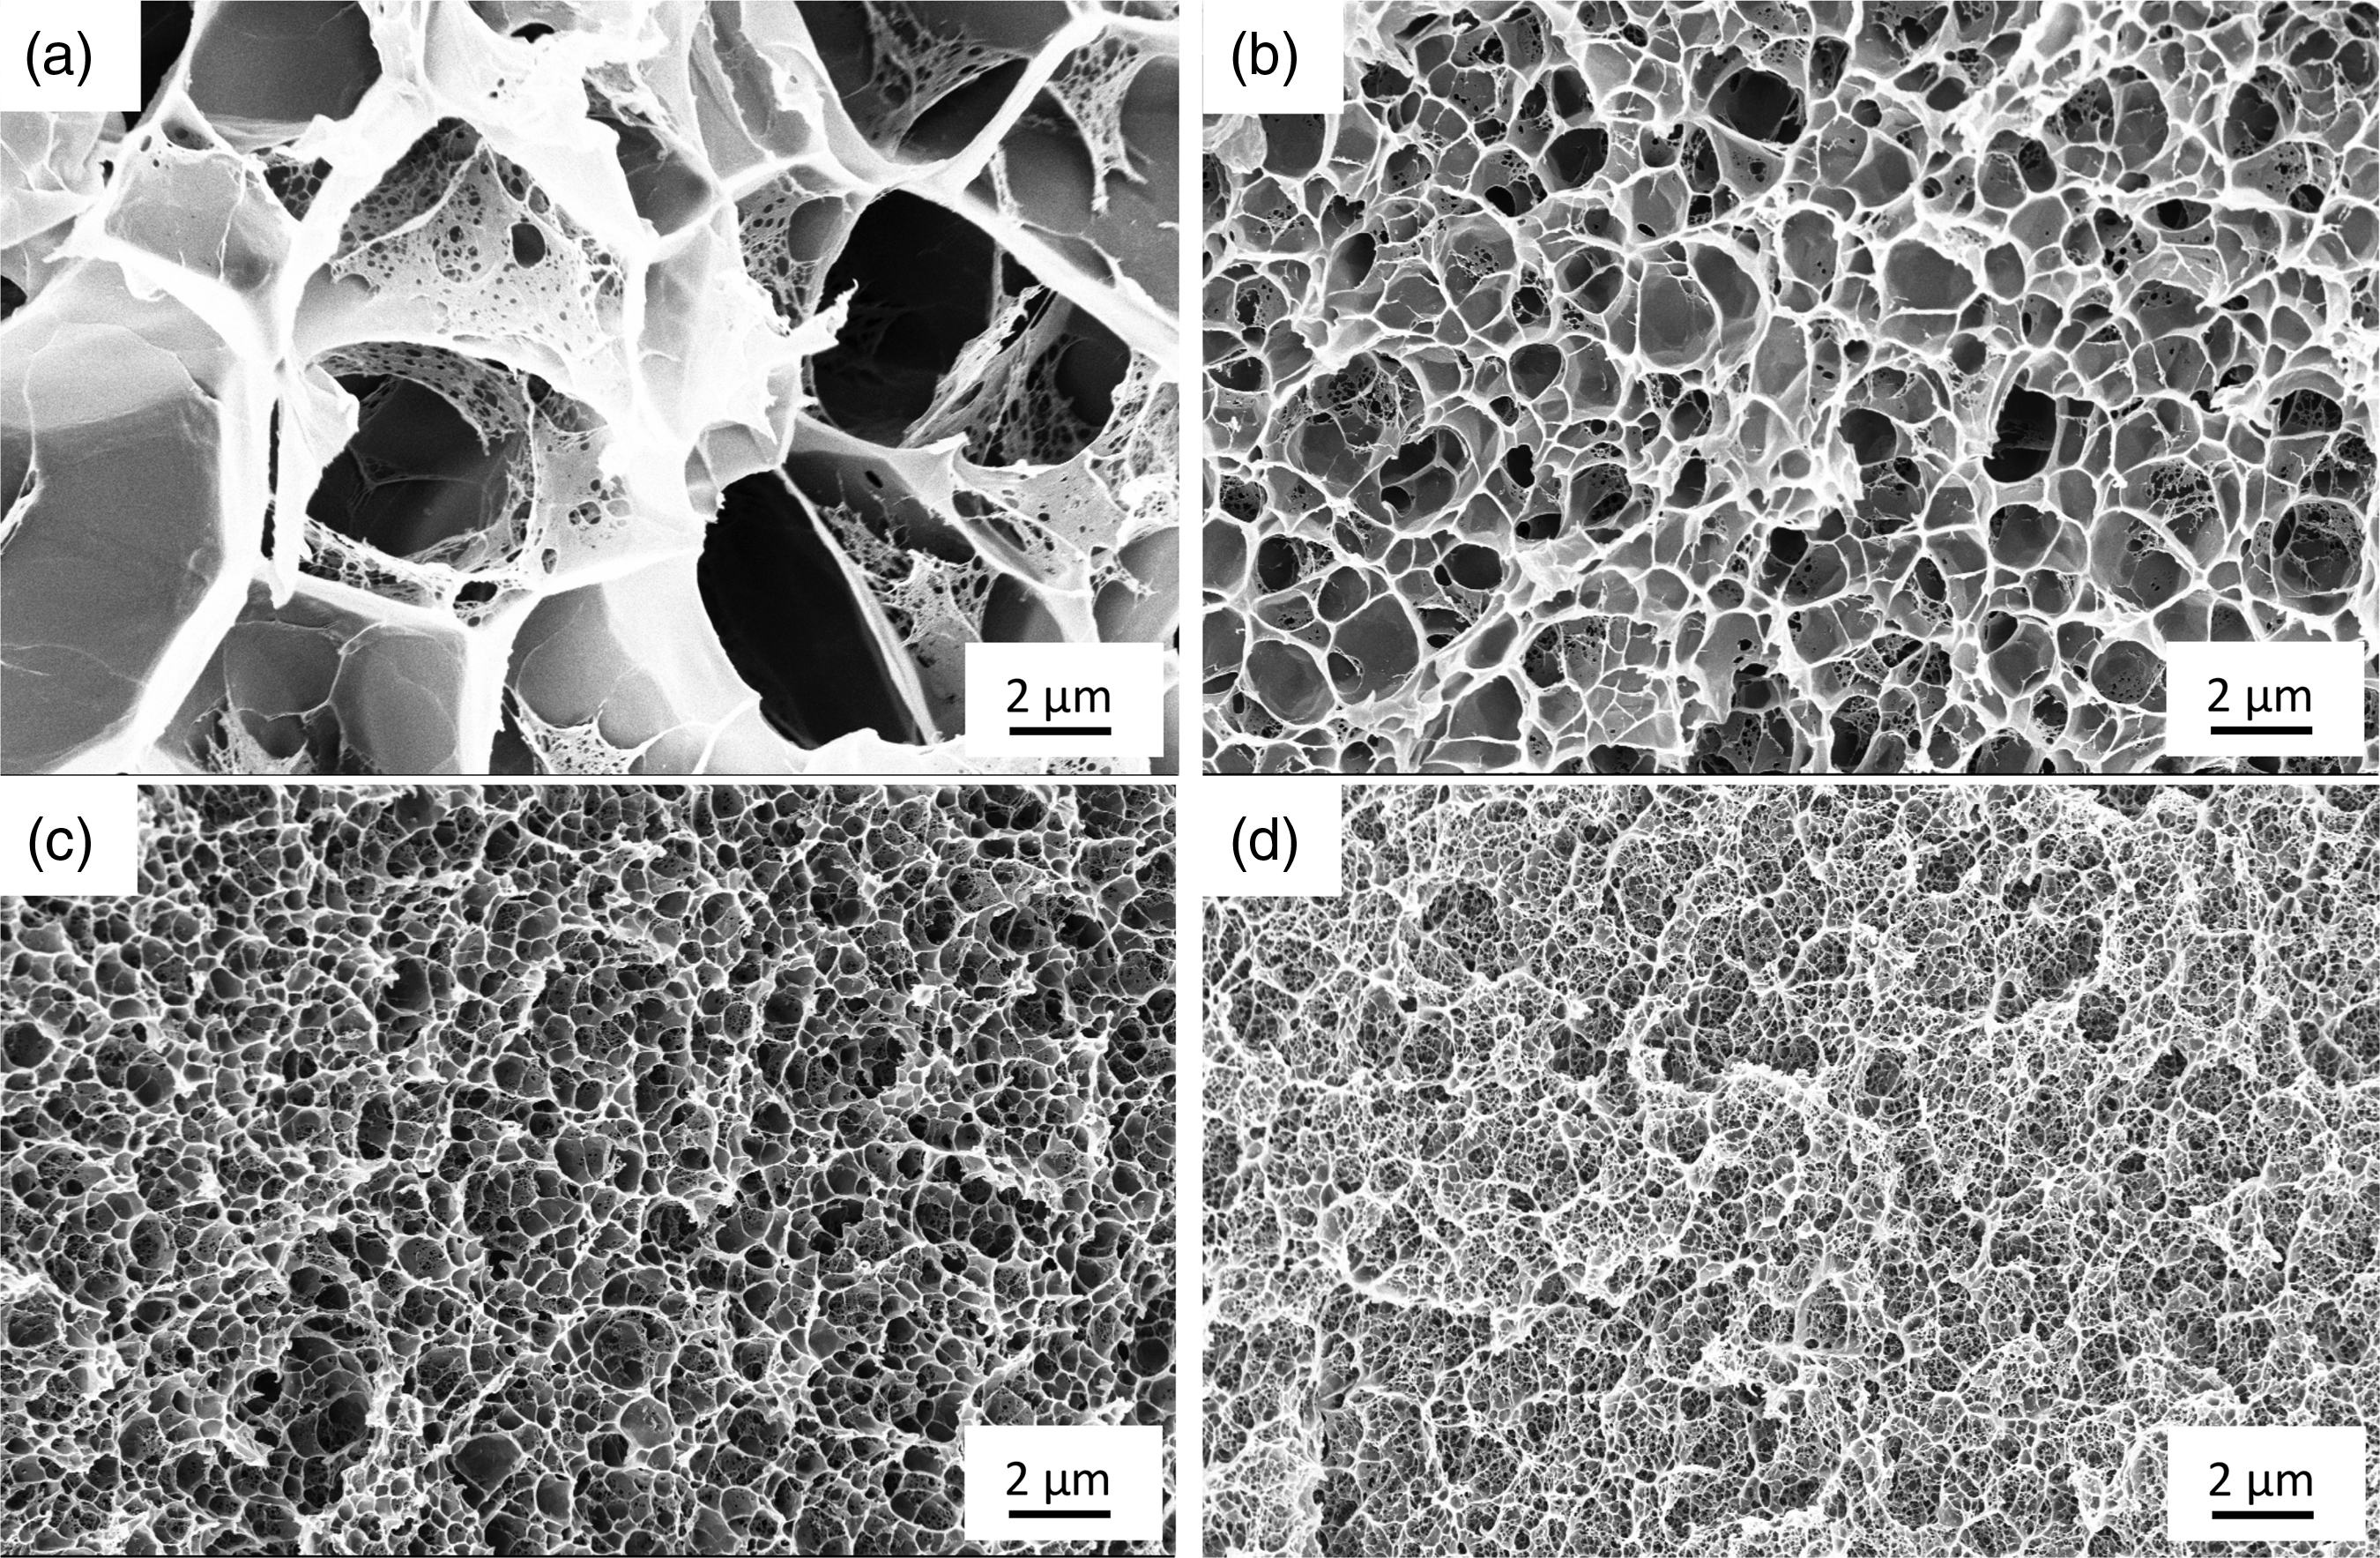
Scanning electron microscopy (SEM) pictures of the different PS foams with densities ρ: (a) 72 kg/m3; (b) 75 kg/m3; (c) 100 kg/m3 and (d) 177 kg/m3.
Besides the mechanical support to withstand 1 bar atmospheric load in vacuum, the VIP core material has to provide an open pore structure for easy evacuation. Also important is the absence of outgassing. Additionally, for a long service life time of VIP (which determines its usability for each specific application and essentially for buildings) small pore diameters are advantageous according to equations (3) and (4). All the foams could be evacuated to initial pressures between 0.2 mbar and 0.6 mbar. However, an increase in gas pressure after the first days of production was noticed and reached a maximum plateau at about 1 mbar after 15 days. Possible reasons for this increase are: a) residual moisture presented on the surface of the polymer cores, even if the polymers have a hydrophobic character; b) existence of some fraction of closed pores inside the foams with entrapped air, which is then gradually released by permeation through the cell walls with time or c) outgassing of the inner PE layer of the envelope foils, which however is negligible.
The overall thermal conductivity of the first PS foam generation was measured in air and in vacuum, showing some linearity with the foam density (Figure 4). This effect is expected by the increasing of solid conduction according to equation (2). In air, thermal conductivities were in the range of 40 mW/m·K to 45 mW/m·K and decrease to around 15 mW/m·K to 20 mW/m·K when in vacuum. Typical values of a commercial expanded PS foam (EPS) of 30 kg/m3 were also plotted for comparison, which are in a range between 31 mW/m·K and 35 mW/m·K at 10°C. 23 As this conventional PS material is not able to be evacuated at all (due to its closed-pore structure), comparative values in vacuum were not possible to be obtained.
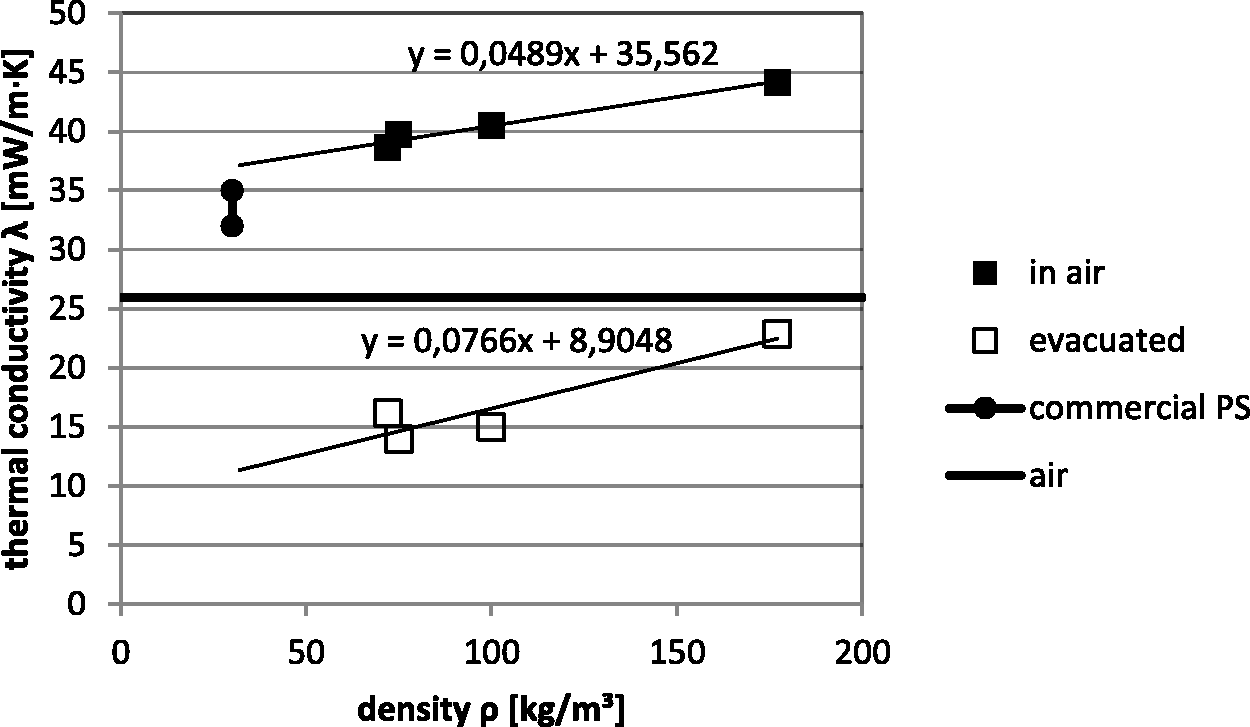
Overall thermal conductivity values of the 1st generation PS foam in air (■) and evacuated (□) and as function of core density ρ.
Considering the difference of thermal conductivity of the foams in air (λfoam-in-air) and in vacuum (λevac), the gas conductivity inside the pores λgas is somewhat lower than the conductivity of still air (λg0), which is about 26 mW/(m·K) at 20°C. 13 This is obvious especially for the foam with the highest density which, due to the very small pore sizes as seen in the foam microstructure of Figure 3(d), is an indication of the Knudsen effect.
From a linear fit of the λfoam-in-air as function of density ρ (in kg/m3) and subtracting λevac (Figure 4), one gets the contribution of the gas thermal conductivity λg (in mW/m·K) within the pores, which can be calculated using the following relationship:

By using equation (6), the relationship between the calculated values of λg as function of density is presented in Figure 5.
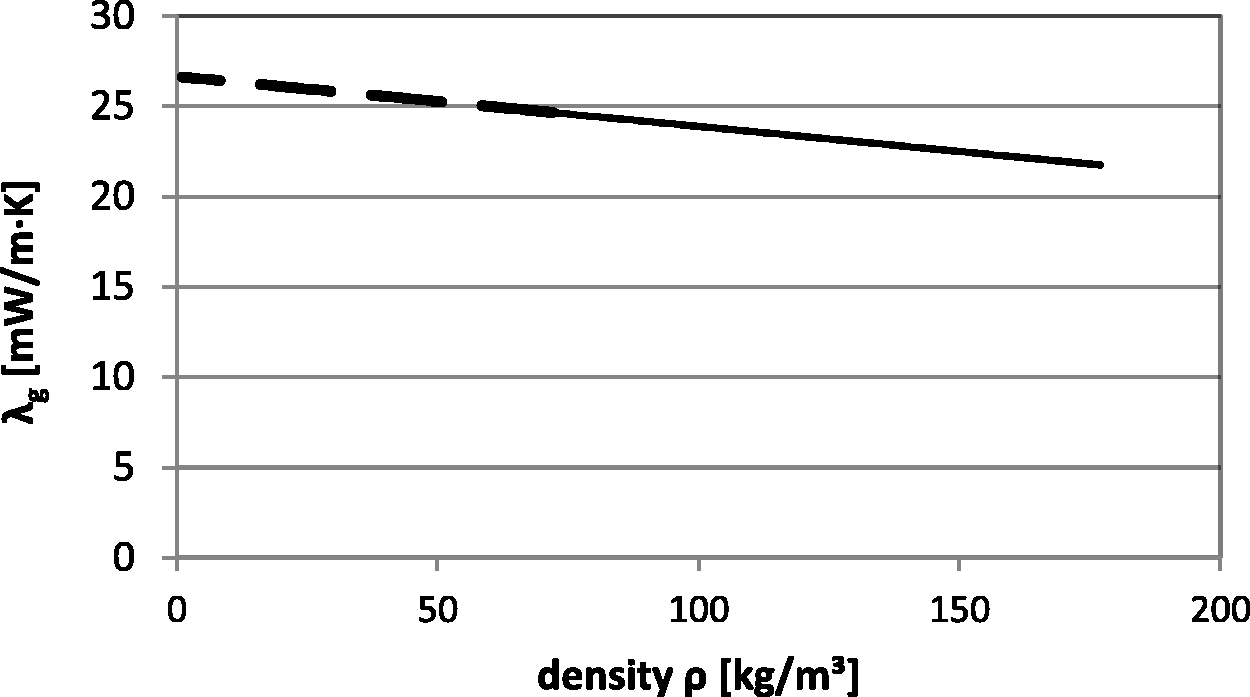
Calculated thermal conductivity of the air (λg) within the pores of the 1st generation foams using Equation (6) (dashed line: extrapolation).
The extrapolated, dashed line in Figure 5 for small densities ρ reaches, as expected, the thermal conductivity λg of still air, around 26 mW/m·K. By applying equations (3) and (4) on the above experimental data, an estimation of p1/2 and the correspondent pore sizes for the different foam densities are presented on Figure 6(a) and (b), respectively. The estimated p1/2 values vary between 80 mbar to 230 mbar, which is in the middle range compared to common VIP core materials (600 mbar for fumed silica and 5 mbar for glass fibre 24 ). The corresponding pore diameters dp are in the range of 3 µm to 1 µm, revealing that the larger the density ρ the smaller are the pore diameters dp. This first estimation on pore sizes seems to be in a good agreement with the observed foam microstructures of Figure 3, especially for the foams with densities below 75 kg/m3 (Figure 3(a) and (b)).
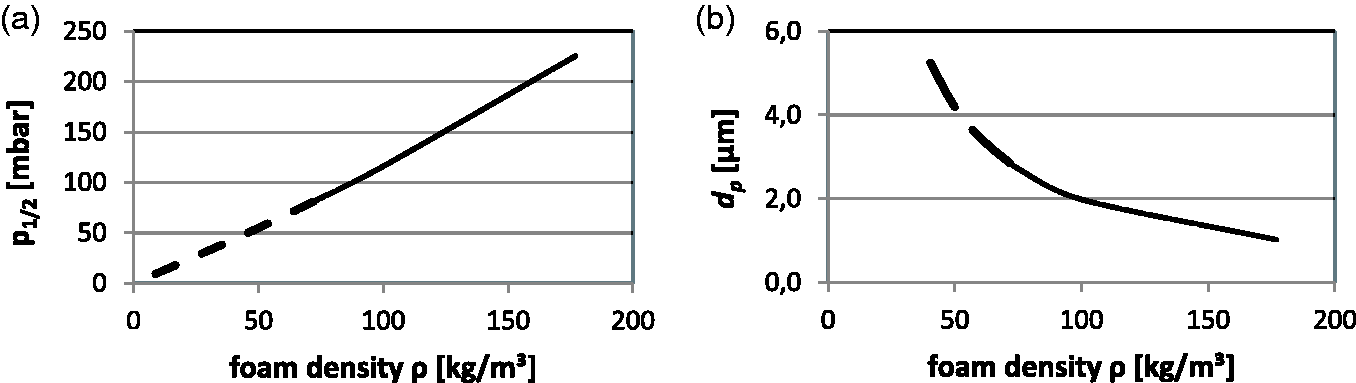
(a) typical gas pressure (p1/2) and (b) the estimated pore diameter dp of the different foam densities (dashed line: extrapolation).
Measurements of thermal conductivity λ for different gas pressures p is a more accurate experimental method to determine p1/2 and the typical pore structure diameter dp. The measurement was performed for the foam with the highest density (ρ = 177 kg/m3) and is presented in Figure 7(a). Here, the best fit of the data values is possible when at least two distinct pore sizes are considered, where 75% of the pores have p1/2 = 600 mbar (the same as for fumed silica 24 ) while 25% have a p1/2 = 2 mbar. According to equation (4), they correspond to pore sizes dp of 0.4 µm and 120 µm, respectively. A high magnification SEM micrograph of this foam is given in Figure 7(b) and corroborates with the estimated value for the small pores found in the pressure dependence measurement. The big pores were not observed in the foam structure, but they could be visually observed in interstitials spaces in between the beads/granules during compaction.
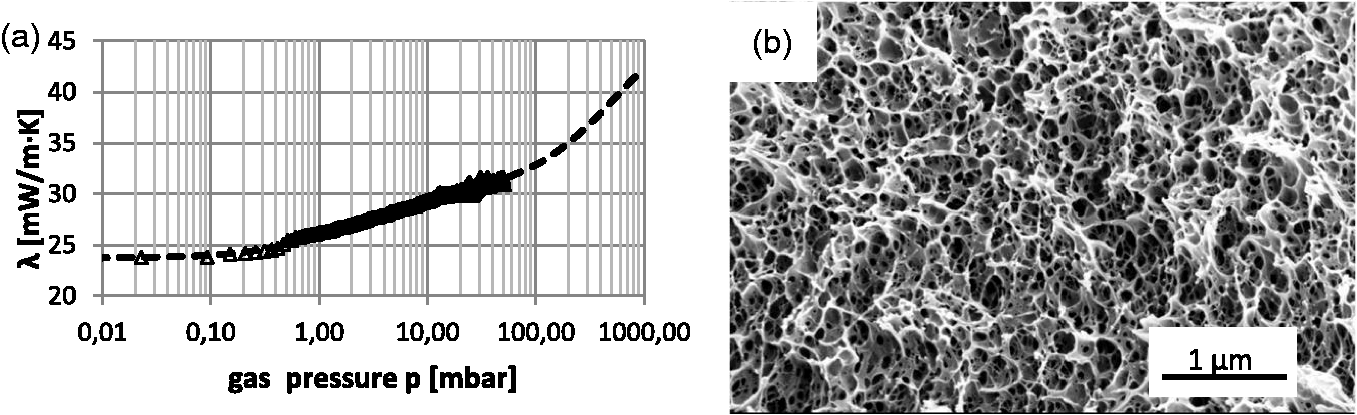
(a) Thermal conductivity λ as function of gas pressure p for the 1st generation foam with ρ = 177 kg/m3 (Δ are the experimental data points and (-) dashed line is extrapolation of fit function) and (b) respective SEM micrograph.
These very first results on pore sizes and typical gas pressures are very promising, although the overall λ still is very high for both the VIP core and the air-filled foam. As in evacuated foams gas conductivity is supressed to a minimum, heat transfer by conduction through the solid matrix and by radiation through the medium are the major components of the thermal conduction of the new PS foam. For estimation of the contribution of radiation and solid part, temperature dependent measurements of the evacuated foam samples were performed.
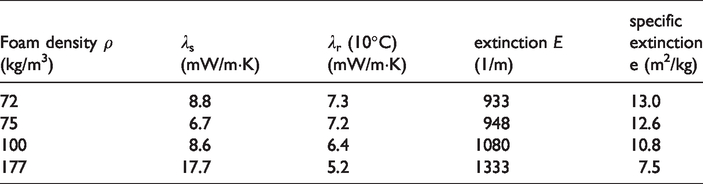
By plotting the measured thermal conductivity λ as function of the cube of mean temperature T³ (Figure 8) using equation (5), the radiative extinction E is calculated. The solid conduction λs could be then estimated by extrapolating the fitted values of T3 to 0 K. Table 1 summarizes the results for all foam densities, where the specific extinction e = E/ρ (infrared-shadow area per mass) is also presented.
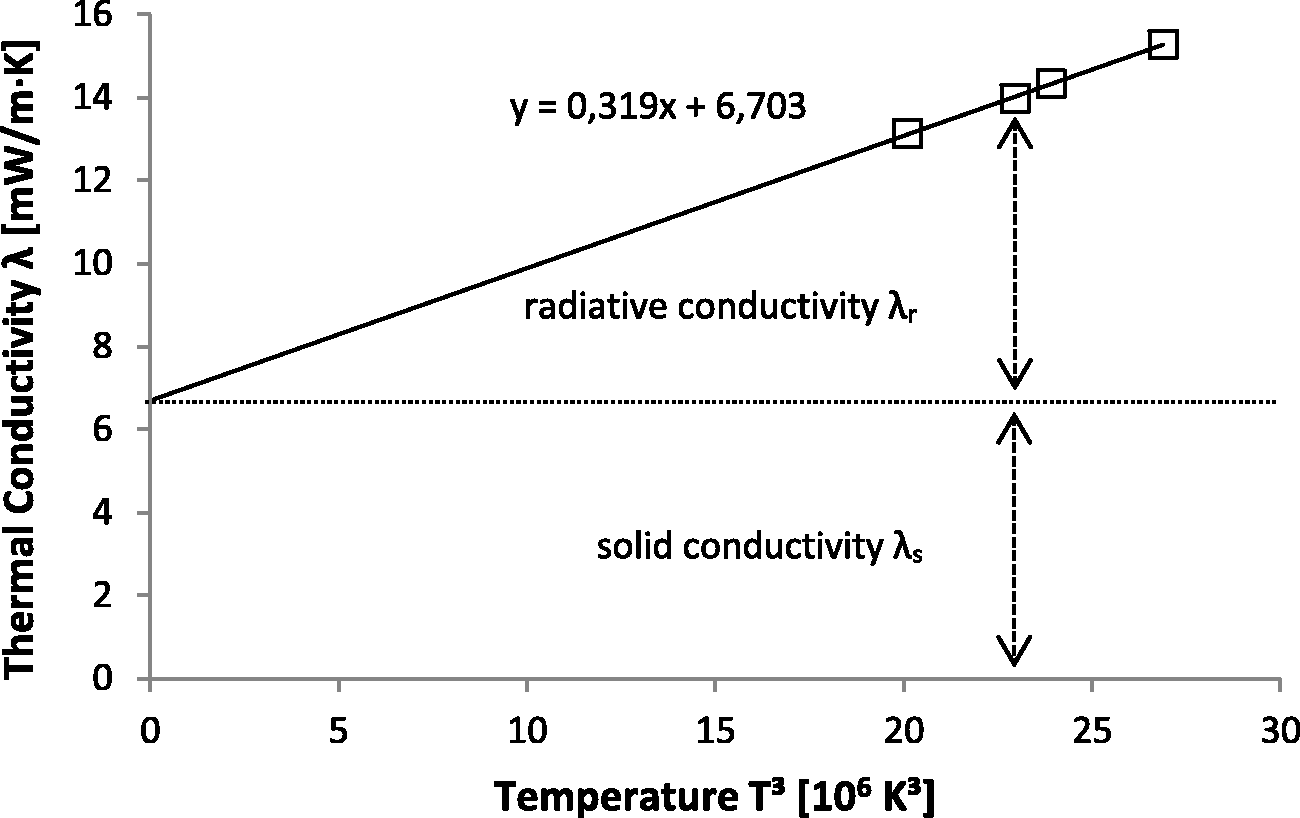
Thermal conductivity λ as function of cube of temperature T3 for a 75 kg/m3 1st generation foam.
Solid conductivity (λs), radiative conductivity (λr), extinction coefficient (E) and specific extinction (e) of the different 1st generation PS foams.
Although the number of samples for having more representative values is low and the relationship between solid thermal conductivity and density is only approximately (especially for the foam densities below 100 kg/m3), the results presented in Table 1 tend to follow a linear relationship, as can be seen in Figure 9.
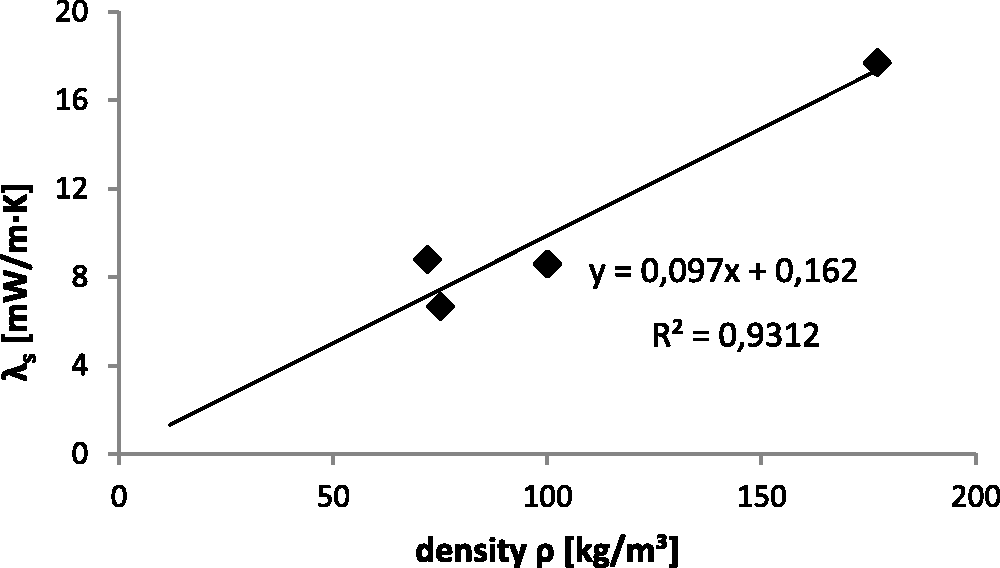
Solid thermal conductivity λs as function of foam density ρ for the 1st generation PS foams.
The radiative thermal conductivity of the foams is about half of the total λ value for foam densities up to 100 kg/m3 (Table 1 and Figure 8) and decreases to about 20% for the highest density foam. This can be explained by the higher extinction E with increasing density ρ of the material. However, this is just a simple explanation, since radiative conductivity can be adversely affected by the morphological foam structure, namely wall thickness, void fraction, homogeneity, IR absorption properties and cell diameter. 25 An optimum range of cell size in commercial PS in which absorption and scattering of infrared radiation is maximized was demonstrated to be between 120 µm – 180 µm for EPS and XPS foams, 25 , 26 which is two orders of magnitude bigger than the pores sizes of the PS foams presented in this work. The small micrometer structural sizes significantly reduce the scattering for the IR electromagnetic waves,8,9 which at room temperature have a typical wavelength of 10 µm.
The values for the mass specific radiation extinction e are calculated to be between 7.5 m2/kg and 13 m2/kg and are, approximately, inversely proportional to the foam density (Table 1). Such values are very low in comparison with the ones of commercial extruded PS foams as well as the mentioned PS samples of Figure 15 in Wong and Hung, 6 of about 40–50 m²/kg, 27 showing that the addition of IR attenuators (opacifiers) to the 1st generation white foam is essential. So, the decreasing of the cell sizes by the new process had a counter effect on the total thermal conductivity both in air and evacuated due to the enhanced contribution of the thermal radiation conductivity.
Opacified, 2nd generation PS foam
The thermal conductivity results of the 1st generation PS-based foams lead to the necessity of incorporating opacifier material into the polymer in order to reduce the radiative contribution. Although the use of opacifier into the foam rendered cell sizes no longer on the submicrometer level, as it will be here presented, it is also to highlight that it was possible to reduce the radiative thermal conductivity while still keeping an open-cell structure and cell sizes of below 10 µm.
An opacifier is a material that strongly absorbs or scatters infrared radiation and is commonly used for this purpose in fumed silica VIPs and other thermal insulations. 7 , 10 , 19 , 24 , 28 An example is Neopor®, a commercial opacified expanded polystyrene foam. 28 Carbon based materials such as carbon black, graphite, carbon nanofibers and nanotubes, as well as TiO2 or Al2O3 have been refereed in literature for the purpose of decreasing radiative conduction of polystyrene foams. 7 , 10 , 26 , 28 , 29 Such materials have different attenuation behaviours; the carbon based ones reduce IR transmission mainly by absorption, whereas TiO2 or SiC powder particles both scatter and absorb radiation. 18
The experimental tests were done with carbon black, graphite, TiO2 and Al2O3, also using different particle sizes for some of them. The quantities varied in between 1 wt% to 15 wt% to find an optimal result of low radiative conductivity while trying to keep the structural integrity of the foam. The results of optimized foam compositions using different opacifiers are summarized in Table 2. The designation C corresponds to carbon-type opacifier whereas the numbers 1 to 4 are from different compositions (type and quantity). The other letters T and A correspond to titanium oxide and aluminium oxide, respectively.
Thermal conductivities (in-air, in vacuum, solid -λs and radiative -λr), extinction coefficient (E), specific extinction (e), density (ρ) and typical gas pressures (p1/2) of the 2nd generation PS foams with different opacifiers (C corresponds to carbon-based opacifier while T and A are titanium and aluminium oxide, respectively). Only best results for each type of opacifier are collected here.
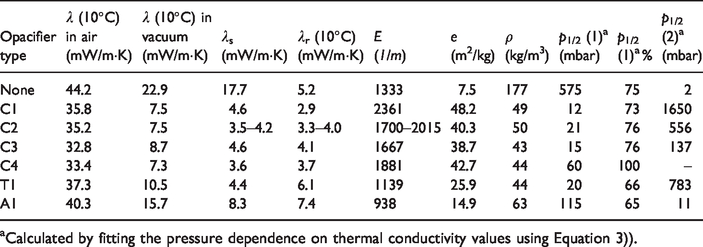
aCalculated by fitting the pressure dependence on thermal conductivity values using Equation 3)).
The results of Table 2 show that the thermal conductivity properties, namely IR extinction effect and typical gas pressures p1/2 (i.e. pore sizes) are highly influenced by the type and composition of opacifier used. Figure 10 shows the calculated pore sizes dp by using equation (4) for the larger amount of pores for each optimized opacifier composition. Pore sizes ranging from 2 µm to 20 µm were estimated and their percentages about 73% and 65%, respectively.
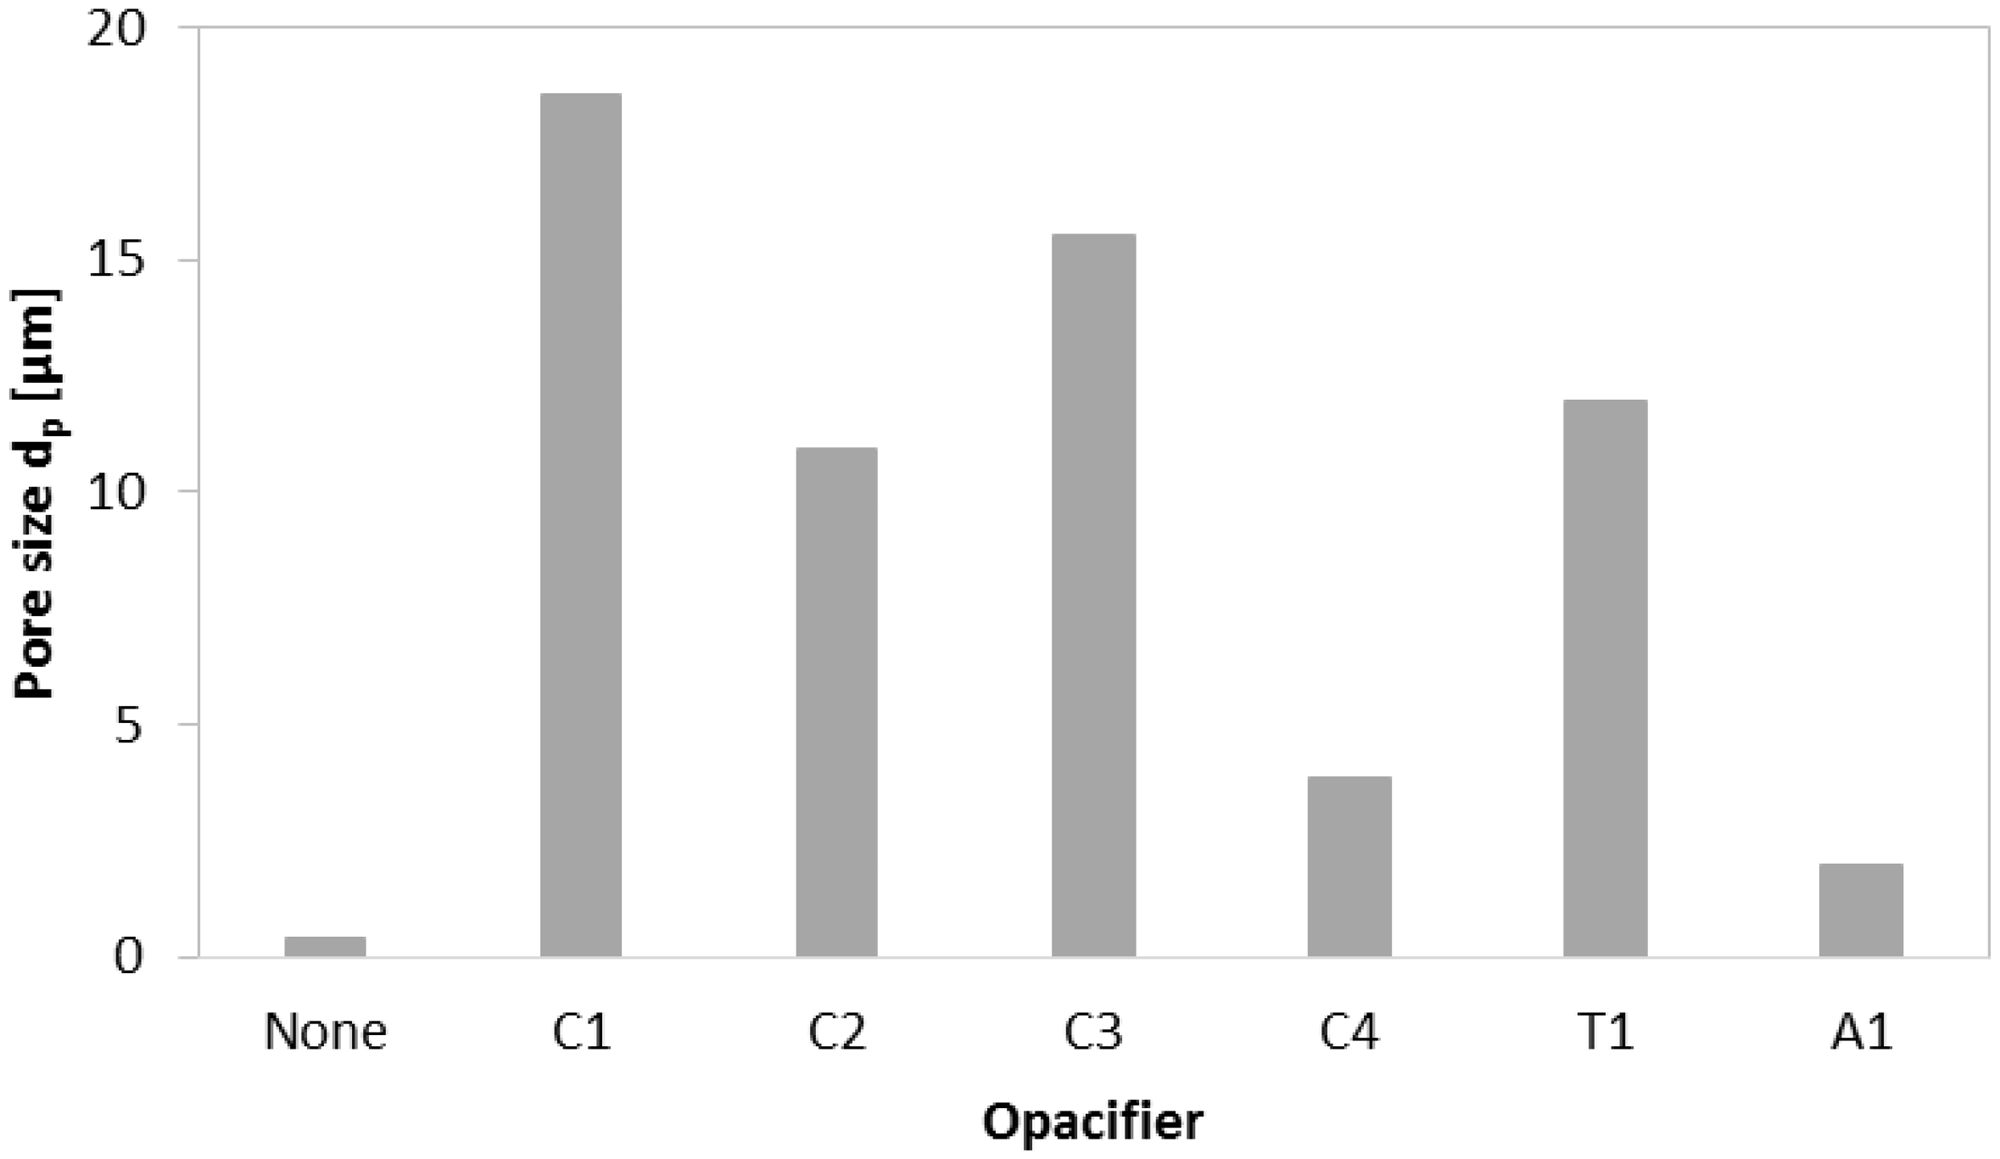
Pore size dp results from the optimized opacifier compositions as calculated using Equation 4) (for the largest amount of pores).
Some of the opacifiers look promising in order to obtain a low thermal conductivity in vacuum, a low density ρ and a radiative contribution λr up to 2mW/m·K lower in comparison to that of of the 1st generation, non-opacified PS foams (Table 1). The lowest thermal conductivity in vacuum is that of the sample containing opacifier C4 (Table 2), which has a good compromise among the above mentioned characteristics while keeping a fine and homogenous pore distribution.. TiO2 and Al2O3 resulted in the lowest contribution to specific extinction e, the opacifier type A1 having similar specific extinction e value to the white 1st generation (Table 1). A comparison of the thermal conductivity λ as function of T3 for the PS foam with opacifier A1 and the foam with opacifier C4 is given in Figure 11. It is clearly seen that not only the carbon-based opacifier C4 renders lower values of solid thermal conductivity λs than A1 (y-intercept), but also a factor of 2 lower radiative conduction λr.
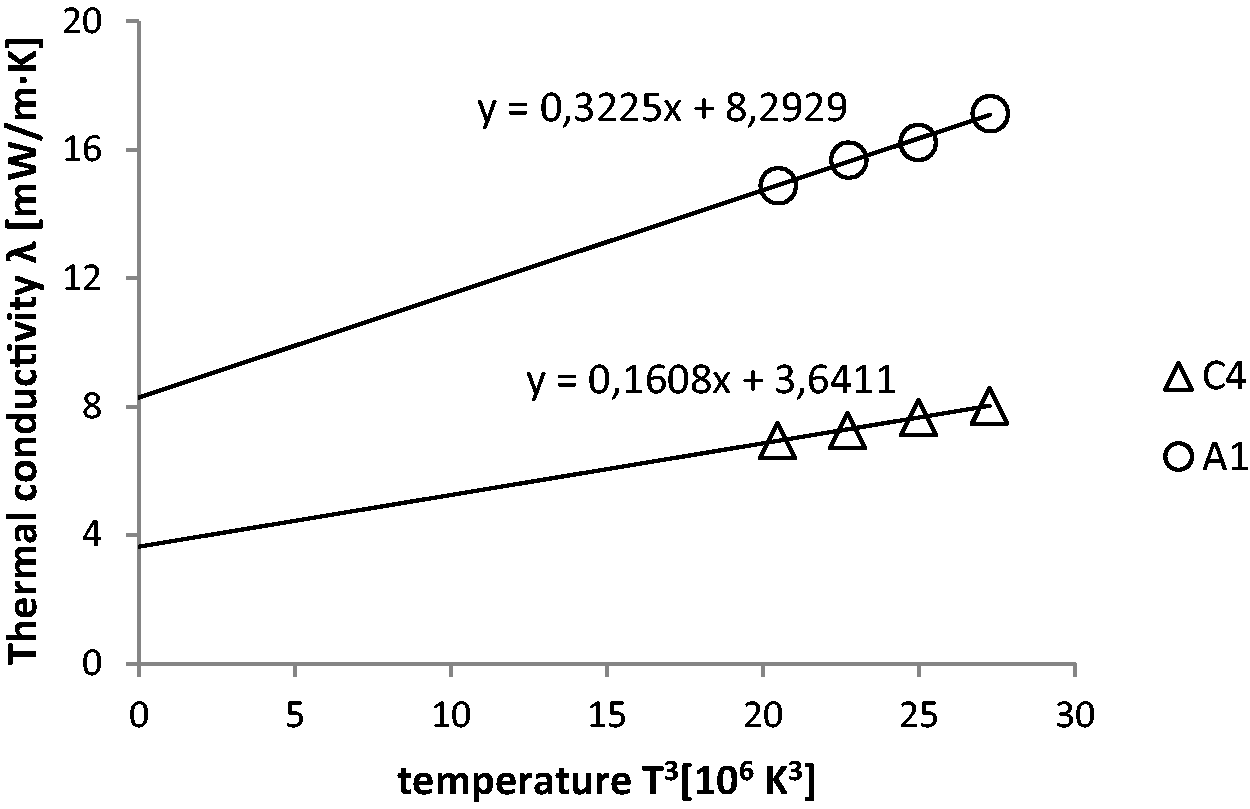
Thermal conductivity as function of T3 for the PS foam with opacifier A1 and the foam with opacifier C4 (Table 2).
For one of the carbon-based opacifiers, thermal conductivities in air and in vacuum (Figure 12(a)) reach a minimum value when using 10 wt.% opacifier of about 33 mW/m·K and 7 mW/m·K, respectively (the sample C4 of Table 2), corresponding to the maximum value of specific extinction of about 43 m2/kg (Figure 12(b)). This specific extinction e is now 3 to 5 times higher than of the non-opacified 1st generation foam (Table 1). It is in the range of commercial opacified PS. 27 Further addition of opacifier results in a slightly higher thermal conductivity, in air as well as in vacuum, reaching values around 38 mW/m·K and 9 mW/m·K, respectively. The opacifier materials itself have higher thermal conductivities of many orders of magnitude in comparison to PS (about 16–28 W/m·K for carbon black and 118 W/m·K for fine grade graphite, compared to 0.14 W/m·K for the polymer 26 ). From a certain concentration on they can affect the solid thermal conductivity λs of the blend.
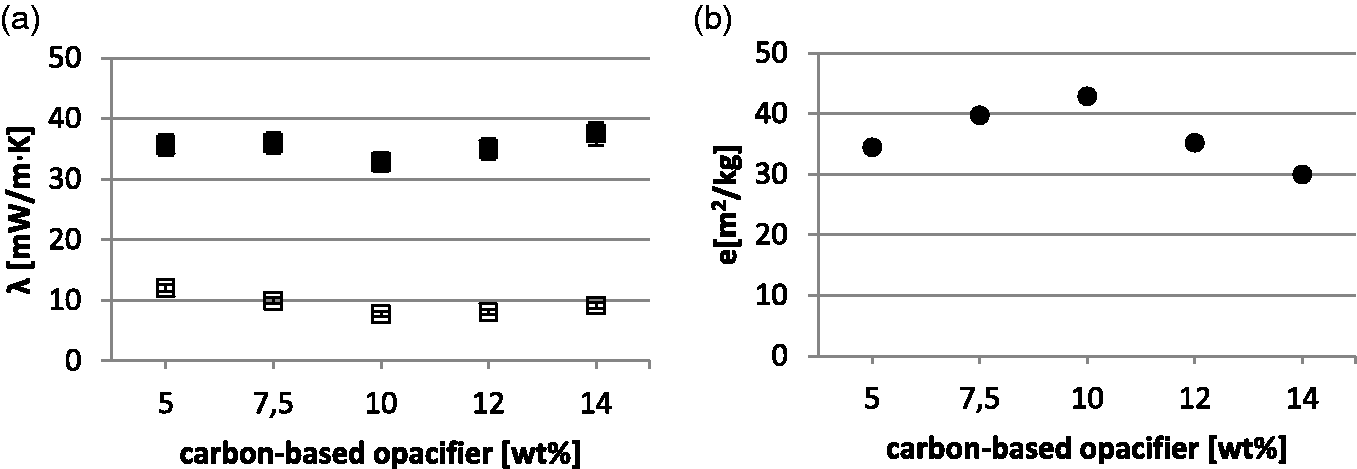
(a) Thermal conductivity λ in air (■) and in vacuum (□) for the 2nd generation PS foams with different opacifier quantities (carbon-based) and, (b) the respective specific extinction e. The PS foam with 10 wt.% opacifier correspond to the sample C4 of Table 2.
The calculated solid conduction λs of the 2nd generation PS foams (Table 2) are shown in Figure 13 together with the values of the 1st foam generation of Figure 9. The λs values of the 2nd generation foams did not change considerably the linear slope of the previous 1st generation ones and the coefficient of determination remained similar (R2 = 0.93). This means, there is no considerable change on solid conduction caused by the opacifier material for the foams shown in Table 2, or it is below the accuracy of the measurement method.
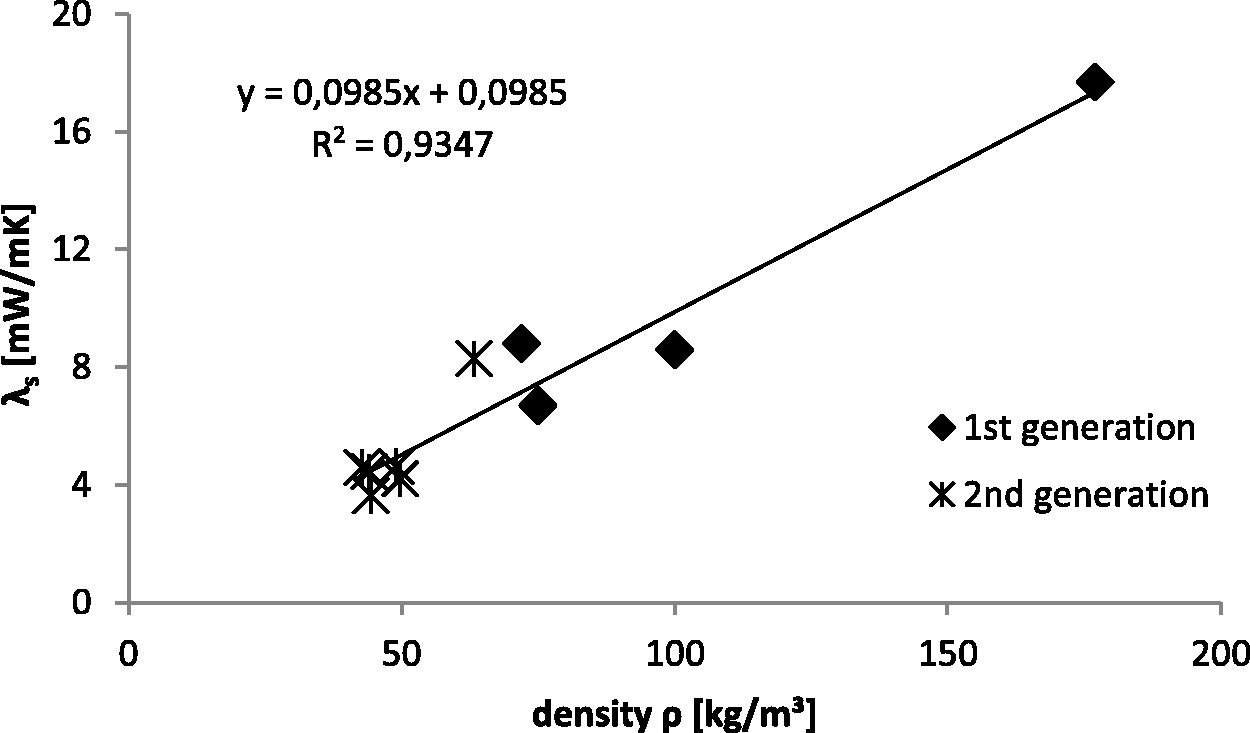
Solid thermal conductivity λs as function of foam density ρ for the 1st and 2nd generation PS foams.
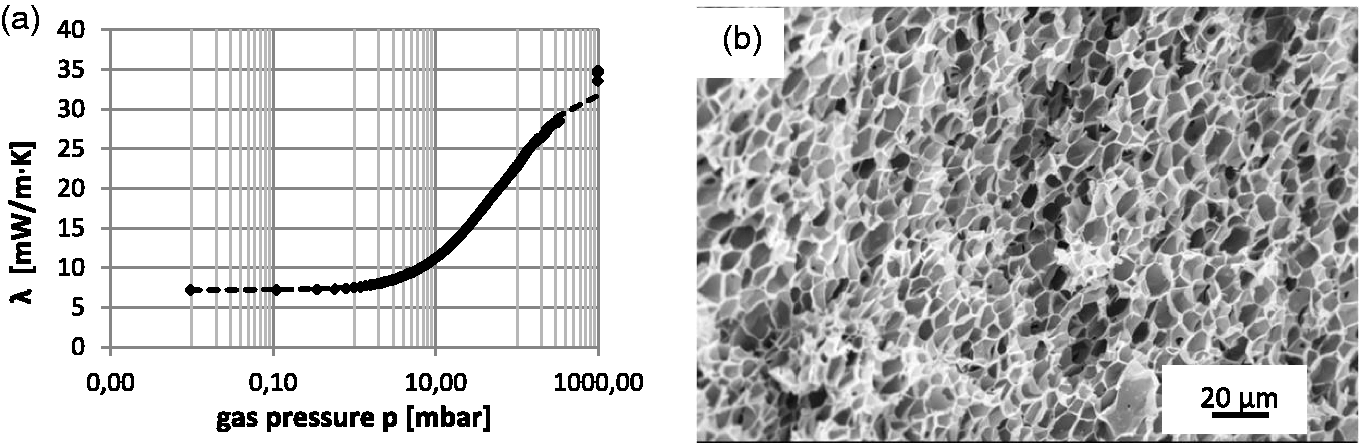
The thermal conductivity dependence on gas pressure for the C4 sample is given in Figure 14(a). According to equations (3) and (4), the typical gas pressure p1/2 was found to be about 60 mbar and the pore diameter dp ∼ 4 µm, respectively. The estimated dp seems to be in a good agreement with the observed pore dimensions in the SEM micrograph of Figure 14(b). For pressures below 1 mbar, the thermal conductivity is about 7.3 mW/m·K and gradually increases to 11 mW/m·K at 10 mbar, which is about 50% more than the initial low pressure value (Figure 14(a)).
Comparison of the PS foams with other insulation materials
Insulation performance and service life are two major properties of VIPs, closely related to the nature and microstructure of the core materials. The latter has a determining influence on the rise of thermal conductivity with increasing gas pressure, as has been already discussed in the previous sections. For comparing the results of the PS foams presented in this work, temperature and gas pressure influence on the thermal conductivity of commercial cores for VIPs were measured. The curves for all the materials can be seen on Figure 15. Given that, at a certain temperature, the thermal transport contributions of the solid phase and radiation are constant, gas thermal conductivity at each gas pressure can be easily separated. 12 The partial contribution of each thermal energy transfer mode for all the core materials are summarized in Table 3 together with the resulting fitting parameters, accordingly to equation (3). Gas thermal conductivity λg at 10 mbar and 1000 mbar are also given for a better comparison.
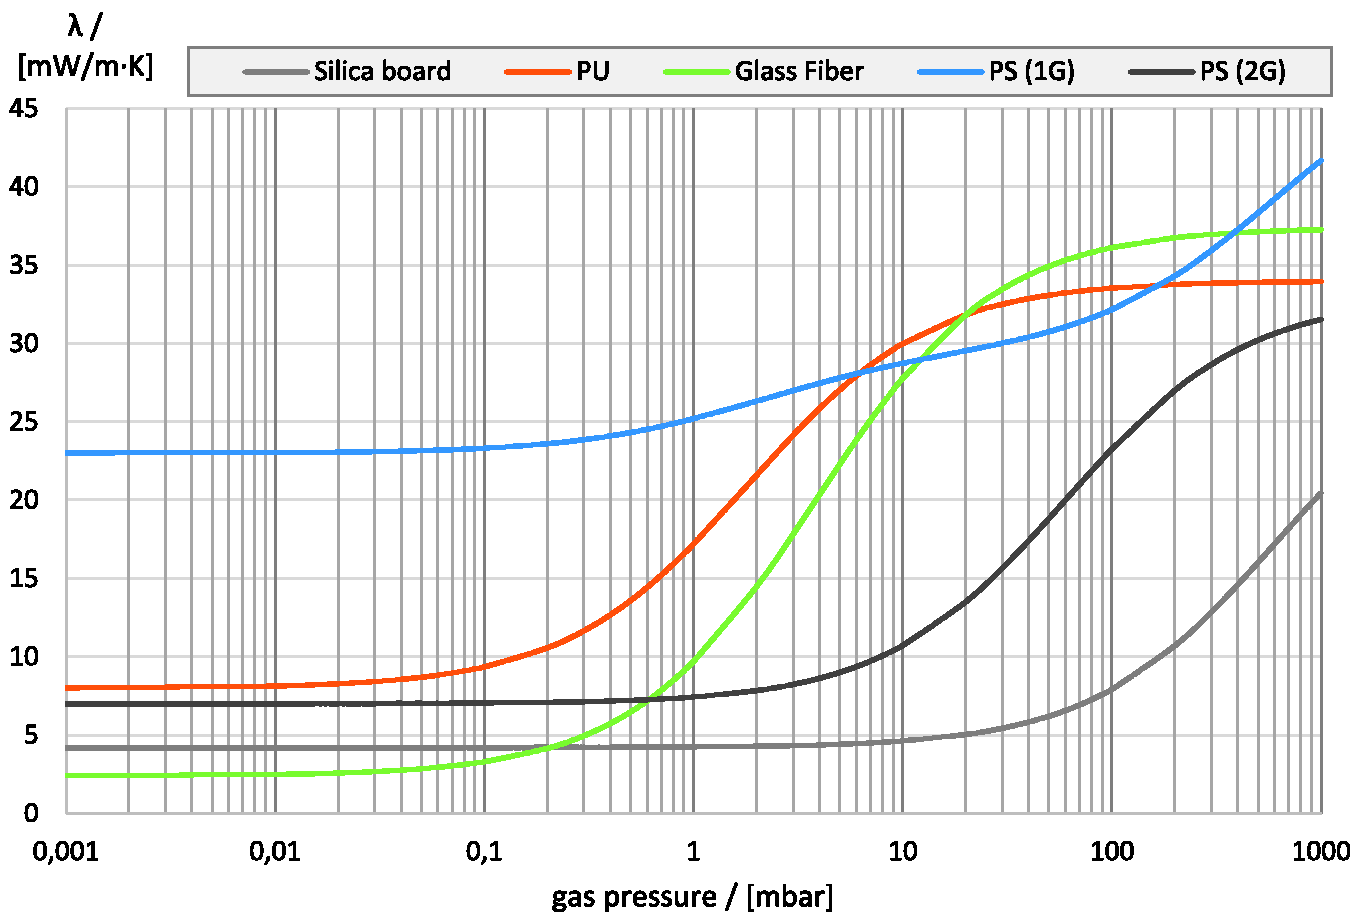
Thermal conductivity as a function of air pressure at 20 °C for different open porous materials.
Density (ρ), partial thermal transport contributions (solid -λs, radiation -λr and gas- λg), typical gas pressures (p1/2) and pore sizes (dp) of several core materials. PS (1 G) and PS (2 G) are the PS foams of the 1st and 2nd generation foam of the Figure 7 and Figure 14, respectively. (An error of the thermal conductivity measurement device is estimate to be about 5%).
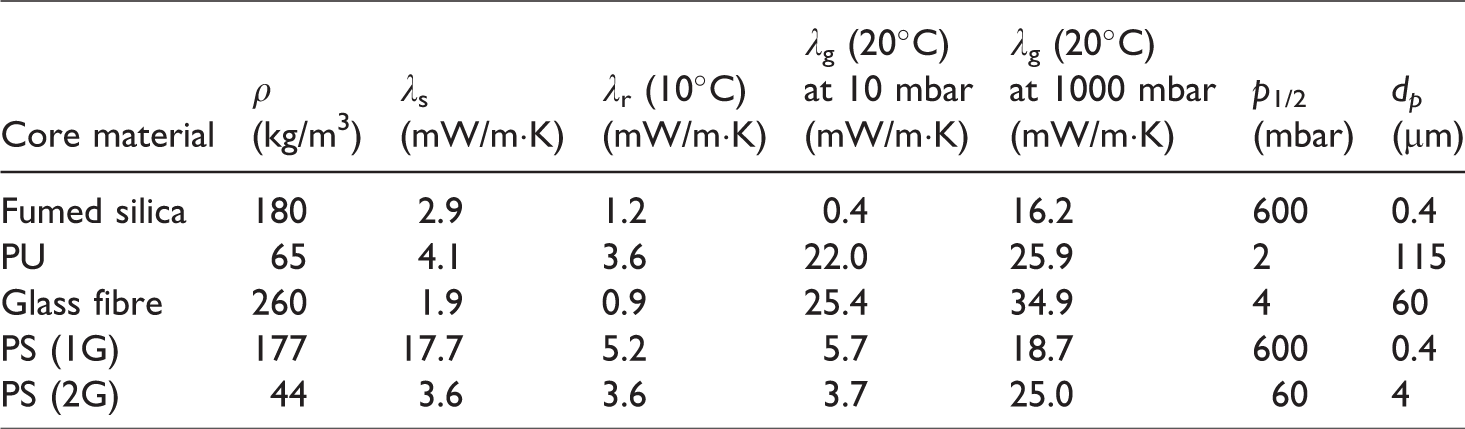
Figure 15 clearly shows that the dependence of thermal conductivity on the gas pressure differs among the several core materials. Although capable of having very low base thermal conductivities (< 3 mW/m·K), glass fibre are very sensitive even to small changes of gas pressure, which correspond to a radical increase of the thermal conductivity and thus considerably shorter service life time. The open-pore polyurethane foam (PU) starts with a relatively high thermal conductivity of about 8 mW/m·K and is even more sensitive to gas pressure increase than glass fibre. By observing the curves of Figure 15, one can see that at 50 mbar the gas thermal conductivity is already fully developed for the PU cores, while for glass fibre it continues to increase to values above the one of free gas at room temperature (≈ 26 mW/m·K), resulting in a gas thermal conductivity at ambient pressure of ∼ 35 mW/m·K (Table 3). This is due to a phenomenon called “coupling effect”, which can be related to the gas in between the intermediate spaces of the fibres creating additional pathways to heat conduction and then decreasing the thermal resistances of the solid-body structure. 13
Fumed silica has the smallest gas pressure dependence on thermal conductivity of all the core materials. It has a total thermal conductivity in vacuum of 4 mW/m·K and can keep its thermal performance to up to 8 mW/m·K to gas pressures as high as 100 mbar. The major difference compared to the other commercial cores lies on its pore sizes. While the pore size of fumed silica is in the nanometric scale, thus in the range of the mean free path of air molecules at atmospheric pressure, 8 PU foam and glass fibre have considerable larger pore diameters (tens to hundreds of µm). Representative SEM micrographs of fumed silica and PU, for instance, are presented in Figure 16(a) and (b), respectively. Fumed silica powder are in the form of agglomerates of few to several micrometers. These agglomerates are, in turn, composed of aggregates of merged primary particles. 30 The inset on Figure 16(a) shows some agglomerates, where the individual primary nanoparticles that have merged together can be roughly identified, revealing its nanometric nature. On the other hand, PU is a three-dimensional “solid foam” with macro pore size structure much larger than the one present in fumed silica. From the micrograph of (Figure 16(b)), it can be seen that the PU foam contains large pores that are interconnected by smaller pores distributed on the walls of the larger ones.
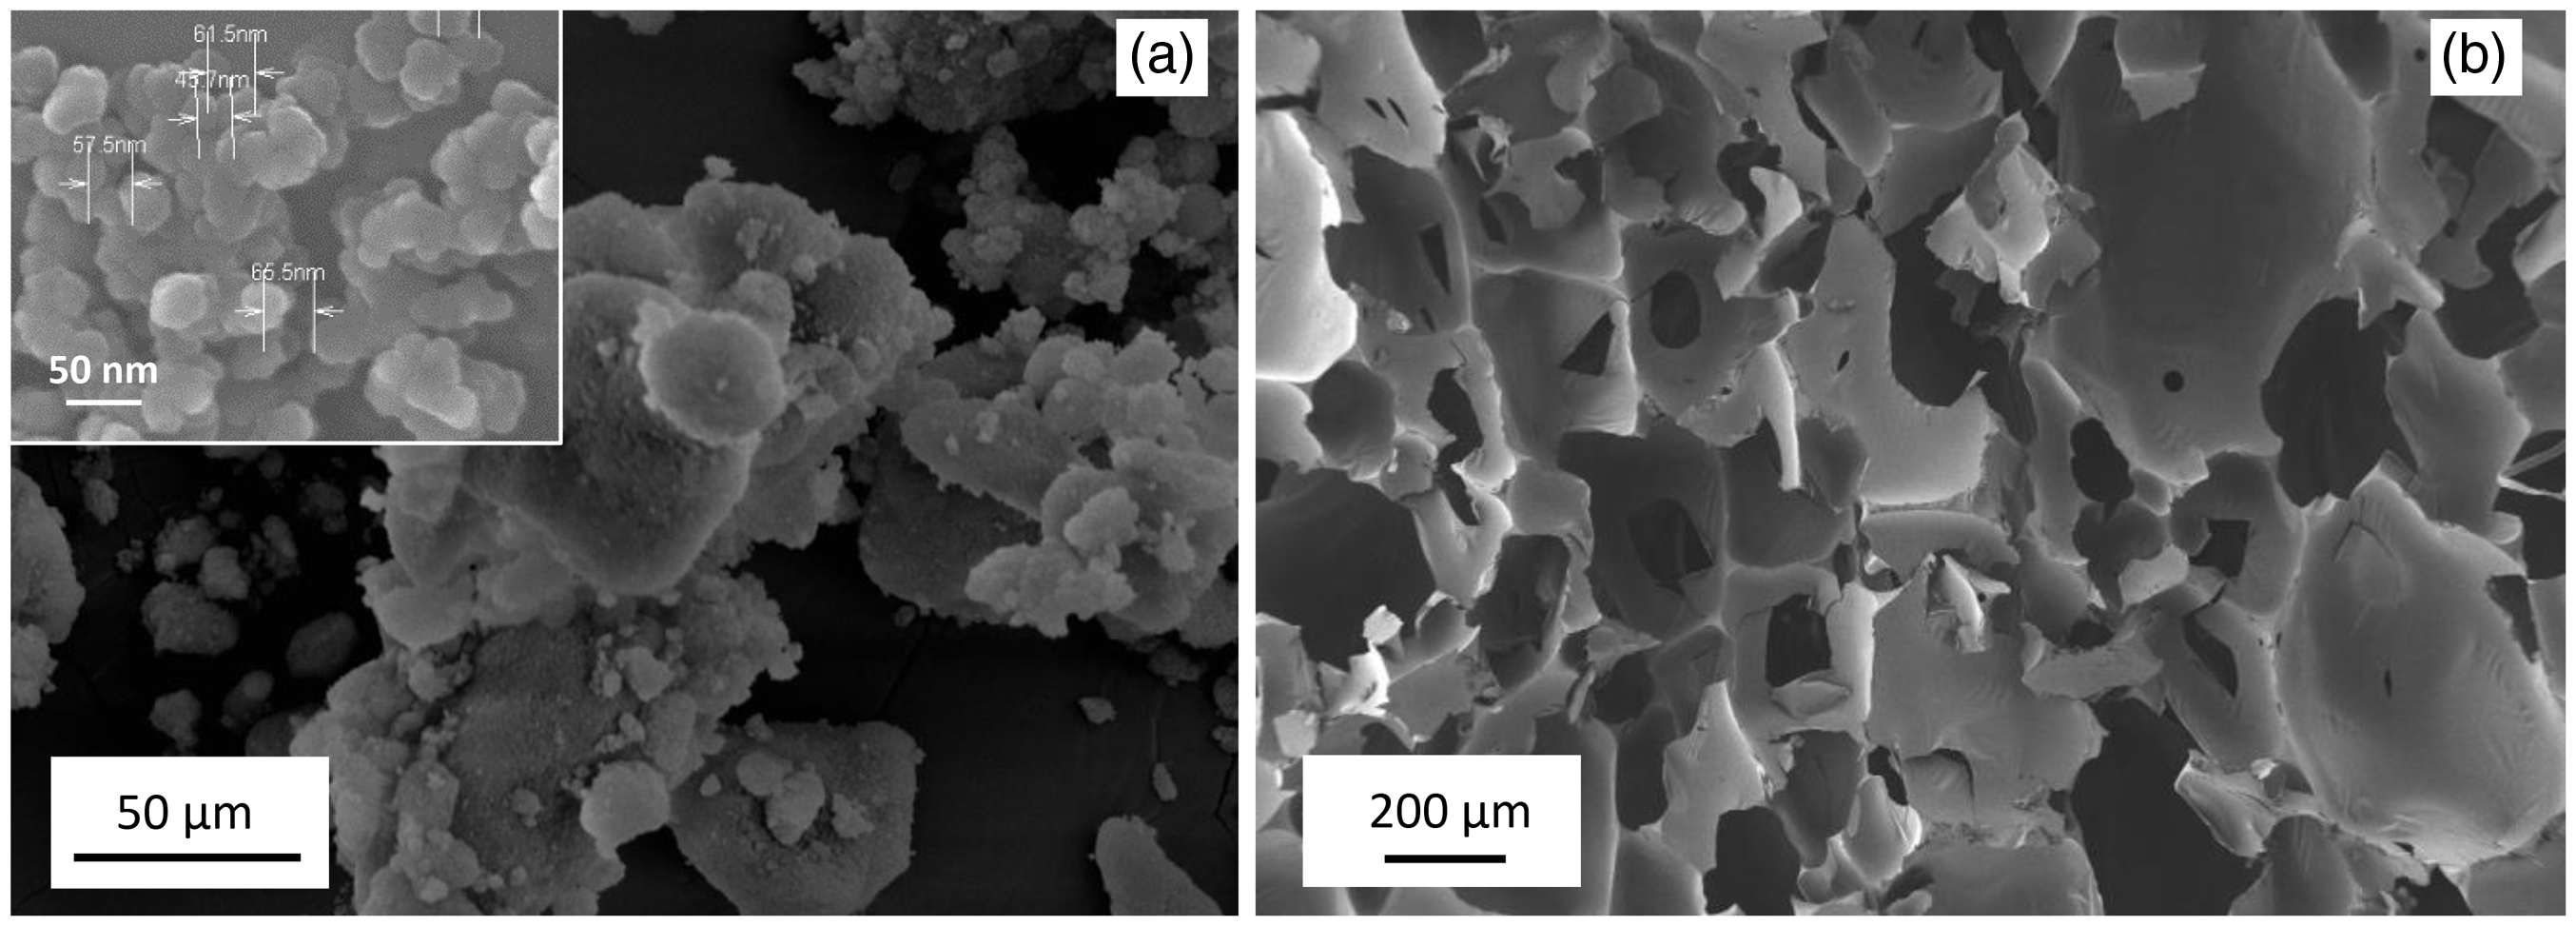
Scanning electron micrographs of (a) fumed silica powder; (b) PU foam.
The curves of the 1st, PS-(1G) and the 2nd, PS-(2G) generation PS foams (from Figure 7 and Figure 14, respectively), were also plotted for comparison. As discussed before, the high radiation and solid thermal contributions of the PS nanofoam of the 1st generation result in a total thermal conductivity in vacuum of more than 20 mW/m·K. Although very high for VIP application, this foamed PS with a density of 177 kg/m3 has already much lower thermal conductivity than that of unfoamed bulk polymer, whose values are in the order of 140–150 m W/m·K and density of unfoamed PS of about 1100 kg/m3. 26 , 31 The macro-defects developed during the welding of the PS granules cause the rise of the thermal conductivity at gas pressures below 10 mbar, but the very small pore sizes, as observed in Figure 7(b), are able to supress the gas conductivity in a similar way as fumed silica. This can be visible by the shape of the curve, where the second inflection point of the “S-shape” curve happens to gas pressures above 1000 bar for both materials.
On the other hand, and as already discussed before, the thermal conductivity in vacuum of the 2nd generation foam (the opacified PS), presents much lower values in vacuum, close to the start values of PU. However, the opacified foams do not present the pores at the sub-micrometer level and gas conductivity starts to raise to gas pressures of about 10 mbar. Although this core cannot be considered as good as fumed silica in keeping low thermal conductivity values along the entire range of gas pressure, it is undoubtedly much superior to its PU and glass fibre counterparts.
Finally, the PS foams of the 1st and 2nd generation, in air and evacuated, are compared to other commercial insulation materials in Figure 17. Conventional thermal insulation materials as mineral wool, can present thermal conductivities between 35 mW/m·K and 50 mW/m·K, while expanded/extruded polystyrene are in a lower range of 30 mW/m·K to 40 mW/m·K. The two generations PS foams have thermal performance in air in between those of mineral wool and large cells EPS/XPS. Closed-pores polyurethane foams filled with pentane or CO2 achieve thermal conductivities as low as 22 mW/m·K. However, aging of PU caused by gas exchange with the surrounding air through the pores walls causes the increase of the thermal conductivity over time. 8 From the “air-filled”, nanostructured materials, fumed silica (not evacuated) has thermal conductivities typically around 20 mW/m·K, while aerogels have measured values as small as 14 mW/m·K. By eliminating the gas thermal conduction, commercial VIPs reaches thermal conductivities between 3 mW/m·K and 9 mW/m·K, depending on the core material, as seen in Figure 15.
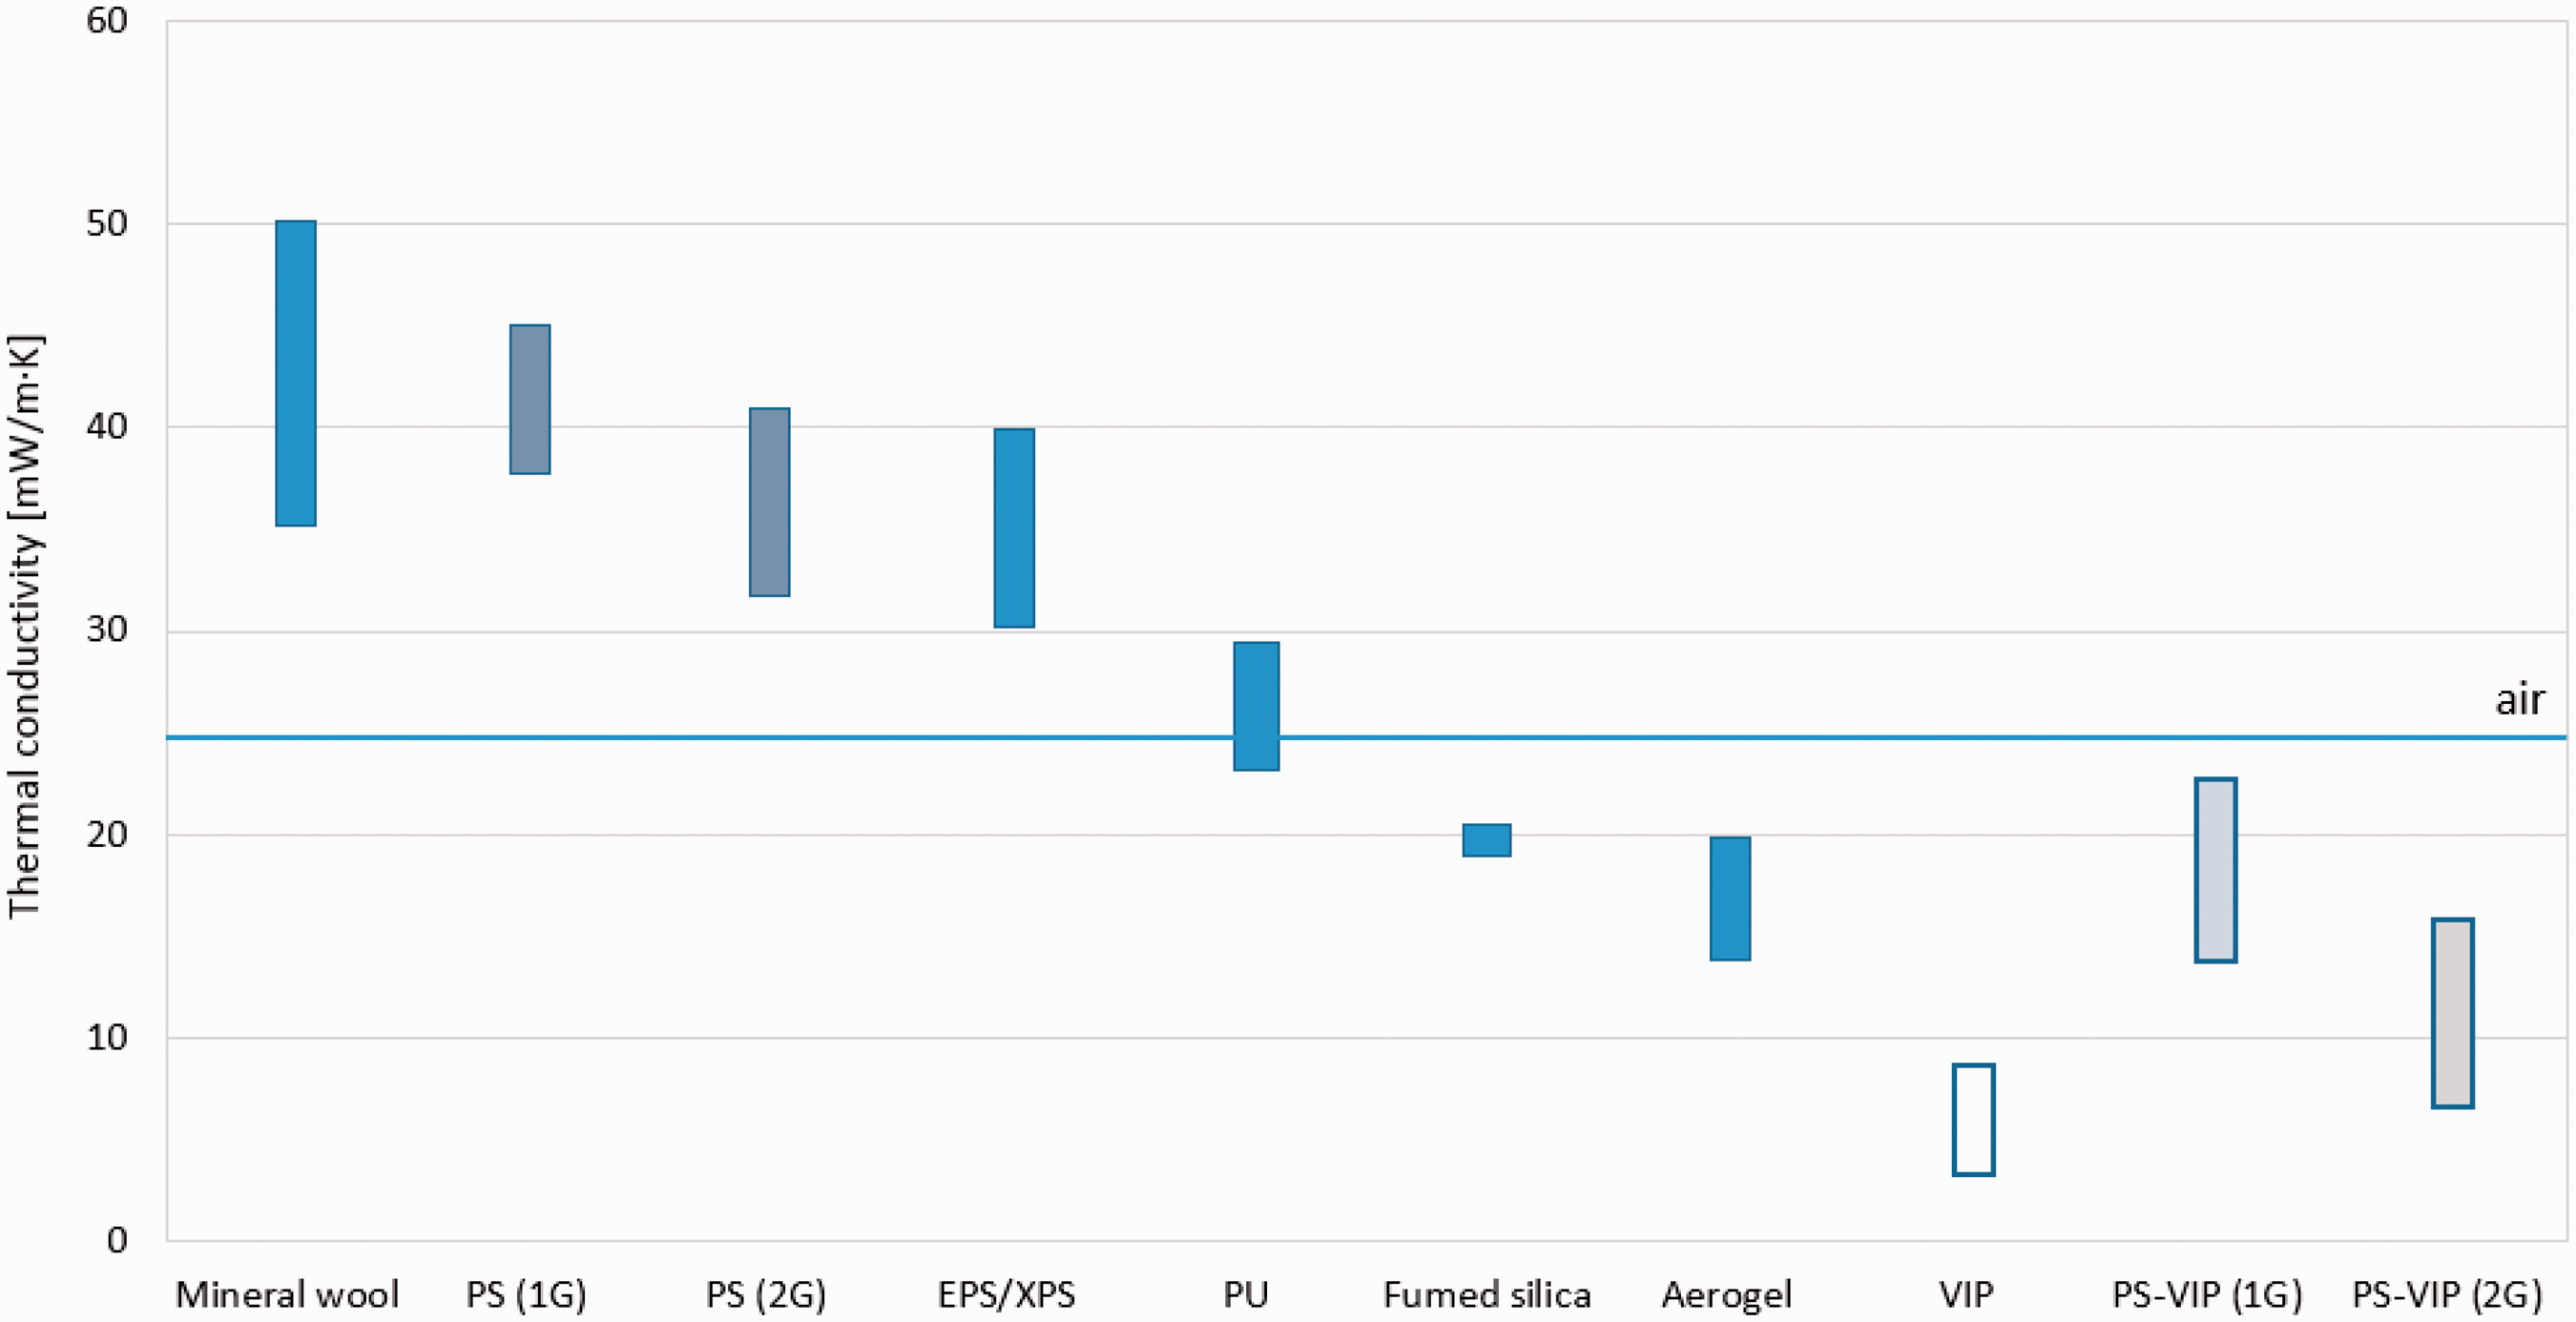
Thermal conductivity range of commercial insulation materials and of the PS foams developed in the 1st, PS (1 G), and the 2nd, PS (2 G) foams.
The range of the thermal conductivity in vacuum of the PS foams developed during the 1st generation and 2nd generation plotted in Figure 17 shows that only some of the opacified foams are able to achieve thermal conductivities comparable to those of macro-porous commercial VIPs. However, long service life-time is aimed and further researcher is being conducted with the goal to reach thermal performance similar to fumed silica by keeping a fine, submicrometric pore structure. Furthermore, other aging effects that can play a role in the service life time of the new PS foams are being evaluated in laboratory.
Conclusions
New polystyrene (PS) foams with submicron pore sizes and open pore structure were characterized as potential cores for vacuum insulation panels (VIPs). Thermal conductivity results for the 1st and 2nd generations of a new PS foam, non-opacified and opacified, respectively, were presented and compared to commercial insulation materials.
The 1st generation of PS foams with densities in the range of 70 to 175 kg/m3 achieved good evacuation ability with fine pore structures (some of them well below 1 µm). The thermal conductivity results in function of mean temperature show that the radiative conduction has a huge influence on the overall thermal conductivity. So, different opacifier materials were added and their quantities optimized, originating the 2nd generation PS foams. The addition of opacifier powders resulted in the enlargement of the pore sizes, typically by a factor of 10. Optimized opacified PS foam with homogenous pore structures of about 4 µm and initial thermal conductivity of about 7 mW/m·K were obtained. The influence of gas pressure on thermal conductivity for this PS foam showed a 50% increase at 10 mbar. In air, the opacified foam reach thermal conductivity levels of commercial EPS/XPS (>31 mW/m·K). Therefore, for commercialization of the new PS foam, still a reduction of thermal conductivity by having pore sizes in the sub-micron level while keeping a low radiation and solid thermal contributions is necessary.
Footnotes
Declaration of conflicting interests
The author(s) declared no potential conflicts of interest with respect to the research, authorship, and/or publication of this article.
Funding
The author(s) disclosed receipt of the following financial support for the research, authorship, and/or publication of this article: This work has received funding from the European Union’s Horizon 2020 research and innovation programme under the grant agreement Nos. 748256 and 768576.