
Abstract
In this paper, we aim to help researchers think, design, and execute their empirical journey by mapping the terrain of choices common in qualitative research. We offer a matrix that relates to various dimensions—the level at which to study the phenomenon (level of analysis), types of field materials, time orientation of research and data, the analytic approach, and the unit of data (unit of analysis). This matrix is intended to support making informed decisions that result in specific research designs and the continuous process of reflection as to how these choices open and limit the ability to answer the research question and offer an analytic generalization based on the findings.
Keywords
Introduction
Doing empirical research is all about making choices—what research questions to ask, what kinds of field material to collect, how to analyze them, how to position the project within a paradigmatic stand and a theoretical conversation. And on it goes, as each of these big choices is actualized through numerous smaller ones. This is more so in qualitative research that adopts a constructionist epistemology and political pluralism (Amis & Silk, 2008; Denzin & Lincoln, 1994). On a methodological level, such research has to consider that the researchers always enter an already meaningful world and have to immerse into this meaning while being reflective of their own meaning-making and potential interferences in the field. Qualitative research—either inductive, bottom-up, or abductive, coming to novel insights through “mental leaps” (Reichertz, 2004)—requires sensitivity and flexibility to allow the empirical phenomenon and its many contexts direct the project. No matter how much thought was put into designing a research strategy before entering the field, qualitative researchers have to adapt decisions on the fly and off-script once in the field.
The challenge is even more daunting as there are no “right” choices, and each methodological option opens a space of possibilities and limits others. Thus, quality and rigor in qualitative research are not about making specific decisions but about how one makes choices, reasons, and justifies them (Grodal et al., 2021; Harley & Cornelissen, 2022; Pratt et al., 2022; Schwandt, 2000). It is about using reflexivity to identify choices to be made, map the possibilities, assess their implications, make a choice that will fit well with past choices and the goal of the project (e.g., future choices), and eventually take responsibility over these choices, and account for their consequences.
In this paper, we aim to help researchers in this journey by mapping the terrain of choices common in qualitative research. Based on our own experience as qualitative researchers, teaching qualitative methods courses, and our roles as editors of qualitative papers (Renate as Editor in Chief of Organization Studies, Tammar as Associate Editor at Academy of Management Journal), we know how confusing these choices may be. We know how easily we retreat to readymade options and templates that seem common and legitimate without examining their fit to our specific project. We know how easy it is to get distracted and consider each choice in isolation, losing sight of their interdependencies and consequences. Thus, we offer a matrix that relates to various dimensions—the level at which to study the phenomenon (level of analysis), types of field materials (data sources), time orientation of research project and data, the analytic approach, and the unit of data (unit of analysis). Each of these dimensions offers an array of possibilities that fit more or less with each other. We are aware that there are more dimensions than these but believe that working with them provides a solid ground from which to dive deeper.
The level of phenomenon spans from the individual, through group, organization, and field, to society or world polity. Data may be comprised of interviews, observations, or archival texts (including images, artifacts, and other types of non-verbal texts). The field materials may be natural (existing without the research) or artificial (provoked through the study), and match the time orientation of the research project (time-authentic) or not. The analytic approach may be categorical, comparative, or processual. Finally, the unit of data may be any recurring happening that serves as focus for the analysis, like paragraphs, reports, meetings, events, or an entire interview or organization. Juxtaposing the level of the phenomenon with the data source creates a matrix that can enhance our thinking about the position of our study and reflect on it through the time orientation, analytic approach, and unit of data, each adding a layer of richness and complexity to our thinking. We offer this matrix as a guiding tool to help researchers visualize the position of their research project within the terrain of possibilities in qualitative research and assess the degree of fit between the research question and their choices of the case(s), data, and analysis.
Given current debates and critiques of templates in qualitative research (see, for example, a recent special feature topic at Organizational Research Methods, Kohler et al., 2022), let us state our position at the outset. The matrix we offer is intended to help researchers think, design, and execute their research. It offers no clear-cut recipes as to what to choose, as much as it highlights the choices that need to be made and the various options and considerations. It is intended to support making informed decisions that result in specific research designs and the continuous process of reflection as to how these choices open and limit the ability to answer the research question and offer an analytic generalization (Schwandt, 2015; Tsoukas, 2009) based on the findings. We focus on the early stages of the research process when the researcher develops the general contours of the project and the focus of attention.
Making Informed Decisions: Mapping the Terrain
To make informed decisions about one's study, we suggest that one needs to situate it within a matrix that relates to five dimensions: Level of the phenomenon, data sources, time orientation, analytic approach, and unit of data. We will present each of these dimensions separately, mapping it through classifications, and then move to examine the fit between them.
Level of Phenomenon
The level at which a phenomenon is studied (usually referred to as the level of analysis or level of phenomenon) is a familiar notion. It is also tricky, as it may convey stability or independence of different levels, whereas they are changing and interdependent (Dansereau et al., 1999; Scott, 2014). Still, for its usefulness, we will distinguish among five different levels related to the scope of the studied phenomena (Scott, 2014). A study may focus on individual-level phenomena, like individual motivation, preferences, or emotions. It may focus on group-level phenomena (including dyads), like groupthink or self-managing teams. The focus may be on the organization as a whole, looking at organizational culture or organizational identity. Some theories or phenomena direct us to look at the inter-organizational space, called field, inter-organizational network, industry, or ecosystem. In other cases, we take an even broader approach and look at the societal level or world polity. Some phenomena can be studied on different levels. The workings of institutions, for instance, can be studied on all levels, from the individual level (such as emotions) or dyads (e.g., doctor–patient relationships), organizations (e.g., adoption of rationalized myths), fields (e.g., the emergence or change of a network of organizations that partake in a conversation that matters to them), society or the world polity (e.g., societal or global meanings that cross boundaries and are translated in local contexts).
Levels of the phenomenon are relative, and each level is interlinked with the others. Moreover, one may bridge different levels in one study by conducting multilevel research (e.g., Haack et al., 2020). For simplicity, though, we will relate here to studies that focus on one seemingly distinct level of the studied phenomenon.
Data Source
Generally, there are three primary sources of field materials in qualitative research: archival data, observations, interviews. Although becoming data implies being touched by the researcher, there are varying degrees of researcher involvement in producing data: Naturally occurring data exists without the research, whereas non-naturally occurring data has been contrived through the researcher and would not exist without the research project (Potter & Wetherell, 1987; Silverman, 2019).
Archival data is the study of texts. “Text” is defined broadly, including written (books, legal documents, meeting minutes), visual (images such as photos, diagrams, or cartoons, and moving images such as TV programs or movies), and material (artifacts such as furniture, buildings, objects, or prototypes). The researcher may collect the texts to create the archive or use an existing one. Archival data may seem unproblematic and easy to gather, yet it may involve much effort to access and ensure it is sufficiently complete (Stanley, 2017). In most instances, archival data are natural data, meaning that the texts were produced without any connection to the investigation, and the researcher was not involved in creating them. But research may also elicit texts, for instance, by asking field actors for written statements (such as open questions in surveys) or images (Meyer et al., 2013). Observations may be another source of field material. In observations (Bernstein, 2017; Locke, 2011), what is observed is an activity that would have been going on with no connection to the study. However, it would not have turned into data that could be analyzed later without the researcher observing and documenting this activity. There are different kinds of observations (overt or covert, Roulet et al., 2017; participatory or non-participatory, Tedlock, 1991) involving various aspects and degrees of immersion (Dumont, 2022). The degree to which the researcher's presence has influenced the observed activities is difficult to assess but nonetheless has to be considered when analyzing the data. Observations have to be documented in writing (field journal), audio or video recording (or a mix thereof, see, e.g., Jarrett & Liu, 2018; Thompson & Byrne, 2022), and they eventually become a text to be analyzed. Finally, interviews conducted for the research project are the most proactive source of field material. The interview would not have existed had the researchers not created the interview situation, selected interviewees, and posed questions. Interviews are social encounters in their own right which means that the questions and utterances of the interviewers are part of the data and the social situation of the interview needs to be taken into account when the data is analyzed (Potter & Wetherell, 1987). There are, of course, different kinds of interviews (e.g., open, semi-structured, and structured; life story interviews; narrative interviews) grounded within different paradigmatic approaches (Alvesson, 2003; Froschauer & Lueger, 2020; Langley & Meziani, 2020). It is common to record and transcribe (verbatim or non-verbatim) interviews and, hence, turn them into texts.
No one data source is principally superior to another—it depends on the research question, the availability and quality of the data itself, and the method of analysis. For all non-natural data, one needs to consider to what degree the researcher has impacted the data and what the implications are. Therefore, some traditions of interpretative research (e.g., hermeneutics) give, when available, preference to natural data.
The quality of qualitative research is not dependent on the amount of data collected or analyzed. While there is no ‘natural’ end to data collection (Potter & Wetherell, 1987), the collection of data in qualitative research, in general, follows the principle of saturation. This means that data collection ends when additional data only confirm what we already know, but does not add any new insights (Glaser & Strauss, 1967). Regretfully, in our discipline, many conflate the quality of data with its quantity. Falling into the fallacy of big numbers, even within qualitative research, we see trends towards large data sets, with dozens of interviews, hundreds of hours of observations, and archival texts by the thousands. It is nearly impossible to handle such an extensive dataset with sufficient qualitative sensitivity. Thus, often time, we see authors who either use the data selectively and focus only on parts thereof without transparent choices concerning the units of data that are relevant for their research endeavor or—trying to capture its totality—float above the data, offering a birds’ eye overview or descriptive summary rather than in-depth analysis (Howard-Grenville et al., 2021). Our discussion here reflects our preference for the quality of data and the ability to approach it in-depth over the quantity of data.
The distinction between these three types of data sources is not always as clear-cut as it may seem. Interviews may be an opportunity for observation that may include the interactions before and after the formal interview, or take note of the place and mise-en-scene of the interview, and many observations involve informal interviews. The distinction between archival and observational field material is blurry when it comes to, for example, powerpoint presentations during an observed meeting or field diaries. It has been lately complicated by data based on social media. Should we treat Facebook posts as archival data or observations? It depends on the time frame and whether or not one collects the data in one step or follows a FB group as it develops. Moreover, one may use more than one data source in each study and triangulate various data sources (Hammersley & Atkinson, 2019). Finally, the relevant distinctions in the social sciences lie on the ontological and epistemological level, and not on the level of methods and procedures (Hitzler & Eberle, 2004). Therefore, interpretative research may also cross boundaries and use qualitative and quantitative data collection techniques and mixed methods of analysis (Jick, 1979; Hannigan et al., 2019; Meyer & Höllerer, 2010; Mohr & Neely, 2009; Molina-Azorin et al., 2017). For simplicity, though, we will assume hereafter the use of one primary qualitative data source.
Time Orientation
Qualitative research aims at understanding meaning. However, meaning is not stable or fixed but changes over time and is in permanent flux (Schütz, 1962). The meaning people give to occurrences they anticipate is different from their lived experience when they actually occur, and again different from the meaning they give them when they look back in time and recapitulate past events. Here, we reflect on the temporalities inherent in the data, on the time orientation of the research project, and, finally, on the fit between them.
All data, whether natural or artificial, is produced at a certain point in time, and the meaning it contains is tied to this time of production. In addition, data reports on things that, at the time of data production, lie in the present, the past, or in the future. Interview data capture meanings at the time the interview was conducted. Still, the interviewee may talk about events in the past or future or try to recollect what events meant for them ‘then.’ Observations collect data in real-time, in vivo, even when they observe the planning of future happenings. All archival materials bear the imprint of the time they were produced, even if they give futuristic visions or are themselves historical analysis. Qualitative research accounts for this time orientation inherent in the data by being mindful of the prospective and retrospective sensemaking (Brown et al., 2015; Huber & Power, 1985; Sandberg & Tsoukas, 2015; Weick, 1995) of the participants in the study. Finally, most data sources (exceptions are often images or objects) have an inherent temporal flow (the sequence of activities in observations or the sequence of what is said in interviews or written in verbal texts) that may be relevant for the analysis. Sequential analysis, an analytic technique in hermeneutic analysis (Lueger et al., 2005), for example, strictly follows this temporal flow when analyzing the material.
The research project also has a specific time orientation. It can focus on the meanings assigned to the phenomenon by different types of actors in the present, or focus on the variety of views that existed in the past or are projected into the future. Process studies or longitudinal analysis, per definition, cover a specific period of time and are interested in dynamics and how meaning changes.
Ideally, the temporality of the data matches the time orientation of the project and is, in this sense, time-authentic. Time-authentic data has the advantage of being less subject to retro- and prospective sensemaking (Barley & Tolbert, 1997). For instance, researchers may want to reconstruct futuristic visions that existed in the 1960ies by studying Star Track episodes from that time or show the different frames that have been used in the antivaxx movement in 2021 by studying social media posts from this year. For research that examines processes or more extended periods, using time-authentic data implies collecting data that have been produced over the entire period covered.
Analytic Approach
Here we take a “Big ‘A’” approach to analysis. 1 Rather than discussing specific techniques of analysis (“small ‘a’” analysis), we relate to a broad approach to handling the data, which goes hand in hand with specific research designs (how to study the phenomenon, what data to collect, etc.). Most generally, there are three “big tent” approaches to handling data within qualitative research in our discipline—categorical, comparative, and process analysis.
A categorical analysis is focused on meanings, practices, or mechanisms and is based on a “parts and whole” understanding, according to which we can partition the whole into thematic parts. We can understand the whole picture through the move between first and second-order thematic units (Lieblich, 1998). The Gioia method (Gioia et al., 2013) may be the most known in our discipline but is not the only one. Some varieties of discourse analysis (Titscher et al., 2000), qualitative content analysis (Mayring, 2000) or hermeneutic analysis (Lueger et al., 2005) that focus on meanings (rather than their dynamics) are principally similar in their logic. This analytic approach is usually based on the collection of interviews or archival material that covers a specific organizational drama grounded within a particular time and place.
Comparative analysis is based on the use of multiple cases, similar on some dimensions and different from each other on aspects that can then be compared to understand the impact of these differences on specific outcomes. Eisenhardt multiple case studies approach represent this cross-sectional or variance approach (Eisenhardt, 1989, 2021; Eisenhardt & Graebner, 2007). Yet, the same logic may apply when we collect data within one organization (single case study) yet across multiple divisions, branches, events, team meetings, or decision-making instances (e.g., McPherson & Sauder, 2013). Theoretical sampling (Glaser & Strauss, 1967) distinguishes between four strategies for sampling comparative cases: maximizing or minimizing differences between cases and/or between concepts. The choice has implications for the kind and scope of the theory that can be generated. One way or the other, we need to ensure the comparability of the various case studies—analytically, in terms of the data collected, the time frame covered, and how deep analysis it allows.
Process studies (Langley, 1999; Langley et al., 2013) focus on the temporal dynamics of meanings and actions. Rather than taking a categorization or comparative approach, they focus on dissecting a long process into its phases and understanding the mechanisms that account for moving from one state of affairs to another, either in a linear, parallel, recursive or conjunctive style (Cloutier & Langley, 2020). Langley’s (1999) process method is a good representation of this approach. Recent studies under the newish “historical studies” banner that delve more deeply into the past are another example (Decker et al., 2021; Godfrey et al., 2016; Vaara & Lamberg, 2016; Wadhwani et al., 2018).
No one of these approaches is better than the others, and the distinction between the three approaches is analytic like all other distinctions in this paper. In practice, they may be integrated. For example, one may use multiple cases, comparing processes of change or mechanisms within and between them; one may study how differences in meanings or mechanisms change across different periods (e.g., by using dynamic topic modeling techniques). Again, we will simplify by assuming these approaches are employed in distinct research projects.
Unit of Data
Beyond deciding about the level of the phenomenon (level of analysis), and once one encounters the kind of field material, one may reflect on the unit of data (unit of analysis). These terms are closely related yet not synonyms. The unit of data is the elementary chunk of the text, interview, or observation that serves as the basis for the analysis, e.g., development of codes, themes, or comparisons. Depending on the research question, the appropriate unit of data can be comprised of a small (such as a sentence, a paragraph, an argument, an interaction, etc.) or a large (such as the entire interview, meeting, website/document) amount of data. The study may use individual interviews as the data source yet focus on stories about the organization told within interviews. The unit of data is not the interview but the story (Zilber, 2009). The study may involve collecting various field materials on the organizational level and then focusing on specific recurring events such as procedures (Barley, 1990a) as units of data to be analyzed. Another study may be based on organizational websites as the data source, but instead of using the text as a whole, the authors used “semantic triplets” of organization–verb–recipient text passages (“With this campaign, we react to complaints by local residents”; “Today, we involve citizens early on into the planning process”) as the unit of data that allowed them to identify the multiple role identities enacted by the organization and, eventually, how institutional logics are instantiated on the organizational level (Jancsary et al., 2017).
One can not analyze the data without deciding the unit of data on which to focus (though sometimes this decision is done in practice, intuitively and not necessarily reflected upon). But in reality, the space of possibilities for deciding the unit of data is determined during data collection. As we encounter the data, we may identify potential units of data that seem interesting and productive to follow and then collect them systematically while in the field. We may later change focus or find that this data unit is more or less relevant or fruitful to where the study emerged. All the more a reason to identify possible data units early on, and ensure their systematic collection. As Spradely (1980) recommends, one needs to have a clear understanding of the various elements of the social world one studies (Spradley distinguished between nine such elements: space, object, act, activity, event, time, actor, goal, and feeling) yet still strive to collect materials holistically. In the same vein, one better gather as much data and as varied as possible (Barley, 1990b) while also giving attention to viable units of data that may later be used as the basis of rigorous analysis.
Using the Matrix to Contemplate Fit
Fit is essential for qualitative research (e.g., Bansal et al., 2018; Gehman et al., 2018; Howard-Grenville et al., 2021). There is no perfect method, as each is flawed and partial in its unique way. Instead, we need to ensure a process of informed decision-making, through which we assess the various options, their pros and cons, and their implications for our overall project. We need to ensure the fit between philosophy of science (ontology, epistemology, methodology), theory, and method, and more concretely—between our research question, the level of the phenomenon, data to be collected, its time orientation, the overall analytic approach, and unit of data. In this process, we may build on traditions in qualitative organizational research. Still, we cannot do that automatically, as we need to check the fit and adapt to the specific circumstances of our concrete study. What our matrix adds, we hope, is a concrete tool that maps the central aspects that need to be fitted together within a research project.
The matrix, presented in Figure 1, allows researchers to position their research and check that their choices fit together coherently and justifiably. Of course, qualitative research is a non-linear process, and the matrix can be used at any stage of the research process. Further, the matrix can be “read” from different angles, starting from each dimension it covers and creating any sequence of fitness-checks. In the very early stage of designing a new research project, the first step would be to identify the level of the phenomenon and analytic approach and then move to other dimensions. In later stages of the research project, one may start with the givens and preferences and adapt the not-yet-decided aspects to ensure fit. For example, if one is to use interview texts already collected, or if the researcher has a clear preference for conducting interviews, one can start from these as given and make sure all other dimensions are adapted accordingly. Below, we exemplify one possible use that seemed most productive in presenting the tool.
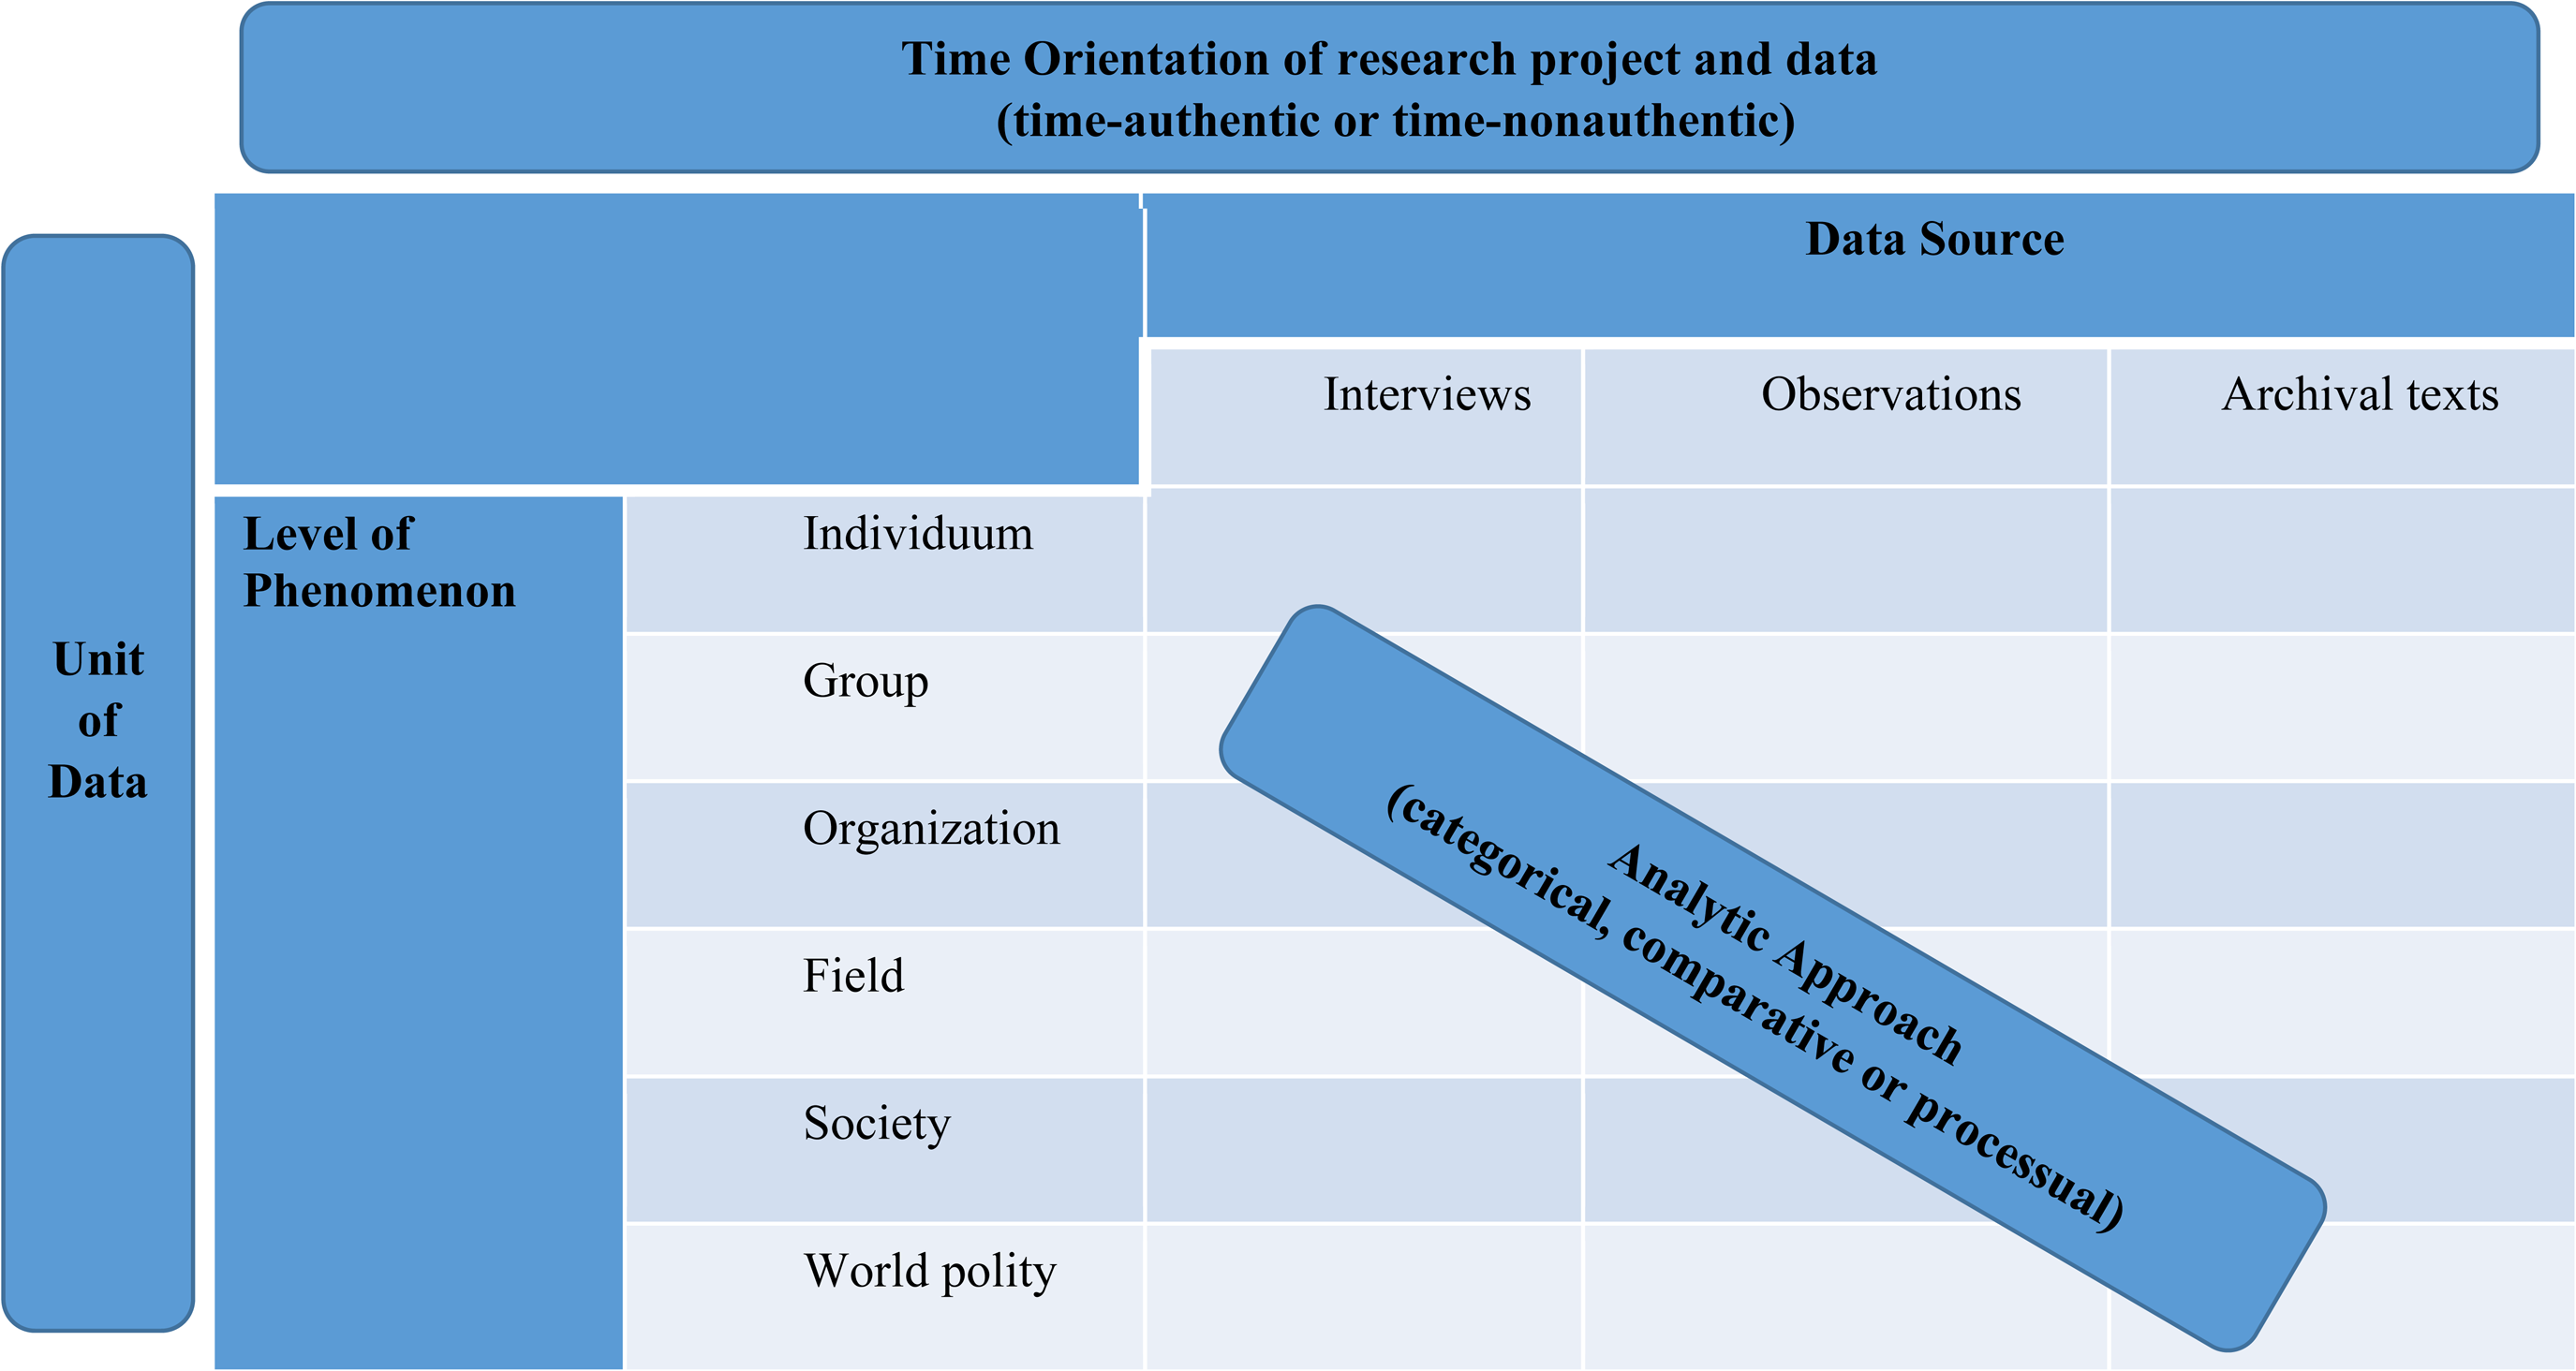
Mapping the terrain of choices in qualitative research.
The inner part of the matrix juxtaposes levels of the phenomenon under study with the potential sources of data collection. The innermost space also relates to the analytic approach, and the outer skirts are about time orientation and unit of data. Thus, a first step may be to identify the position of one's project and research question within the grid in terms of the level of the phenomenon and the accessibility of sources of field material. Note that there are no one-on-one relations between these two dimensions. For example, interviewing individuals does not necessarily mean that the study focuses on individual-level phenomena. Suppose we ask people about their life stories, experiences, and emotions to identify trajectories in constructing personal identity (e.g., Lieblich, 1998). In that case, the individual-level interviews match the level of the phenomenon. Yet, if we use interviews to ask organizational members about the organization's strategy work and its effects, we may use individual interviews for an organizational-level inquiry (Kornberger et al., 2021).
On the other hand, if one focuses on the societal (e.g., nation state) or world polity level, one may wonder whether interviews are a good data source for a qualitative inquiry. The fit between the level of the phenomenon and data source is not trivial—both in terms of quantity (how many interviews will allow capturing society-level understandings and sentiments?) and the possibility of representation (though usually not necessary for analytic, rather than statistical, generalization, see Small, 2009; on a debate over the use of interviews for the study of macro-level phenomena like culture, see Lamont & Swidler, 2014). Observations of official state ceremonies or archival data (official and counter official news media, for example) may be more easily justified sources of data. In historical studies, the research depends on the very ability to find or create the archive—as the researcher depends on existing data. Thus, adaptations usually involve fitting the research question, level of the phenomenon, and analytic approach to the available archive (rather than the other way around).
At this stage, we also recommend thinking about one's analytic approach and whether it fits the level of the phenomenon and available data sources. For example, suppose the researcher strives to compare two organizations, teams, or fields. In that case, she needs to make sure she chooses the two units wisely, for their similarities and differences, and can collect the same kinds of data, covering the relevant period of time, in both (see, for example, Kellogg, 2009; Kellogg, 2014. See also Kellogg, 2011 for an innovative design in which she compares in vivo data collected in the 2000s to two previous studies from the 1970s and 1990s).
It is also worth thinking about the fit of time orientation of the data with the analytic approach and the overall goal (level of phenomenon and research questions). For example, longitudinal data is required if one is interested in an organizational or field-level phenomenon and wants to follow a process unfolding. Interviews are always in vivo data, and if they relate to the past, they involve, as we have outlined above, problems and limitations connected to retrospective bias. However, it is not always possible to conduct interviews with the same people at different times. Most importantly, the time span that can be covered is limited. To cover more extended periods, archival data (e.g., on the field and societal levels, see Zilber, 2006) may be better, as it is time-authentic and grants access to interpretations at the time. A mix of in vivo observations, retrospective interviews, and time-authentic archival data (e.g., Zilber, 2002) may also be used, as these data sources complement each other—especially if one is interested in how people construct the past (rather than how they constructed the present then).
Once in the field and encountering the data, one may start thinking about the units of data to be later used for the analysis. Though the focus of the study may still change, thinking about the unit of data early on may help researchers make sure they have collected enough relevant data. For example, in their study of the Occupy movement in London, a social movement (inter-organizational level of phenomenon), Reinecke and Ansari (2021) focused on specific instances of interactions as their unit of data, which allowed them to delve deep into each instance and compare patterns across them. Zilber (2007), who was also interested in the field-level, studied field-level events and later focused on stories in the data. While she only studied one field, and a limited number of events, she identified many stories and delved deeply into them and their impact on the dynamics of the events (see also Gross & Zilber, 2020). Meyer and Höllerer (2010) were interested in the dynamics of field-level issue frames. They used a decade of media reports as a time-authentic data source and focused on speaker statements as the unit of data to identify types of actors, their accounts, storylines and eventually frames, and their dynamics over the period observed.
Concluding Remarks
The tool we offer is grounded in classifications of various dimensions of qualitative research and fine distinctions in each of these dimensions. Such classifications are necessarily simplistic and reductionist and do not reflect the genres and subgenres of qualitative research (Bansal et al., 2018) or innovative methods in various subdisciplines of qualitative research, from ethnography (Seligmann & Estes, 2020) to computational methods of analyses that aim to measure culture and meaning (Mohr et al., 2020). Also, they may seem at odds with our understanding of qualitative research as non-linear and flexible. Positivistic studies adhere to linear development, which ensures the ethical basis of the statistical techniques used. Qualitative studies are better conceived as spiral endeavors. Researchers may go back and forth between the literature, data, and emerging insights and even adapt the research question or their focus as they allow the data to direct them according to the tradition of discovery (Locke, 2011).
Still, we hold that laying open one's core assumptions and thinking ahead and planning is essential. The same goes for periodic check-ups of the ongoing fit between moving parts. Even if the plans may change, it is necessary to depict the possibilities and choices and reflect on how they open up yet limit future options. We hope that the crude analytic distinctions and mapping we are offering will help think about methodological nuances and allow for methodological creativity, all in the service of better interpretation (or construction) of the world around us.
Footnotes
Acknowledgments
Tammar Zilber thanks the Recanati Center at the Hebrew University for its continuous support.
Declaration of Conflicting Interests
The author(s) declared no potential conflicts of interest with respect to the research, authorship, and/or publication of this article.
Funding
The author(s) received no financial support for the research, authorship, and/or publication of this article.