
Abstract
This study examines how political pressure, as proxied by the election cycle, influences the alignment between textual sentiment and financial performance in municipal annual reports. Based on nearly 4000 reports prepared by Swedish municipalities (2010–2023), we apply sentiment analysis and fixed effects regression models. We find that textual sentiment is generally associated with financial performance. However, we also document a clear election cycle effect: reports for pre-election years − issued during election years, when political pressure is presumably at its peak − exhibit more positive sentiment regardless of financial performance. This effect is partly driven by municipalities with relatively poor performance, suggesting that textual disclosures are used to downplay negative outcomes when political stakes are high. By documenting how the reliability of textual information shifts under political pressure, our study contributes to research on government financial transparency and highlights the need for stakeholder caution when interpreting textual information during election periods.
Points for practitioners
Our findings indicate that the reliability of textual disclosures fluctuates with political pressure, decreasing when political pressure is high but increasing when it is low. Therefore, stakeholders should be particularly cautious when interpreting textual disclosures during election periods, while recognizing their greater reliability in less politically charged times.
Introduction
Governmental annual reports contain two types of information: numerical disclosures and textual disclosures. Numerical disclosures refer to quantitative information, particularly in the financial statements and accompanying notes and tables. Textual disclosures, by contrast, refer to qualitative information in the form of descriptions, analyses and assessments of both the financial condition and the underlying operations. This qualitative information provides context and interpretation, and can thus offer insights that the numbers alone may not convey. However, the flexibility of textual disclosures also makes them susceptible to political influence. Rather than enhancing transparency, they can be used to spin a narrative that favours incumbent politicians, potentially misleading stakeholders and undermining accountability.
Given the potential for political influence over textual disclosures, it is of interest to understand how they align with numerical disclosures. In response to this, recent studies have begun examining the relationship between these two types of disclosures in state and local government annual reports (Kim, 2022; Rich et al., 2018). This research is part of a broader body of literature that uses computational text analysis methods to investigate how governments (Anastasopoulos et al., 2020; Quinn and Bertz 2025; Roundy et al., 2023; Yusuf and Jordan, 2017) and intergovernmental organizations (Patz et al., 2022; Thorvaldsdottir and Patz, 2021) convey textual information in budgets, annual reports and popular financial reports, as well as how stakeholders respond to the textual content in such financial documents (Greer et al., 2023; Rich et al., 2021). Beyond their methodological similarities, these studies share a common focus on textual disclosures as a component of government transparency.
Government transparency has been widely studied in public administration and related disciplines (Cuadrado-Ballesteros et al., 2023; Cucciniello et al., 2017; Matheus and Janssen, 2020), with one major research stream focusing on financial transparency (Cucciniello et al., 2017). While numerous studies have examined variations in the type and extent of financial information disclosed by governments (e.g., Bastida and Benito, 2007; Caba Perez and López-Hernández, 2009; Citro et al., 2021; Columbano and Trombetta, 2022; Garcia and García-García, 2010; Guillamón et al., 2011; Rodríguez Bolívar et al., 2006, 2013), comparatively little attention has been paid to the textual properties of such information. There is limited knowledge about how political pressure influences the reliability of textual disclosures.
To provide empirical evidence in this area, we analyse the relationship between textual and numerical disclosures in the annual reports of Swedish municipalities and how this relationship varies across the election cycle, which we treat as a proxy for political pressure. Using nearly 4000 municipal annual reports for the fiscal years 2010–2023, we examine the association between textual sentiment (or tone) and financial performance with fixed effects regression models. Consistent with expectations, we find a positive association between textual sentiment and financial performance. However, we also document a clear election cycle effect: reports for pre-election years − issued during election years, when political pressure is presumably at its peak − exhibit more positive sentiment regardless of financial performance. This effect is partly driven by municipalities with relatively poor performance, where disclosures are positive despite weak outcomes. This pattern suggests that sentiment is used to downplay poor financial performance that could reflect negatively on incumbent politicians ahead of elections.
By providing evidence that textual disclosures in Swedish municipal annual reports generally align with numerical disclosures − except in pre-election years, where we find indications of misalignment − we contribute to the literature on government financial transparency. This finding extends and refines the conclusions of Rich et al. (2018) and Kim (2022), who observed similar alignment patterns in United States state and local governments but did not account for election cycle effects.
The remainder of the article is structured as follows: the next section presents the theoretical background and formulates the research question, with a focus on cyclical patterns across the election cycle. This is followed by an overview of the Swedish local government context. We then describe the data and measures used in the analysis, present the empirical findings and conclude with a discussion of their implications.
Theoretical background and research question: Cyclical patterns across the election cycle
Political budget cycle theory is one of the most prominent frameworks linking the election cycle to government behaviour. It originates from the work of Nordhaus (1975), which posits that incumbent politicians at the central government level cyclically manipulate macroeconomic aggregates to increase their chances of re-election. Subsequent research has refined the theory in several ways, focusing on budgetary policies instead of macroeconomic aggregates, thereby extending its applicability to local government contexts.
One of the most influential extensions, as highlighted by Dubois (2016), is offered by the models introduced by Rogoff and Sibert (1988) and Rogoff (1990), which emphasize how information asymmetries between voters and incumbent politicians shape electoral incentives. These models assume that voters are rational and can directly observe politicians’ competence, but that information becomes available with a delay. Moreover, the models posit that competence is serially correlated − meaning that a politician's current competence serves as an indicator of their future competence. Given these assumptions, their models predict that incumbent politicians are incentivized to strategically adjust budgetary policies before elections to signal competence to voters. In contrast, the political opposition lacks this credible means to signal competence, as they have no direct control over budgetary decisions.
Consistent with these theoretical predictions, the occurrence of opportunistic political budget cycles has been observed at the local government level. Specifically, existing research shows that local government spending on selected welfare services tends to follow a cyclical pattern across the election cycle, with increases ahead of elections to appeal to voters, followed by more restrictive budgetary policies after the election, and renewed increases as the next election approaches (e.g., Chortareas et al., 2016; Cuadrado-Ballesteros and García-Sánchez, 2018; Köppl Turyna et al., 2016; Maličká and Mourao, 2023; Veiga and Veiga, 2007). Similar cyclical adjustments have also been documented on the revenue side of the budget. Local governments often avoid raising taxes close to elections (Alesina and Paradisi, 2017; Foremny and Riedel, 2014) and, in some cases, even reduce the issuance of fines during election years to appeal to voters (Benito et al., 2021).
Relatedly, cyclical patterns across the election cycle have also been observed in financial reporting. The annual report is the formal document where a government summarizes and communicates its financial condition and underlying operations to stakeholders, including voters and information intermediaries. Although governments are generally required to prepare annual reports in accordance with a set of generally accepted accounting principles and submit them for audit before issuance, there remains some discretion in the financial reporting process. Governments can exploit this flexibility to opportunistically adjust reported financial performance by accelerating or deferring the recognition of revenues and expenses. This practice, commonly known as accounting or accrual-based earnings management, has received increasing attention in the public sector in recent years (Bisogno and Donatella, 2022). Research indicates that such adjustments become more prevalent in state and local government annual reports issued close to elections (Cohen et al., 2019; Ferreira, 2024; Kido et al., 2012). Like budgetary policy adjustments, this cyclicality is attributed to incumbent politicians’ efforts to enhance their re-election prospects. By opportunistically withholding or altering numerical disclosures that might indicate poor financial performance close to elections, incumbents seek to avoid raising voter concerns about their competence.
To summarize, previous research provides evidence that incumbent politicians cyclically adjust both budgetary policies and reported financial performance in response to electoral incentives. This suggests that, depending on the level of political pressure during different phases of the election cycle, incumbents vary their emphasis on the signals conveyed in budgets and annual reports. Against this theoretical background, a similar election-driven cycle can potentially exist in the textual sentiment of annual reports.
During the election year, when political pressure presumably reaches its peak, incumbent politicians are likely to place greater emphasis on appealing to voters to enhance their re-election prospects. If financial conditions are healthy, it does not give voters cause for concern regarding future budget policies, such as tax increases or cuts to welfare services, which could easily spark negative media coverage and prompt reactions from special interest groups on social media. However, in some cases, disclosing poor financial performance during periods of high political pressure, such as in the lead-up to elections, may be unavoidable. When this occurs, the inherent flexibility of textual disclosures provides governments with opportunities to potentially shape voter perceptions by putting forward a more favourable narrative than the raw numbers suggest. One way to achieve this is by using more positive and less negative sentiment in these annual reports. If this practice becomes widespread − where numerical disclosures are systematically accompanied by unjustifiably positive or negative textual sentiment as political pressure increases − the overall alignment between textual sentiment and financial performance in annual reports will weaken or even disappear.
Based on this discussion, we pose the following research question: Are textual sentiment and financial performance aligned in annual reports, and how does this alignment vary across the election cycle?
The Swedish local government context
Organized in a two-tier structure, the Swedish local government sector comprises 20 regions and 290 municipalities. The primary responsibility of the regions is to provide healthcare, whereas the municipalities are tasked with a wide range of services. These include local infrastructure − such as urban planning, local roads, waste management, and water and sewage services − as well as social services covering senior and disability care, childcare, education, and cultural and recreational activities. In addition to providing these services through their administrative structures, Swedish municipalities also operate municipally owned companies. These companies are typically active in areas such as local development and place marketing, real estate, housing, local public infrastructure, and energy and district heating.
The main source of revenue for Swedish municipalities is taxes, which they levy on their residents’ personal income. Other important, though smaller, sources of revenue include fees for services and income from business activities, as well as grants from the national government.
Elections for municipalities − along with separate elections for regions and the national government − are held every four years, on the second Sunday in September. Swedish local politics is essentially party-based, and following the municipal elections, a governing coalition is typically formed, consisting of either right-wing or left-wing parties, or a combination of parties spanning the political spectrum. This means that incumbent parties from the large established national parties are always up for re-election, even if individual politicians may change. The main political bodies are the municipal council − which functions similarly to a parliament, where major decisions are made − and the municipal executive board, which serves as the executive branch of the local government.
Municipalities are legally required to prepare a comprehensive annual report, which must include separate financial statements for services managed through administrative structures, as well as consolidated financial statements for the entire municipal group, including municipally owned companies. The reporting period covers the calendar year, from 1 January to 31 December, and the municipal board must submit the annual report to the municipal council by the legal deadline of 15 April in the following year. In practice, this usually occurs within a few weeks of that deadline (Donatella et al., 2022). Subsequently, the municipal council reviews the auditors’ recommendations and decides whether to approve the issuance of the annual report in its current form and grant the municipal board discharge from liability.
Although the annual report is formally prepared by administrative officials, the process involves several stages where the ruling parties have opportunities to exercise influence. Draft versions of the annual report are presented and discussed at municipal board meetings and at preparatory meetings preceding them, and the municipality's financial situation is regularly addressed in these forums as part of both the budget process and ongoing financial oversight. These procedures follow from the legal framework regulating municipal governance in Sweden. At the same time, prior research has shown that informal channels also matter. Politicians interact with senior administrative officials outside formal meetings, and previous research suggests that through such interactions senior administrative officials develop an understanding of what the ruling politicians expect and consider acceptable (Donatella, 2016; Falkman and Tagesson, 2008).
Data and measures
We collected annual reports from 289 1 Swedish municipalities for the years 2010–2023, a period that includes four election years (2010, 2014, 2018 and 2022), three pre-election years (2013, 2017 and 2021) and seven mid-election years. The reports were retrieved from municipal websites or via personal requests. Due to the limited availability of older documents, comprehensive coverage prior to 2010 was not feasible.
All documents were converted into machine-readable format to enable sentiment analysis. We also collected financial and non-financial data from archival sources to construct measures of financial performance and other municipal characteristics. After accounting for data availability and excluding outliers, the final sample comprises 3981 municipality-year observations out of an initial 4046. On average, annual reports in our sample contain about 30,000 words.
We analysed the annual report in its entirety to ensure that all textual information published is included in our study, regardless of any potential differences in headings or placement across the years in our sample period. We acknowledge that earlier research, such as Kim (2022), analysed both the entire annual report and the Management Discussion and Analysis (MD&A) section. This was not feasible in our case due to the variation in Swedish reporting practice. Specifically, before the amended legal requirements on MD&A reporting introduced in 2019, and the subsequent issuance of Accounting Standard No. 15 in 2020 by the Swedish Council for Municipal Accounting, MD&A disclosures were not always reported in a clearly defined section of the annual report.
Sentiment analysis
We identify and quantify positive and negative sentiment in annual report texts using a bag-of-words approach. Our method builds on the dictionaries developed by Loughran and McDonald (2011), which were specifically designed to capture sentiment in financial reporting. These dictionaries have had a significant influence on research in finance and accounting in the private sector (Loughran and McDonald, 2020) and have also been applied to state and local government annual reports (Kim, 2022; Rich et al., 2018, 2021).
For our analysis, we created Swedish equivalents of the Loughran and McDonald (2011) wordlists, which include 353 positive and 2354 negative terms. Using Google Translate as a starting point, we translated the terms and then manually reviewed and adapted the translations as necessary. Due to the syntactic structure of the Swedish language, we applied stemming to remove inflections. The final lists consist of 221 positive and 658 negative word stems. We attribute the relatively smaller number of Swedish negative stems to vocabulary overlap, as many distinct English terms are translated into the same Swedish word. Detailed statistics on the most frequent sentiment words are presented in Online Appendix Table A1.
For each annual report, we calculated separate scores for positive sentiment and negative sentiment. Each score reflects the proportion of sentiment words in the document, calculated as the number of positive or negative terms divided by the total word count and multiplied by 100. Before scaling, we adjusted for negations: a sentiment word was considered negated if any of the four preceding words was ‘no,’ ‘not,’ ‘none,’ or ‘never.’
Finally, we calculated a net positive sentiment score − defined as the difference between the positive and negative sentiment scores − which serves as the main independent variable in our analysis. This measure is commonly used in prior research, as it is intended to capture the overall tone of a document. However, to better understand what drives this net score, we also present the positive and negative components separately in some of our regressions. The correlations between the three sentiment measures are reported in Online Appendix Table A4.
On average, 1.6 per cent of all words in the annual reports included in our sample were classified as positive and 1.1 per cent as negative. Online Appendix Table A3 presents summary statistics for all variables included in the analysis, including distributional details for the sentiment scores.
Financial performance variables
We focus on three complementary aspects of financial performance in the Swedish context: net income margin; adherence to the balanced budget requirement; and compliance with the approved budget.
Net income margin (NI margin) is calculated as the municipal group's net income before extraordinary items, scaled by the sum of tax revenues and general grants. This variable captures the balance between revenues and expenses at the municipal group level, providing an indicator of the municipal group's overall financial performance. In Sweden, the municipal group includes the municipality and its fully or partially owned companies, ensuring that all material municipal operations are considered in the consolidated financial statements. Notably, the net income margin therefore also reflects business activities that are expected to generate profit, which can subsequently be reinvested in municipal operations. Net income margin was calculated using data from Statistics Sweden.
Whether a municipality meets the balanced budget requirement (Meets BBR) is captured by a dummy variable. Swedish law mandates that a municipality's revenues must cover its expenses each year, and if not met, the deficit must be fully restored within three years. This balanced budget requirement applies only to services managed through administrative structures, not to the municipal group. Adherence to the requirement is determined by assessing net income as reported in a municipality's income statement and adjusting it for items such as capital gains and losses and, since 2013, accruals allocated to or drawn from their accrual reserves (Donatella et al., 2024). A municipality is considered to meet the balanced budget requirement if the adjusted net income is positive; otherwise, it has failed to meet the requirement. The data used to generate this variable were obtained from Kolada, a national database containing financial and non-financial data on Swedish local governments.
Budget compliance is defined as the difference between the budgeted net income before extraordinary items and the actual outcome as reported in the annual report, scaled by the budgeted amount. This variable reflects forecast accuracy and financial control over operations. As the law mandates only the approval of budgets at the municipal level, municipal group budgets are not commonly prepared. Therefore, we use municipal rather than municipal group data for the budget compliance variable as well. Data were obtained from Statistics Sweden.
In our sample, the mean (median) net income margin is 4.4 (3.8) per cent; 88 per cent of municipality-years meet the balanced budget requirement; and the mean (median) budget compliance is 2.8 (1.9) per cent (for summary statistics, see Online Appendix Table A3).
Control variables
In our analysis of the determinants of sentiment, we include several control variables.
In local governments, elections are not the only source of political pressure. In our sample, the political environment varies across municipalities, potentially giving rise to differences in pressure on incumbent politicians. We control for political competition (government change, minority government and the ruling coalition's share of council seats) and political engagement (voter turnout), as both may contribute to political pressure.
Additionally, demographic and socio-economic characteristics of residents affect political pressure as well as a municipality's financial performance. To account for these factors, our analysis controls for a comprehensive set of demographic variables (population size, age, growth trends, density and share of foreign-born residents) and socio-economic variables (population income, unemployment trends and crime trends).
Furthermore, to account for the business environment, we include a business climate ranking. We also control for municipal indebtedness (debt-to-equity) and accruals quality (proxied by absolute discretionary accruals), as these factors may influence both reported financial performance and textual sentiment. Finally, we control for annual report length (total word count) to ensure that our findings are not driven by differences in document size.
See Online Appendix Table A2 and Table A3 for definitions and summary statistics of these variables.
Empirical findings
This section presents our empirical findings. We begin by examining the bivariate correlations and multivariate tests of the association between performance and sentiments, unconditional on the election cycle. We then analyse how the election cycle influences this relationship.
Textual sentiments and financial performance
A bivariate correlation analysis (see Online Appendix Table A4) indicates that municipalities with higher net income margins or that meet the balanced budget requirement tend to use more positive and less negative language. A more positive sentiment is also characteristic of larger municipalities, as well as those with higher population growth, greater population density, higher income levels, a smaller share of foreign-born residents, younger populations, a larger voter turnout, higher business rankings, lower debt levels and decreasing crime rates. Furthermore, sentiments tend to be less positive following recent government changes, under minority governments, and when the ruling party or coalition holds a smaller share of municipal council seats. Taken together, these findings suggest that textual sentiments are influenced by financial performance as well as socio-economic, demographic and political factors.
To investigate the relationship between textual sentiment and the financial performance reported in the financial statements while controlling for potentially confounding factors, we estimated the following fixed effects regression model after rejecting the null in Hausman tests:

Figure 1(a) presents the results of estimating equation 1, displaying coefficients and confidence intervals for the three performance variables. Our overall results point to a positive association between financial performance and net positive sentiments in municipal annual reports. Specifically, sentiment correlates with net income margin and meeting the balanced budget requirement (BBR), but not with budget compliance (NI margin: coeff. = 0.0712, t-stat. = 4.03; Meets BBR: coeff. = 0.293, t-stat. = 6.78; Budget compliance: coeff. = 0.0168; t-stat. = 1.12). While both positive and negative sentiments drive this finding, negative sentiments have a greater impact. The models testing net positive, positive, and negative sentiments explain approximately 15, 7 and 27 per cent of sentiment variation, respectively. Online Appendix Table A5 reports complete regression output.
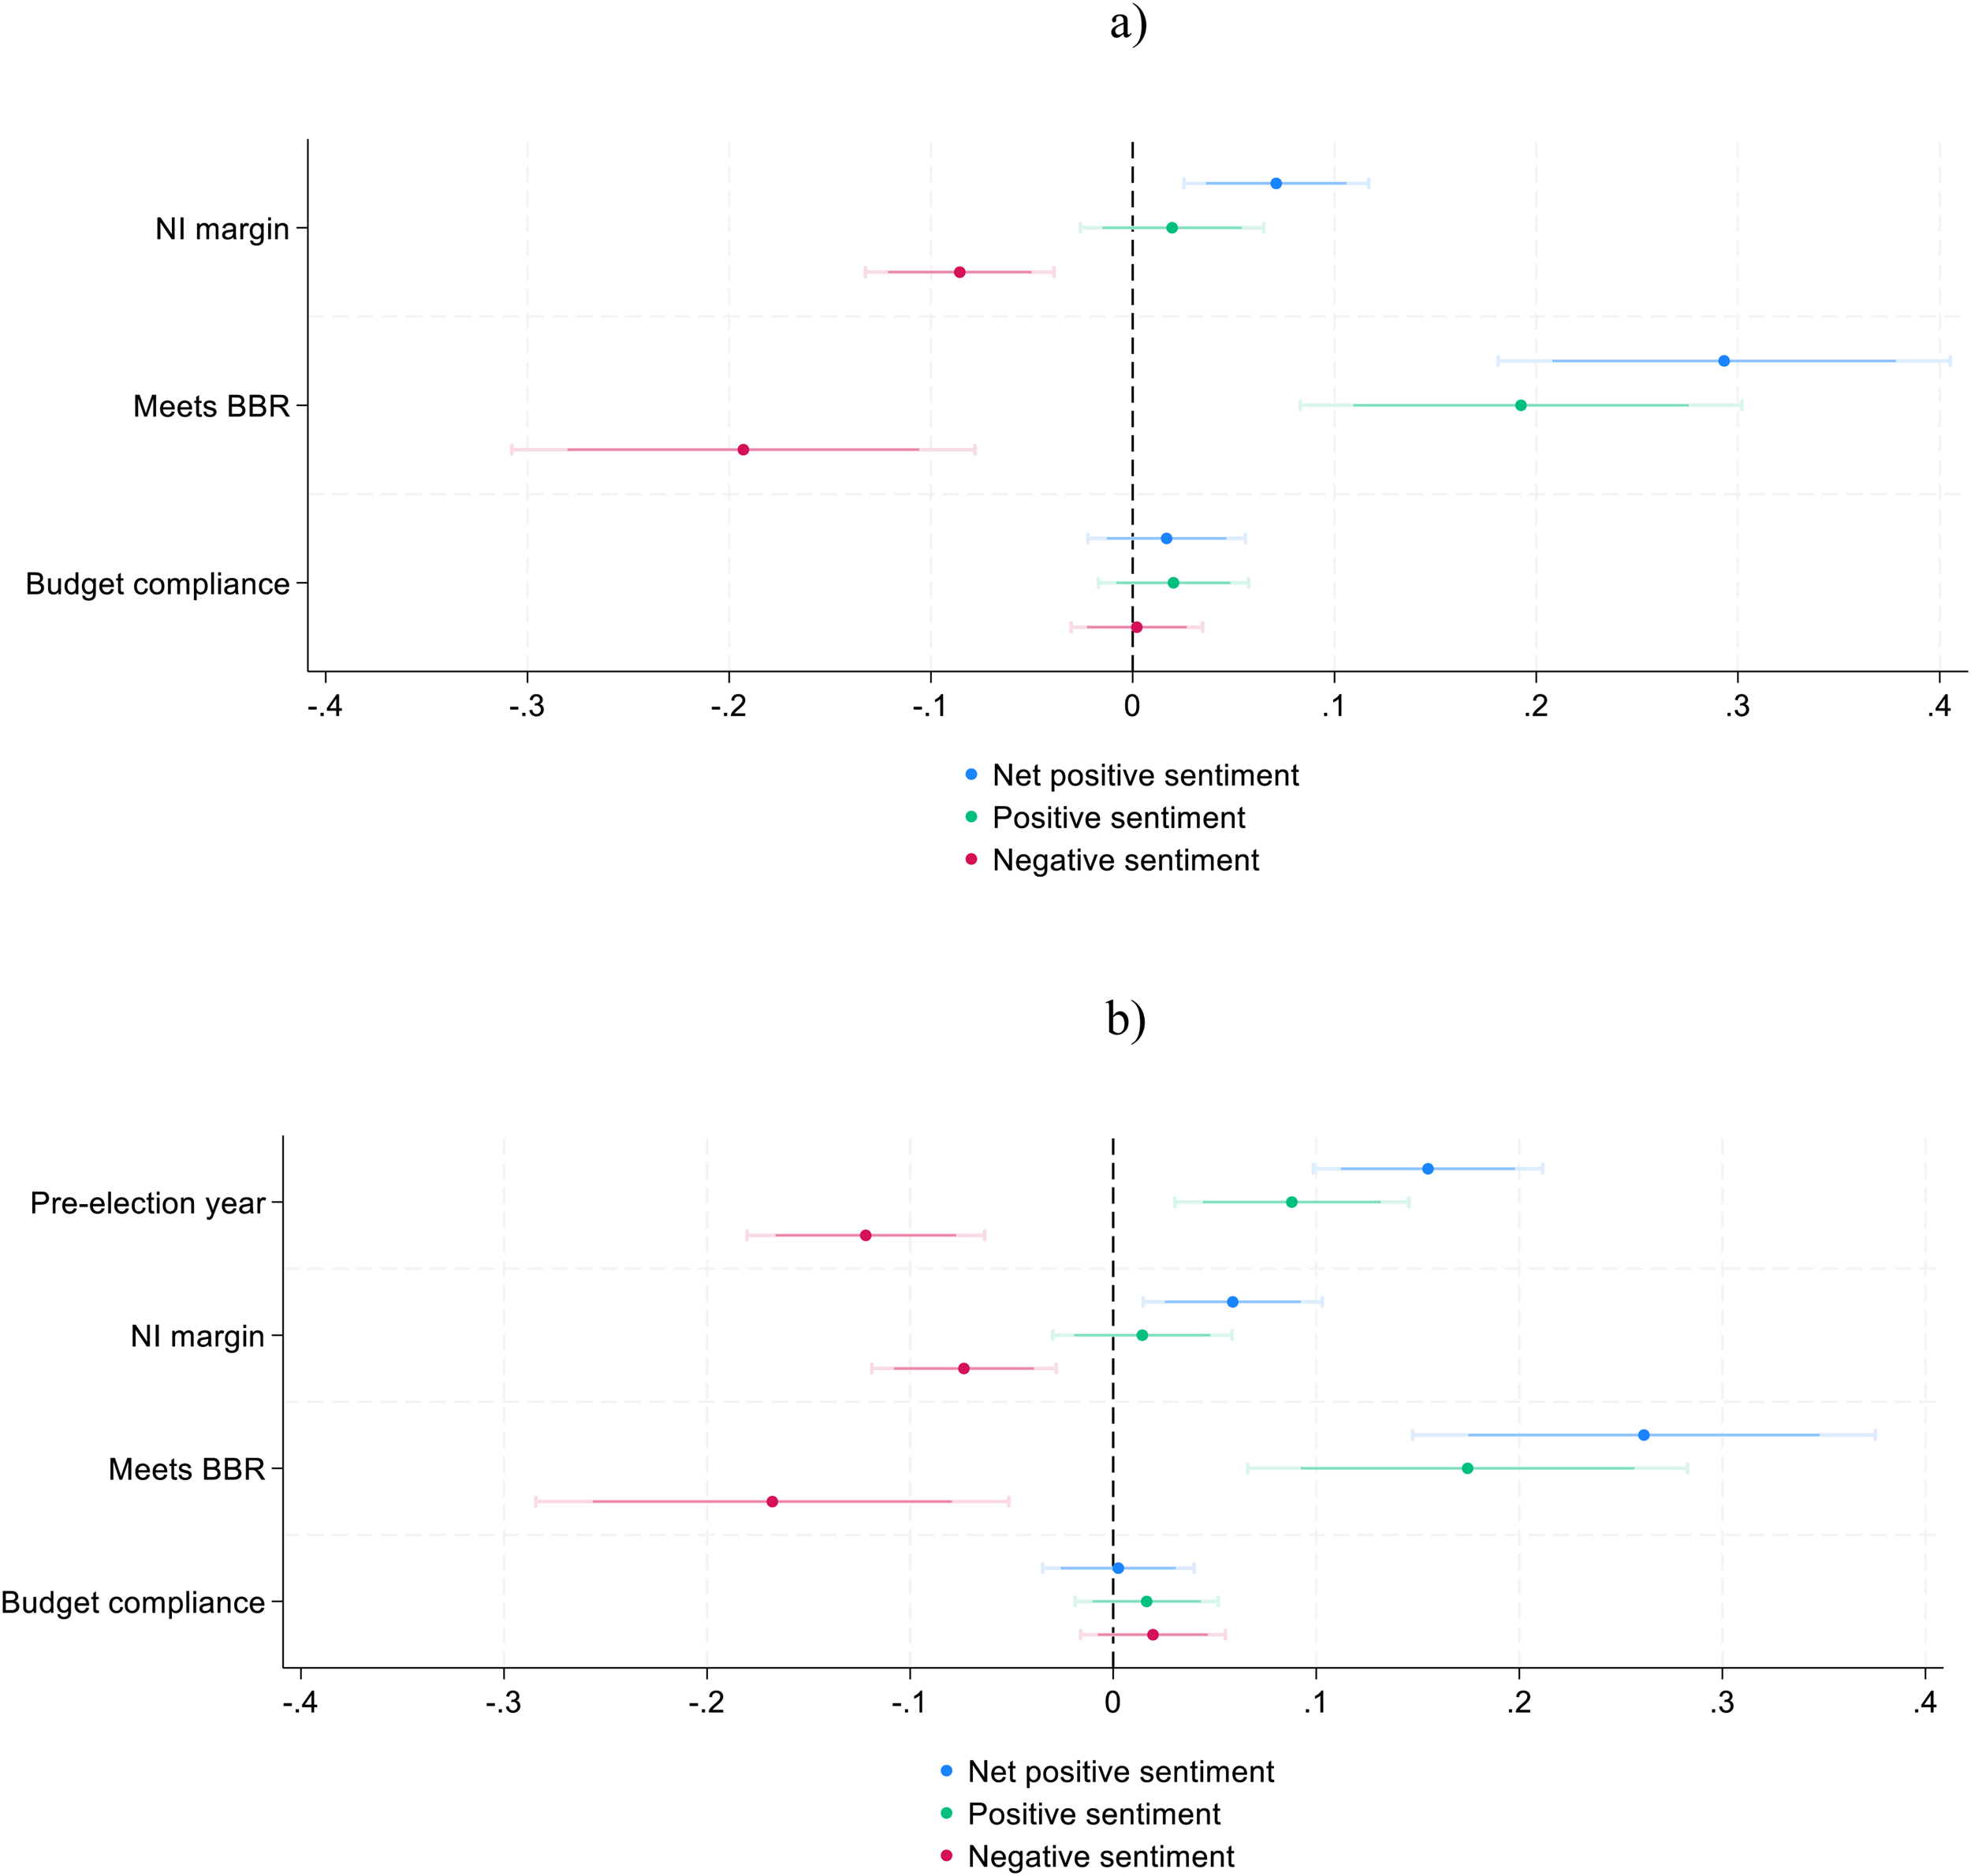
Estimation results with beta coefficients and confidence intervals: (a) municipal performance and textual sentiment (equation 1); and (b) election cycle, municipal performance and textual sentiment (equation 2a).
Textual sentiments and the election cycle
In this sub-section, we address whether the election cycle moderates the relationship between textual sentiment and financial performance. Specifically, we expect a differential effect in pre-election year reports, issued in the spring before the September election.
First, we investigate the unconditional pre-election year effect on sentiment. To this end, we estimate the following model:

Compared to equation 1, equation 2a retains municipality-specific intercepts but omits year-specific intercepts. Instead, it introduces election cycle variables. Our primary variable of interest, Pre_Election_Year, is a dummy indicating whether an annual report was issued in the spring before a September election. Additionally, an Election_Year dummy is included to account for potential confounding effects, as annual reports for election years are issued at the start of a new political term and summarize the budget outcomes of the preceding year, which may have been prepared under the same or a different government. By controlling for the election year, we focus on the comparison between pre-election and mid-election years, where political pressure is expected to be at its lowest.
Figure 1(b) presents the results of estimating equation 2a, showing the coefficients and confidence intervals for the pre-election year variable alongside our three performance variables. Controlling for fundamentals (i.e., financial performance and other municipal characteristics), we find a statistically significant effect of the pre-election year on conveyed textual sentiment (coeff. = 0.155, t-stat. = 7.12). Net positive sentiment is higher than in mid-election years, reflecting both more positive and less negative sentiments. This corresponds to an increase of about 0.16 standard deviations in net positive sentiment relative to mid-election years. This may be benchmarked against the influence of financial fundamentals: meeting the balanced budget requirement is associated with approximately a 0.26 standard deviation increase in sentiment, and a one-standard deviation improvement in the net income margin corresponds to approximately a 0.06 standard deviation increase. Hence, the pre-election year effect is of a comparable order of magnitude to core financial indicators. Overall, we interpret this as sentiment being unjustifiably positive in pre-election years. Finally, we note that the financial performance variables remain qualitatively unchanged after excluding year-specific fixed effects. See Online Appendix Table A6 for complete regression output.
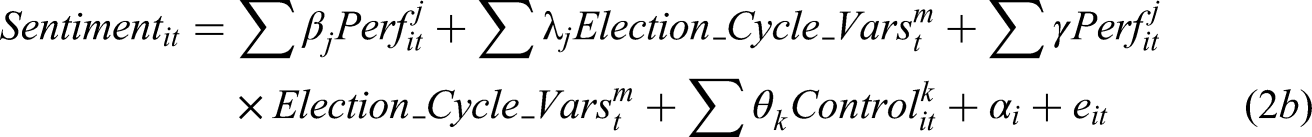
Next, we test the moderating effect of pre-election years on the association between financial performance and sentiment by introducing interaction variables between the election cycle dummies and the performance variables. We estimate the following model:
Specifically, we focus on the slopes of each performance measure and examine the potentially moderating effect of the pre-election year on net positive sentiment. Figure 2 visualizes the relationship between financial performance and sentiment conditional on the election cycle (see Online Appendix Table A7: Panel A for complete regression output). The plots corroborate earlier findings that sentiment is more positive in pre-election years after controlling for fundamentals.
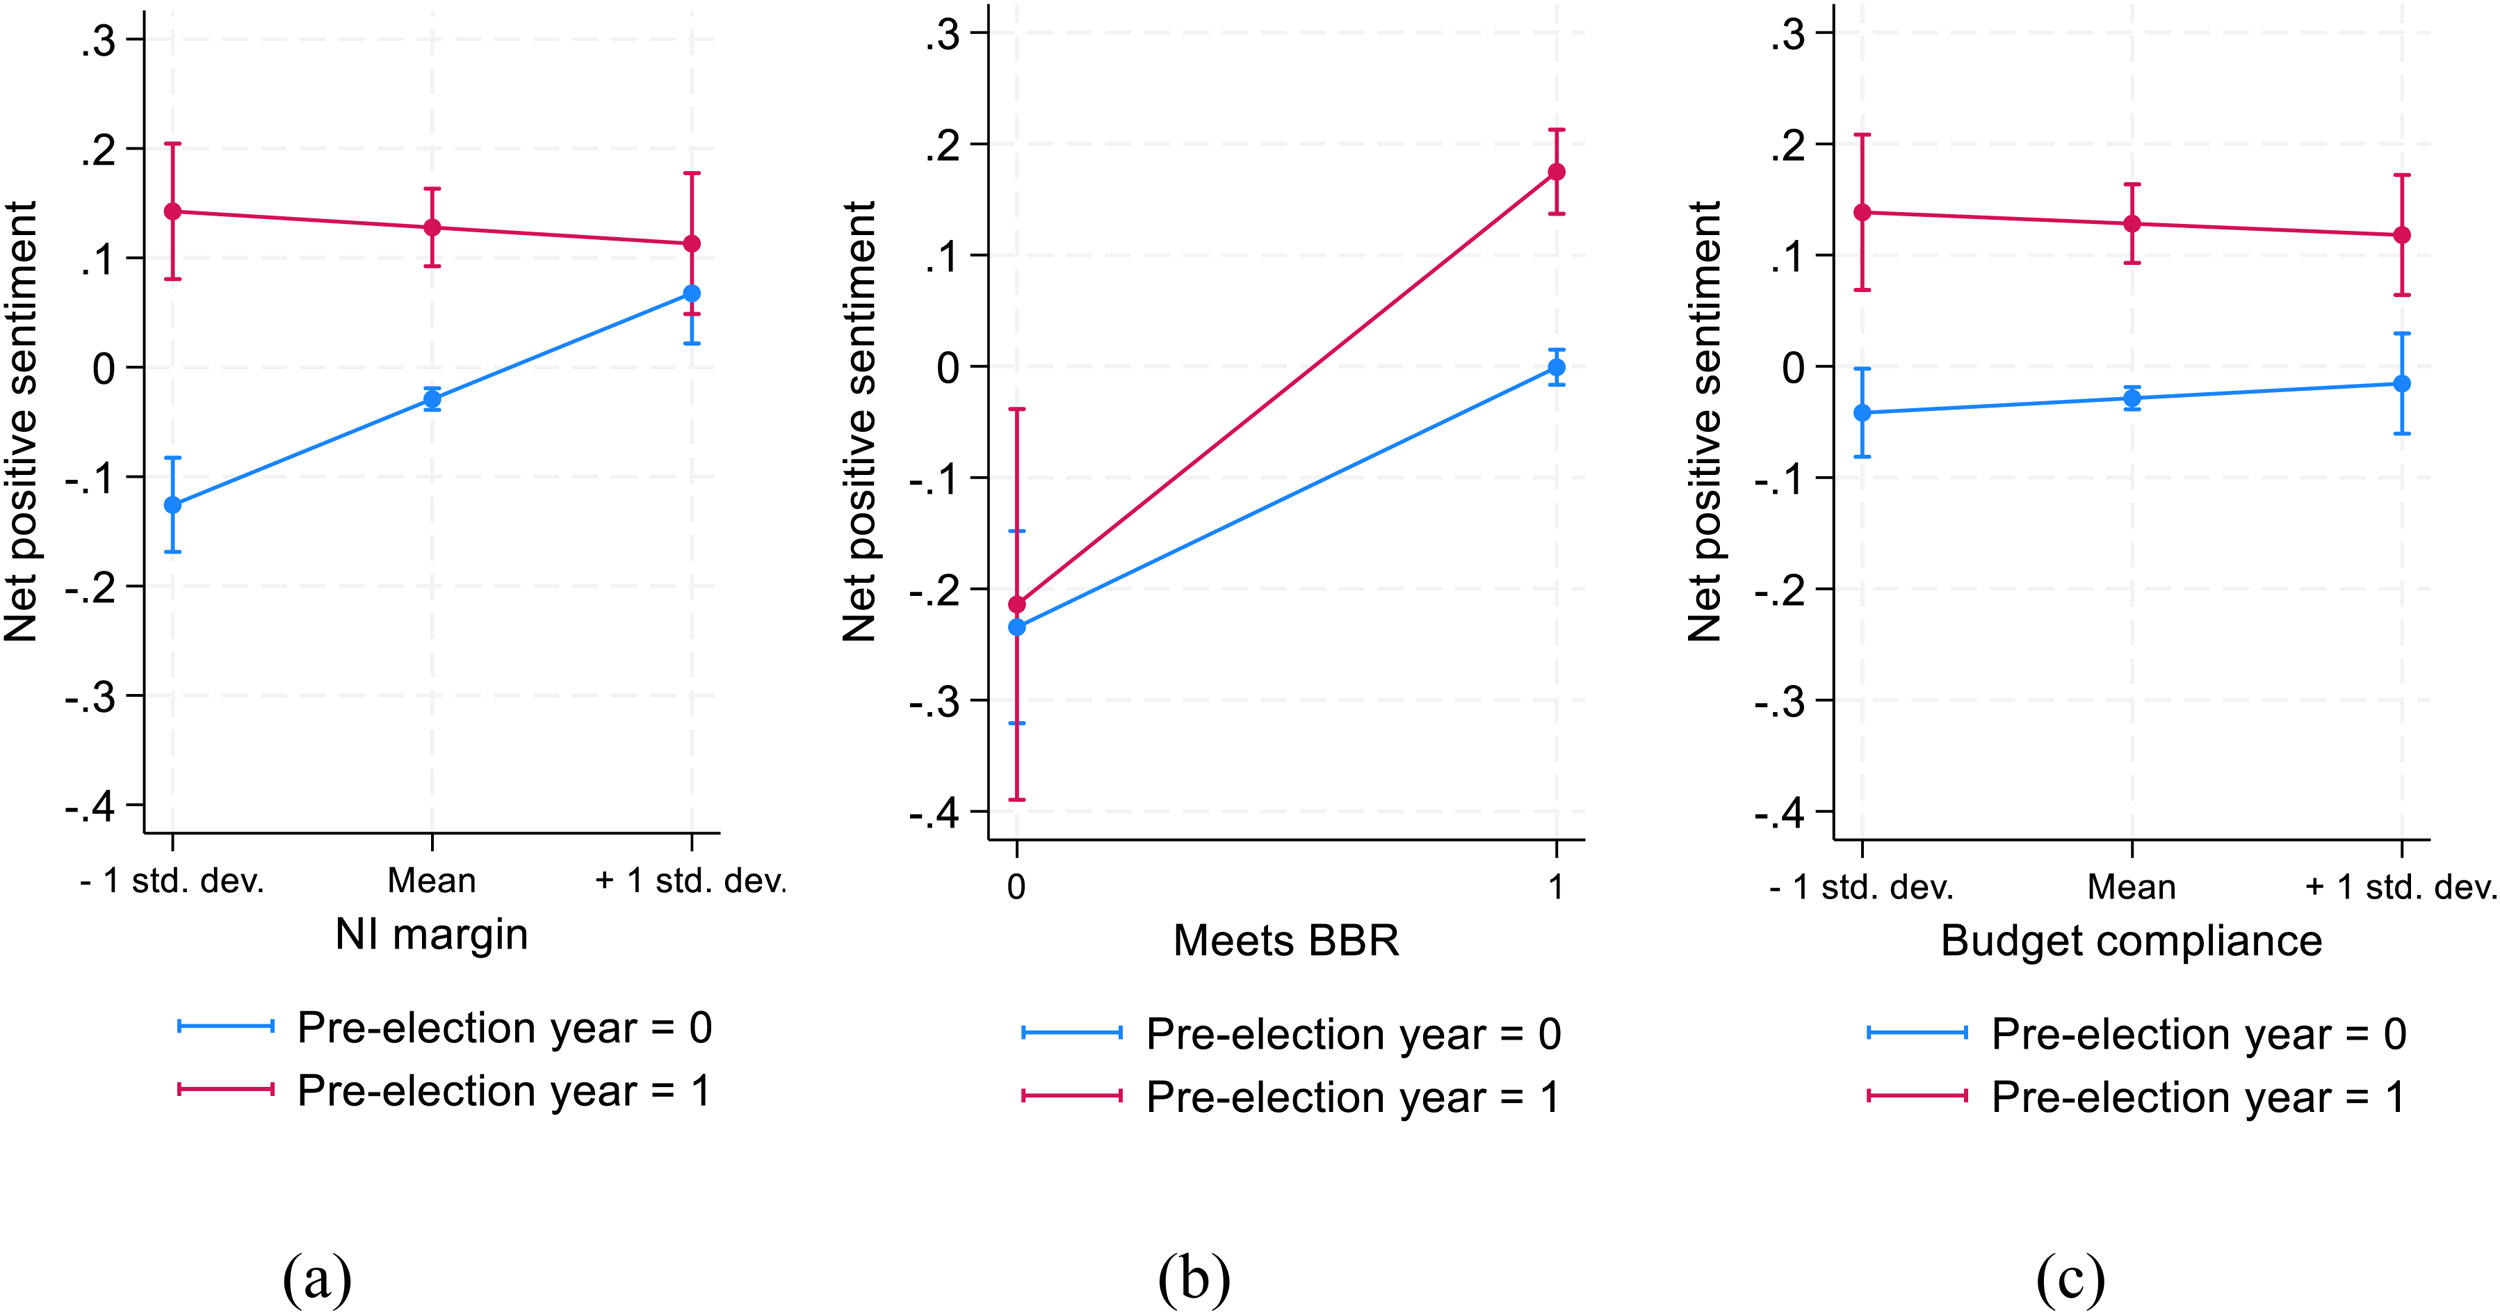
Estimation results with predicted margins and confidence intervals: performance and sentiment over the election cycle (equation 2b).
Turning to each of the performance measures, we make the following observations. First, for the net income margin (Figure 2(a)), the positive association with net positive sentiment observed in mid-election years disappears in pre-election years. In mid-election years, the slope is clearly positive, indicating that sentiment improves as financial performance strengthens. By contrast, in pre-election years the slope is nearly flat, such that sentiment remains high regardless of performance. This is reflected in the interaction term Pre-election year
Second, with respect to meeting the balanced budget requirement (Figure 2(b)), we find that municipalities that meet BBR tend to use a significantly more positive sentiment in pre-election year reports compared to mid-election years, indicating greater emphasis on favourable performance ahead of elections. In contrast, when municipalities fail to meet the requirement, no difference in sentiment is observed across the election cycle. One possible explanation for this asymmetry is that the nature of the requirement for a balanced budget is that it establishes a clear threshold that a municipality either meets or fails to meet − leaving little room for interpretation when it is not met. However, these results should be interpreted with caution; while the margins plots show a significant difference in sentiment across election years for municipalities that perform well, the difference in slope coefficients is not statistically significant in the main specification (Pre-election year
Finally, in pre-election years, sentiments are consistently higher for all levels of budget compliance; however, we observe no performance-related effect, as evidenced by the statistically insignificant interaction term Pre-election year
Robustness tests
To ensure that our findings are not sensitive to alternative model specifications or samples, we have performed several robustness tests. In Online Appendix Table A7: Panel B, we test the sensitivity of our findings to potential multicollinearity from including interaction terms to equation 2b. Across these alternative specifications (excluding either election cycle interactions or control variables), the results remain consistent, suggesting that our main conclusions are not driven by model design.
Furthermore, because very high net income margins may be considered undesirable and reflect one-time events or raise concerns about over-taxation or under-provision of services, we conduct robustness tests to ensure that our results are not driven by extreme financial performance. We first exclude observations at the 1st and 99th percentiles of the net income margin distribution (below −6% and above 20%). The results remain qualitatively unchanged: in equation 1 the coefficient on net income margin is 0.138 (t = 6.11), and in equation 2b the interaction coefficient is −0.115 (t = 3.45). Given the right-skew of the variable, we also exclude observations above the 95th percentile (net income margin above 10%). In this case, the coefficient in equation 1 increases to 0.153 (t = 6.98), and in equation 2b the coefficient becomes −0.0946 (t = –2.37). The coefficients on the remaining performance measures (Meets BBR and Budget compliance) are unaffected by this treatment.
As an additional robustness check, we implement an ‘abnormal tone’ measure to directly control for fundamentals determining textual sentiment. Abnormal tone is defined as the residuals from a first-stage regression of tone on municipal financial performance, and socio-economic and demographic characteristics. In the second stage, we regress this abnormal tone on the election cycle variables along with control variables. Consistent with our main results, we find that abnormal tone is higher in pre-election year reports, reinforcing our conclusion that sentiment is unjustifiably positive during times of high political pressure. Full results are reported in the Online Appendix Table A8.
Concluding discussion
In this article, we examined the alignment between textual sentiment and financial performance in municipal annual reports and how it varies across the election cycle. The core takeaway of the analysis is that while sentiment generally reflects contemporaneous fundamentals, this relationship weakens in pre-election year reports when political pressure is highest. The effect is particularly pronounced among municipalities with relatively poor performance, whose reports convey a disproportionately positive sentiment. These findings suggest that sentiment is used to downplay unfavourable outcomes ahead of elections, raising concerns about the reliability of textual disclosure when political incentives are strong.
Our findings extend the work of Rich et al. (2018) and Kim (2022), who documented an overall alignment between textual sentiment and financial performance in annual reports but did not consider election cycle effects. By showing that alignment weakens during election periods, we highlight the importance of incorporating political context into studies of governmental financial transparency. Prior research has demonstrated that politicians, in response to the political pressure associated with elections, adjust budgetary policies (e.g., Benito et al., 2021; Cuadrado-Ballesteros & García-Sánchez, 2018; Köppl Turyna et al., 2016; Veiga & Veiga, 2007) and reported financial performance (Cohen et al., 2019; Ferreira, 2024; Kido et al., 2012); our study adds that they also adjust the sentiment of textual disclosures.
Transparent governments are a cornerstone of democratic society, with extensive empirical research linking transparency to enhanced accountability, reduced corruption, improved financial stewardship and greater public trust (Cuadrado-Ballesteros et al., 2023; Cucciniello et al., 2017). The annual report, as the formal document through which a municipality summarizes and communicates its financial performance and underlying operations, can serve as a source of information for stakeholders. As many of the groups identified as potential users of local government annual reports, including voters and information intermediaries, are generally regarded as non-experts (Van Helden and Reichard, 2019), they may rely more heavily on textual disclosures to interpret complex numerical disclosures than expert users such as financial analysts and administrative officials at higher levels of government. Considering this, our findings are both reassuring and concerning: textual disclosures can complement numerical information when political pressure is low, but their reliability diminishes when political pressure intensifies. That this decline occurs precisely when voters most need reliable information is troubling, emphasizing the need for stakeholder caution in evaluating incumbent politicians’ financial stewardship during election periods.
Finally, while our study documents patterns in disclosure, it does not examine their effects. An important avenue for future research is to investigate whether and how textual sentiment influences the reactions of the public and intermediaries such as the media, and whether this, in turn, affects electoral outcomes.
Supplemental Material
sj-docx-1-ras-10.1177_00208523261417827 - Supplemental material for Local government transparency across the election cycle: Do text and numbers tell the same story?
Supplemental material, sj-docx-1-ras-10.1177_00208523261417827 for Local government transparency across the election cycle: Do text and numbers tell the same story? by Pierre Donatella and Emmeli Runesson in International Review of Administrative Sciences
Footnotes
Funding
The authors received no financial support for the research, authorship, and/or publication of this article.
Declaration of conflicting interests
The authors declared no potential conflicts of interest with respect to the research, authorship, and/or publication of this article.
Supplemental material
Supplemental material for this article is available online.
Notes
Author biographies
References
Supplementary Material
Please find the following supplemental material available below.
For Open Access articles published under a Creative Commons License, all supplemental material carries the same license as the article it is associated with.
For non-Open Access articles published, all supplemental material carries a non-exclusive license, and permission requests for re-use of supplemental material or any part of supplemental material shall be sent directly to the copyright owner as specified in the copyright notice associated with the article.