
Abstract
The need to understand innovation in public sector environments is growing. There is also a need to build theory, test it empirically and compare across jurisdictions. This article aims to understand the factors that have an impact on innovation capacity. It examines the self-rated innovation capacity of three European city governments – Barcelona, Copenhagen and Rotterdam – in regard to innovation drivers (structures, processes and contextual factors), external networking (levels of communication outside the municipality) and leadership qualities. Results from an online survey of senior administrators in the cities (n = 323) was used to empirically analyse the relationships between these using a structural equation model. Leadership has a stronger effect than innovation drivers and external networking on self-rated innovation capacity for these three city governments.
Points for practitioners
Public sector innovation is a very important topic for public managers as the expectations on government agencies increase. Innovation capacity is related to innovation drivers and barriers, the amount of contact that individuals have with others outside their organization, and leadership. This empirical study of three cities shows that leadership has a bigger effect on innovation capacity than the structures, processes and contextual factors that drive innovation, as well as the amount of external contact that public managers have outside their organizations. In addition, for Barcelona and Copenhagen, the network governance and transformational types have the biggest effect on innovation, while for Rotterdam, it is the entrepreneurial type followed by the network governance type.
Introduction
Innovation is an idea whose time has come to the public sector. Governments around the world have been making innovation statements, developing innovation policy and constructing innovation units for some decades now. While, in the early days, much of this was directed at ways for the public sector to support the private sector to innovate, this conversation expanded into a consideration of innovation within the public sector in the late 1990s as the pressure on governments to deliver for their citizens in the face of severe financial constraints intensified following the last global financial crisis. Innovation – whatever that might mean – has come to be seen as providing solutions to that pressure. As a consequence, public administrators have been confronted with a need to come to grips with innovation. What might innovation mean in a public sector environment? How can it be supported?
Research on the topic of public sector innovation has grown in line with this interest. An obvious launching point is the economic innovation literature, which sees it as creative destruction (Schumpeter, 1942), driven by attempts to gain competitive advantage in an open market. However, there is an apparent lack of fit between this and the world of public sector organizations, which are generally heavily institutionalized, routinized and risk-averse. There is no empirical evidence that the people who work in the public sector are less innovative than those who work in the private sector (Rainey, 1999). Some believe that people who work in the private sector are more innovative because they are driven by competition, or that people who work in public organizations are less innovative because the nature of their work causes them to be risk-averse to taking chances with public money (Hartley, 2005) or failing in regard to personal political esteem. However, it might be argued that high innovation potential is present in public organizations due to greater willingness to share ideas, information and knowledge because they do not have to worry about giving away ‘competitive advantage’ (Hartley, 2014). The first argument is related to Schumpeter’s idea about creative destruction, and hence of innovation being a risky business, while the second points to the importance of effective knowledge-sharing processes that support innovation.
This is just the tip of the iceberg in public sector innovation research, which is growing in both scale and scope. While much of the literature is conceptual, some of it is normative and little of it is based on empirical research (De Vries et al., 2016), it is becoming much broader in its conceptual perspective. The recent literature includes efforts to empirically research specific types of innovations and their diffusion, and also studies that examine the organizational capacity to stimulate innovations from within local governments (Harvey et al., 2010). However, the empirical evidence remains scant in regard to public sector innovation. Further, a great deal of it rests upon studying successful cases of innovations, rather than on conceptualizing and analysing the environments that support innovation.
This article aims to conceptualize the concept of innovation capacity in the public sector, and what supports it, and then to empirically examine this. It begins with some discussion about the meaning of innovation capacity in the public sector. It then outlines three components that have been identified as important contributors to this: innovation drivers, networks and leadership. A model that links these three components to innovation capacity is then constructed and empirically tested, using survey data from three different European city governments. The article concludes with a discussion of what this model reveals about innovation capacity in the public sector, as well as new directions for research on this topic.
Public sector innovation capacity
Innovation is often defined as some kind of discontinuity, a step-change or a game-changer. All of these terms signal that there is some kind of radical break with what has occurred previously. Hence, it is not just about having a good idea, but also about that idea being implemented. For the empirical project that underlies this article, innovation was defined as: the process from ideas to successful implementation of these, which makes a substantial difference to an organization’s understanding of the needs it is addressing and the services it delivers. Following on from this, innovation capacity is defined as a set of conditions that supports innovation or provides a supportive infrastructure; it is the set of factors that either allows innovation to occur or (more positively) actively encourages it.
The literature identifies numerous elements that support innovation capacity, and only a few of these can be discussed here (for a more detailed discussion, see Lewis et al., 2017). The development and efficiency of public service delivery systems requires input from public service officers, service users and wider local community stakeholders (Osborne et al., 2016). Such input also serves as a political instrument to achieve legitimacy for innovation as a public good (Bekkers et al., 2011). This perspective on public sector innovation is prominent in the literature, regarding input from a range of sources as an important tool for improving policy and service design.
There are many factors likely to be related to a public organization’s absorptive capacity, for example, the effect of the dynamics of the local environment it operates in, its public tasks and its investment in knowledge processes. An overview of studies shows that some public organizations have a better institutional fit with changes in the environment than others, using tools like strategy, vision and the adoption of a new corporate paradigm to achieve a turnaround (Harvey et al., 2010; Jas and Skelcher, 2005).
The capacity to learn and understand the needs and priorities of local environments, and the translation of this into actual innovations, are both important for public sector innovation. As noted earlier, public organizations inhabit more complex environments than their private sector counterparts. They are politically driven organizations, with leaders who are democratically elected periodically as representatives of the people. A recent study by Munro (2015), who interviewed public officials (politicians, managers and employees) about accelerating innovation in local councils in the UK, found numerous barriers and constraints that prevent innovation in the public sector, such as the short-term horizon of politicians, the risk-averse culture and the challenges of reaching agreement in complex political organizations. These constraints were also found in a study by Van Buuren and Loorbach (2009) in the Dutch context. Clearly, innovation drivers and barriers are a crucial part of the story.
This brief overview of public sector innovation capacity and some important contributors to it is followed by a consideration of the analytical framework for examining innovation capacity in this article. This contains three dimensions:
innovation drivers – structures, processes and contextual factors that help/hinder innovation; networking – the frequency of communication external to the organization; and leadership – the qualities and capabilities of senior individuals within the organization.
Innovation drivers
The innovation capacity of any organization is related to the environment within which it is located, and its internal structures and processes. Previous work has shown that the political and administrative context, the legal culture of the public sector, state and governance traditions, and resource arrangements can either trigger innovation or constrain it. Contextual factors that have a positive impact on the innovation capacity of public sector organizations are: a decentralized state; corporatist traditions; and a strong civil society (Bekkers et al., 2011). At a more micro level, a range of factors that either help or hinder innovation within municipalities has previously been analysed (Considine et al., 2009), revealing different structures, processes and contextual factors at work in creating innovation opportunities and constraints in different localities.
In this research, we examined a range of different innovation drivers, including: the quality of proposals coming from politicians and senior administrators, as well as the political culture and values; a range of external drivers, such as economic crisis, fiscal austerity and regulation from supranational political levels (European Union (EU)) and national or sectoral public organizations; and the range of stakeholders (e.g. citizens, media) engaged with. The presence of more innovation drivers (more positive perceptions of the structures, processes and context as drivers of rather than barriers to innovation) is expected to be positively associated with self-rated innovation capacity.
Networking
Innovation capacity is expected to be linked not only to contextual factors such as those discussed earlier, but also to informal social structures. Social networks based on interpersonal communication generate embedded resources such as social capital and trust relations. The importance of networks in facilitating innovation and shaping innovation pathways at the organizational, sectoral and national levels has long been recognized within the private sector innovation literature, and networks are now also increasingly being acknowledged as crucial in the public sector (Lewis et al., 2011). Previous empirical studies show that innovation in local governments occurs when individuals can meet each other without the burden of formal responsibilities, positions and rules (Considine et al., 2009; Nooteboom, 2006; Van der Voort et al, 2011). The presence of more external networking (which gives rise to access to a wider variety of information from outside the organization) is postulated to be positively associated with self-rated innovation capacity.
Leadership
In addition to innovation drivers and networking, the third component regarded as important is leadership. There is a vast literature on transformational leadership that emphasizes charisma, motivation of personnel and presenting inspiring visions as very important for achieving innovation and change (see Bass, 1985; Howell and Avolio, 1993). Other leadership literature (for instance, the more entrepreneurial leadership literature) tends to emphasize more the strategic choices leaders make and the way they use and change past routines in organizational behaviour (see Piening, 2013; Teece, 2007). However, leadership and leadership activities are certainly thought to be important for change and innovation in organizations and networks.
The link between leadership and innovation in the public sector is not yet well developed. Much research on innovation from a New Public Management perspective has focused on the role of individual entrepreneurship in pushing for change (Walker et al., 2011), while the Network Governance or New Public Governance version emphasizes ‘co-creation’ as producing innovation through new government–society interactions, especially to solve wicked problems (see Ansell and Gash, 2008; Klijn and Koppenjan, 2016). Innovation in the public sector seems likely to be related to the leadership qualities of both senior administrators and politicians. It is also probable that effective combinations of politicians and senior administrators are important for innovation. In short, we assume that there is a positive relationship between leadership activities that are supportive of innovation and innovation capacity. Leadership types that support innovation (through enabling and supporting administrators to come up with and implement innovative ideas) are presumed to be positively associated with self-rated innovation capacity.
This sets out our expectations for the relationships between innovation drivers, networking, leadership and innovation capacity. While each of these components is important for innovation in its own right, we further postulate that they are also interrelated. Thus, we expect that innovation drivers will have an impact on networking, and that particular leadership styles might be associated with networking and with the impact of innovation drivers. Hence, there are two further hypotheses: first, leadership types that support innovation are positively associated with networking and innovation drivers; and, second, innovation drivers are positively associated with networking.
A conceptual model of the hypothesized relationships is shown in Figure 1. These relationships are empirically examined in this article, first in regard to correlations, and then as a structural equation model, with self-rated innovation capacity as the outcome variable. The choice of cases for the study, our measures and the model that was tested are described in the following sections. All of the measures used are perceptions of administrative staff, which were gathered from responses to an online survey. Hence, we make claims not about innovation capacity per se, but about the perceptions and reported behaviour of administrators and how these are related to innovation capacity.
Conceptual model linking innovation drivers, networking, leadership and innovation capacity.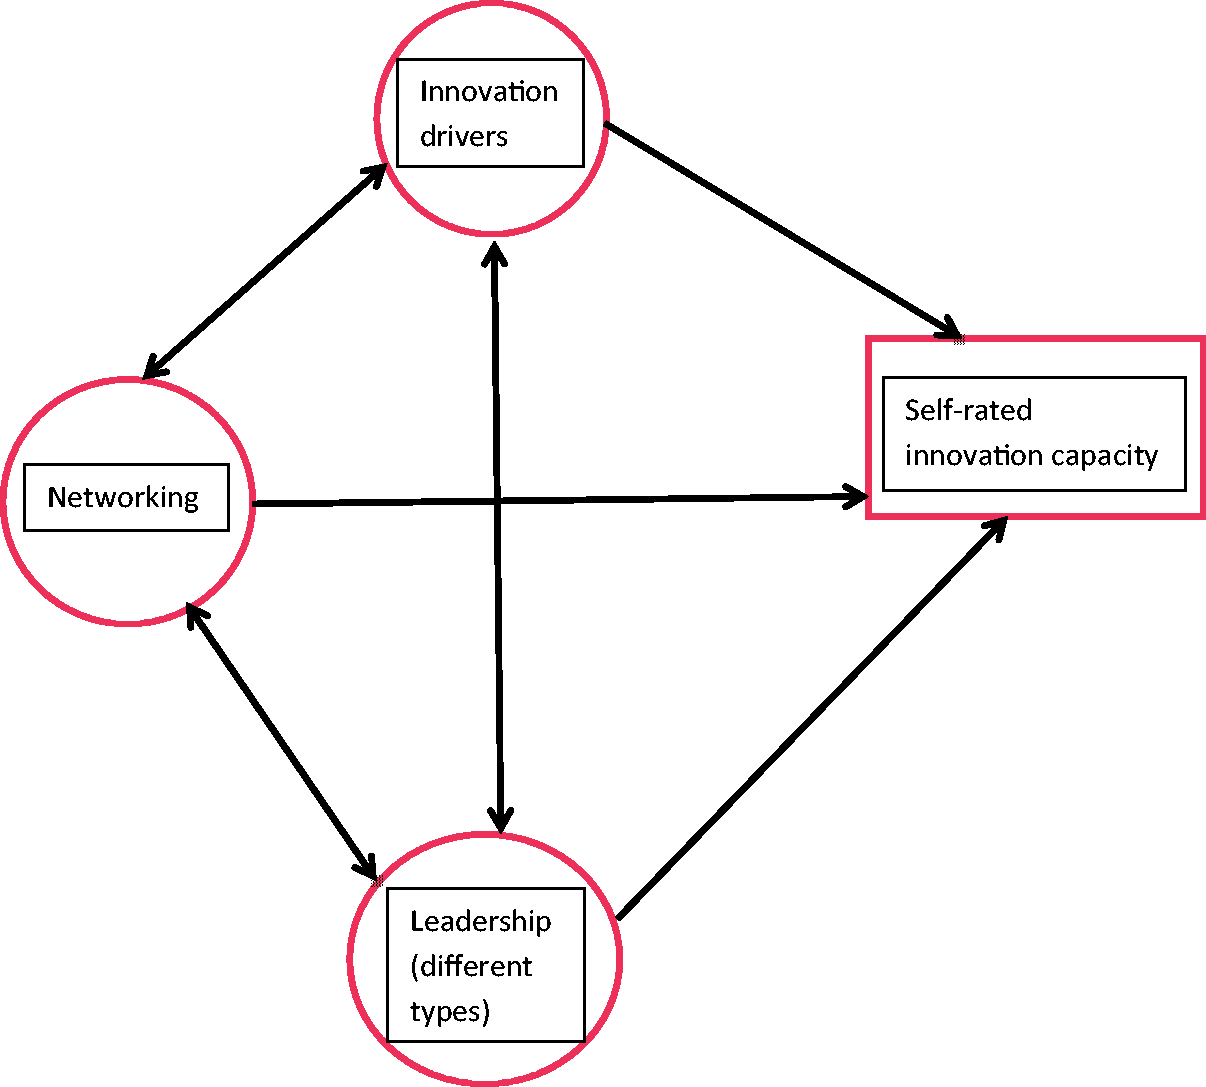
The study
This study uses three city governments (municipalities) as cases; they are treated as innovation environments that shape a municipality’s capacity for innovation. Municipal governments were chosen for a number of reasons. First, they are the level of government that is closest to the citizenry and the most likely to have ongoing interactions with them, making them a likely site for innovation. Second, this level of government has taken on an increasingly important role in many nations as service delivery functions in keys areas such as health, human services and community development have been devolved from higher levels of government over the past three decades. A study of innovation in municipal governments in Australia (see Considine et al., 2009; Lewis et al., 2011, 2013) demonstrated how networks contribute to an understanding of innovation inside government organizations.
Studying the municipal governments of reasonably large cities in different nations has a number of advantages. There is now a good deal of attention being directed towards cities as places where major societal challenges arise because so much of the populace lives and works in cities. Cities are also places where a lot of innovation occurs because the needs are so pressing. In addition, cities are generally centres for activities associated with the new service and knowledge economy, including numerous educational institutions, tourist sites, sporting arenas and creative arts venues. Hence, they are solid ‘cases’ of public sector organizations faced with multiple challenges and the need to innovate. The cross-national comparison provides a source of variation in analysing the interactions between our three dimensions of governance, networks and leadership. An additional but very important advantage of studying three different cities in three different countries is that, in this way, we can test our hypotheses in three different contexts, which is a more severe test than if we testes our hypotheses in one single context.
Three cities were compared: Copenhagen in Denmark; Rotterdam in the Netherlands; and Barcelona in Spain. These three reflect cities in nations with different state and society traditions, with Denmark and the Netherlands generally being more similar to each other than to Spain. The city government governance structures are different in each case (for more detail, see Lewis et al., 2017). However, each of these cities, of which Copenhagen is the only capital city, scores highly on the Innovation Cities Index (Innovation Cities Index, 2014). It could also be expected that each of these cities is facing a set of relatively common global challenges (such as the global financial crisis), as well as a unique set of local contextual factors and challenges. This makes them suitable to test our hypotheses in three different contexts that show similarities.
The survey methods
First, and in order to help with sampling for the online survey of senior administrators and politicians, a document analysis of the formal organizational structure of each municipality was conducted, mainly by using their websites but also by directly asking them questions for clarification. This information was used to develop an inventory of both the political and administrative structures and the functional divisions in each city government, as well as to ascertain the number of staff employed in the different divisions and at different levels in the hierarchy. This information was used to develop the sampling framework for the survey.
The survey was administered online. An English version of the questionnaire was created first, and then the questions were translated into Catalan, Danish and Dutch for use in Barcelona, Copenhagen and Rotterdam, respectively. The definition of innovation provided earlier in this article was provided at the start of the questionnaire as a way of guiding respondents since the term ‘innovation’ is used in many different ways. While this refers specifically to services, the responses to an open question about the socio-economic challenges facing each municipality, and the significant innovations that each municipality had introduced, elicited a wide variety of responses, including new services, changing governance structures, organizational development, information technology (IT), branding and recognition, urban development, citizens’ outreach, network governance, and user-led public services (see Lewis et al., 2017).
Number of responses to questions included in the model (civil servants only).
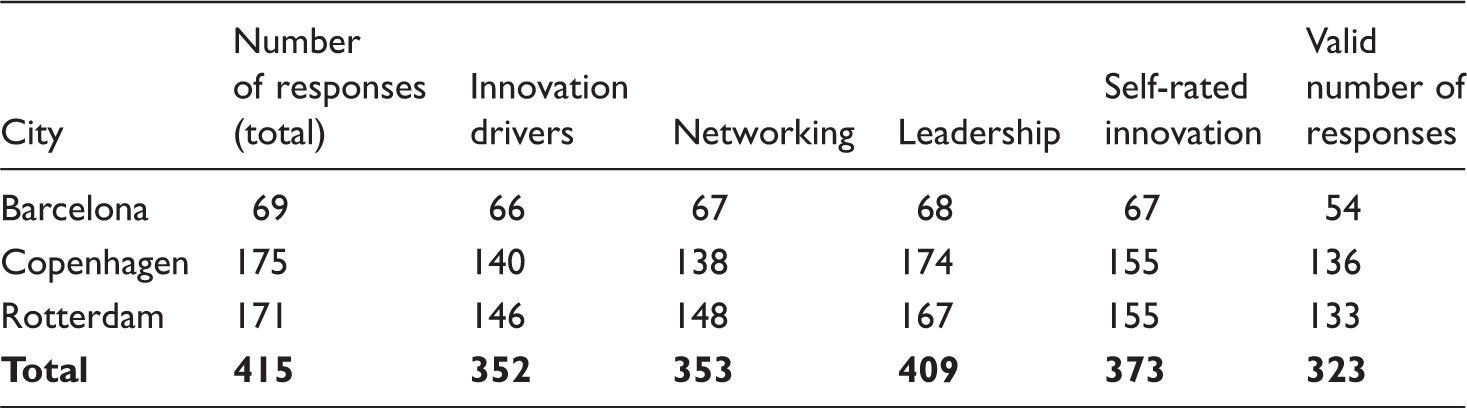
Note: Valid responses are those with no missing values in the whole set of questions used to run the structural equation model.
Summative measures were created for each of the innovation drivers, external networking and self-rated innovation capacity constructs in this article. This necessarily entails using some rather crude measures, but this was a necessary data reduction step in order to have enough cases to run the model with confidence – and it is the overall model that is of interest here. The leadership types were tested using exploratory factor analysis, and mean scores for each of the resulting types (created as scales) were then used in the analyses. Further details on these measures are provided in the following sections.
Innovation drivers
Innovation drivers.
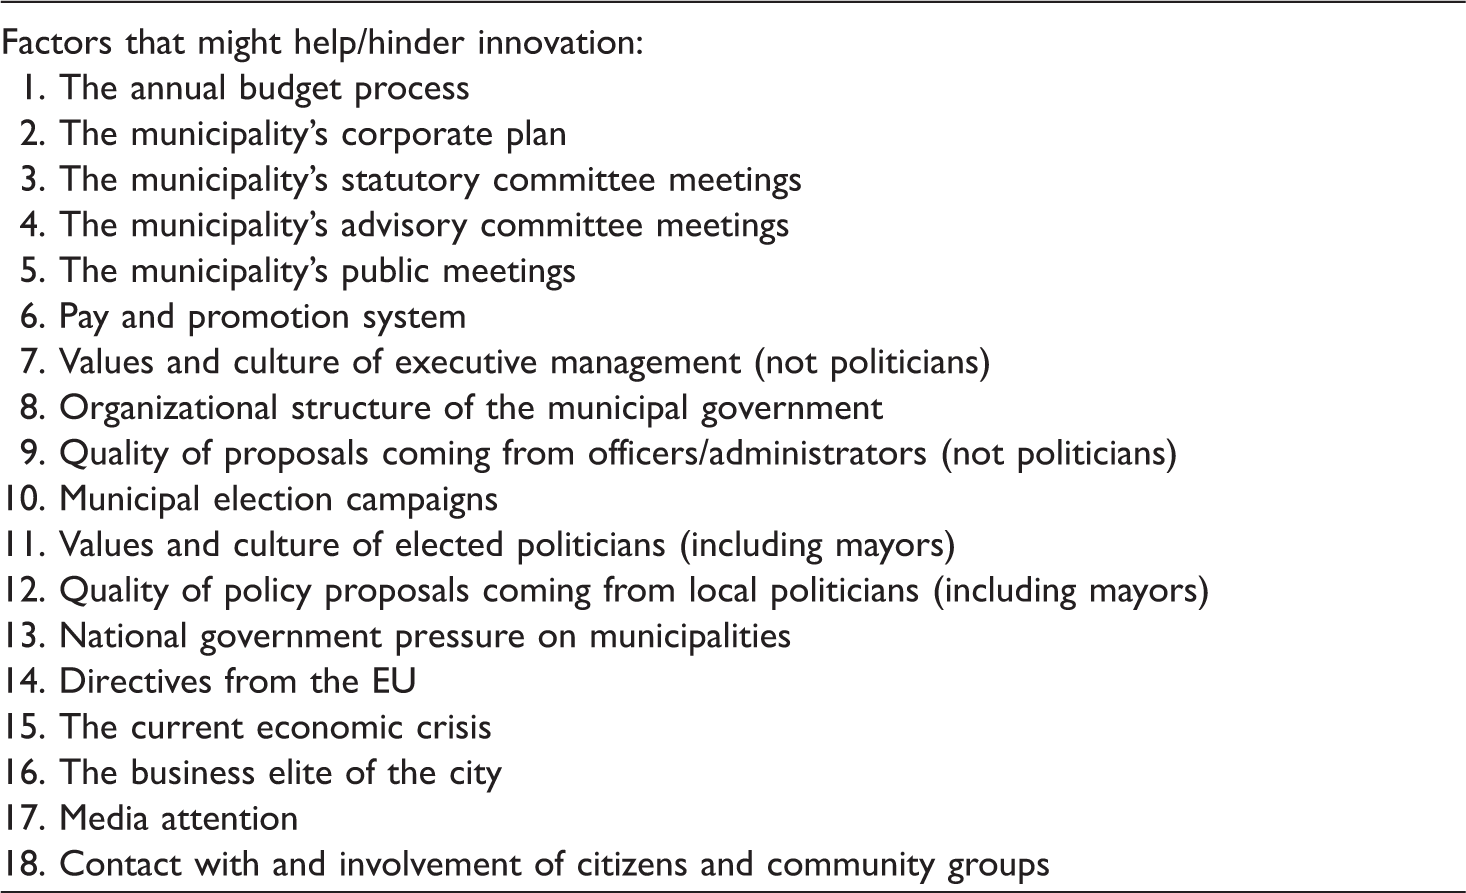
A summation of the scores for each of the 18 items together gives an overall score for how helpful a municipality’s procedures, structures and context is in regard to innovation. This score was created and then prorated so that the score (which could total 90 if someone rated every item at the maximum of 5) is a percentage. The overall score of 56.3 is higher than the mid-point of 45, indicating that, in general, people see this list of factors as driving innovation rather than creating barriers to it. Copenhagen scores the highest on this, with a mean score of 61.5. Rotterdam and Barcelona are lower, and rather close, with 52.7 for Rotterdam and 51.8 for Barcelona (see Table 6). The list of the most important drivers varied from city to city, with some seen as helping in some cases while hindering in others (for more information on this, see Lewis et al., 2017).
Networking
External networking.
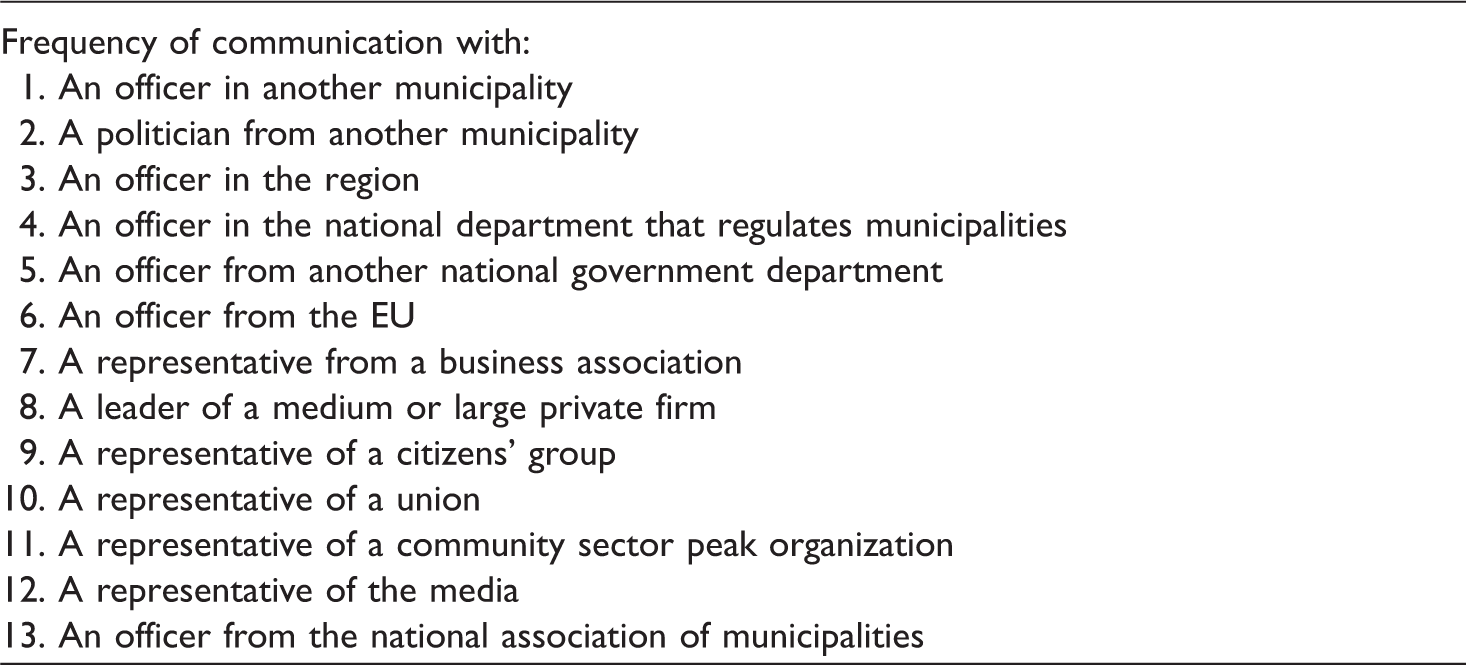
The scores for each of these 13 items were summed to give an overall score for external communication, which was then prorated against the maximum possible score of 52 (never was scored as zero and daily was scored as four) to give a percentage score. The mean for this new variable was 25.8, indicating that most people surveyed were in contact with these external organizations approximately monthly (which would produce an overall score of 26).
This is a crude measure of networks that captures the quantity of external contact but not the nuance of network ties and what they are used for. Social network analysis was also used in this study and the results can be found in Lewis et al. (2017), but it is not included here due to space limitations. A comparison of these mean scores across the municipalities shows that Barcelona respondents, with a mean of 32.1, reported much more external communication than the other two cities, which were very close to each other at 24.4 (Copenhagen) and 24.7 (Rotterdam) (see Table 6).
Leadership
Leadership qualities aligned with the five theoretical concepts.

Leadership correlation and reliability coefficients.
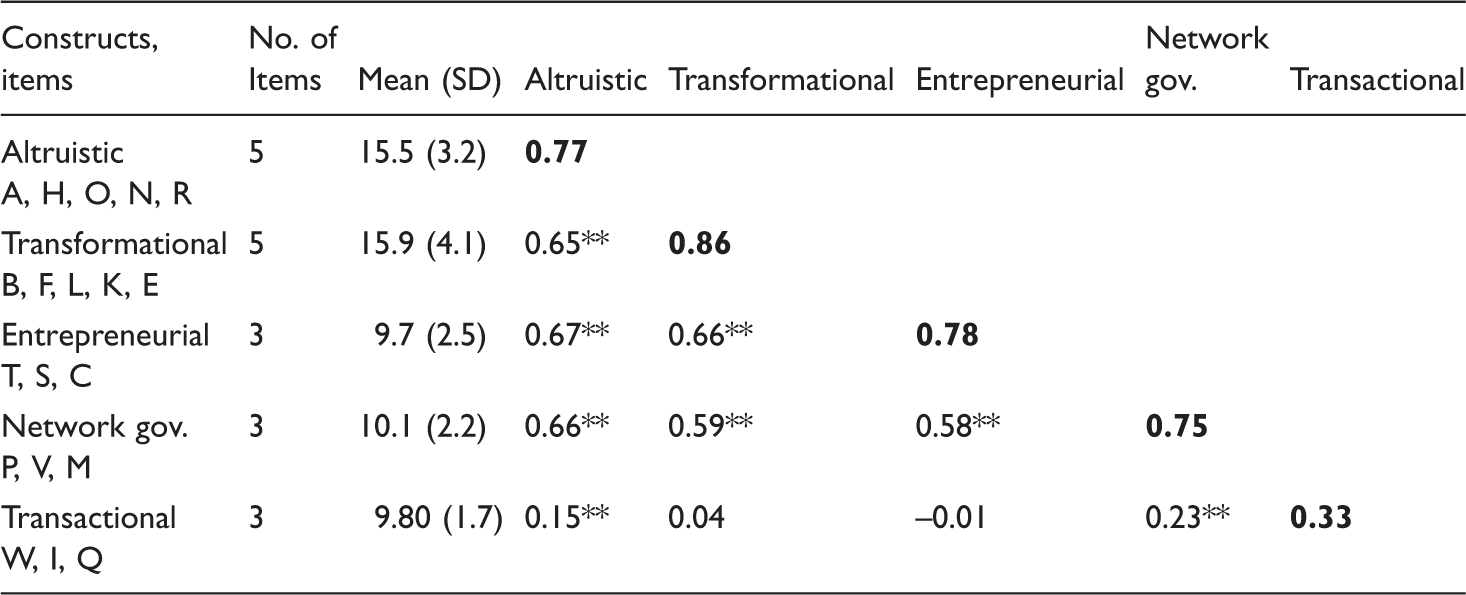
Note: Cronbach’s α coefficients are shown on the diagonal (in bold) and Spearman rank correlation coefficients are below the diagonal. **Correlations are significant at p < 0.01.
These types were empirically examined using an explanatory factor analysis and the number of items was then reduced to 19 based on either low correlation or where negative scores resulted for some items and these replicated positive scores on other items. Further explanation of the removal of four items can be found in another article (Ricard et al., 2017), with a slightly different solution because of the smaller number of responses used in the current article. We renamed the interpersonal type as altruistic to better reflect what the final scale includes.
Descriptive statistics – mean (S.D.) of the measures.
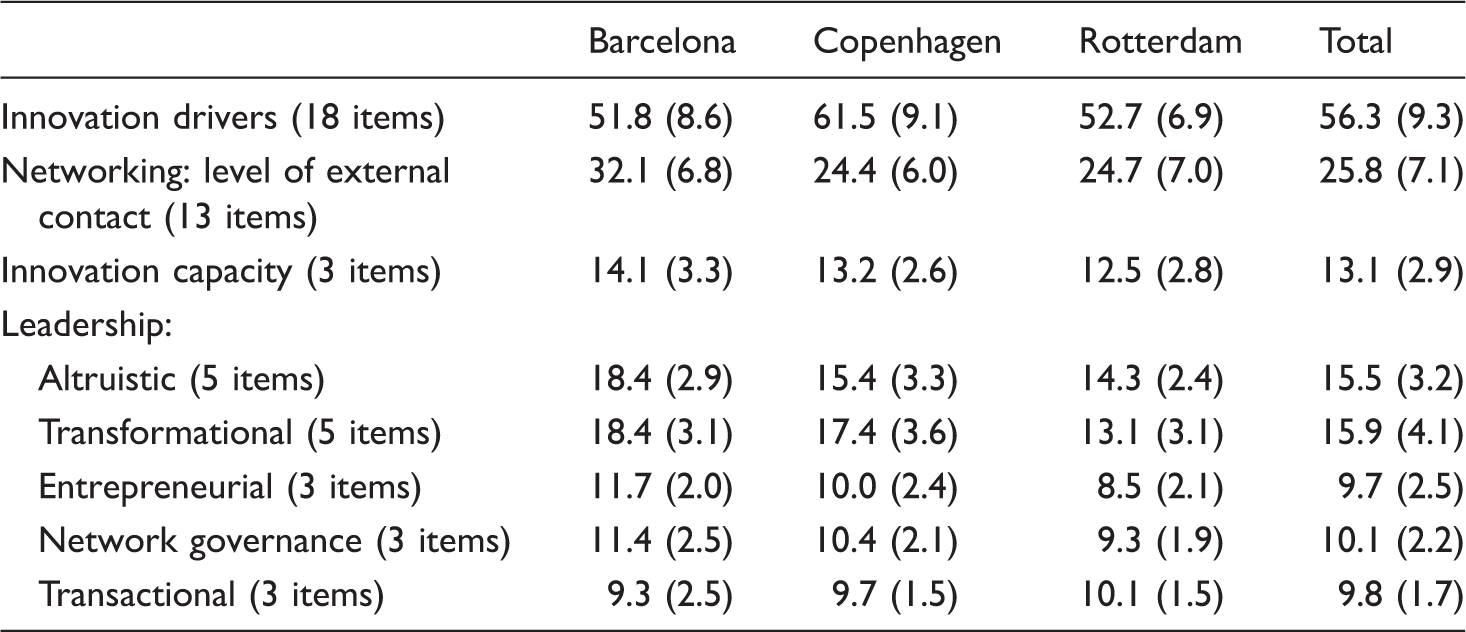
Note: Leadership scores for the five types are based on the 19 items emerging from the explanatory factor analysis pattern matrix (see Ricard et al., 2017).
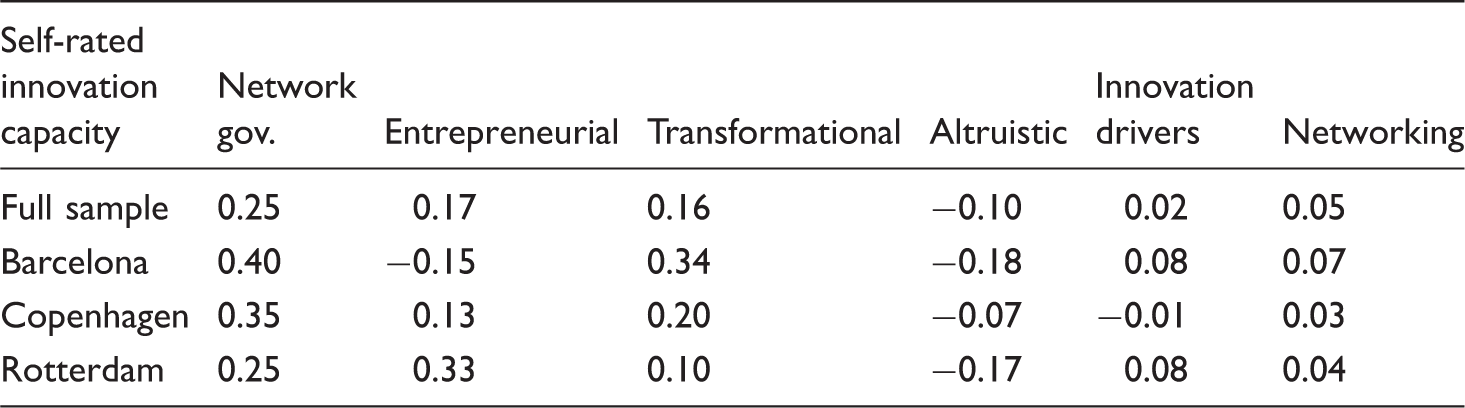
Correlations between innovation drivers, networking, leadership and innovation.
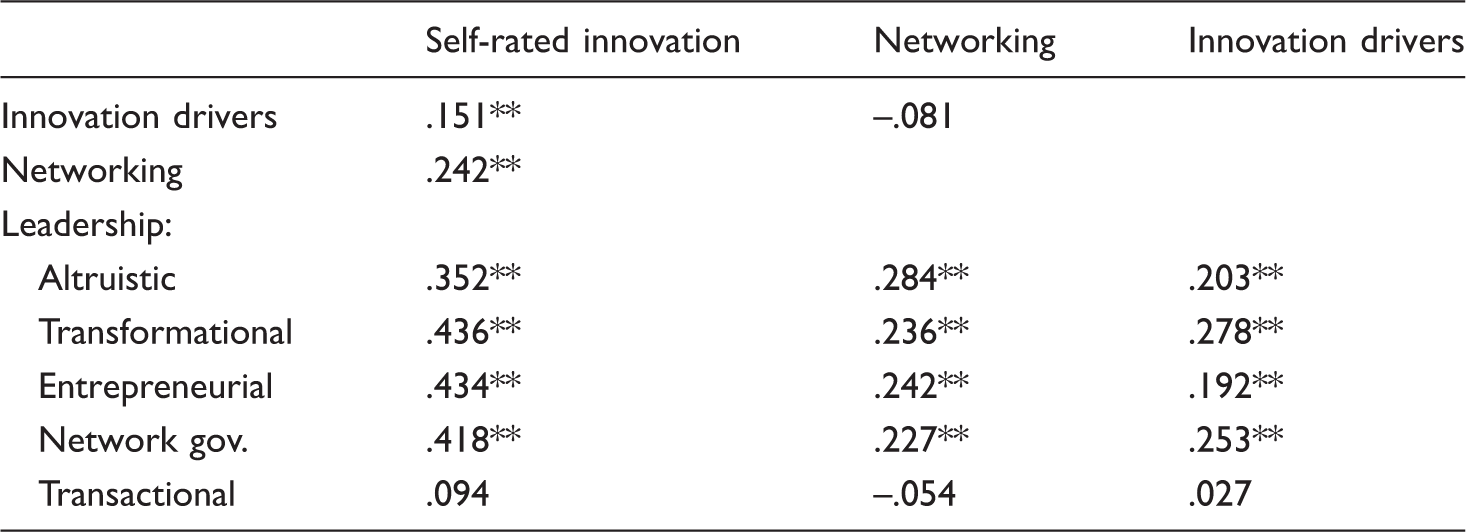
Notes: Spearman rank correlation coefficients. **Significant at p < 0.01.
Summing the scores for each of the individual leadership types produces scores that vary between 5 and 25 (altruistic and transformational) and 3 and 15 (entrepreneurial, network governance and transactional). As can be seen in Table 6, Barcelona has a substantially higher score on the altruistic leadership type than the other two cities. Barcelona also heads up the transformational type but is not much higher than Copenhagen, with Rotterdam substantially lower on this scale. This pattern is repeated for the entrepreneurial type. The scores are relatively close for all three cities on the network governance and transactional types. Barcelona scores the highest on all of the types except the transactional type.
Self-rated innovation capacity
A measure of self-rated innovation capacity was constructed from three items that were rated on a seven-point Likert scale (ranging from strongly disagree to strongly agree):
This municipality is innovative. My immediate colleagues are innovative. The division/department I work in is innovative.
Summing these three items gives a rating of innovation capacity that can vary between a minimum of 3 and a maximum of 21.
Barcelona’s score was the highest at 14.1 (see Table 6). The mean scores for Copenhagen and Rotterdam were lower and quite similar for self-rated innovation capacity, at 13.2 and 12.5, respectively. All of the cities rated themselves as above the midpoint of the scale (which, in this case, would be 10.5), indicating that the respondents to the survey, in general, see their municipalities as quite innovative but not extremely so.
Table 7 shows the correlation coefficients between each of the variables of interest for the three cities combined. As hypothesized, innovation drivers and leadership (four of the five types) are positively correlated, and networking and (four of the five types of) leadership are positively correlated. In addition, innovation drivers, networking and (four of the five) leadership types are all positively correlated with self-rated innovation capacity. One type of leadership – transactional – was not correlated with any of the other variables. Innovation drivers and networking were also not correlated with each other. We therefore did not include the transactional leadership type in the structural equation model, and we removed the path from innovation drivers to networking (shown in the conceptual model in Figure 1) from the empirical testing of the model.
Figure 2 shows the final structural equation model, which was run using the software AMOS 23. It has a very good fit in terms of eight of the most common fit indices (see Table 8) for each city and in total.
The structural equations model. Model fit statistical measures. Notes: CFI is comparative fit index; NFI is normed fit index; TLI is Tucker–Lewis index; IFI is Bollen’s incremental fit index; RMSEA is root mean square error of the approximation; CMIN/df in AMOS is the ratio of χ2 to degrees of freedom. GFI is the Goodness of Fit index.
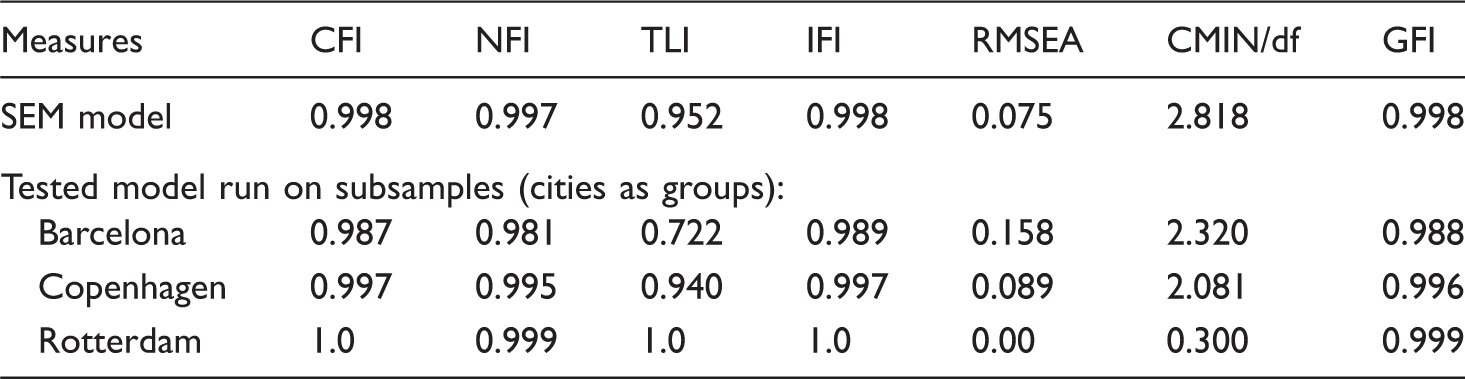
CFI, NFI, TLI and GFI should be close to or preferably higher than 0.90 to demonstrate an acceptable fit (Byrne, 1994). An IFI that exceeds 0.90 is regarded as acceptable (this index is relatively insensitive to sample size). It is also recommended that the RMSEA should be lower than 0.06, and definitely not exceed 0.08 (Hu and Bentler, 1995). However, it has been suggested that a score below 0.10 reflects an acceptable fit and below 0.08 is a good fit (see Byrne, 2012; Kline, 2010). A value of less than 5 for the CMIN/df (χ/df) ratio should be obtained (Schumacker and Lomax, 2004) and preferably less than 2 or 3 (Ullman, 2001). There is only one that falls short of the most stringent of measures – the RMSEA for Barcelona, which, at 0.075, is higher than 0.06 but lower than the more generous 0.08 upper limit.
Direct effects, standardized scores from structural equation models.
Discussion and conclusion
This article aimed to establish a conceptual model of innovation capacity, based on leadership, external networking and innovation drivers. A series of hypotheses were established:
Innovation drivers and external networking will both be positively associated with self-rated innovation capacity. Leadership types that support innovation will be positively associated with self-rated innovation capacity, networking and innovation drivers. Innovation drivers will be positively associated with networking.
Overall, these hypotheses were borne out by the data, with positive associations found between the variables as expected. The exception was that the association between networking and innovation drivers was absent (hypothesis 3). The structural equation models that were fitted for the combined data, and for each of the three cities individually, showed that leadership was the most important contributor to self-rated innovation capacity. The network governance type stands out in both Barcelona and Copenhagen, though the entrepreneurial type of leadership had the biggest perceived effect on innovation capacity in Rotterdam. Interestingly, the altruistic leadership type was negatively associated with self-rated innovation capacity in each of the cities. This is likely to be an effect of its relationship with the other leadership types. Different types of leadership appear to be more related to innovation capacity in different locations, but also several styles are seen as supporting innovation in the same location. The fact that innovation drivers and external networking are weaker determinants of self-rated innovation capacity than leadership signals a few important things about understanding innovation capacity. First, the role of agency (in this case, through leadership) in creating an environment within which people perceive that innovation is supported is important for innovation capacity. An understandable focus on innovation drivers (and, more often in studies of the public sector, innovation barriers), means that leadership is sometimes overlooked. Second, while many studies of innovation have a good deal to say about the importance of external relationships, the findings here indicate that having these contacts does not necessarily improve an individual’s view of how innovative the organization they work within is.
Related to this last point is the fact that much research on the relationship between networks (or collaboration, external engagement, etc.) and innovation, is often very unclear in regard to the meaning of ‘network’, how it is captured and how its link to innovation has been measured. It may be that a simple count of the frequency of external contact tells us a lot about the amount of time that administrators in city governments are spending talking to people outside the organization, but it might also tell us very little about the quality of those contacts in terms of gaining new and useful information that might support innovation.
Further, the lack of any association between external networking and innovation drivers reveals that the frequency of contact outside the organization might have little to do with perceptions of the structures, processes and contextual factors that drive innovation. It is possible that being highly engaged outside an organization has little relationship to an individual’s assessment of what helps innovation inside it. However, it would seem (theoretically) that knowing more about what is going on outside would lead to a better understanding of how structures, processes and contextual factors can be used in support of innovation inside an organization. Finally, all of the measures reported in this article are based on the perceptions and reported behaviours of the administrative staff who responded to the survey. We make no claims about assessments of levels of innovativeness of these cities, or about the generalizability of the findings here to other cities.
This article also points to some interesting future directions for research on innovation capacity. It highlights the importance of including leadership and other measures of agency in examinations of innovation. It also indicates that different types of leadership might be needed to support innovation capacity together in the same location, and in different locations. How we can better capture networks (e.g. by examining social networks and network structures) and how we can use these to understand the important links between networks, innovation drivers and innovation capacity is scrutinized in other research (Lewis et al., 2017).
Footnotes
Acknowledgement
Thanks to Tamyko Ysa for collecting the Barcelona data and making it available for this article.
Funding
This research was funded by the EU FP7 grant ‘Learning from Innovation in Public Sector Environments’ (no. 320090).