
Abstract
This article evaluates the performance of 3 industrialized nations that have pursued market-based financing models, focusing on equity in access to care, care quality, health status, and efficiency. It then assesses the consistency of the findings with those of different research teams. Using secondary data obtained from a semi-structured review of articles from 2000 to 2017, we discuss the hypothesis that commercial health care insurance is detrimental to accessing professional health care and to population health status. The results show that in 2010 the unmet care needs of both poor and rich Americans exceeded those of the poor in several industrial countries. The number of Dutch adults experiencing financial obstacles to health care quadrupled between 2007 and 2013, and 22% of Swiss adults reported skipping needed care in a 2016 survey. The most negative impacts of “managed care” on care quality are its tight constraints on physicians’ professional autonomy; a large reliance on the physicians’ material motivation; health service fragmentation; and the tendency to apply evidence-based medicine too rigidly. Countries with a commercial insurance monopoly generally remained above the maternal, infant, and neonatal mortality rates versus the health-spending regression line. We conclude that the most inefficient system is where the insurance market has achieved its maximal development and that care industrialization contributes to the comparatively poor performance of the U.S., Dutch, and Swiss health systems.
Keywords
This article evaluates the performances of 3 industrial nations that have pursued market-based financing models, with the analysis focusing on equity in access to care, care quality, health status, and efficiency. It then assesses the consistency of the findings with those of different research teams.
Insufficient access to professionally delivered health care leads to excess mortality and morbidity related to patients’ and doctors’ delays in detection and treatment, worse disease-specific prognosis, and reduced health care continuity.
“If,” wrote Nolte and McKee, “the U.S. could reduce amenable mortality to the average rate achieved in the 3 top-performing countries, there would have been 101,000 fewer deaths per year by the end of the study period” 1 – and 75,000 if it were reduced to the OECD average. Conversely, if Europe aligned itself with U.S. performances, it could lose up to 107,000 or 125,000 lives annually from mortality amenable to care, using the OECD average or those of the 3 top-performing countries, respectively.
Reflecting a history of failed attempts to achieve compulsory national health insurance,
2
the United States can be said to be a full-fledged, though still growing, health market for the following reasons:
The vast majority of solvent Americans have private insurance, but most of the poor, elderly, and chronically ill are state-insured or uninsured (14.6% of adults were uninsured in 2008, 18% in 2013, and 10.9% in 2016, while the rate today is on the rise again). Public insurance programs covering the poor and the elderly largely contract care out to profit-making entities.
3
In 2011, 57% of Medicaid beneficiaries were enrolled in private managed-care organizations.
4
In October 2016, the share of Medicaid beneficiaries enrolled in managed-care organizations exceeded 75% in 28 states.
5
Between 2005 and 2017, the proportion of Medicare beneficiaries enrolled in private health plans increased from 5.6% to 19%.
6
The 1989–2019 growth rate of the U.S. health sector is the highest worldwide. This is a commercial objective of insurance companies, since they strive to maximize both the amount of public funding for commercial services and family health insurance premiums.
Switzerland and the Netherlands also organized health care insurance as a market in 1996 and 2006, respectively. Germany and France have increasingly been marketing health care financing for the wealthy (10% of Germans today have private health insurance). Although most E.U. countries maintained a dominant publicly oriented health system (Bismarck or Beveridge system), these became underfinanced after the 2008 crisis (particularly the Beveridge systems like Spain and the United Kingdom), which triggered strikes by health staff and patients across the continent.
In South America, Colombia (1993) and Chile (1981) largely privatized health care insurance plans, although Chile also kept strong public health care services. Colombia failed to secure equitable access to health care.7,8 The good achievements of Chile were related to the public health care services that served 84% of the population. 9 In 2002, Costa Rica, then a middle-income country (MIC) with quasi-monopolistic public health care services, had the same maternal mortality rate as the United States although it spent 9 times less on health per capita. 10 Thus the poor public health achievements of Colombia (for instance, maternal mortality rate, MMR, increased from 81 to 85/100,000 between 1995 and 2010) cannot be attributed to its MIC status.
Scientists and multilateral agencies have for decades compared the U.S. and E.U. health systems’ performances using criteria such as equity of access to care, 11 mortality amenable to care 1 and financial accessibility, 12 disease-specific early detection and survival, and costs. They have unanimously concluded that the U.S. system is less efficient and provides worse access to care and impact on health than West European systems. The mechanisms behind the E.U. and U.S. disparities, however, remain a matter of debate as Dutch and Swiss health insurance reforms are now presented as public health success stories, although with contradictions in rankings between sources.13–15 Using secondary data, we discuss the hypothesis that commercial health care insurance is detrimental to accessing professional health care and to health systems’ efficiency and consequently population health status.
Materials and Methods
We conducted a semi-structured review of articles published in English between 2000 and 2017 with a focus on public and private health insurance. Specifically, we searched the Discovery Service of the Institute of Tropical Medicine Antwerp for peer-reviewed publications with a focus on state and private health insurance. We used the medical subject headings “insurance health discrimination,” “barriers to health insurance,” “health care spending,” “health expenditures,” “prepaid health plans,” “health/ethics,” “private sector/ethics,” “Caesarean cost,” “privatization/trends,” “referral and consultation,” and “state medicine/organization and administration,” limiting our search to articles published in English between 2000 and 2017. To compare health systems, we used Gapminder data drawn from the OECD’s 2012 and 2018 health data sets, the Commonwealth Fund Health Survey (2010 and 2016), the 2012 WHO Global Health Expenditure Database, and the Netherlands 2017 16 and Switzerland 2015 17 country health profiles.
Discussion
Equity in Access to Care
Actuarial management is a distinctive feature of commercial health insurance plans because their financial viability is inversely proportionate to their clients’ health risks. In theory, client selection by health insurance companies is not permitted in the Netherlands. This section discusses how actuarial management and commercial managed care cause mortality amenable to care.
Our hypothesis is that less solidarity in health financing reduces overall access to care and increases mortality and morbidity amenable to care. Commercial health insurance companies cause inequity in access to care because actuarial management of disease and health risk does not allow for solidarity between rich and poor, 18 healthy and sick, men and women, young and old, and high and low health risks because the rich, the healthy, the young, and the male define the profitable health market segment.
A 2004 OECD report already related inequity in access to specialists and pro-rich bias among member countries to the use of private health insurance and providers. 19 Here is the probable mechanism whereby commercial insurance lowers access to care and increases mortality amenable to care:
In the United States, unprofitable patients groups are predominantly covered by public plans (i.e., Medicaid for the poor and Medicare for the elderly) because insurance companies exclude unprofitable patients either directly by refusing coverage or indirectly by charging very high premiums;18,20–23 they often restrict coverage for preexisting medical conditions 24 (a practice addressed by the Affordable Care Act (Obamacare) that has now been partially reinstated by the Trump administration); and they frequently leave patients with unaffordable out-of-pocket costs. Private insurers often leave patients with the most expensive conditions uncovered. Premiums generally rise with age, 25 and high deductibles and co-payments often restrict the use of medical services. 26 Finally, bureaucratic itineraries for the authorization of care, whether they entail medical audits or not, lead to patient and doctor delays. These obstacles to access to care implemented by commercial insurance are also observed in MICs. 27
Mechanisms whereby health insurance markets strain referred patients’ access to hospitals are related to the fragmentation of health services, which also hampers access to primary care (for instance, straining teamwork while creating obstacles to the appropriate geographical distribution of health professionals). 28
In the United States and Colombia, the middle class often votes to reduce government spending on health, as they do not benefit much from it. During the last 25 years, the proportion of government spending on total expenditure on health care in the United States was the lowest of industrial countries (remaining below 65%, 29 compared with more than 75% in most western European countries). The U.S. health care system tends to exacerbate income-based disparities in health. 30 Over the last 30 years, the number of Americans with no insurance at all has been a steadily rising (with a temporary improvement during the Obamacare period), which stood at 28.9 million in January–September 2017. 31
In 2006–2007, mortality amenable to care was higher in the United States than in any other OECD industrial country (Figure 1), and this continues to hold true. 13
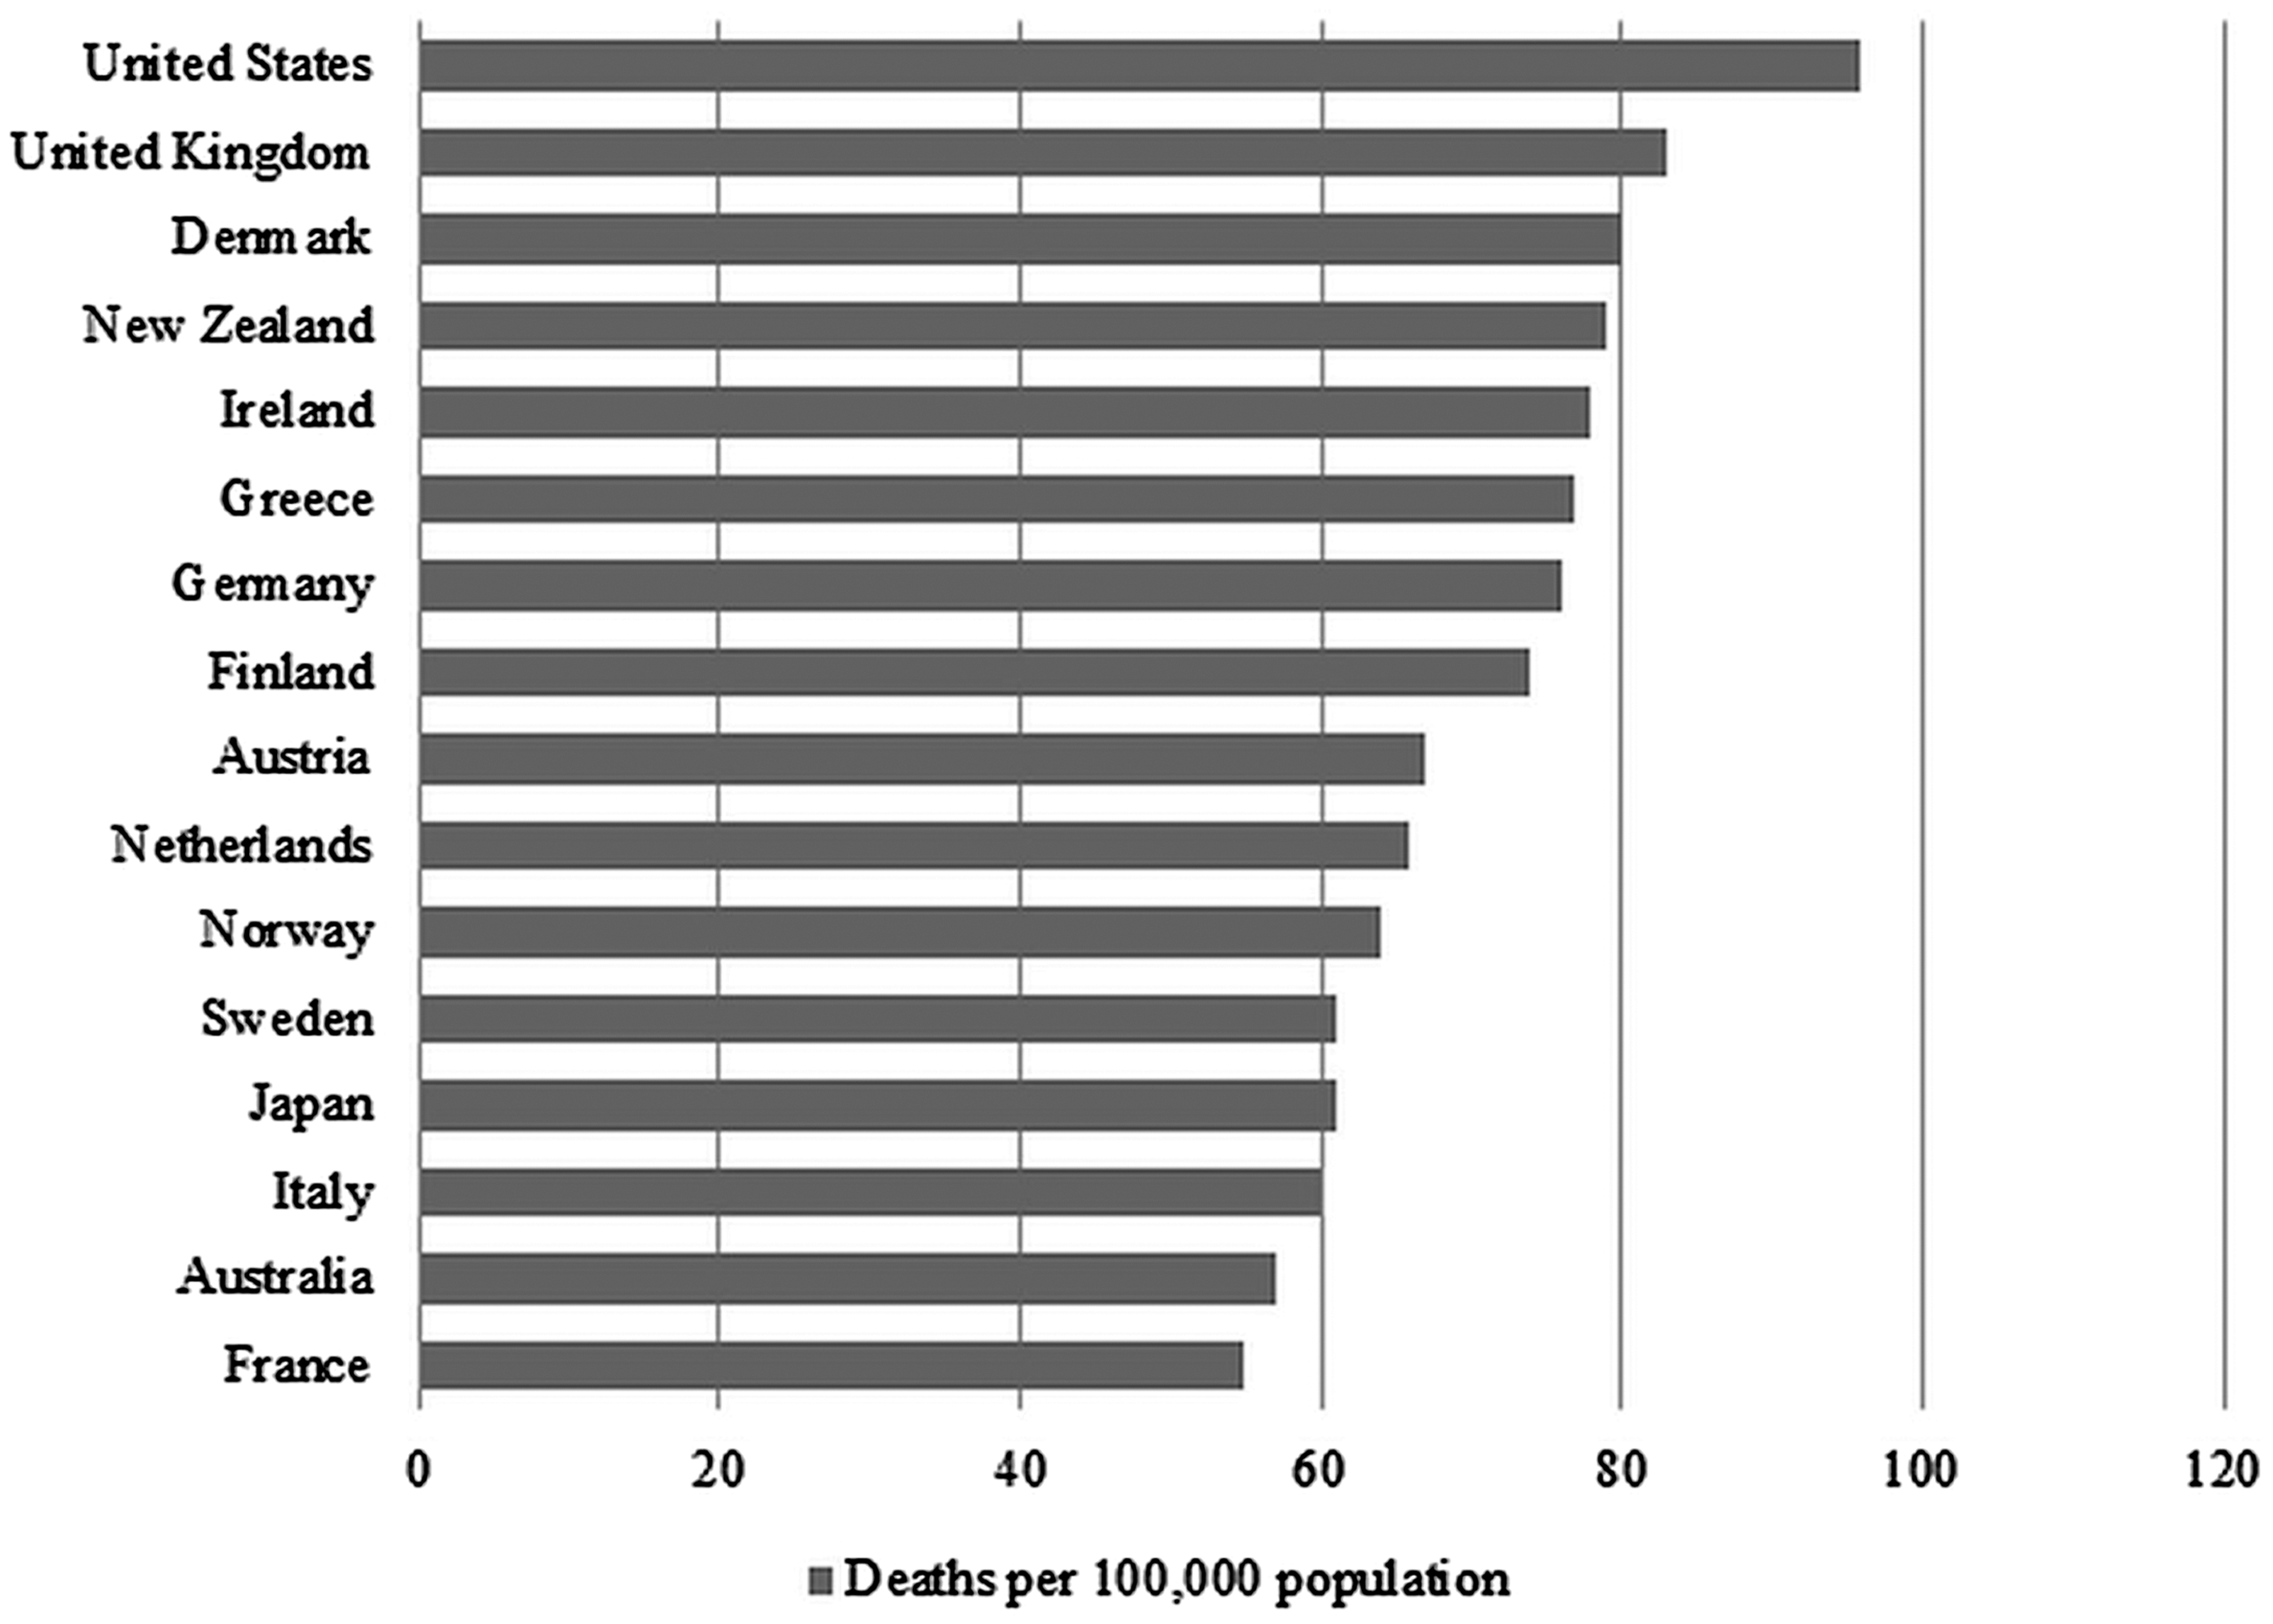
Mortality amenable to health care, 2006–2007. Note: Countries’ age-standardized death rates before age 75 years, including ischemic heart disease, diabetes, stroke, and bacterial infections. Analysis of World Health Organization mortality files and CDC mortality data for the United States. Source: Adapted from Nolte E, McKee M. “Variations in amenable mortality trends in 16 high-income nations.” Health Policy 2011;103(1):47–52.
In 2010, poor Americans had twice the unmet care needs of Americans with above-average incomes and 10 times more than the U.K. poor. The unmet care needs of the rich in the United States exceeded those of the poor in the United Kingdom, Canada, Sweden, and France (Figure 2).
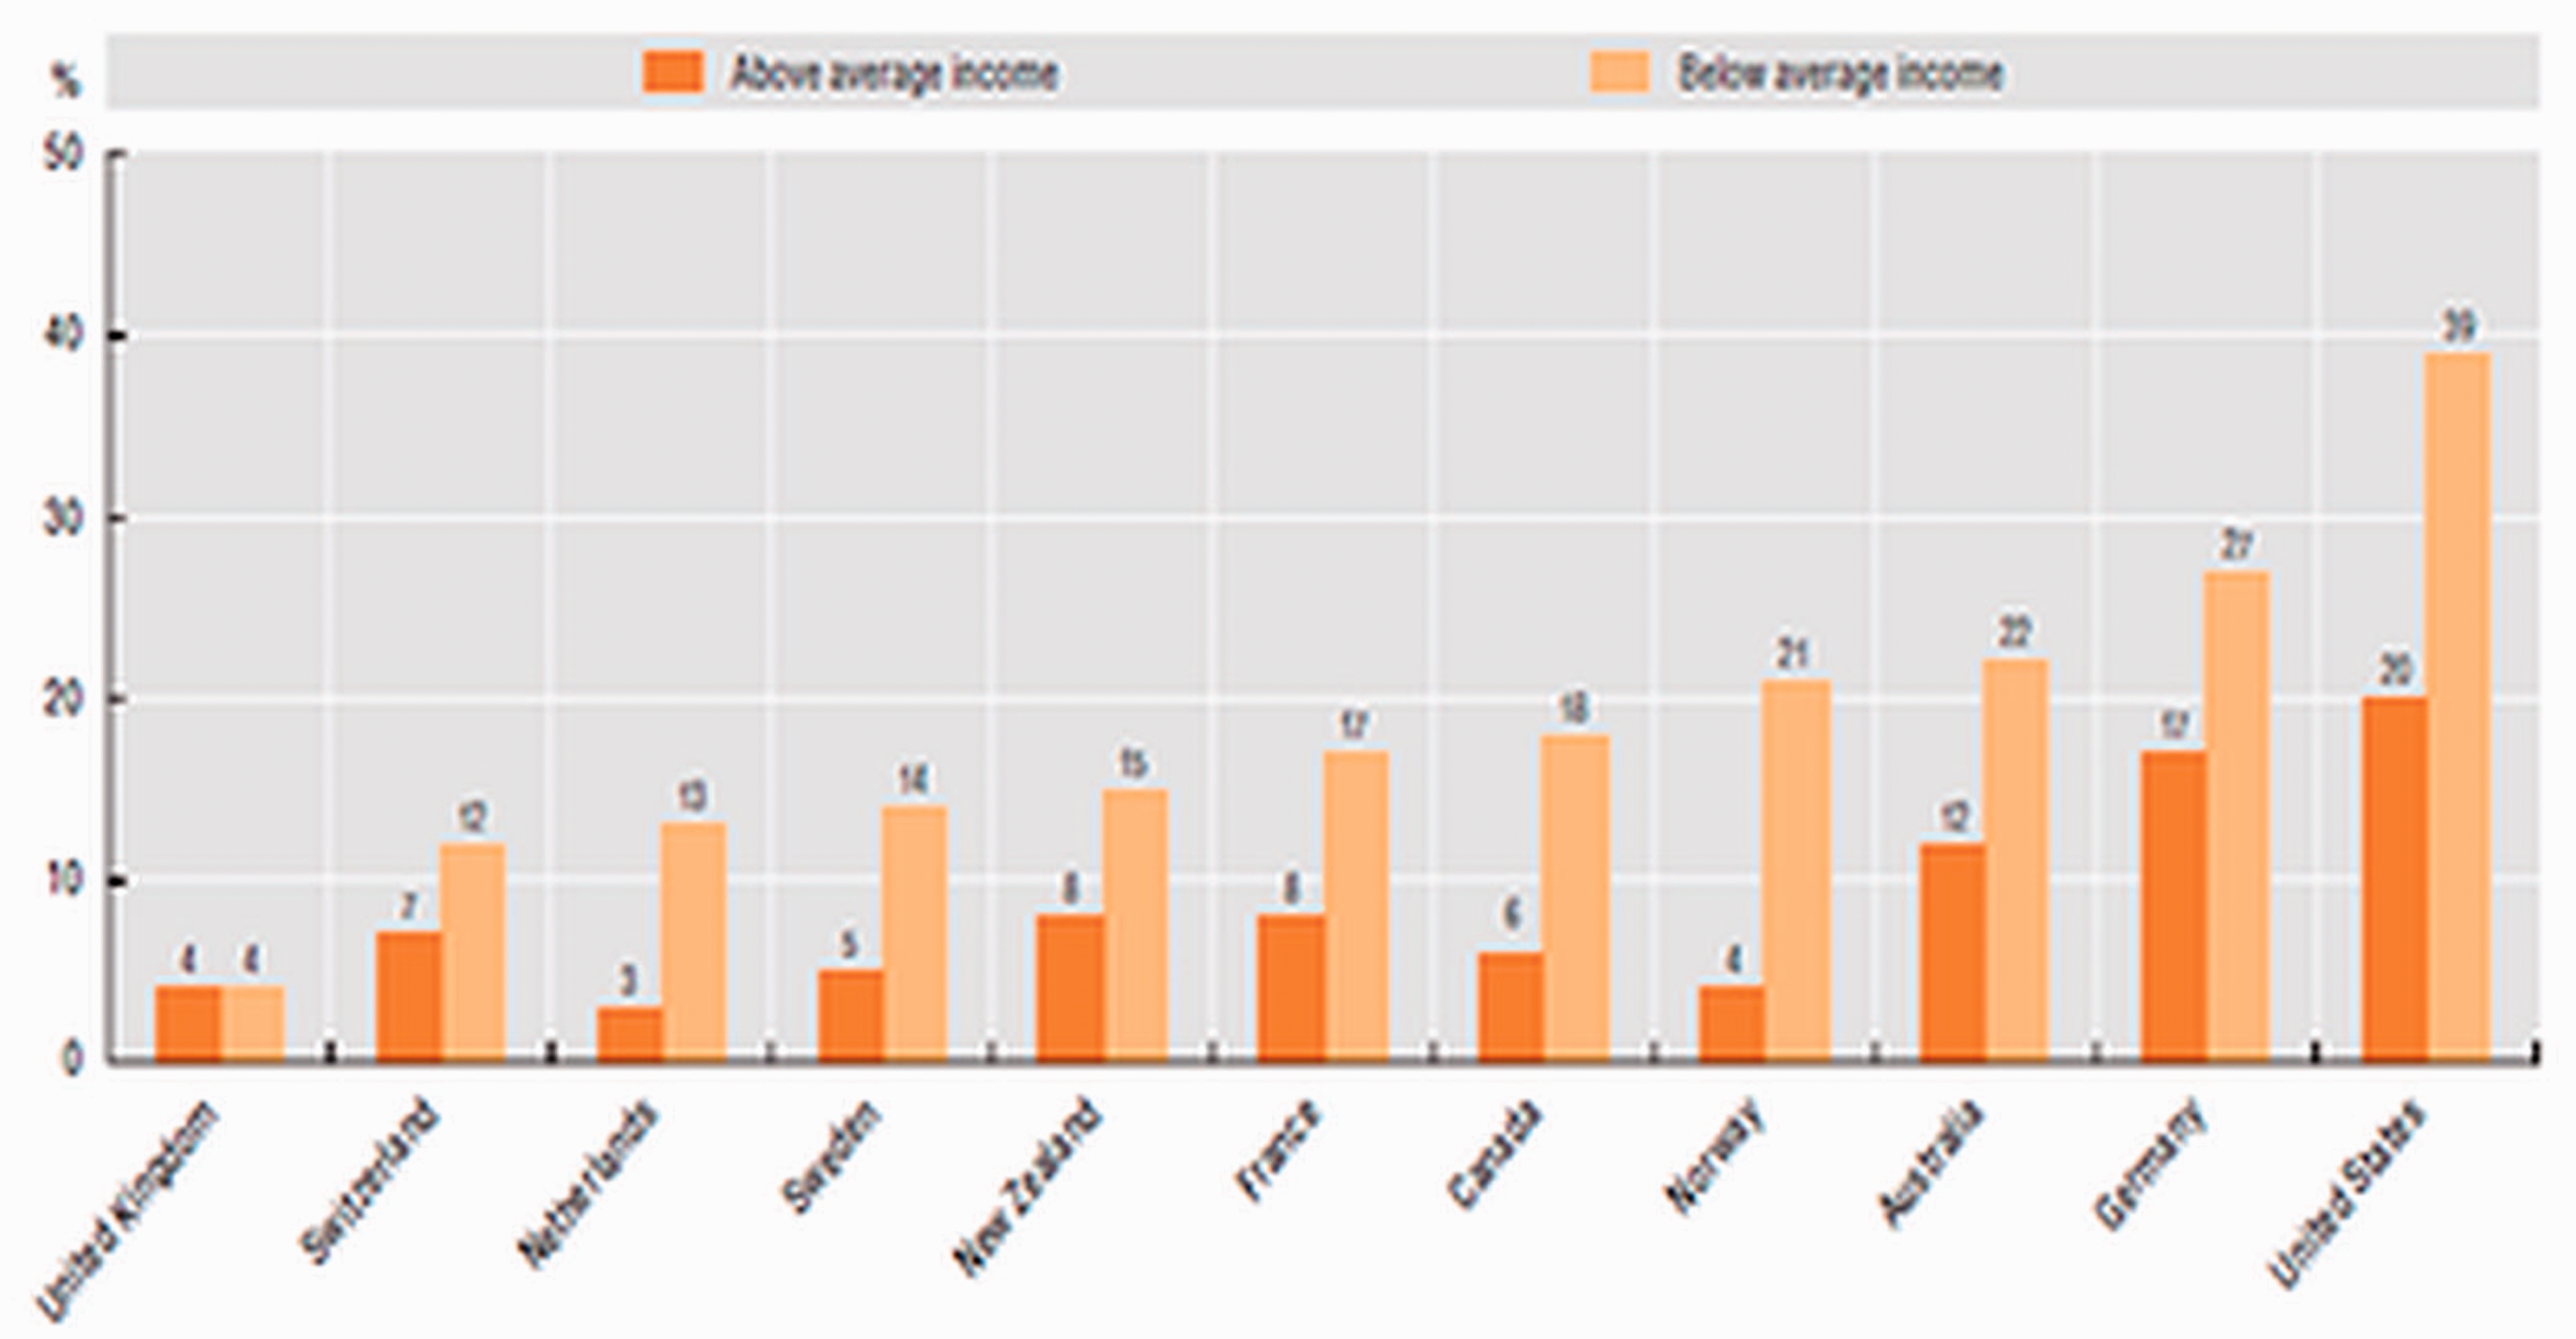
Unmet care needs due to costs in 11 OECD countries by income group, 2010. Note: Unmet care defined as “Either did not visit doctor with medical problem, did not get recommended care, or did not fill/skipped prescription.” Source: Commonwealth Fund (2010).
The frequency of visits to doctors is consistent with these observations. Sweden was the only high-income country (HIC) to have had fewer doctors’ visits per capita than the United States over 2005–2012 (Figure 3). However, Sweden has a system of nurses, trained like general practitioners (GPs), who have gatekeeping functions and pay home visits. It is possible that this characteristic contributes to the emergency utilization rate in Sweden, which is the highest in Europe. 32
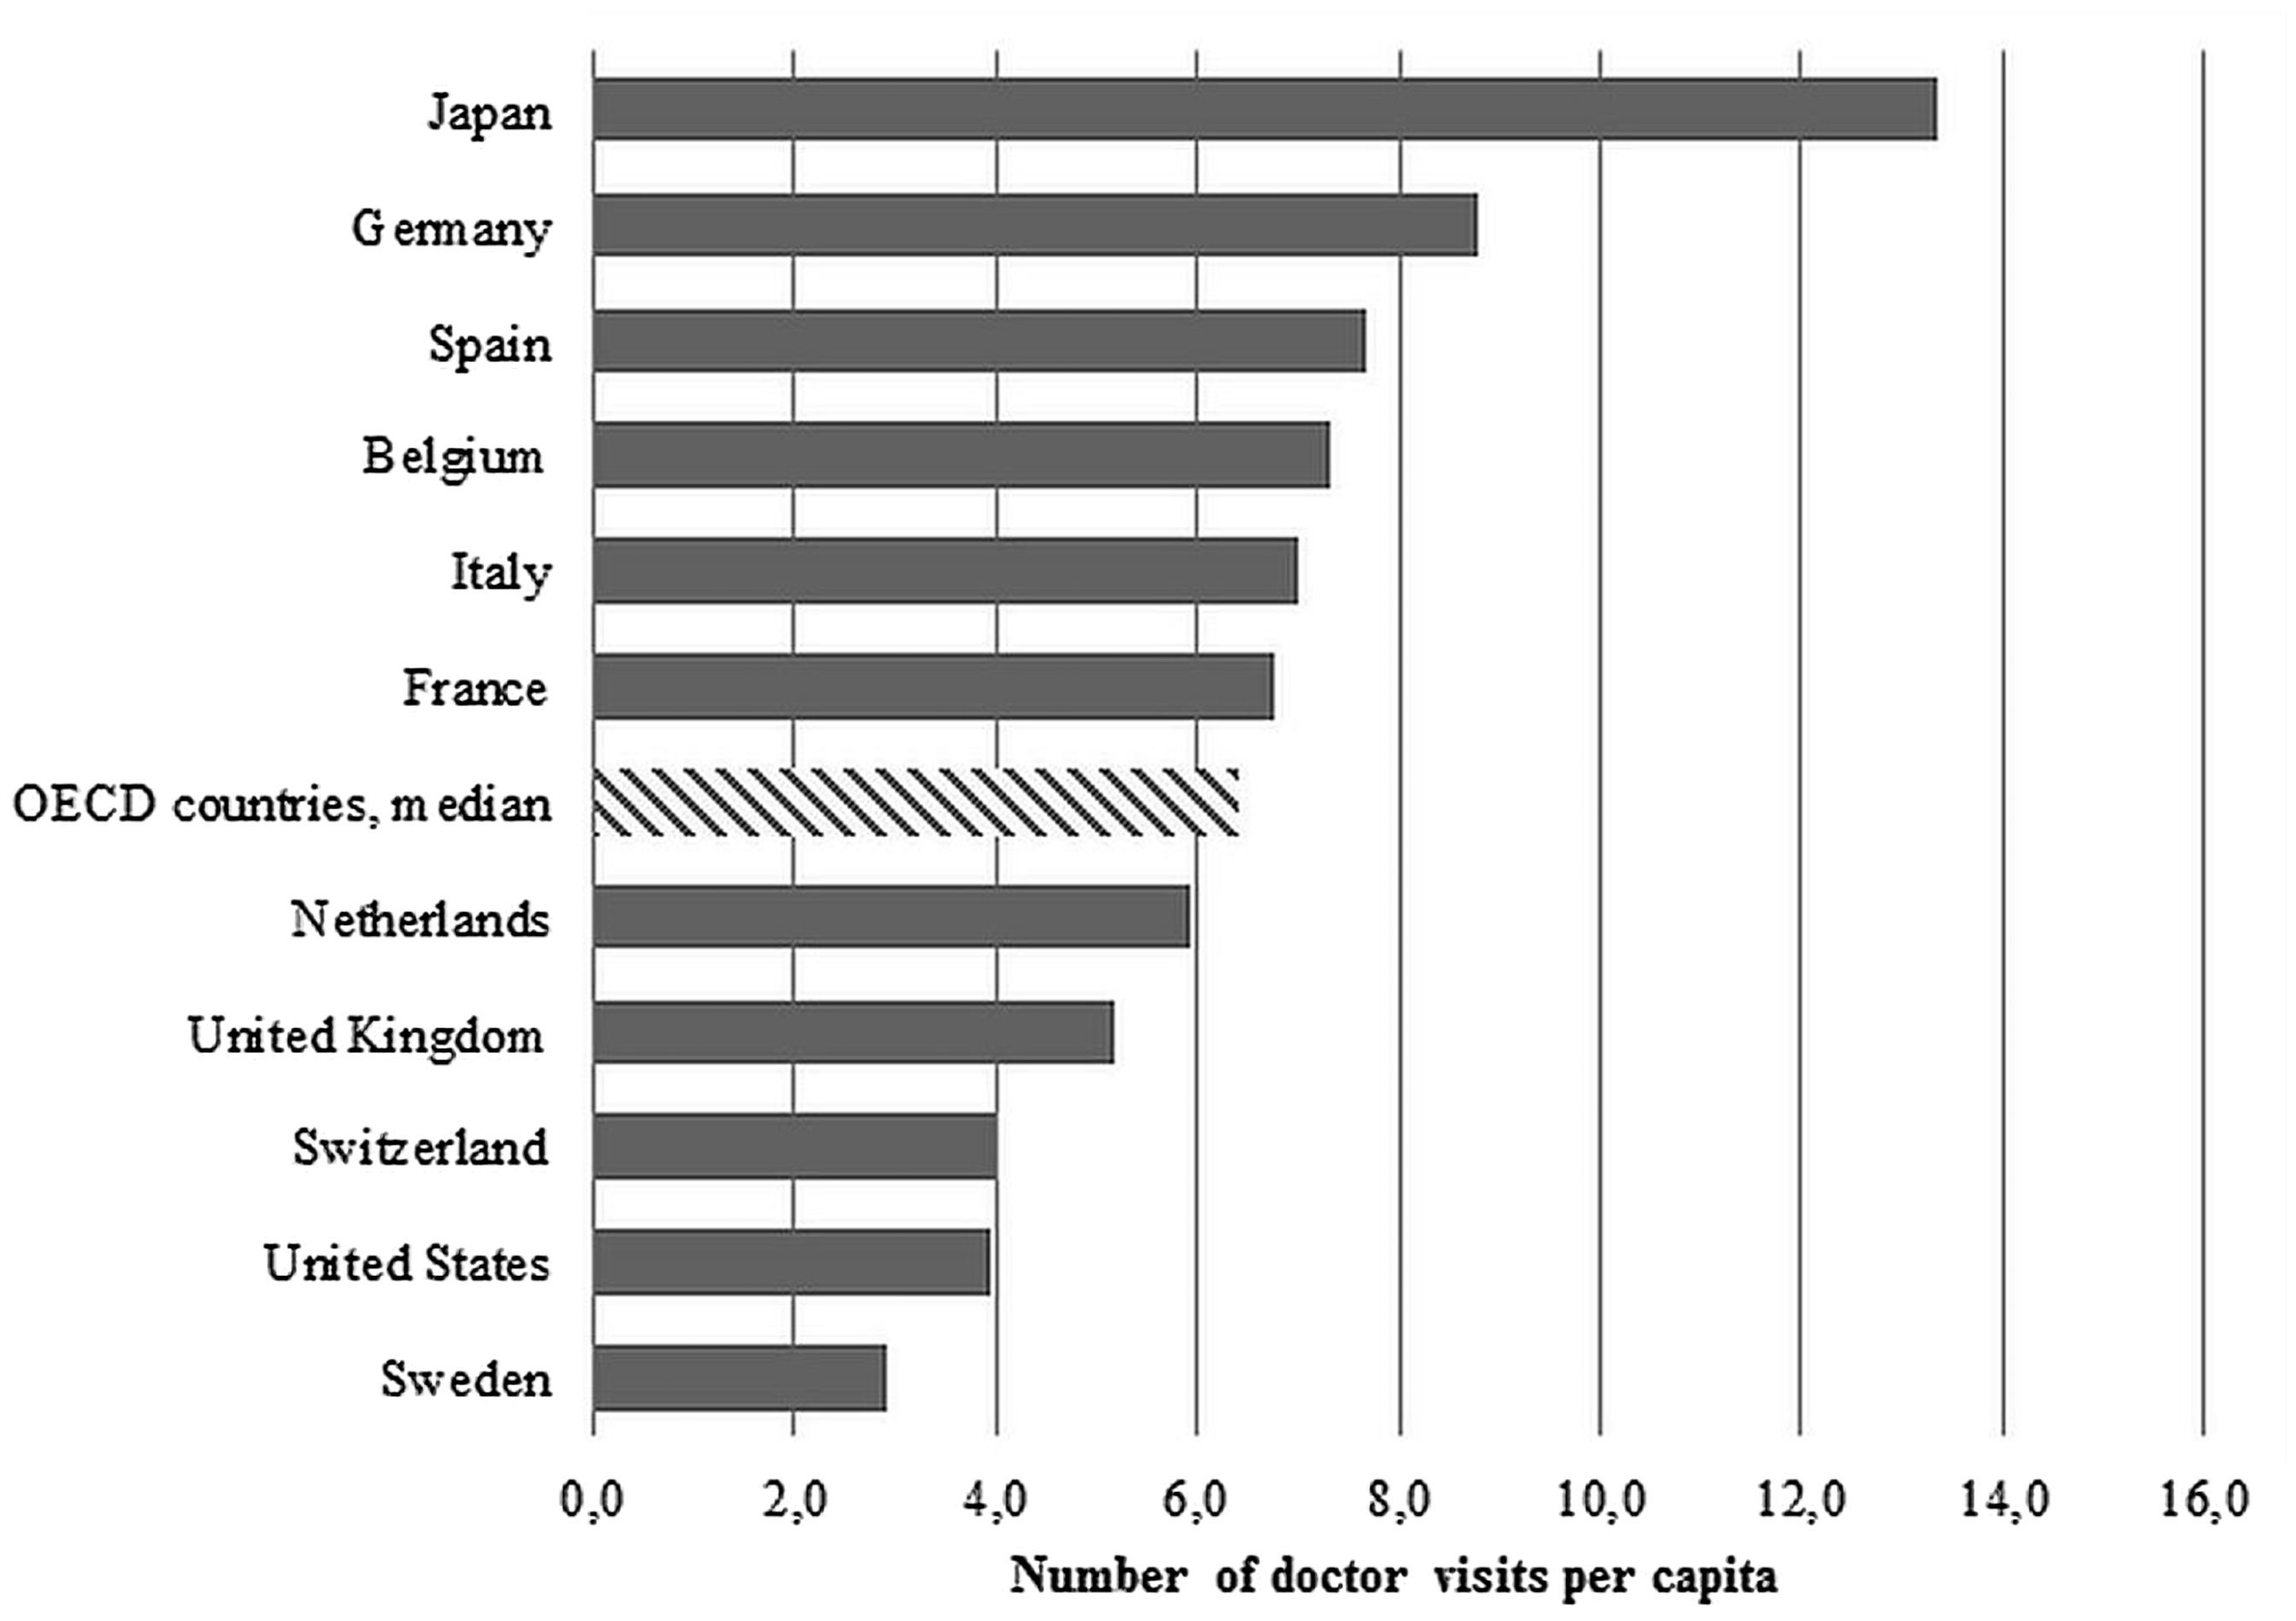
Average annual number of doctors’ visits per capita, 2005–2012. Note: Number of doctors’ visits averaged over 2005–2012. Source: Data from the Organisation for Economic Co-operation and Development (OECD), 2014. http://stats.oecd.org/
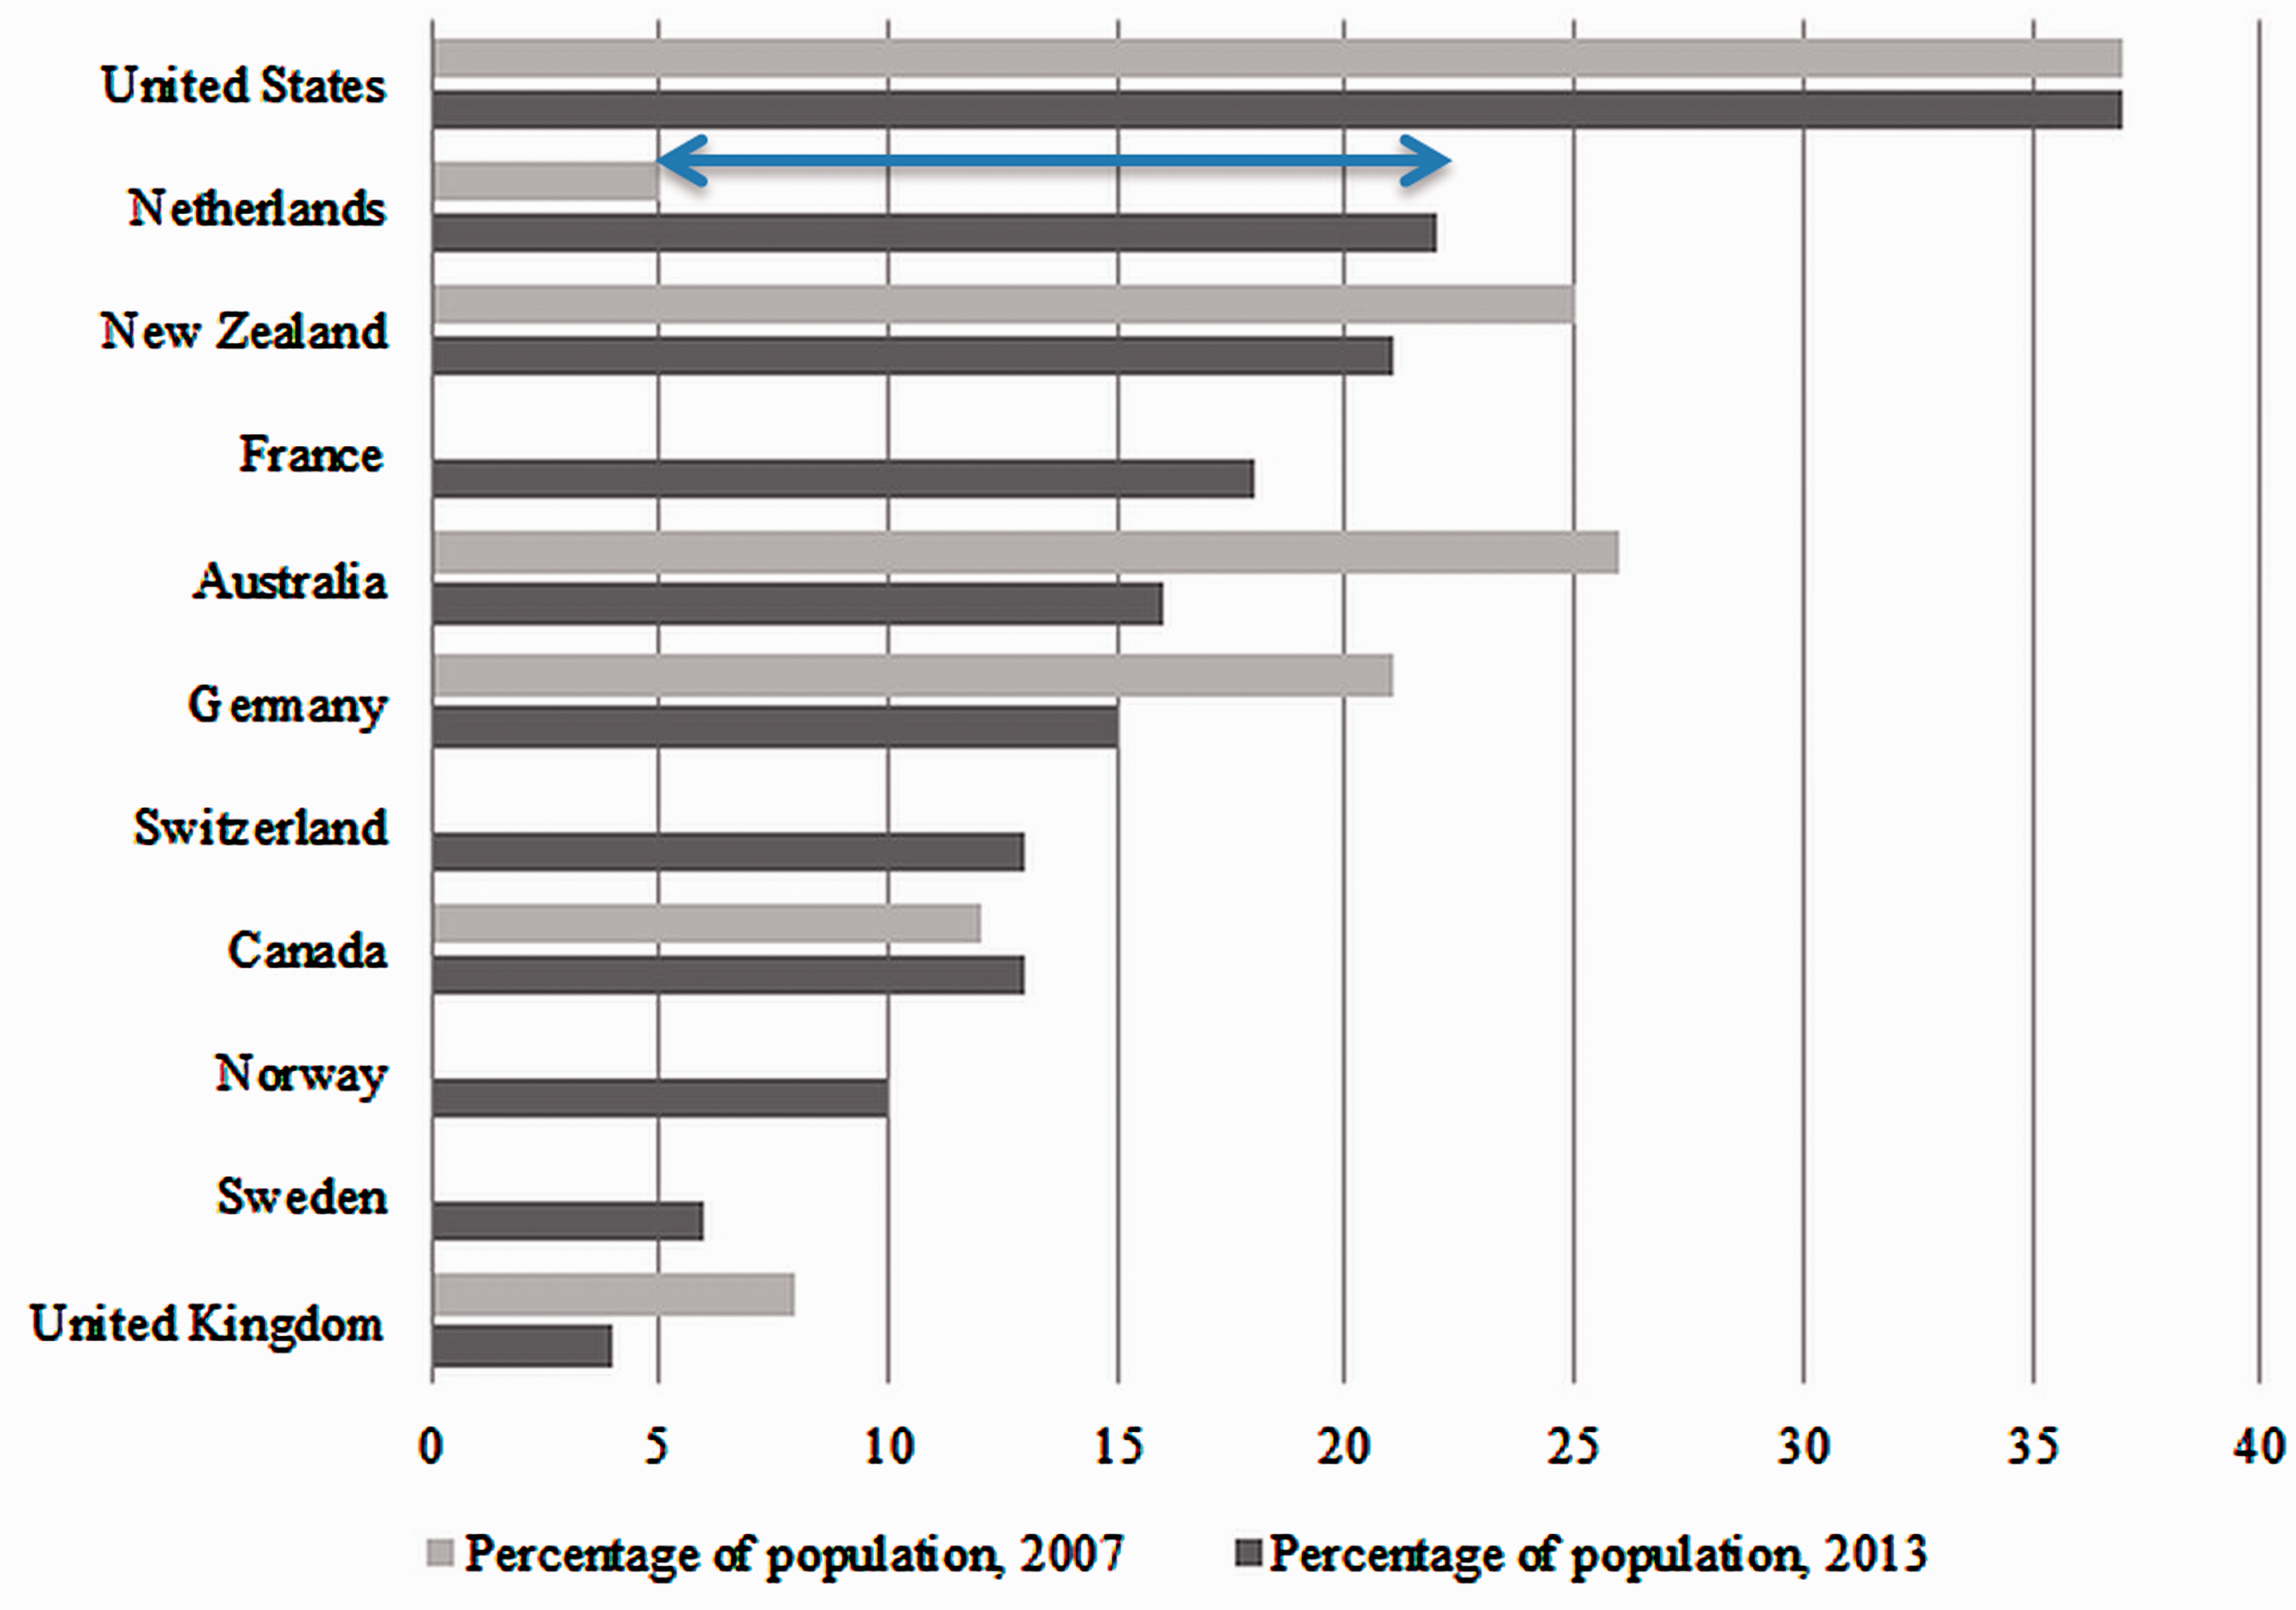
Experienced cost-related access problem, 2007 and 2013. Notes: Access problem defined as “did not fill/skipped prescription, did not visit doctor with medical problem, and/or did not get recommended care.” Adults age 18 years and older. No 2007 data available for France, Switzerland, Norway, and Sweden. Source: The Commonwealth Fund. 2014. Interactives and data. http://www.commonwealthfund.org/interactives-and-data/international-survey-data
Over 2005–2012, Switzerland had quite a low number of annual doctor’s visits per capita (Figure 3). 33 In 2012, the Swiss paid 3.9 yearly visits to doctor per capita and Americans paid 4 (2011), compared with 6.8 in Belgium (2015) and 10 in Germany (2015). 34 This figure chiefly reflects GP visits, especially in systems where GPs are gatekeepers, such as the Dutch system.
The history of Holland and Switzerland reveals a chronological association between insurance market maturation and deterioration of access to care.
Over 2005–2012, the number of annual doctors’ visits per capita in the Netherlands was only slightly below the OECD median (Figure 3). However, since 2006, the country’s unmet care needs have been rising. The number of Dutch experiencing financial obstacles to health care quadrupled between 2007 and 2013 (Figure 4). Admittedly, these data contradict those of the European Observatory 2017 report,
16
which put unmet medical needs at only 0.4%, against 2.4% for the European Union (see below). In a 2011 population-based cross-sectional survey, up to 14.5% of the Swiss had to forgo health care.
35
The country ranked second worst in a 2016 survey of 11 countries, just ahead of the United States, with 22% of Swiss adults likely to skip needed care in 2016.36 The 2015 Switzerland health system review put the unmet needs of the poor at 3%, much higher than in the Netherlands.
17
Being the second least accessible health care system in the Commonwealth study required Switzerland to be the second most expensive health system (preceded by the United States – see below).
Care Quality
The commercial status of health insurance also alters care quality and does so more than the hospital’s status because, we contend, health insurance is in a position to enforce its commercial mission even in nonprofit hospitals.
For instance, of the 5,534 hospitals in the United States in 2018, 87% were community hospitals, with investors owning only 21% of the latter. 37 If the profit-imperative imposed on hospitals by the market-driven policies generally is to blame in their warped behavior, 38 their medical practice was also submitted to the rationale of insurance companies (for-profit “managed care”) by the virtue of ad hoc contracts, “preferred provider” status, and integration in HMOs.
The most negative impacts of “managed care” on care quality lie in its
Tight constraints on physicians’ professional autonomy,
39
whereas this autonomy should be sufficient for health care to be biopsychosocial, for treatments to be negotiated between physician and patient, and for (Hippocratic) ethics to be relevant to practice Central reliance on the material motivation of physicians, for example, with fee-for-service, pay-for-performance, payment mix, and other plans; in contrast, steering the physicians’ empathy and refraining them from exploiting the doctor-patient information asymmetry requires strategies to boost their symbolic motivation. Induction of health service fragmentation, which makes communication, clinical coordination, continuous medical education, and evaluation over institutional divides difficult.
7
Tendency to make the application of evidence-based medicine too rigid and commercial.
40
Besides, without strong state incentives, private insurers have little interest in health promotion or disease prevention when competition encourages frequent switching between insurers. 41 Prevention then has to be organized in public services as ineffectual vertical programs, ineffectual because they are structurally split from care delivery. 42
The United States is the industrialized country that redistributes health-financing least, with less than 50% being government funds. It is also the industrial country with the worst public health achievements. The above 2017 Lancet study classified the United States 35th on a health care access and quality index, just ahead of much poorer Montenegro, Lebanon, Hungary, and Poland. 13 Poor care quality is likely a co-factor of this poor performance, at the side of inequitable access to care.
Health Status
In low- and middle-income countries (LMIC), MMR is an indicator of access to the entire health services pyramid because lowering it requires a large array of facilities. 43 In industrial countries, maternal and child health programs and policies made possible by a strong health infrastructure cause these indicators to lose their ability to reflect access to care in the health pyramid (this is why below 40/100,000, MMR does not mirror general access to decent-quality health care well). 44
The U.S. maternal mortality rate has surpassed those of the other wealthy nations since 2000 and tends to deviate from the regression line (Figure 5).
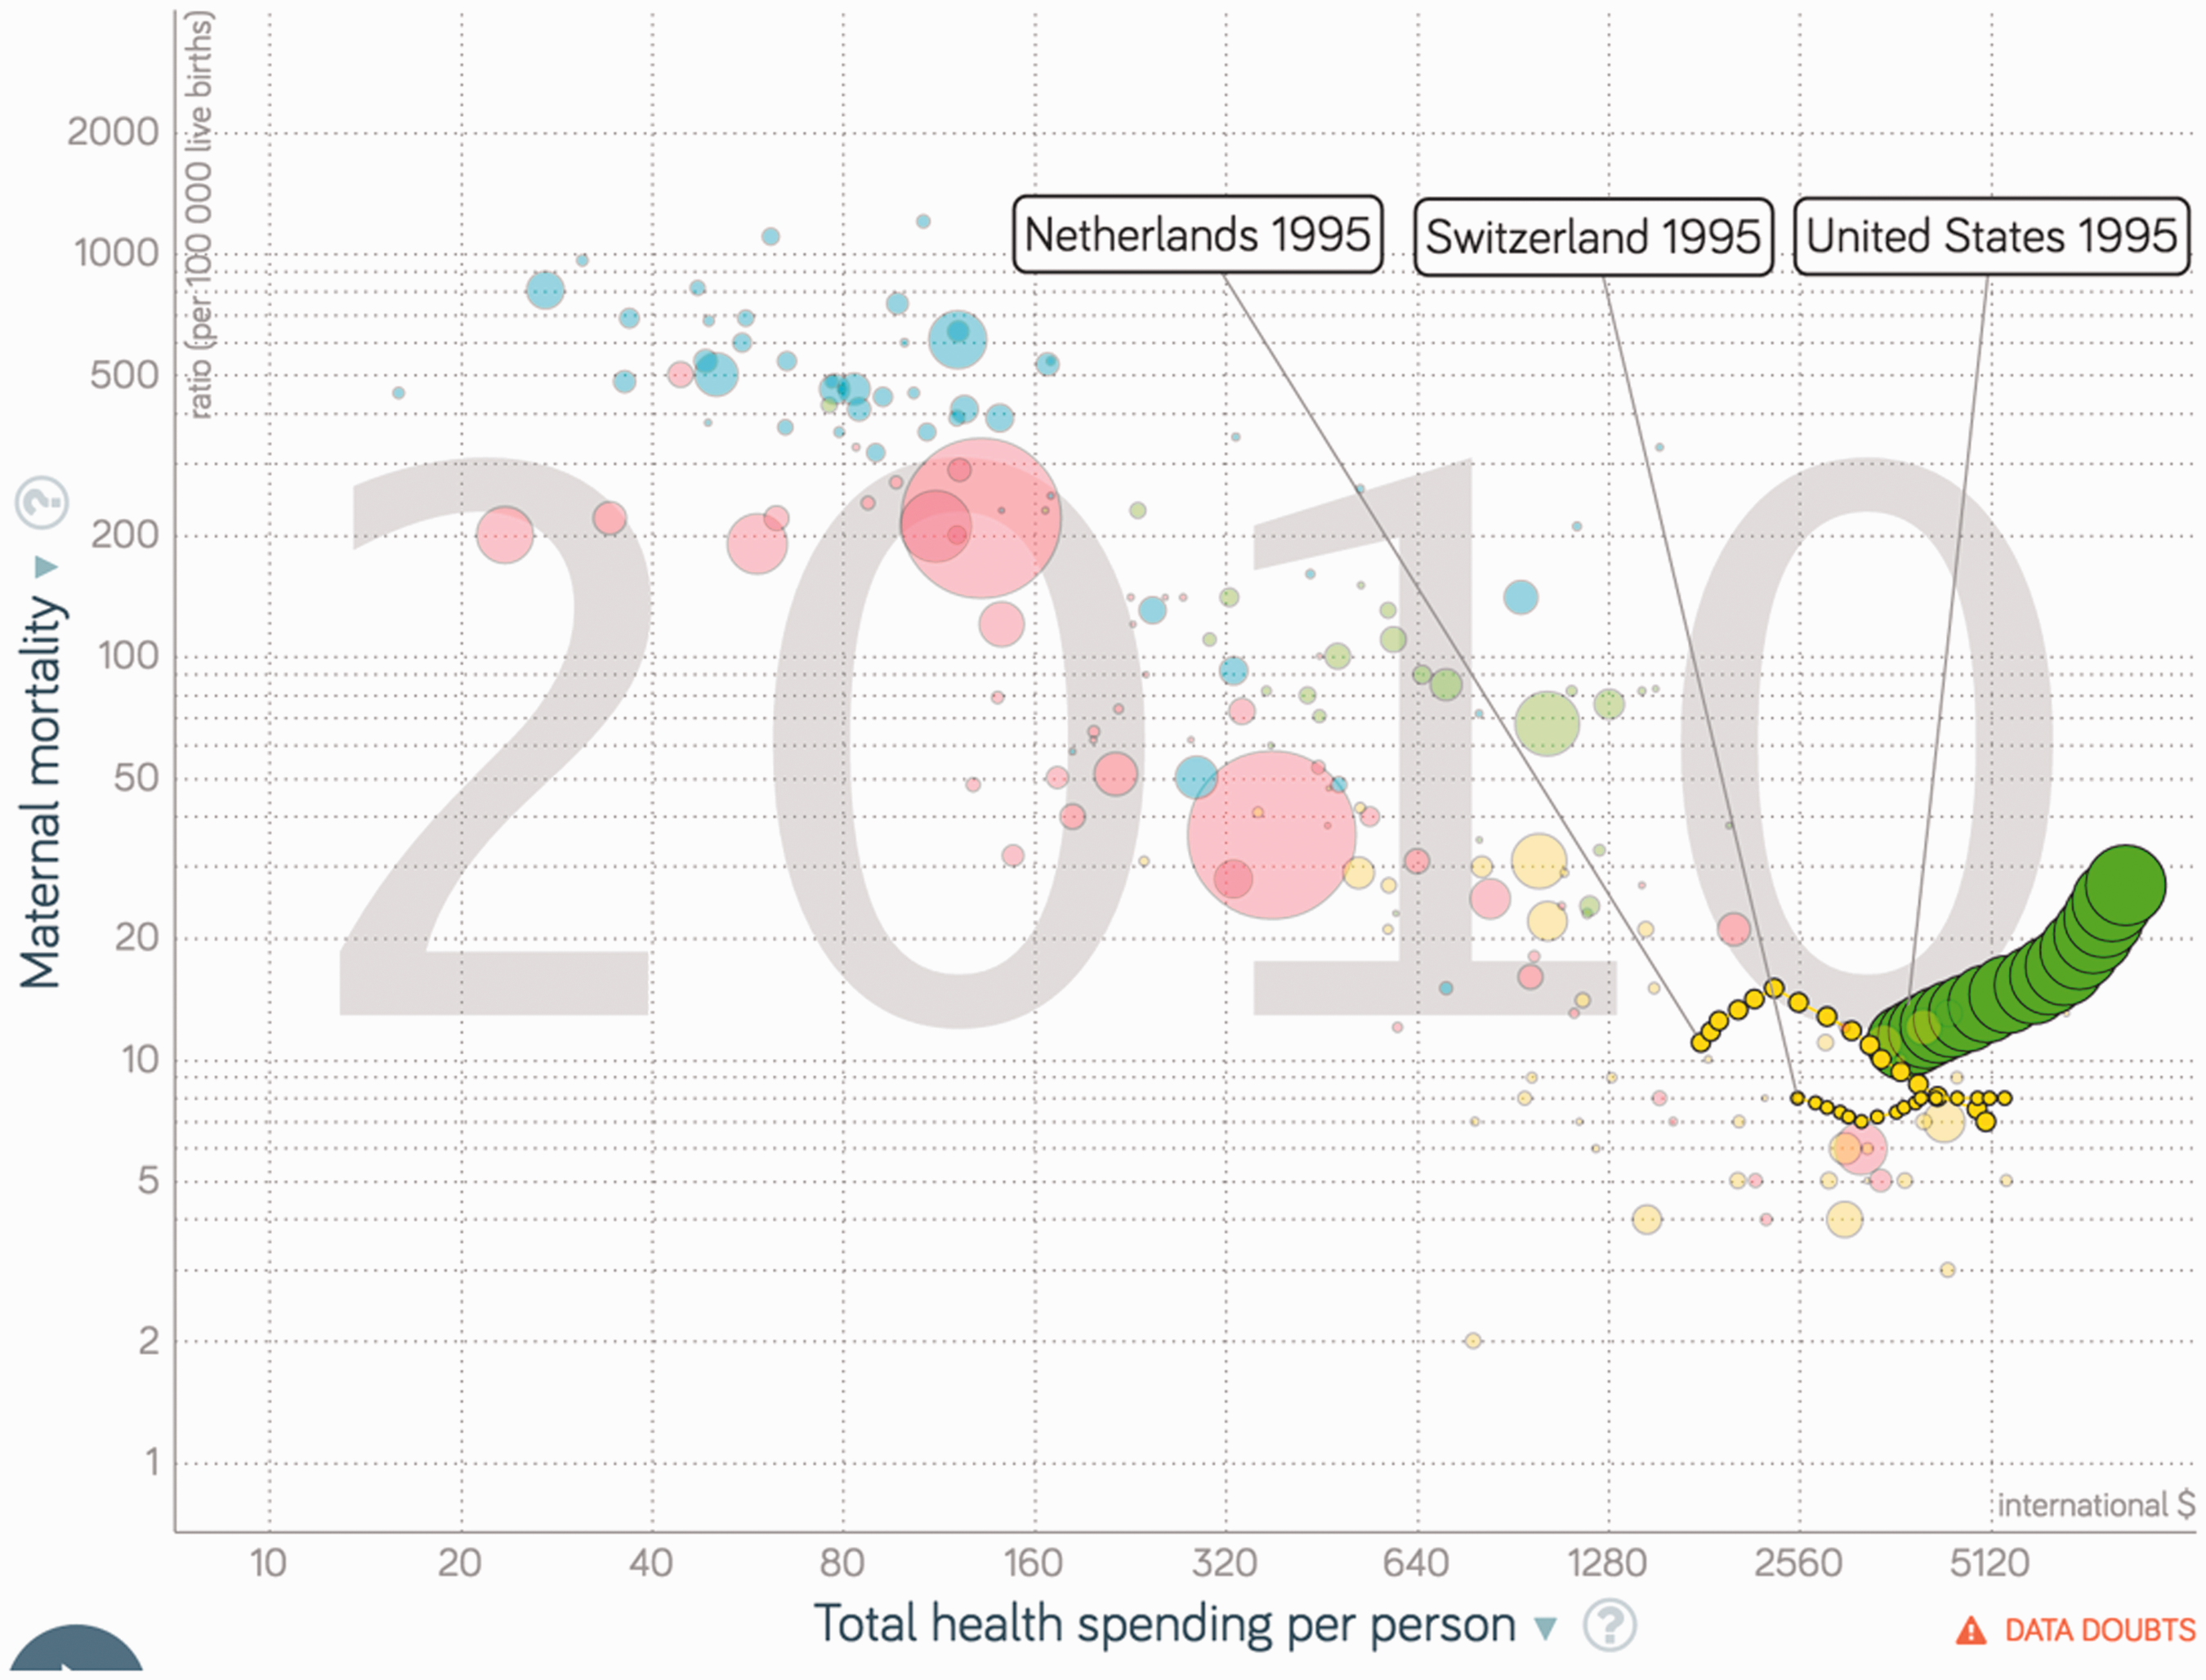
Swiss, Dutch, and U.S. maternal mortality ratio (/100,000 live births) as a function of total health spending per person (GDP/capita; PPP dollars inflation adjusted) over 1995–2010. Source: Gapminder Health Data Set.
In 2010, 19 countries were more efficient than the Netherlands in reducing MMR (Figure 6). The neonatal mortality rate in the Netherlands was the second highest of 13 European countries, although this figure may in part reflect a policy of not saving newborns under a certain weight at birth.45(p22) All countries whose health insurance plans are dominantly commercial, including the United States, the Netherlands, and Switzerland, were positioned above the regression line of the maternal mortality rate on total health expenditure per capita (Figure 6). The Swiss maternal mortality rate stagnated over 1995–2010 (Figure 5).
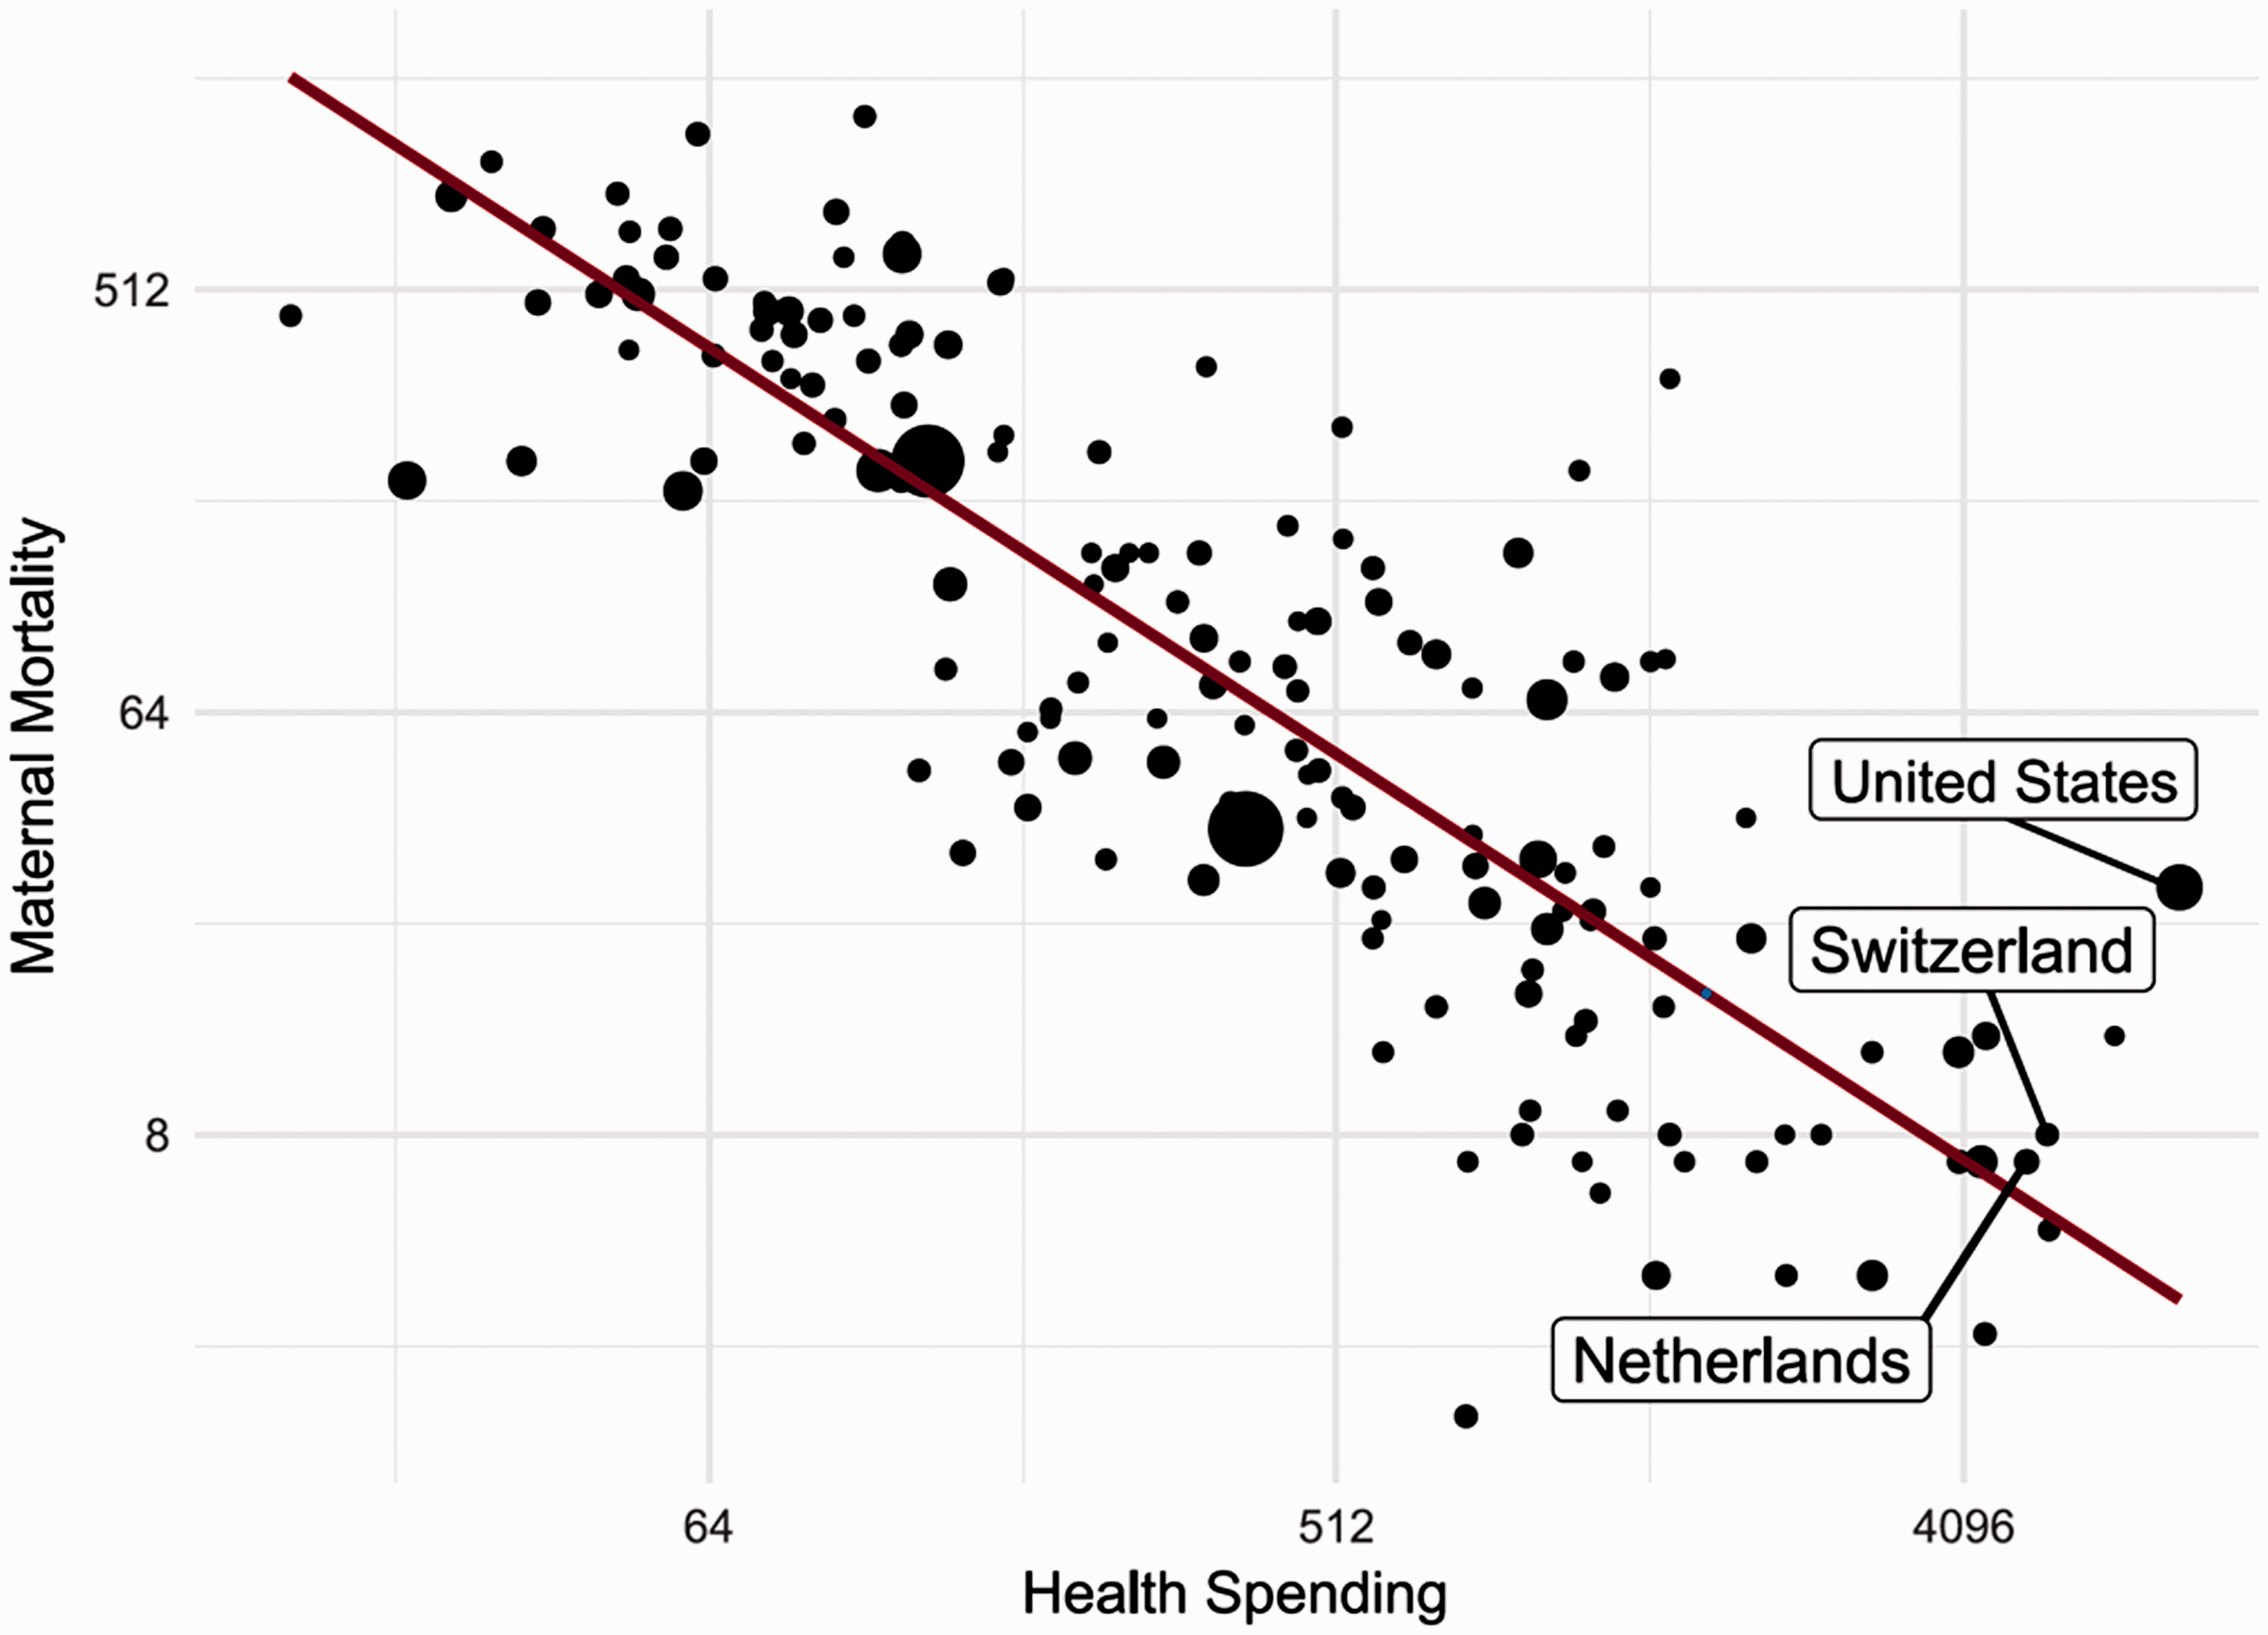
Maternal mortality ratio (/100,000 live births) as a function of total health spending per person (GDP/capita; PPP dollars inflation adjusted). Source: Gapminder Health Data Set.
The same applied to infant mortality (Figure 7) and neonatal mortality (Figure 8) and to LMIC markets such as those of Nigeria, South Africa, and Colombia. After 2010, the place of delivery in the Netherlands shifted, with rising rates of hospital births.45(p58) Still, the Netherlands ranked 9th on MMR, 21st on infant mortality rate (IMR), and 20th on neonatal mortality rate (NNMR) among OECD countries in 2016, while Switzerland ranked 22nd and 26th on IMR and NNMR. 46
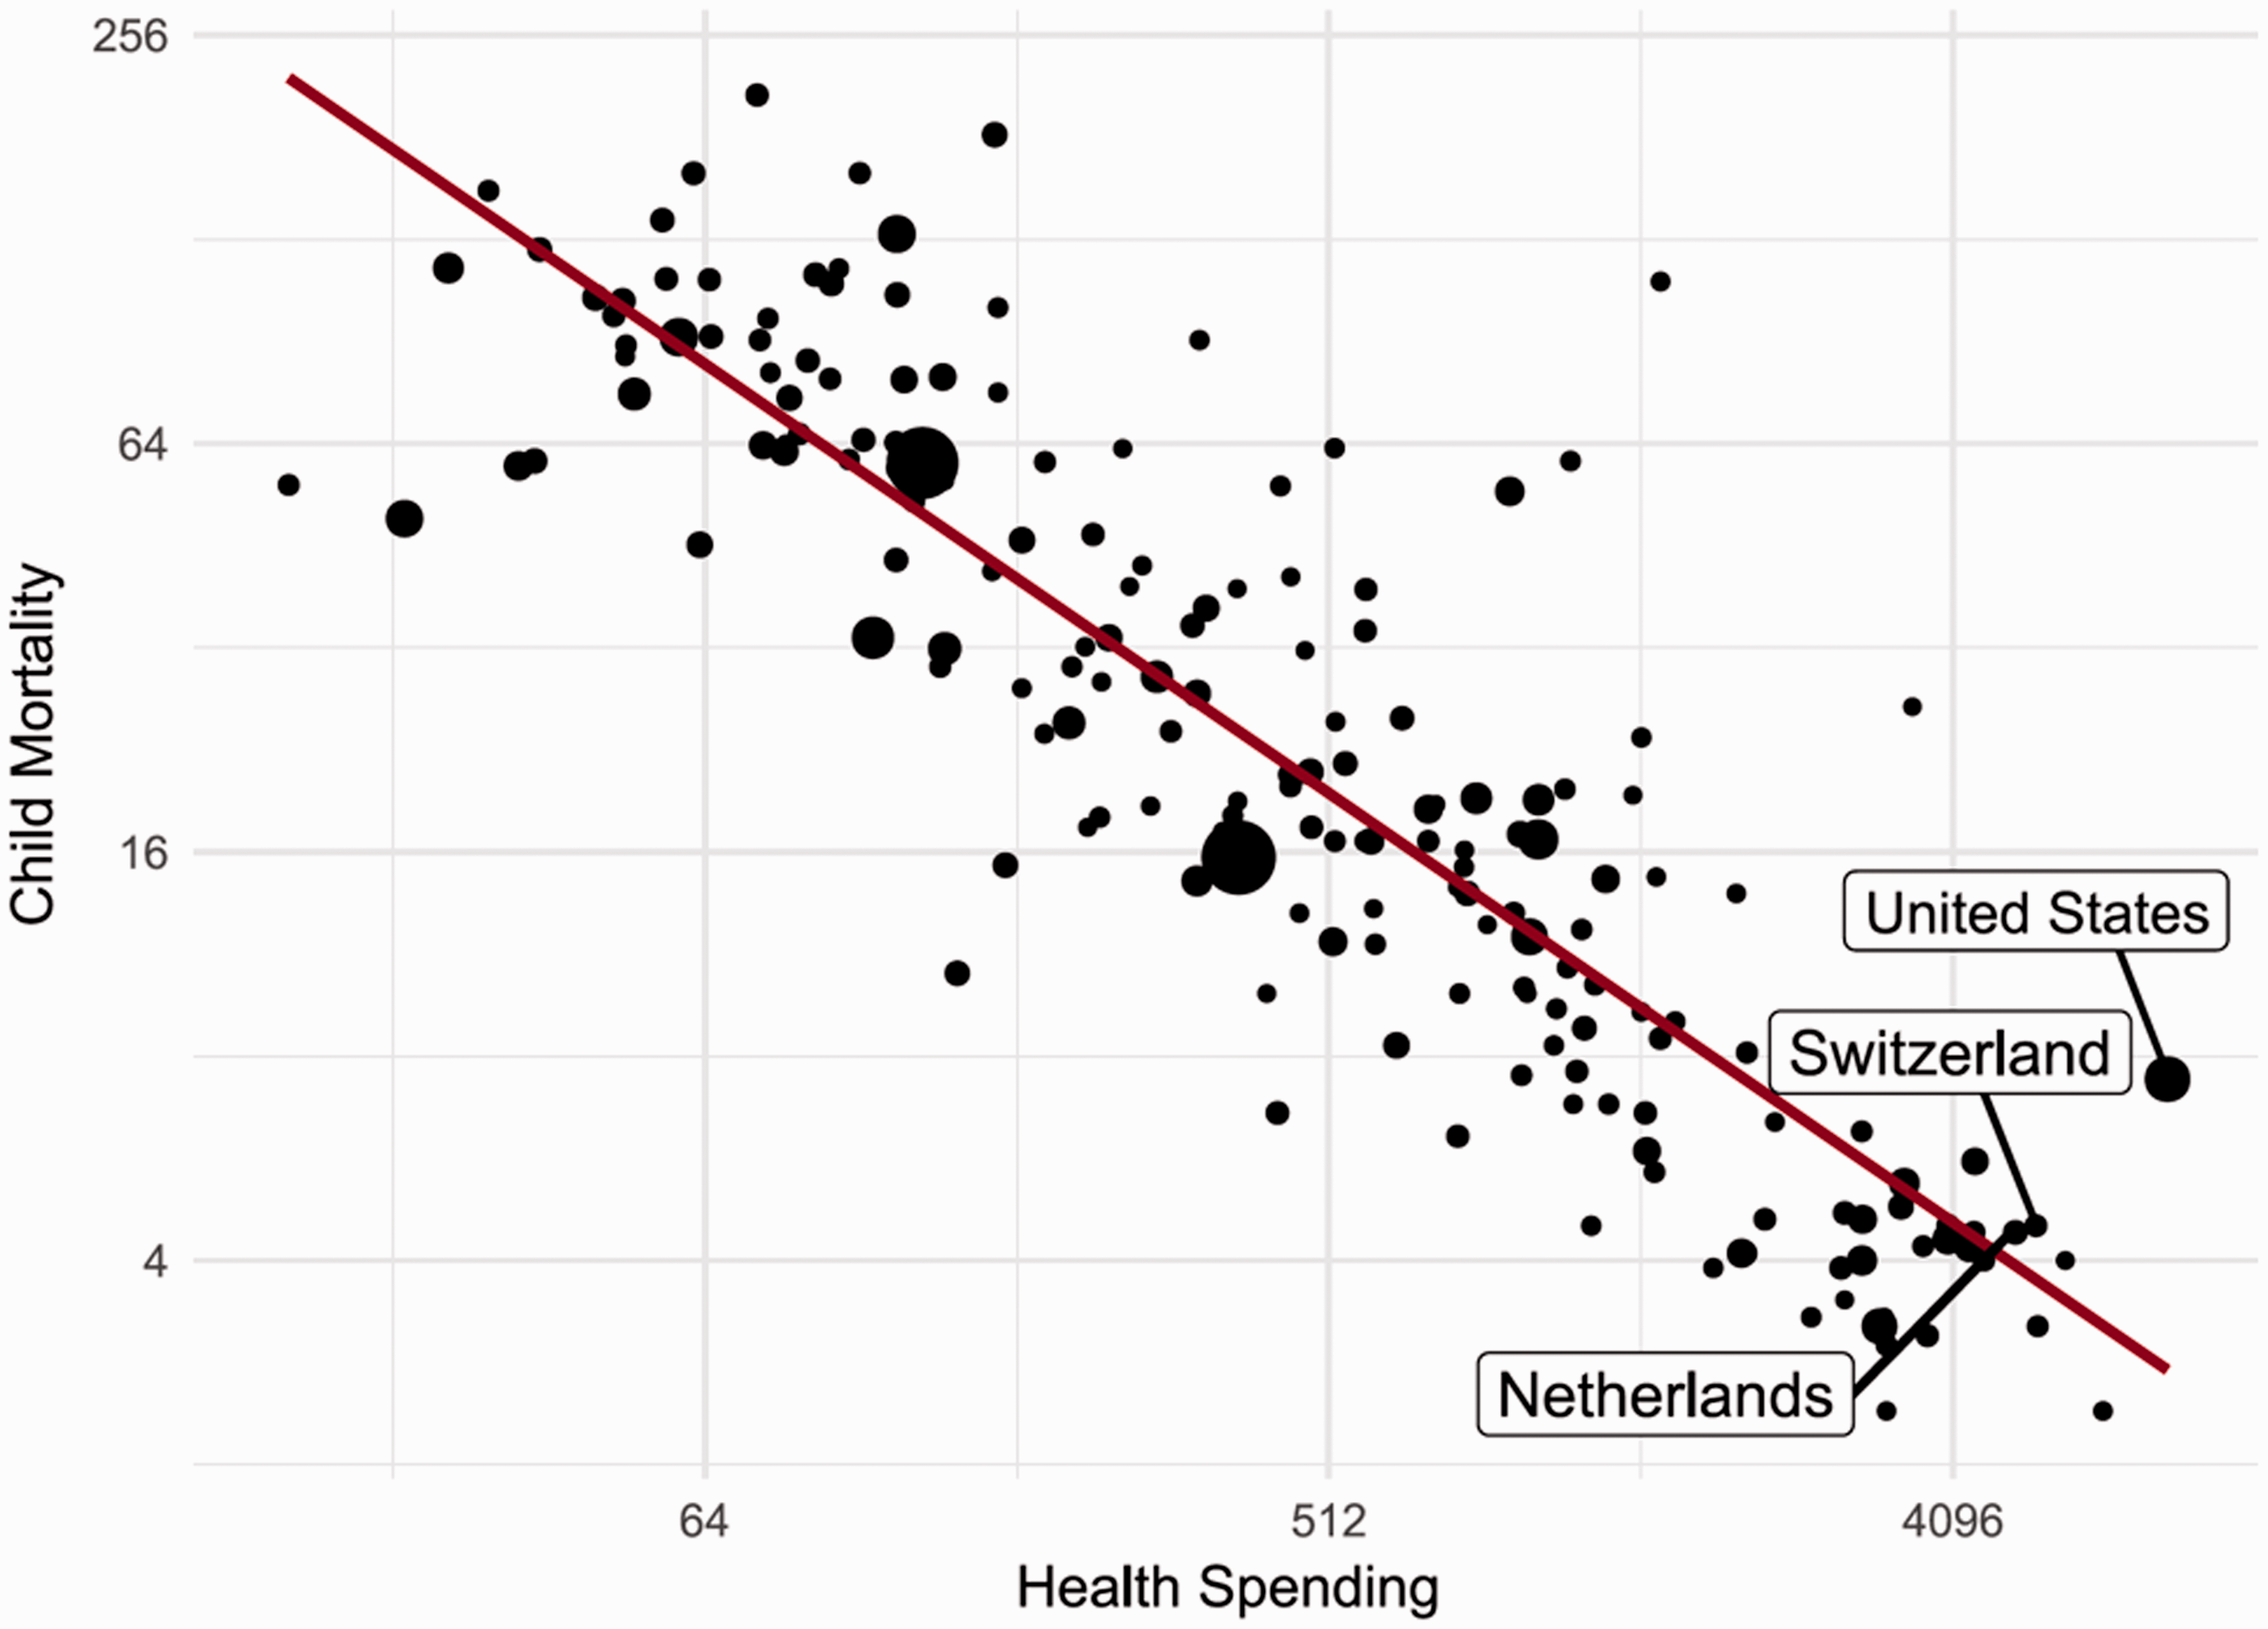
Infant mortality rate (1/1000 live births) as a function of total health spending per person (GDP/capita; PPP dollars inflation adjusted). Source: Gapminder Health Data Set.
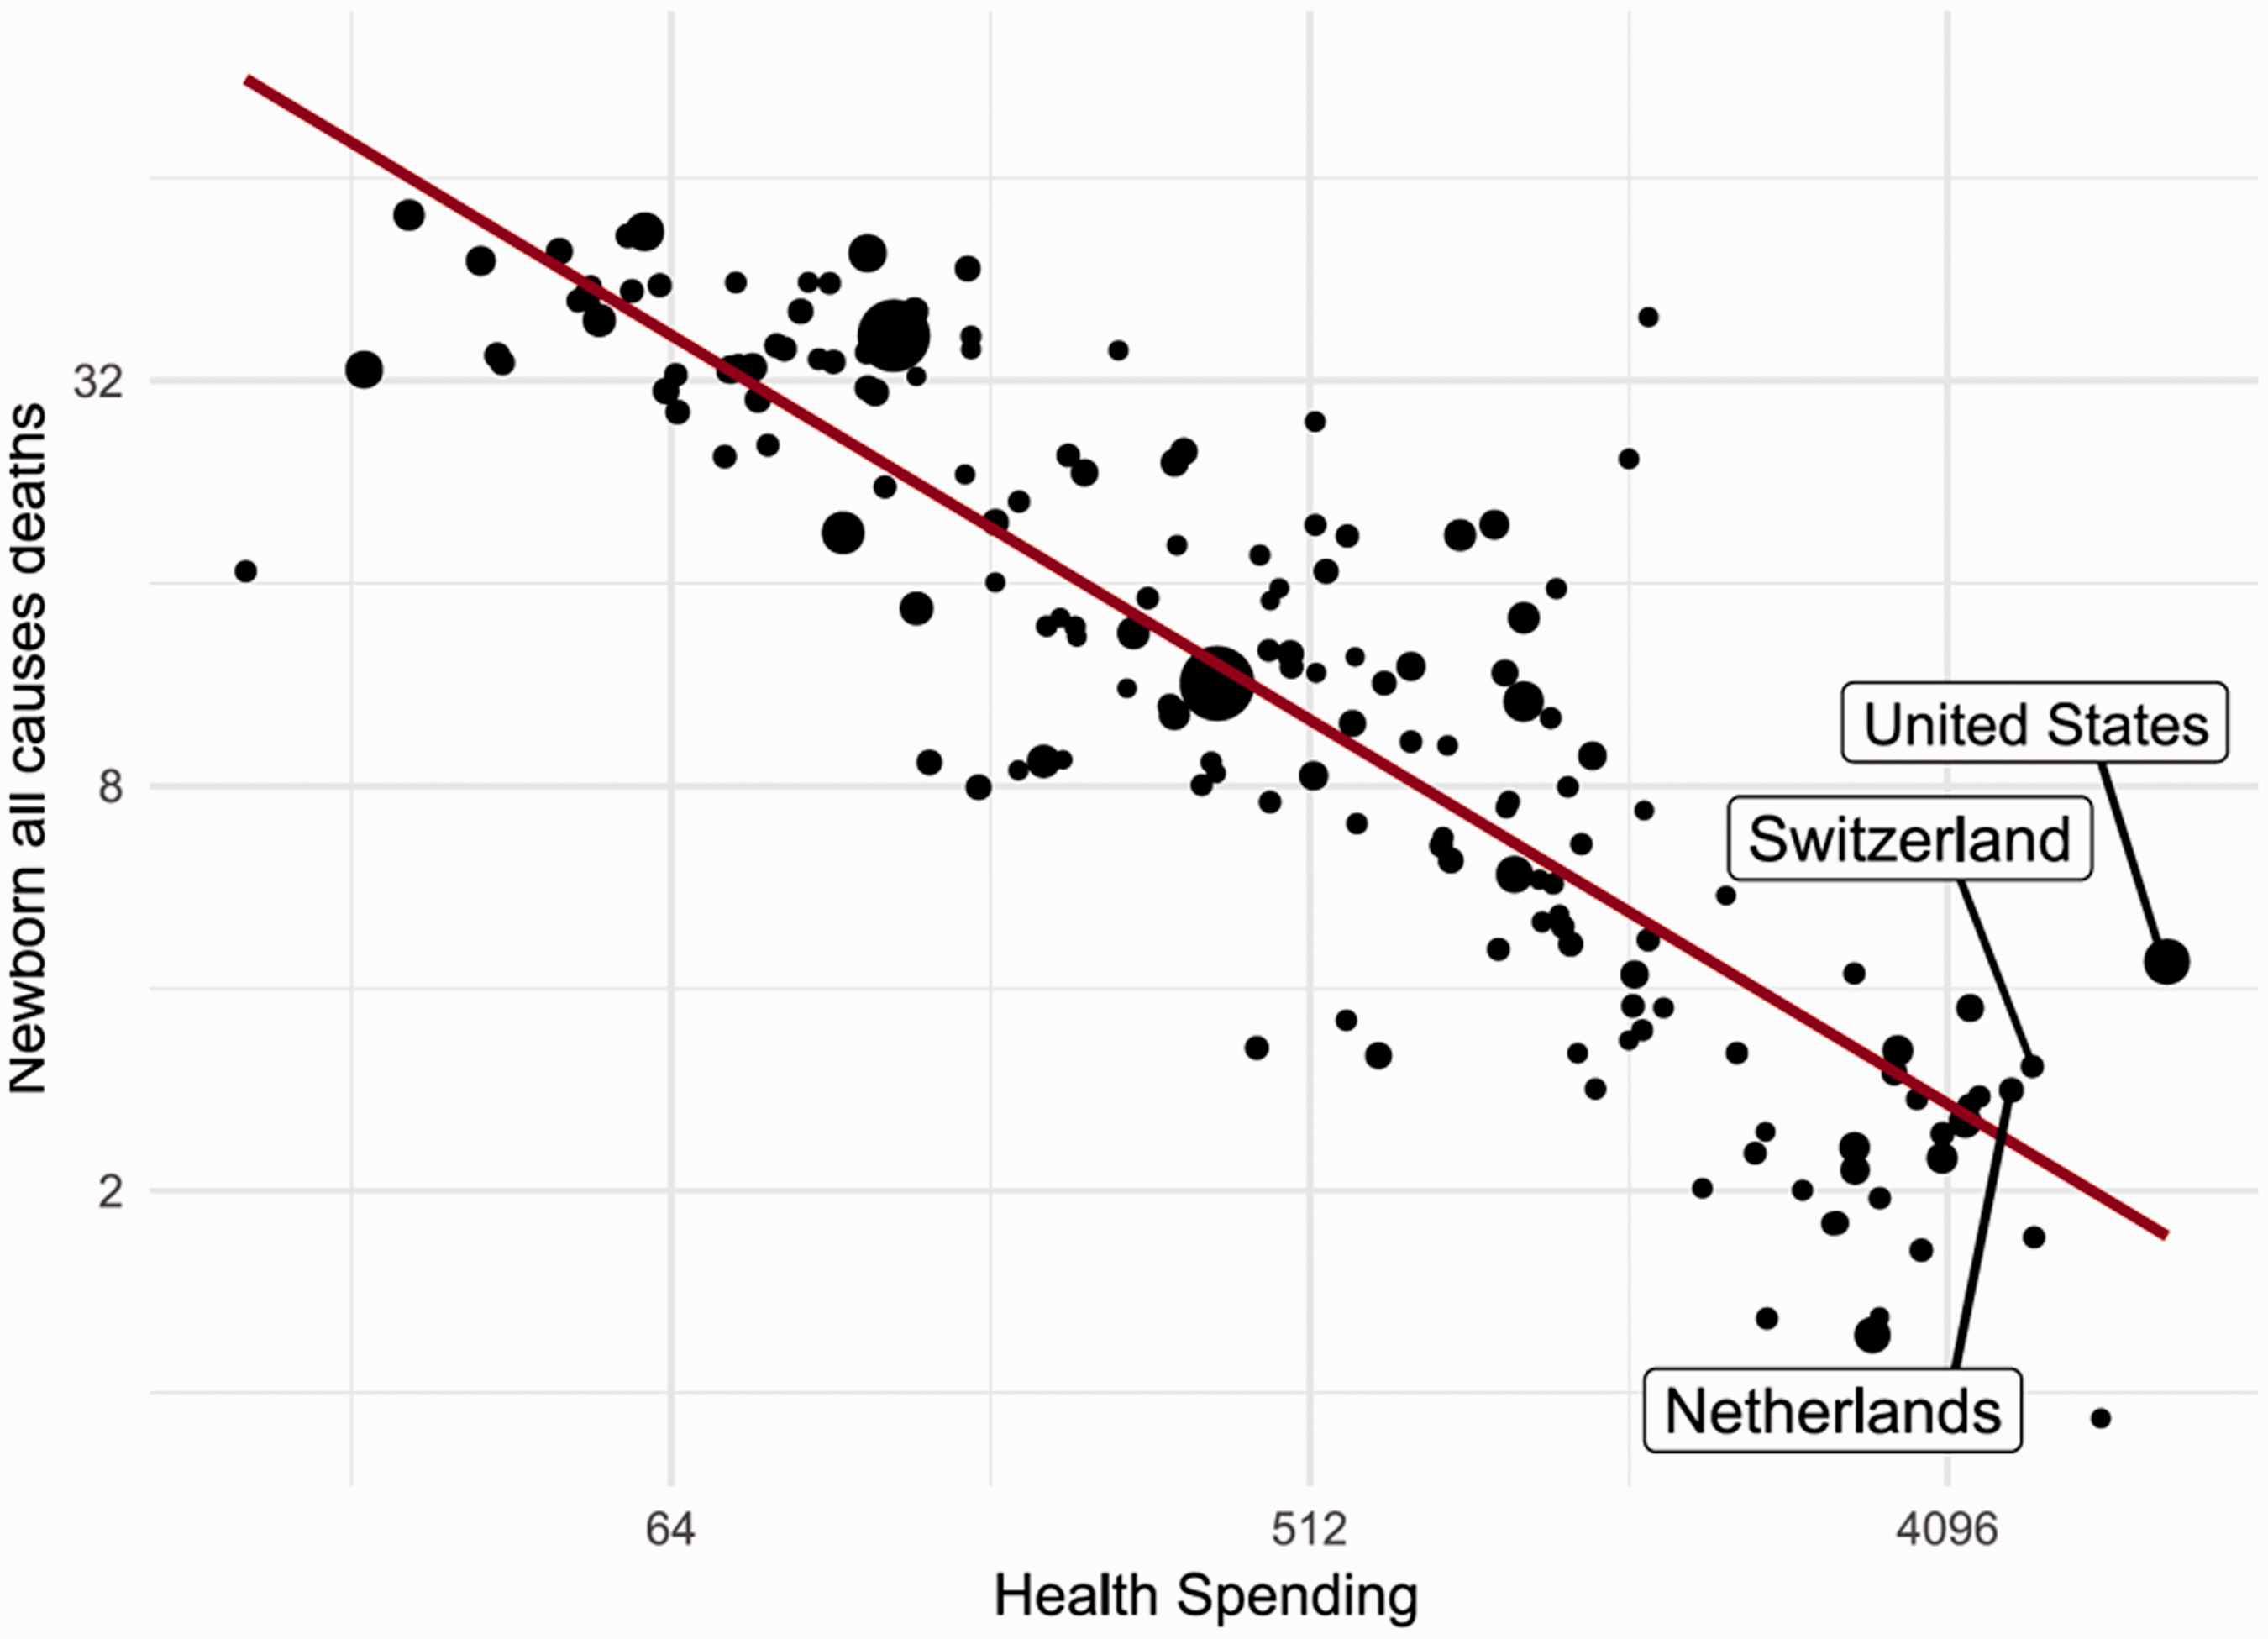
Neonatal mortality rate (1/1000 live births) as a function of total health spending per person (GDP/capita; PPP dollars inflation adjusted). Source: Gapminder Health Data Set.
To explain its relatively unsatisfactory NNMR, Dutch obstetricians were said to have a distinctive clinical attitude toward “unviable” or less viable neonates.
Limited access to secondary prevention and deficient care continuity and quality both explain why the U.S. lower extremity amputation rate was 5 times the British rate (2005–2012) (Figure 9), although diabetes prevalence was 10.79% in the United States and 4.28% in the United Kingdom (2017). 47 Over 2006–2012, both Switzerland and the Netherlands (admittedly like Germany, Belgium, and Spain) were also above the OECD median for this indicator.
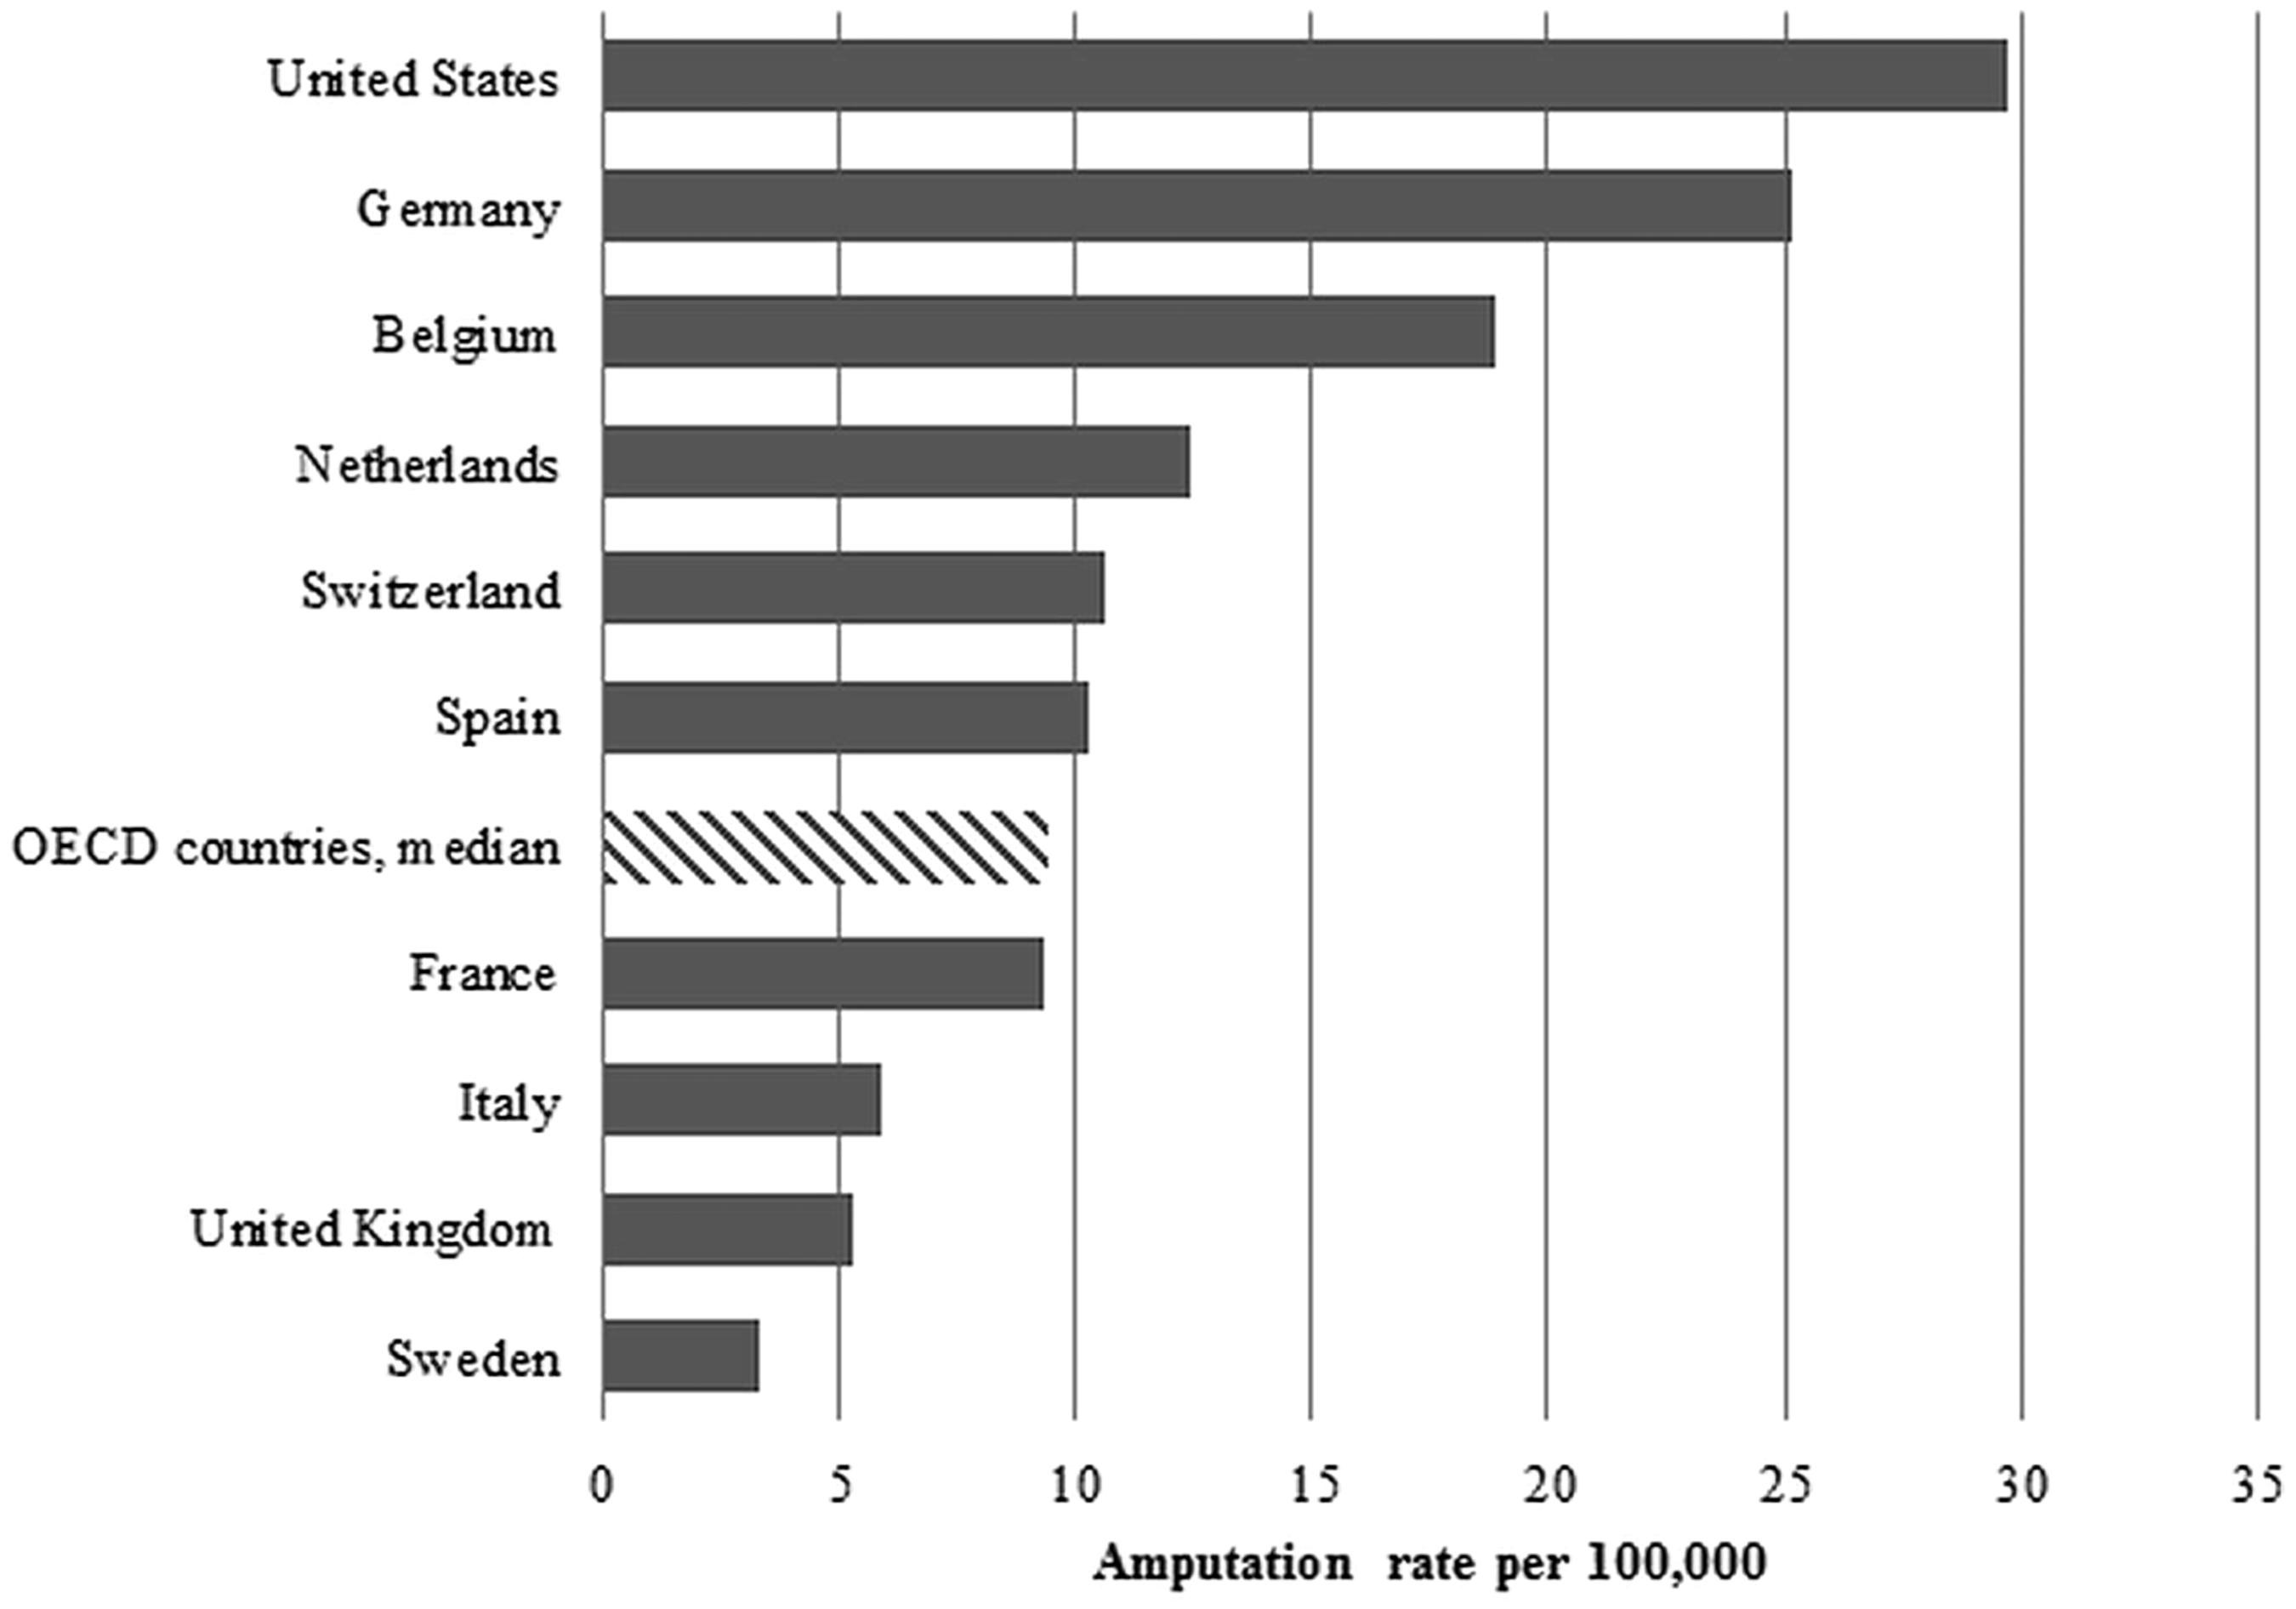
Diabetes lower extremity amputation rates per 100,000 population, age 15 years and older, 2005–2012. Note: Rates averaged over 2005–2012. No data for Japan. Source: Data from the Organisation for Economic Co-operation and Development (OECD), 2014. http://stats.oecd.org/
Government health spending of the United States, Switzerland, and the Netherlands as a function of total health spending per person (GDP/capita; PPP dollars inflation adjusted).Source: Gapminder Health Data Set.
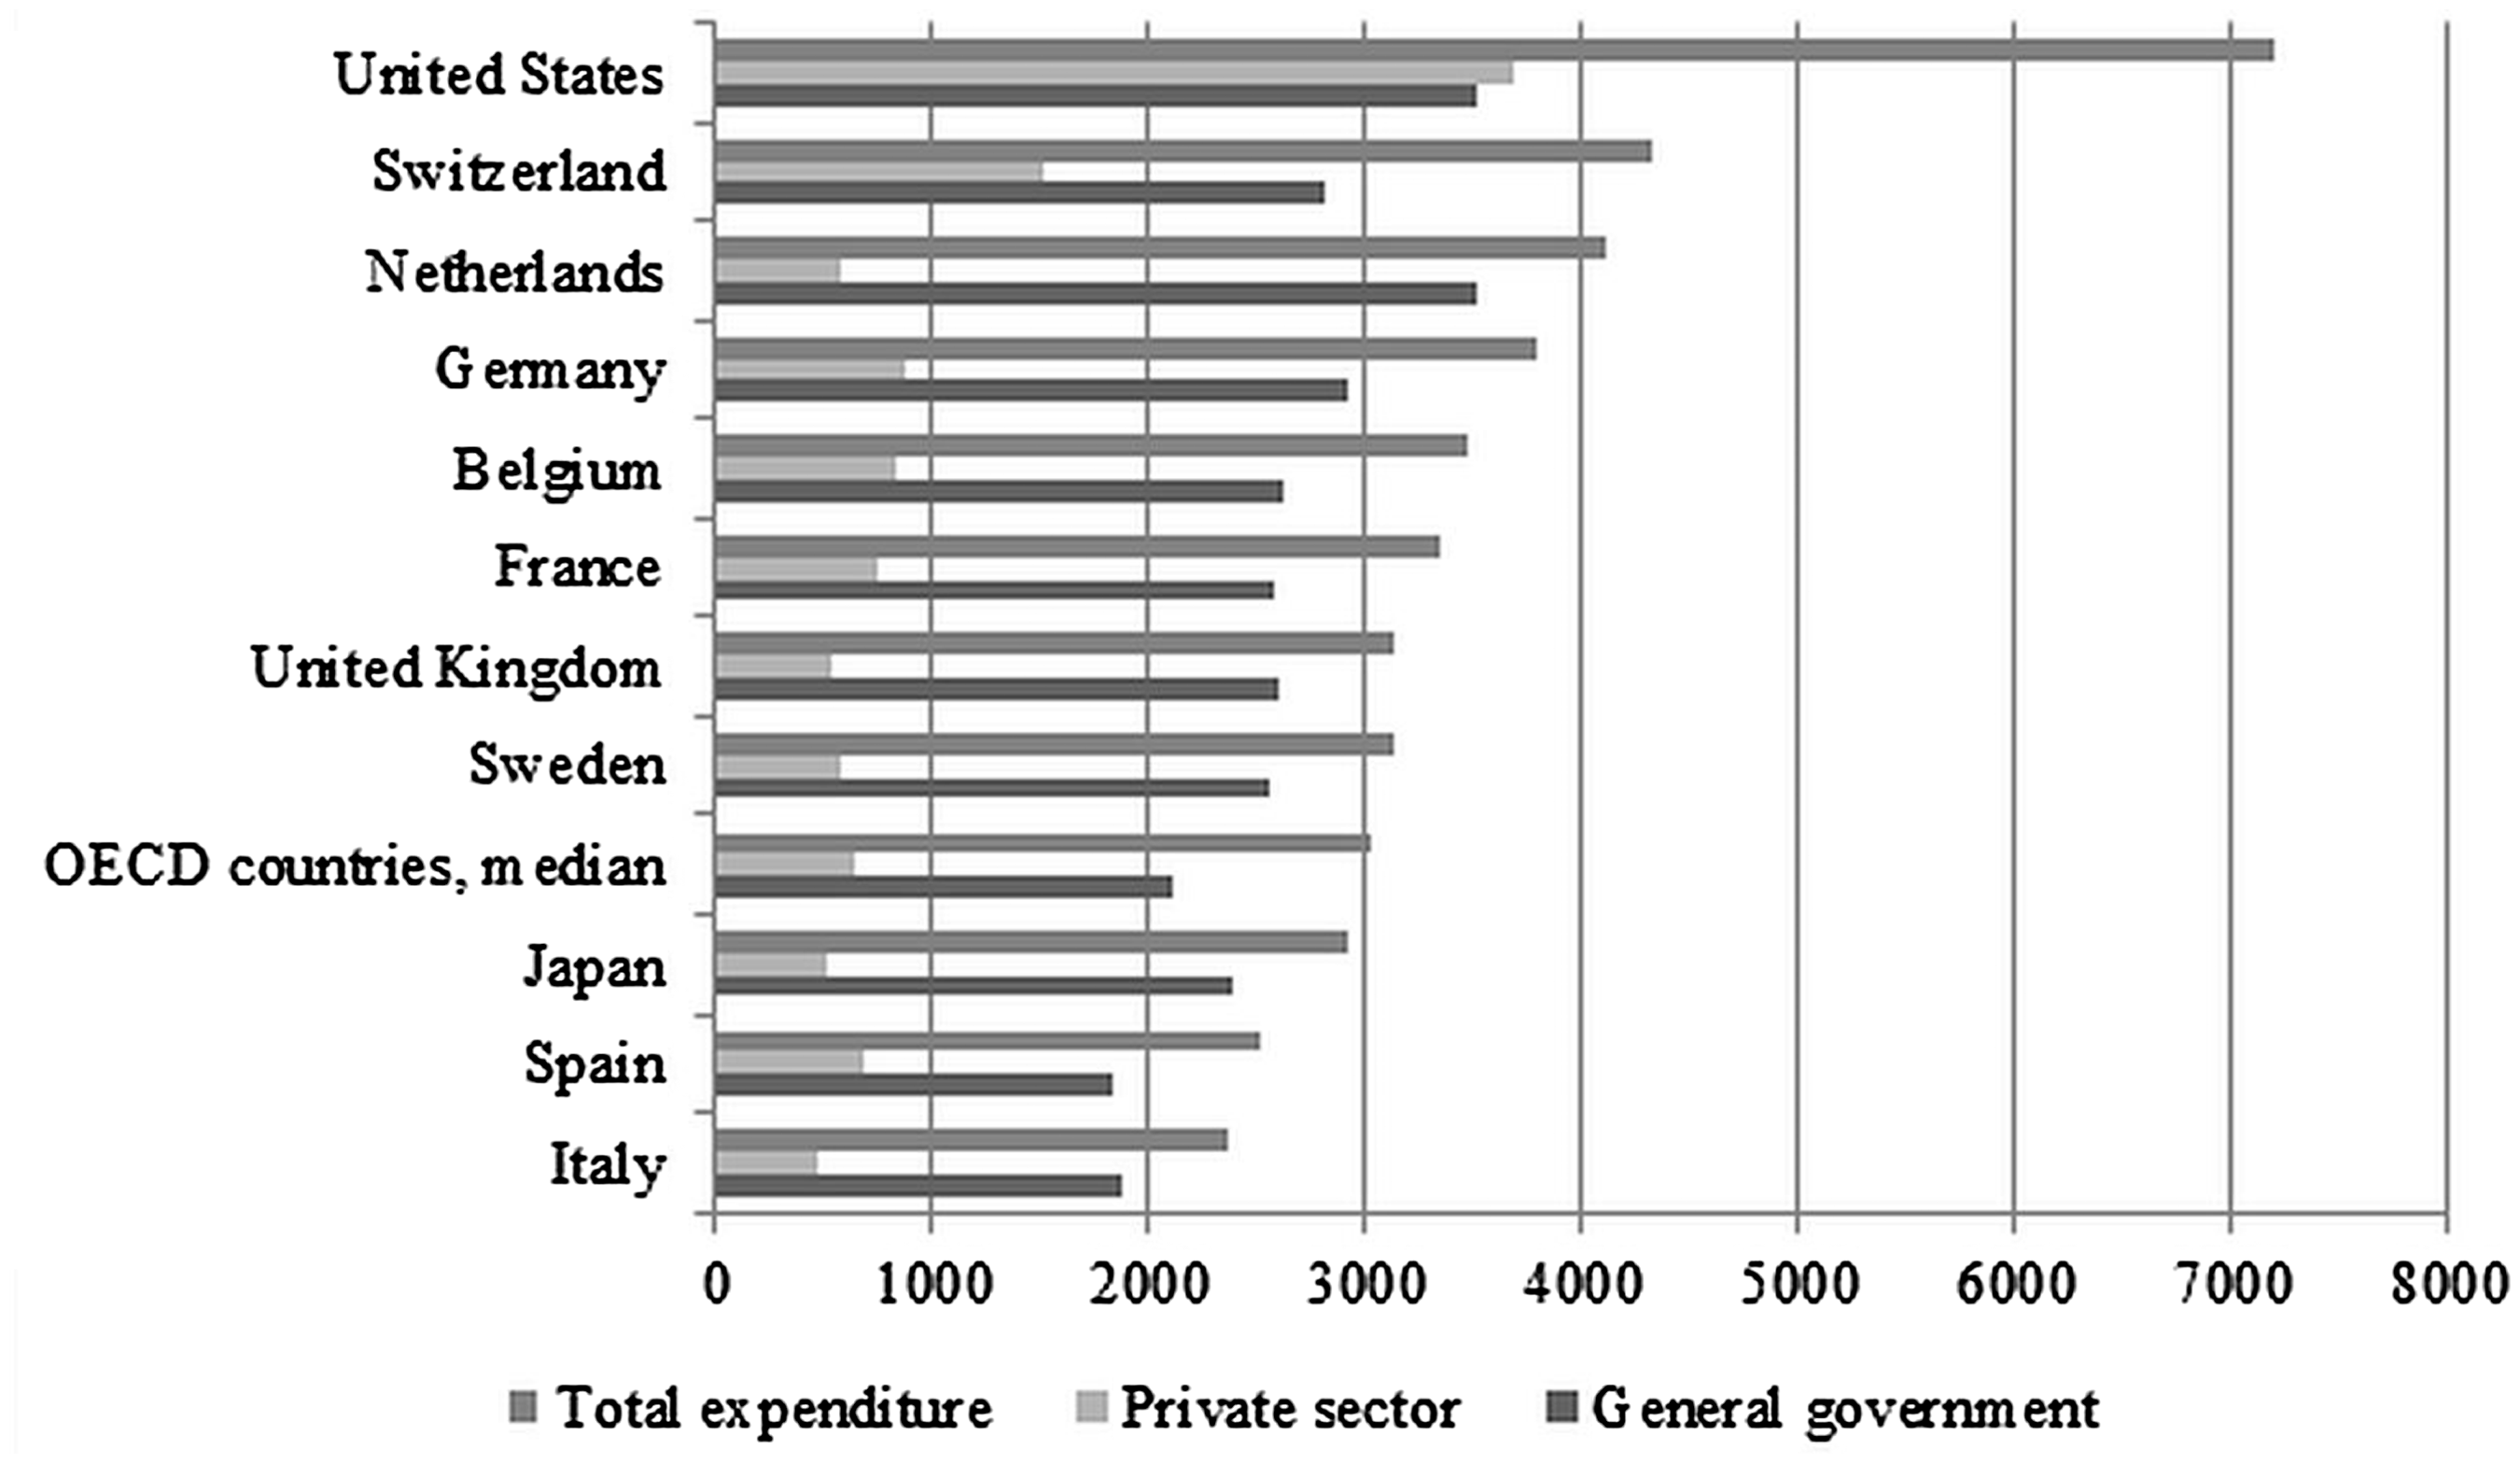
Government share of total health spending vs total health spending per person (in international dollars). Per capita expenditure on health, 2011 (USD PPP). Note: Japan data from 2010. Data for United Kingdom include investments in health (HC.R.1). Source: Data from the Organisation for Economic Co-operation and Development (OECD), 2014. http://stats.oecd.org/
Some inter-country mortality differences are not attributable to the health care systems. The prevalence of obesity in the United States is double the OECD average. 48 This may partly explain its high mortality amenable to care but not the low visits per capita ratio, high cost-related access problems, and inefficiency.
Similarly, the U.S. GINI coefficient (a measure of income inequality), also the worst of OECD nations (0.42 vs 0.33 in Austria and Japan), 49 probably increased poverty-associated deaths. 50 In 2010, however, Chile had a much higher GINI but a lower MMR than the United States, thanks to its dominantly public health system. Rather than confounding factors, poverty and industrial nutrition–related pathologies are probably effect modifiers of the relationship between commercial health financing and mortality amenable to care, which is particularly visible in the United States.
Health System Efficiency
To cope with their health systems’ inefficiency, the U.S., Dutch, and Swiss governments had to cut patients’ “benefits” and access to care, although these benefits remain good in Switzerland and the Netherlands (see below). Although catastrophic health expenditure is a frequent cause of impoverishment in the United States but not in the Netherlands and Switzerland, the 3 countries’ health systems are grossly inefficient:
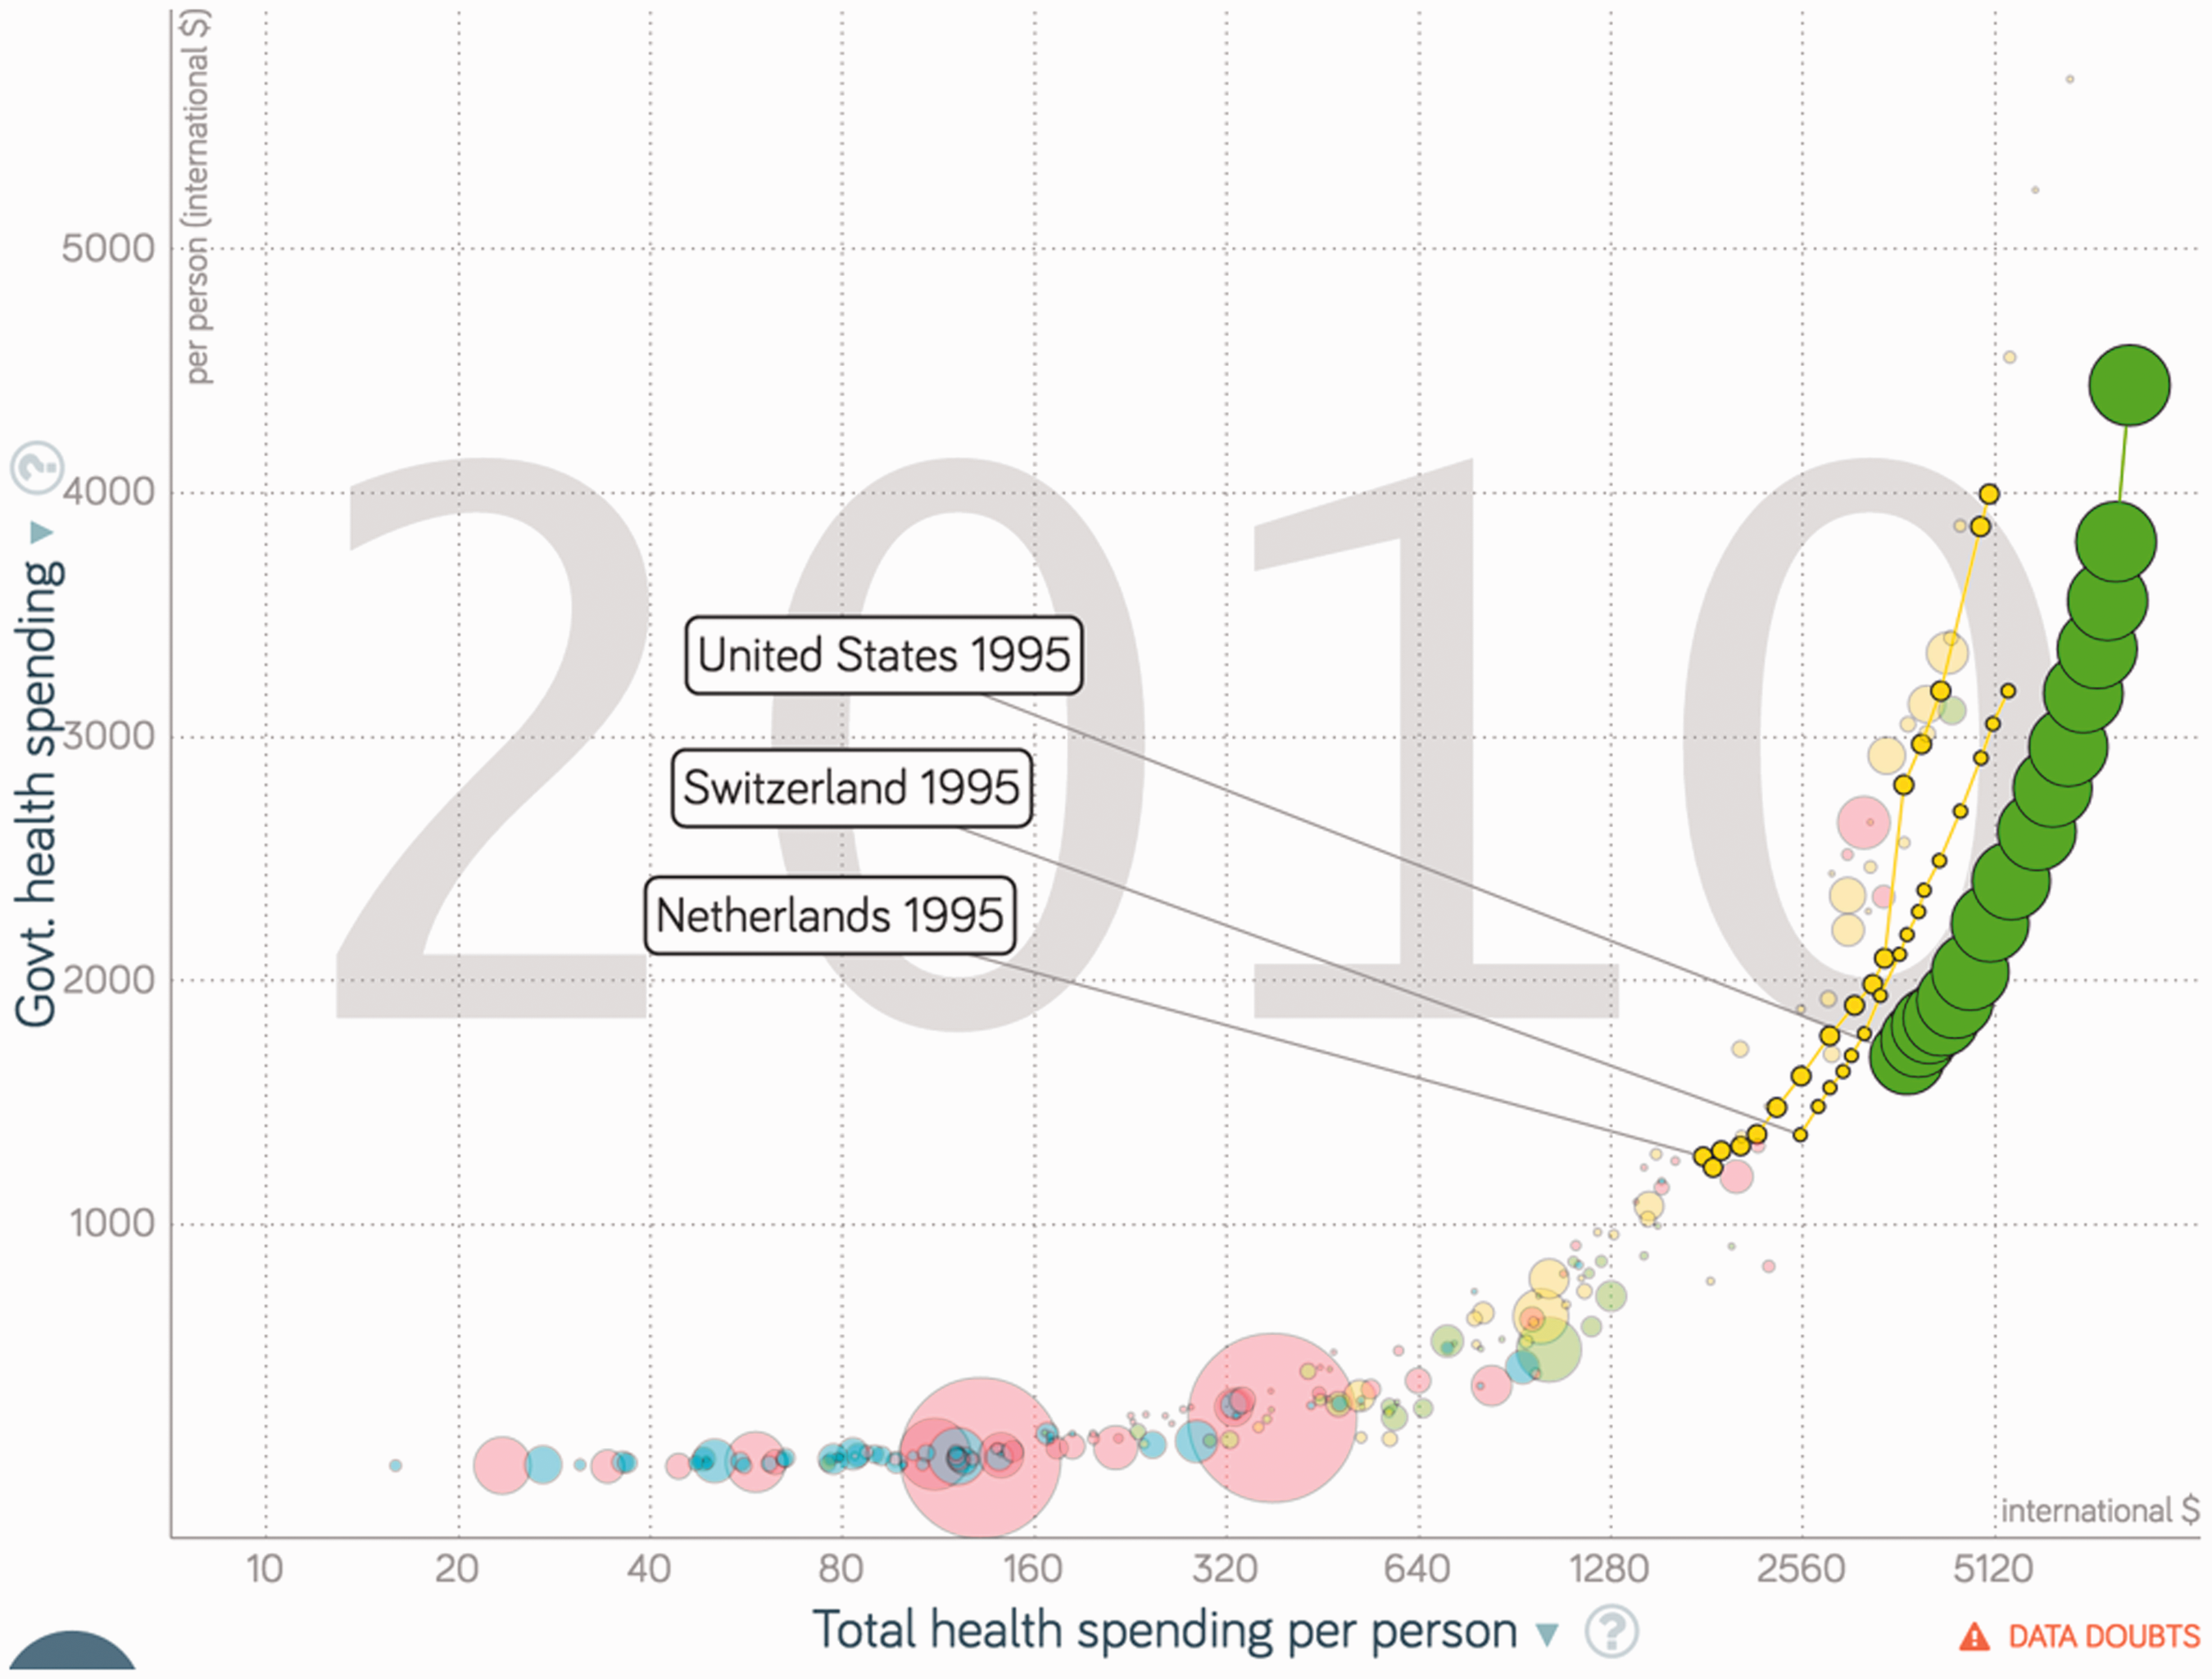
The growth rates of their government expenditures on health have been the highest of the industrial world (Figure 10), although there is conflicting evidence as to a possible stabilization in the Netherlands after 2013. If the Dutch government data are correct, in 2013 the United States, Switzerland, and the Netherlands had the most expensive health systems but not, as seen above, the best HIC performance.
45
The U.S. per capita public health expenditure alone was higher than total health expenditure in most E.U. countries (Figure 11),
51
while rich Americans had more difficulty accessing care than the poor in many European countries.
The inefficiency of the U.S. system was such that between 1999 and 2009, “Although family income grew throughout the decade, the financial benefits that the (U.S.) family might have realized were largely consumed by health care cost growth, leaving them with only $95 more per month than in 1999.” 52
Inefficiency was to be expected, since health markets violate conditions that are essential for an optimal market. 53 This is because they entail large information asymmetries, 54 oligopolies,55–64 and difficulty regulating the markets because care is a credence good, the quality of which is difficult or impossible to monitor accurately, except for its cost dimension (which is what managed care is about). In addition, health insurance contracts are frequently incomprehensible to lay people, thereby exacerbating information asymmetry. Notice that the huge increase in commercial insurance companies' administrative costs in the United States52,65 reflects advertising, lawsuits, lobbying, and the extremely high salaries of their senior decision makers.
The histories of the U.S., Dutch, and Swiss health systems reveal a chronological association between insurance market maturation and skyrocketing health expenditures. Table 1 gives the rankings of these 3 countries as a percent of GDP in 1996, 2006, 2013, and 2018.
Ranking of U.S., Swiss, and Dutch Total Expenditure on Health Per Capita.
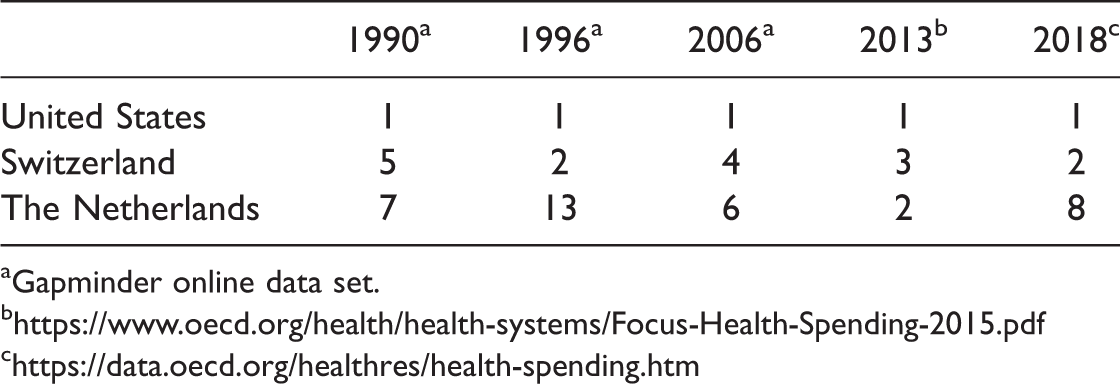
aGapminder online data set.
Over at least 25 years, the United States ran the world’s most expensive health system. In 2016, the U.S. government alone spent US$4,414 PPP (purchasing power parity) per capita, that is, more than the total expenditures of 23 OECD countries.
Health spending as a share of GDP has risen the fastest in the United States of all industrial countries, with Switzerland running second. The amount spent more than doubled between 2000 and 2016,66 while the state-insured population remained between 30% and 35%.
b. Since Switzerland introduced the LAMal compulsory medical insurance in 1996, premiums have risen by 4.6% a year on average. In 2013, “When looking at per capita spending on health, Switzerland spent US$6,187 (when measured in purchasing power parities, PPP) approaching double the E.U. average of US$3,379; in Europe, only Luxembourg and Norway spent more.”
17
In recent years, the country has had the second most expensive system after the United States (Table 1). Swiss health care financing has been regressive (lower spending on lower income citizens) since the 1996 reform, with high variations in equity across cantons.
67
c. Between 2006 and 2011, the Netherlands’ expenditures on health grew faster than any other European country (Figure 12(A)). In 2013, the Netherlands’ health expenditures ranked second (Table 1). Over the 2011–2016 period, the growth rate is uncertain. The OECD considers the proportion of health spending as a share of GDP to have stabilized around 10.5% (10.9% in 2013 and 2014) until 2016 (10.7% in 2015),
46
contradicting the 2014 Dutch government report that estimated that the share of health expenditure over GDP had risen to 14.1%.45(p229)
Moreover, in 2015, the Netherlands´ per capita health care expenditure was said to be the third highest in the European Union, just after Germany’s, 68 while a 2016 scientific publication considered the Dutch health system to be the second most expensive in the world in 2014,69 and the OECD ranked the country eighth in 2017.46
While long-term care is presented as the cause of comparatively high Dutch health expenditures, 16 the inter-country comparability of this sector is questionable: not counting psychiatric beds, long-term care hospital beds accounted for 10.9% of total Dutch bed occupancy in 2017 and just 2.15% in Belgium. 70 Rather, the Netherlands was second to the United States in hospital administrative costs (almost 20% of hospital spending and 0.8% of that country’s GDP). 71
The fast rate of growth in health spending after the privatization of health insurance in 1996 in Switzerland and 2006 in the Netherlands (Figure 12(B)) was preceded in both cases by a reduction or stabilization in total health spending, reflecting an across-the-board reduction in public spending. It put publicly oriented health care services under stress and made changes acceptable to health professionals and, with waiting lists, to patients.
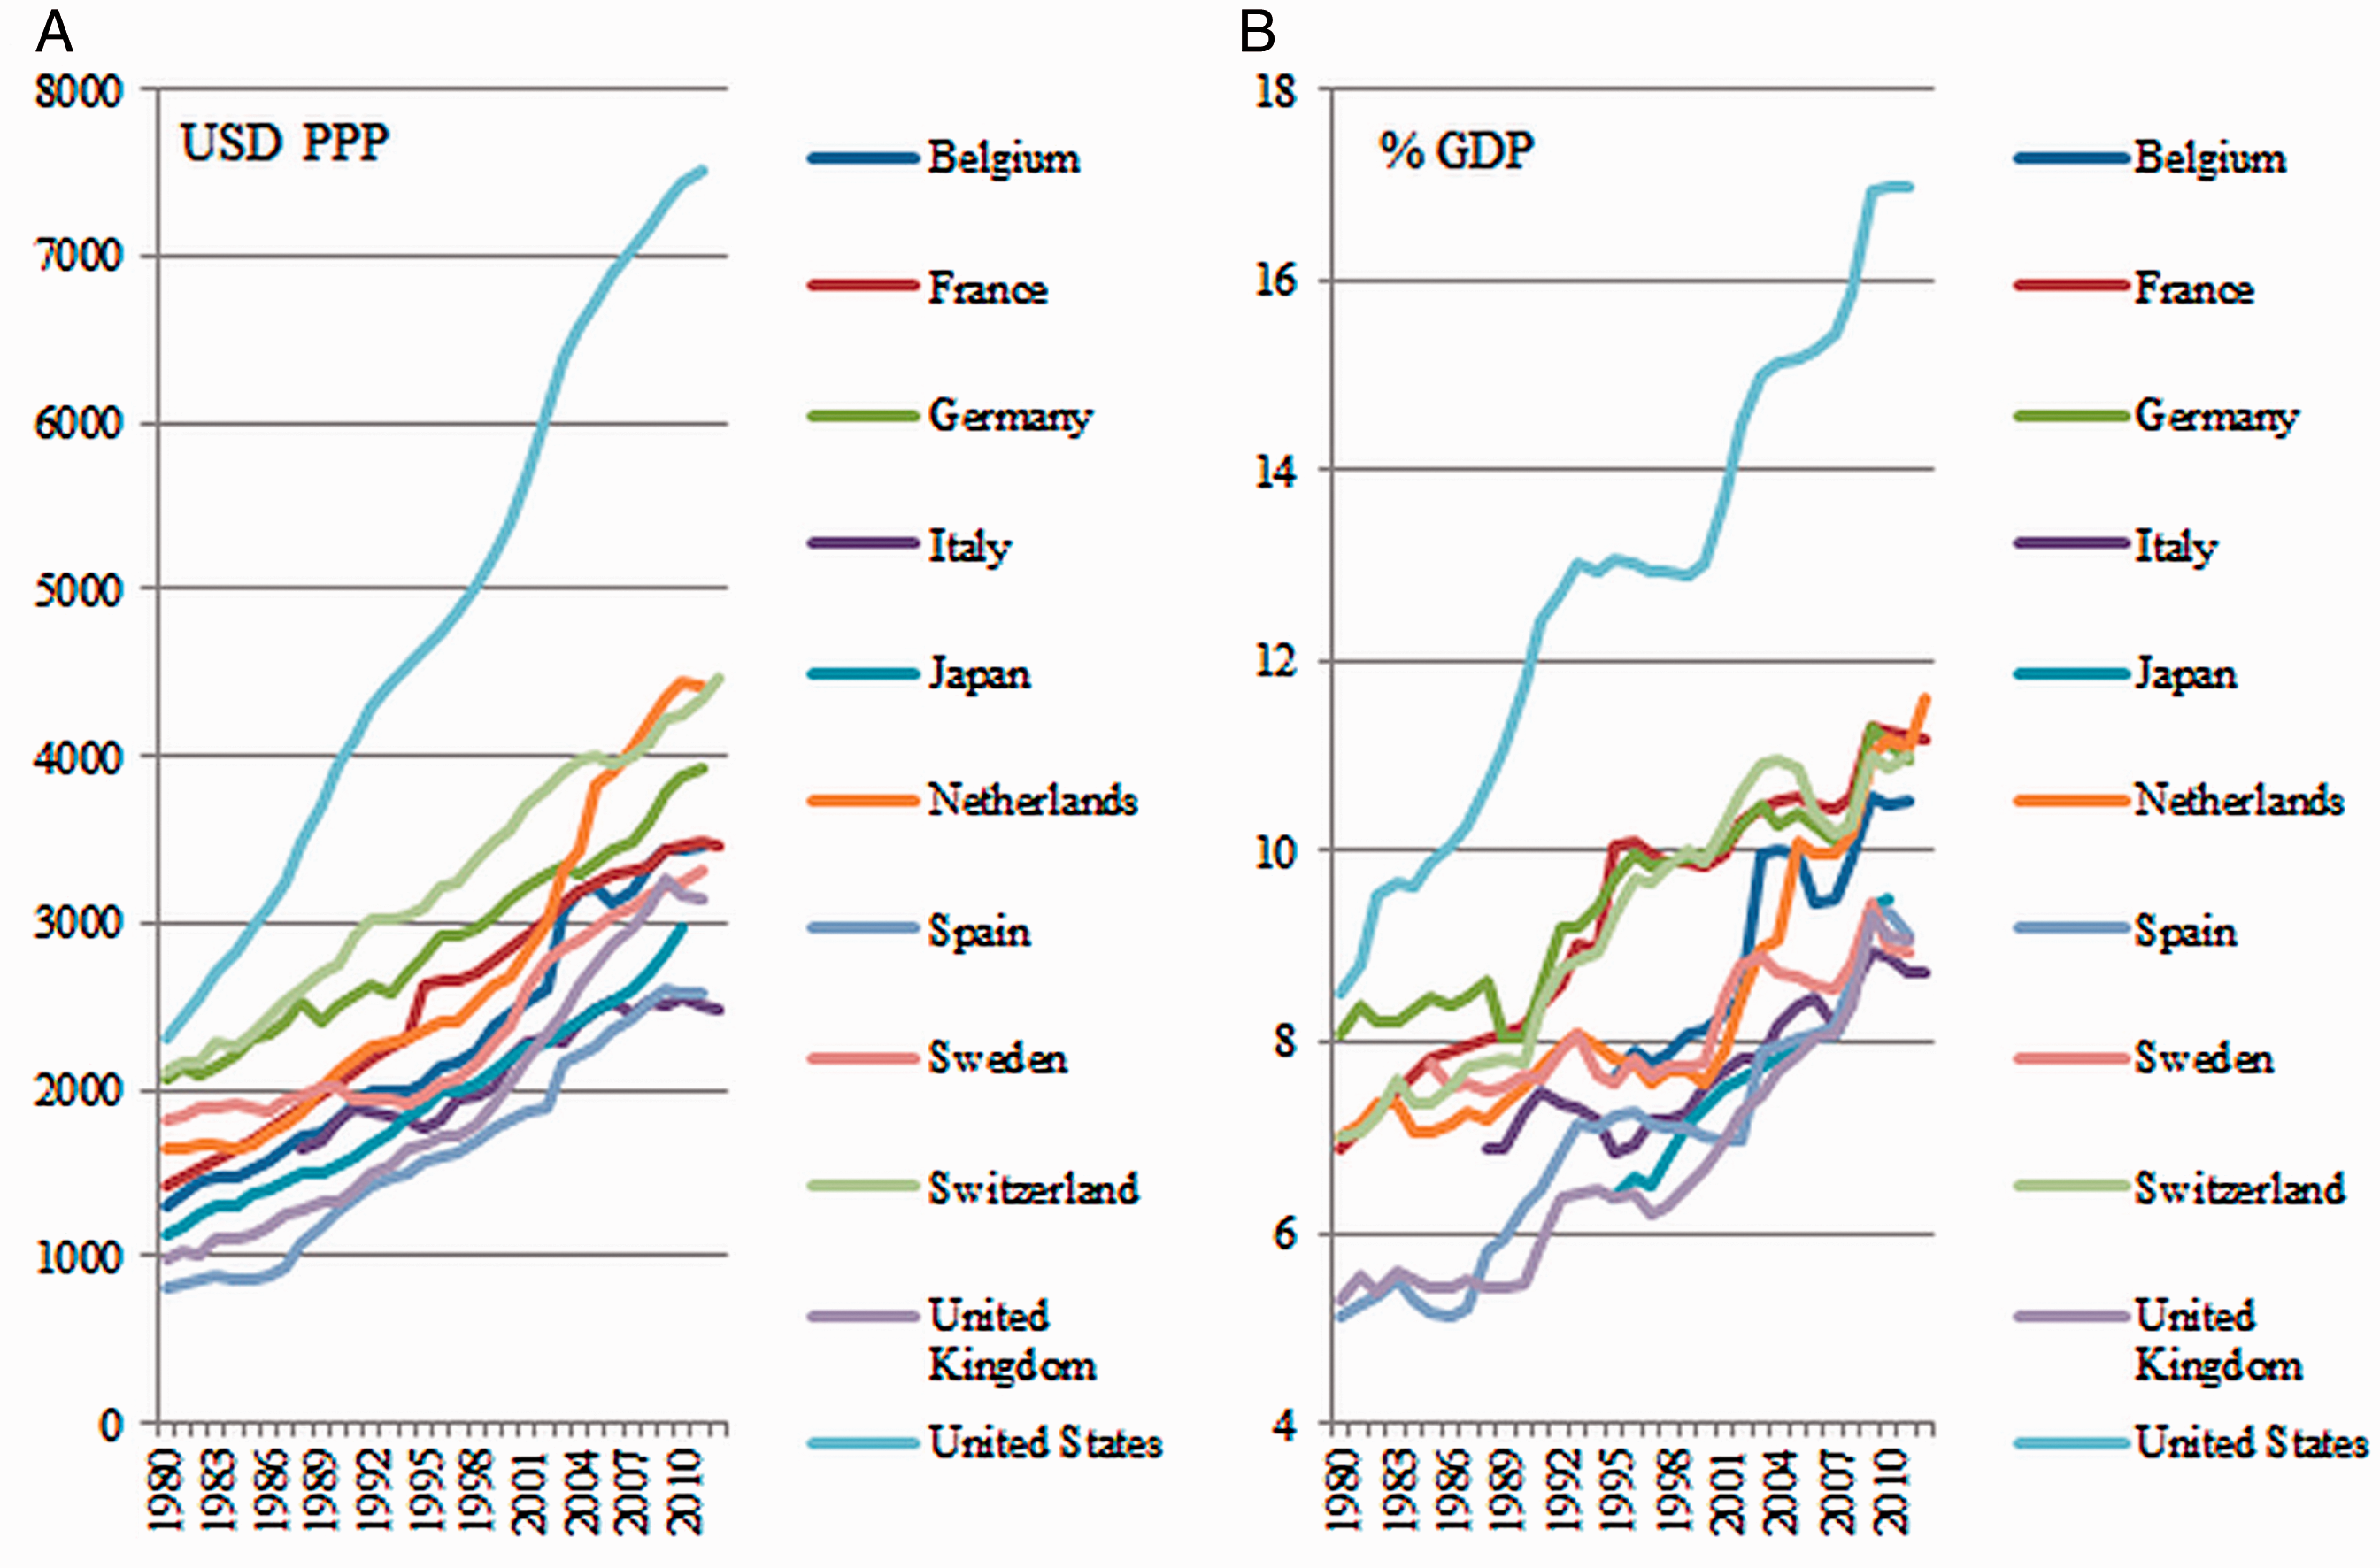
Total expenditure on health per capita in USD (A) and as a percentage of gross domestic product (B), 1980–2012. Source: Data from the Organisation for Economic Co-operation and Development (OECD), 2014. http://stats.oecd.org/
d. The systems based on commercial health insurance require governments to put large shares of their resources in their health sectors. So, in 2013, the Netherlands had the highest proportion of public spending in total health expenditures (88%) in OECD countries, although this figure did decrease to 80.7% in 2015. 16 Likewise, the 2016 World Health Statistics put the government health expenditure as a percentage of the general government expenditure at 21.3% for the United States, 22.7% for Switzerland, and 20.9% for the Netherlands, against 14.5% and 15.1% for Spain and Belgium, respectively. The administrative and transaction costs of Medicare and Medicaid out-contracting explain the high proportion in the case of the United States.
Consistency of Findings
Admittedly, our findings conflict with recent influential health system rankings.
GBD 2017 Lancet study (of 2015 data)
13
Revisiting the global burden of disease (GBD) 2015 study, the GBD 2017 study ranked countries on mortality amenable to care as measured by a Health Access and Quality Index (HAQ-I), a combination of selected disease-specific mortality rates using principal component analysis. The HAQ-I was then weighed against a mix of development indicators to yield a “frontier” index that was supposed to establish a horizon for health care improvement in each country. The study classified Switzerland as the third and the Netherlands as the ninth best countries by their HAQ-I. Among E.U. countries, the Netherlands was 4th, behind Sweden, Spain, and Finland, and 10th out of 28 according to its frontier index.
We question the validity of the HAQ-I (and thus of the frontier index as well) as an indicator of access to and quality of care because the study ignores the type of access reflected in each index component. For instance, whooping cough-, diphtheria-, and polio-specific mortality are averted by only 3 contacts of a child with health services, given that all 3 diseases are covered by a 3-injection series of the same vaccine; TB-specific mortality is mostly averted by early detection in first-line health services; appendicitis mortality mainly reflects access to district and general hospitals; lymphoma and Hodgkin's mortality mirrors access to university teaching hospitals; and maternal mortality partly reflects access to the entire health services pyramid. However, in the study, access to the DPT vaccine justifies 3 categories (mortality by diphtheria, whooping cough, and tetanus), the combination of which weighs just as heavily as maternal, neonatal, and ischemic heart disease mortality combined. Therefore, the study ignores the fact that Switzerland and the Netherlands ranked low on indicators of access to the full range of health services or indicators of mortality linked to maternal and neonatal disorders, ischemic heart disease, Hodgkin's, and chronic kidney disease (Table 2).
Performance of the HAQ Index in 2015 Against Indicators for Selected Causes of Mortality Amenable to Care Received in the Entire Health Pyramid or in High-Tech Hospitals (Lancet Study Data).
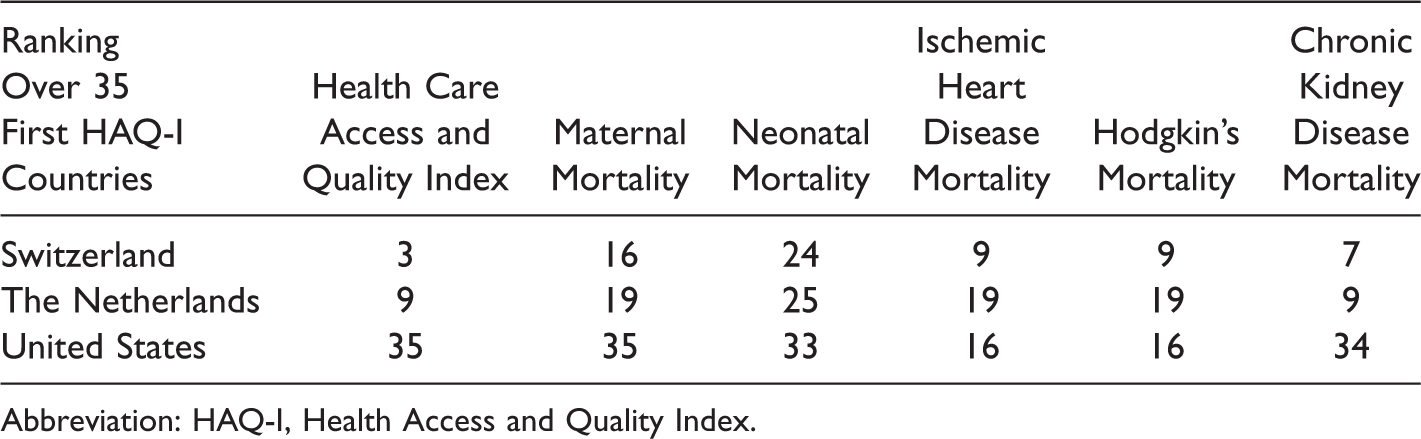
Abbreviation: HAQ-I, Health Access and Quality Index.
In the Netherlands, cancer mortality was comparatively low among those for whom early detection by first-line services improves prognosis considerably (e.g., ranking ninth among OECD countries on cervix cancer age-standardized survival percent over 2010–2014) but higher for the others (ranking 18th for colon cancer, for instance).
72
This can be explained by its outstanding primary care.
b. The European Union Survey of Income and Living Conditions survey (EU-SILC)
15
A 2017 expert panel assessed benchmarking access to care in the European Union while interpreting the EU-SILC survey. The expert panel concluded that the Netherlands had the lowest gap between level of unmet need and the experts’ benchmark based on the member states’ performances in the past 3 years.
The EU-SILC survey (upon which the Netherlands 2017 Country Health Profile assessment of unmet needs is based),16(p10) we contend, cannot be said to reflect unmet health care needs. This is not so much because its sample size is small but because its clusters disregard the population with the highest morbidity and mortality (chronic patients, institutionalized elderly, persons with high health risks, and persons with serious histories of disease). These are the persons who know by experience the entire health system and not merely first-line health services, as in the case of the general population. This leads to an irretrievable bias toward access to general practice (the Netherlands’ first-line services are excellent and there is no deductible for GP care) and a disregard for access to hospitals for those in need, as confirmed by the Dutch ranking on mortality amenable to high-tech hospital care (Table 2).
c. The Commonwealth Fund 2016 Policy Survey
36
According to this survey, the United States ranked last, with 33% of U.S. adults skipping needed care in 2016, just ahead of the Swiss (which was way above the median, as 22% of Swiss adults also forwent care, according to this report). The Netherlands ranked third best with 8% forgoing care because of costs (below the United Kingdom and Germany) and fifth for low-income adults. However, this phone survey of patient experience in the general population in 11 countries suffers from a recall bias toward access to first-line services because, while almost everybody sees their GPs at least once a year, the yearly hospital admission rate is only 10%–12%. The bias toward contacts with GPs is even higher where they are health system gatekeepers (as in the Netherlands). Because of this bias, this study contradicts the above 2014 Dutch government report that states that 22% of adults had to forgo health care in 2013.
d. The Euro Health Consumer Index
14
This OECD report has repeatedly rated the Dutch health system as the best in Europe, based on a “Euro Health Consumer Index” ranking of the OECD countries in 6 criteria classes. Its criteria are questionable because they give equal weight to
“patient rights and information” and “prevention” (e.g., all vaccinations, BP, smoke prevention, traffic deaths, etc., combined) “waiting times” and “health outcomes” (e.g., case fatality rates for AMI and stroke, infant deaths, cancer survival, etc., combined)
Conclusions
Rich people in the United States face more obstacles in accessing health care than poor people in most OECD countries. Insufficient access to hospital care is a concern in the 3 studied countries. The Netherlands, however, managed to maintain good access to effective first-line health services, probably because of their GP culture and no deductibles. This characteristic, while otherwise biasing consumer surveys, creates a relatively cheap but sizeable political advantage for the government.
In international comparisons, Switzerland and the Netherlands classified poorly on disease-specific mortality indicators mirroring access to the full range of health services. Furthermore, while the United States MMR deteriorated steadily over 3 decades, Switzerland and the Netherlands also remained above the MMR, IMR, and NNMR versus the per capita health-spending regression line. Further studies exploring the impact of health financing commercialization on care quality are needed.
While there is little doubt that the United States and Switzerland have had the fastest per capita health expenditure growth rates over the last 2 decades, the Netherlands was not far below. However, to possibly stabilize health expenditures after 2013, access to care had to be restricted, as revealed by the above 2014 Dutch government report. It states: “22% of Dutch adults decided to forgo health care services one or more times in 2013 because of the costs involved…. No other country showed as sharp an increase in the 2010–2013 period.” 45 The Netherlands and Switzerland thus reveal that increasing expenditure on health care enables health systems based on commercial insurance to maintain relatively decent access to professionally delivered health care but for a few years only.
While administrative cost is a well-known cause of health system inefficiency in countries with multiple, for-profit payers, the impact of commercial health insurances on care quality is much less studied.
Commercially managed care is the mark of health care industrialization. It is a key source of insurance-banks profitability in hyper-standardizing clinical decision making and submitting health professionals to guidelines compatible with the economic strategy of the bank. It is reasonable to assume that commercially managed care causes mortality and morbidity amenable to care because
Being incompatible with solidarity in health financing, actuarial management of health funds strains general access to quality health care. Commercial competition fragments health care services and hampers care coordination over institutional divides. In requiring strict application of clinical protocols, commercially managed care is likely to be less favorable to care quality than systems allowing physicians to rely with sufficient freedom on professional decision making.
Admittedly, the Dutch first-line services are an exception to this, but perhaps a temporary one: the high quality of Dutch GPs practice could prove unsustainable because commercial insurances tend to treat non-clinical, medical activities as an opportunity cost and commercial competition strains professional collaboration.
The U.S. health system is generally regarded as the most inefficient system on earth and is also the system where the insurance market has achieved its maximal financial development. The inefficiencies of the Swiss and Dutch health systems are, respectively, just and not far below. The other health spending front-runners are countries such as Germany, France, and Norway, where the rich are increasingly insured in the private sector despite no legal obligation to purchase private insurance. Colombia and Chile provide other nationwide, long-term experiences showing that health-financing commercialization causes inequitable and inefficient health care systems.
In conclusion, it is reasonable to assume that U.S., Dutch, and Swiss health care systems are inefficient and that commercial health care financing lies at the origin this situation. Europe spends 6%–7% less of its GDP on health than the United States. If social security were privatized, as in Switzerland and the Netherlands, more than a trillion U.S. dollars could shift to commercial health insurance companies and hospitals in Europe. Even if public health stakes and the right to health care are irrelevant to them, economic actors outside the health sector should be concerned by the growth rates of family and government health expenditures when health insurances are privatized.
Footnotes
Authors' Note
Pierre De Paepe is retired from the Instituut voor Tropische Geneeskunde, Antwerp, Belgium and is now a self-employed physician researcher.
Declaration of Conflicting Interests
The authors declared no potential conflicts of interest with respect to the research, authorship, and/or publication of this article.
Funding
The authors received no financial support for the research, authorship, and/or publication of this article.
Author Biographies
![]()