
Abstract
High or rising economic inequality can exacerbate political inequalities and is plausibly linked with some social harms, such as health problems and declines in happiness and trust. Within-country income inequality increased sharply across most of the world since the 1980s. One prominent critical sociological account of this occurrence points toward institutions of free-market capitalism, or “neoliberalism,” as a key cause that unleashed inequality during the globalization age. This article empirically operationalizes free-market institutions with the use of Fraser Institute’s index of economic freedom and examines the issue with fixed-effects regressions in a novel dataset of 130 countries between the years 2000 and 2021. It finds a substantial positive correlation between the two variables in the developing, though not the developed, world. This finding is robust to a variety of alternative specifications. Moreover, across specifications, modest size of government and freedom of international trade stand out as the two clear components of economic freedom driving the aggregate relationship. Finally, mediation analysis suggests there also exists an indirect ameliorative relationship between economic freedom and inequality through the conduit of economic development.
Introduction
Economic inequality, most commonly but not exclusively measured as inequality of incomes between citizens within a country, is one of the most pressing social issues today. Even as the average economic gap between countries has narrowed (Milanovic, 2016) and as global extreme poverty has declined (Roser and Ortiz-Ospina, 2022 [2013]), inequalities within countries have nevertheless increased. Regardless of whether one uses the Gini index (Solt, 2020; SWIID, 2024) or the top 1 percent share of total income (WID, 2023), inequality today is notably higher than it was in the 1960s and 1970s. Within countries (averaged across the globe), the top 1 percent of income earners control almost 20 percent of all societal income, while the bottom 50 percent account for less than 10 percent of the total income (WID, 2023).
Some scholars admit the sharp rise in inequality but deny its central importance and the potential social harm it causes. In her critical review of Thomas Piketty’s Capital in the Twenty-First Century (Piketty and Goldhammer, 2014), the libertarian economist Deirdre McCloskey (2015: emphasis added) charges: What is worrying [him] is that the rich might possibly get richer, even though the poor get richer too. His worry, in other words, is purely about difference, about the Gini coefficient, about a vague feeling of envy raised to a theoretical and ethical proposition.
However, the notion that inequality does not matter, at least if absolute poverty is not increasing at the same time, is misguided for at least two reasons. First, it does not account for the possibility that inequality exacerbates political inequality and various forms of social mobility. Second, wide-ranging research suggests that rising inequality is either correlated with, or in some cases even causally related to, a series of large social problems, such as certain health problems (Matthew and Brodersen, 2018; Pickett and Wilkinson, 2015), decreases in happiness and generalized trust (Graafland and Lous, 2019; Yu and Wang, 2017), and even homicidal crime (Nivette, 2011). Some of these studies are not definitive, and several of the more popularly cited findings have been overturned (see the wide-ranging report by Rowlingson, 2011; see also Saunders, 2010), but the notion that inequality is robustly correlated with at least some crucial social problems, even if it is not exacerbating material hardship, has withstood the test of time and meta-analytic methods (Nivette, 2011; Ribeiro et al., 2017; Rowlingson, 2011; though Kim et al. (2022) are somewhat more reserved).
One prominent strand of critical sociological and broader social-scientific research points toward institutions of free-market capitalism, or “neoliberalism,” as the main culprit for rising inequality (see, for instance, Fahnbulleh, 2020; Ghodsee and Orenstein, 2021; Harvey, 2005; Klein, 2007; Ostry et al., 2016). On the surface, at least, the idea can be naively corroborated simply by consulting the evolution of inequality throughout the world since 1980, commonly dated as the start of the neoliberal period. As already described above, the 1980s and 1990s have seen a big surge in income inequality.
However, the idea that free-market institutions and inequality are linked also presents certain interesting complexities. First, one commonly used quantitative measure of such institutions (namely, the index of “economic freedom”) reveals a mixed picture with regard to its inegalitarian correlates (see, for instance, the review in Bennett and Nikolaev, 2017), though more recent studies seem to reaffirm the view that economic freedom exacerbates inequality (see Bennett, 2024). Second, the critical literature has sometimes tended to be methodologically thin when making its main claims. For example, Norberg (2008) pointed out serious quantitative flaws with Klein (2007), noting that she does not rely on official, longitudinal government or international statistical data and trends to support her thesis but instead on single-year data sourced from newspapers and speeches. Third, the evolution of inequality since the year 2000 has surprisingly been quite different compared with the last two decades of the 20th century. As explored in more detail in the following section, income inequality rose sharply in most countries across the world between 1980 and 2000. In the first two decades of the new century, however, inequality had first stopped rising and later even notably declined.
Employing panel data for 130 developed and developing countries with the fixed-effects estimator, this article examines the over-time relationship between free-market economic institutions and income inequality in the post-2000 period (up to 2021), quantitatively measuring free markets with use of the Fraser Institute’s index of economic freedom.
The article’s most important contributions to existing research have to do with (1) its large global sample, covering 28 developed and 102 developing countries, and (2) its explicit (though not exclusive) focus on the post-2000 period, which has seen a starkly different dynamic of within-country inequality as compared with the 1980–2000 period (for more on this, see the following section). Most existing quantitative studies employing the index deal only with time-periods starting around 1970s or 1980s and ending within the first decade of the 2000s (Apergis and Cooray, 2017; Bergh and Nilsson, 2010; Clark and Lawson, 2008; De Haan and Sturm, 2017; Kwon, 2016; Scully, 2002), and their samples are either solely composed of developed countries or highly biased toward them. A few are more global in scope, but they still remain relatively limited (n < 80/90). There are exceptions, like the paper by Pérez-Moreno and Angulo-Guerrero (2016), which deals with the post-2000 period. However, their study is limited solely to the European Union (EU) countries and does not have a global scope. There is another recent paper (Machado and Fuinhas, 2023) explicitly dealing with the post-2000 period, which has a global focus, but its sample is limited to 102 countries (the present study has a sample of 130) and it measures inequality before taxes, not inequality in actual disposable income. Moreover, the paper does not distinguish between developed and developing countries, as is also the case for most of the existing literature. The present article aims to close these and related gaps in the literature.
Inequality, free-market institutions, and “economic freedom”: conceptual background and literature review
Free markets and inequality before the 21st century
In the last two decades of the 20th century, income inequality sharply increased after having substantially decreased in the three decades following Second World War (Piketty and Goldhammer, 2014; WID, 2023). One measure of inequality, the share of total income held by the top 1 percent of earners, shows an increase of within-country inequality (represented as a world average) of more than three percentage points (from 17.2% in 1980 to 20.4% in 2000). The most reliable and commonly used inequality measure for comparative purposes, taken from the Standardized World Income Inequality Database (SWIID, 2024), shows the same trend. In 1988, the within-country inequality of disposable income (after taxes) was on average at a Gini of roughly 36 (0 being total equality in incomes between citizens of a country and 100 being total inequality). It then increased to a Gini of almost 40 by the early 2000s (see Figure 1).
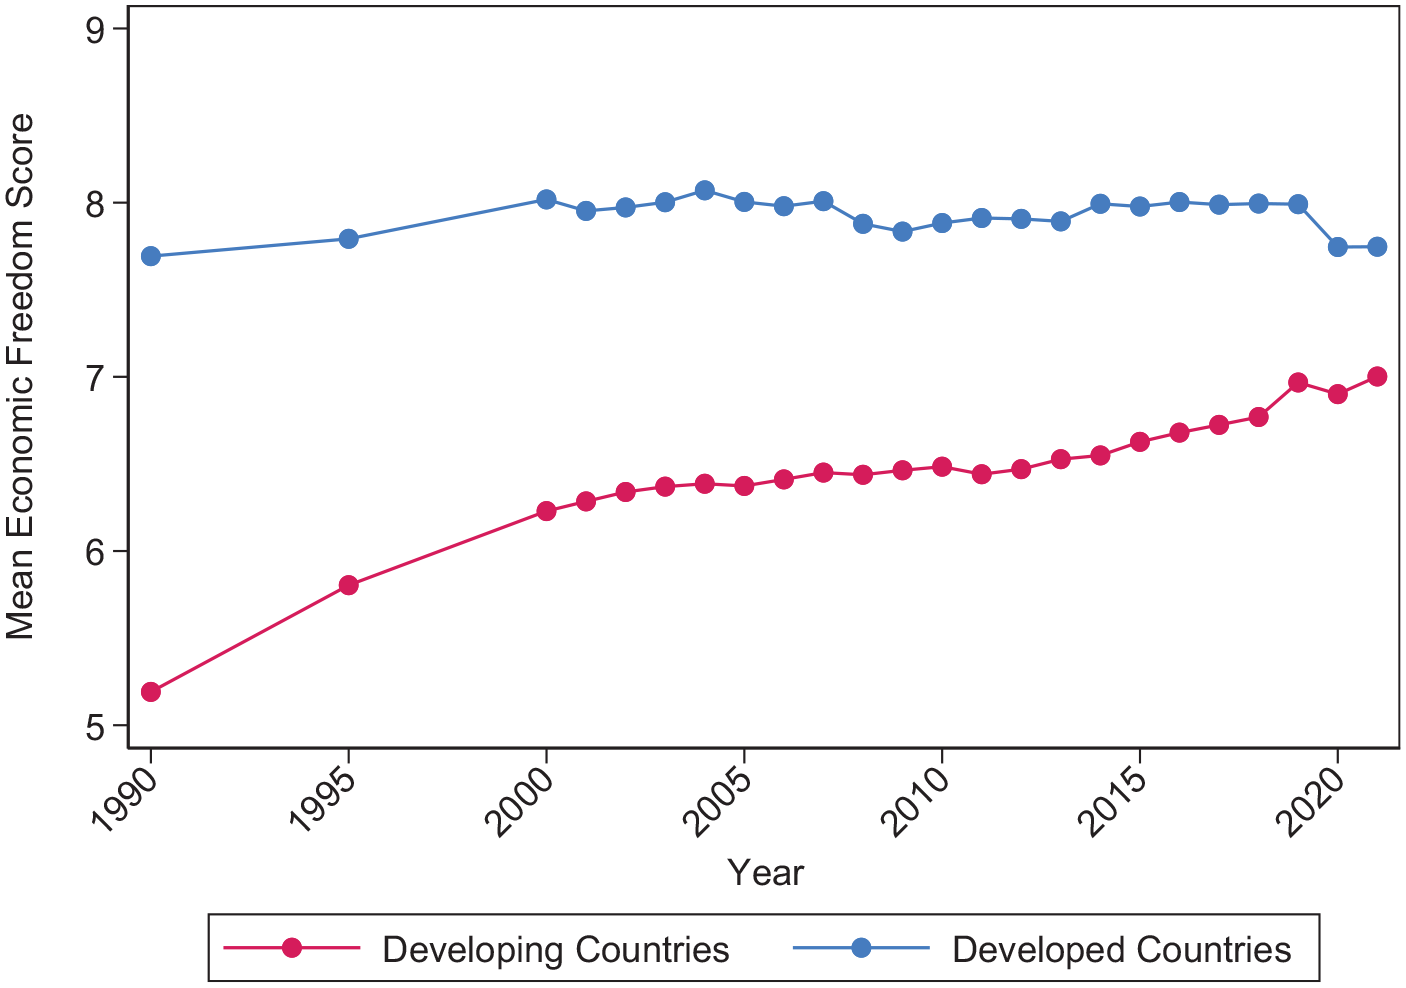
Average economic freedom in developing and developed countries, 1990–2021.
One prominent account for this sudden and large increase in the scholarly literature singles out the phenomenon of liberalization, “neoliberalism,” or free-market capitalism as the main culprit (Harvey, 2005; Klein, 2007; Kwon, 2016; Ostry et al., 2016). The time frame fits almost exactly the US and UK election, respectively, of Ronald Reagan and Margaret Thatcher, two politicians who are widely regarded as neoliberal, but also the rise to power of Deng Xiaoping in China, the entrenchment of Augusto Pinochet’s rule in Chile, and the economic shock therapy administered to post-communist Central and East European states after the end of the Cold War in the 1990s (Ghodsee and Orenstein, 2021; Harvey, 2005; Klein, 2007).
Neoliberalism is a complex phenomenon, but most contemporary research converges on construing its core as the implementation of various free-market institutional reforms, such as the so-called “triumvirate” of privatization, deregulation, and liberalization, or more generally as the promotion of market-based principles for the structuring of social life (Boas and Gans-Morse, 2009; Harvey, 2005; Stiglitz, 2019; Venugopal, 2015; see also the recent synthetic review in Rutar, 2023). The last two decades of the 20th century were also the decades of globalization ramping up, which is typically seen as being tied to free markets, especially with respect to trade liberalization (Stiglitz, 2002, 2019). Perhaps most clearly, the Fraser index of economic freedom (Gwartney et al., 2022), which quantitatively measures key aspects of neoliberal, free-market institutions (such as the “burden” of taxation, the “generosity” of the welfare state, security of private property, how regulated business are, how free international trade is, and so on) notably increased between 1980 and 2000, although the biggest increase happened during the 1990s. This index, which will represent the main independent variable in the empirical part of the present study, is discussed in more detail in the following section.
Free markets and inequality after the year 2000
Although the era of free-market reforms is commonly dated to the 1980s, such a dating is likely very biased toward developed countries in North America and (Western) Europe. Taking a more global perspective, which incorporates developing countries as well, it is not at all clear that deep free-market reforms had already started being implemented during that same early period. Indeed, a recent paper (Easterly, 2019: 3) on the Washington Consensus package of free-market reforms finds that, in the developing world, “there has been additional and quite remarkable progress on reform outcomes since the late 1990s . . . Earlier judgments on the reforms often happened before the reform process was complete and/or had enough post-reform growth data to evaluate reforms.” Relatedly, another recent study (Grier and Grier, 2021) using the economic freedom index to measure free-market reforms provides a global list with timings of the onset of sustained reforms (defined as an increase in the index equal to or greater than 1.0 over a 5-year period, which is then sustained for at least the following 10 years). In all, 72 percent of such reforms happened between 1990–1995 and 1995–2000, or even after 2000, not already in the 1980s.
Another related point is that, according to the index of economic freedom, the absolute level of economic freedom around the globe before the mid-1990s was not that high (around 5.5 on a scale between 0 and 10). In fact, global economic freedom in the year 1990 was even slightly lower than it had been in the decidedly non- or pre-neoliberal 1970. Only in the year 2000 does global economic freedom pass 6.5. Moreover, economic freedom continued increasing from the year 2000 until 2019 (from around 6.5 at the start to 6.8 before the pandemic). In fact, this is the first sustained, 20-year period with a relatively high level of global economic freedom (above 6.5 throughout the period). Only the short period between 1995 and 2000 was roughly comparable in that the index was above 6.0 at both time points (namely, 1995 and 2000). See Figure 1, which disaggregates the trajectory of economic freedom for developing and developed countries, for more detail.
Some critical voices, too, see the 21st century as the era in which global neoliberalism has finally established itself as truly dominant. As Caplan and Ricciardelli (2016) state, In the early 21st century, neoliberalism is the prevailing economic paradigm in most parts of the world, and it is expressed through free trade, the privatization of public services, and the belief in the market as the ultimate expression and provider of human freedom. (p. 22)
At the same time, an interesting and often overlooked shift in the dynamics of income inequality has happened after the start of the 21st century. As Clark (2020) reports, “The narrative of rising inequality across the world is now outdated (p. 15).” He continues, “Little attention is given” to this new fact “that inequality levels have stabilized since the early 2000s, and have even started to decline in many cases” (Clark, 2020: 2). According to various datasets and measures of income inequality, within-country inequality in most of the world stopped increasing and has even declined in the 21st century. The pre-tax income share of the top 1 percent has declined from 20.8 percent in 2005 to 19.5 percent in 2021 (WID, 2023). The post-tax income share has followed the same trajectory, falling from 15 percent in 2003 to 13.8 percent in 2019 (Gethin, 2024). Figure 2 presents standardized estimates of disposable-income Gini (taken from SWIID, 2024) and depicts the same trend. (See also Figures 1A and 2A in the Supplemental Appendix, which present standardized estimates of Gini based on non-imputed data from UNU-WIDER (2023), which are less uncertain but have almost 50% fewer observations; I say more on data limitations later.)
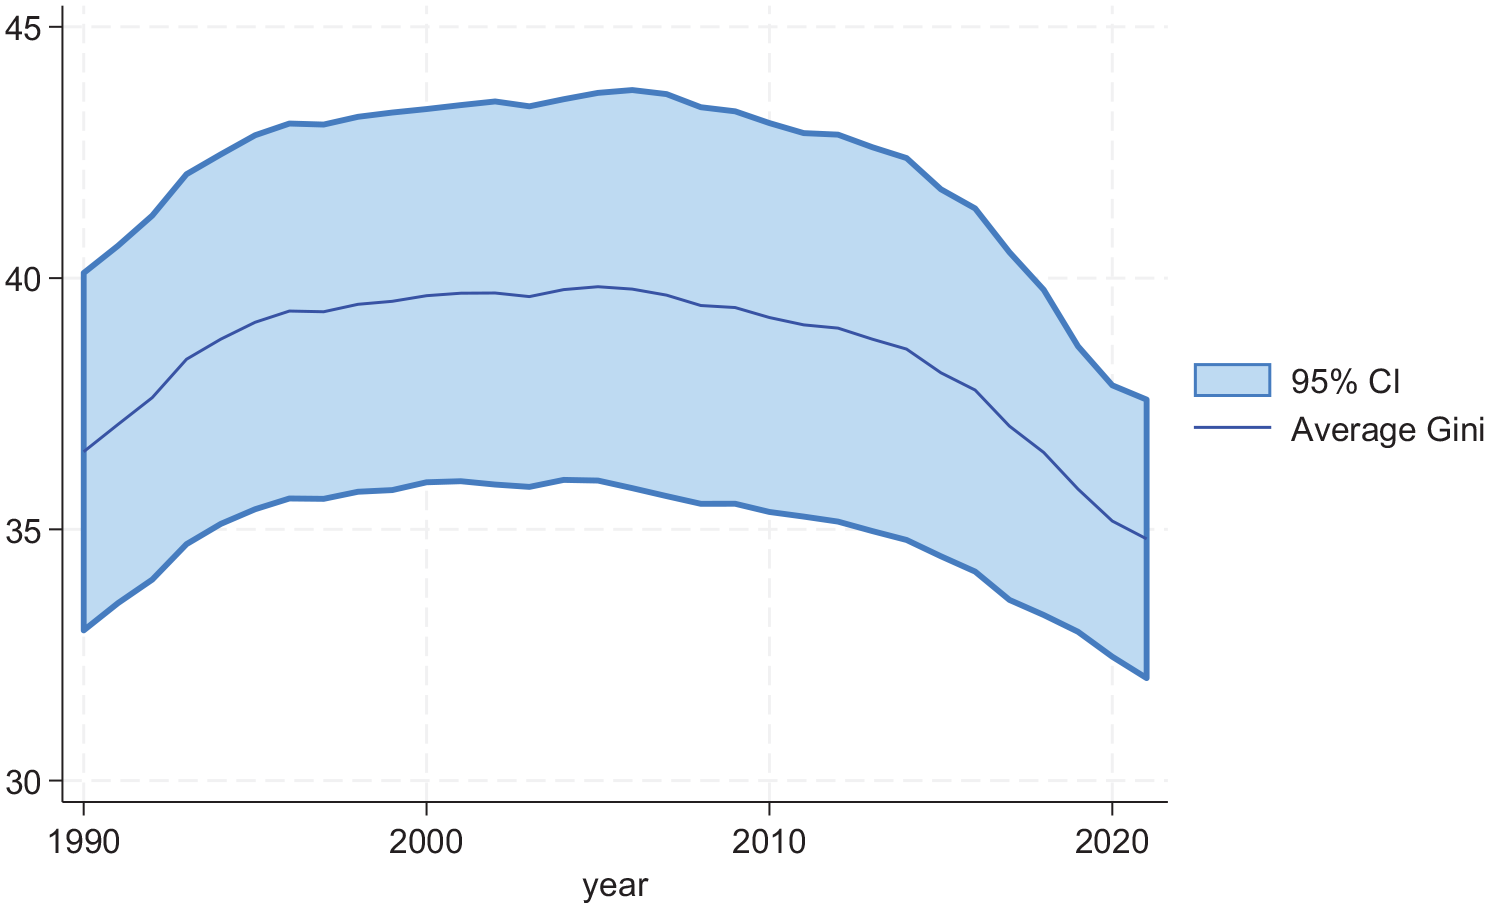
Average within-country Gini of disposable income, 1990–2021 (shaded area represents 95% confidence interval).
Looking at inequality disaggregated by developed–developing country status (Figure 3), evidence of likely cross-country heterogeneity can be seen. On average, the drop in inequality has happened in developing countries, while developed countries’ inequality has been stagnating since 2000. Nevertheless, the fact remains that the majority of countries have seen their income inequality decrease in the 21st century, which is why a global perspective, represented primarily by developing countries, likewise evinces overall decline.
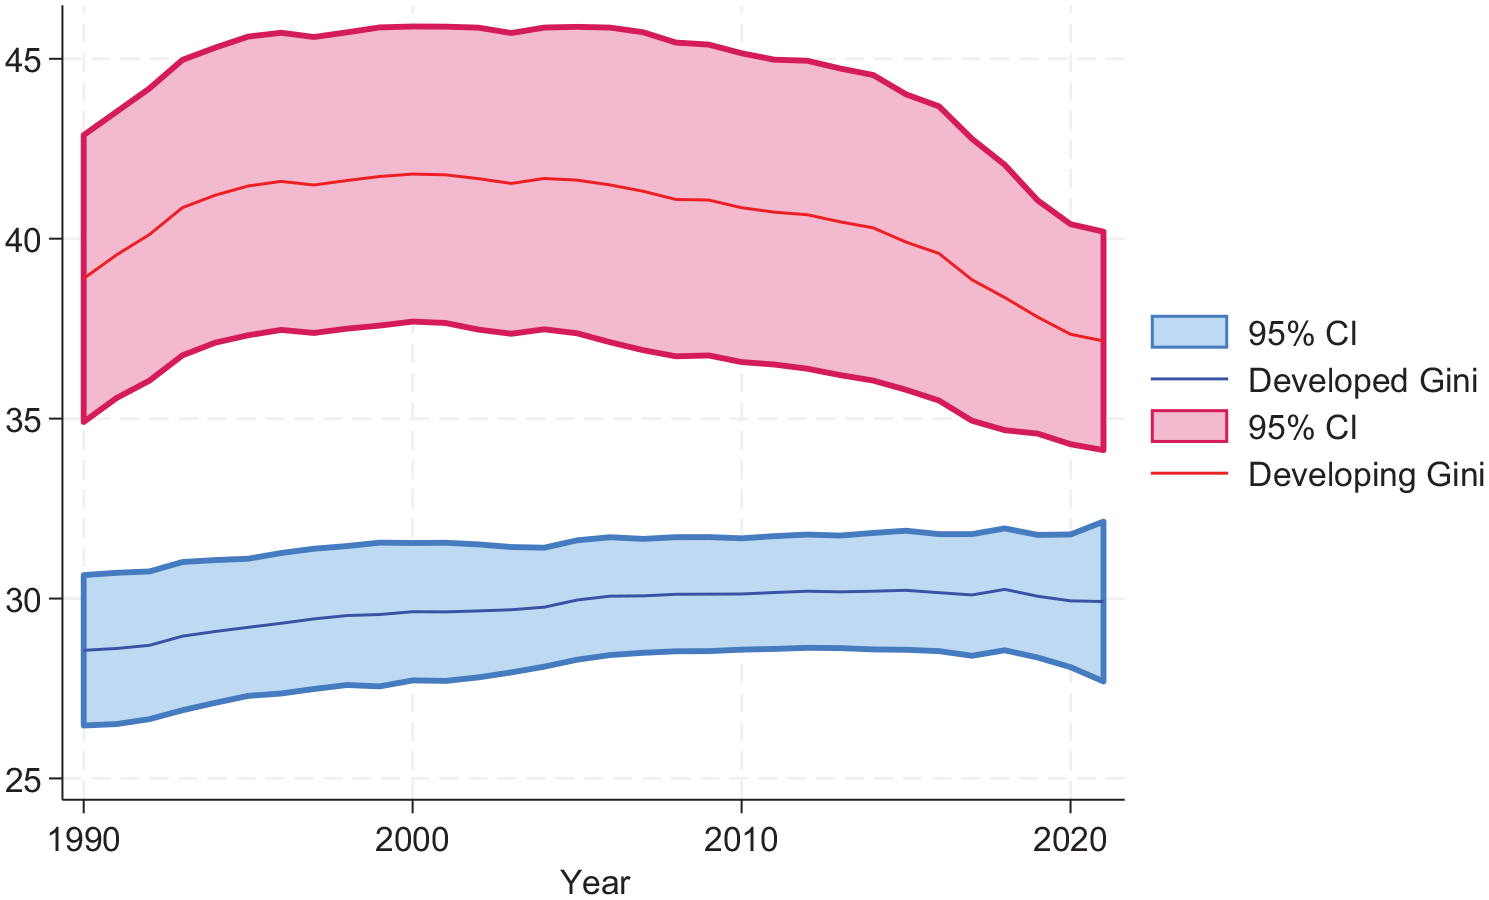
Average within-country Gini of disposable income in developed and developing countries, 1990–2021 (shaded area represents 95% confidence interval).
These two striking developments—namely, free-market reforms being robustly implemented and becoming entrenched across the world in the years around 2000, and within-country inequality from 2000 onwards stagnating and then even declining—along with a methodological consideration motivate the primary research question of this article: does the link between economic freedom and inequality still persist, even while inequality is generally falling? Methodologically speaking, this question has to do with the fact that global data coverage, especially with respect to economic freedom and Gini, is poor before the year 2000. As will be explained later on, the count of joint observations in the 1980–2000 period is less than 15 percent of the observations during the 2000–2021 period, which militates against merging the two asymmetric periods into a single one. This, then, is an important methodological issue that additionally motivates the focus on the post-2000 period.
Theoretical background on economic freedom and income inequality
Why would free-market institutions exacerbate inequality? There are several concrete theoretical mechanisms explaining the link.
First, secure private property rights make the nationalization of the means of production, or wealth more generally, much less likely. And if the wealth and capital remain in private hands, then the revenue or income accruing thereof also remains more concentrated, leading to higher income inequality. This can have further deleterious effects for income inequality as those with higher incomes can mobilize their monetary resources to gain even more income in a dynamic known as the “Matthew Effect” (Słomczyński and Janicka, 2008).
Second and perhaps more importantly, shrinking the size of government (i.e. by reducing taxes or cutting government spending and transfers) can increase inequality of disposable income simply because many less well-off citizens depend on government redistribution for an important part of their income. The bottom 10 percent of income earners are typically mostly excluded from participating in the market and so their fate is largely in the hands of redistribution (see Kenworthy, 2011). Higher deciles, too, can see their relatively small incomes significantly boosted by government redistribution, which reduces overall inequality (Causa and Hermansen, 2017).
Third, some forms of deregulation, such as excessive financial and labor deregulation, can increase the bargaining power of already strong market actors, enabling them to capture a larger share of income than before. For instance, there is robust evidence showing that due to imperfect competition, businesses in many labor markets enjoy disproportionate market power over labor (see the review by Manning, 2021). This partly enables them to create wage markdowns, regularly resulting in labor receiving wages that are around 20 percent lower than they should be, given a perfect competitive benchmark (see the broad review in Card, 2022). Such market failure can be further exacerbated with more deregulation, and it can at least in principle be corrected with certain regulatory rules that increase labor’s market power. Further deregulation would then be associated with increases in income inequality, while proper regulation could decrease inequality.
Finally, liberalized international trade (in the form of reduced tariff and non-tariff barriers, removal of capital controls, and so on) allows for more competition, which can lead to more creative destruction and the disappearance of whole sectors of industry. Overall, this should increase most people’s real incomes as prices decrease in light of more automation and efficiency gains (due to increased international competition), but certain social groups can see sharp decreases in their wages or total loss of employment due to cheap foreign competition (Autor et al., 2013).
It should be noted that the link between free-market institutions and income inequality is not necessarily one-way, at least not in theory (Bennett, 2024: 212). Some of the mentioned mechanisms could imaginably also work to decrease inequality to an extent. For instance, some forms of regulation increase rent-seeking and allow for regulatory capture, which channels income from ordinary citizens into the pockets of the rich and politically well-connected (see the textbook treatment in Holcombe, 2016). In this case, deregulation could reduce such pernicious rent-seeking and regulatory capture, and in so doing help decrease inequality.
In principle, the same goes for liberalized international trade, especially if government programs for job retraining exist and are well crafted (Autor et al., 2016). Such programs could ameliorate the harm from trade shocks, while trade liberalization could at the same time help dismantle formerly monopolistic or oligopolistic firms and increase incomes of ordinary citizens by reducing prices.
In addition, because not only market failure but also government failure happens (Holcombe, 2016), countries with a large size of government (namely, a large percentage of state-owned enterprises, and increasing government consumption spending and investment) might be more prone to resource misallocation and misaligned incentives, which can “reallocate resources regressively” (Bennett, 2024: 212).
Finally, if free-market institutions manage to unleash more economic growth, which is fairly well established in the quantitative literature (see the review in Lawson, 2022), they could theoretically have indirectly beneficial effects for income inequality as, at least in the long term, higher economic development can help with democratization (see the review in Treisman, 2020) and intergenerational income mobility (Callais and Geloso, 2023), which can in turn help reduce inequality.
What does the empirical literature tell us about the connection between free-market institutions and income inequality? Perhaps unsurprisingly, given the complexity just noted, existing research is indeed somewhat mixed (see the review in Bennett and Nikolaev, 2017). Depending on a variety of factors, such as sample size (some studies use small samples), being focused either on developed or developing countries, the exact time-period under examination, and whether researchers look for threshold effects, the index of economic freedom turns out to have a positive, negative, or even neutral relationship with inequality. Larger and more recent studies, such as De Soysa and Vadlamannati (2021a) and Machado and Fuinhas (2023), likewise suggest an interesting duality, which is confirmed by the present article. On one hand, aggregate economic freedom is quite clearly directly associated with higher inequality. It is true that some of its subcomponents can point in different directions (say, modest government size increases it, while deregulation decreases it, as found by Machado and Fuinhas (2023)), but the aggregate relationship is clearer and mostly positive. On the other hand, economic freedom seems to be indirectly associated with decreases in inequality through various conduits, such as development and increased mobility. Thus, the net relationship is complicated.
Neither complication should be seen as surprising. As discussed above, there are understandable theoretical reasons for thinking that various components of economic freedom might have different (positive and negative) direct effects on inequality. Moreover, because economic freedom is robustly positively associated with economic development (Lawson, 2022), while economic development typically has a negative (or, alternatively, Kuznets-type) relationship with inequality, it should not be surprising to find an indirect, negative association between economic freedom and inequality, even if the direct (ceteris paribus) relationship is positive.
In addition, the effect of economic freedom on inequality might be heterogeneous across country types. For instance, whether a country is considered as developed or not might moderate the relationship between economic freedom (as well as its components) and inequality. This might be so because both societal types might have certain enduring differences, differences not captured solely by a simple control covariate for development (such as GDP per capita). The so-called “Deep Roots” research literature (for a review, see Spolaore and Wacziarg, 2013) argues, and is uncovering, strongly entrenched, long-term historical factors that have shaped the economic and social trajectory of societies across centuries and even still today. These factors, such as colonial legacies or entrenched cultural differences, might be responsible for enduring heterogeneity between developed and developing countries, which might influence present-day economic freedom to be associated with inequality differently across social types. To a large extent, this is likely already handled by the fixed-effects estimator I use to handle the panel structure of my data, because the estimator uses each country as its own control and thus expunges unobserved time-constant heterogeneity. Nevertheless, as explained below, I additionally test for the effects of developmental heterogeneity by using a term for the interaction of economic freedom and countries’ developmental status. I followed the International Monetary Fund classification of advanced societies to construct the developmental dummy variable, making sure to tag only those countries that have been classified as advanced by the IMF for a large majority of the time-period under investigation (namely, at least 70% of the time).
Materials and methods
I use a panel data sample of 130 countries between 2000 and 2021 to regress the Gini of post-tax disposable income (but also, in robustness checks, other measure of inequality) on the Fraser Institute’s index of economic freedom. For the list of countries, see Table 3A in the Supplemental Appendix. To handle the panel structure of the data, I follow standard protocol and use the fixed-effects ordinary least squares (FE OLS) estimator in my baseline models. To remedy omitted-variable bias, all regressions include a rich set of control variables and, as is explained in more detail below, all regressions rely on country-fixed effects, which helpfully control for all time-invariant unobserved heterogeneity between countries. The 2021 cutoff year was chosen to ensure the highest amount of data coverage along all variables while at the same time allowing for the examination of a longer period of time.
The baseline FE OLS model can be represented by the following equation

In the equation, Yit represent the dependent variable (Gini of disposable income) for country i at time t. β0 is the intercept. β 1 is the coefficient associated with the main independent variable (economic freedom index) and Xit is the main independent variable for country i at time t. γi represents the country-fixed effects. β 2 is the coefficient associated with the control variables, and Zit represents the set of my control variables.
I have drawn the data for my variables from multiple official sources, such as the World Development Indicators (World Bank, 2023), SWIID (2024), Fraser Institute (Gwartney et al., 2022), UNU-WIDER (2023), and the V-Dem Institute (2023). The specific source for each individual variable is detailed in Table 4A in the Supplemental Appendix. Descriptive statistics are reported in Table 2A in the Supplemental Appendix.
The Hausman test indicates that the fixed-effects estimation is preferable over the random-effects estimator. The Wooldridge test for serial correlation shows that I am able to reject the null hypothesis of no first-order autocorrelation (p < 0.0000), which means that the data exhibit problematic serial correlation. Moreover, the modified Wald test for heteroskedasticity likewise shows that I am able to reject the homoskedasticity hypothesis (p < 0.0000), which means that the fundamental ordinary least squares (OLS) assumption is violated in the dataset. To remedy these common issues with panel datasets, I follow the standard advice in methodological and applied research and calculate robust standard errors clustered at the country level throughout. Other issues commonly discussed in the literature, such as multicollinearity or influential outliers, do not show up in my models. Correlations between independent variables are sufficiently low.
Due to recent methodological warnings against running two-way fixed-effects regressions (e.g. Hill et al., 2020; Kropko and Kubinec, 2020), which are being heeded more and more in applied research (see De Soysa, 2022), I run and report only one-way fixed-effects regressions—namely, those based on country-fixed effects—to obtain my baseline findings.
The regressions in this article are based on the within-estimator, so the regression coefficients should be read as indicating the over-time averaged relationship between the variables within each individual country. In other words, these models are not showing mere cross-sectional associations between economic freedom and inequality (i.e. “Are more economically free countries also more unequal?”) but panel associations (i.e. “Do countries that over time become more economically free also become more unequal?”). This also means that unobserved heterogeneity between countries (that is time-invariant) is controlled for, which makes the coefficients more apt for causal inference. In themselves, panel data and fixed-effects regression of course do not necessarily assuage all or even most concerns about endogeneity. However, they do guard against time-constant unobserved heterogeneity, which is an endemic problem with ordinary cross-sectional data and models.
The main independent variable and controls
The main independent variable of interest is the index of economic freedom, which is published annually by the Fraser Institute (Gwartney et al., 2022). The aggregate index is composed of five categories, which are themselves composed of various subcomponents listed in detail in Table 1A of the Supplemental Appendix. The Fraser Institute does not subjectively score countries but uses exclusively third-party sourced data from the World Bank, The Global Competitiveness Report, and so on, to construct the index.
The five major categories making up the index are (1) size of government, (2) legal system and property rights, (3) sound money, (4) freedom of international trade, and (5) regulation. Both the aggregate score and the five categories run on a scale from 0 to 10, 10 being the highest level of economic freedom. Practically, this means that countries like Hong Kong or the United States, which were both at the top of the list in the year 2020, have a modest government size, robust legal system and property rights, low inflation (sound money), very liberalized international trade, and a modest regulatory environment. It is also in this sense that the article relies on the economic freedom index as a proxy measure for free-market capitalism. Both Hong Kong and the United States score among the most “economically free” countries in the world as described above, and so I take them to be among the most free-market in the world. Examining the top 10 list, one can see on it most of the other countries commonly described as the most free-market, or “neoliberal,” in the world (see, for instance, Harvey, 2005; Klein, 2007), such as Singapore and Estonia, and the Anglo countries such as New Zealand, Australia, and Ireland.
The index of economic freedom has been used in published quantitative research by many scholars, including sociologists and political scientists, as a proxy measure for free-market, “neoliberal” capitalism. For instance, McLean et al. (2019) used the index to examine the relationship between, as they put it, “neoliberalism and homicide.” The political scientists De Soysa and Vadlamannati (2021a, 2021b) have used the index in myriad publications as a proxy for, as they put it, “free markets” or “free-market capitalism.” Okunlola et al. (2022) recently used the index to investigate the question, “Does a free market system reduce conflict in Africa?.” Kwon (2016) uses the index to measure “market liberalization” and its effects on inequality. More broadly speaking, the index has been used in hundreds of quantitative papers across social-scientific disciplines (for a recent exhaustive review, see Lawson, 2022).
Being able to disaggregate the index in its five categories is very useful, especially because some could take issue with one or two categories really indicating free-market institutions. For instance, it could be claimed that the category of legal system and property rights mostly does not reflect free-market capitalism, focused as it is not just on private property but also factors such as the reliability of police or the independence of the judiciary. I handle this issue below by running all regressions not just with the aggregate score but also by disaggregating it into its five components.
To mitigate confounding in the analyses, I employ three main sets of control variables, along with additional ones used in unreported regressions, which will be described later (for the whole list of variables and their sources, see Table 4A in the Supplemental Appendix).
The first set of controls employed in baseline models is as follows: GDP per capita (logged to remedy extreme values and adjusted for inflation and differences in purchasing power) to control for the level of economic development, liberal democracy index to control for the nature of the political regime and the level of political and civil rights, population size (logged to remedy extreme values), trade openness (which is a sum of exports and imports as a percent of GDP, logged), inward flow of foreign direct investment (FDI), also logged, and trade globalization index, a broader measure of countries’ trade characteristics to control for the level of globalization (along with trade openness and inward FDI flow). My baseline models do not include more control variables than this to avoid overcontrolling.
In robustness checks of the baseline model, I employ a second set of common controls (alongside the original ones). These include the unemployment rate (as percentage), ratio of oil rents to GDP to control for how much a country’s development is dependent on oil exports, GDP growth rate to control for episodes of economic boom, bust, and stagnation, labor participation rate, and youth share of the total population to represent a potential youth bulge.
The third set of controls aims to act as an alternative operationalization of economic development, which eschews the standard GDP per capita measure and instead models development through a series of specific economic variables, namely, the shares of industrial and agricultural employment, sector pluralism (which is a multiplication of shares of industrial, agricultural, and service employment, following Clark, 2020), population growth, and tertiary education enrolment. Combined, these variables represent the modified Nielsen–Alderson core model, which is an alternative way of capturing a potential nonlinear relationship between economic development and inequality (the Kuznets curve), and one which does so better than the original core model, at least under the post-2000 era conditions (see Clark, 2020).
Additional controls, including female labor participation rate and outward FDI flow, have also been included in yet additional regressions that have not been reported to conserve space (these controls are statistically not significant and do not affect the results).
All control variables have been drawn from the relevant econometric and sociological literature on income inequality, especially those investigating inequality in the context of economic freedom, development, and globalization (see, for instance, Clark, 2020; De Soysa and Vadlamannati, 2021b; Kwon, 2014, 2016; Kollmeyer, 2015). Because they are theoretically likely to confound the relationship between economic freedom and inequality, their purpose is to remedy omitted-variable bias as much as possible. For instance, on one hand, countries that are more economically free tend to also be more economically developed, globalized, and democratic (Gwartney et al., 2022). So, if there is a correlation between economic freedom and inequality, this could plausibly be accounted for by either the level of development or democracy, not economic freedom itself. On the other hand, countries experiencing a deep economic crisis or having a larger size of the population would probably tend to be less economically free. If they also turn out to be less (or more) unequal, this could in principle be attributable either to how economically free they are or to the fact that they are crisis-ridden and large.
Dependent variable
The Gini index of post-tax disposable income represents the dependent variable. The variable is represented on a scale from 0 to 100, where 0 means total equality of incomes between citizens in a society and 100 means total inequality (meaning that one person has all the societal income). The data for this variable have been sourced from the latest version of the Standardized World Income Inequality Database, version 9.6 (SWIID, 2024; see also Solt, 2020). Instead of using other measures of income inequality (such as top income shares) or forms of income inequality (such as pre-tax or market income), I opt for this inequality variable because it is standardized explicitly for purposes of comparative, cross-national research, which also maximizes data coverage across years and countries (Solt, 2020). Moreover, the income inequality that likely matters most for people’s lives and their social interactions is the inequality in the actual, real income (purchasing power) that exists between them. Finally, the pre-tax measure obscures the extent of redistribution in societies, which is problematic if what we are interested in is the relationship between free-market institutions and actual income inequality. That is why the post-tax disposable income should be looked at.
A crucial way in which SWIID maximizes data coverage is by multiply imputing the Gini data. This means that even though the data are standardized, they at the same time remain limited for purposes of cross-country and over-time comparisons because they still contain a notable amount of statistical uncertainty. This is handled in the present study in two ways. First, following Solt (2020), I incorporate this uncertainty in my regressions by estimating all the models with the mi estimate command in Stata, which uses the reported standard errors of the SWIID estimates. Second, as a robustness check, I report alternative regressions using Gini estimates based on more direct, non-imputed data appearing in the World Income Inequality Dataset, or WIID (UNU-WIDER, 2023). These data are less statistically uncertain, because of being more direct, but because of that, they also offer much less coverage (almost half fewer total observations as compared to SWIID). In other words, there are trade-offs in using one or the other dataset, so I use both to cross-verify the robustness of my results.
Results
Baseline results
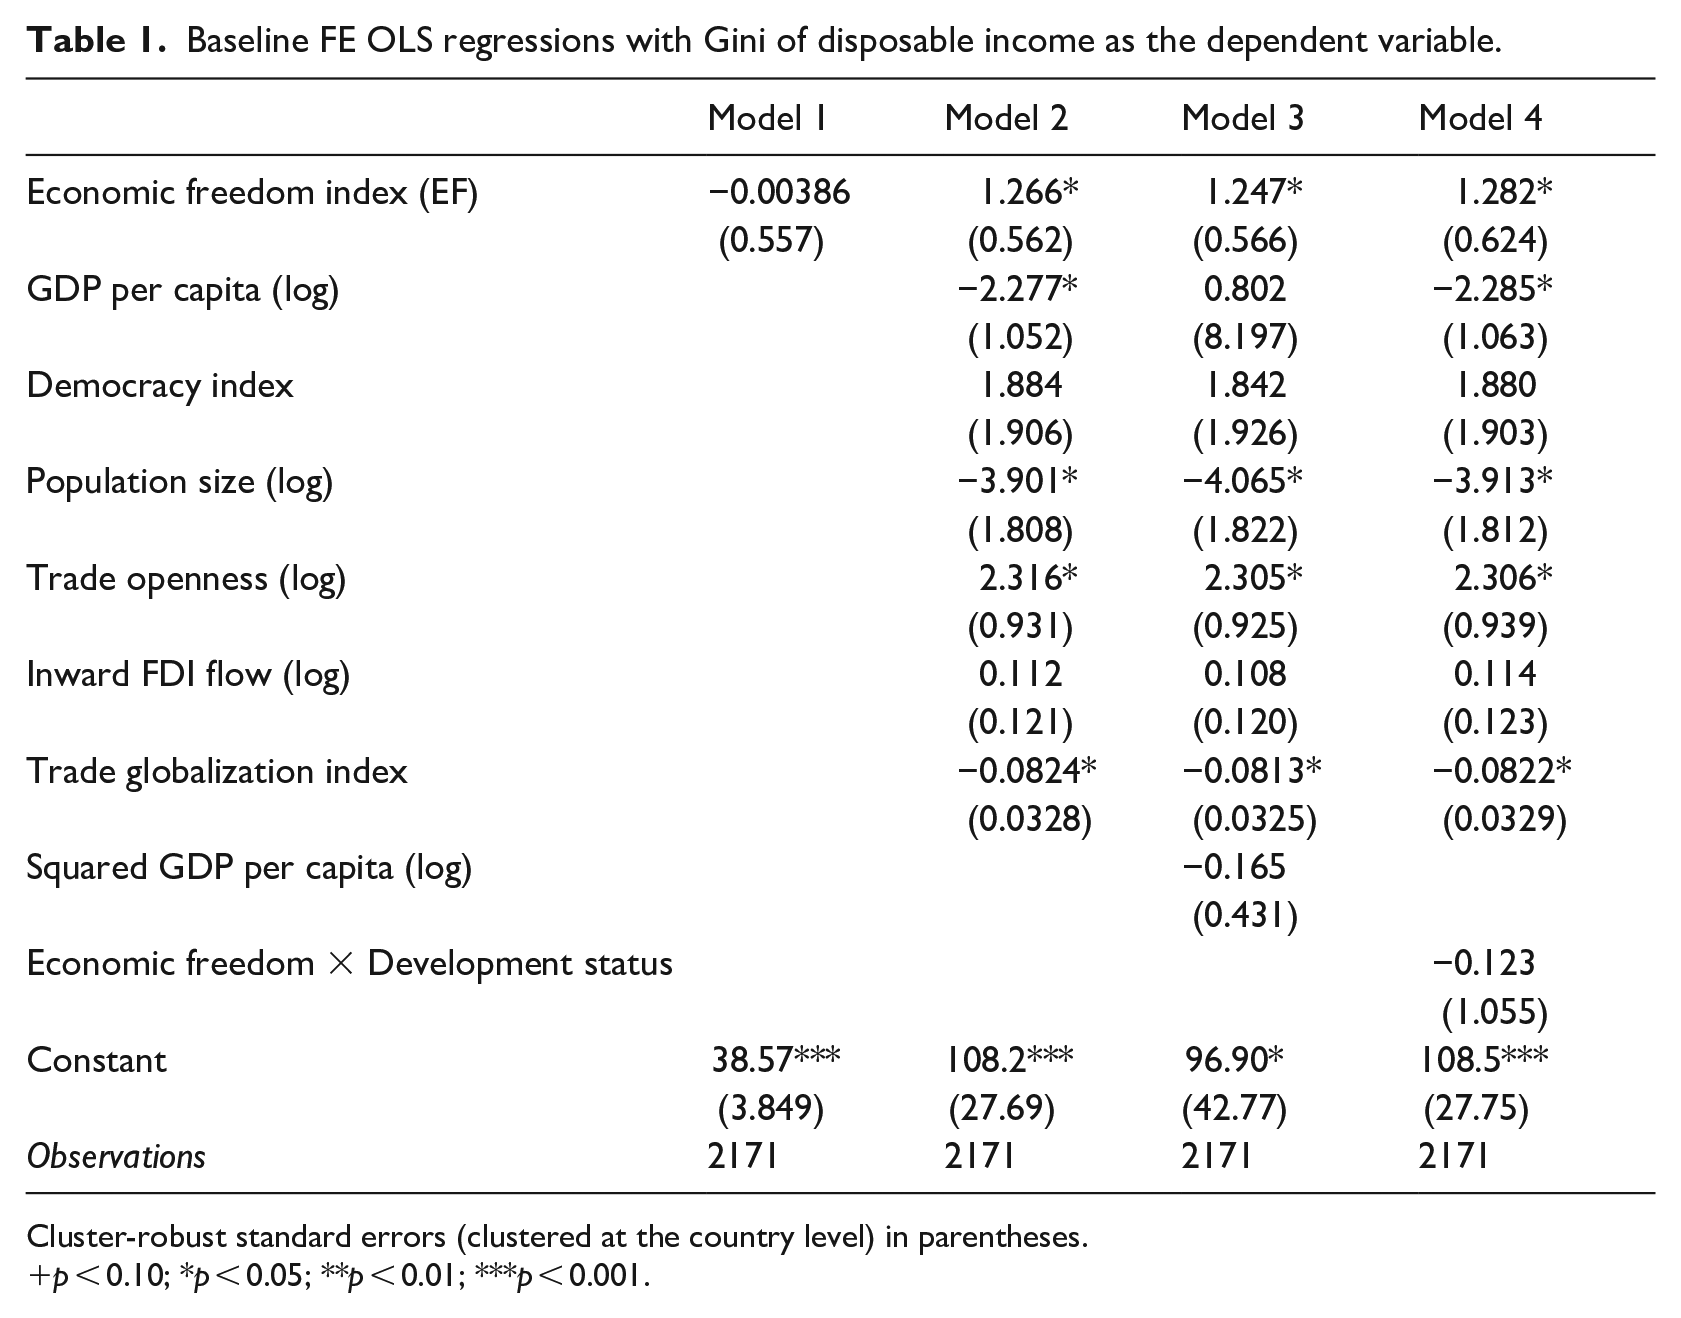
Table 1 displays the results for various specifications of the baseline model with the aggregate economic freedom index as the main independent variable of interest. Model 1 shows that the unconditional, and likely severely confounded, relationship between economic freedom and inequality is slightly negative but not statistically significant. The preferred full specification of the baseline model with the relevant controls appears under Model, where the relationship now turns positive and significant. The size of the coefficient is relatively modest: holding all else constant, a 1.27 increase in economic freedom results in a 1-unit increase of Gini. Even if the coefficient is not particularly large, this is still a notable association because the post-2000 period was one of stagnating and decreasing inequality, a trend that was apparently diminished by the fact that rising economic freedom had been associated with increases in inequality.
Baseline FE OLS regressions with Gini of disposable income as the dependent variable.
Cluster-robust standard errors (clustered at the country level) in parentheses.
p < 0.10; *p < 0.05; **p < 0.01; ***p < 0.001.
Models 3 and 4 are two alternative specifications of Model 2. The first includes the squared term of GDP per capita as a covariate to test for the presence of a nonlinear (Kuznets-type) relationship between development and inequality. In this model, neither the linear nor the squared term evinces statistical significance, indicating that, at least in my sample, development is linearly associated with inequality (see the coefficient for GDP per capita in Model 2, which omits the squared term). Model 4 tests whether the relationship between economic freedom and inequality might have different valences (or significance) in developed versus developing countries. The non-significance of the interaction terms suggests this is not the case and that the positive association persists across both types of societies. However, the linear combination of parameters is 1.159 and not statistically significant (p > 0.1), which does indicate an absence of the same significant, positive relationship in developed countries.
Moving on to Table 2, it displays five models, each based on a different component of economic freedom. All models also include the interaction term of economic freedom components with the development status of a country to test for potential heterogeneity. Together, they show that two components are likely the primary drivers of the aggregate relationship, namely, modest size of government (EF1) and freedom of international trade (EF4). Both are positive and significant at the conventional level (p < 0.05). EF1 suggests no differences between developed and developing countries, while EF4 does (though only at p < 0.1). More specifically, freedom of international trade predicts increases in inequality in the developing world, while the negative valence of the interaction term suggests that this positive relationship is strongly decreased in the developed world. Summing the two coefficients to isolate the relationship for developed countries specifically even suggests that the relationship might be negative there. However, additional calculations reveal that the slightly negative summed coefficient for the developed world is not statistically significant.
Baseline FE OLS regressions with Gini of disposable income as the dependent variable (economic freedom disaggregated).
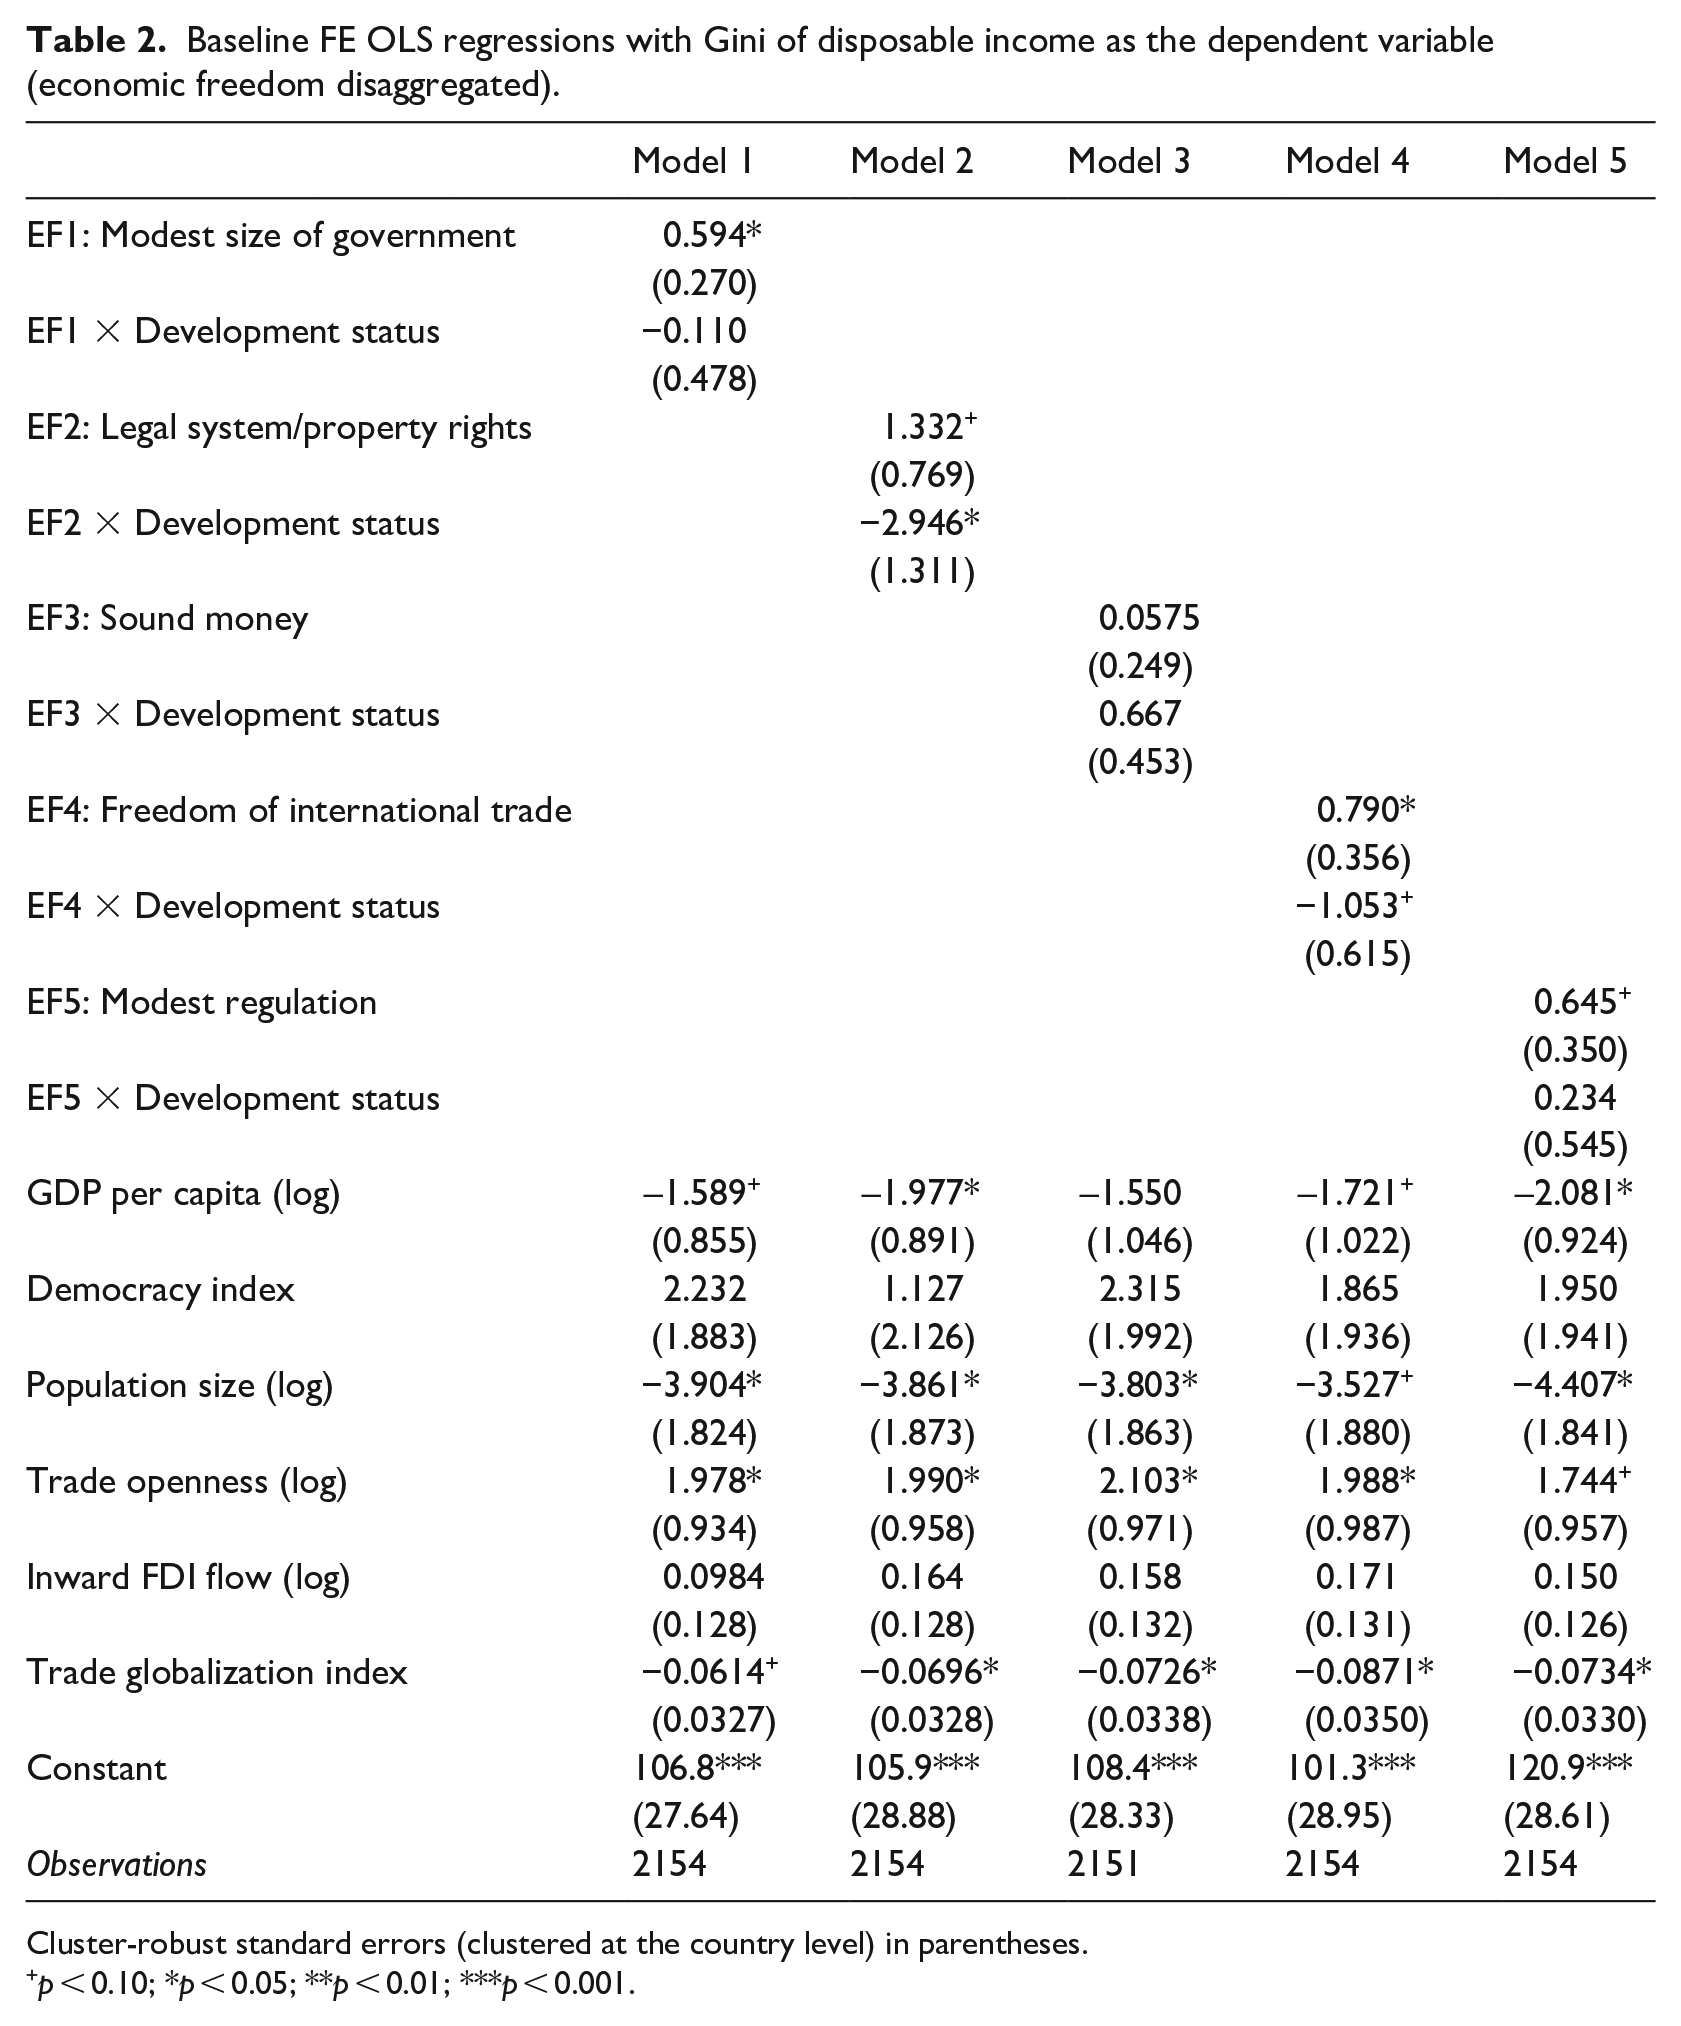
Cluster-robust standard errors (clustered at the country level) in parentheses.
p < 0.10; *p < 0.05; **p < 0.01; ***p < 0.001.
Again, put in more formal terms, the linear combination of parameters is 0.485 (p > 0.1) for EF1 and −0.263 (p > 0.1) for EF4. This means that while EF1 and EF4 have a significant positive association with inequality in the developing world, there are no significant positive relationships in the developed world for either of the two components.
Two other components of economic freedom in Table 2 are also positive and significant, although only at the marginal p < 0.1 level. These are legal system and property rights (EF2) and modest regulation (EF5). The first again evinces signs of heterogeneity in developed and developing countries. The interaction term suggests that the relationship is decreased, even negative, in developed countries. However, additional calculations show that the negative summed coefficient does not achieve significance, which indicates a null result for developed countries. The linear combination of parameters is −1.615 (p > 0.1) for EF2 and 0.879 (p < 0.05) for EF5. The latter indicates that modesty of regulation is after all significantly positively associated with inequality in developed countries.
The last component, sound money (EF3), is positive but not significant in the developing baseline case. The linear combination of parameters is 0.724 and evinces only marginal, non-conventional significance (p = 0.072). In all five models, control variables virtually remain unchanged as compared with the aggregate baseline models in Table 1.
Robustness checks
I now turn to a variety of robustness checks that have been performed on my main findings from above.
First, I substituted non-imputed Gini WIID data for my main dependent variable (multiply imputed Gini SWIID data). As can be seen in the Supplemental Appendix, baseline results appear to be robust to this alternative measure of the dependent variable. All coefficients in Table 5A of the Supplemental Appendix point in the same direction as in Tables 1 and 2, and all of them retain their original status of statistical significance (or lack thereof). I have omitted nonsignificant interaction terms to conserve space. With one exception, all linear combination parameters exhibit the same state as those presented above. The one exception is the legal system/property rights component (EF2). Its linear combination of parameters now deepens to −3.129 and turns significant (p < 0.05).
Second, I respecified my baseline regression model by adding additional control variables to remedy concerns about residual confounding. See Table 6A in the Supplemental Appendix. These additional controls are unable to overturn the main results, themselves failing to turn significant. Because all of the added controls fail to achieve significance, these models turn out not to be the preferred specification.
Third, I verified the robustness of original results under a different operationalization of economic development (substituting the modified core model for the standard GDP measure as described in the previous section). See Table 7A in the Supplemental Appendix. The main results remain the same, both for the aggregate and disaggregated index of economic freedom. The one exception is modest regulation, which is marginally significant in baseline specifications but now turns insignificant.
Fourth, I ran additional regressions (using the baseline specification) by extending the time-period to include the 1990s (see Table 8A). As noted before, the observations count for the 1990s is very low because the data are available only at two points, namely, in 1990 and 1995, and many countries have missing data. This means that there are only 152 additional observations (compared with over 2100 for the period between the year 2000 and 2021) in the estimation that includes the 1990s. Nevertheless, the results mostly remain the same. Aggregate economic freedom is positively associated with income inequality for the whole 1990–2021 period. This is again primarily due to two components of the index: modest size of government and freedom of international trade. Two other components that were marginally statistically significant before, in the original baseline model focusing on the 2000–2021 period, now lose their significance (although the coefficient signs remain positive). They are legal system and property rights, and modest regulation. None of the five interaction terms (between components of economic freedom and inequality) turn significant, so they were omitted from presentation in the table to conserve space. However, when calculating the linear combination of parameters, modesty of regulation retains its significance, direction, and coefficient size as compared with baseline results reported above. This further strengthens the finding that, even though aggregate economic freedom in the developed world is not associated with more inequality, one of its components nevertheless seems to be tied to it.
Fifth, on the recommendation of an anonymous reviewer, I conducted additional sensitivity tests specifically for the influence of time. Models 1 and 2 in Table 9A in the Supplemental Appendix present the coefficient on economic freedom by including time dummies in the fixed-effects estimation. In other words, although all other tables in this article report results relying on the one-way fixed-effects estimator (namely, country-fixed estimations), Models 1 and 2 in Table 9A in the Supplemental Appendix are performed using the two-way fixed-effects estimator (time-fixed and country-fixed). As noted before, the two-way fixed-effects estimation is currently being heavily scrutinized by methodologists for reasons both of issues with quantitative computation and theoretical interpretation (see Hill et al., 2020; Kropko and Kubinec, 2020). However, I wanted to check whether my headline result (namely, the significant positive association between economic freedom and inequality) is driven simply by the choice of estimation strategy. Model 1 in Table 9A shows this is not the case. Nevertheless, Model 2 suggests my headline result is not fully robust to estimator choice. The two-way fixed-effects estimator, using the 1990–2021 extended time-period sample, just fails to replicate my significant positive baseline result (p = 0.104 in Model 2, Table 9A).
As far as interacting economic freedom with time is concerned, Models 3 and 4 in Table 9A reveal no statistically significant result, implying that the (positive) effect of economic freedom on inequality does not change through time.
Overall, considering all the different specifications, three results are almost completely robust. First, aggregate economic freedom is positively associated with income inequality in a numerically small-to-moderate way, though one which is substantively still notable due to the specificities of the time-period under consideration (namely, stagnating and decreasing inequality). The two exceptions to this otherwise robust result occur (1) with a simple bivariate relationship between economic freedom and inequality (eschewing any control variables) and (2) when using the two-way fixed-effects estimator on an expanded time-period. Because the first is likely to be heavily confounded, while the second is not a preferred estimator (in light of methodological issues outlined above), I do not see these two exceptions as damaging to the mentioned positive finding, especially in light of all the other robustness tests.
Second, this same positive and significant relationship seems to be absent in the developed world at the aggregate level. The coefficient on economic freedom is of similar size when calculating the linear combination of parameters, but it fails to reach statistical significance.
Third, it is the modest size of government and freedom of international trade that are the two components of economic freedom robustly driving the aggregate relationship (in developing countries). A different component, namely, modest regulation, seems to be relatively robustly associated with increased inequality in the developed world, though the word relatively should be emphasized here. In fact, calculating the linear combination of parameters from Model 6 in Table 7A reveals no significant association. Moreover, the coefficient’s p-value of 0.045 based on Model 5 in Table 2, when calculating the same, is right on the edge of conventional significance. Finally, the positive association, if it exists, is apparently small enough to be swamped when looking at the relationship between aggregate economic freedom and inequality (in developed countries).
Mediation analysis
Because the majority of models reported above show a consistent negative association between economic development (as measured by GDP per capita) and income inequality, and because economic freedom is one of the main predictors of economic development (see De Haan et al., 2006), one should investigate whether economic development acts as an ameliorative mediator between economic freedom and inequality. In other words, economic freedom has a positive direct relationship with inequality; but might it at the same time also have an indirect negative association with it (via increasing development)? If so, then the total relationship between economic freedom and inequality is likely to be less uniformly or strongly positive, perhaps even annulled.
Using the same FE OLS estimator, I have relied on the baseline specification from Table 1 with the full set of controls to perform mediation analysis with the Monte Carlo method for calculating the indirect effect and its confidence intervals (Selig and Preacher, 2008). I find that the relationship between economic freedom and inequality is mediated by economic development. In particular, the direct effect of economic freedom on inequality is 1.242 (p < 0.05), while its indirect effect (via development) is −0.4325, which makes the total effect shrink from 1.242 to 0.8095; see Figure 4 for a graphical representation. Economic freedom predicts both increases and decreases of inequality, though the latter are not as strong, leaving the net or total relationship positive.
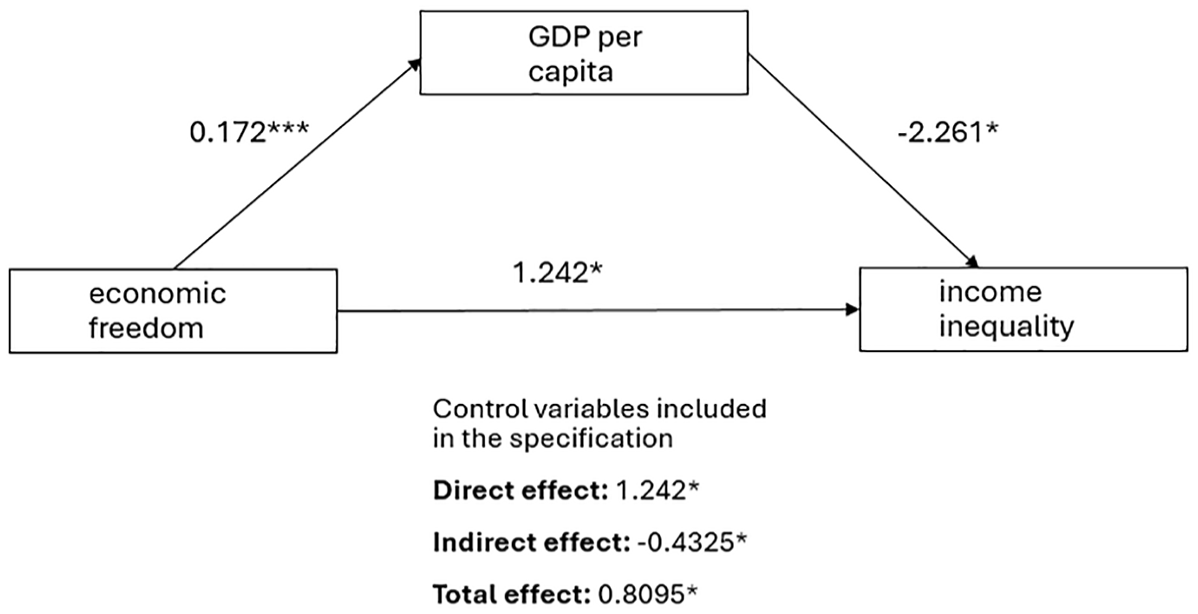
Monte Carlo mediation analysis based on baseline FE OLS regressions with Gini of disposable income as the dependent variable (aggregate economic freedom index).
An anonymous reviewer thoughtfully suggested to expand mediation analysis to include other variables. First, is the relationship between freedom of international trade (as a component of economic freedom) and inequality mediated by trade openness, and if so, what is the direction of mediation? Second, is regulation’s effect on inequality (particularly, credit market regulation and monetary regulation) mediated by financial development?
With respect to the first question, it turns out that freedom of international trade has, apart from its positive relationship with inequality (amounting to 0.564), a very small indirect effect on it via trade openness (−0.141), which makes the net total effect 0.433. All of these coefficients are statistically significant at least at the p < 0.05 level.
As far as the second question is concerned, credit market regulation and monetary regulation (as subcomponents of the regulation component) turn out to not even be statistically significantly related to inequality (the whole effect of regulation is driven by the labor market regulation subcomponent). Financial development, too, evinces no significant relationship, which is why mediation analysis would shed no further light on this matter.
Discussion and conclusion
The existing quantitative scholarly literature indicates that economic freedom (used by many researchers to proxy free-market capitalism or “neoliberal” institutions) is clearly positively tied to a set of crucial social indicators, typically perceived as normatively “good,” such as economic development and growth of income (Lawson, 2022). However, there are other variables, including inequality, which evince a much more mixed relationship. One large recent survey (Lawson, 2022) found that the majority of studies on the association between economic freedom and inequality come to mixed conclusions (including a null relationship). The findings of the present article in part echo the mixed nature of the correlation, although they also much more clearly reaffirm the thesis coming from the critical literature, according to which free-market reforms go hand-in-hand with higher inequality or even cause, over time, increases in inequality.
To be more specific, the critical thesis is corroborated at the aggregate level, albeit not for the sample of developed countries. With only two exceptions, the headline result of all other regressions in this article is a statistically significant and positive over-time association between aggregate economic freedom and inequality. Importantly, although the size of the coefficient is not large, it is still notable as it typically hovers around 1 or more, meaning that a 1-point increase in economic freedom (on a scale from 0 to 10) implies a 1-point increase in inequality (on a scale from 0 to 100). This is all the more salient given that the period between 2000 and 2021 was a period of stagnating or even declining income inequality within countries.
The findings are more mixed when it comes to the disaggregated index of economic freedom, though here, too, there are robust positive results. Modest size of government and freedom of international trade consistently predict increases in income inequality, although these effects vanish in developed countries (they turn statistically insignificant). Plausibly, freedom of international trade is less deleterious for inequality in developed countries because of better and more prevalent trade/globalization adjustment assistance programs in developed countries (such as the United State and most countries in Europe) for workers negatively affected by free trade and competition from abroad (Baicker and Rehavi, 2004; for a more mixed view on this, see Kim and Pelc, 2021). The same goes for modest size of government, given that developed countries have, on average, well-developed and relatively large welfare states. Marginal tapering from a high level would likely have no effect on inequality, but the same is not the case for developing countries, where robust welfare states are more an exception than the rule.
There is some evidence, though, that modesty of regulation predicts increased inequality both in developed and developing countries. This finding is sensitive to swaps in control variables and time-periods, albeit less so in developed countries than the developing world. I find no evidence of sound money consistently predicting statistically significant increases or decreases in inequality.
Finally, there is evidence that the net relationship between economic freedom and inequality is somewhat more complicated due to economic development. Economic development is itself positively predicted by economic freedom, but it has a negative association with inequality. This means that even though economic freedom seems to have a direct positive effect on inequality, it also might have an indirect negative effect on it by boosting economic development. Nevertheless, the overall net relationship is still positive and notable because the negative indirect association is small in size. Interestingly, Kwon (2016) finds less evidence for such mediation in his study of economic freedom. As he puts it Kwon (2016), “although there is some mixed evidence to support the contention that economic liberalization indirectly decreases inequality by expanding economic growth [. . .], these results are far from conclusive as the liberalization-growth-inequality link is inconsistent across different equations” (p. 492). This partial divergence of findings is explicable in terms of different samples and time-periods under investigation. In contrast to the present study, his focuses mostly on the pre-2000 period (1970–2009) and is limited solely to 21 developed countries.
To conclude, as predicted by the critical literature, free-market institutions (measured by an index of economic freedom) were associated with an increase in inequality even during the 2000–2021 period of overall falling inequality, although not completely unequivocally so. It is thus plausible that additional increases in economic freedom during the past two decades prevented inequality from decreasing even more than it has. In light of this finding, policy favoring additional free-market reforms, especially in the area of government size and international trade, should be mindful of their potential inequality-amplifying effects, at least if inequality prevention (and reduction) is a key policy goal.
Supplemental Material
sj-docx-1-cos-10.1177_00207152241285759 – Supplemental material for Free-market institutions and income inequality: Did the link persist around the world even in times of falling within-country inequality, 2000–2021?
Supplemental material, sj-docx-1-cos-10.1177_00207152241285759 for Free-market institutions and income inequality: Did the link persist around the world even in times of falling within-country inequality, 2000–2021? by Tibor Rutar in International Journal of Comparative Sociology
Footnotes
Declaration of conflicting interests
The author(s) declared no potential conflicts of interest with respect to the research, authorship, and/or publication of this article.
Funding
The author(s) received no financial support for the research, authorship, and/or publication of this article.
Supplemental material
Supplemental material for this article is available online.
References
Supplementary Material
Please find the following supplemental material available below.
For Open Access articles published under a Creative Commons License, all supplemental material carries the same license as the article it is associated with.
For non-Open Access articles published, all supplemental material carries a non-exclusive license, and permission requests for re-use of supplemental material or any part of supplemental material shall be sent directly to the copyright owner as specified in the copyright notice associated with the article.