
Abstract
How has identification and differentiation based on ethnicity shaped the economic experience in postsocialist Europe? We propose that creation of neoliberal capitalism in the context of ethnic conflict led to a sense of economic marginalization of East European ethnic minorities. Findings from Life in Transition Survey analysis show greater economic discontent by ethnic minorities in 2006 than in 1989 and persistent discontent in 2016, controlling for social class standing and other relevant demographics. Economic marginalization may also lead ethnic minorities to support more involvement of state in guaranteeing employment and low prices and to dislike markets as a way to organize the economy, both supported in our data. We conclude by suggesting how our findings about marginalization of ethnic minorities help put into perspective contemporary receptivity of East Europeans (and others) to nationalist and populist leaders.
Introduction
The official ideology of socialism portrayed it as a system that ensures social justice and equality. The Party-state would secure full employment and take care of the basic needs of people by providing universal education, health care, subsidized housing, and cultural goods (Kornai, 1992). Actual socialist systems did not erase inequalities (Szelenyi, 1978). Still, there is strong consensus among scholars that social inequality during socialism was substantially lower than inequality in other systems at comparable levels of industrial development (Boswell and Chase-Dunn, 2000; Heyns, 2005). For instance, in one of the rare sociological studies that incorporate state-socialist countries in their analyses of worldwide inequality, Alderson and Nielsen (1999) found a significant negative relationship between the presence of Marxist-Leninist regime in a country and income inequality. Ceteris paribus, the Gini coefficient in state-socialist countries was estimated to be 5.3 to 10.1 points lower than that in other countries, depending on model specification.
With the collapse of the communist regimes, social inequalities in Eastern Europe have, without exception, increased throughout the region (for review, see Heyns, 2005). In 1989, the income inequality Gini index for the 10 Central and East European countries that became European Union (EU) members was on average 22, but only a dozen years later this figure increased to 34, with some countries registering levels up to 39 (Bandelj and Mahutga, 2010). The magnitude of this transformation becomes evident when we consider that during this same period the Gini index increased by about 3 points in the United States, and slightly declined in a few West European countries (Alderson and Nielsen, 2002). According to Eurostat, in 2020, the average Gini index for East European countries that are EU members was 30.5, and in some states as high as 40.
What influenced these rising income inequality trends in Eastern Europe? In one of the first quantitative analyses to address this question, Bandelj and Mahutga (2010) identified privatization, foreign investment inflow, and state retrenchment as the main culprits. Moreover, they claimed that market transition increases social exclusion, which deepens inequality. They tested whether having a sizable ethnic minority population increases income inequality and found robust empirical support. Advancing this inquiry, the present study aims to place ethnicity front and center in analyses of postsocialist capitalism and asks whether we can identify any trends in how those who identify as minorities feel about their economic lives after the collapse of communist regimes. We acknowledge from the start that what it means to be an ethnic minority, or to be minoritized in a society, can vary significantly. This may be especially so in Eastern Europe due to complex historical and geopolitical forces. For instance, the reconfiguring of borders of the former Yugoslavia, and former Czechoslovakia, redefined the ethno/national minority and majority in some cases. In other places, communities of ethnic Russians who remained after the dissolution of the Soviet Union comprise groups now considered to be minorities. For these cases, in Eastern Europe the term national minority may be more fitting as a category of practice than the notion of ethnic minority, which is often reserved for the Roma, the Europe’s largest ethnic minority. Nevertheless, we propose that occupying an ethno/national minority status writ-large is consequential as it underscores one’s relationship to dominant racial and ethnic forces as they manifest in politics, economy, and other social processes. To capture this relational definition of ethnicity, we utilize the ethnic power relations (EPR) index (Wimmer et al., 2009) in our operationalization of minority status, which is a globally comparative measure that centers the extent to which different ethnic groups have access to power in a given nation-state. EPR has been widely used and aligns with our relational understanding of ethnicity, which we examine in connection with perceptions of economic marginalization. 1
While much ink is spilt on the history of nationalism and ethnic conflict in the East European region, especially because of the Yugoslav wars, market transition research rarely engages directly with the issue of ethnicity and ethnic exclusion. Yet, there is evidence of such experiences recorded by organizations that oversee minority rights. For instance, Amnesty International (2007) reports of exclusionary treatment in Slovenia where, upon the country’s declaration of independence in 1991, many non-ethnic Slovenian inhabitants (primarily of Bosnian, Albanian and Roma ethnicities), so-called the erased, were denied access “to employment, pension, and health care” (p. 7). As another instance, Minority Rights Group (2023) documents that Russian minorities in Estonia “allege occupational, salary and housing discrimination because of Estonian language requirements.” Furthermore, based on a report released by the Ministry of Labor and Social Affairs of the Czech Republic, “Roma living in sub-standard houses has been rising over the last 10 years” (reported in Amnesty International 2007: 4). In this context, the goal of our article is to answer the following research question: In what ways does being of ethnic minority status shape one’s experiences with and perceptions of the transitioning market economy? This matters because understanding how the creation of a market economy is entwined with social exclusion in Eastern Europe can shed light on the current power of autocratic and populist leaders and wide-spread anti-immigrant sentiments in this region and beyond.
In the next section, we present our case of economic marginalization of ethnic minorities in postsocialism to derive our central argument: in the context of neoliberalism, insider-based privatization, and collective memory of ethnic conflict, creation of markets in postsocialism leads to a sense of economic marginalization of ethnic minorities. In the second half of the article, we analyze data from the Life in Transition Survey, collected by the European Bank for Reconstruction and Development (2006, 2010, 2016), on ethnic minorities’ perceptions about the economy in 2006 and 2016, as well as a comparison to 1989, for 16 East European countries. We conclude by suggesting how the experience of long-term economic marginalization in Eastern Europe helps inform contemporary receptivity to nationalist and populist leaders in this region.
Ethnic and racial marginalization and discrimination
Sociological studies on race/ethnicity in the economy have focused on the macro-level analysis of racial capitalism (Christian, 2019; Crockett, 2022; Jenkins and Leroy, 2021; Jobson, 2021; Park, 2021; Robinson, 2000 [1983]) and ethnic economies (Bailey and Waldinger, 1991; Cranford, 2005; Light et al., 1994; Light and Bonacich, 1988; Portes, 1981; Portes and Manning, 2006; Rosales, 2014, 2020; Sanders and Nee, 1987; Valdez, 2011). Scholars have also examined ethnic/racial discrimination in labor markets, credit markets, and consumer experience (Charron-Chénier et al., 2017; Chavez, 2021; Gould-Werth, 2018; Grier and Perry, 2018; Huang, 2021; Pacewicz and Robinson, 2021; Pager et al., 2009; Pager and Shepherd, 2008; Pedulla et al., 2022; Pittman Claytor, 2020; Rafferty, 2020; Robinson, 2020; Seamster and Charron-Chénier, 2017; Taylor, 2019; Thomas et al., 2018; Tilcsik, 2021; Veresiu and Giesler, 2018; Wherry et al., 2019).
As concerns scholarship on ethnic minorities in Eastern Europe, researchers document how the nationalist appeals to collective rights by dominant ethnics on behalf of all, such as demands for cultural, religious, and linguistic conformity, have in many ways made other ethnic groups second-class citizens (Bugajski, 2019; Hastings, 1997; Hroch, 1995). Ethnic marginalization has also figured into party politics. For instance, Rovny (2014) demonstrates that post-communist left-wing parties tend to be more conservative in countries that were centers of former communist federations and have large ethnic minority populations from the peripheries. In contrast, the left parties in the region tend to be more liberal when they support ethnic minorities.
In her study of ethnic marginalization in Eastern Europe, Batta (2017) concludes that post-independence (peripheral) countries such as Belarus, Moldova, and Ukraine that transitioned as authoritarian states and did not seek membership in the EU have treated their Russian ethnic minority populations better than the Baltic states of Estonia, Latvia, and Lithuania. Several researchers focus on the experiences of the Roma as one of the most sizable racial/ethnic minorities in the region. Feischmidt et al. (2013) identify several structural factors including long-term unemployment, segregation in housing and education, and privatization of industries that disproportionately and negatively affect Roma’s economic inclusion and social status. Utilizing primary data from in-depth interviews with Macedonian and Romani politicians and individuals from various socio-economic strata, Barany (1995) cites Macedonians’ more positive attitudes toward the Roma, absence of stereotyping, and a desire for peaceful coexistence as main factors in the latter group’s relative socio-economic inclusion, even though they reside in segregated settlements. However, in his study of Macedonian ethnic politics Crowther (2017) discusses deterioration of social, economic, and political conditions for Roma, Turks, Serbs, and Vlahs ethnic minorities.
Less research has investigated the (perception of) ethnic marginalization of East European minorities in the economic sphere. Wheatley (2007) identifies several factors that affected ethnic minorities’ relative economic position, including constitutional laws, privatization, and integration into a global economy. For instance, post-independence Estonia adopted new restrictive citizenship laws including the requirement of passing the Estonian language knowledge test for newly-arriving ethnic immigrants. Although non-citizens in Estonia (about 11 percent of population) can obtain residence permits, are eligible for social welfare benefits, and can vote in local elections, Wheatley reports that their participation in Estonia’s skilled labor market is much lower than for Estonian citizens.
Beyond single case studies, how have ethnic minorities in Eastern Europe experienced their economic lives? What are their views on the role of the state in the economy? We argue these sentiments and views are shaped by the path dependency of political and cultural institutions, which have made ethnicity a salient category of differentiation, and discrimination, in Eastern Europe.
Salience of ethnicity in postsocialist economies
Scholars have shown that path-dependent political and cultural institutions of East European postsocialism, especially those of privatization (Stark, 1992; Stark and Bruszt, 1998; Verdery, 2004), neoliberalism (Campbell and Pedersen, 2001; Streeck, 2010), and ethno-nationalism (Brubaker, 1996; Calhoun, 1993; Cohen, 1999; Verdery, 1998; Zubrzycki, 2001) have made ethnicity a salient category of identification and differentiation in postsocialist Europe. We explicate the main historical developments below and then consider how we can advance this body of work on postsocialism with our examination of the economic experience of ethnic minorities, pre- and post-market transition. As such, we align with the attempts to investigate potential commonalities of postsocialist capitalism (Bandelj, 2016), in addition to recognizing complexities of individual groups’ experiences in specific countries.
Nationalism and violence heighten the salience of ethnicity
At the end of the Communist Party rule, national movements, and national sentiments in postsocialist Europe proliferated (Calhoun, 1993; Cohen, 1999; Verdery, 1998). 2 Nationalism was used as a tool of political mobilization and nation-oriented idioms were “widely available and resonant as a category of social vision and division” (Brubaker, 1996: 21) in postcommunist Europe. In particular, “national” and “ethno-national” became very salient categories of identification and differentiation for communities from formerly multinational states where the fall of socialism was accompanied by assertions of state sovereignty and independence, sometimes through war and violence. In cases of Czechoslovakia, the Soviet Union, and Yugoslavia, the collapse of state-socialism coincided with disintegration of federal arrangements and establishment of several new independent states. In these circumstances, “at the most fundamental level, a decision [had] to be made as to who ‘we’ are, i.e. a decision on identity, citizenship, and the territorial as well as social and cultural boundaries of the nation-state” (Offe, 1991: 869). Thus, nationalism can be seen as an integral part of the consolidation of an identity of a new state, either due to dissolution of federations or due to loosening of the Soviet Union grip.
Rogers Brubaker (1996) distinguished three types of nationalism, which have interacted to destabilize the new or restructured states in post-1989 Europe: ethno-nationalism, “nationalism of the national minority,” and “nationalism of the external homeland.” This triadic, conflict-ridden configuration of nationalisms in postcommunism is considered distinct from the problems of national integration in older European and post-colonial states in Africa and Asia (Smooha and Jarve, 2005). In particular, it is ethno-nationalism that may present a basis for social exclusion of ethno-national minorities in postsocialism because “postcommunist governments [may] take the view that they [governments] do not represent citizens but the [ethnic] nation” (Schopflin, 1996: 153). Smooha (2001) provides potential reasons for this by suggesting that “in these states, there is a strong tendency for indigenous minorities to be non-assimilating, for majorities to be intolerant of cultural diversity and suspicious of claims for special rights based on ethnicity” (pp. 6–7). As a case in point, in former Yugoslavia, starting in 1991, a series of ethnic conflicts and wars of independence culminated in a secession of six sovereign entities: Slovenia, Croatia, Bosnia and Herzegovina, Serbia, Macedonia, and Montenegro, and recently, the autonomous unit of Kosovo. Recognized as one of Europe’s deadliest conflicts since World War II, the Yugoslav wars were marked by crimes against humanity and prosecuted by the International Criminal Tribunal for the former Yugoslavia, which was established by the United Nations. The international community proclaimed the situation in Bosnia, including rape of Bosnian women by Serbs, as a genocide and strategy of ethnic cleansing.
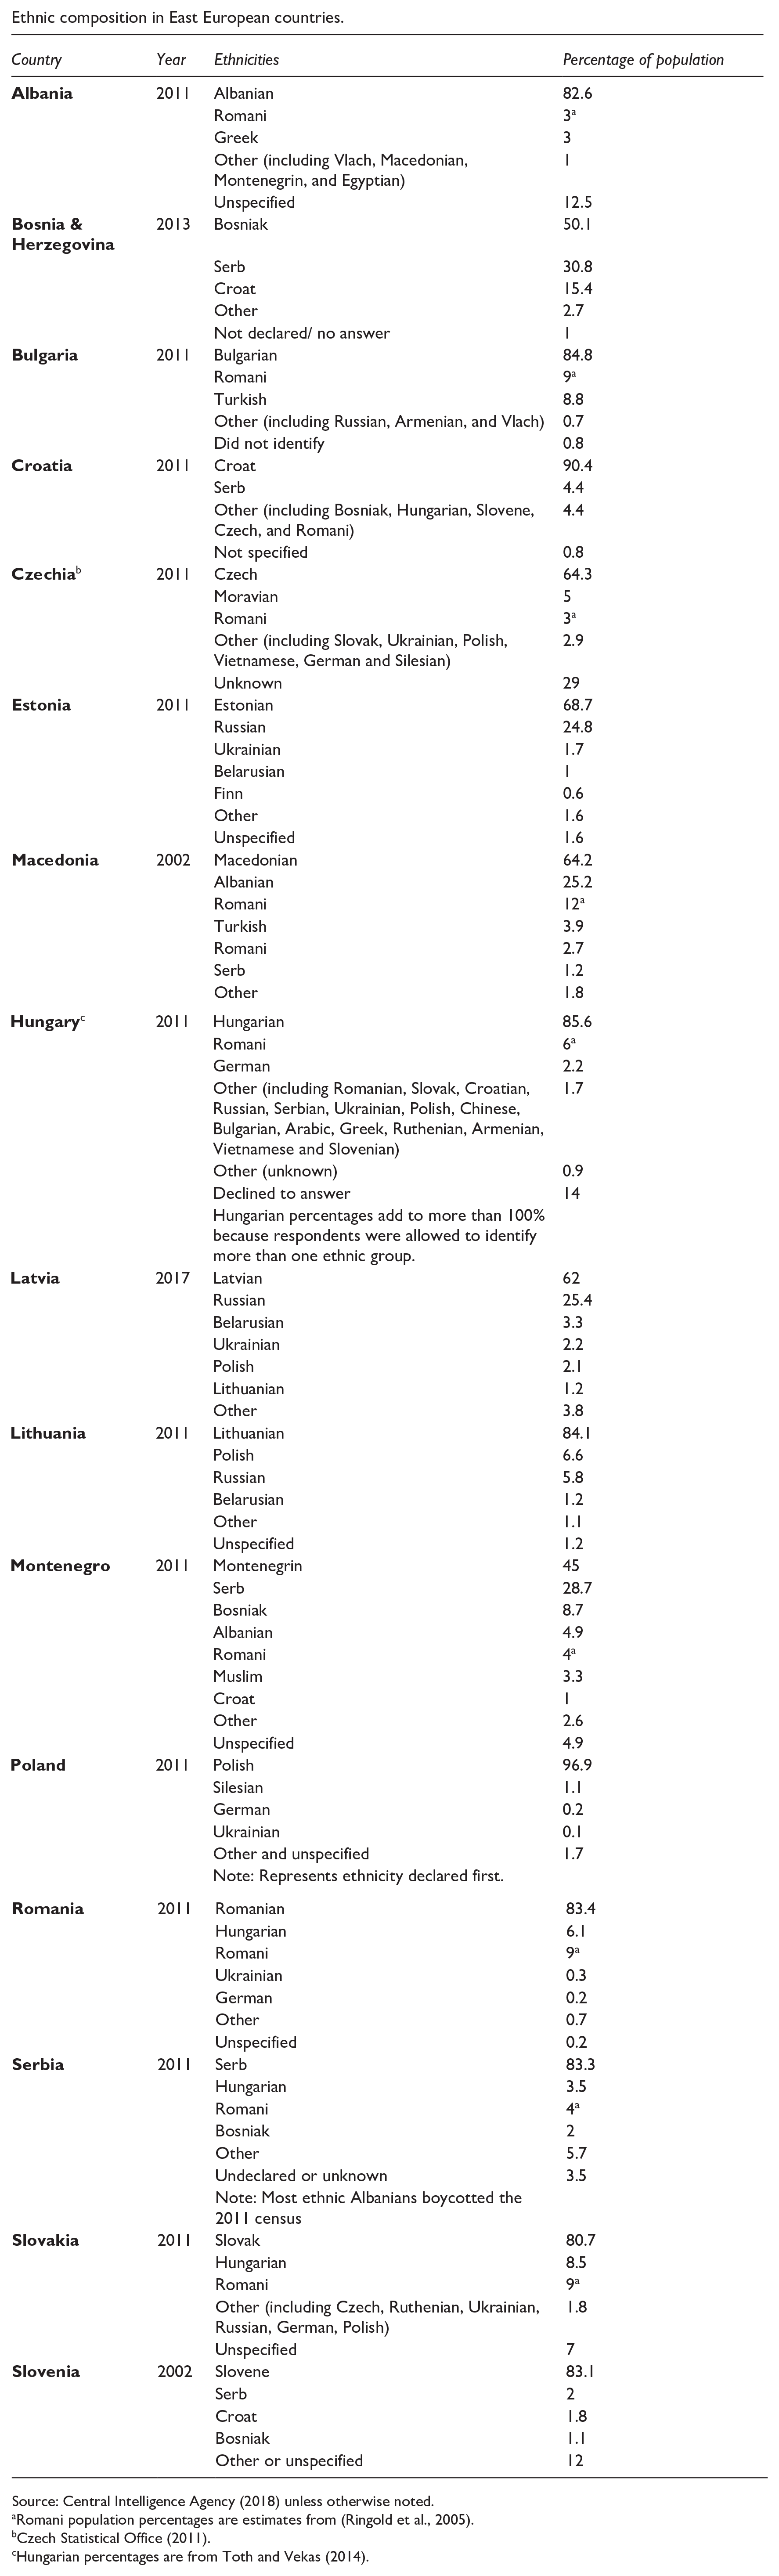
Considering ethnic nationalism and even ethnic violence that marked the political scene in Eastern Europe after the fall of communist regimes, we can expect that members of ethnic minority populations will experience forms of social exclusion. Notably, researchers find that Roma have become the “underclass” throughout Eastern Europe (Emigh et al., 2001: 3; cf. Barany, 2000) whose disenfranchisement is also racialized (Emigh et al., 2001: 6). Still, Roma are but one among many ethnic minorities on the post-1989 postsocialist territory of Central and Eastern Europe. Appendix 1 shows that in several of the East European countries, there is a sizable share of population that does not identify with the national majority. This suggests that there are significant segments of the population in Eastern Europe that may be subject to ethnic marginalization.
Market transition leads to marginalization of ethnic minorities
With an overarching objective to explore how salience of racial/ethnic difference gets imprinted into the operation of markets, we stipulate that two main processes lead to the perception and experience of ethnic economic marginalization. The first process is related to the political logic of privatization and homophily, whereby opportunities in the economy are secured by political elites who, due to the prevalence of nationalism, belong to ethno-national majorities and allocate resources to other co-ethnics who are “like us” or “one of us.” While this process of allocation is thoroughly political with material consequences, homophily likely also follows an emotional logic: we trust and like those who are “one of us.” Those who are not like “us” but one of “them,” will be excluded. Maintaining positions of power is also entwined with emotional bonds to the co-ethnic elite, on one hand, and distrust, disgust, or fear of the subaltern (Morris, 2022), on the other hand.
The second process is related to how marginalization operates in labor and consumption markets, whereby newly socialized market actors, such as “emoting racial [ethnic] subjects” (Bonilla-Silva, 2019: 1), will differentiate us from them to allocate and/or exchange resources. And to integrate a point made in the previous section, both of these processes—of initial private property rights allocation and subsequent market operation—happen in embedded (Polanyi, 1957) postsocialist economies in which nationalism and ethnic conflict/violence have made ethnicity a salient category of differentiation.
Thus, we derive the central proposition that in the context of neoliberalism, insider privatization, and ethnic conflict/violence, we should observe a widespread sense of economic marginalization by ethnic minorities. Neoliberal markets, steeped in nationalism and ethnic conflict, will potentiate giving power and resources to ethnic majorities, and, consequently, marginalizing ethnic minorities. Concretely, given these conditions, we hypothesize that ethnic minorities will express that their life and economic situation were better during socialism than they are under capitalism. Moreover, we expect that economic discontent of ethnicity minorities has persisted over time (between 2006 and 2016 for which data are available) as ethnic marginalization has been likely heightened by exogenous shocks of the economic crisis of 2009 and the European refugee crisis in 2015 (FitzGerald and Arar, 2018). Finally, we expect that ethnic minorities will express a negative preference (or a distaste) for markets as the primary way to organize an economy and will, in turn, prefer greater involvement/redistribution of the state in economy.
Theory of market transition: social class as central to economic marginalization
Before proceeding to the empirical test, it may be worthwhile to make explicit an alternative explanation to economic marginalization in postsocialism, as proposed in the theory of market transition (Nee, 1989). Market transition theory stipulates the prominence of instrumental incentives in markets and material resources. There are three theses at the core of the market transition theory. First, the market power thesis claims that once less is controlled by the administrative fiat of the redistributive state, direct producers in the market have more power to set the terms of the exchange. The second thesis is that of the market incentives. Redistributive economies depress incentives, but in markets, direct producers can withhold their product or labor power until a mutually agreed upon price is set. This translates into “a greater share of the surplus [being] retained by direct producers” (Nee, 1989: 665) with rewards more closely linked to individual productivity. The third thesis is the market opportunity thesis: markets open alternative avenues of socio-economic mobility, in particular, through entrepreneurship. The theory of market transition envisions markets as, first and foremost, an economic mechanism of allocative efficiency, following the logic of supply and demand, and aligns with the economists’ view of self-regulating markets, which presupposes that individuals are instrumentally motivated by incentives to increase their material well-being and maximize utility.
As such, following the market transition theory, people’s experience of the postsocialist economy should primarily depend on one’s material class standing in the postsocialist economic hierarchy. Because of material realities of class position, those at the bottom are expected to experience more disenfranchisement and discontent than those at the top of socio-economic hierarchy. From this perspective, differentiation based on ethnicity is not expected to play a significant role in economic outcomes, or to be overridden by material economic considerations.
Examining ethnic minorities’ marginalization
Our main interest is to examine how being of an ethnic minority status shapes one’s experiences with and perceptions of the transitioning economy, and how this has evolved over time. As such, we are rather limited in the kind of data available that covers these dimensions. One dataset that is useful for this is the Life in Transition Survey conducted in Eastern Europe in three waves (2006, 2010 and 2016), with multiple questions about economy and markets as well as a comparison to life in 1989, toward the end of socialism.
Data source
The Life in Transition (LiT) survey is a cross-national survey jointly administered by the European Bank for Reconstruction and Development (EBRD) and the World Bank, available on the EBRD website (http://www.ebrd.com/what-we-do/economic-research-and-data/data.html). For this study, we use the 2006 and 2016 waves of the survey. It is a large-N representative survey that has been administered in all former communist countries in Eastern Europe and Eurasia, and it has a sizable sample of respondents from each country who do not identify as the ethno-national majority. In this analysis, we focus on respondents in Eastern Europe from the following 16 countries: Albania, Bosnia and Herzegovina, Bulgaria, Croatia, the Czech Republic, Estonia, Hungary, Latvia, Lithuania, Macedonia (Former Yugoslav Republic of Macedonia), Montenegro, Poland, Romania, Serbia, Slovakia, and Slovenia. There are approximately 1000 respondents for each country in 2006 and approximately 1500 respondents for each country in 2016. Across the 16 East European countries, we have a sample size of 16,002 respondents for 2006 and 24,106 for 2016. The ethnic minority groups covered in the analysis include, among others, the Russian minority in Estonia, Latvia, and Lithuania; the Bosnian minority in Croatia, Serbia, Slovenia, or Montenegro; the Slovak minority in the Czech Republic and Hungary; the Romanian minority in the Czech Republic or Poland; the Turkish minority in Bulgaria; the Albanian minority in Macedonia or Serbia; the Hungarian minority in Slovakia; and the Roma in Slovakia, Hungary, Romania, Bulgaria, Serbia, and Albania. Appendix 1 provides Census estimates of ethnic composition in the countries covered in our study, and Appendix 2 lists the actual subsamples included in our quantitative analyses. About 18.5 percent of the respondents captured in our data identify with groups other than the national majority.
It is important to note that the 2006 LiT survey includes questions that ask respondents to compare their situation in 2006 with their life in 1989. Respondents were asked to evaluate their economic situation and overall living conditions, and whether their household lives better now than it did in 1989. We use retrospectively reported information about 1989 to trace potential differences between lives before the collapse of communism and the period of market transition. We acknowledge that retrospective data obtained after assessing the situation in 1989 are not ideal in 2006, 17 years later. Nevertheless, attitudinal data effectively reveal people’s perceptions, even if they don’t strictly align with material experience. Thus, we take the information about how people remember their lives in 1989 seriously and as something that can reveal their relative content or discontent with economic matters over time. As research has shown, such perceptions can be quite consequential (Alonso-Ferres et al., 2020; Fernandez-Urbano and Kulic, 2020). Please also note that the Berlin Wall fell in November 1989, and regimes in the countries studied in this article unraveled in the next few years, not immediately in 1989. Furthermore, to ensure that we capture the validity of individual sentiments, we limited the retrospective analysis to respondents who were 33 or older during the survey in 2006. This guarantees that respondents were at least 16 years old in 1989, entering adulthood during the post-socialist transition. Given all this, we think it is reasonable to use reports about 1989 to capture respondents’ feelings of satisfaction with their economic lives.
Measures of satisfaction with economic lives
The analysis focuses on self-understanding of East Europeans about their economic lives, and how ethnic minorities compare with ethnic majorities. We test the hypothesis of increasing ethnic marginalization with a series of three logistic regression analyses. These include two that test the effect of ethnic minority status on retrospective accounts of economic lives in 1989 from the 2006 survey and one that tests the effect of ethnic minority status on economic lives in 2016. All the variables, including relevant covariates, are listed in Appendix 3. The comparison to 1989 analysis relies on two indicators: (1) belief that the current economic situation is better than in 1989 and (2) belief that overall living conditions are better than in 1989. Each of these is measured on a 5-point Likert-type scale, with values ranging from 1 = strongly disagree to 5 = strongly agree with the statement provided. For ease of interpretation, in the analyses presented, we dichotomize these variables with 1 indicating agreement (strongly agree and agree responses) and 0 otherwise. (Ordered logistic regressions show substantively similar results.) In addition, we check for economic attitudes in 2016 using the following survey question: “On the whole, I am satisfied with the present state of the economy.” The variable is similarly dichotomized with those expressing agreement and strong agreement coded as 1 and others coded as 0.
Measures of preference for state involvement in the economy and preference for markets
Outcomes that are linked to processes of market experience would include respondents’ sense of the role of the state in the economy and overall preference for markets as the central way to organize economic life. We have some measures to capture these processes in different survey years. In 2006, respondents were asked a series of questions beginning with, “Do you think the state should be involved in the following?” answering either not involved, moderately involved, or strongly involved. For our study, we used the responses for guaranteeing employment, guaranteeing low prices for basic goods and food, and guaranteeing low prices for electricity and gas. We dichotomized the variables with those asserting strong involvement as 1 and others coded as 0. In addition, in 2016, respondents were asked if they agreed with the statement. “A market economy is preferable to any other form of economic system” over two other statements suggesting that sometimes a planned economy is preferrable or that it does not matter. For this variable, all responses in agreement with preference for a market economy were coded 1 and all other responses coded as 0.
Differences across ethnicity
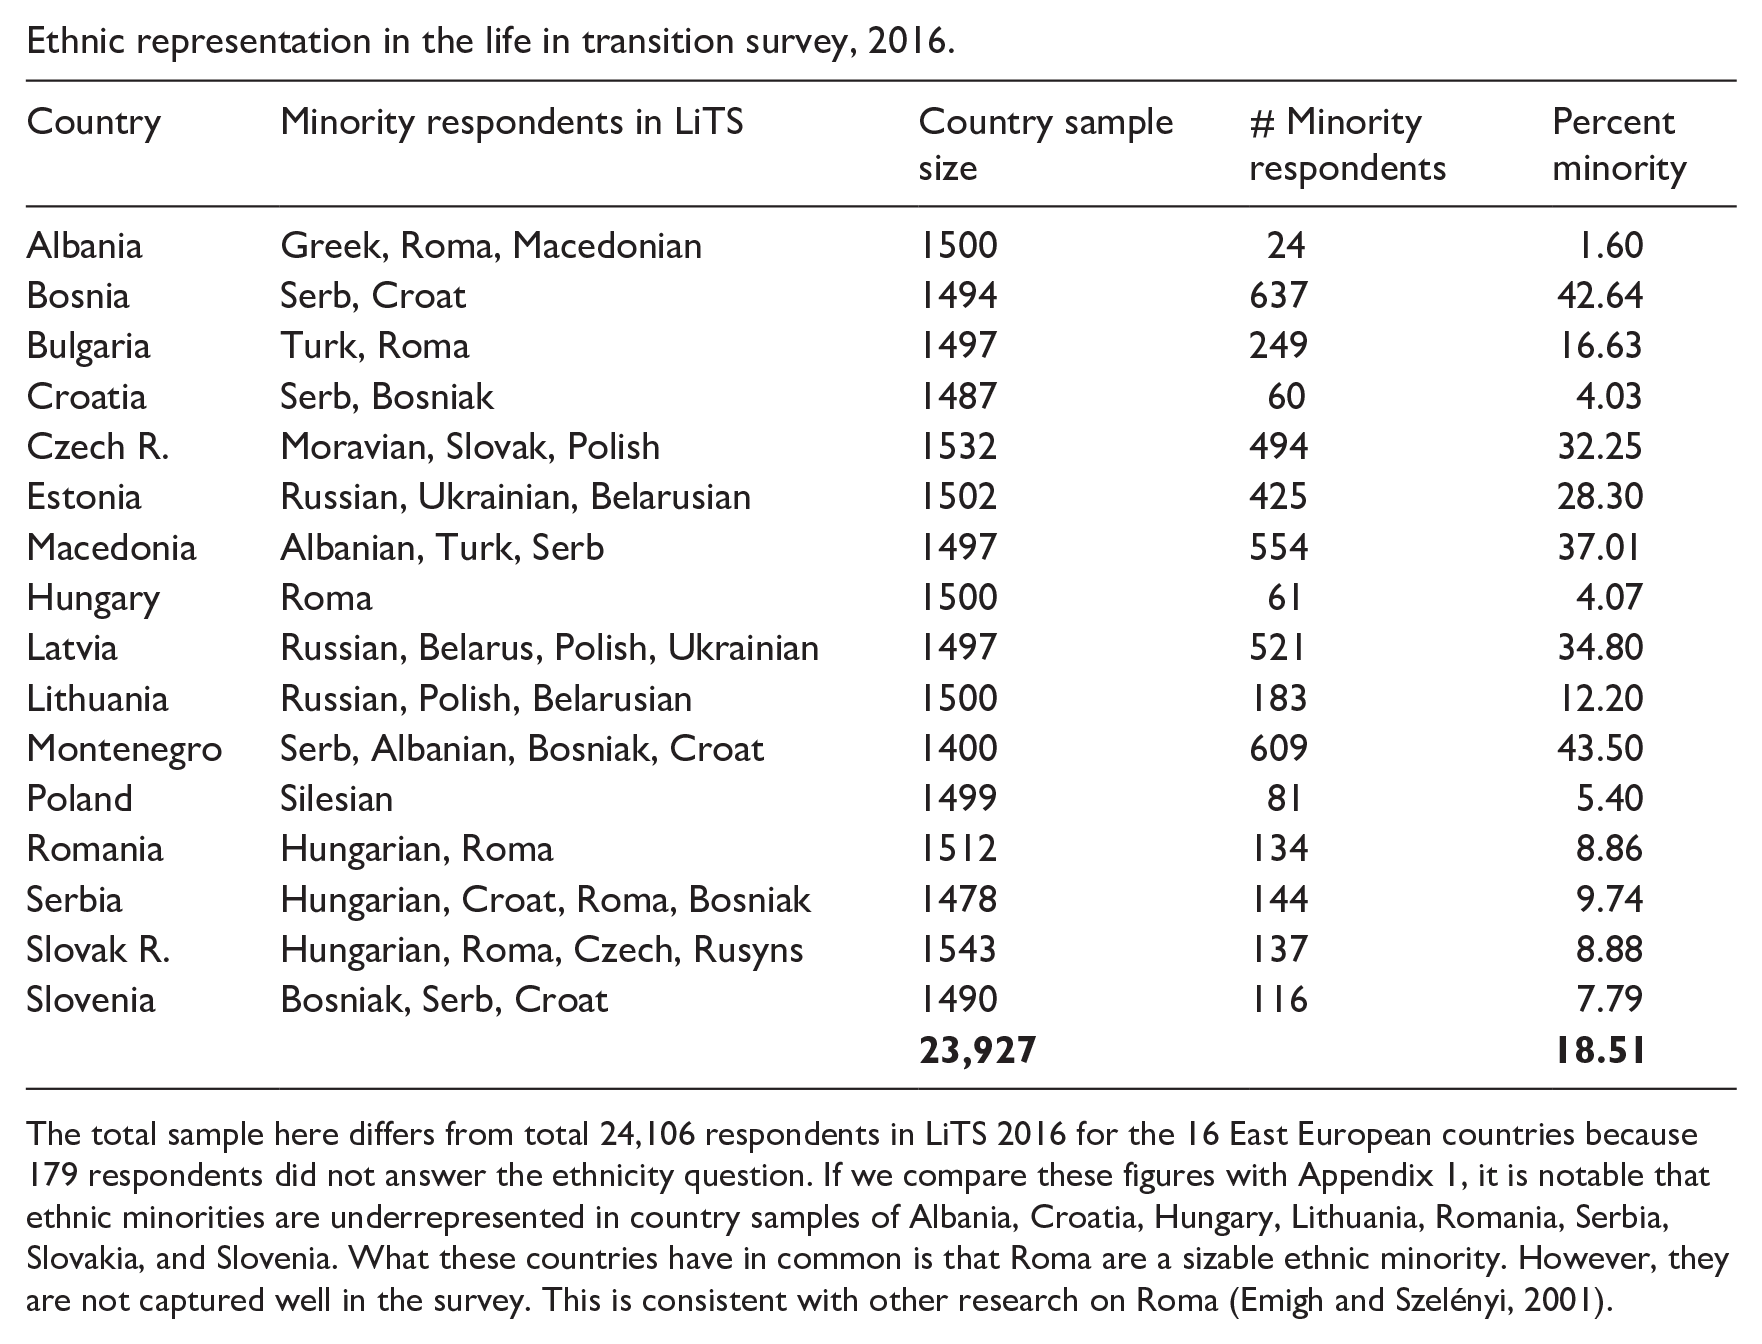
Given expectations about ethnic economic marginalization in postsocialism, we are particularly interested in examining how ethnic minorities compare to ethnic majorities in their evaluation of economic lives as well as the comparisons they make between 1989 (end of socialism) and 2006. We note that around 2006 was a period of economic growth in Eastern Europe, after many years of trying to recoup the pre-1989 gross domestic product (GDP) levels. We measure ethnic minority status as a binary variable reflecting whether the respondent belongs to an ethnic group that has been shown to be excluded in society, as operationalized with the EPR index (Wimmer et al., 2009). We should note that alternative operationalizations of “ethnic minority” using nationality designations (i.e. coding those who do not identify with the titular nationality as ethnic minorities (2006 wave) or using self-identification as ethnic minority (2016 wave)) produces substantively similar results, but the use of the EPR index has the advantage of consistency across datasets. Furthermore, the index codes various ethnic groups in terms of their power in a given nation-state, which captures a relational view of ethnicity, and is particularly well suited for an investigation of marginalized ethnicities. In addition, it deserves mention that the LiT survey is probably conservative in the numbers of ethnic minorities that it captures (Appendix 2). In 2016, 18.51 percent of respondents are coded as ethnic minorities. Statistics reported in Appendix 1 from CIA Factbook and national statistical offices indicate that a higher share, about 24 percent, do not identify as the ethnic majority across the 16 East European countries included in this study. Likely, as other studies also found, those who are substantially disadvantaged tend to be underrepresented in official national surveys (see Emigh and Szelényi, 2001 for the case of Roma). This means that our conclusions are likely to be conservative as the data we used may be more likely to not capture those who are disaffected and severely marginalized.
Method of analysis
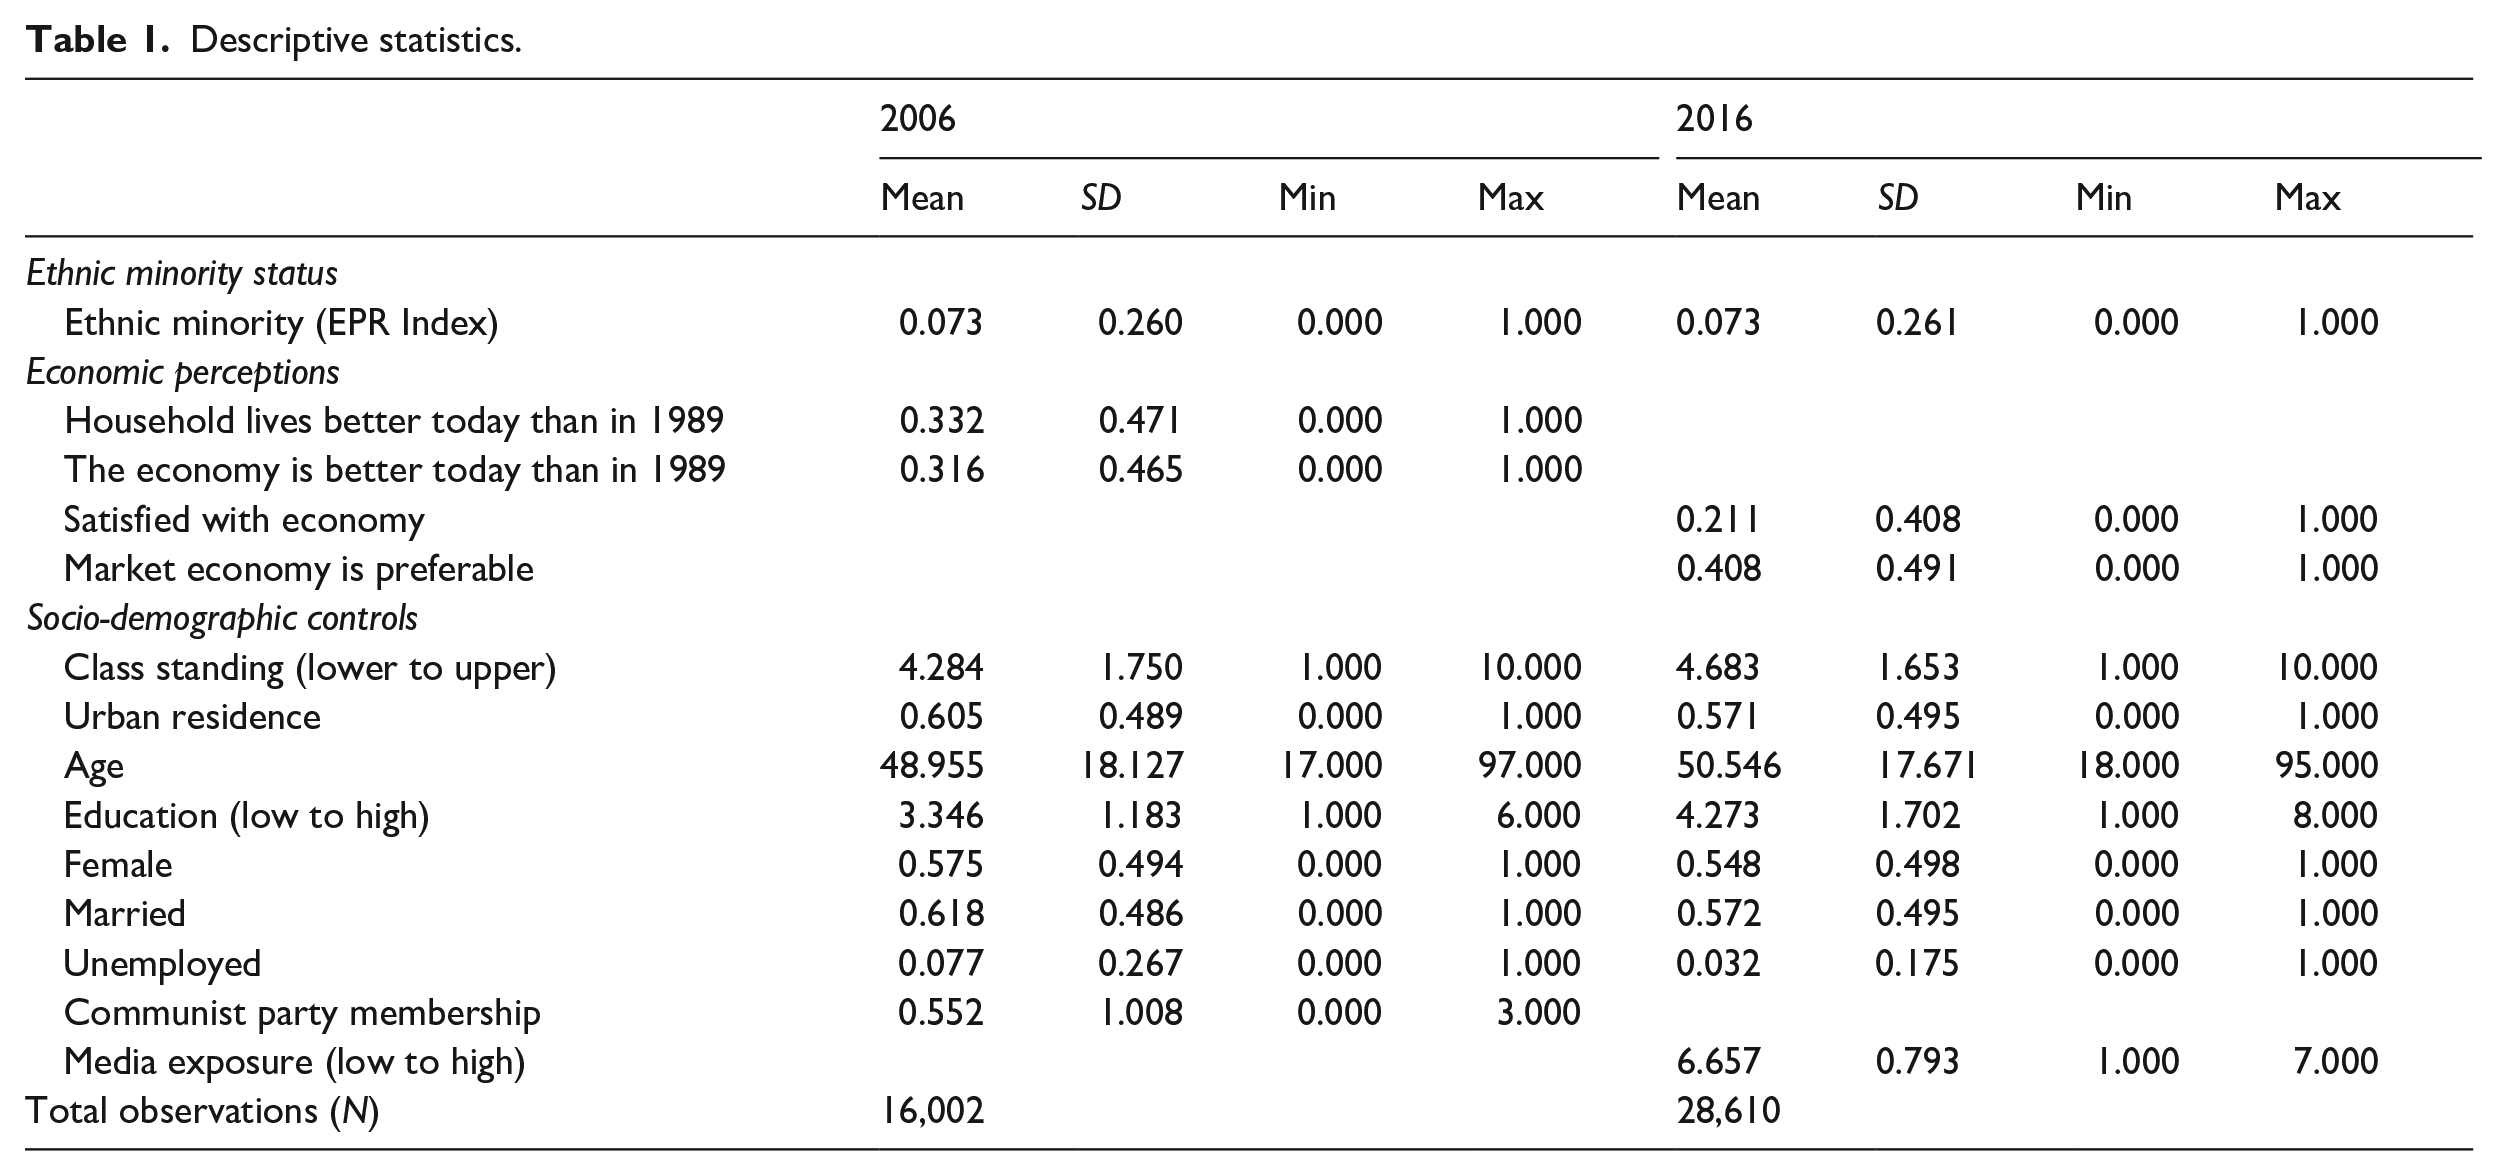
The survey outcomes used as dependent variables are measured in ordinal scales, which we convert into dichotomous outcomes (1 = strongly agree or agree, and 0 = neutral, disagree, and strongly disagree). We include the “neutral” category as a 0, making a value of 1 on the dichotomous variables reliably and clearly indicative of affirmative agreement with the statements. Therefore, we fit logistic regressions, with country fixed effects to account for any features that may be related to specific country characteristics that influence economic attitudes in those countries, such as aggregate economic growth, unemployment levels, or demographic structure. We note that fitting country fixed effects when we have small samples per country and therefore low degrees of freedom provides for a rather stringent test of how ethnicity may matter for economic attitudes. Furthermore, the data shows appreciable cross-national variation in the size of minority populations, thus we consider fixed effects to be a sensible approach that will minimize potential bias from this dynamic that could distort the correlations we observe between minority status and the outcomes under examination. We also fit a series of covariates that other studies have identified as important in influencing attitudes and are available in the dataset: class, urban/rural residence, gender, education, marital status, unemployment status, party member status (asked in 2006), and media exposure (asked in 2016). Table 1 presents descriptive statistics for all variables in the analyses.
Descriptive statistics.
Findings
Table 2 contains the first set of results and shows that, net of all covariates, the effect of being an ethnic minority is significant and negative for both dependent variables we investigate. More specifically, Table 2 shows that these 1989 to 2006 comparisons of economic perception and household living condition indicate a statistically significant negative correlation between the ethnic minority variable and economic satisfaction (meaning lower likelihood of ethnic minorities to express agreement that their lives are better in 2006 than in 1989, compared with the ethnic majority). Overall, ethnic minorities evaluated their lives to be substantially better in 1989 than in 2006, and this withstands the test in logistic regression analyses controlling for social class, urban/rural residency, age, education, gender, marital status, unemployment status, communist party membership (in 2006), and media exposure (in 2016) as well as country fixed effects.
Logistic regression predicting satisfaction with economic lives in 2006 compared with 1989 (limited to respondents over 32 in 2006).
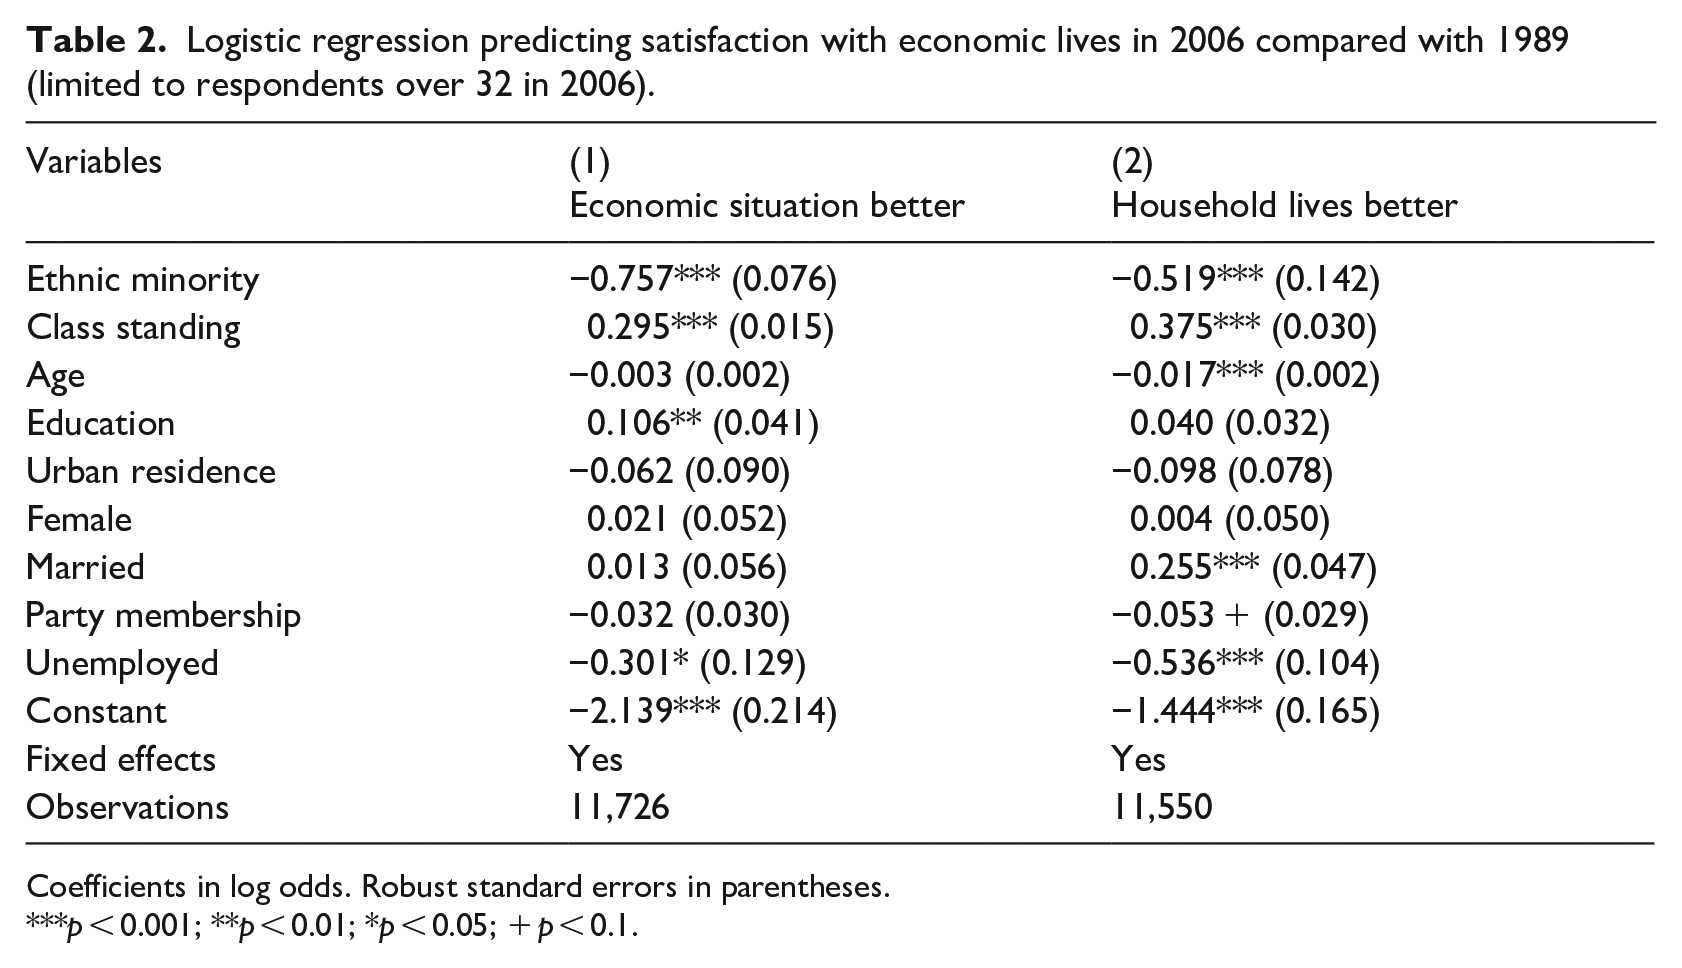
Coefficients in log odds. Robust standard errors in parentheses.
p < 0.001; **p < 0.01; *p < 0.05; + p < 0.1.
We demonstrate the relative importance of ethnic minority status using bar graphs, presented in Figure 1, comparing the predicted values of the mean likelihood of agreement across ethnic minority/majority status. By using predicted values, we can calculate the mean for both groups that is net of the effects of all covariates in the regression models. As Figure 1 illustrates, the model predicts that ethnic minorities will report less agreement with statements that the economic situation in the country is better in 2006 than in 1989, and that their household lives better than in 1989. Notably, the agreement with these statements for ethnic majorities is not overwhelming. The predicted values show that about one third of the ethnic majority agree that their life is better in 2006 than in 1989. However, less than a fourth of ethnic minority respondents evaluate that they lead better economic lives in 2006 than they did toward the end of socialism in 1989. It is also important to note that 2006 was probably among the highs in terms of economic prosperity and growth in Eastern Europe. It took decades for the region to recoup the GDP levels it had before the collapse of communism, but the economic situation around 2006 looked optimistic. The growth rates in Eastern Europe were around 6 percent in 2005 (Eurostat, 2017), while they were less than 3 percent in EU-15, the core fifteen European Member countries. Hence, in the period that could reasonably be considered among the economic highs of the postsocialist transformations, before the worldwide crisis hit Europe and Eastern Europe around 2009, we still see East Europeans rather disillusioned about their economic lives—substantially more so for ethnic minorities compared with others.
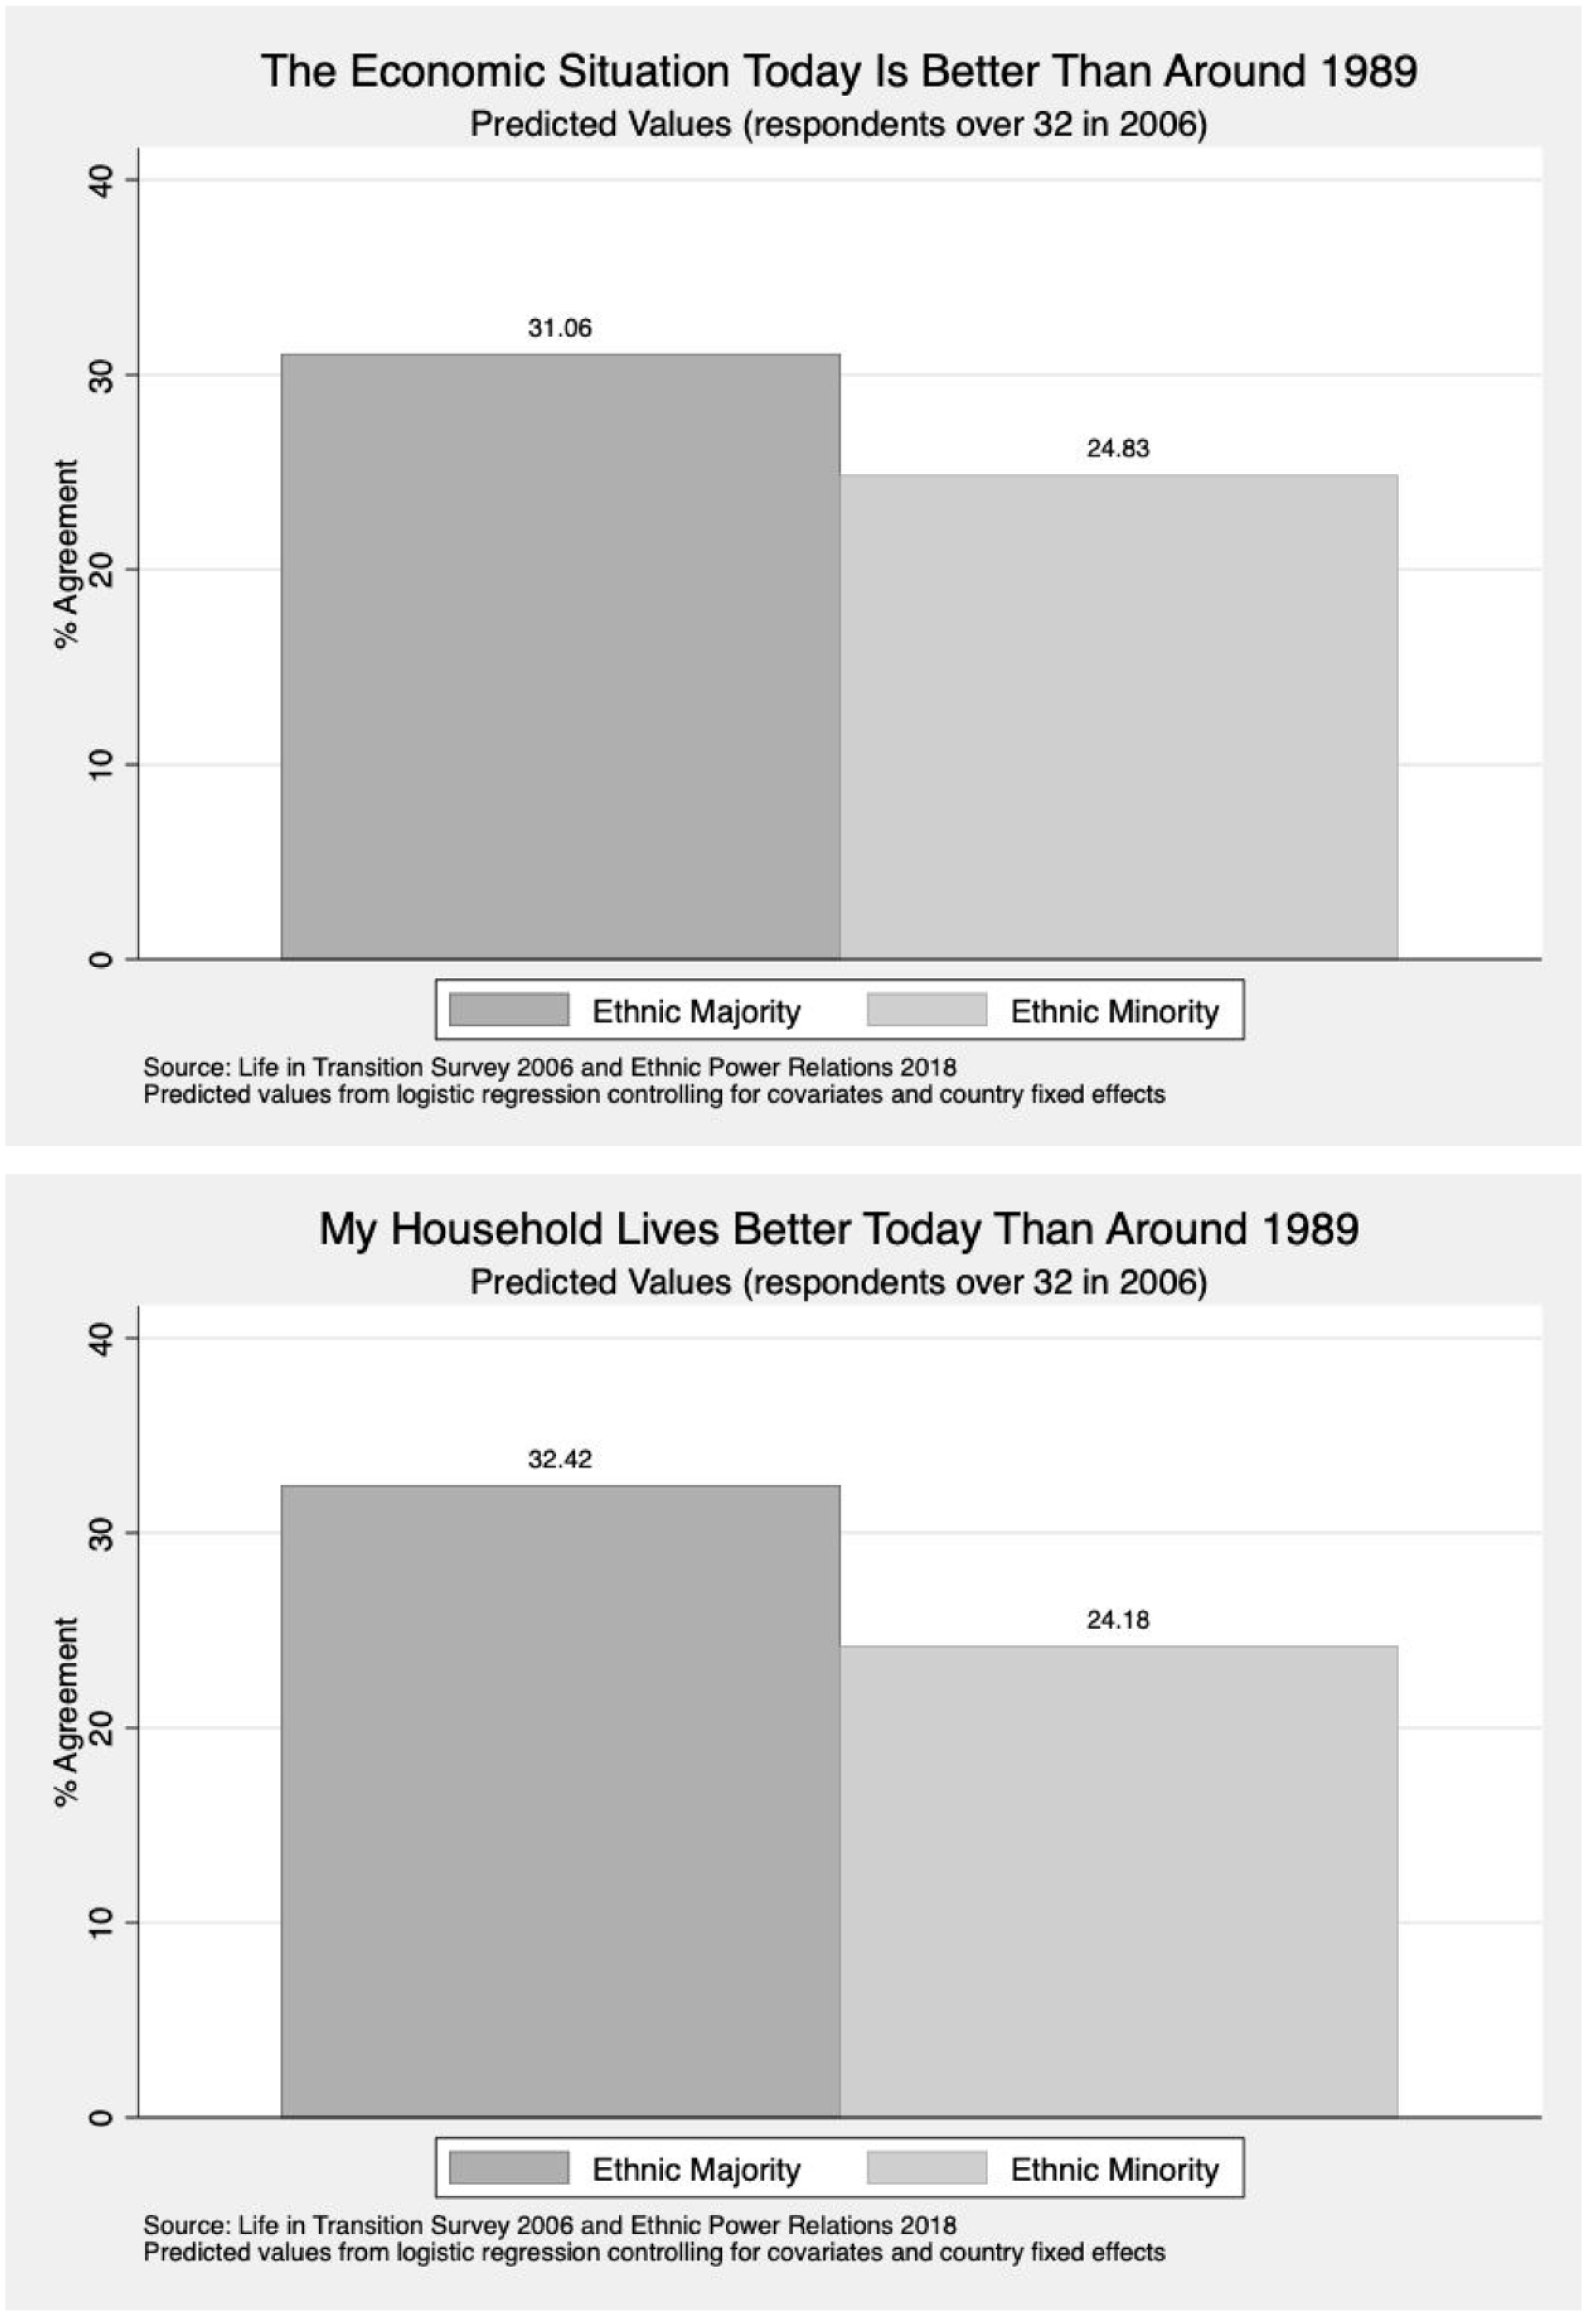
Comparing economic lives in 2006 to 1989, by ethnic minority status.
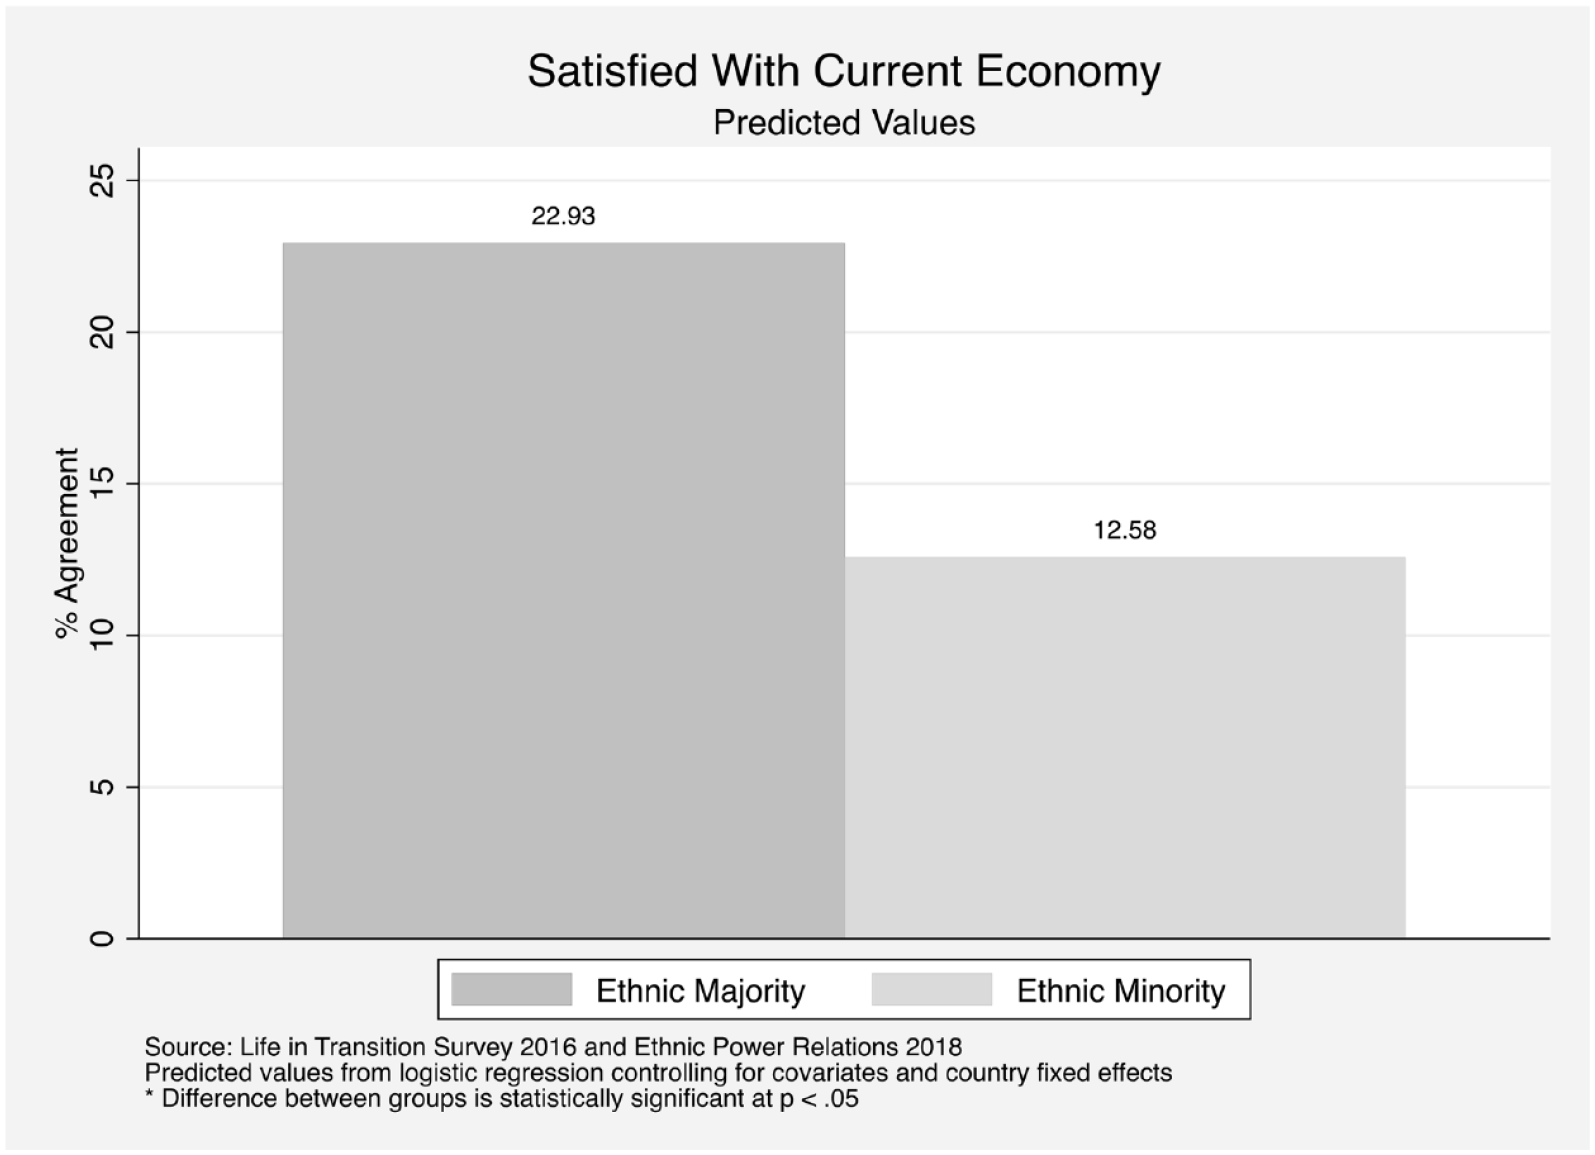
The second dimension of the analysis concerns a comparison of economic satisfaction between ethnic majority and minority in 2016, demonstrating the persistence of the effect observed with the 2006 to 1989 comparisons. This examines satisfaction with the current state of economy. Table 3 shows that ethnic minorities, compared with ethnic majorities, have lower levels of satisfaction with economy. We visualize this comparison in Figure 2 with the mean predicted values to show the likelihood of agreement, net of all covariates in the model. We see that there is a gap of over 10 percent between ethnic majority and minority respondents, with 12.58 percent of minorities and 22.93 percent of majorities predicted to report the economic satisfaction.
Logistic regression predicting satisfaction with economic life in 2016.
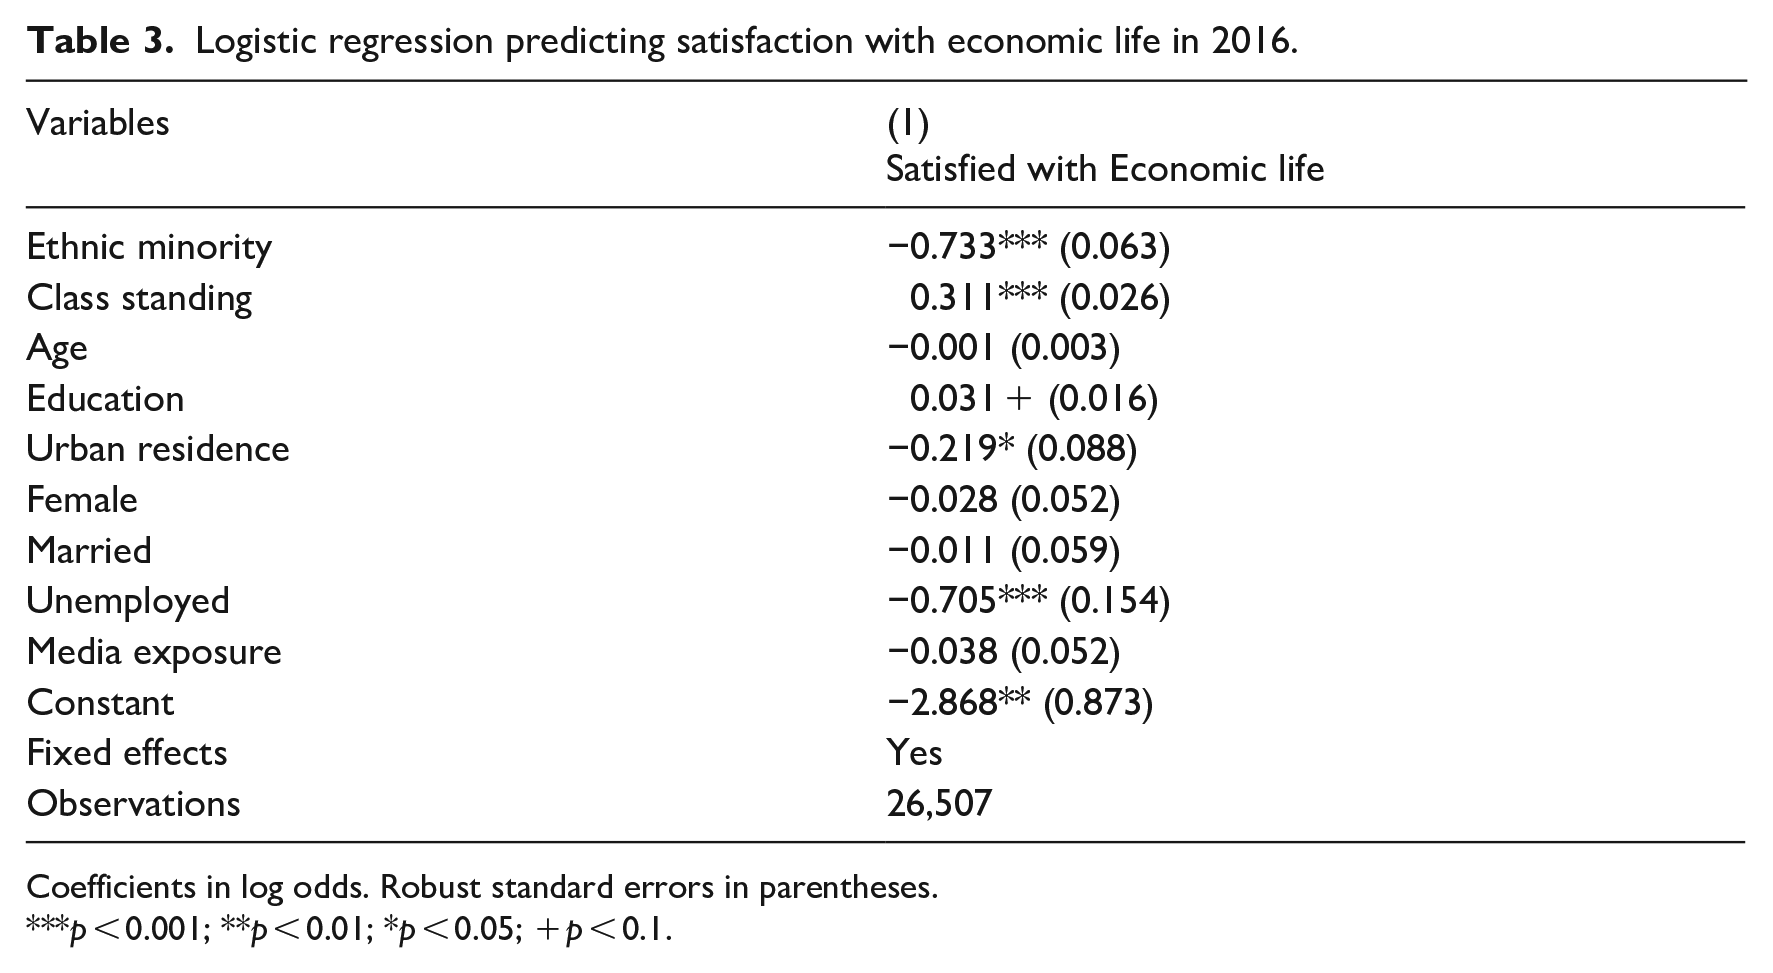
Coefficients in log odds. Robust standard errors in parentheses.
p < 0.001; **p < 0.01; *p < 0.05; + p < 0.1.
Economic discontent in 2016, by ethnic minority status.
In Table 4, we report differences across ethnicity on preferences for state involvement in the economy and preference for markets as the primary mechanism of economic organization. We examine four measures that are available in LiTS on these dimensions. The results show that there is a systematic difference based on ethnic identification, whereby in the 2006 survey, ethnic minorities are more likely to prefer state involvement in guaranteeing employment (Model 1) and low prices of basic goods (Model 2) as well as electricity/gas (Model 3). In addition, in the 2016 survey we find that ethnic minorities also prefer less markets as a general organizing principle (Model 4). These results suggest that those who experience market racism are more likely to turn to the role of the state for economic security and protection from economic marginalization, and they are significantly less likely to support that their lives be governed by markets, presumably also because their market experience is discriminatory and alienating.
Logistic regression predicting state involvement and market preference.
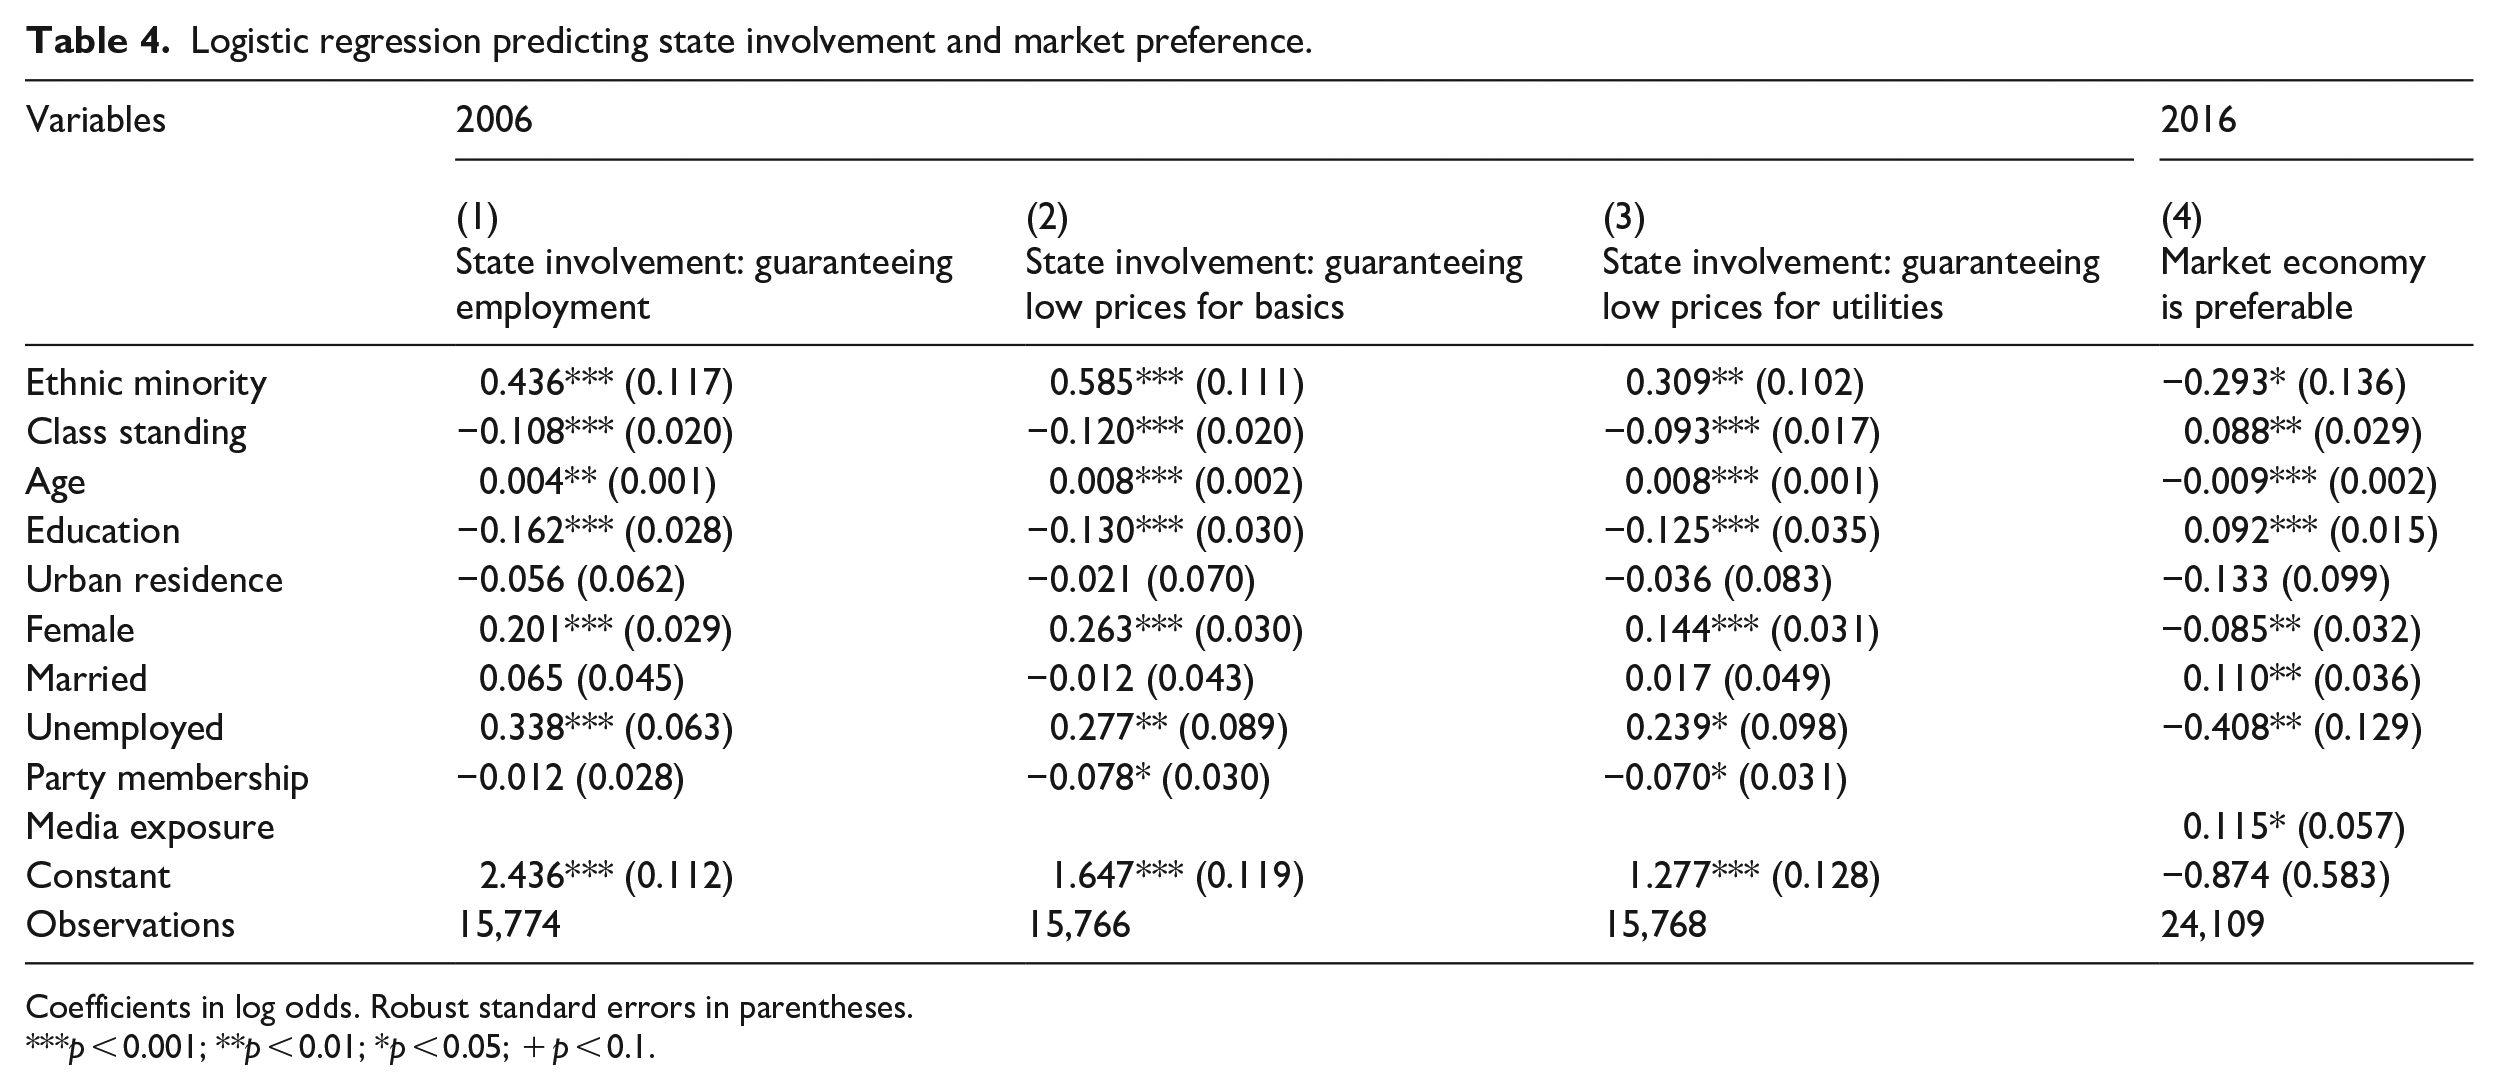
Coefficients in log odds. Robust standard errors in parentheses.
p < 0.001; **p < 0.01; *p < 0.05; + p < 0.1.
We also conducted auxiliary analyses to check for the influence of the Roma respondents’ perceptions on our general findings. Several studies show that Roma tend to be poorer, less well educated, racialized, and criminalized as an ethnic minority (Barany, 1998; Feischmidt et al., 2013; Milcher, 2006; Wheatley, 2007; WHO, 2023). It is therefore possible that they are the single ethnic minority that suffers from the most severe marginalization and that this has an outsized influence on our results. To check for this potential explanation, we ran all of our analyses on a sample that excludes those who identify as Roma. Given the heterogeneity of ethnic/national groups represented in our sample (see Appendix 2), this is only about 9 percent of the sample. All of our results remain substantively the same when Roma respondents are not included in the sample. That is, we have robust evidence that our findings of ethnic marginalization’s connection to economic dissatisfaction are not driven by those who identify as Roma, and that this sense of discontent is widespread among those who don’t belong to the countries’ national majorities, even if their specific ethnic/national identifications across the region are very diverse (see Appendix 1).
Discussion and conclusion
In this article, we scrutinized the consequences of market transition for ethnic marginalization in postsocialist Europe. We first set up the context of our case to argue that forces of neoliberalism, insider-based privatization, and collective memory of ethnic conflict rendered ethnicity as a salient category of identification and differentiation in postsocialist Europe. We argued that this impacted not only political processes but also creation and operation of markets, leading to economic marginalization of ethnic minorities. Based on the analysis of Life in Transition Survey data, and using the EPR index (Wimmer et al., 2009), we find that members of ethnic minority groups with low power in society across sixteen East European countries reported experiencing a stronger sense of discontent with their economic lives, compared with others. Furthermore, their sense of economic discontent was greater in 2006 and in 2016 than how they remembered it in 1989. This finding persisted when accounting for one’s material economic status, a measure privileged in the market transition theory (Nee, 1989). As such, our findings indicate that processes outside of a strictly material experience of the economy contribute to perception of economic marginalization, and that cultural and symbolic considerations are integral to economic lives. Moreover, we found that this sense of marginalization has likely pushed ethnic minorities to express greater support for the role of the state in guaranteeing employment and low prices, as well as lower support for markets as the main principle of economic organization.
Why do ethnic minorities express such economic discontent? Although we cannot get to causal mechanisms with the data available, we want to highlight the likelihood of the role of racial/ethnic prejudice and discrimination in shaping market outcomes. In understanding these, researchers would be well served to integrate insights from economic sociology and race/ethnicity scholarship and consider both cognitive and emotional mechanisms that undergird racial/ethnic differentiation in everyday market exchanges. The existing research largely stipulates cognitive differentiation, because of the in-group out-group dynamic (Tajfel and Turner, 1986), so that, for instance, discrimination can be considered rational because employers can entertain their “taste” for certain groups over others (Becker, 1957). Alternatively, discrimination can be rational because employers rely on stereotypes about group membership to deal with lack of information, also known as statistical discrimination (Tilcsik, 2021). Next to the rational or boundedly rational considerations, it also seems important to learn from economic sociology that offers alternatives to rational-action framework and opens conceptual space for an affective dimension of racial/ethnic differentiation in markets, as actors bring to the marketplace also likes and dislikes, compassion and disgust, or loyalty and betrayal, and other emotions (Bandelj, 2009). Emotions are culturally and historically grounded (through ethnic conflict and violence, for instance) and can become engrained into social structures. These path-dependent processes contribute to a lesser or greater salience of certain categories of identification and differentiation in everyday marketplace interactions (e.g. on the basis of race/ethnicity) and we would expect this to contribute to the experience of economic marginalization for said groups.
Some observers blame the negative outlook of East Europeans on the economic crisis that hit Europe after 2009 (De Haas et al., 2016; Grosjean et al., 2013). However, when we consider how respondents evaluated their lives in 2006 compared with 1989, we can see that a sense of discontent about economic lives and sense of disillusionment with the future started to permeate the East European region well before the 2009 crisis. While this crisis undoubtedly had an impact, we point to the roots of observed trends in the fundamental societal transformations after communism, brought about by privatization and neoliberalism, whereby—in the context of ethnic conflict or violence that permeated the region—ethnicity has reigned as a salient category of identification and differentiation in everyday market interactions in postsocialist Europe.
We hope that our research advances the understanding of economic ethnic marginalization. While quite voluminous, scholarship on the intersection of race/ethnicity and economy most often starts with issues of social stratification and inequality—not with a goal to understand the inner workings of the economy. As such, this literature seems to treat the realm of race/ethnicity and the realm of economy as two analytically separate spheres, which potentially impact one another. Instead, we are inspired by recent work that urges analysts to examine racism as constitutive of economy (Hirschman and Garbes, 2021; Reyes, 2022), and not only within a broad umbrella of racial capitalism, but also in everyday market interactions. It is also important that such inquiry extends to empirical sites that have mostly eluded racial capitalism’s attention, outside of Global North, but also outside of Global South, in the semi-peripheral regions, as is Eastern Europe.
In addition, it is established that, in public opinion, there is a hierarchy of “deservingness” (Hilmar, 2019, 2023), and with regards to state welfare provisioning, for instance, immigrants are perceived as less deserving as other groups (Van Oorschot, 2006). Our analysis of state involvement preferences underscores that one’s status as a minority, or not, can be expected to shape their deservingness perception. In other research, we also observe that public attitudes toward redistribution are shaped by the welfare regime under which one lives and by their social positioning, including class and gender (Svallfors, 1997). Our study suggests that one’s position as an ethnic minority similarly correlates with attitudes in favor of redistribution programs.
Importantly, other extensive research suggests that factors as varied as financial knowledge (Owusu, 2021), social trust (Ren et al., 2022), social support (Choi et al., 2023), perceptions of fairness (Mitchell and Gengler, 2019), satisfaction with one’s country (Morrison et al., 2011), individualistic/collectivist cultural orientations (Çera et al., 2020), a country’s GDP (Augner, 2015), or its level of income inequality (O’Connell, 2004) could all shape one’s perception of economic wellbeing. Therefore, future research could focus more on the relative importance of different factors, including ethnic identification.
In closing, we offer that our findings can also help us understand the recent rise in anti-democratic, populist, and right-wing tendencies within Eastern Europe (Bandelj and Gibson, 2020) and beyond (Baker et al., 2020; Grigoryan and Ponizovskiy, 2018; Schmidt and Quandt, 2018; Singh, 2021 cf. Bonikowski, 2017). While public commentators have focused on economic issues and rising income and wealth inequalities as potential explanations for these anti-democratic trends, our analysis of the experience of ethnic minorities in Eastern Europe reveals the weight of sentiments of ethnic intolerance and likely acts of discrimination that have been pervasive for decades. This makes it less surprising, if not less demoralizing, that the populists and nationalists have recently gained strong political ground in Eastern Europe and (too many) other countries of the world.
Footnotes
Appendix 1
Ethnic composition in East European countries.
| Country | Year | Ethnicities | Percentage of population |
|---|---|---|---|
|
|
2011 | Albanian | 82.6 |
| Romani | 3 a | ||
| Greek | 3 | ||
| Other (including Vlach, Macedonian, Montenegrin, and Egyptian) | 1 | ||
| Unspecified | 12.5 | ||
|
|
2013 | Bosniak | 50.1 |
| Serb | 30.8 | ||
| Croat | 15.4 | ||
| Other | 2.7 | ||
| Not declared/ no answer | 1 | ||
|
|
2011 | Bulgarian | 84.8 |
| Romani | 9 a | ||
| Turkish | 8.8 | ||
| Other (including Russian, Armenian, and Vlach) | 0.7 | ||
| Did not identify | 0.8 | ||
|
|
2011 | Croat | 90.4 |
| Serb | 4.4 | ||
| Other (including Bosniak, Hungarian, Slovene, Czech, and Romani) | 4.4 | ||
| Not specified | 0.8 | ||
|
|
2011 | Czech | 64.3 |
| Moravian | 5 | ||
| Romani | 3 a | ||
| Other (including Slovak, Ukrainian, Polish, Vietnamese, German and Silesian) | 2.9 | ||
| Unknown | 29 | ||
|
|
2011 | Estonian | 68.7 |
| Russian | 24.8 | ||
| Ukrainian | 1.7 | ||
| Belarusian | 1 | ||
| Finn | 0.6 | ||
| Other | 1.6 | ||
| Unspecified | 1.6 | ||
|
|
2002 | Macedonian | 64.2 |
| Albanian | 25.2 | ||
| Romani | 12 a | ||
| Turkish | 3.9 | ||
| Romani | 2.7 | ||
| Serb | 1.2 | ||
| Other | 1.8 | ||
|
|
2011 | Hungarian | 85.6 |
| Romani | 6 a | ||
| German | 2.2 | ||
| Other (including Romanian, Slovak, Croatian, Russian, Serbian, Ukrainian, Polish, Chinese, Bulgarian, Arabic, Greek, Ruthenian, Armenian, Vietnamese and Slovenian) | 1.7 | ||
| Other (unknown) | 0.9 | ||
| Declined to answer | 14 | ||
| Hungarian percentages add to more than 100% because respondents were allowed to identify more than one ethnic group. | |||
|
|
2017 | Latvian | 62 |
| Russian | 25.4 | ||
| Belarusian | 3.3 | ||
| Ukrainian | 2.2 | ||
| Polish | 2.1 | ||
| Lithuanian | 1.2 | ||
| Other | 3.8 | ||
|
|
2011 | Lithuanian | 84.1 |
| Polish | 6.6 | ||
| Russian | 5.8 | ||
| Belarusian | 1.2 | ||
| Other | 1.1 | ||
| Unspecified | 1.2 | ||
|
|
2011 | Montenegrin | 45 |
| Serb | 28.7 | ||
| Bosniak | 8.7 | ||
| Albanian | 4.9 | ||
| Romani | 4 a | ||
| Muslim | 3.3 | ||
| Croat | 1 | ||
| Other | 2.6 | ||
| Unspecified | 4.9 | ||
|
|
2011 | Polish | 96.9 |
| Silesian | 1.1 | ||
| German | 0.2 | ||
| Ukrainian | 0.1 | ||
| Other and unspecified | 1.7 | ||
| Note: Represents ethnicity declared first. | |||
|
|
2011 | Romanian | 83.4 |
| Hungarian | 6.1 | ||
| Romani | 9 a | ||
| Ukrainian | 0.3 | ||
| German | 0.2 | ||
| Other | 0.7 | ||
| Unspecified | 0.2 | ||
|
|
2011 | Serb | 83.3 |
| Hungarian | 3.5 | ||
| Romani | 4 a | ||
| Bosniak | 2 | ||
| Other | 5.7 | ||
| Undeclared or unknown | 3.5 | ||
| Note: Most ethnic Albanians boycotted the 2011 census | |||
|
|
2011 | Slovak | 80.7 |
| Hungarian | 8.5 | ||
| Romani | 9 a | ||
| Other (including Czech, Ruthenian, Ukrainian, Russian, German, Polish) | 1.8 | ||
| Unspecified | 7 | ||
|
|
2002 | Slovene | 83.1 |
| Serb | 2 | ||
| Croat | 1.8 | ||
| Bosniak | 1.1 | ||
| Other or unspecified | 12 |
Source: Central Intelligence Agency (2018) unless otherwise noted.
Romani population percentages are estimates from (Ringold et al., 2005).
Hungarian percentages are from Toth and Vekas (2014).
Appendix 2
Ethnic representation in the life in transition survey, 2016.
| Country | Minority respondents in LiTS | Country sample size | # Minority respondents | Percent minority |
|---|---|---|---|---|
| Albania | Greek, Roma, Macedonian | 1500 | 24 | 1.60 |
| Bosnia | Serb, Croat | 1494 | 637 | 42.64 |
| Bulgaria | Turk, Roma | 1497 | 249 | 16.63 |
| Croatia | Serb, Bosniak | 1487 | 60 | 4.03 |
| Czech R. | Moravian, Slovak, Polish | 1532 | 494 | 32.25 |
| Estonia | Russian, Ukrainian, Belarusian | 1502 | 425 | 28.30 |
| Macedonia | Albanian, Turk, Serb | 1497 | 554 | 37.01 |
| Hungary | Roma | 1500 | 61 | 4.07 |
| Latvia | Russian, Belarus, Polish, Ukrainian | 1497 | 521 | 34.80 |
| Lithuania | Russian, Polish, Belarusian | 1500 | 183 | 12.20 |
| Montenegro | Serb, Albanian, Bosniak, Croat | 1400 | 609 | 43.50 |
| Poland | Silesian | 1499 | 81 | 5.40 |
| Romania | Hungarian, Roma | 1512 | 134 | 8.86 |
| Serbia | Hungarian, Croat, Roma, Bosniak | 1478 | 144 | 9.74 |
| Slovak R. | Hungarian, Roma, Czech, Rusyns | 1543 | 137 | 8.88 |
| Slovenia | Bosniak, Serb, Croat | 1490 | 116 | 7.79 |
|
|
|
The total sample here differs from total 24,106 respondents in LiTS 2016 for the 16 East European countries because 179 respondents did not answer the ethnicity question. If we compare these figures with Appendix 1, it is notable that ethnic minorities are underrepresented in country samples of Albania, Croatia, Hungary, Lithuania, Romania, Serbia, Slovakia, and Slovenia. What these countries have in common is that Roma are a sizable ethnic minority. However, they are not captured well in the survey. This is consistent with other research on Roma (Emigh and Szelényi, 2001).
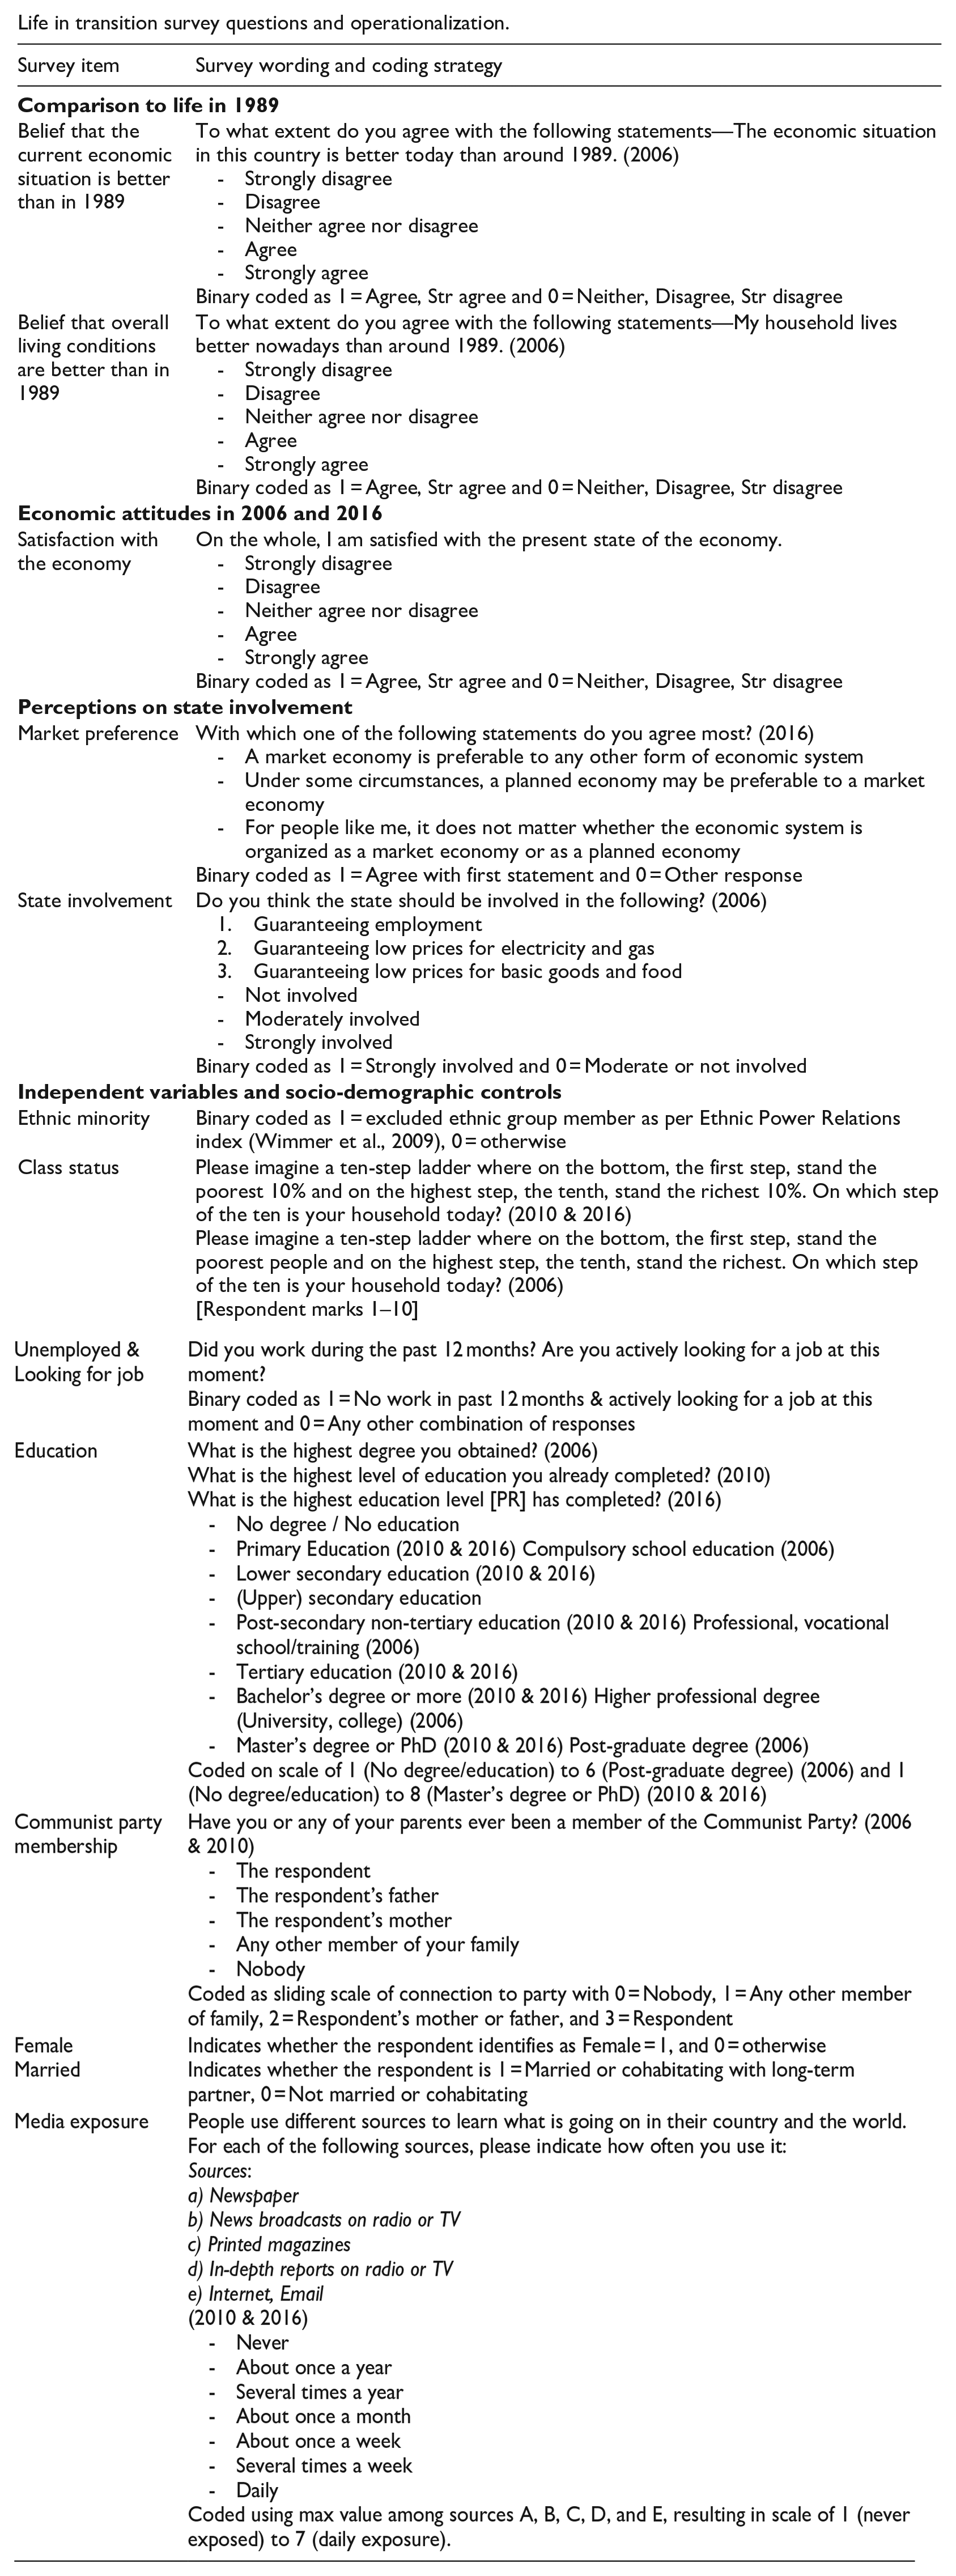
Appendix 3
Life in transition survey questions and operationalization.
| Survey item | Survey wording and coding strategy |
|---|---|
|
|
|
| Belief that the current economic situation is better than in 1989 | To what extent do you agree with the following statements—The economic situation in this country is better today than around 1989. (2006) - Strongly disagree - Disagree - Neither agree nor disagree - Agree - Strongly agree Binary coded as 1 = Agree, Str agree and 0 = Neither, Disagree, Str disagree |
| Belief that overall living conditions are better than in 1989 | To what extent do you agree with the following statements—My household lives better nowadays than around 1989. (2006) - Strongly disagree - Disagree - Neither agree nor disagree - Agree - Strongly agree Binary coded as 1 = Agree, Str agree and 0 = Neither, Disagree, Str disagree |
|
|
|
| Satisfaction with the economy | On the whole, I am satisfied with the present state of the economy. - Strongly disagree - Disagree - Neither agree nor disagree - Agree - Strongly agree Binary coded as 1 = Agree, Str agree and 0 = Neither, Disagree, Str disagree |
|
|
|
| Market preference | With which one of the following statements do you agree most? (2016) - A market economy is preferable to any other form of economic system - Under some circumstances, a planned economy may be preferable to a market economy - For people like me, it does not matter whether the economic system is organized as a market economy or as a planned economy Binary coded as 1 = Agree with first statement and 0 = Other response |
| State involvement | Do you think the state should be involved in the following? (2006) 1. Guaranteeing employment 2. Guaranteeing low prices for electricity and gas 3. Guaranteeing low prices for basic goods and food - Not involved - Moderately involved - Strongly involved Binary coded as 1 = Strongly involved and 0 = Moderate or not involved |
|
|
|
| Ethnic minority | Binary coded as 1 = excluded ethnic group member as per Ethnic Power Relations index (Wimmer et al., 2009), 0 = otherwise |
| Class status | Please imagine a ten-step ladder where on the bottom, the first step, stand the poorest 10% and on the highest step, the tenth, stand the richest 10%. On which step of the ten is your household today? (2010 & 2016) Please imagine a ten-step ladder where on the bottom, the first step, stand the poorest people and on the highest step, the tenth, stand the richest. On which step of the ten is your household today? (2006) [Respondent marks 1–10] |
| Unemployed & Looking for job | Did you work during the past 12 months? Are you actively looking for a job at this moment? Binary coded as 1 = No work in past 12 months & actively looking for a job at this moment and 0 = Any other combination of responses |
| Education | What is the highest degree you obtained? (2006) What is the highest level of education you already completed? (2010) What is the highest education level [PR] has completed? (2016) - No degree / No education - Primary Education (2010 & 2016) Compulsory school education (2006) - Lower secondary education (2010 & 2016) - (Upper) secondary education - Post-secondary non-tertiary education (2010 & 2016) Professional, vocational school/training (2006) - Tertiary education (2010 & 2016) - Bachelor’s degree or more (2010 & 2016) Higher professional degree (University, college) (2006) - Master’s degree or PhD (2010 & 2016) Post-graduate degree (2006) Coded on scale of 1 (No degree/education) to 6 (Post-graduate degree) (2006) and 1 (No degree/education) to 8 (Master’s degree or PhD) (2010 & 2016) |
| Communist party membership | Have you or any of your parents ever been a member of the Communist Party? (2006 & 2010) - The respondent - The respondent’s father - The respondent’s mother - Any other member of your family - Nobody Coded as sliding scale of connection to party with 0 = Nobody, 1 = Any other member of family, 2 = Respondent’s mother or father, and 3 = Respondent |
| Female Married |
Indicates whether the respondent identifies as Female = 1, and 0 = otherwise Indicates whether the respondent is 1 = Married or cohabitating with long-term partner, 0 = Not married or cohabitating |
| Media exposure | People use different sources to learn what is going on in their country and the world. For each of the following sources, please indicate how often you use it: Sources: a) Newspaper b) News broadcasts on radio or TV c) Printed magazines d) In-depth reports on radio or TV e) Internet, Email (2010 & 2016) - Never - About once a year - Several times a year - About once a month - About once a week - Several times a week - Daily Coded using max value among sources A, B, C, D, and E, resulting in scale of 1 (never exposed) to 7 (daily exposure). |
Acknowledgements
The authors gratefully acknowledge research assistance of Debra Boka and Homa Sadri and helpful comments from participants at the Mini-conference on Economic Racism, Racial Capitalism and Ethnic Chauvinism at the 2022 Society for the Advancement of Socio-Economics in Amsterdam. Bandelj also acknowledges the U See I Write, a faculty writing initiative at the University of California, Irvine, for protected writing time during which much of this article was written. The authors are grateful to the IJCS editor and anonymous reviewers for their valuable feedback that significantly improved the article.
Funding
The author(s) received no financial support for the research, authorship, and/or publication of this article.