
Abstract
This article explores the relationship between inequality and social harm, revisiting the original “Spirit Level” data from Wilkinson and Pickett, updating it for a later time period, and considering what difference it makes to their results by addressing criticisms made of their original research by using an alternative measure of inequality and expanding the range of possible causal factors. To achieve this, it makes use of both the original method used by Wilkinson and Pickett and that of a different approach, Qualitative Comparative Analysis. It finds that a measure of the kind of democracy (lower “integrative democracy”), along with higher inequality, are the key factors at the root of solutions for explaining higher social harm in both periods, which both follow up the suggestions by Wilkinson and Pickett about the role of democracy in explaining social problems, as well as making the extent and means of that relationship clearer.
Introduction
Research by Richard Wilkinson and Kate Pickett, in The Spirit Level, has shown that among the richest countries, it is the more unequal ones that do worse according to almost every quality of life indicator. We all know, in our hearts, that as long as there is deep poverty living systematically side by side with great riches, we all remain the poorer for it.
The Spirit Level (TSL) (Wilkinson and Pickett, 2010) is an influential and important text, the reach of which has gone far beyond academia. TSL is about the relation between inequality and its relationship with a variety of health and social problems. Prefaces of different editions of the book contain supportive quotes from senior members of the UK Labour party, and the former leader of the Conservative Party (and, at the time of writing, Foreign Secretary) also presents it as a key influence (see above). The US edition had a foreword from former US Secretary of Labour Robert Reich. In 2022, the President of the Academy of Social Science in the United Kingdom, Will Hutton, named it as one of the key examples of social science research that has directly influenced his own thinking. 1
However, TSL also launched a substantial debate, with allegations being made that the authors had deliberately chosen their sample to produce the results they sought (Snowdon and Basham, 2010) and of poor statistical practices (Saunders, 2010). This article aims to make original contributions to the relationship between inequality and the health and social problems identified by Wilkinson and Pickett, as well as to the methodological debates surrounding TSL by replicating the original study, taking another sample of data (from 2019, just before the pandemic) to give a comparison point with the original sample (which was from around 2005), and utilizing a new method (Qualitative Comparative Analysis) to consider a wider range of causal factors to see whether they better explain the relationships of different countries scoring highly in the index of health and social problems than inequality alone. In doing this, the article also explores the challenges involved in relation to replicating social research findings.
The article finds that the relationship between inequality and the index of health and social problems constructed by Wilkinson and Pickett in the original time period appears to be robust, even after its measures to include only factors replicable in a later period. However, it also finds that the relationship between inequality and the social harm index is not as strong in 2019, making it appropriate to consider the effects of including other causal factors. QCA is deployed in order to incorporate such factors, and its application finds that, for countries with higher health and social problems, higher inequality is found to be a key part of a more complex causal solution but alongside lower integrative democracy, a finding which applies both for the original period and for 2019.
TSL debate
If one of the original aims of the founders of social science was to identify “social facts” (Durkheim and Lukes, 1982), the authors of TSL seems to claim they had found one—that inequality levels in highly developed nations are positively correlated, suggesting in the view of the authors a causal relationship, with a range of social problems. Wilkinson and Pickett (2018) went on to publish a sequel to TSL which put a greater emphasis on the underlying causal mechanisms underlying the relationship between inequality and health and social problems, making clear links to other research, especially in the social determinants of health field (Marmot, 2015) which also emphasizes the damaging effects of inequality.
TSL made its argument using two main macrocomparative data sets. One was based on the relationship between inequality and different social problems in US states, and will not be the topic of this article as the book’s main arguments and influence have been concerned with the second data set, which was concerned instead with the data from 21 different countries (including the United States). That data set led to the construction of the book’s main claims about the relationship between inequality and a range of health and social problems, including poor mental health, drug use, low life expectancy, low trust, obesity, poorer educational performance, high teenage birth rates, violence, imprisonment, and low social mobility. Several of these factors are then combined to create an index of health and social problems (henceforth, the “index”), with inequality plotted against that measure to produce Figure 1, which appears to show a strong relationship between the two.
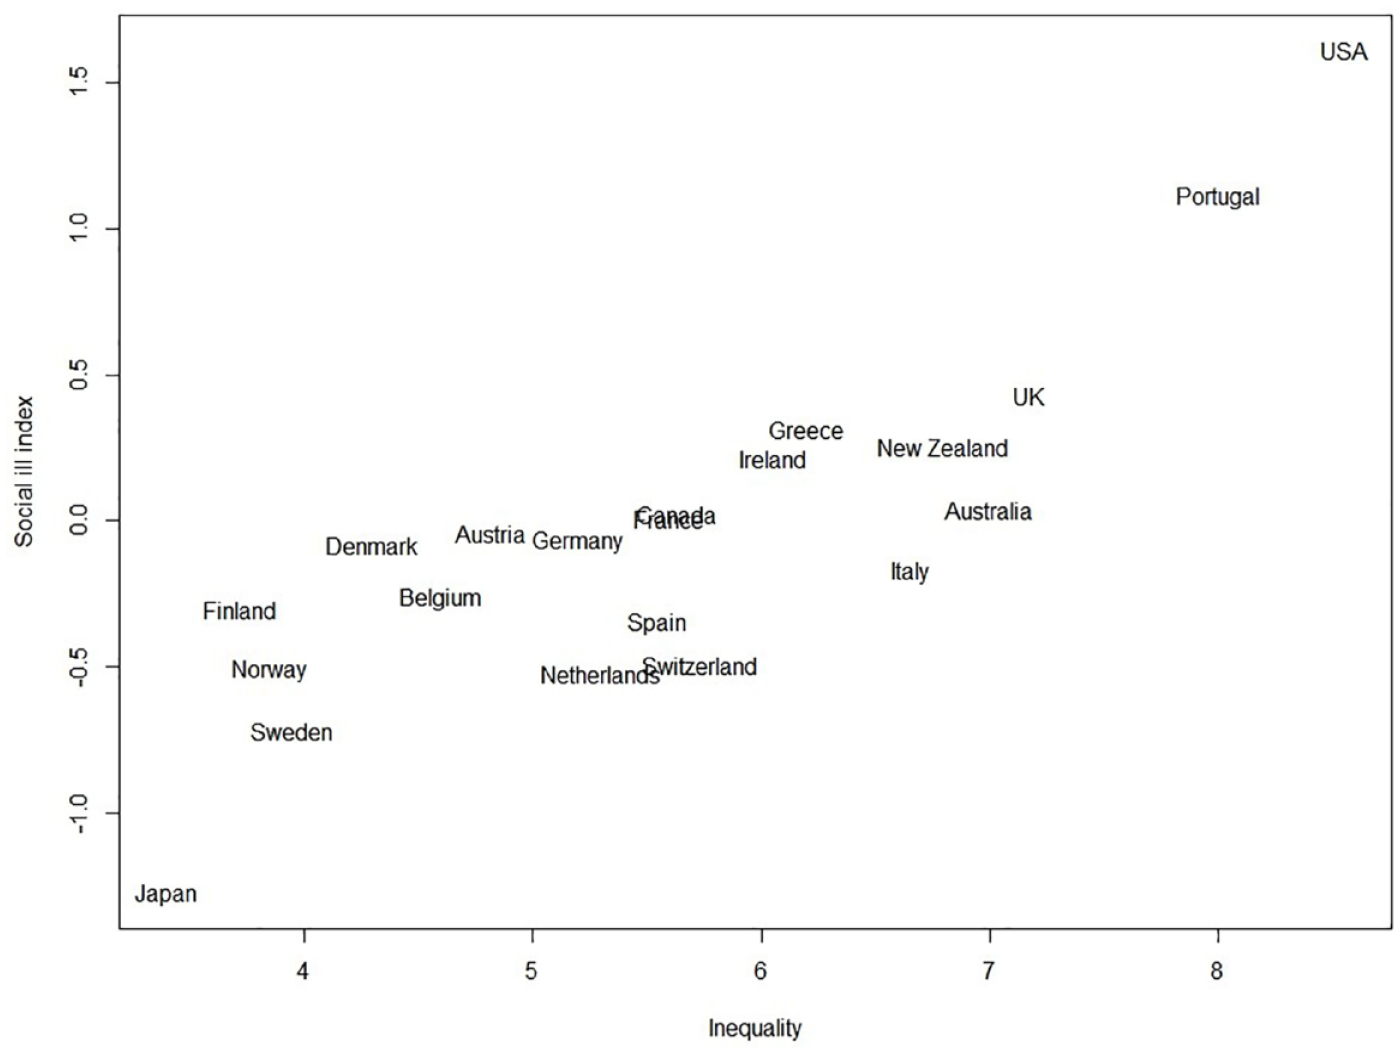
Scattergram of the original Spirit Level data.
The publication of TSL, as noted above, led to supportive responses, especially from political leaders and the left-learning media, but also to a range of criticisms. Wilkinson and Pickett were accused, in book-long responses of (among other things) selectively choosing countries to make their argument (Snowdon and Basham, 2010) and of poor statistical practice (Saunders, 2010). Wilkinson and Pickett, in turn, published responses to these claims in the paperback version of the book, 2 but there is clearly still a great deal of heat in the debate, with some critics even revisiting the discussion years later (Snowdon, 2019). Wilkinson and Pickett were also key figures in founding The Equality Trust (2023), which continues to publish work emphasizing the importance of their findings in current policy debates.
As well as work criticizing TSL, there is also published research that partially supports its findings, but at the same time casts doubt on the simplicity of its core argument, of the causal relationship between inequality and social problems. Perhaps the most thorough version of this comes from Deaton (2003, 2015) whose work suggests that the cross-sectional approach of Wilkinson’s work (going beyond TSL) is not supported when the relationship between inequality and mortality is explored longitudinally instead. This work is extremely robust quantitative analysis, but is focused on one of TSL’s social ills only—mortality data. It does raise an important question, however, of whether exploring TSL’s data using either a different method or in a different period might lead to a different result.
Other research exploring the claims made in TSL has extended its analysis as well as elaborating on its underlying mechanisms and suggesting refinements of its argument. Peacock et al. (2014) suggest that high inequality neoliberalist countries tend to naturalize blame for being at the lower end of the social gradient, and that internalization exacerbates the inequalities in income which Wilkinson and Pickett identified. This internalization is also related to low-income households also being effectively excluded from civic and social life (Lancee and Van de Werfhorst, 2012), as well as from their exclusion from cultural consumption more generally, adding further to status anxiety above and beyond that of income inequality alone. Other research suggests that the economic and cultural gaps between richest and poorest lead to decreased trust between them (Delhey et al., 2017), and which is especially the case in the most globalized countries (Polillo, 2012).
Muntaner et al. (2012) suggest that there is a need for the analysis of TSL to go further, especially in terms of the need to incorporate political and economic explanations in order to explain why income inequality is generated in the first place, whereas Bartram (2022) finds that higher earners do not suffer from increased social anxiety as inequality increases, making it harder to get that group to agree to greater egalitarianism in high inequality countries. Finally, Rambotti (2015) suggests there is a need to consider poverty alongside inequality in order to get a better understanding of the causes of health and social problems. More generally, it is also important to test whether the results TSL found in the mid-2000s can be replicated in another time period—especially given the effects of post-financial-crisis austerity on both health and its social determinants including trust, social relationships, and economic hardship (Van der Wel et al., 2018).
As such, although TSL’s findings are often supported by later research, there are also some criticisms, suggesting that the focus on inequality alone is too narrow, and questioning whether the results are specific to data from the time period (mid-2000s) which the original study made use of. It is these questions that the article now turns to.
Method
The original Spirit Level analysis is based on fairly simple bivariate relationships between inequality, based on a published measure of income inequality, and the index of health and social problems, the components of which were all weighted equally based on the means of their z scores. These measures have the advantage of being fairly easy to understand, and produce strong visualizations, with inequality on the X axis and the index on Y (as with Figure 1).
If we are to replicate the analysis of TSL for the original time period and repeat the analysis for another time period, then this involves compiling the data from the original study (which is available from the Equality Trust), and finding as much as possible equivalent data for the other time period. Expanding the range of possible causal factors in line with the criticisms made above, however, is more complex. The most obvious answer is to extend the linear modeling approach implicit in the bivariate correlations of the original book by incorporating additional independent variables (as well as their interactions). This is the most common approach in macrocomparative work. However, there are also significant limits, as one of the leading methods texts in the field makes clear (Babones, 2013).
First, although it is relatively easy to add additional independent variables to a linear model and look to see if this adds to the power of our causal explanations, that doesn’t mean we always should. Each causal factor must earn its place, ideally in terms of its position in relation to a theory or framework, but also accepting that linear models with multiple factors have significant “limited diversity”—they are unlikely to cover all variations of causal factors. A good rule of thumb is that we need 2n cases for each factor added (where n is the number of factors) just to have the possibility of having one case for each possible combination. So two factors requires four cases, three factors nine cases, four factors 27 cases, and so on—and this will still only potentially yield one case per possible combination with the likelihood of several combinations not having any cases at all. This puts limits on the complexity of the models we can create with limited case numbers—and if we are comparing developed countries (which is the goal of TSL), then we have only a limited number of countries to compare—here the 21 in the original study.
Second, we need to know how our causal factors interact with one another. We can incorporate this simply into linear models through interaction effects, but Gelman (2018) estimates that incorporating an interaction effect requires an exponential increase in the number of cases available to differentiate between noise and the actual effect. There is little potential to increase the number of cases (countries) in a macrocomparative analysis—especially if we are trying to reproduce and extend a study based on a particular sample of countries. We can try and increase our case numbers by including data from several time periods, but this comes with its own problems (Babones, 2013) with such use of repeated data points clearly being non-independent, and so doesn’t really address the problem. Causal complexity is hard to deal with and, when combined with limited diversity, makes linear modeling extremely challenging for macrocomparative work.
Given these problems, how can we add more causal factors to macrocomparative research?
One option is to focus on cases which appear to show particularly interesting patterns of causal factors, and produce in-depth qualitative analysis of them. This allows us to explore those cases, identified in terms of the causal factors we have outlined, to try and better understand how the factors play out to produce the index result. This is the strategy most often used in qualitative case analysis, and which has produced some powerful results (including Skocpol, 1992; Thelen, 2014, for example).
The difficulty with this approach comes in providing a robust selection of cases that capture the full range of phenomenon we are interested in, and the extent to which we can say results are generalizable from them, no matter how carefully we choose the cases which will be included. As an alternative to linear modeling, and as a means of dealing with complexity, “small n” case analysis has a great deal of strengths. However, this was not the approach taken in TSL, and it is hard to see how we could construct a study using small numbers of detailed cases to either support or challenge the findings from the original study.
Another option is to use a mixed-methods approach to try and combine the rigor of quantitative analysis with the insight of qualitative analysis. A strong candidate developed in this approach is that of Qualitative Comparative Analysis (QCA), developed by Charles Ragin (2000, 2008, 2014), and elaborated on by a number of researchers since (for example, Dusa, 2018; Schneider and Wagemann, 2012). This approach is based on (in its most recent forms) fuzzy-set logic combined with case analysis in order to try and find complex patterns within the data. The chief strengths of the approach are in dealing with causal complexity with case numbers far smaller than linear modeling, but also that it potentially offers multiple solutions—or “equifinality”—so that there can be more than one causal recipe for reaching a particular outcome. Such equifinality seems a reasonable assumption—life expectancy is high in both Australia and Switzerland, but with very different patterns of inequality and a range of possible other causal candidates in the two countries as potential causal factors.
QCA is based on set-theoretical logic rather than what Ragin (2008) calls the “net effects” models of linear regression–based approaches, so that analysis is based on seeking the necessary and sufficient conditions that cases with the desired outcome have in common (and difference). The fuzzy-set version of QCA incorporates a range of measures, most clearly for the consistency of the sufficient solutions, and which measures the extent to which cases correspond to the solution generated. The measure provides a pragmatic balance between attempting to make causal claims and accepting that no model can fully capture the complexity of reality.
QCA, being based on causal complexity and seeking patterns between variables in small to medium size cases (Schneider and Wagemann, 2012), therefore appears to be a viable approach to exploring the numbers of cases present in TSL, as well as expanding the range of causal factors beyond inequality alone. This expansion of causal factors, however, requires further consideration, and it is to this that the article now turns.
Adding additional causal factors
The criticisms of TSL outlined above suggested a range of possible additional causal factors that might be relevant to the relationship between inequality and social harm. First, there is the default control variable generally included in macrocomparative research—national income per capita. This factor is included to attempt to explore the effects of other factors independent of those which come as a result of economic growth. Wilkinson and Pickett (2010: chapter 1) make clear that they do not believe that this factor is relevant to the index of health and social problems, but it is worth including it to explore whether it might be having some effect, perhaps in combination with other factors. The measure of national income per capita most consistently available is gross domestic product (GDP) per capita, and in the spirit of the original book, which aimed to make use of measures that are as accessible as possible it is used here.
Second, and following Polillo (2012), there is a need for a factor which captures whether a country has been successful (or not) in dealing with changes to the global economy since the 1970s. At the macrocomparative level, several possible measures exist to try and capture these changes. Two such measures are the KOF globalization index and the WEF competition index. Both are credible candidates, but the second gives an indication not only of the societal changes that have occurred, but also how well the country appears to be meeting them (see all the discussion in Gamble, 2016). Although the two measures are only moderately correlated, they do appear, having tried both in the following analysis, to be remarkably interchangeable in QCA solutions, and so can be regarded as substitutes rather than complements. The WEF results are presented in solutions below, which attempts to capture whether countries scored according to that index as being less competitive in an era of globalization have more social problems.
The third additional factor attempts to measure the commitment of a particular to dealing with social problems, especially in relation to the criticisms offered by Rambotti (2015). This is a factor which cannot be assessed directly, and so will need a proxy measure. Here, public social expenditure (as a proportion of government spending) is used. Interpreting the impact of this factor requires understanding its interaction with other potential causal factors, with high social spending possibly a sign of a country which is attempting to alleviate social problems by government expenditure, or, could, in combination with other factors, be an attempt to simply manage them. This element attempts to capture, especially in relation to other factors, whether countries with higher public social expenditure have more social problems.
To incorporate the criticism of Muntaner et al. (2012), it is important that we also characterize the type of democratic government that is in place. Several empirical typologies exist, with perhaps the most cited being that of Lijphart (2012) who uses two dimensions—that between “executive-parties” (the extent to which a government is run on a single-party approach or a coalition of interests and political parties) and the “federal-unity” dimension (broadly whether a government is federal or more singular in its executive structure). The first of the two dimensions is least controversial (Vis, 2007) and more relevant to the democratic issues raised by TSL (Wilkinson and Pickett, 2010: postscript). Maleki and Hendriks (2016) update Lijphart’s work to attempt to both mitigate existing criticisms of it, and present what they call a measure of “integrative democracy” defined as the extent to which a political party is both elected and governed through a proportional system of elections incorporating a range of societal interests (highly integrative) or is elected by a minority of people and able to act as a single party in government. This factor attempts to capture the extent to which political systems incorporate a wide range of interests, or are able to govern without them. It is a sensible working hypothesis that governments which are more integrative might place a greater emphasis on confronting social harm because of the wider range of interests they need to take into account—such a finding is certainly compatible with Lijphart’s original research.
It is also crucial to consider how inequality is measured. In TSL, the measure used came from the World Development Report (WDR) comparing the richest 20 percent to the poorest 20 percent. This choice of this measure is entirely sensible—but the WDR no longer includes it in more recent updates of its report, so it cannot be used (at least from the same source) to update the data. To consider the effect of changing the measure of inequality, the article incorporates the WDR Gini index measure, which is perhaps the most widely used measure of inequality. It compares the results of the GINI measure to those from the “20:20” measure for the earlier period, and allows for the creation of a consistent data set in the later period.
Combining the factors outlined above creates a robust means of exploring not only the effects of inequality to see if it is present in either QCA necessary or sufficient solution terms, but also how other factors might interplay with it, and which might appear as a route to poor achievement in the index of health and social problems. This article focuses on solutions for countries with a higher index score of health and social problems as including solutions for those with a lower score on the index of health and social problems as well would have nearly doubled its length, and will be the subject of future research.
Procedure
The article first replicated the original bivariate results from the original book. 3 However, reproducing the analysis for another time period did present some challenges. Although much of the same data as was used by Wilkinson and Pickett are available in 2023 (the time in which it was collected and analyzed), some of the sources have now updated or changed their measures. The “trust” variable, for example, is based on data from a combined World Values and European Values data set that produces slightly different values in its current form than those given by Wilkinson and Pickett. This is not unusual—taking OECD data, for example, at different time periods often produces different results as numbers are updated or underlying methods change. Finally, there were some measures, such as those for mental illness and social mobility, which are not available for anything like the full range of countries, and which are notoriously difficult to measure. Mental illness, in particular, although it is a hugely significant factor, is extremely difficult to generate macrocomparative, robust measures for. We, therefore, decided to exclude measures which did not cover all the countries we wished to consider, or where comparative measures for the two time periods could not be constructed.
These challenges led to the creation, in effect, of two data sets—the original Wilkinson and Pickett data, which forms a baseline set of measures, and a slightly revised version of that data which removes variables which are not available in the later time period (mental illness and social mobility, as well as including a different measure of inequality), and which reproduces the findings in both the original and later time period.
Once the data for the index of health and social problems was reconstructed, it was first examined using principal component analysis to explore whether there was more than one latent variable across the measures. This produced a proportion of variance from one factor of between 0.85 and 0.9 (depending on the data set) suggesting that the different measures do reasonably cohere to a good degree in one measure of them.
The bivariate calculations reproducing the original analysis are relatively straightforward, but as noted below, suggested that the relationship between inequality and social harm was not as strong in 2019 as it was in the original data set. To address this, as well as to expand the range of possible causal factors, QCA was conducted, but this involved several additional analytical steps. First, the data had to be calibrated. There are several variants of QCA, but here the fuzzy-set (Ragin, 2000, 2008) version was used as the data clearly do not fit into the simple binary categories needed for crisp sets. If we say a country has higher inequality, for example, this will be in relation to other countries as well as external benchmarks (Greener, 2023).
Calibration involves a qualitative judgment to assess whether a country falls into the set we are considering. In the case of inequality, countries were calibrated as to whether they were higher inequality or not because this article is concerned with exploring causal patterns or recipes that lead to higher scores on the index, with TSL suggesting this should be high inequality countries. Calibration involves scoring each country on a scale from 0 (out of the set) to 1 (fully in the set), with a value of 0.5 representing a country neither higher nor lower inequality—the point of indeterminacy.
Ideally, each calibration should be carried out in relation to an external index or measure to determine whether the factor under consideration can be considered in terms of its position in relation to a fuzzy scale ranging between 0 and 1 (Ragin, 2008). However, it is crucial that data are considered in context—in terms of the sample of countries from which it was drawn. To accomplish this, for each of the causal factors and outcome measures, its data were initially plotted along a single axis to examine the distribution and range present. Cluster analysis was then performed to see if it was possible, through a combination of the chart and the cluster analysis, to see if the distribution of data led to a crossover point between lower and higher being identified. Once possible crossover points were identified, the data were then calibrated on a logistic curve in line with Ragin’s (2008) “direct method” approach. Where possible alternative crossover points were identified, analysis was repeated with each calibration point—but in the case of the data in this article, this made little difference to the derived results.
After calibration has been completed, the first stage of QCA analysis involves identifying possible necessary conditions. This involves exploring the causal factors in terms of their appearance in calculations of necessary consistency, but also whether those factors, in set theory, are “relevant” to it (see Schneider and Wagemann, 2012) both in terms of their fit with theory and in terms of their measures of consistency and relevance. It is important to note that only factors which meet all three criteria—consistency, relevance and having fit with existing theory or empirical research—were considered.
As well as calculating necessary conditions, QCA also requires the construction of a truth table which presents every possible combination of causal factors to explore which have the outcome under consideration (here, a higher score on the index), and which do not. These scores are then again assessed in terms of their consistency in achieving the outcome, with a threshold, typically 0.75 or 0.8 (in line with the principles suggested by Ragin as well as what has become known as “enhanced standard analysis” (Schneider and Wagemann, 2012)) being used as a cut-off for being relevant to calculating a sufficient solution. After the truth table is constructed, and any counterfactual rows which have inconsistencies which need to be considered as part of enhanced standard analysis are noted so they can be removed as needed from subsequent analysis, sufficient solutions can be calculated.
Three sufficient solutions were calculated based on different assumptions about “remainder” or “counterfactual” rows on the truth table. Here, the intermediate sufficient solutions will be fully presented. Space prohibits all three sufficient solutions being included, but the commentary on them will outline other solutions where they are significantly different from the intermediate solution. Set relations are seldom perfect as it is unlikely a few causal factors will always lead to an outcome—models are always approximations of complex social reality. However, sufficient solutions should give us answers as to how our causal factors combine in relation to the outcome.
Finally, in its post-analysis stage, QCA goes on to consider the implications of the results of the sufficient solution, and here we identify one “typical case” and also identify cases which don’t fit with solutions (“deviant” cases) to engage in more detailed work to both explore how the solutions appear to function and seek candidate explanations for how deviant countries are different from those that do fit with the solution.
Having outlined its method, the article now turns to the results of its analyses.
Re-examining TSL
Original time period—bivariate results
The first step was to reproduce the original results from the book using the data made available by the authors, and with the original sample of 21 countries. Reproducing the original results is fairly straightforward, with an r value of 0.85 being attained. If the health and social problem index was then updated to include the elements that could be reproduced for the later time period, the r value increased to 0.86. As such, making changes to the index of health and social problems to make it more reproducible for 2019 made little difference to the original results.
The next step was to substitute an alternative measure of inequality for the “20:20” measure, as that data are no longer available in the WDR and the measure itself is not widely used. The substitution of the GINI index for the 20:20 index led to a fall in r to 0.72 using the original index, but this increased to 0.8 when correlated against the revised index of health and social problems that included measures reproducible in the later data period.
So, in performing a simple bivariate analysis between the two different measures of inequality and different versions of the index, for the original time period, the relationships suggested by TSL seem reasonably robust.
If we then look at data for 2019—so including results at the beginning of the pandemic to try and make sure that its effects are not included, then the value of the correlation coefficient between the GINI measure in the WDR and the replicated index falls to 0.52 (p = 0.02), with the new mapping of countries shown in Figure 2. As the relationship between inequality and social ill seemed weaker in 2019, this raised the possibility of exploring whether the wider range of causal factors suggested by existing research, and outlined in the literature review above, could help better explain social ill, both in 2019, but also in the original time period of TSL.
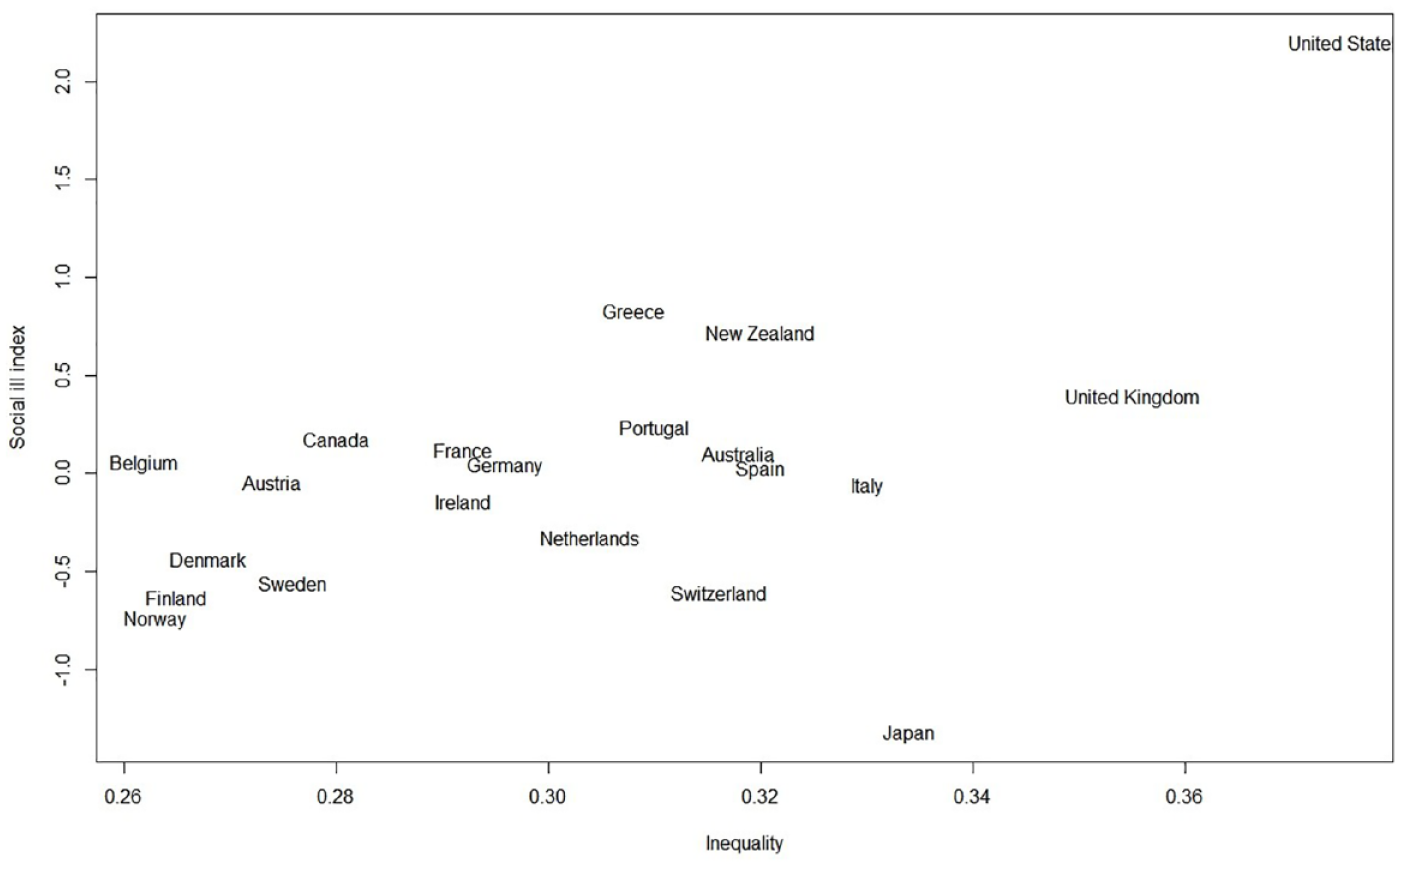
The inequality/social ill relation reproduced with 2019 data.
QCA results
Original time period
If we analyze the original Spirit Level data using QCA, adding the causal factors outlined above, the first step is to identify necessary conditions. Necessary conditions are those that consistently appear in the solution term (higher social ill) either by themselves or in combination with other causal factors, and which have some theoretical relevance given the discussion in the literature review above. Potential causal factors are measured in terms of their consistency (broadly, how often they appear) and their relevance (broadly, the extent to which they vary in line with the outcome). Two necessary conditions were found—lower integrative democracy (consistency 0.91, relevance 0.71) and a combination of either higher inequality or lower competitiveness (consistency 0.929, relevance 0.78), both of which have strong consistency and relevance, but also fit with the empirical evidence outlined above. Potential necessary conditions which had strong consistency and/or relevance but did not fit with existing research or theory were excluded. Two possible necessary conditions were included here because of the lack of agreement in existing research, but with each being credible combinations in the context of existing work.
QCA requires the construction of a truth table 4 which explores all possible combinations of causal factors (except those that are the opposite of those including necessary conditions, as such possibilities are logically impossible), and to examine the consistency and coverage of the solution of each combination to find sufficient solutions—the combinations of causal factors that appear to lead to higher scores on the social ill index. A consistency cutoff of 0.8 was applied in order to ensure cases included were highly consistent in their solutions, along with a proportional reduction in inconsistency cutoff of 0.5, which was the minimal threshold to ensure that cases did not appear in both the solutions for higher and lower inequality—a feature that can occur in complex set-theoretical relationships. These thresholds are consistent with best practice of enhanced standard analysis in QCA, and in the context of this solution, were relatively uncontentious, as there were no truth tables rows present which were close to the consistency thresholds.
In calculating the intermediate sufficient solution, directional expectations of higher inequality were included (in line with the original TSL research and that which followed it) so that the calculations which allowed simplifying assumptions on counterfactual rows which included that theoretical expectation could be incorporated.
Taking the necessary conditions outlined above into account and incorporating directional expectations resulted in the intermediate sufficient solution in Table 1.
QCA sufficient solution for original TSL data.
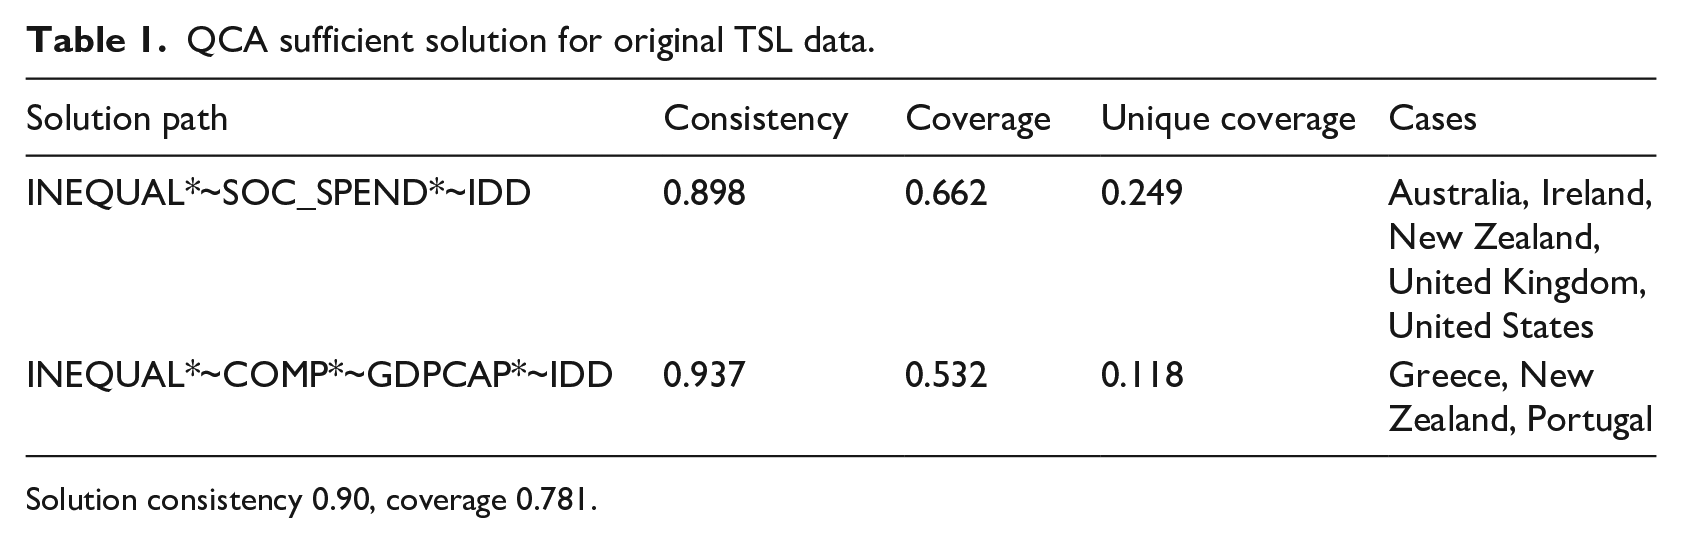
Solution consistency 0.90, coverage 0.781.
This intermediate solution (which here is identical to the parsimonious and conservative solutions, so that the directional expectations here did not simplify the solution) has two pathways to a higher index score with a high consistency (0.9) and which covers the majority of countries with a higher index score (0.78). The first causal pathway is a combination (indicated by the “*”) of higher inequality, lower social spending (with lower indicated by the “~”), 5 and lower integrative democracy. It has the highest unique coverage value in the solution, but has a lower consistency than the second pathway as it includes one case which, although it has the pathway’s combination of causal factors, does not score in the high group (just) for the index—Australia—which is therefore “deviant for consistency.”
The second solution pathway has a combination of higher inequality, lower competitiveness, lower GDP per capita, and lower integrative democracy. It has lower unique coverage than the first pathway, and covers few countries, but no countries deviant for consistency.
Both solutions, then, have higher inequality and lower integrative democracy in common—so a higher score on the index appears to have these two factors (and not inequality alone) at their root.
If, however, we use the fully replicable data set, then we get the following, slightly different results. The necessary conditions were a complex combination, with both lower integrative government (consistency 0.91, relevance 0.71) and the combination of higher income inequality or lower competitiveness (consistency of 0.95, relevance 0.65) being relevant both in terms of theoretical fit and these measures, so justifying their inclusion whereas other combinations of conditions either fell short in terms of theoretical fit or did not have high enough consistency or relevance measures. The truth table from the data used the same consistency thresholds as those above (consistency 0.8, proportional reduction in inconsistency 0.5) and again had no rows which presented borderline cases to consider. The pattern of necessary conditions, combined with directional expectations of higher inequality, led to the intermediate sufficient solution with again only two pathways, shown in Table 2.
QCA sufficient solution, replicable data, original time period.
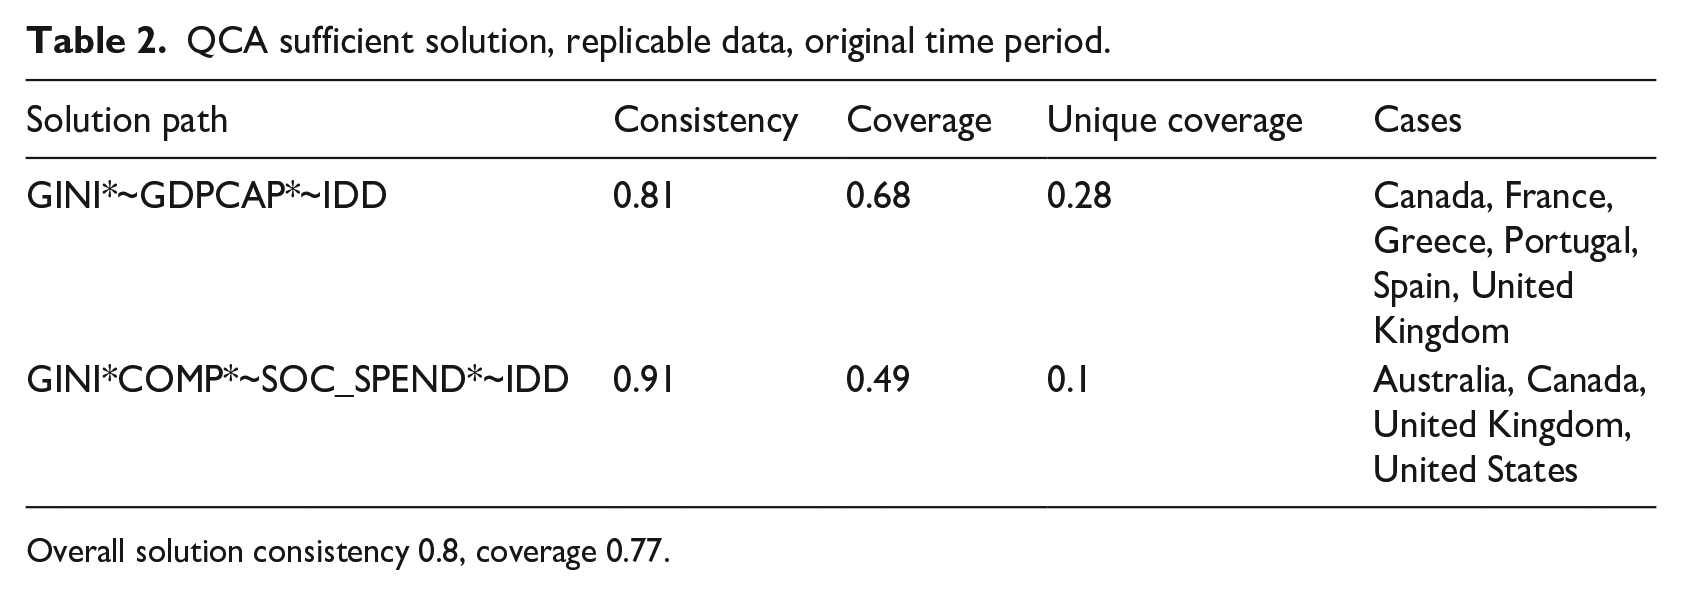
Overall solution consistency 0.8, coverage 0.77.
The two solution pathways here have fairly simple combinations, both of which again combine higher inequality and lower integrative democracy at their root. In contrast to the first solution, the parsimonious solution is slightly different, and has only one pathway made up of two factors alone (GINI*~IDD) with a consistency of 0.77 and coverage of 0.8.
The fall in consistency across both intermediate and parsimonious solutions results in there being four cases deviant for consistency (Australia are joined by Canada, France, and Spain) and one case deviant for coverage (Ireland). This relationship is shown in figure 3 below:
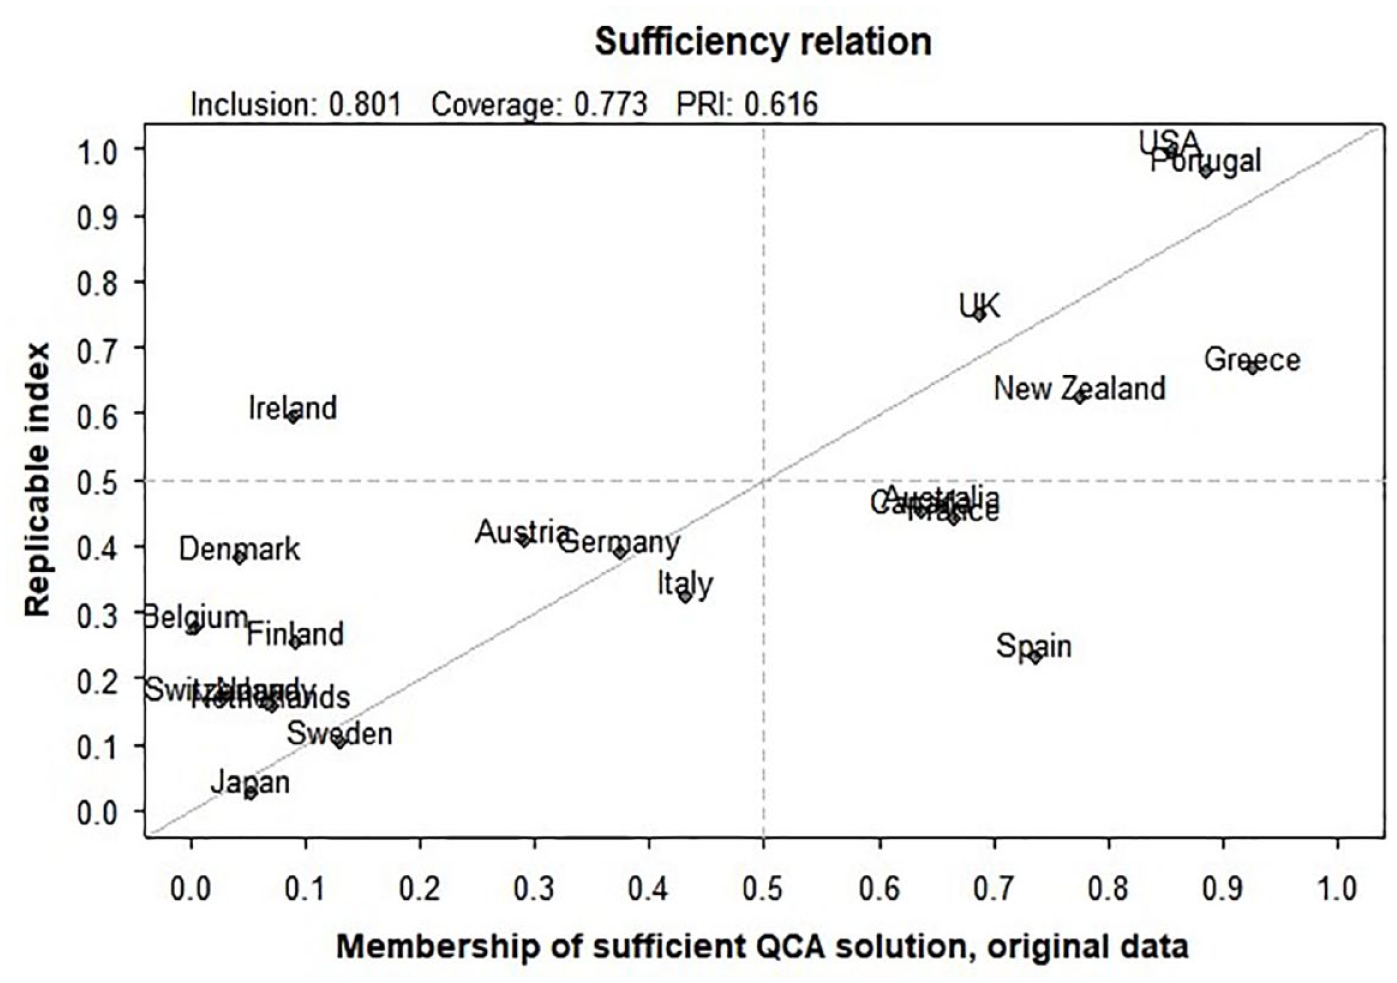
XY chart of sufficient relation for replicable QCA data, original time period.
In QCA, an XY chart gives an indication, along with the diagnostics presented above, of the reliability of the solution. Here, we are concerned with the countries in the top-right quadrant of the diagram—those scoring highly on the solution and with a higher social ill index, with the most typical cases in the set of countries with membership of the solution being those above but closest to the diagonal line. Countries in the bottom-right or top-left quadrant are those which are “deviant” in that they either have a sufficient solution score above 0.5, but less than that for their social ill index score (bottom-right), and so are deviant for consistency, or have an index score higher than 0.5 but a sufficient solution score lower than 0.5, and so are deviant for coverage. The chart also shows that several of the deviant for consistency cases (Australia, Canada, and France, which appear more or less on top of one another just below the horizontal line) falling only just into the set of countries with a lower score on the index. Both Ireland (deviant for coverage) and Spain (deviant for consistency) are some distance from the central diagonal of the diagram, and so are more obviously deviant cases which need further exploration below.
2019 data
Turning to the more recent data, replicating the original analysis using a simple bivariate approach led to a fall in correlation values (r = 0.52), as outlined above and shown in Figure 2.
When using QCA, lower integrative democracy appeared as a necessary condition with consistency of 0.9 and relevance of 0.71, and was the only potential necessary condition which combined high consistency, high relevance, and theoretical fit in line with the existing research and theory outlined above. The truth table was again calculated with a consistency level of 0.8 and a proportional reduction in inconsistency of 0.5, with no “borderline” cases which required additional consideration appearing.
The intermediate sufficient solution, again with inequality as a directional expectation, has two pathways, and is shown in Table 3.
QCA sufficient solution for replicable TSL data, 2019 data.
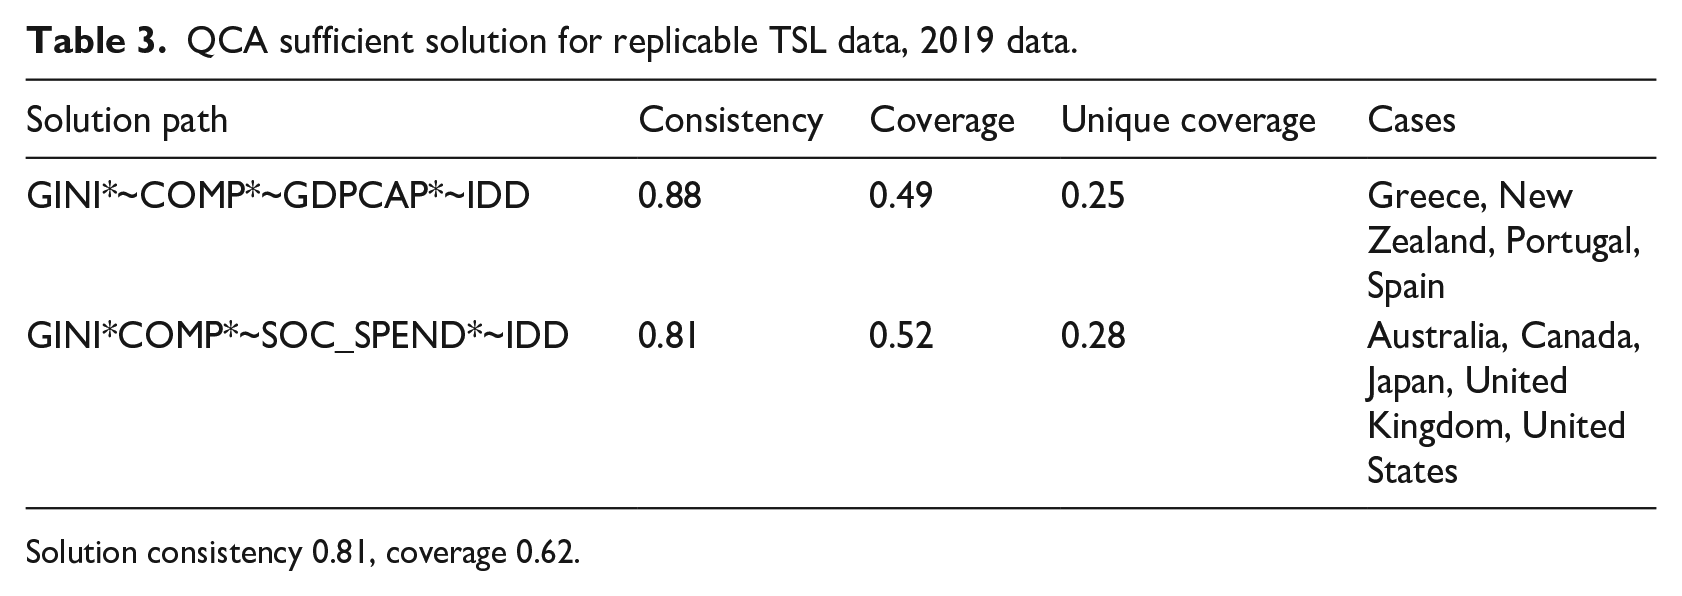
Solution consistency 0.81, coverage 0.62.
As with the sufficient solutions for the original time period, both inequality (GINI) and lower integrative democracy (~IDD) appeared in both the solution pathways for the 2019 data. Other causal factors appear, but not consistently between the pathways, emphasizing the importance of equifinality in the solutions. Both the parsimonious and conservative solutions are identical for this analysis, so directional expectations were not relevant in simplifying the solution further.
The first solution pathway contains Spain as a country deviant for consistency, and the second both Australia and Japan, with these countries appearing in the bottom right quadrant of the XY chart in Figure 4. The chart shows Australia and Spain are somewhat marginal in being deviant as they fall just below the central line, but with Japan appearing to be somewhat of an outlier—a country doing far better on the index than its particular mix of causal factors might suggest it should.
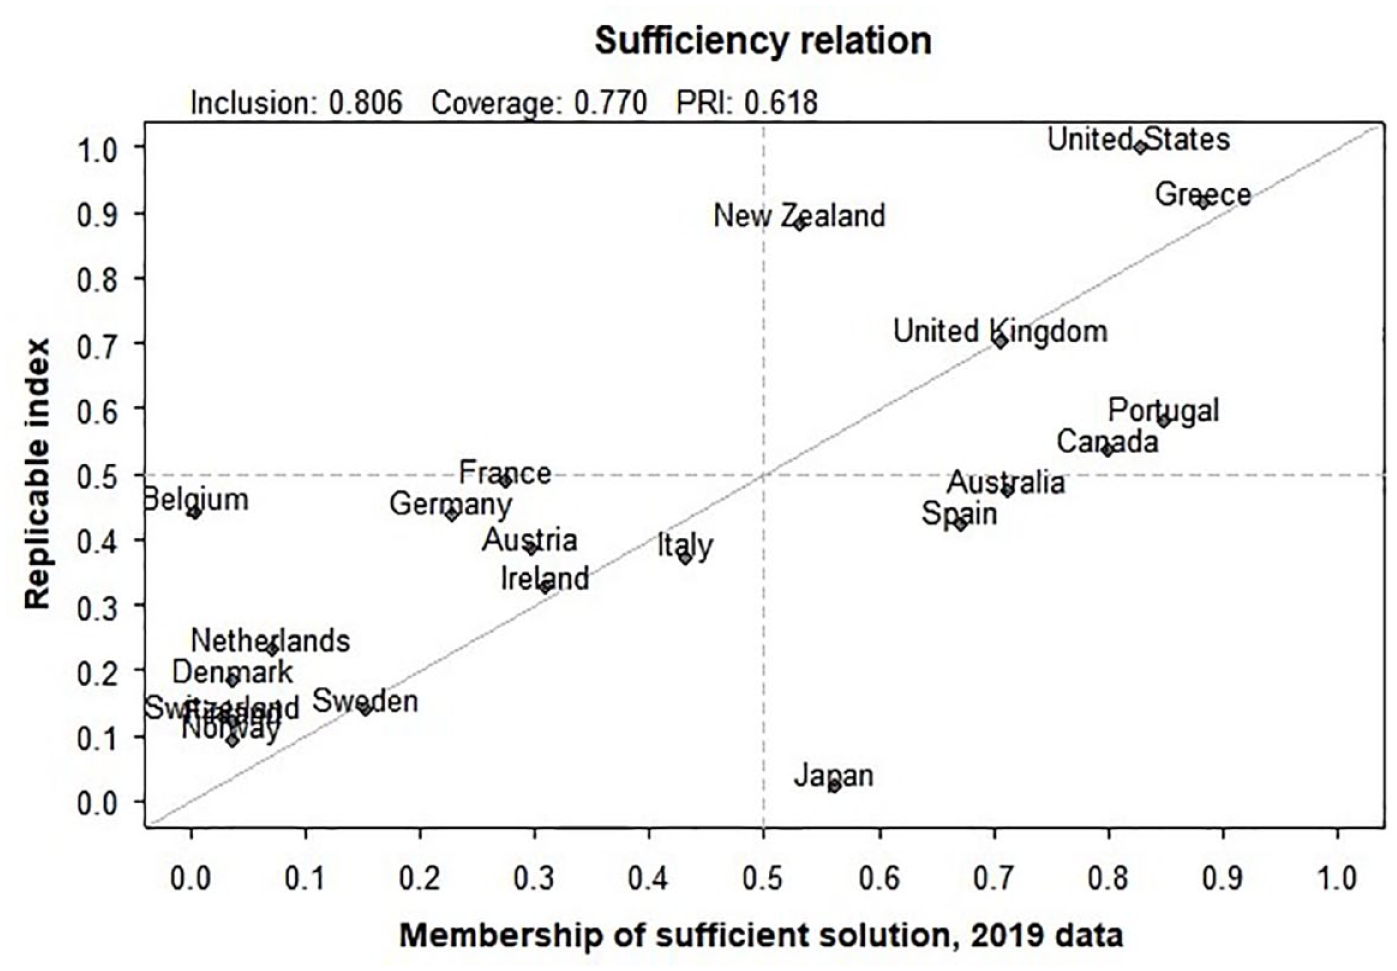
XY chart of QCA sufficient solution, fully replicable 2019 data.
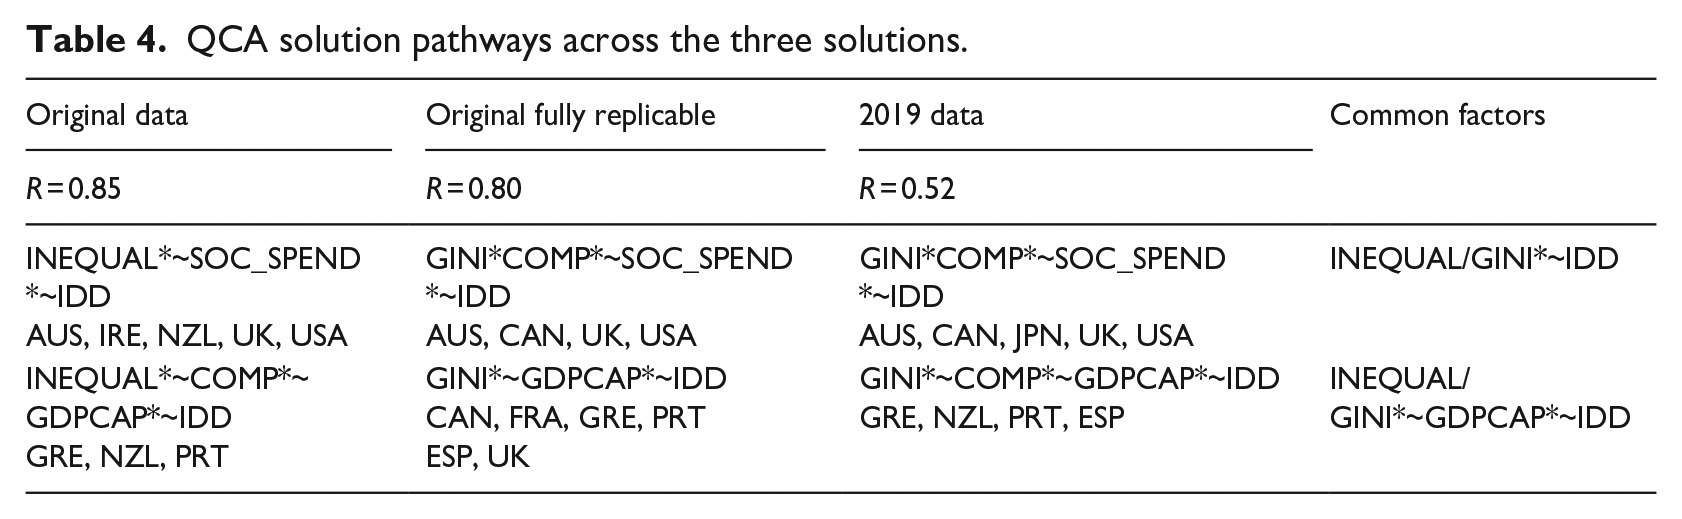
If we compare the solution pathways in each period, we construct the following:
In the above, solution pathways which are similar are placed alongside one another (no more than one solution term different) so that those which are similar are aligned to highlight their commonalties.
We can see in Table 4 that all of the solution pathways have both higher inequality and lower integrative democracy at their root—these terms are common across them all. In the first row of solutions, these are the only two terms consistent in all the solutions. In the second row, lower GDP per capita joins them as a third key causal factor, but with higher inequality and lower integrative democracy remaining consistently present across the solutions.
QCA solution pathways across the three solutions.
Typical case
A key part of QCA is explaining how the causal factors interplay. One road into this is to outline a case which is typical of the analysis presented. Here, the United Kingdom is a strong candidate because of its presence in sufficient solutions in both time periods.
The United Kingdom has a combination of GINI*COMP*~SOC_SPEND*~IDD in the sufficient solution in both time periods. Linking back to the research cited in the literature review above, Wilkinson and Pickett have made a strong case of the link between inequality and social ill, but the United Kingdom’s causal factors go beyond this, deepening (along with other countries with a similar causal recipe) our understanding of the challenges it faces.
In the United Kingdom and similar countries, higher inequality is combined with lower levels of social spending, lower integrative democracy, but higher competitiveness (which might be seen as offsetting at least to some degree some of the other factors). Combining higher inequality with lower social spending suggests a reticence to confront social challenges (as measured by the social ill index) by supporting those most in need. How can such a situation have persisted? One possibility is in the United Kingdom’s “first past the post” electoral system which does not attempt to mediate between political interests in the same way as more proportional systems do, and so tends to result in less attempt to broker society-wide, long-term solutions to social problems (Lijphart, 2012). Even though the United Kingdom has remained globally competitive (as measured by that index), the social harm caused by its other causal factors appears to offset those potential gains.
In all then, we might suggest a model where a lack of wide engagement and proportionality in the electoral system (~IDD) provides a context in which governing occurs which has permitted higher levels of income inequality (GINI) rather than attempting to govern across different interests, and when this is combined with relatively ungenerous levels of social spending (~SOC_SPEND) has led to higher levels of social ill, despite the relatively high measured competitiveness of the United Kingdom. Exploring the exact mechanisms underpinning this is clearly an area for further research, but the diagnosis presented here is broadly similar to that of Hutton (2010), for example.
Deviant cases
A key part of QCA is to explore cases which either have the outcome under consideration, but do not appear in the sufficient solution (cases deviant for coverage), or which do not have the outcome under consideration, but do appear in the sufficient solution (cases deviant for consistency). These cases are often illuminating in highlighting differences between cases, so have the potential to offer additional insights into the patterns in the data. They also demonstrate that the sufficient solutions generated by QCA are not deterministic, but instead work as guides to what countries with the required outcome, and up to the consistently limited prescribed, have in common.
If we take the original data set and the fully reproducible measures, then Australia, Canada and France are just deviant for consistency, with Spain also deviant for consistency to a greater extent. Ireland is deviant for coverage. With the most recent data, there are three cases deviant for consistency (and none for coverage). Australia and Spain appear again, this time alongside Japan.
Cases which are deviant for consistency are effectively doing better than we expect them to—they have a lower score on the index of health and social problems than their mix of causal factors would suggest. What the countries in this category (in both periods) have in common is that they score highly for longer life expectancy. The causes of this are difficult to fully explain, but with Australia and Spain especially (the two countries present in both time periods) often linked to having strong health outcomes due to dietary factors, the possibility of an outdoor lifestyle, and highly performing health systems (Greener, 2021).
Ireland was deviant for coverage in the original time period—and so is doing worse than expected according to the social ill index given its causal factors. It is hard not to read Ireland’s past into this result. Even up to the 1990s, Ireland appeared to be experiencing slow economic growth, low productivity, high levels of unemployment, and high emigration rates (Lee, 1989). Ireland’s receipt of structural and cohesion funding after then appeared to improve things, and formed a foundation for its “Green tiger” role, and for its stronger performance in the 2019 data. This is a fairly unusual combination of factors, although it may offer clues to a route to improvement for other countries facing similar challenges.
Understanding why Japan is a deviant country in the analysis is complicated by its level of 20:20 inequality in the first time period in the article is far lower than its measured Gini inequality. Japan does extraordinarily well on life expectancy, obesity, homicide rates, incarceration rates, teen-birth rates, infant mortality rates, and education (Greener, 2021). As such, perhaps Japan represents a case with far less in common with many of the other countries in the sample than would be ideal—a problem inherent to macrocomparative research is working out the boundaries of comparable cases. As noted above, fairly simple causal models cannot fully capture the complexity of the world, and Japan can appear to be an outlier in that context, both in terms of its more collectivist culture and mode of welfare governance more generally (Dean, 2002).
Discussion
What does the article’s analysis add to our understanding of the relationship between inequality and health and social problems?
Analyzing the data through the QCA lens suggest that, for both the original and later period, lower integrative democracy is a reliable additional causal factor to add to higher inequality. This provides us with an additional level of insight—as well as incorporating the critique offered by Saunders (2010) that Scandinavian countries are exceptional. Perhaps it is the form of democracy which makes those countries special, with lower integrative democracy seeming to be linked to higher scores on the index for the original sample of countries. Countries which aim to bring in a wider range of interest groups into their democratic decision-making appear to have an advantage in confronting social ills.
Adding lower integrative democracy to higher inequality raises some additional questions. Many of the countries in the original sample have both causal factors present, but some do not. In the original sample, four countries are especially interesting—Italy and Switzerland (higher inequality, lower integrative democracy), whereas Ireland and Japan are, at that time, lower integrative democracy but also lower inequality. Three of the four nations fall in the set of countries with lower scores in the index (Ireland being deviant for coverage, as noted above). This would seem to suggest that having higher integrative democracy may mitigate, at least for Italy and Switzerland, against the higher levels of inequality present there. Perhaps the wider opportunities for political engagement offset some of the negative effects of higher inequality. In the 2019 sample, Italy and Switzerland remain with the same pattern, but are now joined by Germany which has moved into the set of higher inequality countries, but remains within the set of countries with lower scores in the index—perhaps adding to the claim that the negative effects of inequality can be at least partially offset by more opportunities to engage in the political life of a country. Perhaps even more interestingly, and as noted above, Ireland has moved to being a country in the set of those with lower scores in the index, with a pattern of lower integrative democracy but also lower inequality—in its case lower levels of political opportunity are perhaps offset by lower levels of inequality.
It seems fair to claim then, that the negative effects of higher levels of inequality or lower opportunities for political involvement can be at least partially offset by either higher integrative democracy or lower inequality, respectively. This is an intriguing prospect and does fit with the idea that the causal mechanism underlying higher scores in the index might be to do with the lack of ability for people to assert their agency in the world, either because of status hierarchies (higher inequality) or lack of opportunity to engage in political life (lower integrative democracy).
That higher inequality and lower integrative democracy go together for so many countries in the sample also suggests that the two might also be causally linked—with either higher inequality discouraging people from asking for greater political involvement, or perhaps more likely that a lack of opportunities for political involvement lead to political systems which reinforce rather than reduce economic and social gradients. This is clearly an area where future research could make a significant additional contribution.
It is also the case that there are a group of countries in the second solution row in Table 4 that also struggle with lower GDP per capita as well as higher income inequality and lower integrative democracy, with Greece being the country appearing in all the columns in that category, and so the most obvious typical case. This pattern of causal factors suggests that countries with lower levels of national income per capita also struggle in circumstances where they have higher inequality and lower integrative democracy.
Finally, it is worth reflecting on replicability in relation to the findings above. TSL attracted such a lot of attention that its authors made its full data set available on the website of the charity the book helped found—the Equality Trust. There the data for the macrocomparative study (and the United States study) in the book can be downloaded. This is a valuable resource and predated the increased emphasis on replicability in social science research. The spreadsheet available there allows the results from the book to be reconstructed without too many issues, and in itself the reconstruction is a valuable exercise as it makes clear the decisions the authors made in relation to their analysis. Extending the data set, however, led to some challenges as many of the original sources do not extend to other countries (which was often why they were excluded from the sample) or with slightly different results being obtained by finding data sets that included the original time period and 2019. These challenges show how difficult it can be replicating and extending even fairly simple data sets, and the importance of storing data, along with the code used for analysis, for other researchers to draw upon.
Conclusion
This article aimed to reproduce the findings of the original Spirit Level study, to consider whether using a different measure of inequality or a fully reproducible version of the index of health and social problems made any difference to the findings, to utilize QCA as an additional method able to take into account a wider range of causal factors than inequality alone, and then extend the analysis into a more recent time period. This led to a number of findings.
The relationship between inequality and the index does hold for the original sample of countries across different inequality measures and with different data sources being used in the construction of the index. Wilkinson and Pickett were right to draw the conclusions they did, for the countries in their sample, at the time they did their research. For those countries, at that time, the relationship between inequality and the index stands. However, exploring their data through the lens of QCA suggests there is also greater causal complexity present than is apparent in the bivariate correlation approach. Neither the correlations of the original studies nor the sufficient solutions presented in the QCA work demonstrate causation in themselves. However, that both TSL and the work presented here include higher inequality as a key term in the solutions adds weight to the importance of considering this factor as a driver of higher levels of social harm. However, the addition of lower integrative democracy into the solution terms for both the original time period and for 2019 makes an additional and credible contribution to understanding the factors that lead to higher levels of social ill.
Adding integrative democracy to our understanding of what leads to higher scores on the index therefore provides an extra dimension to the data that fits well with theories that stress the importance of agency and autonomy in our lives (including “The Inner Level”), suggesting that this, when reduced by status hierarchies or lack of opportunities to engage in political participation, can lead to greater health and social problems. This relationship between inequality and democracy also asks questions about the links between the way politics functions within a wider social context. Could it be that less integrated democracies, because they are less likely to reflect the range of interests in their society, are more prone to creating higher levels of inequality, and that this in turn, is linked to greater health and social problems? The results in this article do seem to point in that direction, and this is clearly an area for further research. Both the particular forms of democracy present in different countries and the levels of inequality relative to other countries are difficult to change. Among the nations included in the sample, New Zealand has arguably had the most significant change in voting system, voting to move toward a more integrative model after 1993 and ratifying that decision in 2011. Such dramatic changes, however, are rare, and it is hard to identify their effects.
If adding democracy to our range of causal factors proved to be successful, then the other factors (GDP per capita, social expenditure, and our WEF measure of competitiveness) were less consistently part of the solutions generated in the article. GDP per capita does appear consistently in one row of the solutions in Table 4, and so can make the strongest claim for being important, but does not achieve the same generalized importance as the other two factors, and the insight from that solution row appears to suggest that countries with a lower level of national income per capita, but which also have higher inequality and lower integrative democracy, also consistently face higher levels of social problems. This partially confirms the claim that Wilkinson and Pickett made in their original book that GDP per capita was not a significant driver of social harm (at least for developing countries), but is clearly an area where further research is needed to differentiate between the developed countries for which this is consistent factor, and for those where this does not appear to be the case.
The increased insights offered from the use of QCA illustrate what could have been hidden causal complexity—but at a price. Although the XY charts produced by the solutions are still interpretable, they are not as straightforward to understand as the scatter charts from the original Spirit Level. But perhaps the world is more complex than simple bivariate graphs allow. Further work might explore a small sample of countries in the study, digging deeper into the relationship between integrative democracy, inequality, and social ill. That is clearly a fruitful area for further research.
Finally, in terms of replicability and its role in social science, the article shows that reproducing even a relatively simple data set and its results can be surprisingly hard, even when the original book was relatively recent. It is testament to the commitment of Wilkinson and Pickett that they made their original data available to others, but some of the data sets linked to the data are far harder to access in their original form, and if we want to compare periods, this rules out even more of the data on which the original analysis was based.
Looking forward, it is crucial that both data and the code used to analyze data are made available for others to examine and make use of, as well as to make clear the assumptions that underlay analysis. Presenting data in this way creates the potential for debate around interpretation as we have seen with the original TSL, but also far greater transparency as to how our results were obtained.
Supplemental Material
sj-rmd-1-cos-10.1177_00207152241245620 – Supplemental material for Inequality and social harm: Revisiting the Spirit Level debate by reproducing and updating it, as well as reanalysing the data with qualitative comparative analysis
Supplemental material, sj-rmd-1-cos-10.1177_00207152241245620 for Inequality and social harm: Revisiting the Spirit Level debate by reproducing and updating it, as well as reanalysing the data with qualitative comparative analysis by Ian Greener in International Journal of Comparative Sociology
Footnotes
References
Supplementary Material
Please find the following supplemental material available below.
For Open Access articles published under a Creative Commons License, all supplemental material carries the same license as the article it is associated with.
For non-Open Access articles published, all supplemental material carries a non-exclusive license, and permission requests for re-use of supplemental material or any part of supplemental material shall be sent directly to the copyright owner as specified in the copyright notice associated with the article.