
Abstract
The article investigates normative preferences for environmental protection over economic growth registered in 74 countries—based on the European Values Study and the World Value Survey (2017–2022). We employ multi-level logistic regression to demonstrate that Gross Domestic Product per capita moderates the effects of political orientation and household income, both of which tend to be stronger in wealthier countries. Only in wealthy societies are left-leaning and affluent individuals far more likely to prefer environmental protection. Not accounting for moderation leads to underestimating the propensity for political polarization over environmental questions. Hence, our study suggests that large-scale implementation of growth-impeding or wealth-sacrificing environmental policies could face insurmountable public opposition in wealthy societies. Furthermore, failing to account for the moderation by GDP per capita in cross-national studies of environmental attitudes may constitute a confounding factor by aggregating wealthier countries, where the effects of political orientation and household income prove substantial, with the poorer ones, where they appear negligible.
Keywords
Introduction
Achieving a high and stable rate of economic growth measured by Gross Domestic Product (GDP) has long remained the overriding goal of mainstream economic policy (Van Vuuren et al., 2017), contributing to the extensive exploitation and degradation of the natural environment and its resources (Resch et al., 2008; Spash, 2011). In the 1970s, the growth-driven approach first faced a concerted challenge with the publication of The Limits to Growth report (Meadows et al., 1972), which initiated a wide-ranging discussion on the interdependence between the human and earth systems. Following vigorous debates on the ecological consequences of economic activity, heterodox approaches to economic policy asserted themselves, including the ecological economics paradigm (Costanza, 1989). Other novel approaches to economic growth also emerged, some of which question the singular emphasis on growth, for example, steady-state economy (Daly, 1974) or circular economy (Bauwens, 2021), while others seem to be doing away with growth itself, for example, agrowth (Van den Bergh, 2011) or degrowth (Kallis, 2018). In the political realm, the emergence of social movements and political parties focused on environmental protection issues has also generated a sustained challenge to the received growth-centered consensus (Kaelberer, 1993; Tranter and Western, 2009). The civilizational challenge posed by anthropogenic climate change has further increased the intensity and immediacy of tension between proponents of economic growth and environmental protection, turning the juxtaposition into one of the pivotal issues for contemporary ideological struggles worldwide (Paglia, 2018).
The growth-versus-environment dilemma generates socio-political tension within and between countries (Gugushvili, 2021; McCright et al., 2016). The international axis of tensions between the developed and developing countries focuses on the demands of the latter to enjoy exemptions from environmental and climate policies and to receive reparations for suffering the consequences of pollution and emissions historically accumulated by the already developed countries (Grasso and Vladimirova, 2020; Okereke and Coventry, 2016). Even if agreeable to sharing a greater burden in principle, governments of developed economies face internal political tensions over the costs of curtailing economic growth. In the current climate of political polarization, opposition to climate policy and large-scale environmental regulations came to constitute the rallying cry of the populist right-wing (Huber, 2020; Lockwood, 2018). Conversely, the most vocal expressions of preference for the environment over growth typically proliferate on the left-wing end of the political spectrum (Klein, 2015). As attitudes toward climate change and environmental protection became vital issues of political contention, the state of public opinion has grown in importance relative to expert opinion. The politicization of the growth-versus-environment dilemma necessitates paying closer attention to global public opinion trends due to their sway on country-level policymakers (Burstein, 2003).
The article has a specific empirical focus on cross-national differences in public opinion regarding the growth-versus-environment dilemma, an issue with broad policy implications for environmental protection (Carrus et al., 2018; McCright et al., 2014; Smith and Hempel, 2022). By exploring the intersection of policy decisions (Collins et al., 2019), public attitudes, and the delicate balance between economic growth and environmental preservation, our study examines how public opinion may influence policy orientations in addressing environmental challenges. Environmental policies affect, among other things, “the setting and enforcement of pollution abatement requirements, as well as the reform of prices and tariffs” (OECD, 2007: 95). Drawing upon European Values Study (EVS) and World Value Survey (WVS) surveys, the article examines the diverse characteristics and concerns of the general public. It further explores the role of public engagement in shaping policy orientations in countries with different GDPs per capita. Considering the complex dynamics between environmental policy orientations and public opinion, this article provides valuable insights for policymakers, researchers, and practitioners seeking to align environmental protection policies with public preferences and aspirations while navigating the growth-versus-environment dilemma.
Our study investigates the growth-versus-environment dilemma from the vantage point of cross-national opinion surveys. Based on the combined datasets of EVS and WVS (2017–2022), we investigate the normative choices registered in 74 countries. The analysis accounts for the country-level effect of GDP per capita while investigating the association of political orientation and household income with the likelihood of prioritizing environmental protection over economic growth. Employing multi-level logistic regression, we probe for the effects of the two individual-level characteristics, their interaction, as well as the moderating effects of the country-level contextual variable. Our analysis corroborates the expectations that espousing a left-wing political orientation and living in higher income households increase the propensity to prioritize environmental protection over economic growth. Besides, we also confirm that the aggregate preferences for environmental protection at the country-level increase with GDP per capita. However, moving beyond the patterns already identified in existing literature, our analysis demonstrates that those effects are not uniform across countries with different levels of economic development. We identify a strong moderating influence of GDP per capita on the effects of political orientation and of household income, both of which tend to be stronger in wealthier countries.
Research problem
Most studies addressing the problem of attitudes toward increasing environmental protection at the cost of economic growth are based on data from the late-20th century (e.g. Lengfeld and Gerhards, 2008) or focus on only one country (e.g. Drews and Van den Bergh, 2016). A boost to the cross-national approaches resulted from the rotating module “Attitudes to climate change” in round 8 of the European Social Survey (e.g. Czarnek et al., 2021; Fritz and Koch, 2019). The WVS (and EVS) datasets constitute another essential empirical background for comparative studies (Roos, 2018). In a recent EVS-based study of factors influencing attitudes regarding economic growth and environmental protection, Gugushvili (2021) demonstrated the existence of substantial social divides in opinions regarding the growth versus environment dilemma: those in favor of sacrificing growth tend to be post-materialist, left-leaning, better-off, and with higher levels of educational attainment, whereas materialists, right-wing individuals, and economically disadvantaged groups prioritize the economy over ecological concerns. Our analysis broadens the geographic coverage by employing the joint EVS–WVS dataset. Conversely, it narrows the analytical scope, focusing on the individual-level effects of political orientation and household income nested within the country-level effects resulting from the differences in GDP per capita.
Among country-level factors, GDP per capita is considered one of the most critical factors influencing environmental attitudes. In line with the prosperity thesis that high environmental quality is a “luxury” good, an increase in wealth in the society causes the trade-off between economic growth and environmental protection to disappear, as the latter becomes more affordable over time (e.g. Ballew et al., 2020; Brody et al., 2007; Combes et al., 2018; Gugushvili, 2021; Kvaløy et al., 2012; Malka et al., 2009; Marquart-Pyatt, 2012; McCright, 2010; Mohd Suki, 2013; VanHeuvelen and Summers, 2019; Welsch and Kühling, 2017). Reliance on GDP per capita suffers from well-known limitations (Easterlin, 1974; Sen, 1997; Stiglitz et al., 2009); however, the measure remains in widespread use due to its accessibility and ease of comparison between countries and regions (Azam et al., 2021; Franzen and Vogl, 2013; Heizmann and Huth, 2021; Murshed et al., 2021). Household income features less frequently in empirical studies on environmental attitudes, and a consensus has yet to emerge regarding its influence. Analyzing WVS data, Kenny (2020) found no evidence for the relationship between income and the prioritization of environmental protection. However, other EVS- and WVS-based studies found income to be consistently positively related to environmental concerns and pro-environmental attitudes (Combes et al., 2018; Fairbrother, 2013).
Self-placement on a Left–Right scale is an established minimalist proxy for ideological orientation in survey research (Clulow et al., 2021; Rapeli, 2022). The approach remains in common use despite the questionable interpersonal comparability of respondent scores (Bauer et al., 2017), which becomes hugely magnified in cross-national research settings due to the country-specific idiosyncrasies of culture and political heritage (Zuell and Scholz, 2019). Notwithstanding its obvious validity impediments, the Left–Right self-placement has played an essential role in the study of environmental attitudes, with the consensus being that a left-leaning ideological position increases support for pro-environmental attitudes when compared with a right-leaning position (Jones and Dunlap, 1992; McCright et al., 2014, 2016; Neumayer, 2004; Samdahl and Robertson, 1989). However, the widespread employment of ideological self-placement in comparative studies should not overshadow its inherent limitations. The interpretations of the Left–Right juxtaposition likely exhibit substantial cross-country differences; for instance, Piurko et al. (2011) provide strong evidence for such a divergence in understanding between Western and Eastern Europe. Even within countries, the exact meaning of this scale may seem ambiguous to respondents (Svallfors, 2012).
Gender, age, and education status commonly feature in empirical studies of public attitudes toward climate change and environmental protection (Diekmann and Franzen, 1999; Franzen and Meyer, 2010). They tend to be employed as control variables but play explanatory roles in some studies. Regarding gender, a higher focus on environmental issues and willingness to take action to protect the environment is usually attested among women (Brody et al., 2007; Leiserowitz, 2006; Malka et al., 2009; McCright, 2010; Xiao and McCright, 2013). When it comes to age and level of education, younger people and those with higher levels of education are typically found to be more supportive of pro-environmental activities, including the acceptance of lower living standards in return for environmental protection (Dunlap et al., 2000; Gelissen, 2007; Whitmarsh, 2011).
Figure 1 presents the conceptual model reflecting our expectations regarding the influence of individual-level explanatory variables and their interactions with GDP per capita on the propensity to prioritize protecting the environment over economic growth. At the outset, we assess the direct effect (solid curves; hypotheses 1 and 2) of the Left–Right scale and household income on the dependent variable and the level of GDP per capita on country-level aggregate fractions of declarative preference for environmental protection (H3). The main thrust of our analysis is whether GDP per capita has a moderating effect (dashed lines; research questions 1, 2, and 3) on the direction and strength of the relationship between explanatory variables and the dichotomous dependent outcome. We control the assumed direct and moderating effects by including the gender, age, and educational level of respondents, which we hypothesized do not exclude the direct and moderating effects presented in Figure 1.
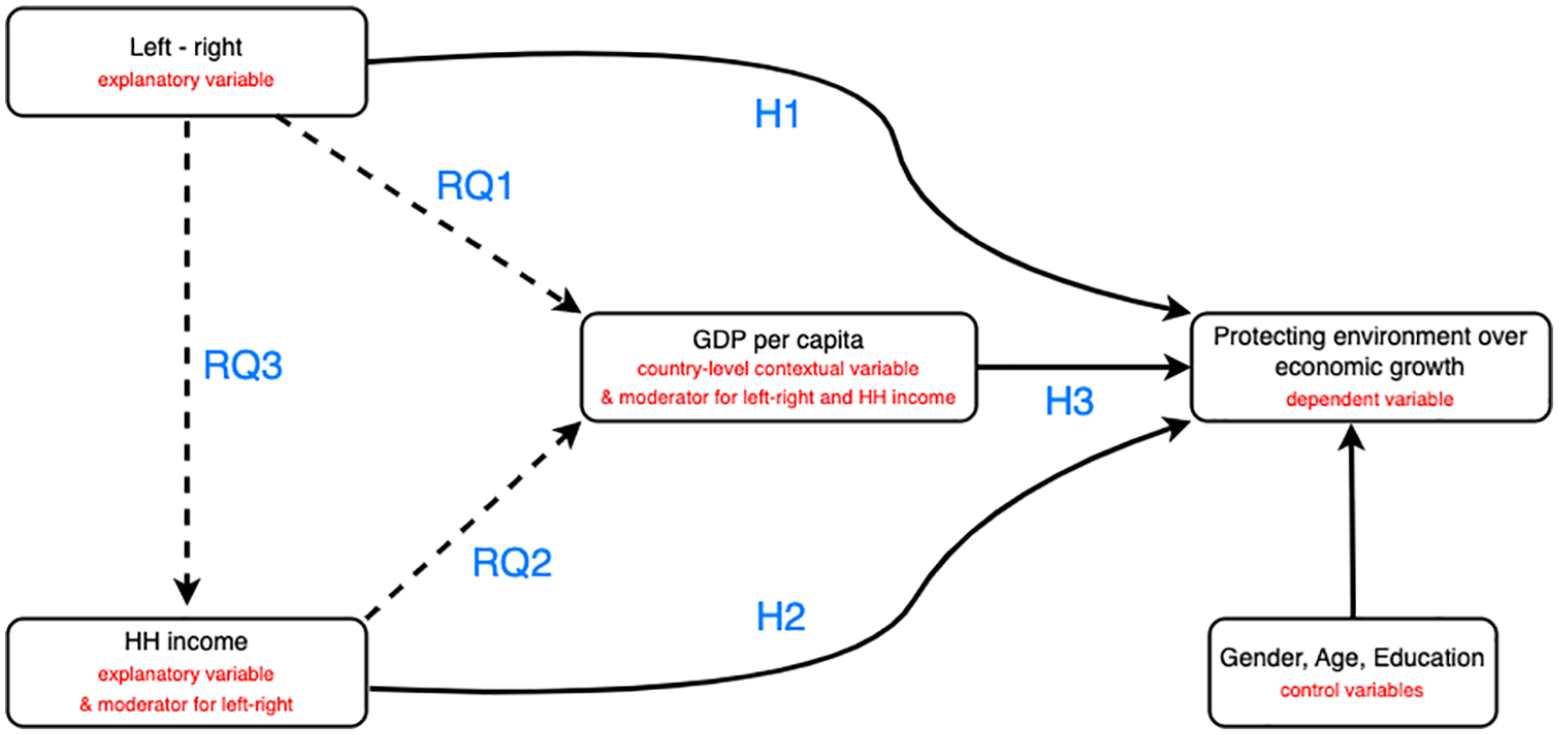
The conceptual model.
We hypothesized the effect of individual-level explanatory and country-level contextual variables on the dependent variable as follows:
H1. Right-wing political orientation decreases the likelihood of prioritizing environmental protection over economic growth.
H2. Individuals from higher income households are more likely to prioritize environmental protection over economic growth.
H3. Country-level aggregate preference for environmental protection over economic growth increases in accordance with the GDP per capita levels.
In turn, research questions ask whether the country-level GDP per capita exert a moderating effect on the following:
RQ1. The relationship postulated by H1.
RQ2. The relationship postulated by H2.
RQ3. The interaction between the effects of right-wing political orientation and net household income on the likelihood of prioritizing environmental protection over economic growth.
Data and methods
Our analyses rely on data from two large-scale cross-country comparative surveys: EVS and WVS. We used the 2017 edition of both projects, namely the fifth wave of EVS and the seventh wave of WVS, which were the first carried out jointly on almost the same questionnaire. Most national surveys were administered from 2017 to early 2021. However, a few were delayed due to COVID-19 and completed data collection in 2022, using face-to-face interviews as the data collection mode for most countries and with all national surveys employing random surveys probability samples of the adult population 17 years and above. The EVS and WVS covered 89 countries from six continents, with 10 simultaneously included in both projects; 36 countries featured in the EVS dataset ver. 5.0.0 (EVS, 2022), while 64 were in the WVS dataset ver. 5.0.0 (Haerpfer et al., 2022).
Measures
Dependent variable
The dependent variable is based on the question requesting respondents to choose between two statements: (1) “protecting the environment should be given priority, even if it causes slower economic growth and some loss of jobs” versus (2) “economic growth and creating jobs should be the top priority, even if the environment suffers to some extent.” In the WVS surveys, the choice of “other option” was also possible, yet, only recorded when explicitly volunteered; additionally, interviewers could also indicate one of the two hidden item-nonresponse options (“no answer” and “do not know”). However, given that the “other option” was combined in the available datasets with the two item-nonresponse options in the EVS counterpart, we consistently treated this response as “missing.”
Individual-level explanatory variables
Our primary individual-level explanatory variables are (1) Left–Right positioning and (2) respondents’ household income. The political orientation was measured by asking respondents to position themselves alongside a 10-point scale ranging from (1)—left-wing to (10)—right-wing. In turn, household income was measured by providing respondents with a list of 10 income groups corresponding to the deciles of the actual distribution of household income in each country (expressed in national currency) and asking respondents to indicate to which decile groups their household belongs after counting for all wages, salaries, pensions, and other revenues from each household member. Before including both variables in a multi-level regression analysis, we standardized the original scales by calculating z-scores across all countries and respondents.
Individual-level control variables
We also controlled for respondent Gender, Age, and Level of education. Given that the EVS data groups together all respondents aged 82 years and above regardless of their actual age, the same data transformation was applied to the WVS. Education was measured using the International Standard Classification of Education (UNESCO, 2012; see Schneider, 2013) and recoded into five categories: Primary, incomplete secondary, ISCED 0–1 (a reference category); lower secondary, ISCED 2; upper secondary, ISCED 3; and post-secondary, tertiary, ISCED 4–8.
Country-level contextual variable
To assess the average percentage of respondents’ cross-country variability prioritizing protecting the environment over economic growth, we chose the Word Bank Open Data (https://databank.worldbank.org/), which provides the country-level GDP per capita (data in current US$). As the country values of the GDP per capita are highly asymmetric (with most low-GDP countries), we applied a log10 scale transformation of its original values before including it in regression analyses.
Methods
We estimated a set of two-level logistic regression models to recognize the hierarchical structure of the data from the EVS and WVS—with respondents (level 1) nested within countries (level 2). We excluded 15 national surveys, leaving 74 of 89 countries in the regression analyses. We do not analyze data for Portugal, which lacked the question on household income, as well as for China, Egypt, Iran, Iraq, Jordan, Kazakhstan, Kyrgyzstan, Lebanon, Myanmar (Burma), Pakistan, and Vietnam (the Left–Right variable was not available). We also excluded Taiwan, as the country is not listed in the World Bank data, and Hong Kong and Macau, territories constituting special administrative regions of the People’s Republic of China.
In all analyses, we applied weighting factors as provided in the EVS and WVS data. We used a complete case analysis with listwise deletion of all cases with missing values in any variable (all variables reached a maximum of 15.9% of missing responses for the Left–Right scale). In total, we excluded 36,122 of 131,971 cases with missing values in any of the variables.
Our dependent variable (ENVij) has two outcomes such that
We start with the Null Model (which excludes all explanatory variables from the regression), allowing us to estimate the variance component attributed to the country level (i.e. Intraclass Correlation Coefficient, hereafter ICC). Note that the level-1 residual variance in the logistic regression is scaled to 1.0 and could not be tested for statistical significance (Snijders and Bosker, 2011). Nevertheless, the variance of the logistic distribution with a scale factor of 1.0 is approximately equal to
We build our analytical models step-by-step. Model 1 assumes random intercepts at a country level and fixed beta coefficients for two explanatory variables within countries. Model 2 adds log10 of the GDP per capita as a country-level contextual variable. Model 3 adds interactions between two explanatory variables and country-contextual GDP per capita. Finally, model 4 adds control variables to model 3, that is, gender, log10 of the age and educational level. We also ran multi-level regression (model 5) with random beta coefficients for two explanatory variables to test whether cross-country differentiation in the association of regression coefficient impacts the marginal effects. This model demonstrates that marginal effects are similar to those obtained in model with fixed slope restrictions; we present the results of model 5 in Supplementary Online Materials.
Our assumed (final) multi-level mixed model for respondent
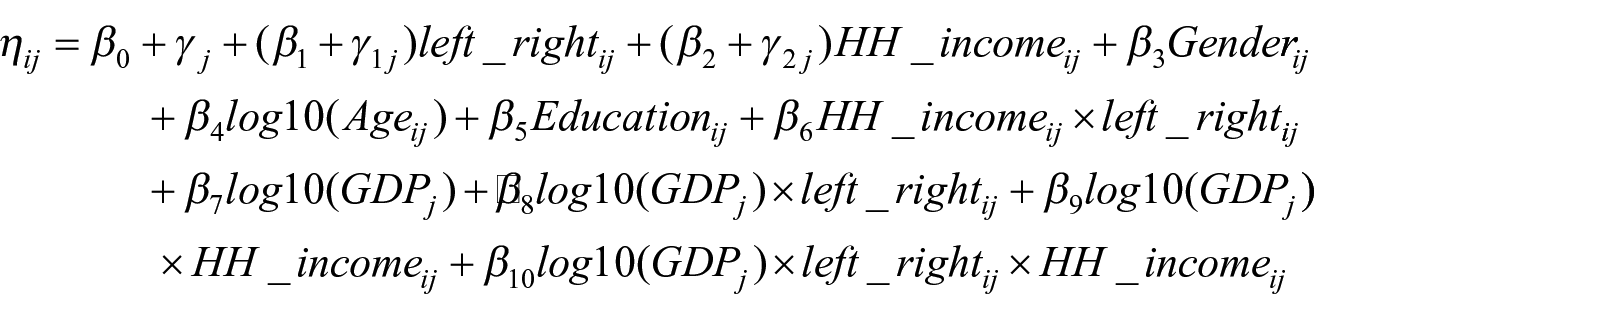
where
All analyses were conducted using the R software (R Core Team, 2021). We implemented the following packages for data manipulation, regression analyses and visualization of results: flextable (Gohel, 2021), ggplot2 (Wickham, 2016), haven (Wickham and Miller, 2022), labeled (Larmarange, 2021), lme4 (Bates et al., 2015), sjPlot (Lüdecke, 2021), and tidyverse (Wickham et al., 2019).
Results
In order to provide a descriptive background for the analysis, a brief glance at the cross-national aggregates of the dependent variable seems in order. The country-level aggregates for the dependent variable are visualized in Figure 2, which also demonstrates the geographical coverage of our data. Notably, the countries of sub-Saharan Africa feature only sparsely, which constitutes a common problem in global survey coverage (Dubrow and Tomescu-Dubrow, 2016). Furthermore, the absence of data on Left–Right orientation severely restricted the representation of Asian countries in the analysis.
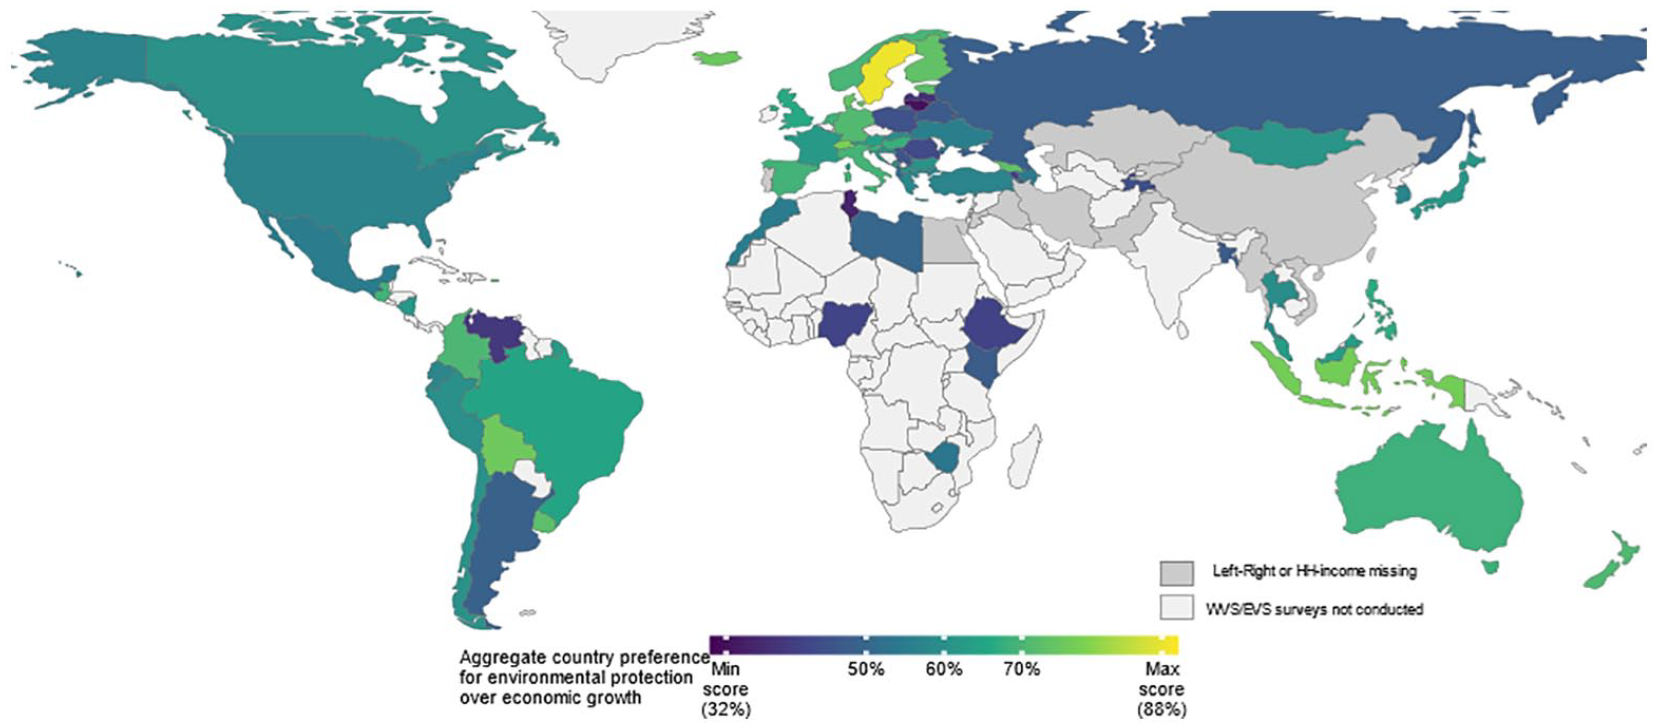
Fractions of respondents preferring environmental protection over economic growth.
In most countries covered by our analysis, an overall preference exists for environmental protection over economic growth. The country-level aggregates represent the fraction of respondents preferring environmental protection over economic growth, with the actual occurring empirical minimum in Lithuania (35.1%), followed by Egypt and Tunisia (both 36.6%), and the maximum score observed in Sweden (88.7%). For details, see Table A1 in the Online Supplemental Material Appendix.
Table 1 presents the results of the multi-level logistic regression modeling, with regression coefficients transformed by the natural exponential function into standardized odds that respondents prioritize environmental protection over economic growth. We used the results of subsequent models to test hypotheses 1–3 and answer research questions 1–3.
Results of multi-level logistic regressions: standardized odds ratio coefficients and their standard errors in parentheses.
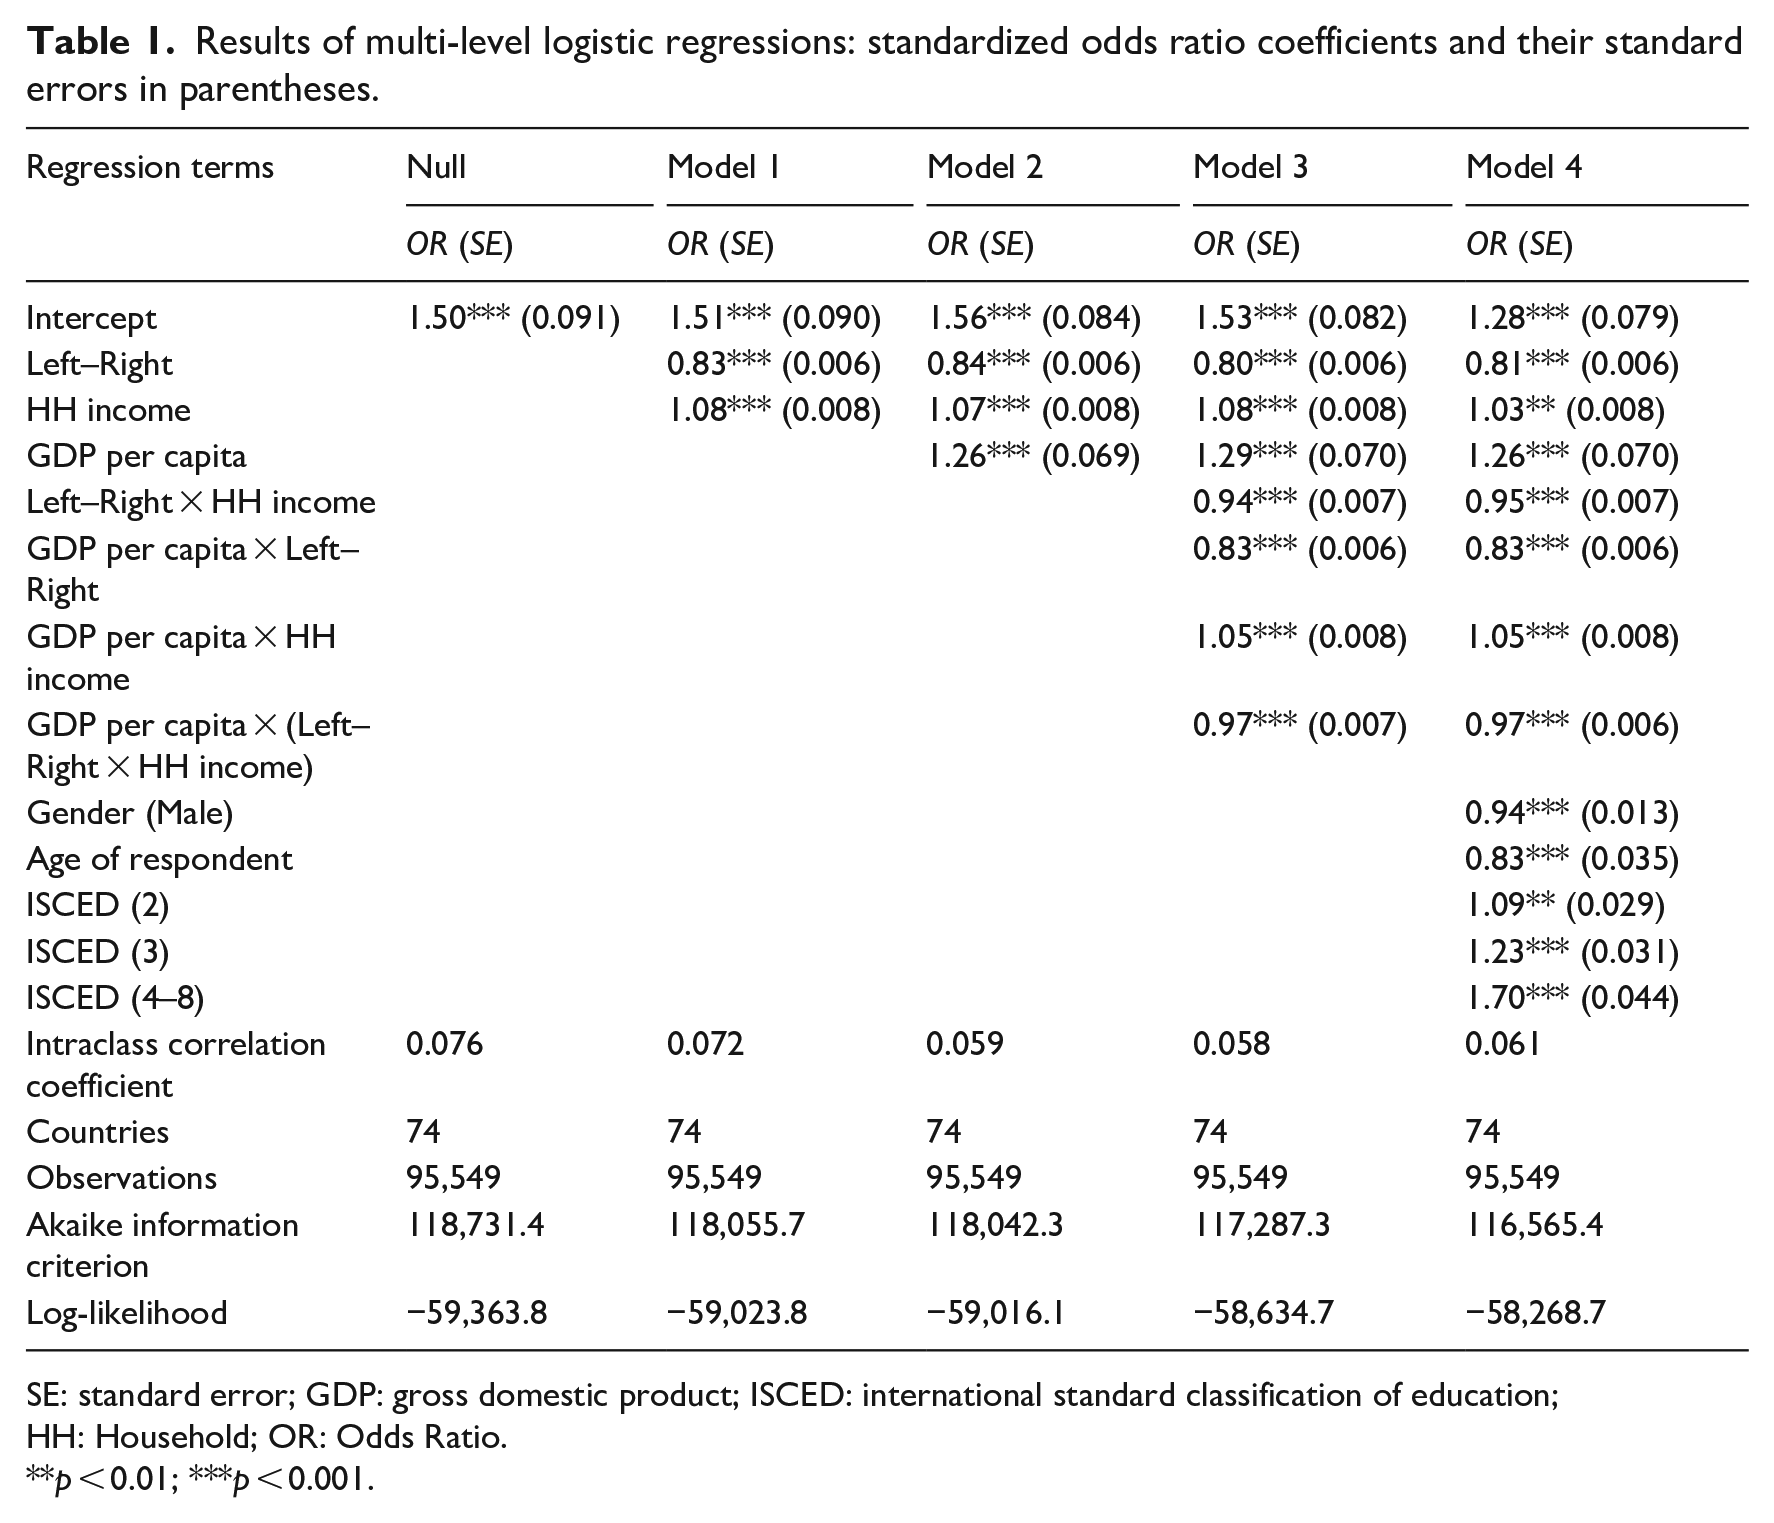
SE: standard error; GDP: gross domestic product; ISCED: international standard classification of education; HH: Household; OR: Odds Ratio.
p < 0.01; ***p < 0.001.
Our analysis incorporated regression terms stepwise, resulting in five models of increasing complexity. The Null Model includes only countries as nesting features. Model 1 adds two individual-level variables: Left–Right orientation and household income. Model 2 further incorporates GDP per capita as the country-level contextual variable. In Model 3, the main focus of our analysis, cross-level interaction terms are added. Finally, Model 4 ascertains that including socio-demographic control variables does not decrease the effects apparent in Model 3. Starting with the Null Model, the Intraclass Correlation Coefficient (ICC) equal to 0.076 means that above 7.5% of the total variance in the outcome variable can be attributed to countries. As the standardized OR for the Intercept term equals 1.50, approximately two-thirds of all respondents prioritize environmental protection over economic growth. The inclusion of GDP per capita as a country-level contextual variable, in Model 2, reduces the ICC by 22% to a value equal to 0.059.
Our analysis confirms that the right-wing political orientation decreases the likelihood of prioritizing environmental protection over economic growth (H1). We also demonstrate that individuals from higher income households are more likely to prioritize environmental protection over economic growth (H2). Finally, we also show that country-level aggregate preference for environmental protection over economic growth increases in accordance with the GDP per capita levels (H3). Thus, our results corroborate expectations grounded in the existing literature. However, the novelty of our approach lies in the pursuit of Research Questions (1–3) regarding the moderating effect of the GDP per capita on the influence of political orientation and household income.
To facilitate the interpretation of the moderating effects, we used the sjPlot package (Lüdecke, 2021) for plotting the marginal effects of interaction terms in Model 3. Figure 3 visualizes the influence of Left–Right political orientation (left panel) and household income (right panel) on the predicted probability of prioritizing environmental protection over economic growth. In each panel, model predictions are visualized for three levels of GDP per capita: (1) the orange curves represent the association predicted for a country 1.5 standard deviations below the mean of all countries included in the analysis, (2) the green curves for a country at the mean, and (3) the blue for 1.5 standard deviations above. The shading shows a 95% confidence interval (CI) for the model predictions.
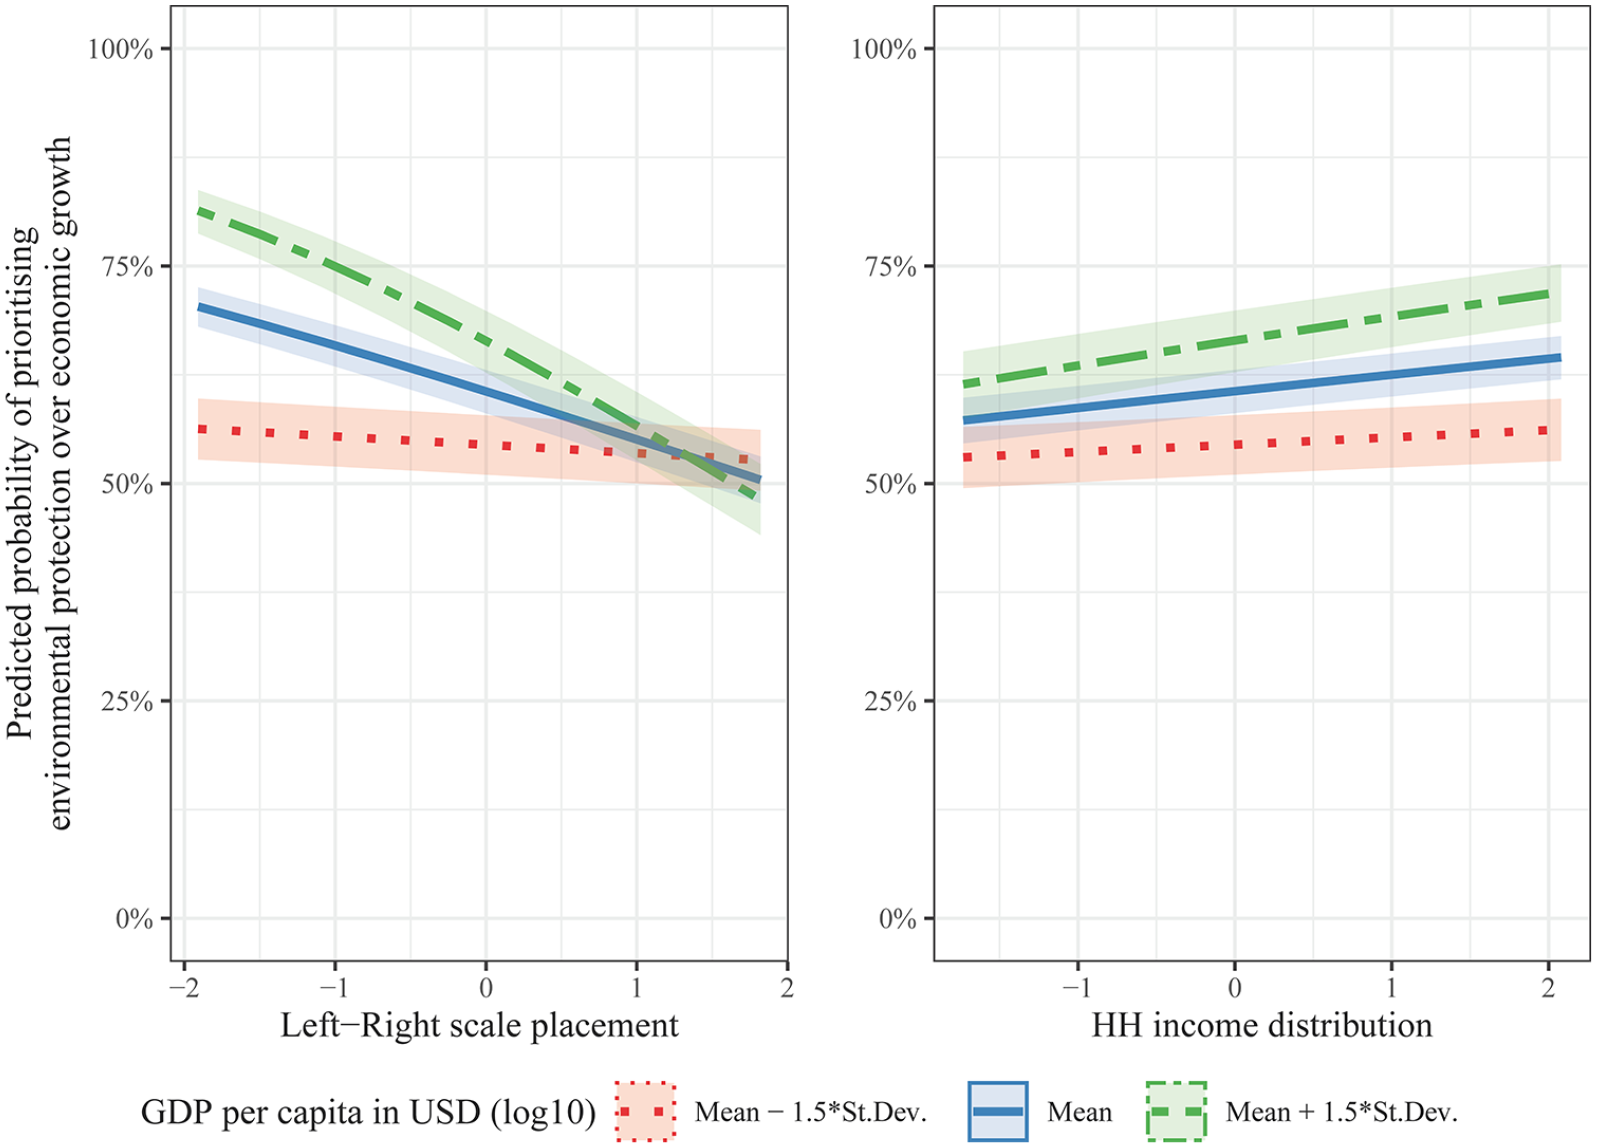
Moderating effect of GDP per capita on the relationship between level-1 explanatory variables and the preference for environmental protection over economic growth.
As visualized in the left panel, GDP exerts a strong moderating influence on the effect of political orientation (RQ1) with a weaker influence on the effect of household income (RQ2). In countries with low GDP per capita, the effect of Left–Right political orientation is negligible; conversely the effect is strong in high-GDP countries. Therefore, while the relationship postulated in H1 holds for all countries in aggregate, the association does not seem uniform across different levels of economic development. Regarding household income, the moderating effects also prove statistically significant but not comparable in strength.
The model predictions visualized in Figure 4 go a step further, as they present the moderating effect of GDP per capita on the interaction between political orientation and household income. Each of the three panels depicts an association between the Left–Right scale (x-axis) and the predicted probability of prioritizing environmental protection over economic growth (y-axis) for three levels of GDP per capita: low (left panel), average (middle panel), and high (right panel). The colors of prediction curves represent three levels of household income: (1) orange for households 1.5 standard deviations below the aggregate mean, (2) green for those at the mean, and (3) blue for 1.5 standard deviations above the mean.
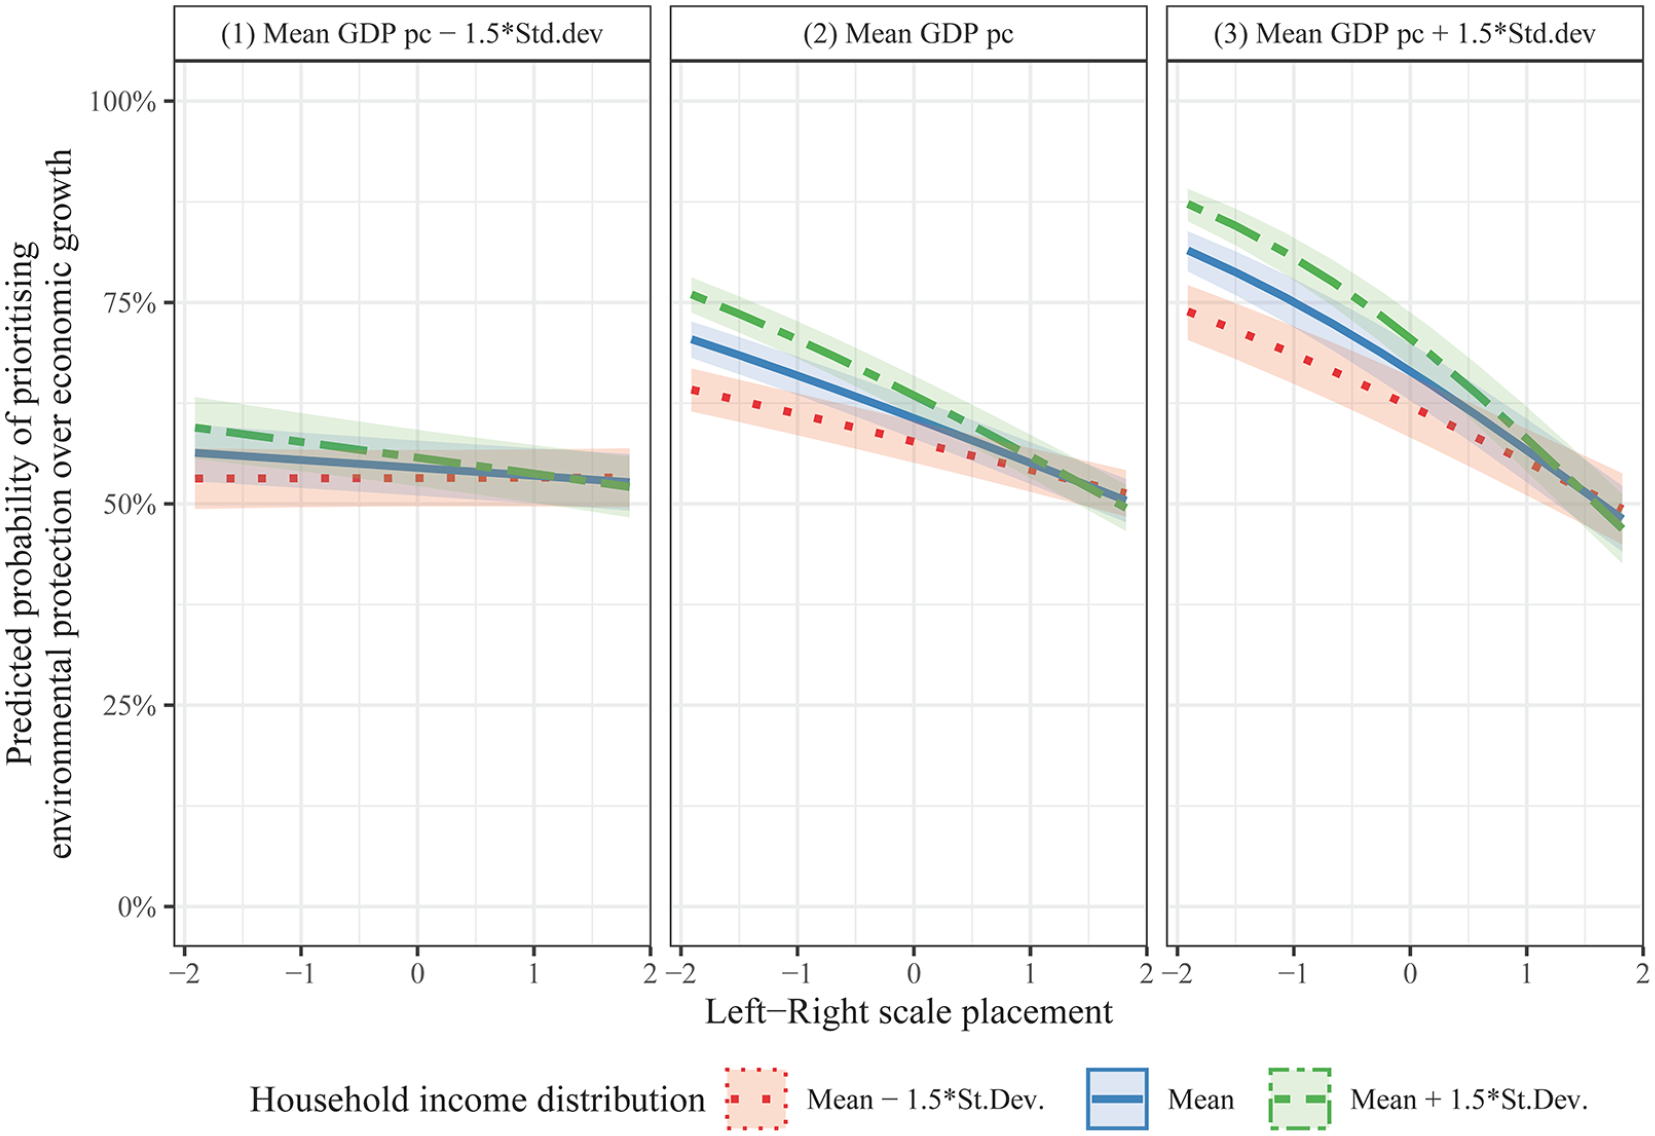
Moderating effect of GDP per capita on the interaction between the effects of level-1 explanatory variables on the likelihood of prioritizing environmental protection over economic growth.
Model 3 points to a significant interaction between the effects of household income and political orientation, with the effect of Left–Right placement being stronger among respondents from higher income households. Furthermore, model predictions visualized in Figure 3 show that this interaction effect is moderated by GDP per capita—the interaction is stronger in wealthier countries (RQ3).
Discussion
The confirmation of individual-level relationships postulated by H1 (e.g. Huber, 2020; McCright et al., 2016) and H2 (e.g. Combes et al., 2018; Kenny, 2020) falls in line with the existing empirical literature. Similarly, the aggregate country-level effect of GDP per capita expressed in H3 (e.g. Ballew et al., 2020; VanHeuvelen and Summers, 2019) is also well-established. Our analysis expands upon the existing knowledge by investigating the moderating effects of GDP per capita on the effects of Left–Right orientation and household income as well as on the interaction among those terms. Such an expansion of the analytic frame was necessitated by the fact that our analysis encompasses a larger and more diverse set of countries than typically found in the literature. For analyses based on data from European cross-national projects (e.g. Czarnek et al., 2021; Gugushvili, 2021; Lengfeld and Gerhards, 2008) or surveys from North America (e.g. McCright, 2010; McCright et al., 2014), potential moderating country-level effects of GDP per capita on individual attitudes do not constitute a major concern as they cover a relatively homogeneous set of countries. Expanding geographical coverage based on the combined EVS/WVS dataset presents a more global and substantially more diverse picture. Many of the 74 countries in the analysis come from low-or-middle income regions of the world.
Accounting for the moderating effect of GDP per capita makes it apparent that the established effects of political orientation and household income (see Figure 3) and their interaction (see Figure 4) on normative preferences for environmental protection over economic growth constitute public opinion artifacts of more affluent individuals in wealthier societies. Crucially, failure to account for the moderation by GDP per capita would lump together wealthier countries, where the effects prove substantial, and the poorer, where they appear negligible. The contrasts are especially stark regarding the Left–Right orientation but remain noticeable for household income. Notably, however, the political positioning along such a spectrum may not be meaningful in countries without a reasonably well-established democratic system, which constitutes an explicit limitation of our analysis (Jou, 2010; Zechmeister and Corral, 2010). In 11 mostly Asian countries for which WVS/EVS data were collected, the Left–Right question item was not even included in the likely recognition of its inapplicability. Their necessitated exclusion substantially limited the representation of Asia, whose global coverage was already restricted by the sparse availability of survey data from African countries (see Figure 2). Although our analysis encompassed many societies outside the developed bubble, the resulting geographical coverage remains far from global.
Conclusion
Research into the normative choices encompassed by the growth-versus-environment dilemma should account for the cross-national differences in wealth and economic development. The over-abundance of data from the developed and a corresponding sparsity of survey research in non-wealthy parts of the world introduce an availability bias to academic discourse. Our analysis confirms that political orientation and household income influence the declarative preference for environmental protection over economic growth. However, we also demonstrate the moderating effect of GDP per capita on those relationships, which tend to be strong in the wealthy and weak in poorer societies. Ignoring this effect may result in underestimating their potential for political polarization in developed countries over the distribution of economic costs of environmental protection. Conversely, especially when it comes to the political salience of environmental issues along the Left–Right spectrum, findings from cross-national surveys conducted in mostly affluent parts of the world should not be construed as globally valid. It points to the importance of conducting detailed quantitative analyses of countries with lower levels of economic development, where political attitudes and political party agendas may significantly differ from those observed in well-studied wealthy countries. Researchers and policymakers can identify and address the specific challenges and opportunities in these contexts by conducting in-depth quantitative analyses. This approach can lead to tailored environmental policies that effectively consider the diverse needs and priorities of countries at different levels of economic development.
Identifying the strong moderating effects of GDP per capita on the influence of political orientation and household income has significant implications for the feasibility of environmental protection and climate change policies. Growth-sacrificing agendas, for example, agrowth or degrowth, are likely to fall victim to political polarization patterns in affluent societies, with right-of-center parties pushing back against the costs imposed on businesses and the less affluent households. In such a scenario, the imposition of growth-impeding costs on the developed economies would not seem politically viable in the long run for their efficacy. However, in non-wealthy countries, political orientation, and household income do not play a major role in shaping the views on the growth-versus-environment dilemma. Their public opinion is not even polarized in this regard along the political lines recognized in the developed world. Further research should investigate the cross-country differences in political salience (Epstein and Segal, 2000; Wlezien, 2005) of environmental issues, of which the declarative preferences measured by opinion surveys are merely a superficial aspect.
Supplemental Material
sj-docx-1-cos-10.1177_00207152241229395 – Supplemental material for The wealth of nations matters: A cross-national analysis of how political orientation and household income affect attitudes toward environmental protection
Supplemental material, sj-docx-1-cos-10.1177_00207152241229395 for The wealth of nations matters: A cross-national analysis of how political orientation and household income affect attitudes toward environmental protection by Piotr Cichocki, Piotr Jabkowski and Mariusz Baranowski in International Journal of Comparative Sociology
Footnotes
Correction (April 2024):
Funding
The author(s) disclosed receipt of the following financial support for the research, authorship, and/or publication of this article: This work was supported by the National Science Center, Poland (grants 2018/31/B/HS6/00403 and 2020/37/B/HS6/02998).
Replication files
Supplemental material
Supplemental material for this article is available online.
References
Supplementary Material
Please find the following supplemental material available below.
For Open Access articles published under a Creative Commons License, all supplemental material carries the same license as the article it is associated with.
For non-Open Access articles published, all supplemental material carries a non-exclusive license, and permission requests for re-use of supplemental material or any part of supplemental material shall be sent directly to the copyright owner as specified in the copyright notice associated with the article.