
Abstract
The often-posed claim that Europe is a pessimistic continent is not unjustified. In 2012, 53 percent of European Union (EU) citizens were pessimistic about their country. Surprisingly, however, societal pessimism has received very little scientific attention. In this article, we examine to what extent political and economic factors drive societal pessimism. In terms of political factors, we expect that supranationalization, political instability, and corruption increase societal pessimism, as they diminish national political power and can inspire collective powerlessness. Economically, we expect that the retrenchment of welfare state provisions and economic decline drive societal pessimism, as these developments contribute to socioeconomic vulnerability. We assess the impact of these political and economic factors on the level of societal pessimism in the EU, both cross-nationally and over time, through multilevel analyses of Eurobarometer data (13 waves between 2006 and 2012 in 23 EU countries). Our findings show that the political factors (changes in government, corruption) primarily explain cross-national differences in societal pessimism, while the macro-economic context (economic growth, unemployment) primarily explains longitudinal trends within countries. These findings demonstrate that, to a large extent, societal pessimism cannot be viewed separately from its political and economic context.
Introduction
The concern that society is changing for the worse is prevalent in many Western countries. Public opinion data show that many Europeans and Americans think that their country is heading in the wrong direction (European Commission, 2013b; Gallup, 2014). Intellectuals in these countries signal a sentiment of pessimism in Western countries (Mahbubani, 2008), and portray Western countries as feeling out of control of their own destiny (Moïsi, 2009). Societal pessimism has also become a relevant factor politically. American voters for example are strongly divided along partisan lines in terms of societal pessimism. During the 2016 Presidential campaign, 69 percent of Trump voters thought the country was going in the wrong direction, compared to merely 8 percent of the Clinton voters (New York Times, 2016). Furthermore, European leaders warn against the serious social, economic, and political consequences of pessimism. The French president, François Hollande, and the Dutch prime minister, Mark Rutte (RTL Nieuws, 2013; The Times, 2015), as well as Pope Francis in his 2014 address to the European Parliament (Vatican Network, 2014), have argued that a less pessimistic outlook is needed to prevent societal and economic stagnation or even deterioration. There are similar arguments in the scholarly literature, that is, that societal pessimism has real consequences by reducing trust in public institutions (Mazarr, 1998; McKenzie, 1997; Whitman, 1998). Nevertheless, despite calls for more scholarly attention (Eckersley, 2000, 2013; Kroll and Delhey, 2013), societal pessimism is greatly understudied.
While opinion leaders, politicians, and scholars warn against pessimism’s detrimental consequences, they pay little attention to its sources. There is a wide range of influential theoretical contributions that trace back a supposed societal decline to specific political and economic causes (e.g. Bauman, 2000, 2007; Beck, 1992; Taylor, 1991). Nevertheless, even these general theoretical suggestions about the political and economic roots of societal pessimism are rarely specified. This is remarkable. In related fields of public opinion research, political and economic performances are consistently important macro-level determinants of, for example, political trust (e.g. Anderson and Guillory, 1997; Hakhverdian and Mayne, 2012; Mishler and Rose, 2001), social trust (e.g. Bjørnskov, 2007; Rothstein and Uslaner, 2005), and happiness (e.g. Hagerty and Veenhoven, 2003; Tavits, 2008).
The political and economic contexts are also likely to influence societal pessimism. The Great Recession hit European economies hard after the summer of 2008. Its consequences were substantial in Europe, increasing unemployment and government deficits, and resulting in austerity measures and fundamental reforms, in some cases enforced by the International Monetary Fund (IMF) and the European Commission. Concurrently, Europe saw an increase in electoral volatility (Mair, 2008) and a rise of radical right parties (Mudde, 2007), undermining the stability of governmental coalitions.
This article formulates hypotheses on the influence of political and economic factors on societal pessimism, and tests the extent to which it is affected by the political (supranationalization, political instability, and corruption) and economic context (retrenchment of welfare state provisions, economic growth, unemployment, and inflation). We employ multilevel modeling to analyze 13 waves of the Eurobarometer (EB) that cover 23 European Union (EU) countries between 2006 and 2012. These waves are enriched with the political and economic contextual measures referred to above cross-nationally (between countries) and longitudinally (within countries) in a single model.
This study contributes to the literature in several ways. First, it provides a test of to what extent societal pessimism reflects the political and economic context. Second, it contributes to public opinion research in two ways: (1) we demonstrate the significant effects of contextual factors on public opinion that are only infrequently included in public opinion research, namely, supranationalization and political instability; and (2) we distinguish between cross-national and longitudinal differences in societal pessimism, showing that these are explained by dissimilar factors. This reinforces the recent push in the literature for more comprehensive cross-national and longitudinal analyses (cf. Schmidt-Catran, 2014; Te Grotenhuis et al., 2015; Van Erkel and Van der Meer, 2016). Third, we provide more insight into societal pessimism itself, its cross-national distribution, volatility, and individual-level determinants.
The article is structured as follows. In the next section, we discuss and define societal pessimism, before turning to a general reflection on which of its roots to consider. We continue with specific sections on the political and economic causes in which we hypothesize on country characteristics. After describing the data used and the modeling technique, we present the descriptive patterns, the effects of the political and economic factors, and tests for mediation. The conclusion summarizes our findings, reflects on the study’s limitations, and makes suggestions for further research.
Theoretical framework
Societal pessimism
Despite a wide range of influential theoretical accounts on societal decline (Bauman, 2000; Beck, 1992; Bennett, 2001; Taylor, 1991), remarkably few scholars have explored whether citizens hold pessimistic views about society. A concern about the state of society can be found in the work of Mills (1971 [1959]), who uses the term uneasiness to refer to a feeling that somehow something is a threat, without knowing what is threatened or by whom. Bennett (2001) describes cultural pessimism theoretically as the sense that one’s culture is in decline. He describes this sentiment in relation to environmental, moral, intellectual, and political concerns. Elchardus and Smits (2007) speak of ‘a lack of well-being about [being part of] society’ (p. 104), but do not specify a particular object of concern. Others focus on the opposite position, namely, positive, optimistic notions of society. Uslaner (2002) examines the effect of optimism on social trust. He does not, however, make a distinction between personal and societal optimism (or pessimism); in his work, optimism relates to expecting success (or the worst) with regard to both personal matters and society as a whole. Social actualization – the sense that society has potential – is one of the five dimensions of social well-being (Gallagher et al., 2009; Huppert et al., 2009; Keyes, 1998; Keyes and Shapiro, 2004).
This article follows a recent conceptualization of Steenvoorden (2015) who describes the concern about society as the perception of unmanageable deterioration and a collective powerlessness to improve conditions. In line with Steenvoorden (2015), we define societal pessimism as the concern among citizens that their society is in decline. Several elements in this definition deserve attention. First, this broad definition focuses on the sense of decline, without specifying which elements of society are declining. The core aspect of societal pessimism is the general perception of societal deterioration rather than a perception of the specific elements of society that may be in decline. Any specification of the object of the sense of decline is therefore beside the point and part of the explanans rather than the explanandum. We therefore operationalize the concept as a respondent’s perception of whether their country is heading in the right or wrong direction.
Second, it is important to conceptualize societal pessimism as a sociotropic rather than an egotropic attitude (Kinder and Kiewiet, 1979; Steenvoorden, 2015), 1 as it reflects how people perceive society at large rather than their own personal position. This sharpens the conceptual boundaries with other concepts and sets societal pessimism apart from personal well-being, which is a position that others have also adopted (Eckersley, 2000, 2013; Kroll and Delhey, 2013). The sociotropic focus also distinguishes societal pessimism from the use of optimism (Uslaner, 2002) and social actualization (e.g. Keyes, 1998; Keyes and Shapiro, 2004). Third, we believe that because societal pessimism reflects sociotropic problems, the term concern is more appropriate than anxiety or fear because the latter imply more distress.
Despite similarities, societal pessimism is distinct from related sociological concepts. For instance, anomie – unlimited expectations and normlessness (Durkheim, 1951 [1897]), or deviant, illegitimate behavior (Merton, 1938) – is a characteristic of society itself, not an evaluation of society by its citizens like societal pessimism. The concepts anomia (e.g. Dean, 1961; Legge et al., 2008) and alienation (Seeman, 1975, 1983) describe the mental state of individuals, and resentment emphasizes one’s relative position (Barbalet, 2001; Meltzer and Musolf, 2002; Webber, 2007), rather than the state of society at large. Finally, societal pessimism is also different from personal satisfaction with life and well-being (Eckersley, 2000, 2013; Kroll and Delhey, 2013).
Roots of societal pessimism
One stream of research focuses on an apparent gap between personal well-being and public pessimism. These authors argue that pessimism about the future of society is often unjustified and based on overly negative media reports (McKenzie, 1997; Whitman, 1998). Whitman suggests two explanations of that gap: a psychological mechanism and a media effect. The former is the general tendency in human nature to expect better things for ourselves than average, while the latter points to a major influence of media reports on evaluations of the state of society, which is in contrast to its negligible effect on the evaluation of one’s personal circumstances. 2
The much larger empirical body of public opinion research on a wide range of attitudes implies the opposite, however, namely that societal pessimism reflects the societal context. In many instances, research demonstrates the influence of the social, political, and economic contexts on happiness, social trust, and political trust (e.g. Bjørnskov, 2007; Mishler and Rose, 2001; Tavits, 2008). We have little reason to assume that this would be any different for societal pessimism, as it is clearly part of public opinion, just like social and political trust.
Political causes of societal pessimism
Politically, we expect a perceived collective powerlessness – that is, the lack of power by society and its (political) institutions to change the societal status quo – to stimulate societal pessimism. National political institutions and actors are vital in this respect, as they are in the position to perform actual changes with regard to where a country is heading. Theoretically as well as empirically, the perception of loss of national political power contributes to a concern about the state of society (Steenvoorden, 2015). Hence, we expect that objective political conditions that diminish national political power increase societal pessimism. As a result, our overarching expectation is that societal pessimism is greater in contexts where national political institutions are undermined in terms of their ability to exert political power. Specifically, we consider three ways in which decreasing national political power inspires societal pessimism: supranationalization, political instability, and corruption.
A first example of diminishing national political power on the European continent is supranationalization, namely, the transfer of political power and resources to the EU. Supranationalization reduces the autonomy of national political actors and their ability to act unilaterally (Hay, 2007; Scharpf, 2000; Wallace, 1999). In effect, supranationalization diminishes the national grip on society’s future, stimulating a sense of collective powerlessness among citizens. This reasoning is also present in the public debate, for instance, in the critique of the EU during the Brexit campaign and more generally by populist political parties across Europe, which claim that their respective country is losing sovereignty (Van Elsas et al., 2016). Of course, if the national government is failing, the EU might be a welcome alternative. We consider the effect of the malfunctioning of national governments below. Ceteris paribus, we expect that supranationalization increases societal pessimism (H1).
We operationalize supranationalization by distinguishing between financial redistribution in the EU and adopting the Euro. Countries that benefit financially from the EU value EU institutions more and have lower levels of Euroscepticism (Karp et al., 2003; Lubbers and Scheepers, 2010; Mahler et al., 2000). Financial support from the EU can inspire optimism, whereas the opposite is likely in countries that pay more than they receive in subsidies because they have lost control over their own resources. We therefore hypothesize that a net payment to the EU increases societal pessimism (H1a). Furthermore, the member states of the European Monetary Union (EMU), which have the Euro as their currency, experience a much higher level of interference in national decision-making, with examples being European standards with respect to a country’s maximum budget deficit and demands from the EMU on the rate and type of social reforms. As such a loss of national autonomy in policy decision-making can add to a sense of collective powerlessness, we expect that EMU membership increases societal pessimism (H1b).
Second, political instability also diminishes national political power. When a government brings its term in office to an end prematurely – regardless of the nature of the conflict within government – it is constrained to deal with new or contentious topics, adding to the impression of collective powerlessness and in turn inspiring societal pessimism (cf. Harmel and Robertson, 1986). We therefore expect that political instability increases societal pessimism (H2).
Third, corruption also diminishes political power. There is ample evidence of the disruptive effect of corruption on collective socio-political attitudes (Anderson and Tverdova, 2003; Della Porta, 2000; Hakhverdian and Mayne, 2012; Mishler and Rose, 2001; Zak and Knack, 2001). On the surface, corruption undermines the political system’s ability to achieve results. More fundamentally, it signals a collective inability or unwillingness to fight for the common good. As we expect corruption to lower people’s expectations of societal improvement, the third hypothesis is corruption increases societal pessimism (H3).
Economic causes of societal pessimism
While societal pessimism is likely to be induced by collective powerlessness in the political realm, it is arguably related to socioeconomic vulnerability in the economic domain. Socioeconomic vulnerability here does not refer to people’s personal finances or employment circumstances, but to their worries about a general trend in society that socioeconomic guarantees are becoming less evident. As the perception of socioeconomic vulnerability stimulates a concern about the state of society (Steenvoorden, 2015), we expect an objective economic decline to foster societal pessimism by increasing socioeconomic vulnerability. Various authors discuss such an objective economic decline, for example, by arguing that economic transformations have removed old certainties, resulting in increased socioeconomic vulnerability for current and future generations (Bauman, 2007; Ehrenreich, 1989; Samuelson, 1995). This trend of the ‘individualization of risks’ (Bauman, 2006, 2007) suggests that current personal circumstances have become less stable and more vulnerable to change.
One development that increases socioeconomic vulnerability is the retrenchment of welfare state provisions across Europe, which corrodes the protection of citizens in a vulnerable position (Korpi, 2003; Pierson, 1998). This creates more insecurity for all, which we assume will lower expectations about the future of society. We therefore expect that cutbacks in social security increase societal pessimism (H4).
More generally, the macro-economic performance is likely to affect societal pessimism for similar reasons. Any fall in a country’s level of wealth is likely to increase perceptions of the overall level of socioeconomic vulnerability, as economic recessions tend to deepen societal challenges. As a result, we expect that economic decline increases societal pessimism (H5). Specifically, we focus on three indicators of macro-economic performance that are known to affect public opinion (Anderson and Tverdova, 2003; Taylor, 2000): economic growth, unemployment rates, and inflation levels. Hypothesis 5 thus has three components: economic growth (H5a), unemployment rate (H5b), and inflation (H5c).
Comparisons composing societal pessimism
Societal pessimism inherently presupposes a comparison. This is particularly relevant to our hypotheses on the impact of the political and economic context, which may be conditional on the benchmarks that citizens use when they assess the state of society. To the extent that the benchmark is based on citizens’ historical experiences (e.g. being used to a high level of economic growth in their country), this implies a within-country, longitudinal comparison. Alternatively, the benchmark may be based on a comparison to other nations (e.g. performing well in comparison to neighboring countries), which, in turn, implies a cross-national comparison. Finally, the benchmark may be an absolute norm (independent of historical experiences or cross-national comparisons) if the longitudinal and cross-national analyses produce the same set of determinants of societal pessimism, which is not self-evident (cf. Schmidt-Catran, 2014; Te Grotenhuis et al., 2015; Van Erkel and Van der Meer, 2016). Although we are agnostic about the extent to which people make explicit, reflective comparisons, or rather implicit, experiential comparisons, we need to accommodate all possibilities in our research design. As a result, the design encompasses both cross-national and longitudinal effects.
Data and methods
Data and operationalization
Our hypotheses place high demands on the data and research design: they require cross-national (covering many countries) and longitudinal survey data (covering many time points). Moreover, the survey needs to include measures of societal pessimism. These demands are best met by the EB surveys covering 13 waves in the period 2006–2012. 3
These particular EB waves include an item about the direction in which citizens think their country is heading: ‘At the present time, would you say that, in general, things are going in the right direction or in the wrong direction in [your country]’. This item fits the definition of societal pessimism because of its broad scope on society as a whole and its focus on the process of decline or improvement. Although the words ‘at the present time’ might make respondents focus on short- rather than long-term developments, the item nevertheless measures an anticipation of the future. The answer categories are ‘things are going in the right direction’ (optimists), ‘things are going in the wrong direction’ (pessimists), and a spontaneous ‘neither one nor the other’ (undecided). ‘Don’t know’ (2.6%) is treated as missing. We restricted the analysis to countries that have been an EU member since the start of this period, and we excluded Cyprus and Greece because of missing data in these nations. This left us with 23 countries.4,5
We connected the individual-level survey data to contextual data from various sources. Net EU payment was measured with data from the European Commission concerning the net balance of the costs and benefits to/from the EU in terms of the percentage of gross national income (GNI) (European Commission, 2013a).6,7 EMU membership distinguished between non-EMU (reference category), new EMU (which adopted the Euro between 2006 and 2012), and established EMU countries. 8
We operationalized political instability in two ways. First, we coded early elections in the period 2000–2011 that were due to an inevitable and obligatory dissolution of parliament (e.g. because of conflict within a coalition or a governing party). Early elections that took place on the initiative of the government without a preceding political crisis were not coded as such. The longer time span was chosen to reflect recent history, which is likely to shape perceptions of political instability. Cross-nationally, we coded the number of elections that were classified as early elections. Longitudinally, the variable indicates whether early elections took place the year before each wave. To isolate the effect of early elections from that of regular elections, we controlled for the number of parliamentary elections that had taken place in a country, either in the period 2000–2011 (cross-nationally) or in the previous year (longitudinally). 9
The second measure of political instability focused on the executive, via the number of changes in government due to changes in the composition of a government (ministers or parties entering/leaving the coalition and termination of government). In our cross-sectional models, we relied on the total number of changes between 2000 and 2011, again using a longer time span than the individual survey data reflect. Longitudinally, the variable indicates the number of changes that took place the year before each wave.
Corruption was operationalized with the Corruption Perception Index produced by Transparency International, which we recoded so that a low score refers to a low level of corruption (Teorell et al., 2013). Cutbacks in social security were measured with yearly differences in the Organisation for Economic Co-operation and Development (OECD) salary replacement rate, with a negative number indicating a fall in the social security rate over that year. 10 Eurostat yearly data on inflation and the mean of the two quarters before each wave on gross domestic product (GDP) growth and unemployment were used as operationalizations of these economic factors.
On the individual level, we controlled for gender, age (15–24, 25–39, 40–54, 55+), educational level (low, medium, high, and student), 11 employment status (employed, unemployed, or other – which is retired, ill, home-maker, or student), and type of community (rural area or village, small or mid-sized town, and large town). All the missing individual-level data were deleted list-wise, resulting in 252,393 respondents in all the analyses. Appendix 1 provides an overview of all the variables used in the cross-national analyses (the pooled mean of the 13 waves of data for each country used in the longitudinal analyses).
To examine the nature of societal pessimism, we repeated all the final analyses while including four individual-level attitudes, which were all dummy variables recoded in the negative direction: low satisfaction with life (not very or not at all satisfied versus very or fairly satisfied), negative economic expectation for the next year (worse versus better or the same), distrust of parliament, and distrust of government (tend to trust versus tend not to trust). The correlations of societal pessimism with these attitudes were weak to moderate: 0.21 (low life satisfaction), 0.30 (negative economic expectation), 0.39 (distrust of parliament), and 0.41 (distrust of government).
Research design and method
Our hypotheses, measures, and data structure drove the choices for our research design. As the dependent variable has three answer categories without a strict, inherent ordering of the classifications, 12 we applied a multinomial regression analysis. We chose optimists as a reference category to get a picture of the characteristics that influence societal pessimism.
As our hypotheses and data structure concern individuals who are nested in countries, we performed a multilevel regression analysis. This allowed us to model both individual and contextual determinants simultaneously, and to correctly estimate the standard errors (SEs) at each level of analysis. We did this using the software package MlwiN 2.30 (Rasbash et al., 2014), which is specifically designed for multilevel analyses. Multilevel models have important advantages compared to aggregate analyses at the country level, which would require us to transpose individual-level data to the contextual level, creating overdetermined or underspecified models. Moreover, aggregate analyses conflate rival individual-level and contextual-level effects, such as the effect of being unemployed and the impact of living in a country with high unemployment rates.
To the extent that societal pessimism is rooted in the economic and/or political context, citizens are assumed to consciously or implicitly compare their country’s state of affairs to a benchmark. The benchmark in this comparison can be cross-national (in comparison to other countries), longitudinal (in comparison to the past), or both (if the comparison is to an absolute standard, regardless of time and place) (cf. Van Erkel and Van der Meer, 2016). Recent analyses show that cross-national and longitudinal models (with country-level fixed effects) may produce fundamentally different outcomes (e.g. Schmidt-Catran, 2014; Te Grotenhuis et al., 2015; Van Erkel and Van der Meer, 2016). This has important consequences for our research design: we needed to perform cross-national as well as within-country longitudinal analyses.
We performed these cross-national and longitudinal analyses in a single model (Fairbrother, 2014; Schmidt-Catran and Fairbrother, 2015). We thus nested individuals in country-waves, which were nested in countries. To isolate cross-national effects, we operationalized all the economic and political effects as determinants that only vary at L3 (i.e. across countries, but not over time). We relied on country means (across the 2006–2012 time span), dummy variables (EMU membership), and sum scores (early elections and changes in government; see above). To isolate within-country, longitudinal effects, we centered all relevant country-level characteristics, including dummies (Enders and Tofighi, 2007), around their longitudinal mean to filter out any cross-national variance of these determinants. Finally, using dummy variables that identify each wave, we eliminated joint longitudinal variation from the models that existed independently from country-specific variations (i.e. survey design effects, or cross-national events). 13
A risk in cross-national multilevel models is the problem of multicollinearity. To avoid this, we carefully built up our analysis in a stepwise fashion. We first estimated the political and economic models of societal pessimism separately. The subsequent model 3 only combines those contextual determinants with a b-value larger than the SE. 14 We also performed two robustness checks: we assessed the robustness of our models by adding variables in a different order, and determined to what extent the cross-national models held when we included Greece (which was not included because of the extraordinary political and economic developments there and missing data). Both checks suggested that the findings are robust.
Descriptive analyses
Descriptive patterns
Figure 1 shows that in the period 2006–2012, 50 percent of Europeans think their country is heading in the wrong direction, 32 percent believe that it is going in the right direction, and 19 percent are undecided. Societal pessimism is a rather common phenomenon across Europe. Nevertheless, there are considerable differences between countries. Pessimists are in the majority in most nations, except for Sweden, Austria, Estonia, and Luxembourg. Their proportion ranges from 68 percent in Hungary to 31 percent in Luxembourg. The most pessimistic nations tend to be large Western European countries, some with clear ethnic and cultural divisions, such as France, Spain, Great Britain, and Italy. In contrast, the least pessimistic group consists predominantly of relatively small Western European countries with well-developed welfare states, such as Luxembourg, Austria, Sweden, and the Netherlands. Post-Communist nations, meanwhile, are found both among the most societally pessimistic and the most societally optimistic peoples.
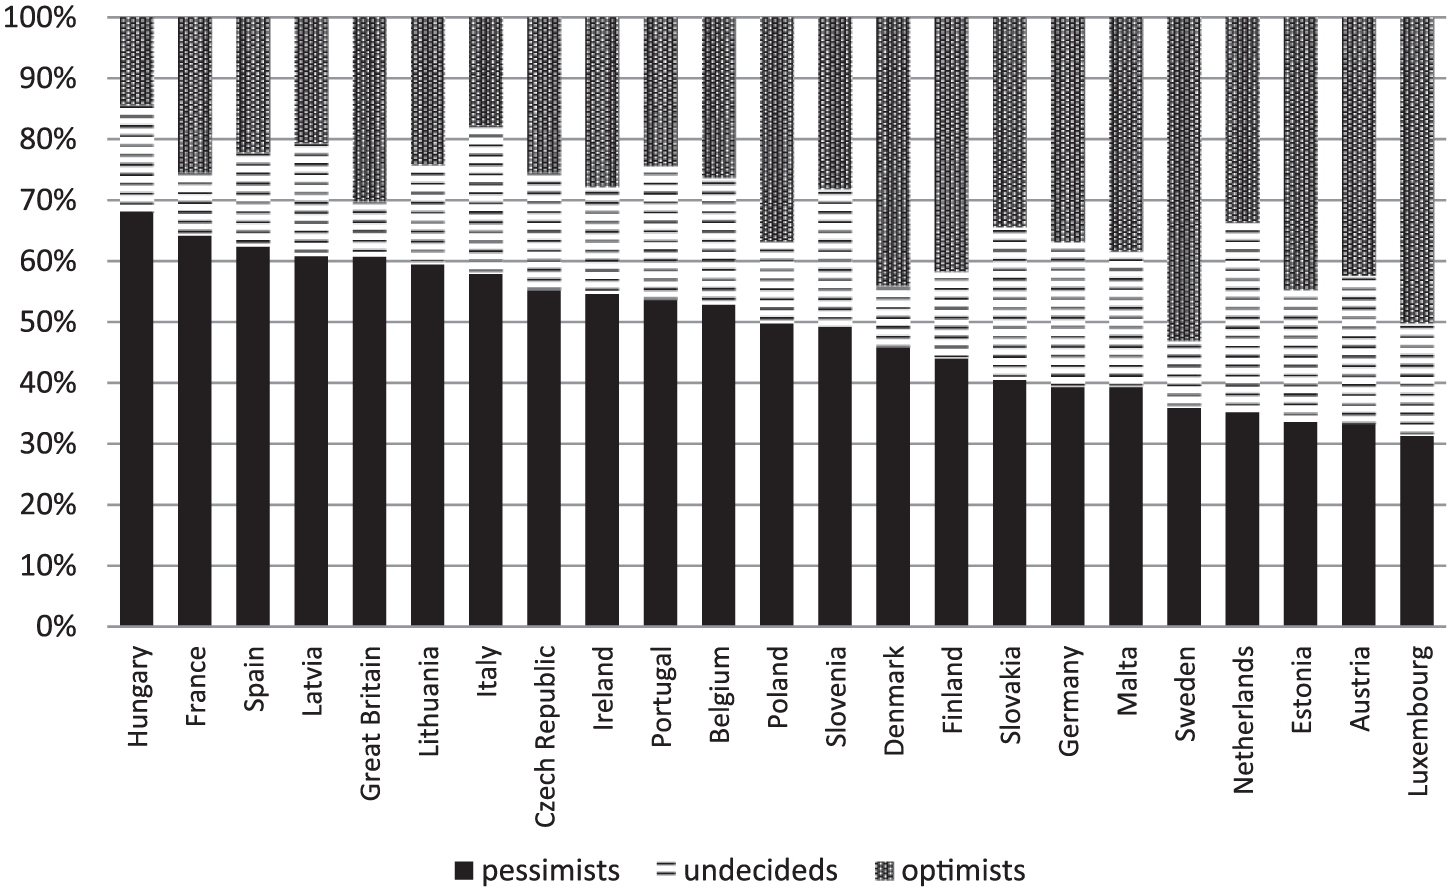
International distribution of societal pessimism (national means 2006–2012).
Figure 2 presents the development of societal pessimism over time on the pooled data. There is no clear linear trend. Societal pessimism first increased with the onset of the Great Recession in the fall of 2008, then fell slightly, before rising again in the fall of 2011. The level of societal pessimism is significantly higher after the fourth quarter of 2008 than in the third quarter of 2006. Nevertheless, even before the Great Recession, the degree of societal pessimism was already substantial. Indeed, between 2006 and 2008, the mean level of societal pessimism in Europe was 42 percent. This means that despite any influence that the Great Recession may have had on societal pessimism, it leaves a great deal of the variance unexplained.
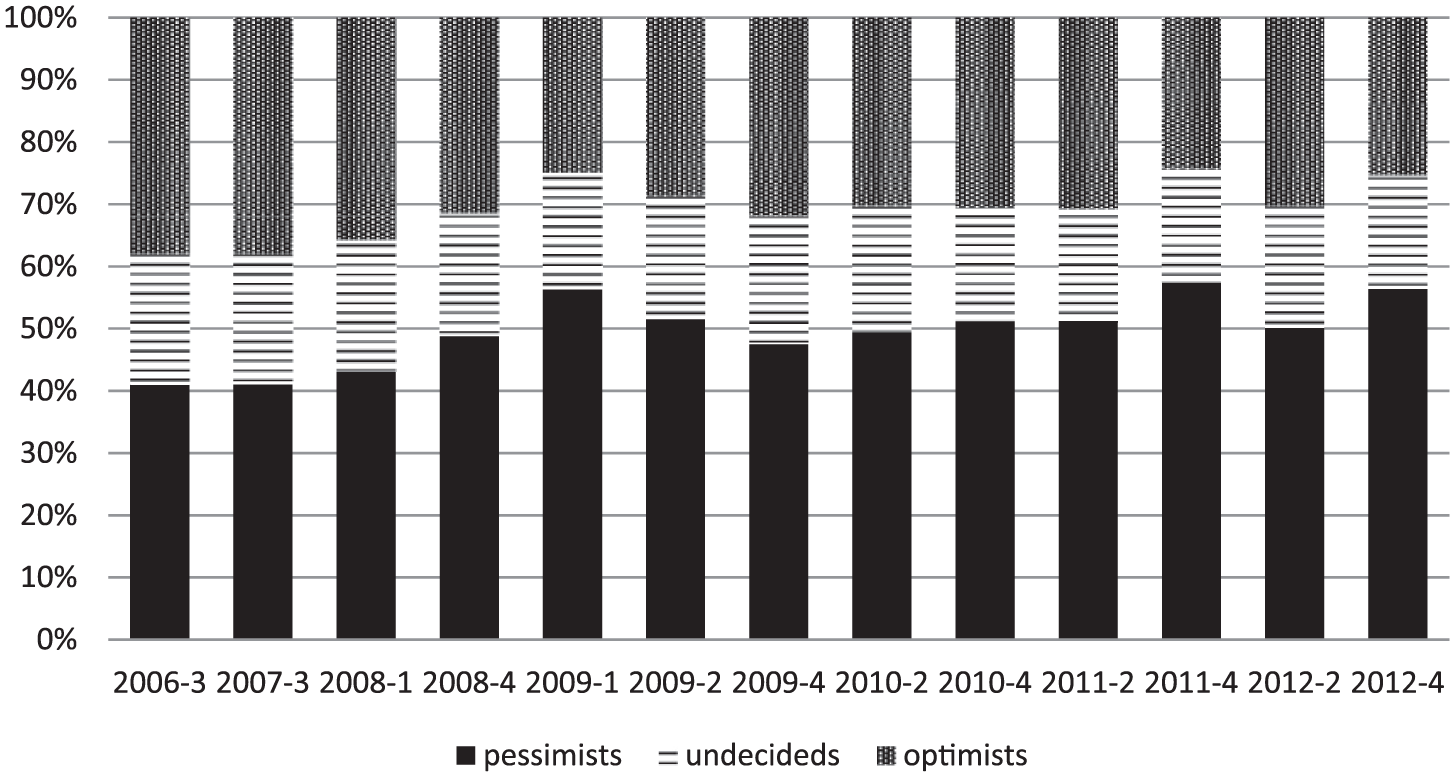
Distribution of societal pessimism 2006–2012 (pooled data).
Figure 3 shows the development of societal pessimism for all 23 countries during the period of study, 2006–2012, sorted from the most to the least societally pessimistic. Three patterns stand out. First, societal pessimism is relatively volatile; we see considerable changes in its level in 2006–2012. Second, this volatility applies to all countries, regardless of whether they are very pessimistic or relatively optimistic. Third, the onset of the Great Recession did not increase societal pessimism in all countries to the same extent or at the same time; the rapid rise of societal pessimism in Spain since the last quarter of 2008 is not a general European pattern.
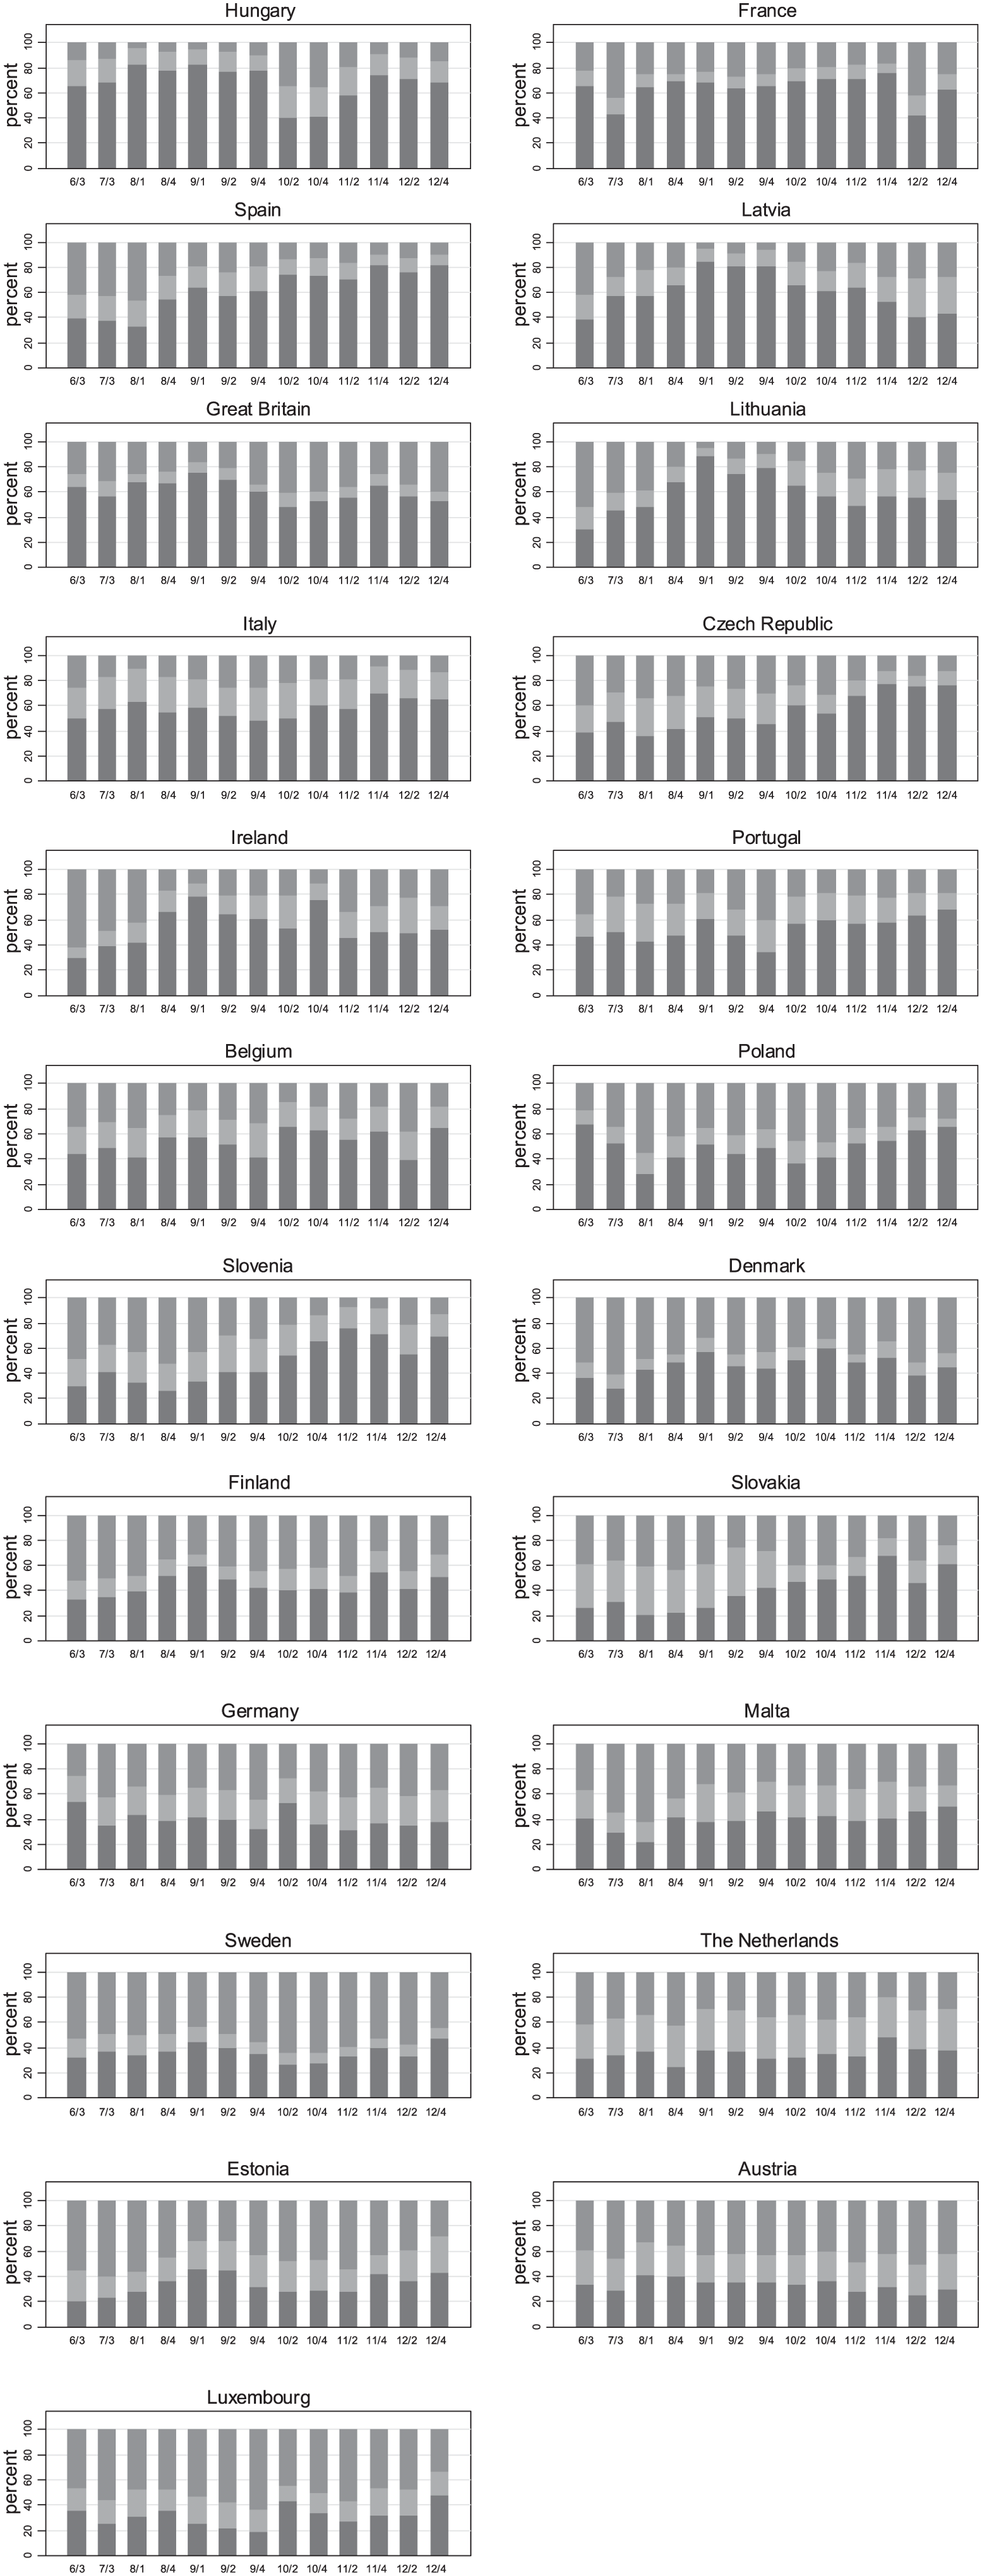
Within-country changes in societal pessimism 2006–2012.
By breaking down the variance in societal pessimism across the different levels of analysis, we can assess how much of the variance is accounted for at the macro-level. Five percent of the total variance between optimists and pessimists is situated at the country level, with another 5 percent located at the country-wave level. This means that 10 percent of all differences – a substantial amount – between optimists and pessimists are accounted for by differences between countries at different points in time. 15
Explanatory analysis
Table 1 reports the results of the multilevel, multinomial regressions we conducted to explain within-country, longitudinal differences (L2) and cross-national differences (L3) in societal pessimism. These analyses modeled the chances of being a societal pessimist or undecided rather than a societal optimist (reference category). Bold numbers indicate significant effects. The dummy variables identifying survey waves are not presented in Table 1 for reasons of space.
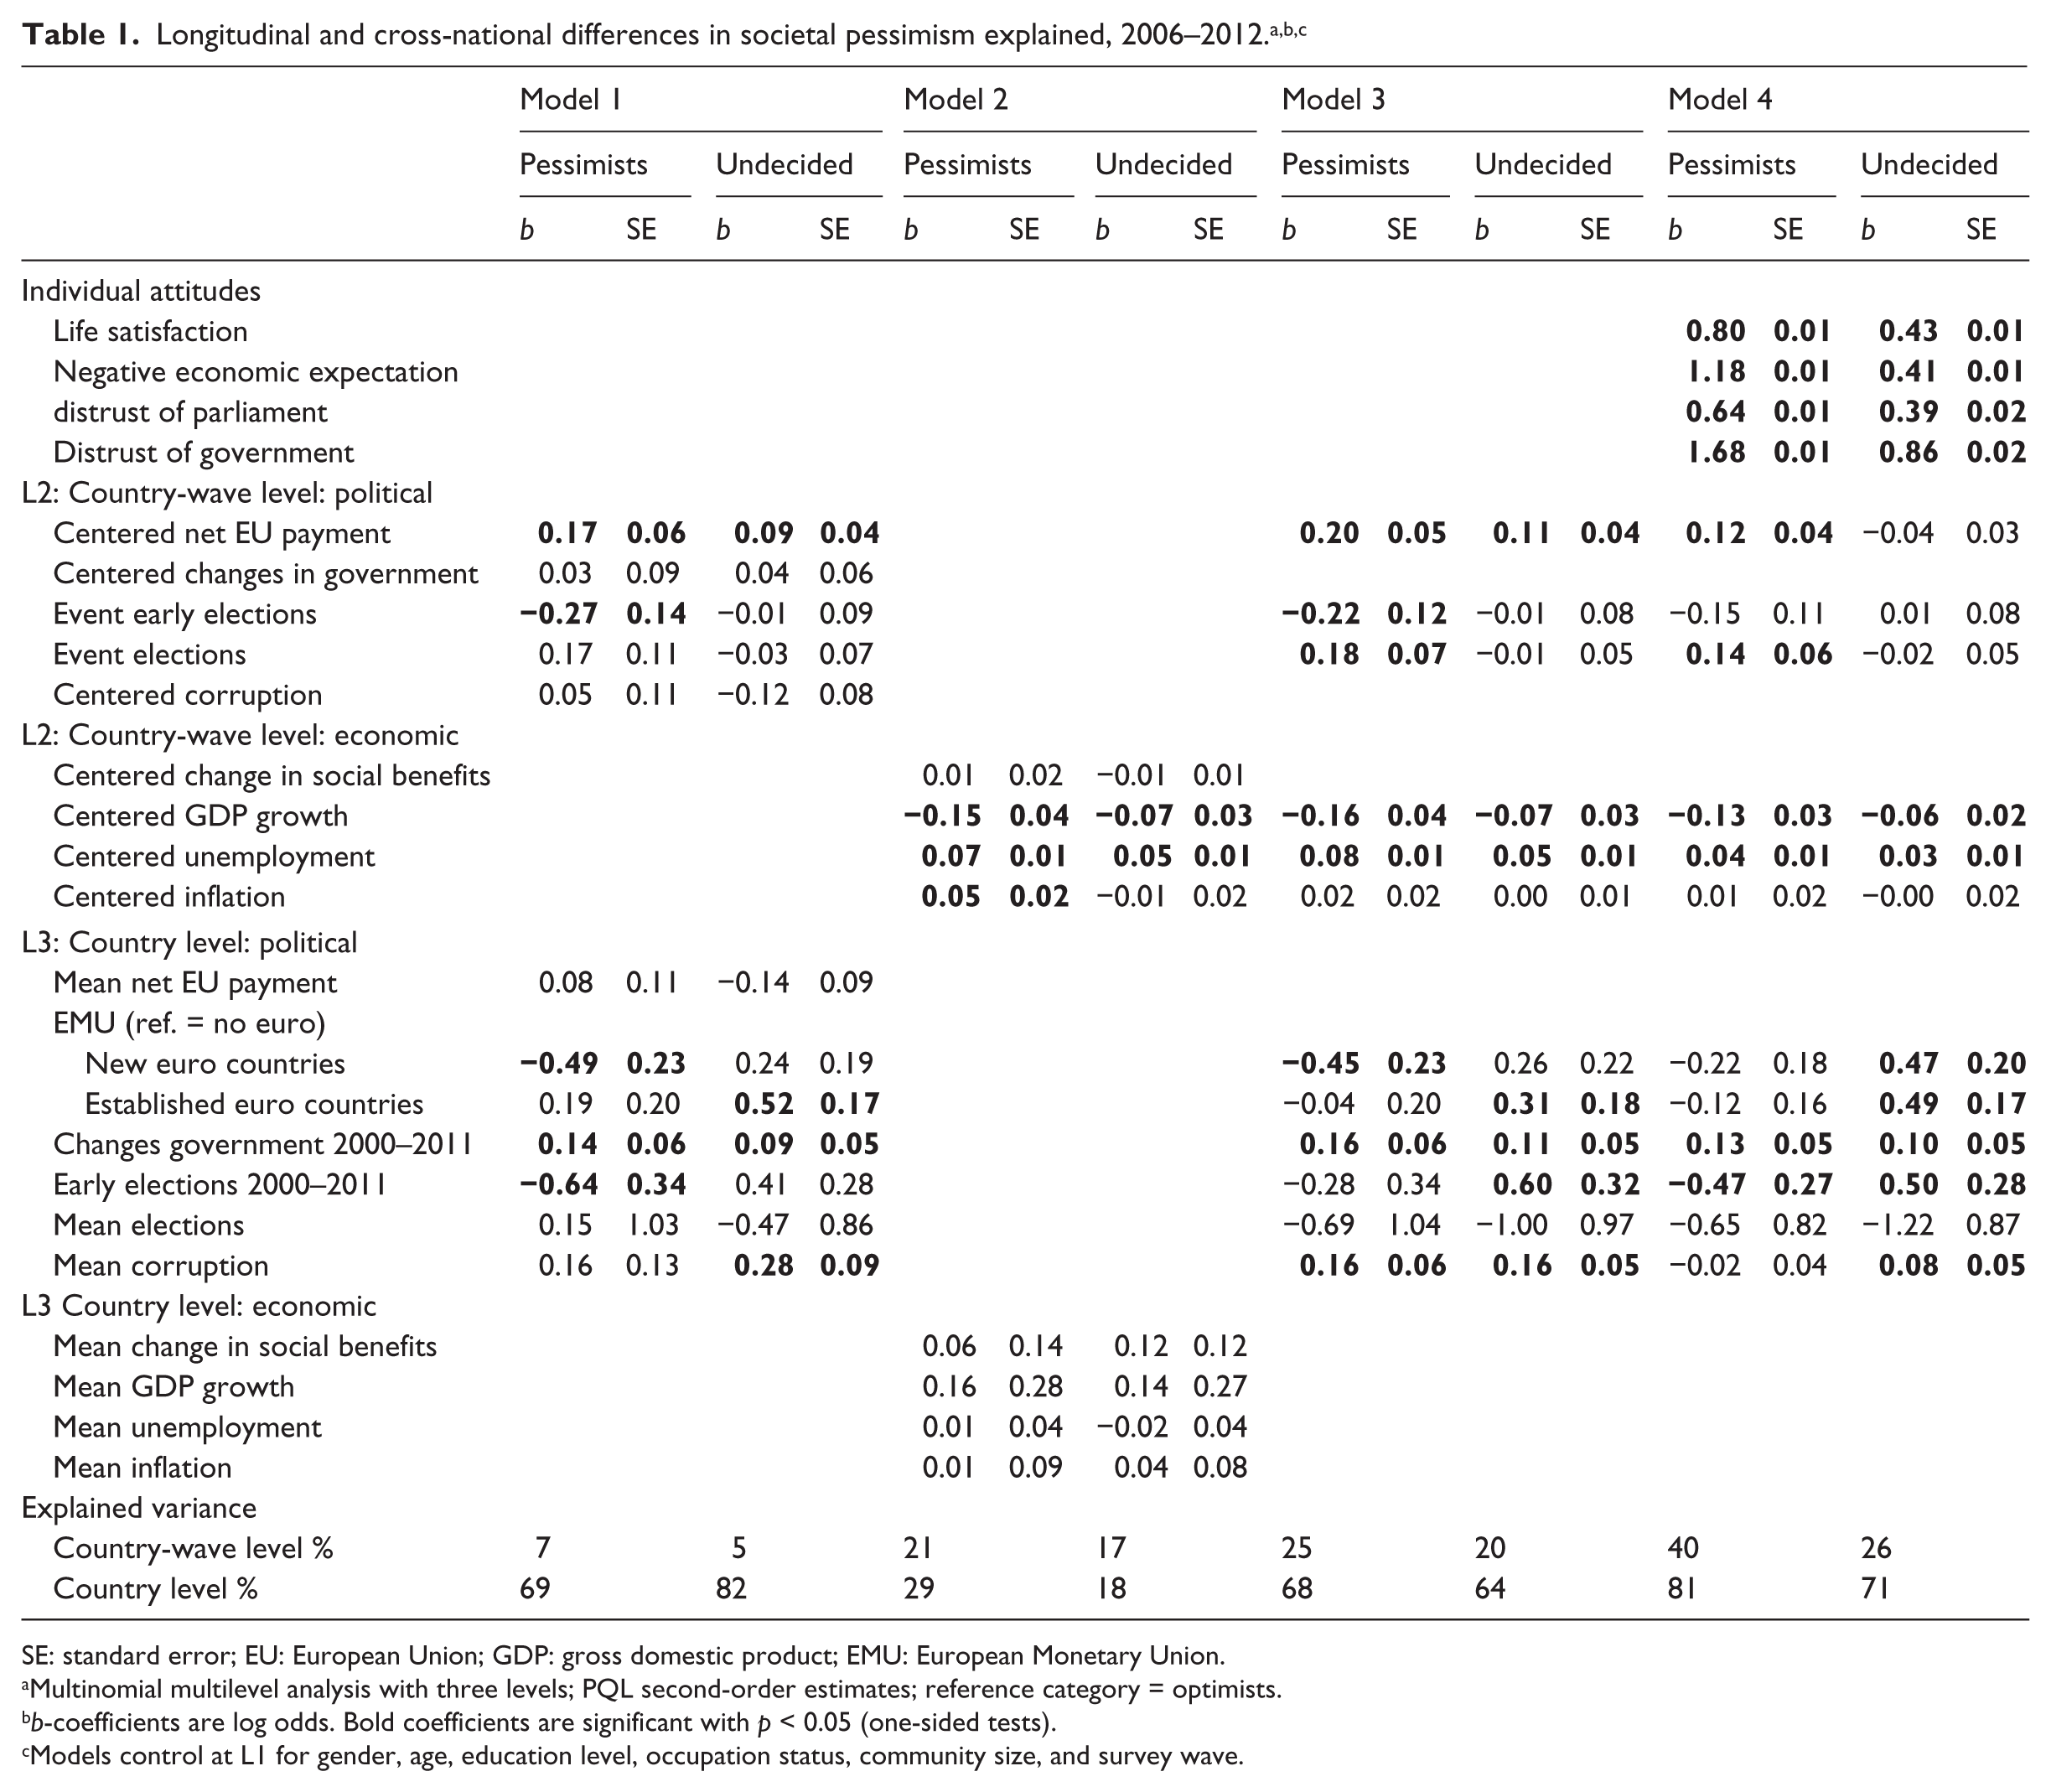
SE: standard error; EU: European Union; GDP: gross domestic product; EMU: European Monetary Union.
Multinomial multilevel analysis with three levels; PQL second-order estimates; reference category = optimists.
b-coefficients are log odds. Bold coefficients are significant with p < 0.05 (one-sided tests).
Models control at L1 for gender, age, education level, occupation status, community size, and survey wave.
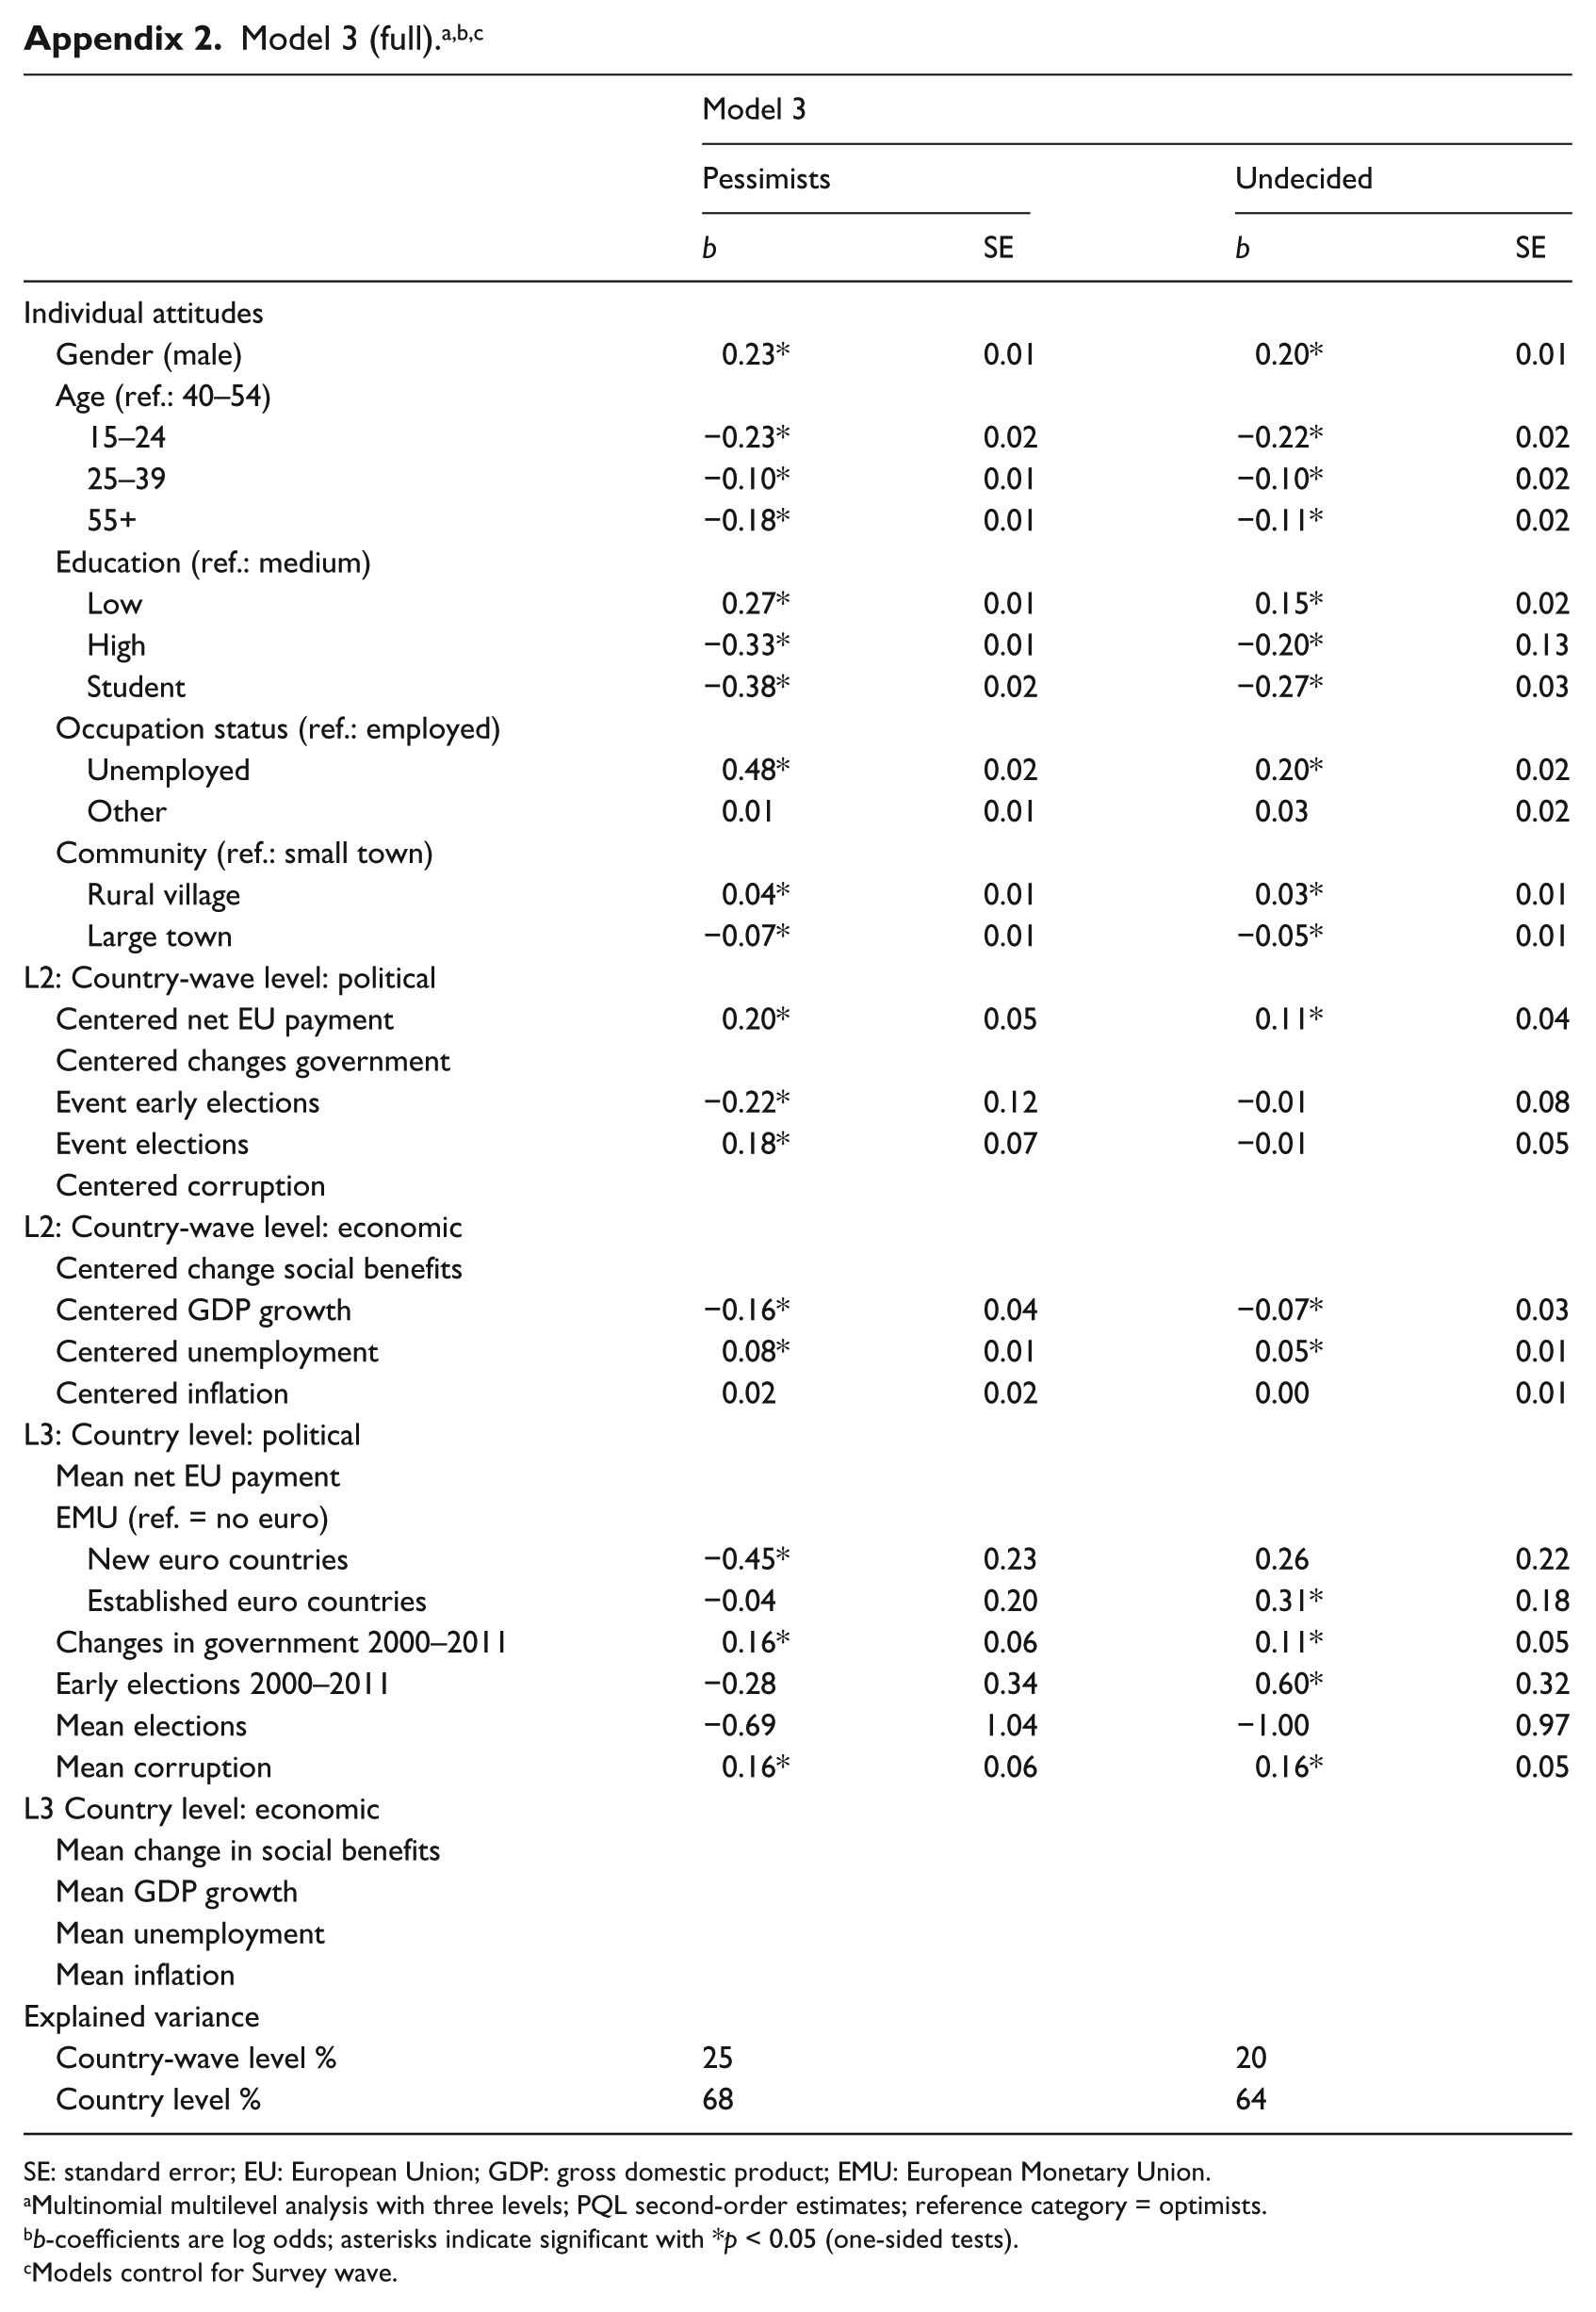
As there are very few studies on societal pessimism, we briefly discuss the effects of the individual control variables (see Appendix 2). In all the models, education negatively affects societal pessimism, whereas unemployment has a positive effect. Furthermore, age matters, with the middle-aged (25–39 and 40–55) being the most likely to be pessimistic, whereas the oldest cohort (55+) is not more likely to be pessimistic about society than those aged 15–25. People in rural areas are more often societally pessimistic, while inhabitants of large cities are instead less inclined to societal pessimism.
Political model
Model 1 focuses on political determinants, which explain most of the cross-national variance in societal pessimism (69%), and relatively little of the within-country, longitudinal variance (7%). We find mixed support for hypothesis H1 on supranationalization. Net payments to the EU have no significant cross-national effect but, longitudinally, it has the positive effect we expected (H1a): people are more likely to be societally pessimistic (b = 0.17) or undecided (b = 0.09) when their country’s net payment to the EU was relatively high in the previous year compared to other years. Nevertheless, citizens of EMU countries do not display higher levels of societal pessimism (H1b); instead, we find a negative effect (b = −0.49) in countries that had recently adopted the Euro.
The findings on political instability are also ambivalent (H2). The single event of experiencing a change in government does not stimulate societal pessimism, but in countries where changes in the composition of government are common, societal pessimism is higher (b = 0.14). Early elections tend to reduce rather than increase societal pessimism, both longitudinally as an event (b = −0.27) and as a time-invariant characteristic (b = −0.64). These remarkable results are quite robust when it comes to the various model specifications. 16 As a consequence, governmental instability stimulates societal pessimism, while early elections instead provide an optimistic boost.
Corruption does not tend to increase societal pessimism (H3), whether longitudinally or cross-nationally.
Economic model
Model 2 focuses exclusively on the economic determinants. Jointly, they explain much less of the cross-national variance in societal pessimism than the political determinants (29%), but more of the within-country, longitudinal variance (21%). In fact, we only find significant effects of macro-economic outcome indicators in the longitudinal part of the model. This is very much in line with recent findings in recent sociotropic public opinion research (Han and Chang, 2016; Van Erkel and Van der Meer, 2016).
Not all the longitudinal determinants have a significant effect, though. Contrary to our expectations (H4), the change in the social benefit rate over the previous year is not related to societal pessimism. However, as expected, rising economic growth reduces societal pessimism (b = −0.15), whereas rising unemployment (b = 0.07) and inflation rates (b = 0.05) increase it. These findings are in line with our expectations (H5a–H5c).
Full model
Model 3 includes the L2 and L3 determinants of societal pessimism, with b > SE in models 1 and 2. None of the effects change direction, although there are some differences in terms of significance; in model 3, corruption has a significant between-country effect (b = 0.16), whereas the longitudinal effect of inflation and the cross-national effect of early elections both lose significance. Overall, the full model explains 68 percent of the cross-national variance in societal pessimism and 25 percent of the within-country longitudinal variance.
Model 3 allows us to draw final conclusions about which hypotheses are confirmed and which are not. Supranationalization (H1) only stimulates societal pessimism in the longitudinal part of our model. Cross-nationally, we do not find the expected effects of EU net payments, nor of EMU membership. On the contrary, we find a negative effect for new Euro countries. This indicates that joining the EMU injected a positive sentiment, possibly because it ran parallel with positive (economic) developments in a country or because citizens view the supervision by EMU nations of their government as a positive, welcome development. Political instability (H2) is related to societal pessimism, with a track record of government instability stimulating this. Early elections, however, are not; instead, we find that it depresses societal pessimism. Hypothesis 2 thus finds mixed support. Possibly, early elections reflect the responsiveness of the political system to the sentiments of electorates. The third political factor, corruption (H3), indeed increases societal pessimism as expected, but only in the cross-national models.
Of the economic factors, the change in the level of social benefits does not affect societal pessimism in any way; H4 is not supported by the data. However, several macro-economic performance indicators are related to societal pessimism, albeit only longitudinally. In line with H5a, economic growth suppresses societal pessimism. Meanwhile, in line with H5b, rising unemployment boosts pessimism.
Societal pessimism’s distinct dynamic
Finally, we assessed to what extent societal pessimism is a unique attitudinal feature, with its own root causes and dynamics. This is particularly relevant in the face of the outcomes presented in model 3, which are, in part, similar to findings in political trust research. That literature commonly finds that corruption has a consistent negative effect in cross-national analyses, whereas macro-economic performance only has an impact in longitudinal analyses (cf. Van Erkel and Van der Meer, 2016). Consequently, model 4 investigates to what extent our findings are driven by more specific judgments. To this end, we added four potential confounders: life satisfaction (about private life), macro-economic expectations (about the economic sphere), and parliamentary and governmental trust (about the political sphere).
Model 4 shows that life satisfaction, economic expectations, and political trust are all related to societal pessimism in the way one would expect: privately happy, economically optimistic, and politically trusting citizens are less likely to be pessimistic about society.
The contextual effects in model 3 are indeed partly driven (mediated) by more specific attitudes. Most effect sizes decrease after the inclusion of the specific judgments. Some effects even lose significance at p < 0.05. Most noteworthy is the complete collapse of the cross-national effect of corruption on societal distrust (b = −0.02, ns). Additional analyses (not displayed here) reveal that this collapse is primarily due to the inclusion of political attitudes. Apparently, corruption increases societal pessimism primarily because it makes people pessimistic about the political system. In contrast, the longitudinal effects of two macro-economic performance indicators (growth, unemployment rates) retain most of their strength, as well as their significance, even after the inclusion of subjective economic expectations.
Overall, model 4 confirms that the effects of the political and economic contexts on societal pessimism are partly, but not exclusively, driven by citizens’ specific judgments of their private lives, the state of the economy, and politics. This underlines the notion that societal pessimism is conceptually distinct from these more extensively studied, more specific judgments. Societal pessimism is an attitude with a dynamic of its own, in addition to known attitudes in public opinion research such as political trust or economic expectations.
Conclusion and discussion
Societal pessimism, namely, the sentiment that society is in decline, is thriving in Europe. Indeed, between 2006 and 2012, approximately 50 percent of the adult population could be classified as a societal pessimist. This article aimed to examine to what extent societal pessimism is itself a reflection of political and economic developments. On the one hand, we expected political characteristics – supranationalization, political instability, and corruption – to drive societal pessimism because they signal and strengthen (the impression of) collective powerlessness to change the status quo. On the other hand, we suggested that societal pessimism may find its roots in economic developments – falling social benefits, economic decline – that increase citizens’ socioeconomic vulnerability.
Our multilevel models separate within-country, longitudinal variance from cross-national variance. Intriguingly, economic factors such as economic growth and unemployment rates significantly affect longitudinal, within-country differences, but do not explain structural, cross-national differences in societal pessimism. This is remarkably similar to recent findings in political trust research. In contrast, cross-national differences in societal pessimism depend mostly on political determinants: corruption and governmental instability increase it. The only exception to this pattern is the political factor of net EU payments, which explains the longitudinal variation. Contrary to our expectations, societal pessimism is lower in new EMU countries than in non-EMU nations, possibly because joining the EU reflects positive developments in a country or because citizens welcome the supervision of their government.
It is theoretically remarkable that welfare state retrenchment has no significant effect on societal pessimism, either in the cross-national or in the longitudinal analyses. Theorists have considered welfare state retrenchment to be a particularly stressful and pervasive feature of contemporary society (e.g. Bauman, 2006, 2007; Samuelson, 1995). Nevertheless, empirically, we find no evidence that it relates to societal pessimism. Possibly, the stress associated with welfare state retrenchment may not be due to the level of benefits (as we tested in this article), but instead to citizens’ eligibility and access.
Overall, our models explain most cross-national variance in societal pessimism (68%), but relatively little of the longitudinal variance (25%). These longitudinal changes may follow more idiosyncratic events such as scandals or terrorist threats that are likely to have a similar short-term impact on societal pessimism as they do on political trust. Moreover, this study faced serious data limitations when it came to unpacking the underlying causal chain. To do this adequately would require more and different types of information from our respondents. To the extent that societal pessimism can be understood as an evaluation of political and economic contexts, we ought to find (1) that citizens correctly interpret the macro-factors we study. This is assumed in research on context effects on public opinion, and is shown to be the case for some factors such as corruption (Hakhverdian and Mayne, 2012). Therefore, although it is likely that citizens could learn about the state of the economy, the unemployment rate, or net EU payments through the media or government statements, the causal test would be improved with tests of citizens’ knowledge of those factors. Furthermore, we ought to find that (2) the macro–micro relationships central in this study are mediated by citizens’ evaluations, and (3) that citizens extrapolate current trends to a distant (but not necessarily too distant) future. The focus on citizens’ knowledge, evaluations, and temporal extrapolations seems to be a fruitful path for future research on the roots of societal pessimism, albeit one that requires new and more detailed survey measures.
Nevertheless, this study establishes that societal pessimism is indeed partly rooted in (or, rather, is a reflection of) the political and economic context. Cross-national differences and longitudinal changes in economic and political performance are clearly perceived by citizens. At least to some extent, people become pessimistic about society for good reasons. This means that sociologists and political scientists should not interpret societal pessimism as a superficial mood or a psychological attribute. Moreover, future research should pay more attention to other objective circumstances that contribute to societal pessimism. Beyond the economic and political factors, other societal developments deserve scrutiny. One can think of immigration flows, which could be experienced as a cultural decline, but also the emigration from rural areas that face a very concrete deterioration in the form of empty houses and fewer shops and public facilities.
This conclusion has two implications for society. On the one hand, there is a risk that enduring societal pessimism – itself caused by political instability and/or economic recession – induces further stagnation and pessimism. On the other, these very same political and economic roots of societal pessimism imply that such a self-fulfilling prophecy can be offset by changes in the institutions and policies that we find here to affect societal pessimism. Such changes could include less political instability (changes in government), dealing with corruption hands-on, and formulating economic policies to support economic growth and bring down unemployment. Political leaders do not, therefore, have to sit back and watch societal pessimism take its course.
Footnotes
Appendix
| Model 3 |
||||
|---|---|---|---|---|
| Pessimists |
Undecided |
|||
| b | SE | b | SE | |
| Individual attitudes | ||||
| Gender (male) | 0.23* | 0.01 | 0.20* | 0.01 |
| Age (ref.: 40–54) | ||||
| 15–24 | −0.23* | 0.02 | −0.22* | 0.02 |
| 25–39 | −0.10* | 0.01 | −0.10* | 0.02 |
| 55+ | −0.18* | 0.01 | −0.11* | 0.02 |
| Education (ref.: medium) | ||||
| Low | 0.27* | 0.01 | 0.15* | 0.02 |
| High | −0.33* | 0.01 | −0.20* | 0.13 |
| Student | −0.38* | 0.02 | −0.27* | 0.03 |
| Occupation status (ref.: employed) | ||||
| Unemployed | 0.48* | 0.02 | 0.20* | 0.02 |
| Other | 0.01 | 0.01 | 0.03 | 0.02 |
| Community (ref.: small town) | ||||
| Rural village | 0.04* | 0.01 | 0.03* | 0.01 |
| Large town | −0.07* | 0.01 | −0.05* | 0.01 |
| L2: Country-wave level: political | ||||
| Centered net EU payment | 0.20* | 0.05 | 0.11* | 0.04 |
| Centered changes government | ||||
| Event early elections | −0.22* | 0.12 | −0.01 | 0.08 |
| Event elections | 0.18* | 0.07 | −0.01 | 0.05 |
| Centered corruption | ||||
| L2: Country-wave level: economic | ||||
| Centered change social benefits | ||||
| Centered GDP growth | −0.16* | 0.04 | −0.07* | 0.03 |
| Centered unemployment | 0.08* | 0.01 | 0.05* | 0.01 |
| Centered inflation | 0.02 | 0.02 | 0.00 | 0.01 |
| L3: Country level: political | ||||
| Mean net EU payment | ||||
| EMU (ref. = no euro) | ||||
| New euro countries | −0.45* | 0.23 | 0.26 | 0.22 |
| Established euro countries | −0.04 | 0.20 | 0.31* | 0.18 |
| Changes in government 2000–2011 | 0.16* | 0.06 | 0.11* | 0.05 |
| Early elections 2000–2011 | −0.28 | 0.34 | 0.60* | 0.32 |
| Mean elections | −0.69 | 1.04 | −1.00 | 0.97 |
| Mean corruption | 0.16* | 0.06 | 0.16* | 0.05 |
| L3 Country level: economic | ||||
| Mean change in social benefits | ||||
| Mean GDP growth | ||||
| Mean unemployment | ||||
| Mean inflation | ||||
| Explained variance | ||||
| Country-wave level % | 25 | 20 | ||
| Country level % | 68 | 64 | ||
SE: standard error; EU: European Union; GDP: gross domestic product; EMU: European Monetary Union.
Multinomial multilevel analysis with three levels; PQL second-order estimates; reference category = optimists.
b-coefficients are log odds; asterisks indicate significant with *p < 0.05 (one-sided tests).
Models control for Survey wave.
Funding
The author(s) received no financial support for the research, authorship, and/or publication of this article.