



Abstract
Conventional two-dimensional image-based methods are limited in measuring the three-dimensional morphology of tobacco stems, especially thickness and curved geometry. This study proposes a point-cloud-based method for three-dimensional tobacco stem measurement using a dual-laser scanning system. The method combines improved centerline skeleton extraction, upper–lower surface registration, and skeleton-guided cross-sectional analysis to estimate length, width, thickness, and fineness. Adaptive neighborhood re-weighting and curvature-constrained regularization are introduced to improve skeleton extraction, and reference-assisted registration is used to support thickness measurement. For a standard gauge block, the proposed method achieved mean absolute errors below 0.009 mm and root mean square errors below 0.011 mm for length, width, and thickness measurements. Validation on 30 tobacco stem samples showed good agreement with the YC image-based method for length and width, with correlation coefficients of 0.998 and 0.997, respectively. The results demonstrate the feasibility of thickness-aware three-dimensional morphological measurement of tobacco stems under the tested conditions.
Keywords
Introduction
Tobacco stems are a crucial component of cigarette blends, directly influencing filling capacity, combustion behavior, and smoke composition. Accurate characterization of their morphological parameters is therefore of great significance for process optimization and quality evaluation in tobacco production. 1
Image-based inspection remains the dominant approach for tobacco morphology measurement. ISO 20193:2019/Amd 1:2021 and YC/T 606-2024 both rely on two-dimensional (2D) image analysis for geometric parameter determination.2,3 Liu et al. proposed a digital image-based method for measuring tobacco strand width 4 and Wang et al. improved the segmentation of overlapped tobacco shreds by combining Mask RCNN with a COT algorithm. 5 However, 2D methods infer geometry from planar projections and thus have inherent limitations for irregular three-dimensional (3D) structures. They may underestimate length, overestimate width, and perform poorly under 3D overlapping, curling, or stacking conditions. More importantly, they cannot directly provide thickness information. Wang et al. investigated tobacco shred point cloud segmentation and measurement based on an improved PointNet++ network with a DTC algorithm, providing a representative example of extending tobacco morphology measurement from 2D image analysis to 3D geometric characterization. 6 With the development of 3D sensing and point cloud analysis, 3D measurement methods have shown strong potential for irregular biological materials. Harandi et al. reviewed 3D data processing techniques for plant phenotyping, 7 Liang et al. demonstrated quantitative 3D characterization of irregular surface structures using LiDAR, 8 and Corcoran et al. reported automated extraction of pod phenotype data from micro-CT. 9 Compared with 2D imaging, point clouds preserve more complete spatial geometry and provide a better basis for simultaneous evaluation of length, width, and thickness. Nevertheless, tobacco stems are typically slender, curved, thin, and locally non-uniform, making their point cloud highly sensitive to noise, uneven sampling density, and local geometric instability. Under such conditions, robust centerline extraction becomes particularly critical because it directly affects cross-sectional analysis and dimensional measurement.
In the field of skeleton extraction, curve skeletons have been defined and computed using the medial geodesic function. 10 A mesh contraction-based skeleton extraction method has been proposed, 11 and contraction-based approaches have been further extended to point clouds through Laplacian-based contraction. 12 The L1-medial skeleton for point clouds has also been introduced, 13 and a comprehensive review of 3D skeleton extraction methods has been presented. 14 Although these studies have established an important foundation for centerline representation, most existing methods were developed for relatively regular or volumetric objects. When applied to highly curved, thin, and noisy tobacco stem point clouds, they may still suffer from skeleton breakage, local drift, or over-contraction, thereby reducing measurement accuracy and stability. Recent studies have also provided new support for point cloud processing and registration in 3D measurement tasks. Advances, challenges, and future directions in point cloud registration have been systematically reviewed, 15 while recent progress in deep learning-based rigid point cloud registration has been summarized. 16 In addition, point cloud segmentation methods for understanding 3D indoor scenes have been reviewed, 17 and low-overlap point cloud registration for complex scenarios has been analyzed. 18
These studies indicate that current point cloud processing methods are increasingly moving toward task-oriented optimization; however, they are still primarily designed for general 3D scenes rather than slender and curved biological structures. Similar optimization-driven strategies have also been explored in other domains. Özkan et al. 19 proposed an optimization-driven hybrid machine learning framework for brain tumor classification, integrating metaheuristic feature selection to improve task-specific performance. Cicek et al. 20 developed a metaheuristic optimization approach for orthodontic growth stage detection based on chaotic connectivity matrices and fractal dimension analysis. Although these studies address different applications, they consistently show that incorporating optimization mechanisms tailored to data characteristics can significantly enhance performance. This perspective is relevant to the present work, where the main challenge lies in adapting a classical skeletonization framework to slender, curved, and noise-affected tobacco stem point clouds.
Accordingly, this study develops an improved Laplacian contraction-based method for tobacco stem point clouds by introducing adaptive neighborhood re-weighting and curvature-constrained regularization. On this basis, a practical 3D morphology measurement pipeline is established by integrating dual-sensor point cloud acquisition, upper-lower surface registration, centerline extraction, and orthogonal cross-sectional analysis for quantitative evaluation of tobacco stem length, width, and thickness. The main contributions of this work are as follows:
(1) An improved centerline skeleton extraction method is proposed for slender and curved tobacco stem point clouds by incorporating adaptive neighborhood re-weighting and curvature-constrained regularization into the Laplacian contraction framework. (2) A task-oriented 3D morphological measurement pipeline is established for tobacco stems, integrating dual-sensor point cloud acquisition, registration, improved centerline extraction, and orthogonal cross-sectional analysis. (3) The proposed method is validated through standard gauge block experiments, comparative skeleton extraction analysis, and tobacco stem measurements, demonstrating its effectiveness for thickness-aware 3D morphological evaluation.
Materials and methods
Experimental materials and 3D data acquisition system
To obtain high-precision three-dimensional morphological data of tobacco stems, a dual-laser displacement-based 3D scanning system was developed, as illustrated in Figure 1. The core components of the system include two Aerotech high-precision two-axis motion stages and two Keyence LJ-X8080 laser displacement sensors. The sensors employ a 405 nm blue laser beam, controlled via a dedicated controller that manages laser emission, signal acquisition, and data transmission. The system achieves a static repeatability of 0.5 μm along the Z-axis and 2.5 μm along the X-axis, enabling highly accurate detection of subtle surface variations on the tobacco stems.

Structure of the 3D point cloud acquisition system.
To simultaneously capture both the upper and lower surfaces of each stem, the two sensors were mounted on independent motion stages arranged in a vertically symmetrical configuration. A high-transmittance glass substrate was positioned between the sensors to serve as the sample platform. The glass plate, characterized by excellent flatness and optical transparency, effectively minimizes reflection, and refraction errors during scanning. Each tobacco stem sample was laid flat at the center of the glass substrate to ensure that it remained within the focal ranges of both sensors.
During scanning, the upper and lower motion stages performed synchronized reciprocating movements within the X-Y plane, coordinated by the central control system. In each scanning pass, the stage moved continuously along the primary scanning direction (X-axis) while the sensors acquired line-laser cross-sectional profiles at fixed intervals. After completing one scan line, the stage stepped incrementally along the secondary scanning direction (Y-axis), thereby achieving full-area coverage of the sample. By registering and fusing the point cloud data acquired from the upper and lower sensors, a complete 3D point cloud model of the tobacco stem was reconstructed.
All motion control tasks were coordinated by an Aerotech controller, ensuring submicron-level positioning accuracy and high-speed synchronized sampling. To minimize environmental vibration and optical interference, the entire setup was mounted on a vibration-isolated optical table, and the ambient illumination was maintained at a constant level. The acquired point cloud data were transmitted in real time to the host computer for storage and processing, providing high-quality 3D data for subsequent point cloud registration, morphological parameter extraction, and statistical analysis.
To verify the effectiveness and reliability of the proposed 3D morphological measurement method, the experimental design consisted of two parts. First, standard gauge blocks were used to quantitatively evaluate the measurement accuracy of the developed system. Subsequently, the method was applied to actual tobacco stem samples to examine its applicability and to analyze their three-dimensional morphological characteristics. This integrated validation scheme provides a comprehensive assessment of the proposed method in terms of accuracy, practical applicability, and morphological characterization.
Synchronized triggering between the motion stage and the laser sensors enabled line-by-line scanning of stationary samples. The sequential two-dimensional cross-sectional profiles were then combined to reconstruct a complete three-dimensional point cloud of each specimen.
Point cloud preprocessing algorithm
The original laser-scanned point cloud contains approximately 12.8 million points, as shown in Figure 2. The raw data typically include points from the target specimen, the supporting platform, and random noise introduced by environmental or instrumental errors. Unprocessed point clouds not only affect the extraction of geometric features but also increase computational complexity.

Raw point cloud data of the tobacco stem: (a) upper surface, (b) lower surface.
To ensure analytical validity and computational efficiency, this study establishes a systematic point cloud preprocessing pipeline that includes spatial cropping, density filtering, instance segmentation, and data regularization. Such multi-stage preprocessing has been widely adopted in 3D reconstruction and measurement systems to remove redundant data and structure raw point cloud for subsequent analysis.21–23
Region of interest (ROI) extraction based on spatial coordinate cropping
During the 3D scanning process, the surface of the supporting platform often occupies a considerable proportion of the captured point cloud data. The presence of these background points can significantly interfere with the accurate analysis of the target object. To address this issue, a Region of Interest (ROI) extraction method based on Z-coordinate spatial cropping was proposed in this study. By analyzing the spatial distribution differences between the tobacco stem and the supporting platform along the vertical (Z) axis, the method enables rapid and effective background removal.
The core principle of this approach lies in exploiting the coordinate separation characteristics between the target object and the background along the Z-axis. Through statistical analysis and observation of the point cloud distribution, an appropriate Z-coordinate threshold range was determined. Points falling within this range were retained as valid data, while those outside the range were discarded as background noise. The resulting ROI extraction outcome is illustrated in Figure 3.

ROI extraction results.
Compared with traditional segmentation methods based on shape recognition, the proposed approach eliminates the need for complex model fitting. It relies solely on spatial coordinate features to achieve fast and accurate background separation, effectively preserving the complete geometric integrity of the target object while maintaining high processing efficiency.
Outlier removal based on density analysis
After ROI extraction, isolated or outlier points still exist within the point cloud. These outliers mainly originate from sensor measurement errors, ambient light interference, and uneven surface reflectivity of the material. Such points typically appear as isolated points or small clusters in space, and if not removed, they can significantly affect the accuracy of subsequent clustering, segmentation, and feature extraction processes.
In this study, the Statistical Outlier Removal (SOR) algorithm was employed to eliminate measurement noise. 23 The method is based on statistical principles: the neighborhood distance distribution among normal points is relatively concentrated, whereas noise points exhibit significant deviations. 24 This allows for robust outlier removal while preserving the geometric structure of the tobacco stem.
For each point

where

Outlier removal results.
Instance segmentation and labeling based on Euclidean distance
After noise removal and background elimination, it is necessary to separate the clustered point cloud of multiple tobacco stems into individual entities—a process known as instance segmentation. In this study, a Euclidean distance-based clustering algorithm was employed to achieve this goal. The algorithm is founded on the principle of spatial proximity, enabling accurate identification and separation of distinct physical objects within the scene.
The Euclidean clustering algorithm is based on an intuitive physical assumption: points belonging to the same tobacco stem are spatially adjacent in 3D space, whereas points from different stems are separated by a clear spatial gap. The algorithm determines whether two points belong to the same physical entity by calculating the Euclidean distance between them. 25
In the point cloud dataset, the Euclidean distance between any two points

The clustering process is based on the following criterion: for any two points
Specifically, a k-d tree spatial index is constructed to accelerate neighborhood searches, with a distance threshold of S = 0.3 mm serving as the clustering criterion. In addition, a minimum point threshold of 100 is applied to effectively remove scattered points and residual background noise. Although this may result in a few extremely small or sparse tobacco stems not being identified, the impact on the overall analysis remains negligible. This point-scale filtering strategy is widely adopted in point cloud segmentation studies, as it improves the robustness of the algorithm while preserving the integrity of the primary analysis objects.
After instance segmentation, each independent cluster is assigned a unique identifier to establish a structured data management framework. As shown in Figure 5, this labeling system facilitates subsequent morphological parameter calculations and statistical analyses for each individual stem, enabling us to trace each measurement back to its original dataset and thereby enhancing the repeatability and reliability of experimental results.

Instance labeling of tobacco stem clusters.
Voxel grid-based data regularization
Raw point cloud data often exhibit uneven density and contain a massive number of points, which not only increases computational complexity but also introduces redundant information. The voxel grid downsampling method (Voxel Grid) addresses this issue by constructing a uniform three-dimensional grid structure that reduces data density while preserving the morphological characteristics of the tobacco stem, thereby achieving structured regularization of the point cloud data.
The three-dimensional space is divided into evenly spaced voxel grids, and all points within each voxel are replaced by their centroid, calculated as follows:

where
Through the above preprocessing, the point cloud data are effectively denoised and compressed, retaining essential geometric features while minimizing redundancy. This process provides a reliable foundation for subsequent centerline skeleton extraction and three-dimensional morphological parameter computation.
Improved centerline skeleton-based method for 3D morphological measurement of tobacco stems
Improved Laplacian contraction for tobacco stem centerline skeleton extraction
Accurate extraction of the centerline skeleton is essential for reliable three-dimensional measurement of tobacco stem morphology. However, tobacco stems are slender, curved, and locally non-uniform, and their point clouds are often affected by uneven density and noise. In such cases, conventional skeletonization methods may cause skeleton breakage, local drift, or over-shrinkage. In particular, classical Laplacian contraction is more suitable for geometrically regular point cloud but is less stable for curved filamentary structures such as tobacco stems. Therefore, this study introduces adaptive neighborhood re-weighting and curvature-constrained contraction to improve the continuity, robustness, and geometric fidelity of the extracted centerline skeleton.
For a point


where
To enhance local geometric adaptability, an adaptive neighborhood re-weighting strategy is introduced. Instead of using uniform averaging, each neighboring point is assigned a weight according to its distance to the current point. The weighted contraction term is defined as

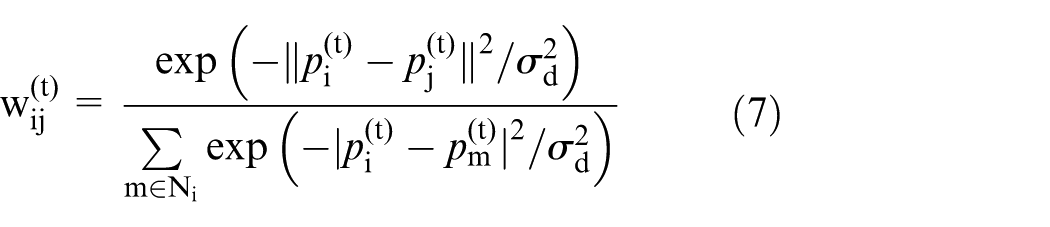
where
To further reduce local drift and over-shrinking in highly curved regions, a curvature-constrained term is introduced. Let the local discrete curvature of the ordered centerline points be approximated by a second-order difference term. For point

This term reflects the local bending tendency of the curve and acts as a second-order smoothness constraint. By incorporating this term into the contraction process, excessive oscillation and undesired geometric distortion can be suppressed, especially in curved sections of the tobacco stem.
Accordingly, the final iterative update equation of the proposed method is written as

where
After iterative contraction, the point cloud gradually converges toward the medial region of the tobacco stem. To obtain a continuous centerline suitable for morphological measurement, the contracted point cloud is further organized into an ordered skeleton representation according to its principal direction. Isolated points and unstable local branches are removed, and a B-spline interpolation is then applied to generate a smooth three-dimensional centerline. This process ensures that the final skeleton is continuous and differentiable enough for subsequent length calculation and orthogonal cross-sectional analysis.
In the implementation, the neighborhood size k, contraction step size λ, curvature constraint coefficient μ, and iteration number T jointly affect the contraction stability and the quality of the extracted skeleton. Among them, k determines the scale of the local neighborhood, λ controls the contraction speed, μ balances the strength of the curvature regularization term, and T determines the contraction degree after iterative updating. These parameters were selected empirically based on experimental tests to achieve a balance between centerline smoothness and computational efficiency. In this study, the parameters were set to k = 15, λ = 0.1, μ = 0.05, and T = 50, which yielded stable centerline extraction results for tobacco stem point clouds.
In the practical implementation, the contracted point set was first ordered according to its dominant geometric trend obtained from principal direction analysis, and the point sequence is then refined using nearest-neighbor connectivity to form an ordered centerline path. Isolated points and unstable local branches were identified based on local connectivity and relative spatial continuity with respect to the main path, and were removed before curve fitting. After branch cleaning, a B-spline curve was fitted to the ordered centerline points to generate a smooth continuous skeleton. The fitted spline was then sampled at uniform arc-length intervals to support subsequent computation of tangent vectors and local cross-sectional measurements.
The extracted centerline skeleton effectively characterizes the spatial curve morphology of the tobacco stem and provides the geometric basis for the subsequent computation of length, width, and thickness. A quantitative comparison with other representative skeleton extraction methods is presented in Section 4. Using the first nine samples (labeled by ID), Figure 6 presents the extracted skeleton results of nine different tobacco stems. The red curves represent the fitted centerlines of the stems, while the green points correspond to the original point cloud. It can be observed that the proposed skeleton extraction method successfully produces continuous and smooth centerlines across samples with varying shapes, curvature, and thickness, effectively capturing the principal geometric axes of the stems.

Skeleton extraction results of different tobacco stem samples: (a) stem1, (b) stem2, (c) stem3, (d) stem4, (e) stem5, (f) stem6, (g) stem7, (h) stem8, and (i) stem9.
Improved length and width extraction based on the centerline skeleton
The three-dimensional morphological parameters of tobacco stems include length, width, and thickness (height). The core of this analysis lies in leveraging the geometric constraints provided by the centerline skeleton, with robust dimensional measurements obtained through orthogonal cross-sectional analysis. The proposed method in this study consists of three components: length calculation, width calculation, and height calculation.
After extracting the skeleton from the point cloud data, a discretized centerline represented by an ordered set of points is obtained. Since the skeleton effectively captures the overall geometric trajectory of the object, its arc length serves as a reliable measure of the stem’s length.The total length L is calculated by cumulatively summing the Euclidean distances between consecutive skeleton points:

where
For measuring local dimensions, a series of orthogonal cross-sections are generated along the skeleton. To achieve this, uniformly spaced key points
Next, points from the original point cloud located within a specified thickness range on both sides of the normal plane (e.g. ±0.1 mm) are extracted to form the local cross-section
Width measurement is based on the 2D distribution of points within each cross-section. The cross-sectional point set is projected onto the normal plane, and Principal Component Analysis (PCA) is applied to obtain the principal eigenvectors of the covariance matrix. The first principal component

Finally, the average width

The local coordinate system for cross-sectional analysis is constructed based on the skeleton tangent vector and the PCA-derived principal direction. This formulation is theoretically valid when the local point distribution is sufficiently dense and exhibits a clear anisotropic structure. However, in practical scenarios, such as sparse sampling, noise contamination, or irregular cross-sectional shapes, the PCA-based principal direction may become unstable. This instability may further affect the definition of the orthogonal height direction derived from the cross product, potentially impacting the accuracy of dimensional estimation.
To improve robustness, two stabilization strategies are introduced in this study. First, a smoothing strategy is applied to the width measurements across adjacent cross-sections. Specifically, a sliding window averaging method is used to reduce local fluctuations and ensure continuity of width estimation. Second, for thickness estimation, instead of using a global direction, a local PCA-based direction is computed for each cross-section. This allows the method to adapt to local geometric variations and improves the stability of thickness measurement under irregular and noisy conditions.
The orthogonal height direction is constructed using the cross product between the skeleton tangent vector and the width direction. This formulation ensures that the local coordinate system is mutually orthogonal. Although this assumption is generally valid for slender structures, the proposed stabilization strategies further enhance its robustness under non-ideal conditions.
Thickness measurement based on point cloud registration
Point cloud registration
Building upon the width measurement, characterization of the three-dimensional thickness of tobacco stems requires determination of the local height at each sampling point along the stem axis. Such a measurement can only be achieved when the upper and lower surface point clouds are accurately aligned within a unified coordinate system.
During three-dimensional data acquisition, the upper and lower surfaces are captured independently by a dual-sensor system. Owing to installation tolerances of the sensors and motion errors of the two-dimensional displacement platform, the acquired point cloud generally exhibit systematic coordinate offsets and global pose discrepancies. These deviations prevent direct correspondence between the two surfaces and would inevitably propagate into the thickness estimation if left uncorrected. Reliable thickness measurement therefore depends on an effective point cloud registration procedure performed prior to geometric analysis.
In principle, conventional point cloud registration methods, including ICP directly and feature-based matching approaches, require sufficient overlapping regions or stable geometric correspondences between the source and target point cloud. This requirement is difficult to satisfy in the present study because the two sensors separately acquire the upper and lower surfaces of the tobacco stem, which are nearly parallel and provide limited overlapping features. Under such conditions, direct application of standard registration methods is unlikely to recover the true spatial relationship between the two surfaces and cannot provide a sufficiently reliable basis for subsequent thickness computation.
To overcome this limitation, a reference-assisted registration strategy was introduced. By incorporating an external geometric reference into the scanning process, the systematic spatial relationship between the upper and lower surface point cloud can be established before further alignment refinement. In the experiment, a first-grade standard block with nominal dimensions of 10 mm × 4 mm × 1 mm was placed together with the tobacco stem sample within the scanning area. The laser scanners captured the point cloud of the block’s upper and lower surfaces, serving as geometric references. After point cloud preprocessing and block region segmentation, the center point of the block and the midpoints along its length and width directions were selected as reference feature points. The average coordinate differences between the upper and lower surfaces were then calculated. The registration transformation is defined as:

where
This approach effectively eliminates the systematic misalignment caused by dual-sensor installation errors, allowing the upper and lower surfaces of the tobacco stem to be precisely aligned within the same coordinate system. This provides a reliable foundation for subsequent 3D morphological reconstruction and thickness measurement.
During the coarse registration stage, PCA is performed separately on the upper and lower surface point cloud to extract their principal direction vectors (i.e. the eigenvectors corresponding to the largest eigenvalues). The rotation matrix is then constructed by calculating the angle and rotation axis between the principal directions of the two surfaces, ensuring consistency along the main axis. Subsequently, the geometric centroids of the two point cloud are aligned to achieve initial spatial overlap. This step effectively removes overall rigid-body errors caused by differences in sensor orientation and measurement positions, providing a stable initial condition for the subsequent ICP fine registration.
In the fine registration stage, the ICP algorithm is employed to perform rigid-body registration of the upper and lower surface point cloud by iteratively minimizing the point-to-point distance, with the objective function defined as:

where
By iteratively solving the ICP optimization, the registration residual is progressively minimized, yielding the optimal rigid-body transformation matrix. Figure 7 presents a representative visualization of the registration result, where the green points denote the upper-surface point cloud and the red points denote the registered lower-surface point cloud. The visual overlap indicates that the proposed method can establish a consistent spatial relationship between the upper and lower surfaces.

Point cloud registration results.
To further assess the registration performance quantitatively, the changes in XY mean residual error and XY RMSE before and after registration are summarized in Table 1, and their corresponding comparisons are illustrated in Figure 8(a) and (b), respectively. The results show that both error metrics decrease consistently after registration for all displayed samples. On average, the XY mean residual error is reduced from 0.247 mm before registration to 0.120 mm after registration, corresponding to an average reduction of 49.1%. Meanwhile, the XY RMSE decreases from 0.332 to 0.149 mm, corresponding to an average reduction of 53.2%. These results demonstrate that the proposed registration strategy effectively improves the alignment accuracy between the upper and lower surface point cloud, thereby providing a reliable geometric basis for subsequent thickness computation.
Quantitative comparison of registration accuracy before and after registration.


Comparison of registration errors before and after registration: (a) XY mean residual error and (b) XY RMSE.
Thickness measurement
After obtaining the finely registered upper and lower surface point cloud, this study employs a local projection-based method to quantitatively characterize the thickness distribution of the tobacco stem. Since the height direction should be orthogonal to both the length and width directions, the normal plane for cross-sectional analysis must be further defined. At each skeleton point along the length, the first principal component vector u 1 (width direction) and the skeleton tangent vector t j have already been determined via PCA. The orthogonal height direction vector u 2 can then be obtained using the vector cross product:

where

However, in real point cloud data, measurement noise and local surface burrs often cause skewed height distributions, thereby affecting the accuracy of thickness estimation. To address this issue, before calculating the local height, the projected point set is first subjected to a statistical analysis. Let the projection values along the height direction be denoted as

where
To enhance robustness, this study removes a fixed proportion of extreme values at both ends of the distribution (e.g. the upper and lower 2.5% quantiles) and recalculates the truncated height range. This approach effectively reduces the influence of local noise points on the overall height estimation, resulting in more stable and reliable local thickness measurements.
Finally, the average height

Experimental results and analysis
System accuracy verification
To quantitatively evaluate the absolute accuracy of the proposed measurement system, a grade-1 standard gauge block with nominal dimensions of 10.00 mm × 4.00 mm × 1.00 mm was selected as the test object. The block was scanned 10 times, with its position randomly reset after each scan to introduce pose perturbations. After each acquisition, the length, width, and thickness parameters were measured independently. The measurement results are shown in Table 2.
Measurement results of the standard gauge block.

To evaluate the deviation between the measured results and the true values, the Mean Absolute Error (MAE) and Root Mean Square Error (RMSE) were used as the core indicators, defined as follows:

where x i represents the i-th measured value, xref denotes the reference (true) value of the standard gauge block, and n is the number of repeated measurements. The experimental results are shown in Table 3.
As shown in Table 3, the system achieved mean absolute error (MAE) values below 0.009 mm and root mean square error (RMSE) values below 0.011 mm for the standard gauge block in length, width, and height measurement. These results indicate that the measurement system can recover simple rigid geometry with good accuracy and repeatability under controlled conditions. However, this experiment mainly verifies the acquisition and reconstruction capability of the system for regular objects. The performance of the complete method on slender, curved, and irregular tobacco stems still needs further evaluation, especially regarding skeleton extraction, curved-length estimation, orthogonal cross-sectional analysis, and thickness recovery. The following comparative and sample-based experiments address this gap.
Measurement error results of the standard gauge block.

Comparison of skeleton extraction methods
To evaluate the effectiveness of the proposed skeleton extraction method, comparative experiments were conducted using three representative methods: the classical Laplacian contraction method, the L1-median skeleton method, and the proposed method. A representative tobacco stem sample was selected for visual comparison, and multi-sample statistical results were further used for quantitative evaluation. These comparative methods were selected because they represent three commonly used yet structurally different skeletonization paradigms for point cloud: contraction-based extraction and median-based centerline estimation. By comparing the proposed method against these representative baselines in terms of geometric fidelity, smoothness, and computational efficiency, the advantages of the proposed strategy for slender and curved tobacco stem point clouds can be more directly evaluated.
Figure 9 shows the skeleton extraction results of the three methods on a representative sample. The classical Laplacian method produces a skeleton with noticeable local deviations and shrinkage effects. The L1-median skeleton method exhibits less stable behavior in curved or sparse regions, resulting in a less regular skeleton path. In contrast, the proposed method generates a smoother and more continuous centerline that better follows the overall geometric trend of the tobacco stem. This indicates that the proposed strategy is more suitable for slender and curved tobacco stem point clouds.

Visual comparison of skeleton extraction results for a representative tobacco stem sample: (a) classical Laplacian method, (b) L1-median skeleton method, and (c) proposed method.
To further evaluate the performance quantitatively, four representative indicators were selected: length retention ratio, tortuosity, direction change MSE, and runtime. Among them, the length retention ratio reflects whether the extracted skeleton preserves the global geometric extent of the stem; the tortuosity reflects whether the skeleton path is excessively distorted; the direction change MSE evaluates the smoothness and stability of the skeleton; and the runtime reflects computational efficiency. The statistical comparison results over multiple tobacco stem samples are summarized in Table 4. The corresponding statistical comparisons of length retention ratio, direction change MSE, and runtime are further illustrated in Figure 10(a) to (c).
Quantitative comparison of different skeleton extraction methods.

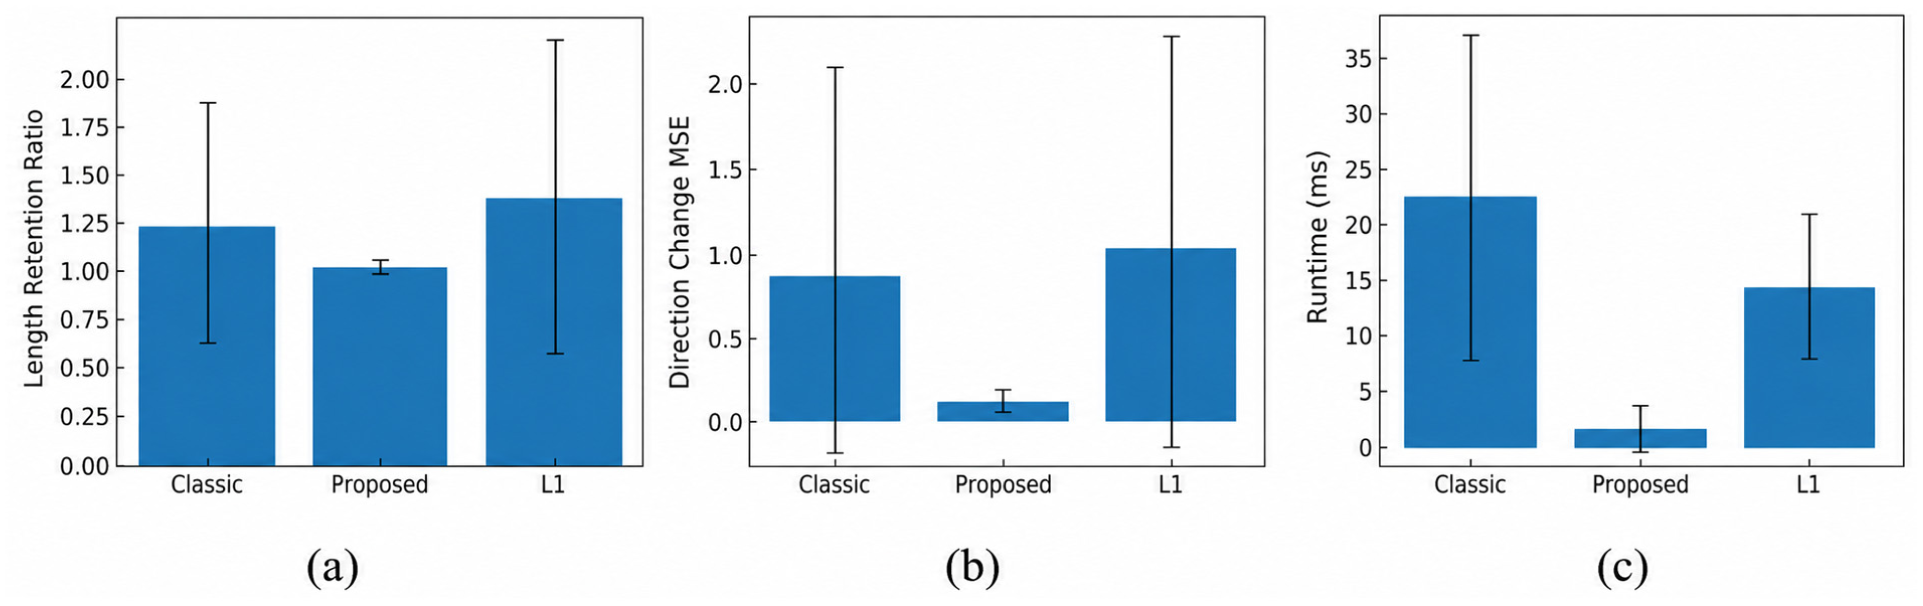
Statistical comparison of skeleton extraction performance for different methods: (a) length retention ratio, (b) direction change MSE, and (c) runtime.
As shown in Table 4 and Figure 10, under the tested tobacco stem samples, the proposed method achieves the best overall performance among the three compared methods. Its length retention ratio is closest to the ideal value of 1, indicating the most faithful preservation of the global geometric extent of the tobacco stem. It also yields the lowest tortuosity and direction change MSE, demonstrating that the extracted skeleton is more geometrically regular, smoother, and more stable than those obtained by the comparison methods. In addition, the proposed method requires the shortest runtime, showing a clear advantage in computational efficiency. Overall, these results indicate that the proposed method provides a better balance among geometric fidelity, skeleton quality, and efficiency, making it more suitable for centerline extraction of slender and curved tobacco stem point clouds.
Robustness evaluation of thickness estimation
Due to measurement noise, local surface irregularities, and occasional outliers in the projected cross-sectional points, direct thickness estimation may become unstable when all local measurements are retained. To improve robustness while preserving the geometric meaning of thickness, a trimming strategy was introduced in this study. Its rationality was evaluated from four perspectives: parameter selection, cross-sample robustness, comparison with alternative robust estimators, and quantitative influence on the final thickness value.
The trimming ratio should be large enough to suppress tail outliers, but small enough to avoid removing valid boundary information. If the ratio is too small, abnormal measurements remain and continue to affect the estimation; if it is too large, the true thickness may be underestimated. To examine this trade-off, several trimming ratios, including 0%, 1%, 2.5%, 5%, and 10%, were tested. As shown in Figure 11, increasing the trimming ratio leads to further reduction in fluctuation, but also causes a gradual deviation of the mean thickness from its original value. Among the tested settings, 2.5% provides a suitable compromise, achieving noticeable stability improvement while introducing only negligible bias. It is therefore adopted in the following analysis.
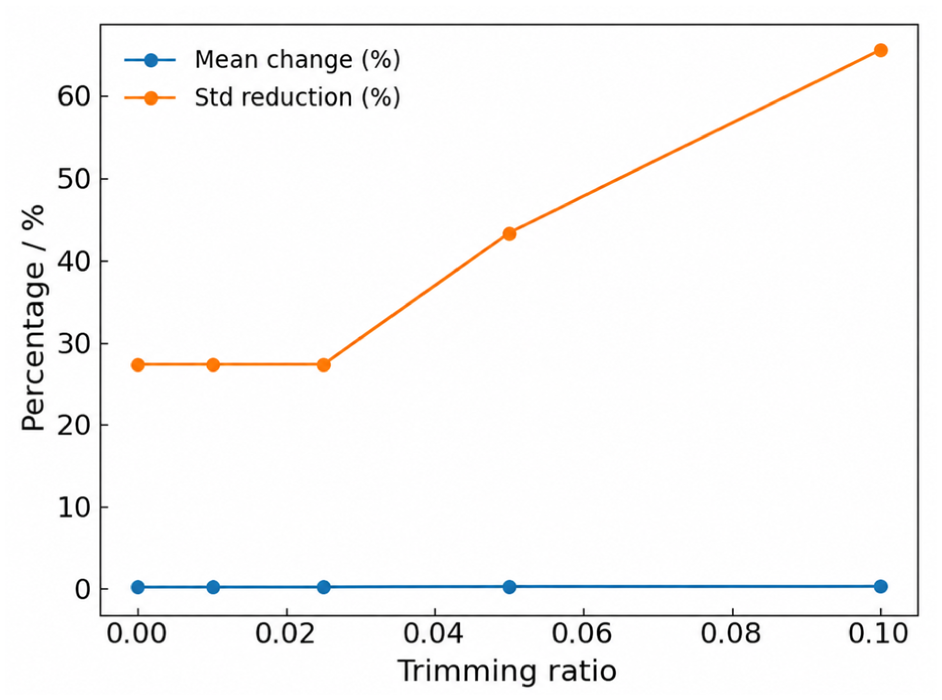
Influence of trimming ratio on thickness estimation.
To evaluate the robustness of this threshold across different samples, the same trimming strategy was applied to multiple tobacco stems with different thickness levels and fluctuation characteristics. The results are summarized in Table 5. It can be seen that the trimmed mean thickness remains very close to the raw mean thickness for all samples, whereas the standard deviation is consistently reduced after trimming. This indicates that the selected threshold maintains stable performance across different sample conditions.
Effect of trimming on thickness estimation across different samples.

Alternative robust estimators, including median-based thickness estimation and quantile-range-based estimation, were also considered. The median-based method is intrinsically less sensitive to outliers, but it mainly reflects the central tendency of the local distribution rather than the geometric extent of the cross-section. Quantile-based estimators show a similar suppression effect on outliers, but do not provide a clear advantage over the present approach. In comparison, the fixed 2.5% trimming strategy offers a more suitable balance among robustness, geometric interpretability, and implementation simplicity for the current task.
The quantitative influence of trimming on the final thickness value was further assessed by comparing the raw mean thickness with the trimmed mean thickness. As listed in Table 6, the difference between these two values is very small for all samples, indicating that trimming introduces only limited bias into the final result. Meanwhile, the reduction in standard deviation shows that the proposed method mainly suppresses abnormal local fluctuations rather than altering the global thickness level.
Quantitative influence of 2.5% trimming on final thickness estimation across different samples.

The mechanism of this improvement can also be observed visually. Figure 12 shows the sorted thickness distributions of three representative samples with different thickness levels and fluctuation characteristics. A small number of extreme values can be observed at the distribution tails, whereas the central part remains relatively concentrated. After trimming, the tail values are effectively removed while the main body of the distribution is preserved. In addition, Figure 13 compares the standard deviation before and after trimming across samples, further confirming the improvement in stability.
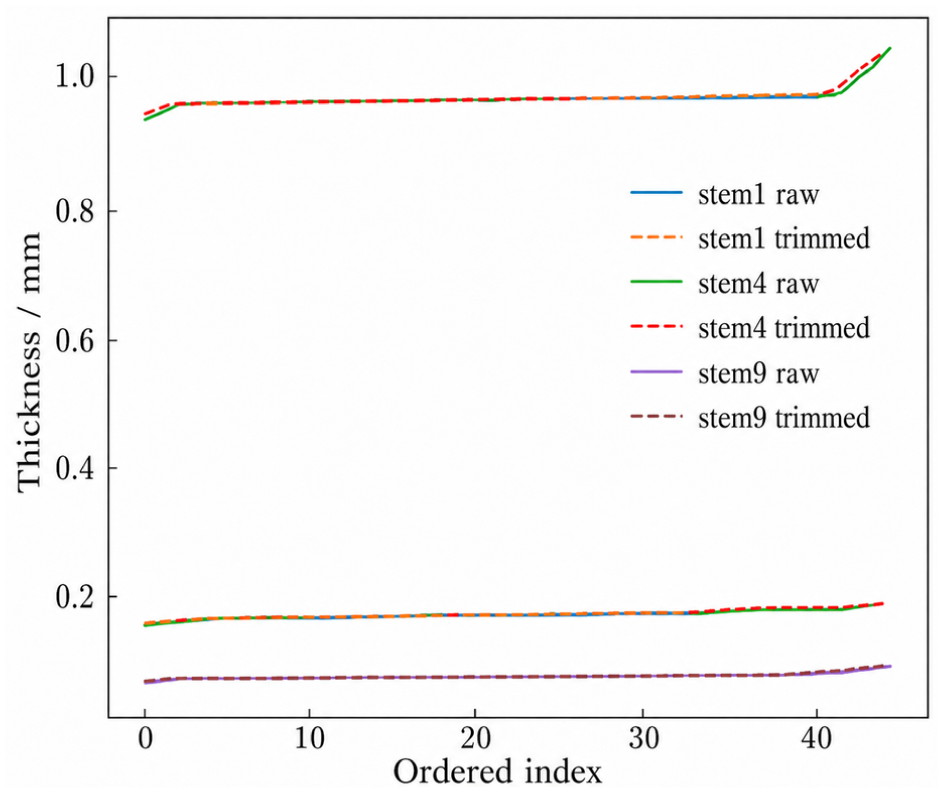
Sorted thickness distributions before and after trimming.
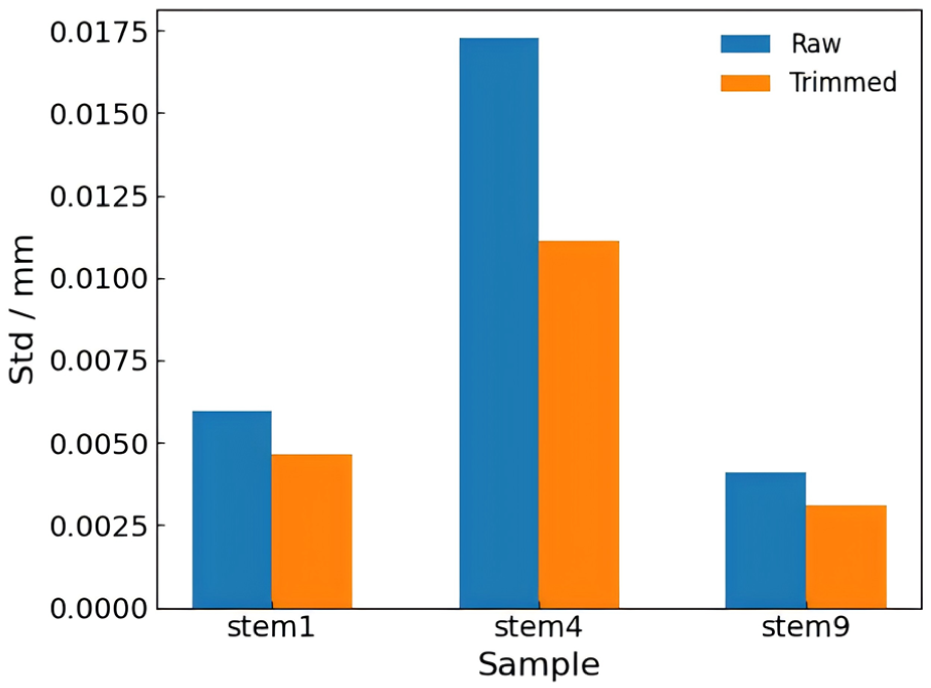
Comparison of thickness standard deviation before and after trimming across samples.
Overall, the results demonstrate that the proposed 2.5% trimming strategy is physically reasonable and statistically effective for the present thickness estimation task. It shows satisfactory robustness across different samples, introduces only minor changes to the final mean thickness, and effectively suppresses abnormal local fluctuations.
Three-dimensional morphological measurement of tobacco stems
After verifying the system accuracy, the three-dimensional morphology of actual tobacco stem samples was further analyzed. The tobacco stem materials used in this study were obtained from Henan Zhongyan Industrial Co., Ltd. The corresponding point cloud data were acquired by the dual-sensor 3D scanning system described in Section 2.1 and preprocessed using the procedures presented in Section 2.2, including ROI extraction, outlier removal, instance segmentation, and voxel-grid regularization. Thirty preprocessed tobacco stems with diverse shapes were selected for measurement.
To further characterize the slenderness of the tobacco stems, a fineness parameter S is defined as

where L, W, and H represent the length, width, and average thickness of the tobacco stem, respectively, and
The fineness parameter S reflects the elongation and flexibility of the tobacco stem along its length and serves as a key indicator for evaluating morphological uniformity and processing adaptability. A larger S value indicates a more slender and pliable sample, whereas a smaller S value indicates a shorter, thicker, and more compact structure.
A total of 30 tobacco stem samples with different morphological characteristics were statistically analyzed. The length, width, height, and fineness of each sample were obtained using the proposed measurement algorithm, and the results are presented in Table 7.
Three-dimensional morphological measurement results of tobacco stems.

The results show that the 30 tobacco stem samples exhibit obvious differences in length, width, height, and fineness, demonstrating that the proposed method can effectively characterize the three-dimensional morphological diversity of tobacco stems. Compared with conventional two-dimensional methods, the proposed method provides more comprehensive morphological information by simultaneously measuring both in-plane and out-of-plane dimensions. To further verify the reliability of the proposed method for measurable dimensions, the measured length and width were compared with those obtained using the standard image-based method specified in YC/T 606-2024, and the detailed results are listed in Table 8.
Comparison of length and width results between the proposed method and the YC image-based method.

The statistical comparison is summarized in Table 9. For length measurement, the mean absolute error was 0.554 mm, the root mean square error was 0.578 mm, and the average relative error was 4.18%. For width measurement, the corresponding mean absolute error, root mean square error, and average relative error were 0.127 mm, 0.148 mm, and 5.63%, respectively. In addition, the correlation coefficients for length and width were 0.998 and 0.997, respectively, indicating that the proposed method agrees well with the standard image-based method across tobacco stem samples with different morphological characteristics.
Statistical comparison between the proposed method and the YC image-based method.

Thickness was not compared with the YC image-based method, because the standard image-based approach is limited to two-dimensional indicators and cannot directly provide thickness information. Its validity in this study is mainly supported by the standard gauge block verification and the registration accuracy analysis in the previous sections. Overall, the results show that the proposed method can effectively characterize tobacco stems with different morphological characteristics, while maintaining good agreement with the YC image-based method in length and width measurement, and further extending the measurable parameter set to thickness.
Discussion
The results indicate that the proposed framework is suitable for tobacco stem point cloud, particularly for skeleton extraction of slender and curved structures. Compared with the reference methods, the extracted centerlines are smoother and more continuous, mainly due to the adaptive neighborhood re-weighting and curvature-constrained regularization, which reduce the influence of uneven sampling and suppress local oscillation in highly curved regions.
The registration results further show that accurate upper-lower surface alignment is essential for reliable thickness estimation. The PCA-based coarse alignment ensures global directional consistency, while ICP refinement reduces local mismatch. This coarse-to-fine strategy improves the spatial consistency of the reconstructed geometry and supports subsequent cross-sectional measurement. For local dimensional analysis, the PCA-based width direction and its orthogonal thickness direction provide a practical local coordinate system for slender stems. In addition, the 2.5% trimming strategy improves thickness robustness by removing extreme values caused by noise and local burrs, while introducing only limited change in the mean value.
The method was further validated on 30 tobacco stem samples with different morphological characteristics. The results show that it can effectively characterize differences in length, width, height, and fineness, while maintaining good agreement with the YC image-based method in length and width measurement. However, thickness could not be directly compared with the YC method, because the standard image-based approach is limited to two-dimensional indicators.
Nevertheless, some limitations remain. The proposed method is still an application-oriented integration of existing point cloud processing techniques, and the stability of the local PCA-based frame depends on sufficient point density and relatively regular cross-sectional geometry. Broader validation under more complex sample conditions is still needed in future work.
Conclusion
This study presented a three-dimensional morphological measurement method for tobacco stems based on dual-sensor point clouds acquisition, centerline skeleton extraction, upper-lower surface registration, and local orthogonal cross-sectional analysis. To improve skeleton extraction for slender and curved tobacco stem point clouds, a contraction strategy incorporating adaptive neighborhood re-weighting and curvature-constrained regularization was introduced. On this basis, a complete pipeline was established for extracting length, width, thickness, and fineness-related morphological information.
The experimental results show that the proposed system achieves good geometric measurement accuracy on a standard gauge block, with MAE values of 0.009, 0.007, and 0.009 mm for length, width, and height, respectively, and corresponding RMSE values of 0.011, 0.009, and 0.011 mm. The PCA-ICP registration strategy further improves upper-lower surface consistency and supports reliable thickness estimation.
Validation on 30 tobacco stem samples shows that the proposed framework can effectively characterize morphological differences in length, width, height, and fineness. Compared with the YC image-based method, the proposed method achieved an MAE of 0.554 mm, an RMSE of 0.578 mm, and an average relative error of 4.18% for length measurement. For width measurement, the corresponding values were 0.127 mm, 0.148 mm, and 5.63%, respectively. The correlation coefficients for length and width were 0.998 and 0.997, respectively, indicating good agreement with the standard method.
Overall, the proposed framework provides a feasible and effective solution for thickness-aware three-dimensional measurement of tobacco stems. Compared with conventional two-dimensional image-based methods, it not only maintains good consistency in length and width measurement, but also extends the measurable parameter set to thickness, thereby providing more complete geometric information for three-dimensional morphological evaluation.
Footnotes

Ethical considerations
Not applicable. This study does not involve human participants, animals, or sensitive personal data.
Consent to participate
Not applicable.
Consent for publication
Not applicable.
Funding
This work was funded by the National Natural Science Foundation of China (Grant No. 52475577).
Declaration of conflicting interests
The authors declared no potential conflicts of interest with respect to the research, authorship, and/or publication of this article.
Data availability statement
The datasets generated and analyzed during the current study are available from the corresponding author on reasonable request.*