
Abstract
A feasibility-guided deep Q-network (FG-DQN) framework for the collaborative optimization of flexible resources is proposed in this paper to enhance power system resilience under extreme events. Targeting the coordinated siting, sizing, and switching of mobile generators, energy storage systems, reactive compensation devices, and reserve interconnections, the resilience enhancement task is formulated as a constrained sequential decision problem under multiple concurrent contingencies. AC power-flow equations, operational-safety limits, and budget constraints are embedded into the environment, and a normalized incremental-potential reward aligned with a composite resilience score is introduced. A width-limited search mechanism for reserve-interconnection selection is further developed to improve computational tractability and execution quality. Simulation results on the IEEE-30 and IEEE-57 systems confirm that more balanced resilience improvements and better overall solution quality can be achieved under unified feasibility checks.
Introduction
In recent years, extreme weather events and cyberattacks have become more frequent, exposing power grids to higher uncertainty and risk and creating the need for coordinated planning, operation, and emergency response. 1 Power system resilience is regarded as a key capability that spans the withstand, adapt, and recover stages and supports critical-load protection and rapid restoration through unified topological and physical representations.2,3
However, under multiple concurrent contingencies, resilience evaluation and operational decision-making are often treated inconsistently in existing studies.4,5 At the same time, the high dimensionality of deployment actions is not handled effectively, and scalable decision structures remain limited. 6 As a result, the treatment of the feasible operating region, the design of reward signals, and the mechanisms for action deployment are still inadequate and require further investigation.
One central challenge is that many control actions explored during training violate AC power-flow and operational-safety limits, and these infeasible actions accumulate in the replay buffer and slow down policy improvement. In Zhao and Wang, 7 distribution-system restoration was framed as a graph-reinforcement-learning sequential decision problem and recovery efficiency was improved, but AC feasibility was not enforced during training and limit-violating samples persisted. In Bedoya et al., 8 deep reinforcement learning under asynchronous information was applied to enhance distribution-system resilience and policy effectiveness was demonstrated, but physical feasibility relied on ex-post checks and ineffective exploration during training could not be prevented. In Zhang et al., 9 a curriculum-based reinforcement learning method was proposed to improve convergence and stability for critical-load restoration, but over-limit and infeasible actions were handled heuristically rather than precluded by design. In Cao et al., 10 a two-timescale, physical-model-free voltage-control scheme was shown to be effective, but training stability still depended on external feasibility verification. In Xie et al., 11 robustness analyses showed that infeasible samples introduced value-function bias and amplified variance accumulation. In Butt et al., 12 deep reinforcement learning for resilient power and energy systems was surveyed and it was argued that embedding physical consistency in the environment remains essential for deployment. In Zimmerman et al., 13 environment-side pre-screening and sample cleaning that remove infeasible actions before replay were discussed, but systematic integration with deep reinforcement learning for resilience remained limited. In parallel, nonconvex optimal PMU placement formulations and related solution strategies have been studied in the context of wide-area monitoring and state estimation.14,15 Mathematical models and algorithms for channel-constrained PMU allocation and arrangement under practical operation settings were also reported.16,17 Cyber-physical security aspects, including complementarity-based reformulations of false-data-injection attacks on PMU-only state estimation, have been investigated as well. 18 Taken together, these studies show that an effective handling mechanism for infeasible actions is urgently needed so that AC power-flow and security limits are enforced within the learning process and physically invalid decisions are filtered before they contaminate the replay buffer.
Furthermore, another critical issue is the misalignment between the reward signal and composite resilience objectives, which leads to policy drift and unstable convergence. In Shi et al., 19 a comparative analysis of resilience metrics in power and control systems was conducted and it was found that inconsistent normalization and weighting across systems undermined the reliability of cross-case conclusions. In Vijay and De, 20 resilience definitions, assessment methods, and enhancement strategies were synthesized and unified metric protocols were called for so that optimization targets and control signals would not become misaligned. In Zhang et al., 21 multi-objective learning in deep-reinforcement-learning-driven resilient dispatch was illustrated, but an explicit mapping consistent with a composite resilience score was not provided. The survey in Yang et al. 22 on reinforcement learning for energy and electric systems underscored that reward design aligned with task objectives is essential for sample efficiency and bias reduction. Taken together, these studies show that, although various resilience metrics and reinforcement-learning based control frameworks have been proposed, many approaches either optimize each indicator separately or aggregate multiple indicators through simple weighted sums, leading to reward signals that remain misaligned with the intended composite resilience objectives. Hence, a normalized incremental, potential-based reward aligned with the composite resilience score is needed to guide coordinated improvement in connectivity, critical-line survival, load-loss ratio, and overload ratio.
Finally, large-scale selection of reserve interconnections and topology configurations introduces significant combinatorial complexity. In Hedman et al., 23 optimal transmission switching was coupled with contingency analysis and discrete topology variables together with tightly coupled security constraints were shown to create heavy computational burdens. In Aziz et al. 24 and Zhou et al. 25 recent studies pointed out that as constraints and candidate sets grow, the combinatorial search space expands rapidly, making a single feed-forward decision unlikely to yield near-optimal solutions within acceptable computational effort when the system scale becomes large. In Chen et al., 26 wildfire-driven cascades were analyzed and the importance of maintaining operational feasibility and consistent constraint handling under extreme scenarios was emphasized. In Gholizadeh and Musilek, 27 multi-timescale multi-agent graph-reinforcement-learning coordination improved economic efficiency and stability in high-renewable distribution networks, but an execution-stage near-optimal subset search for structural actions was not designed. In Tian et al., 28 explainable reinforcement learning for distribution reconfiguration was investigated and it was argued that controllable combinatorial complexity together with physical consistency was essential for deployable robustness. It should be pointed out that, these studies show that the complex topology of large-scale power systems leads to highly complex combinations of reserve interconnections, which in practical systems may also include cross-area emergency support through HVDC links, while execution-level schemes that jointly balance computational cost and solution quality under AC-feasibility constraints remain scarce, so controlling combinatorial complexity in the execution stage remains a key requirement for enhancing power system resilience.
In summary, existing studies have advanced resilience assessment, reinforcement learning based restoration, and topology optimization from different perspectives. However, important gaps still remain in the treatment of the operational safety feasible region, in reward design under multiple concurrent contingencies, and in execution stage procedures that should balance computational efficiency and solution quality.
To address these limitations, a unified framework is needed for the collaborative optimization of flexible resources under multiple concurrent contingencies. Within such a framework, feasibility screening under AC power flow, reward design for resilience improvement, and control of combinatorial complexity during implementation should be handled in an integrated manner. On this basis, a feasibility guided deep Q-network framework is proposed for the collaborative optimization of flexible resources in power systems. The main contributions are summarized as follows:
(1) A decision mechanism with explicit feasibility checking is established by embedding AC power flow equations, operational safety limits, and budget constraints into the environment. As a result, the feasibility of each action can be evaluated before execution and experience replay, thereby mitigating the adverse effects of invalid actions on policy learning.
(2) A normalized reward design based on incremental potential is developed in accordance with the composite resilience score. Accordingly, the evolution of connectivity, critical line survival, load loss ratio, and overload ratio can be jointly guided by a unified learning objective.
(3) A search strategy is developed for reserve interconnection selection during implementation. By combining beam search with AC power flow verification, the computational burden and the variation of training outcomes can be reduced without enlarging the action space.
The remainder of this paper is organized as follows. Section II introduces the physical modeling and resilience-evaluation framework. Section III presents the FG-DQN methodology, including training-execution integration and width-limited search. Section IV reports numerical studies on the IEEE-30 and IEEE-57 systems, with comparative and ablation results. Section V concludes the work and outlines limitations, practical implications, and directions for future research.
Physical modeling and evaluation metrics
Modeling and evaluation framework
A unified end-to-end framework for FG-DQN is shown in Figure 1.
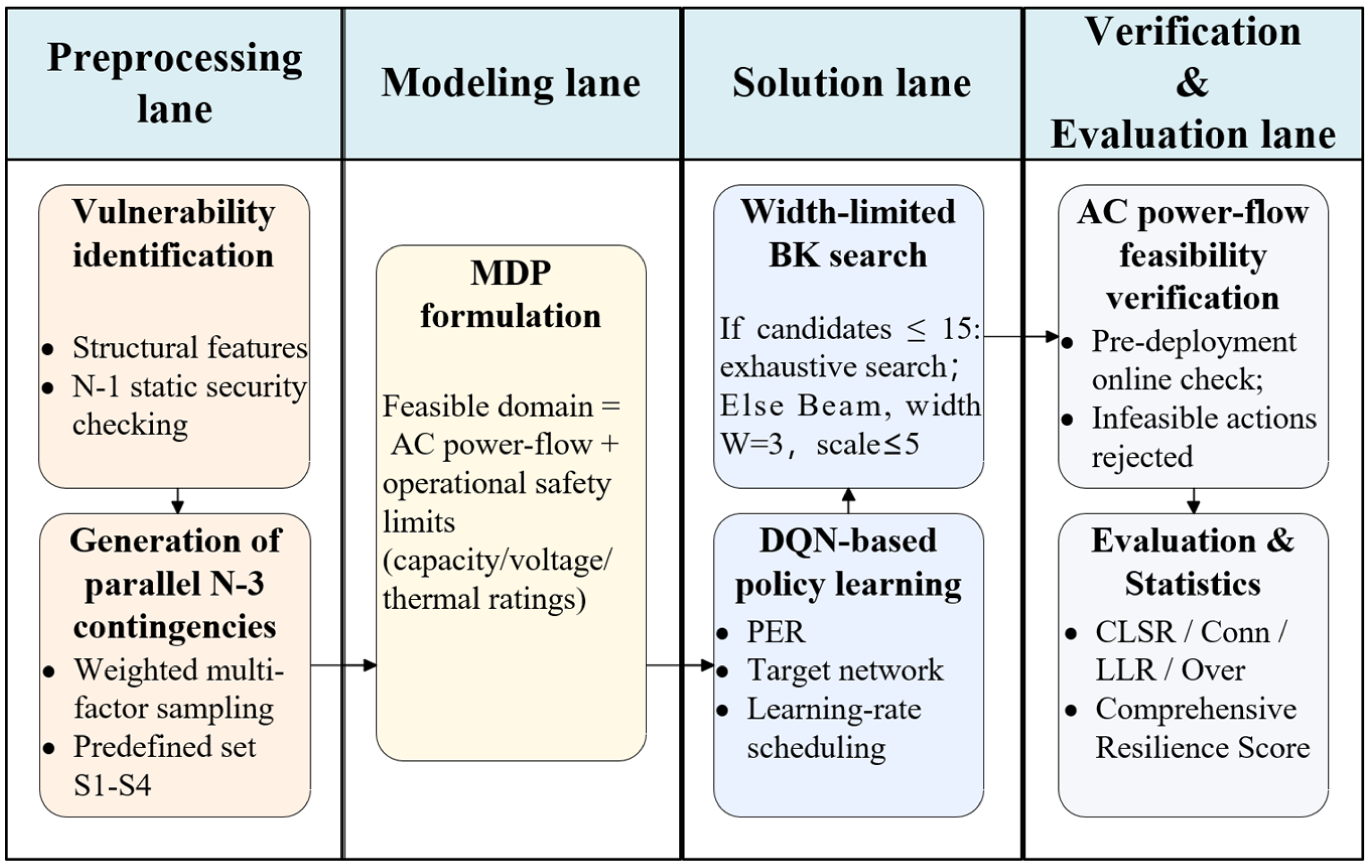
Flow of the overall methodology.
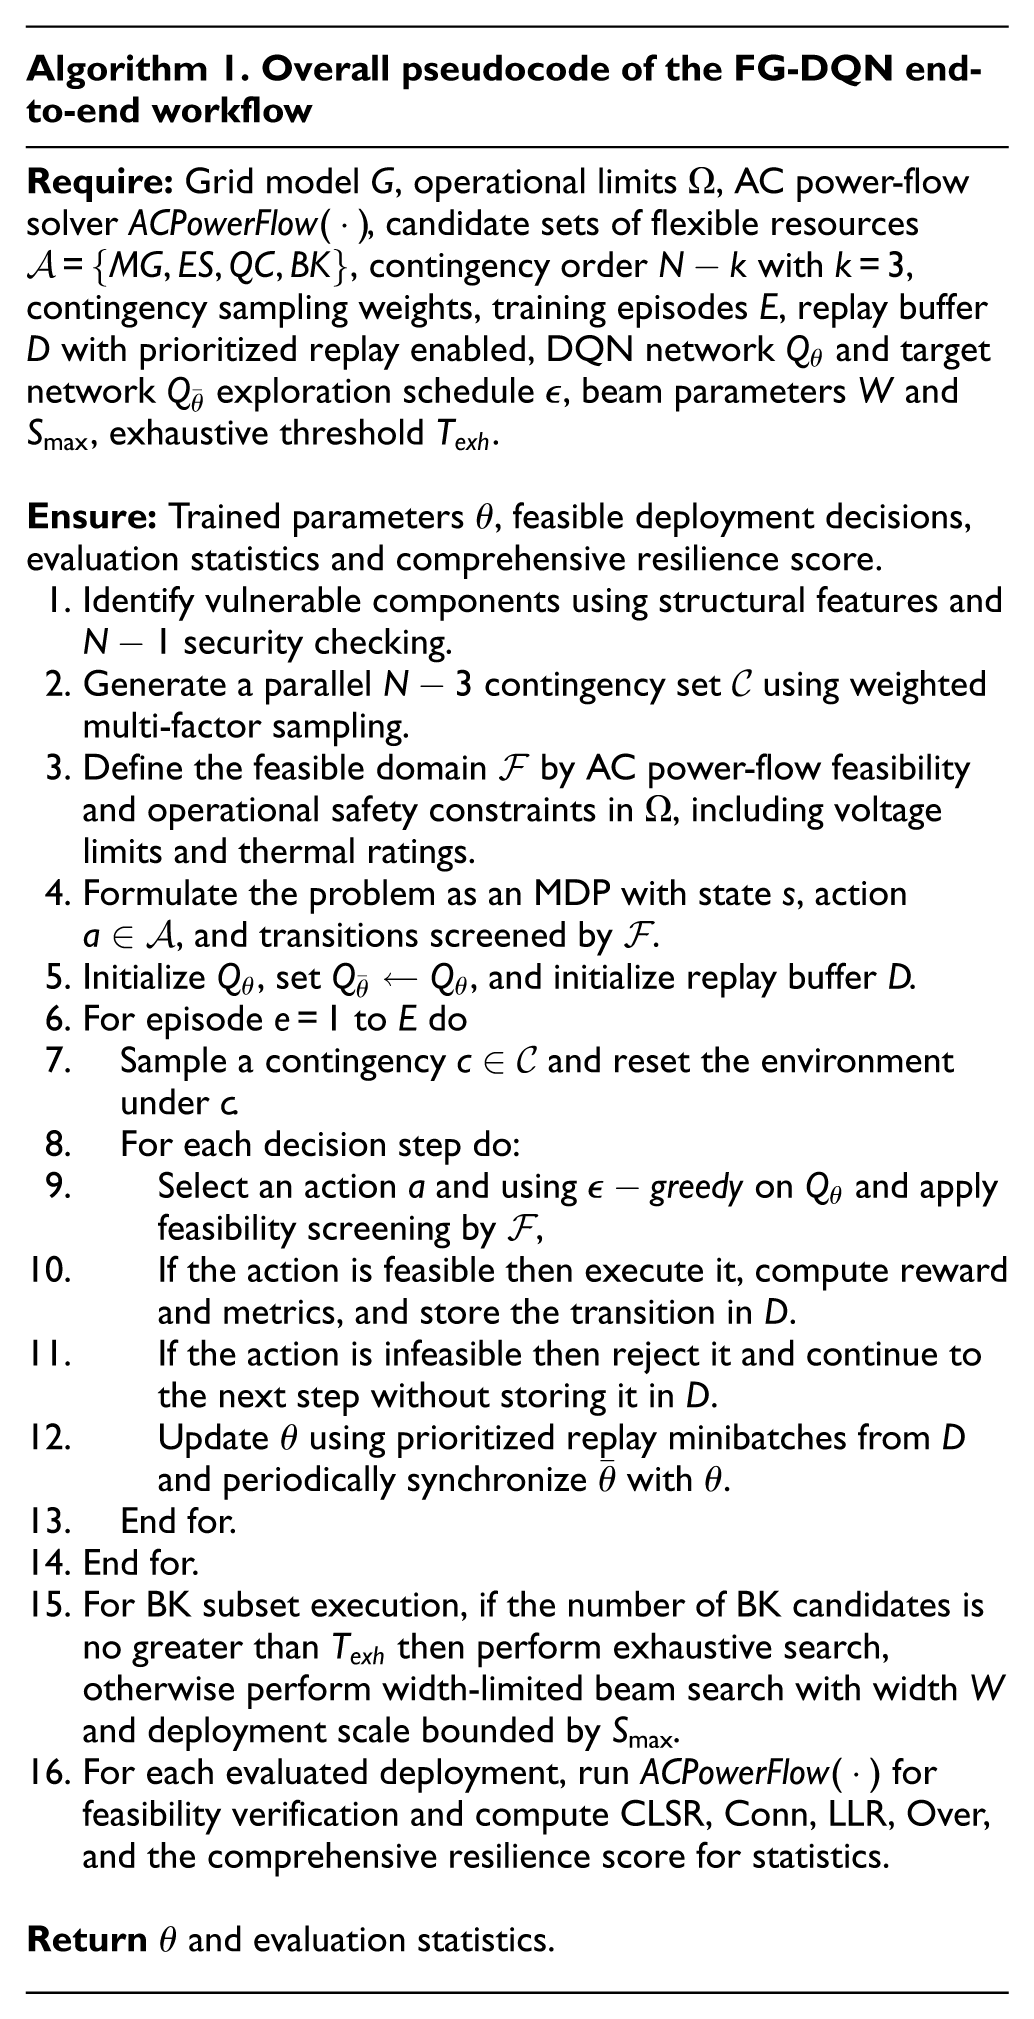
The workflow in Figure 1 is organized into four lanes that implement the FG-DQN framework. The preprocessing lane uses structural information and N-1 security checking to identify vulnerable components and to generate weighted parallel N-3 contingencies from data and physical priors. The modeling lane defines the feasible domain through AC power-flow equations and operational safety limits and casts resilience-oriented resource deployment as a Markov decision process. The solution lane carries out policy learning with FG-DQN and applies a width-limited, quality-preserving beam search to candidate backup-line combinations, while AC power-flow feasibility checks are embedded to remove infeasible structural actions. The verification and evaluation lane computes resilience metrics such as connectivity, critical-line survival, load-loss ratio, and overload ratio together with a composite resilience score under unified criteria, forming a comparable and reproducible evaluation loop. 29 Information flows from the preprocessing lane to the modeling lane to construct state and action spaces and feasible-domain constraints, and trajectories generated in the solution lane are stored in the replay buffer and passed to the verification and evaluation lane for performance assessment. Evaluation results can then be used to tune reward weights and deployment rules and to adjust scenario generation, which jointly improves numerical stability and engineering feasibility.30,31 To improve clarity and reproducibility, Algorithm 1 summarizes the unified end-to-end workflow illustrated in Figure 1.
AC power-flow and operational feasibility region
The following full AC power-flow formulation is employed, which is a set of nonlinear algebraic equations and thus defines a nonconvex feasibility region. In this paper, it is used as an environment-side feasibility check, where an action is rejected if the AC power-flow does not converge or any operational limits are violated.

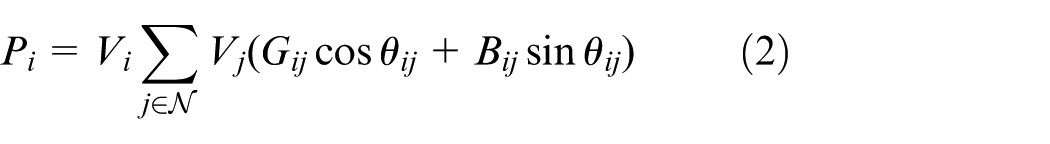
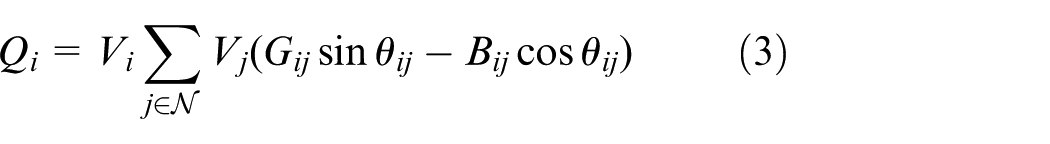


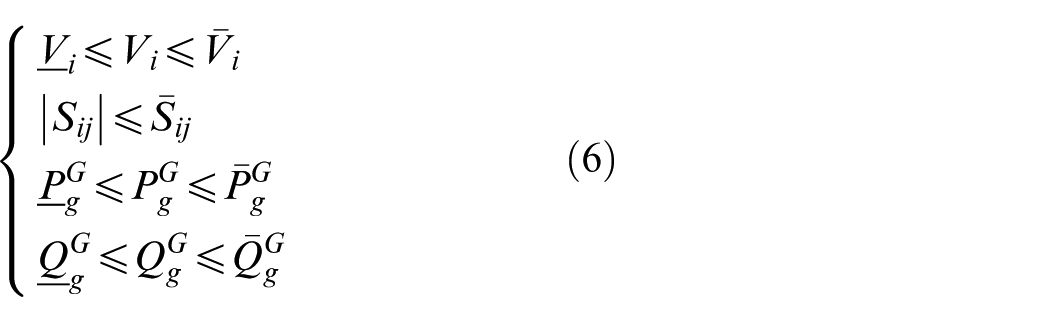
where
Flexible resources and cost-budget model
Flexible resources comprise four categories: mobile generators, energy storage systems, static reactive power compensation devices, and reserve interconnections. The cumulative investment satisfies:


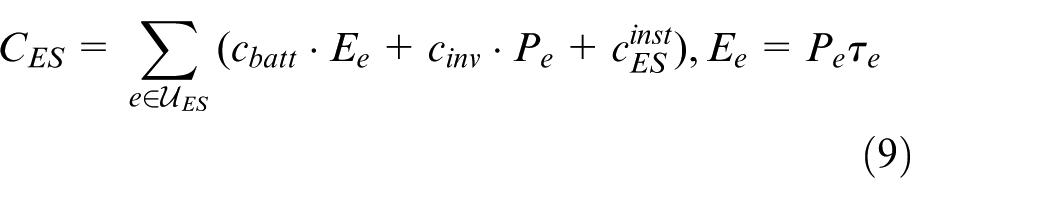
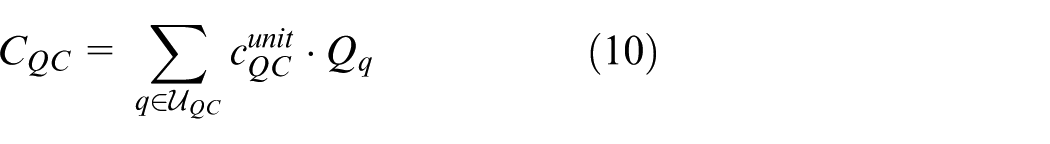

where
Equations (7)–(11) formulate the investment costs and budget constraints for the four resource types. Equation (7) enforces that the total cost of mobile generators, energy storage units, reactive compensators, and reserve-interconnection lines does not exceed the budget
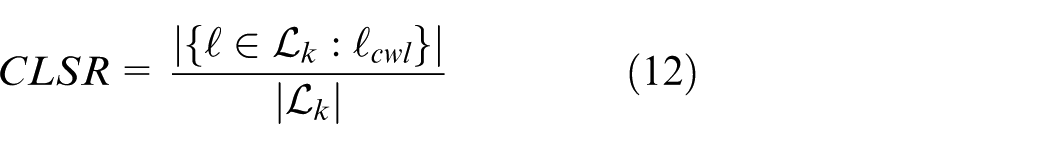
Resilience metrics and composite scoring
Under a unified evaluation protocol, four resilience metrics are defined. Resilience metrics are defined as follows:

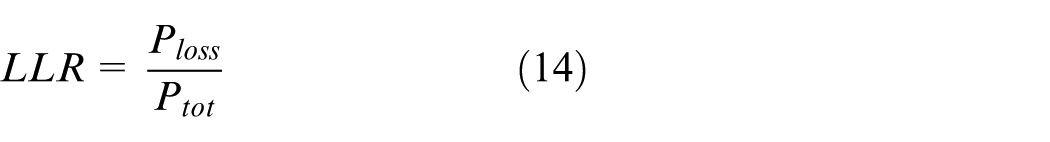
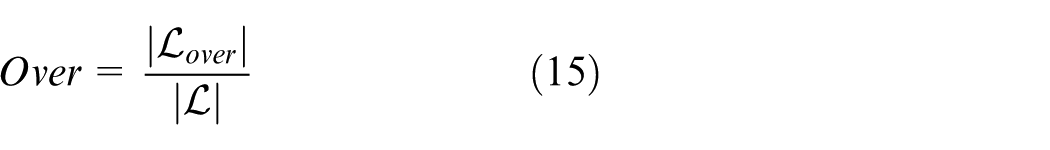
where
MDP formulation
Siting, sizing, and switching of the four resilient resources are modeled as a sequential decision process, serving as the core of the decision layer and defining an MDP
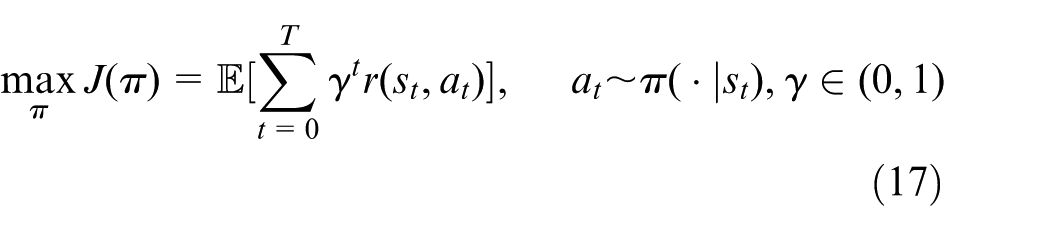


where
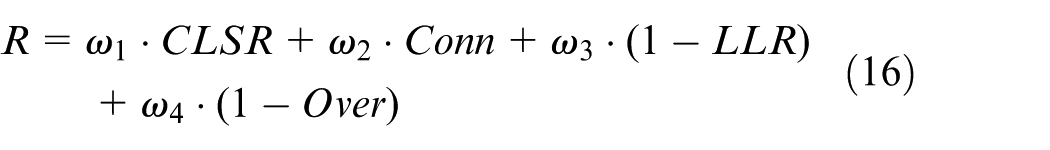
Potential-based composite reward
A normalized, potential-based composite reward is introduced to align policy learning with the composite resilience score.


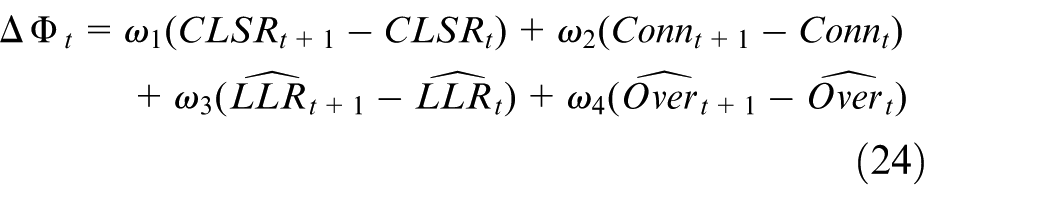
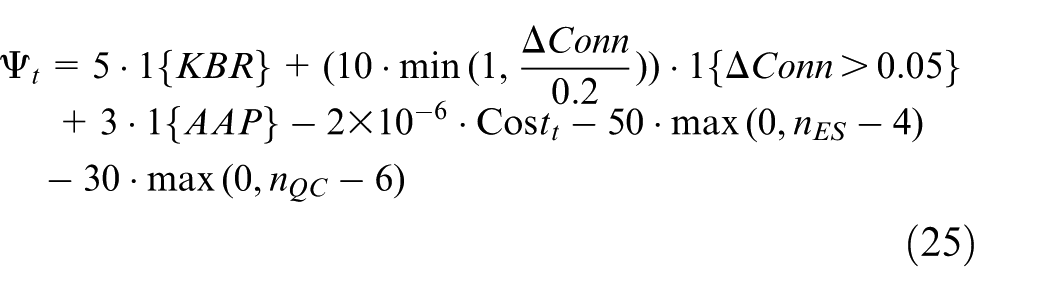


where
Solution method
High-dimensional decision making under concurrent contingencies and physical constraints is addressed by a solution path comprising feasible-domain preprocessing, reward shaping, policy learning, and execution verification.
Training-execution integrated framework and stabilization mechanisms
An integrated training-execution framework for FG-DQN is established, in which the action-value function


where
The MDP-extended three-lane architecture is illustrated, clarifying the data flow and temporal relations among state generation, action selection, environment feedback, sample ingestion, priority-based sampling, and parameter backpropagation, as shown in Figure 2.
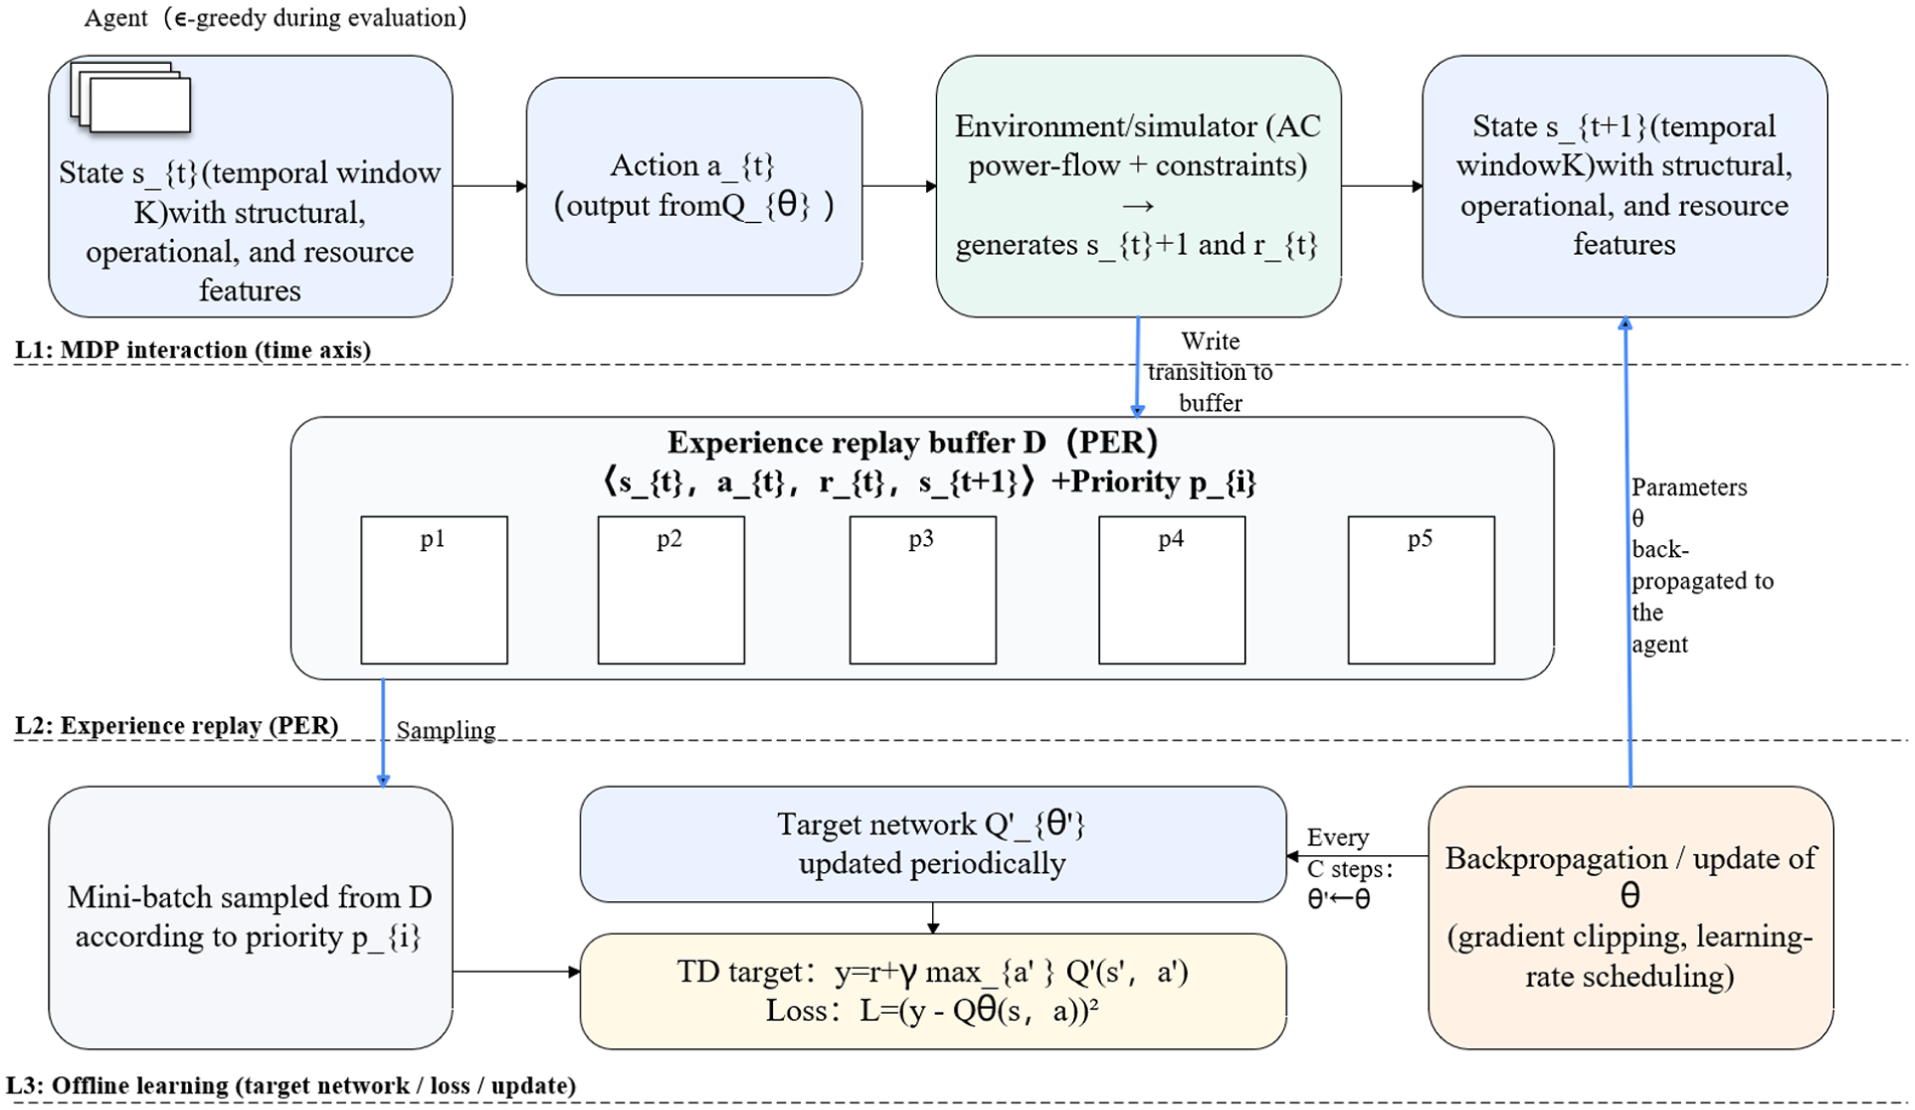
Three-lane framework of the proposed FG-DQN.
At each deployment step the environment applies the currently selected microgrids, storage units, reactive compensators, and backup lines to the grid model and performs an AC power-flow feasibility verification based on the formulation in Section 2.2. The updated topology may be split into several islands. For each island that still contains at least one generation or slack bus an AC power flow is solved and nodal voltages and branch flows are obtained. Islands without any source are treated as fully lost and their demand is counted as part of the load loss. If any island fails to converge in the AC power flow or if any voltage or thermal limit from equations (2)–(6) is violated the global post action state is marked as infeasible and the candidate action is rejected in both training and evaluation. Otherwise, the converged solution is used to compute the resilience indicators, including the critical load survival rate CLSR, the connectivity index Conn, the load loss ratio LLR, and the overload ratio Over, and these indicators enter the incremental reward design and the comprehensive resilience score.
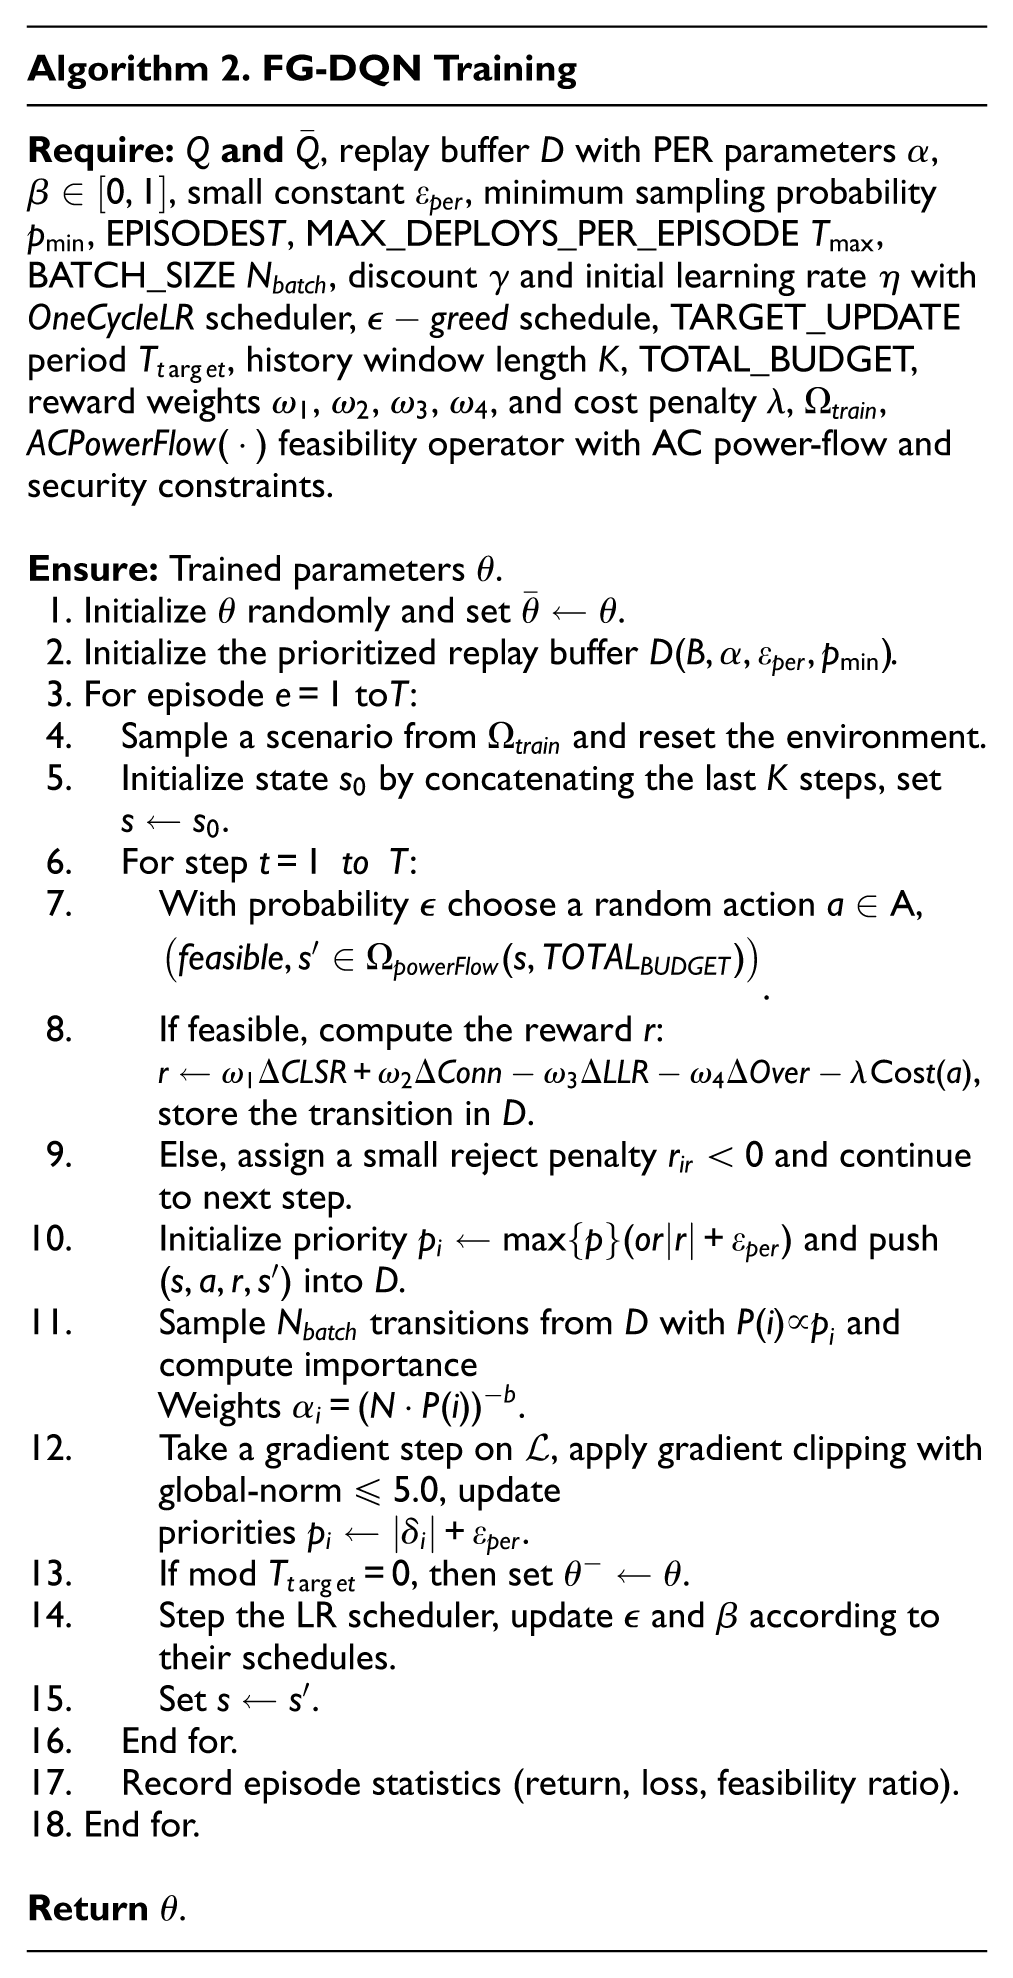
To instantiate the three-lane framework into executable steps, the training pseudocode of FG-DQN is formulated as Algorithm 2.
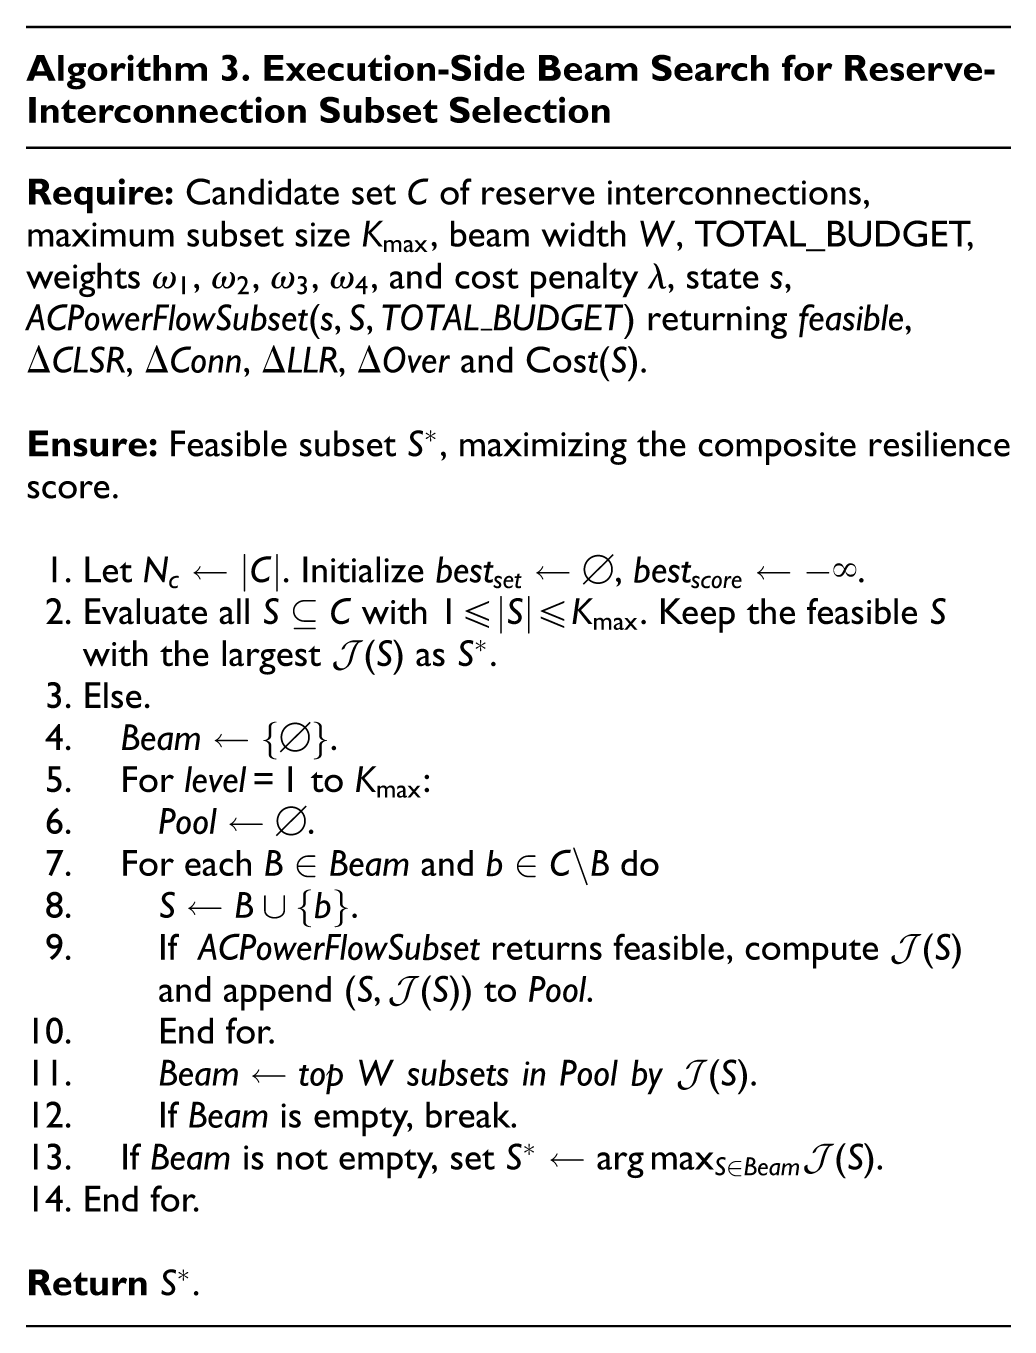
Width-limited optimality search for reserve-interconnection line combinations
A width-limited hybrid exhaustive/beam search is employed at the execution layer to select near-optimal subsets of reserve-interconnection lines while enforcing AC power-flow feasibility and controlling combinatorial growth. 35 A scoring function for the subsets is defined as:
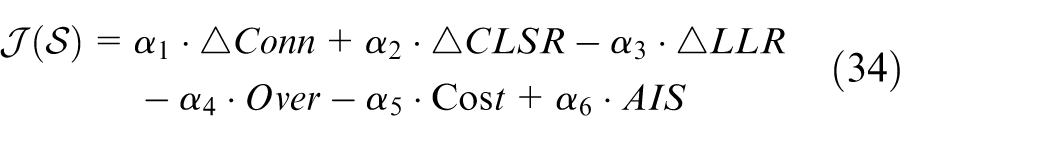
where
Starting from the current candidate set, a contraction step removes dominated or infeasible options. If the remaining size does not exceed
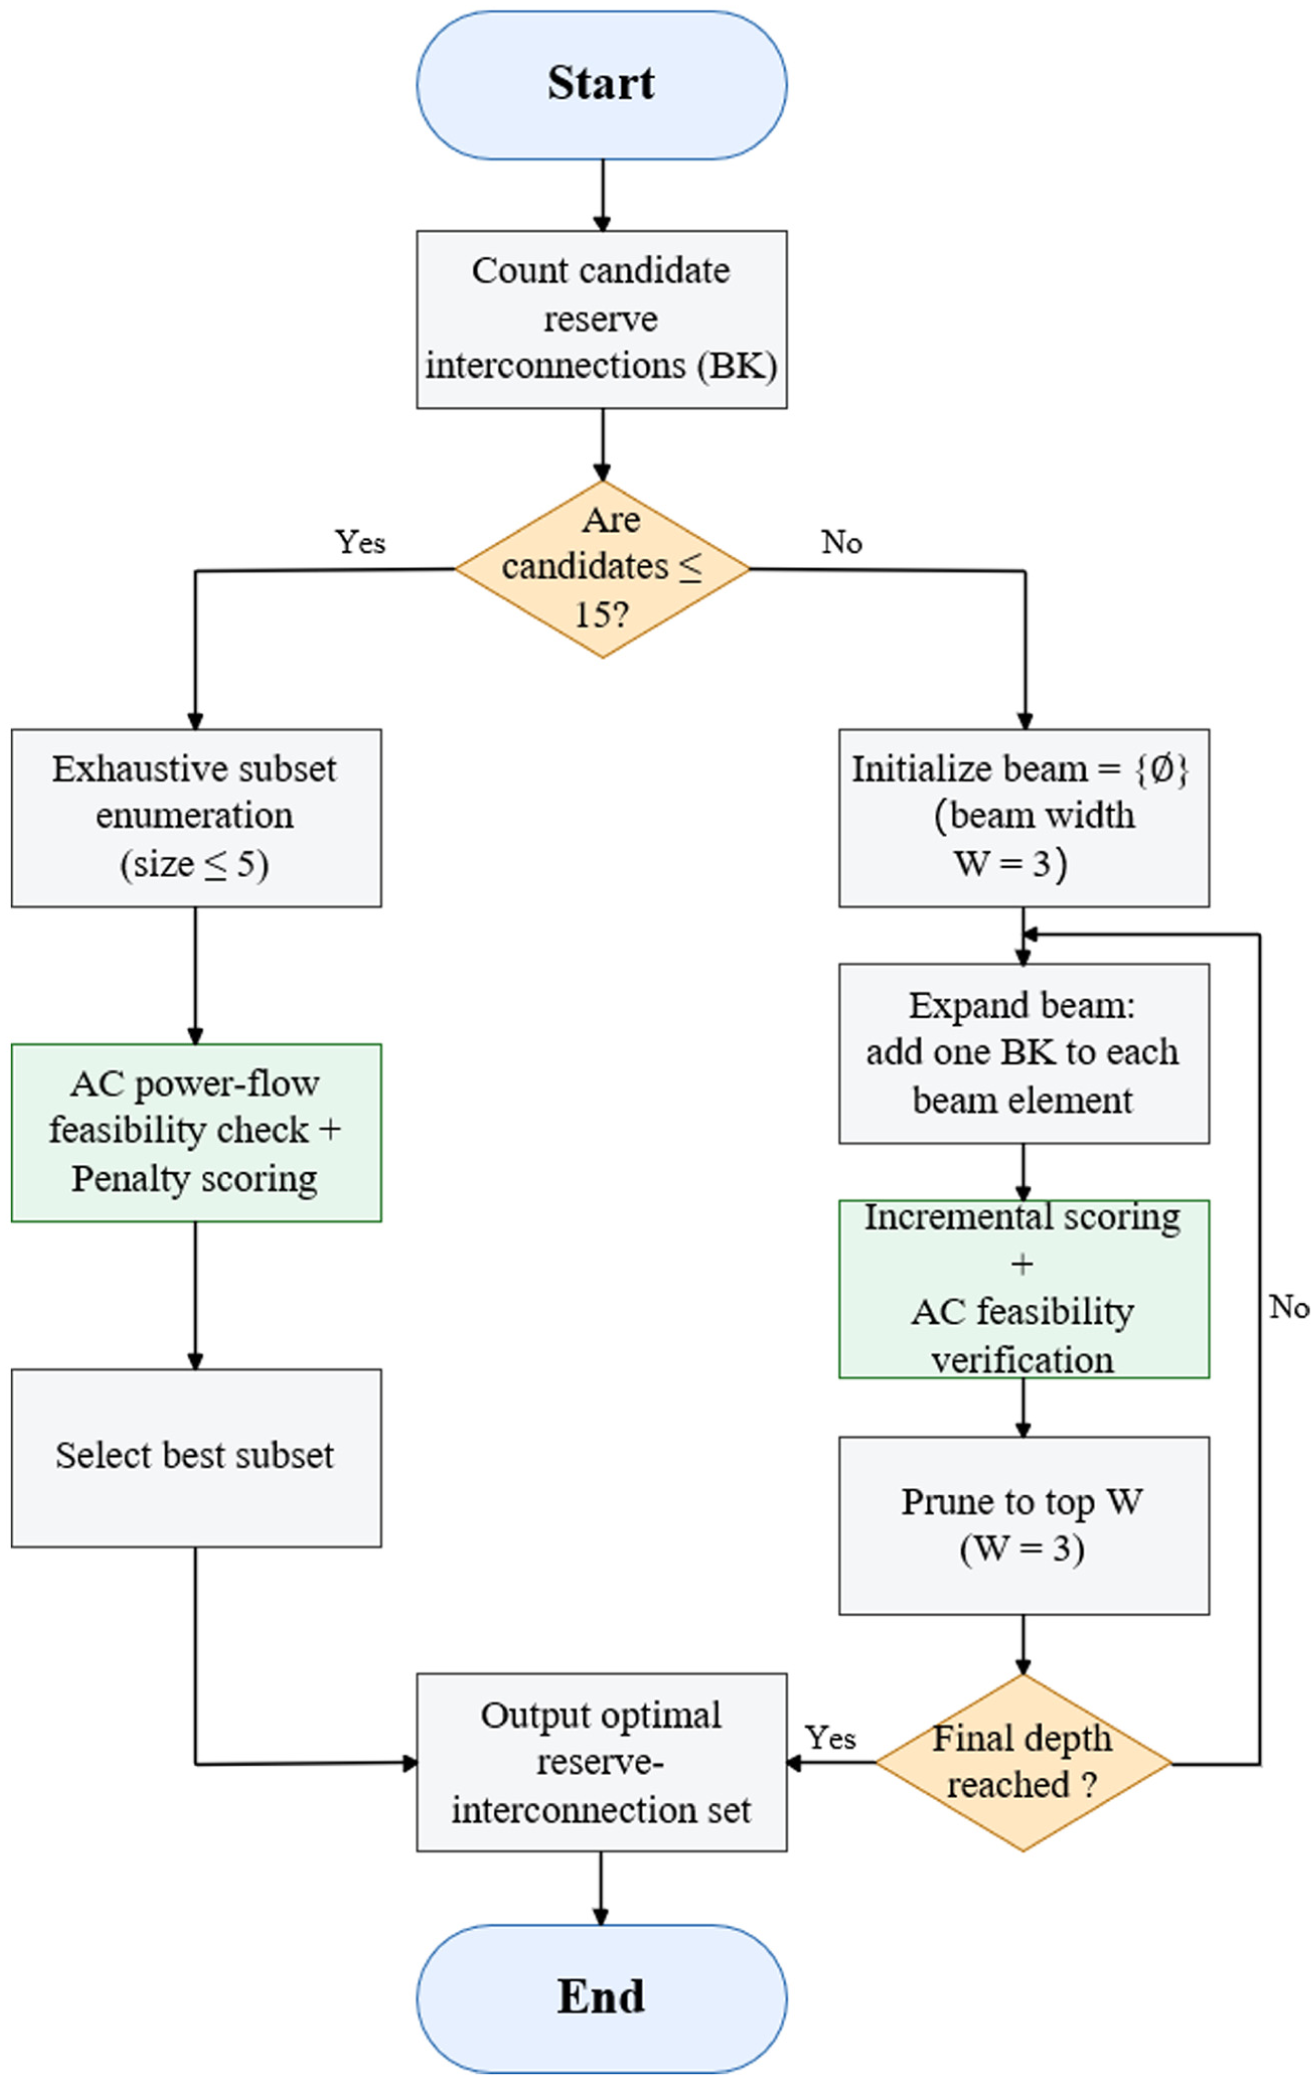
Width-limited search for reserve-interconnection combinations.
Computational complexity and engineering feasibility
By executing width-limited optimization at the execution layer, the exponential growth of structural combinations is reduced to a linear-time evaluation proportional to the product of the number of candidates and the cluster width. Formally, for a candidate set of size
Experiments and results
Experimental platform and unified settings
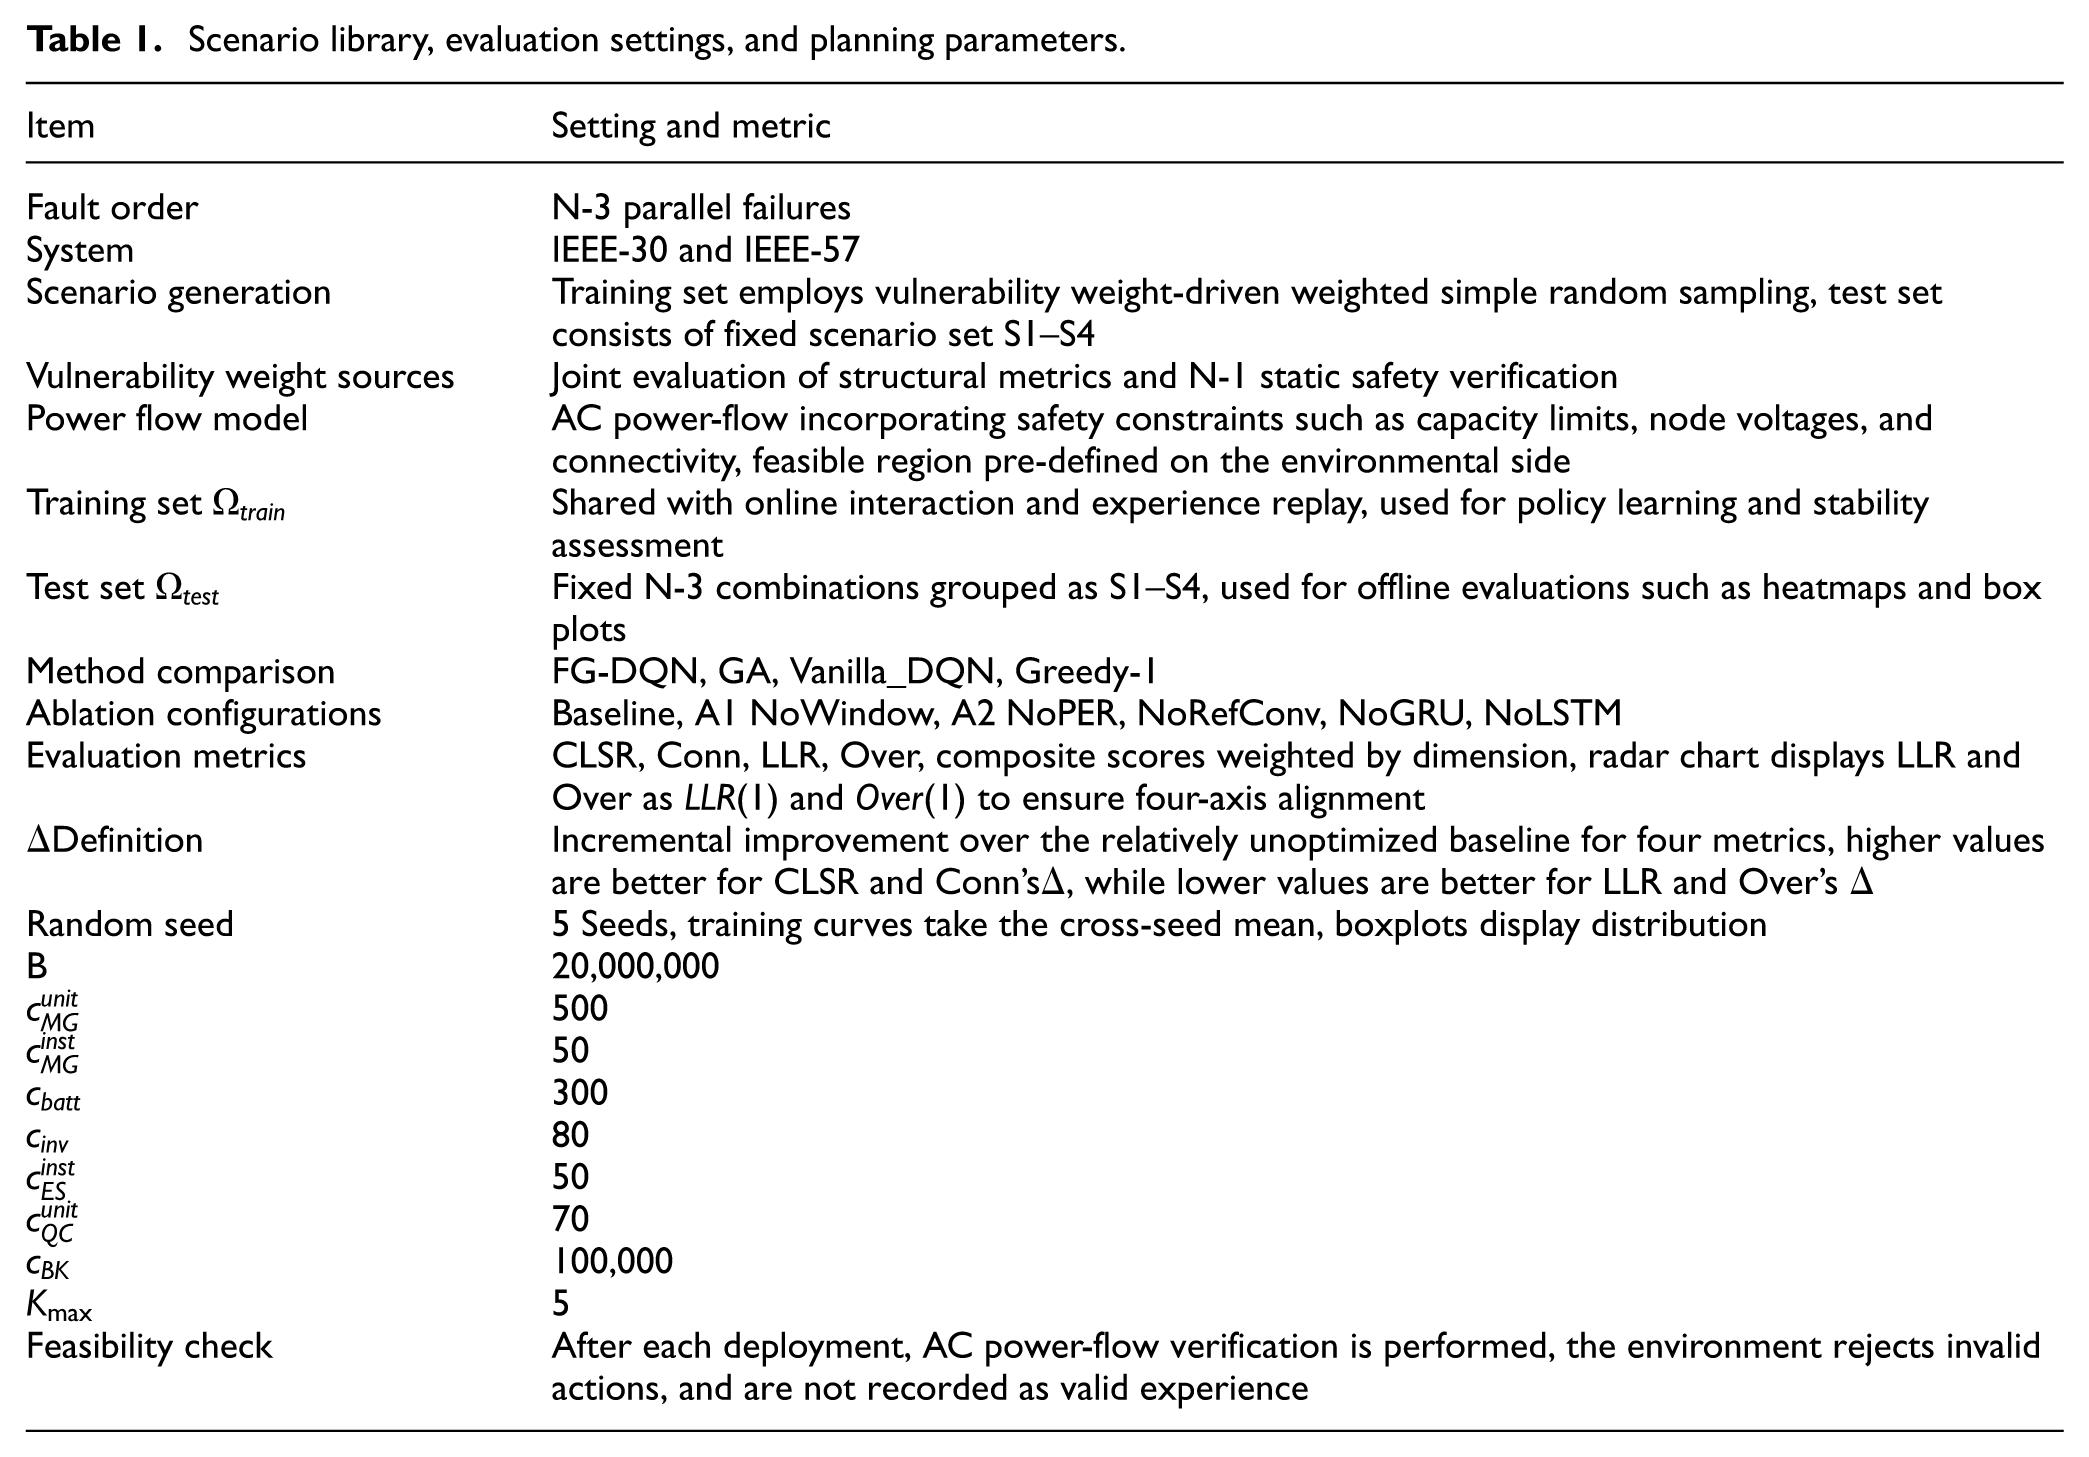
A unified experimental platform is established on the IEEE-30 and IEEE-57 systems, standardizing N-3 scenario generation, feasible-domain enforcement, FG-DQN-based policy learning, width-limited execution search, and evaluation under consistent resilience metrics. The workflow of parallel N-3 contingency sampling, based on weight fusion and weighted draws from critical buses and vulnerable lines, is illustrated in Figure 4. The corresponding numerical settings are summarized in Table 1.
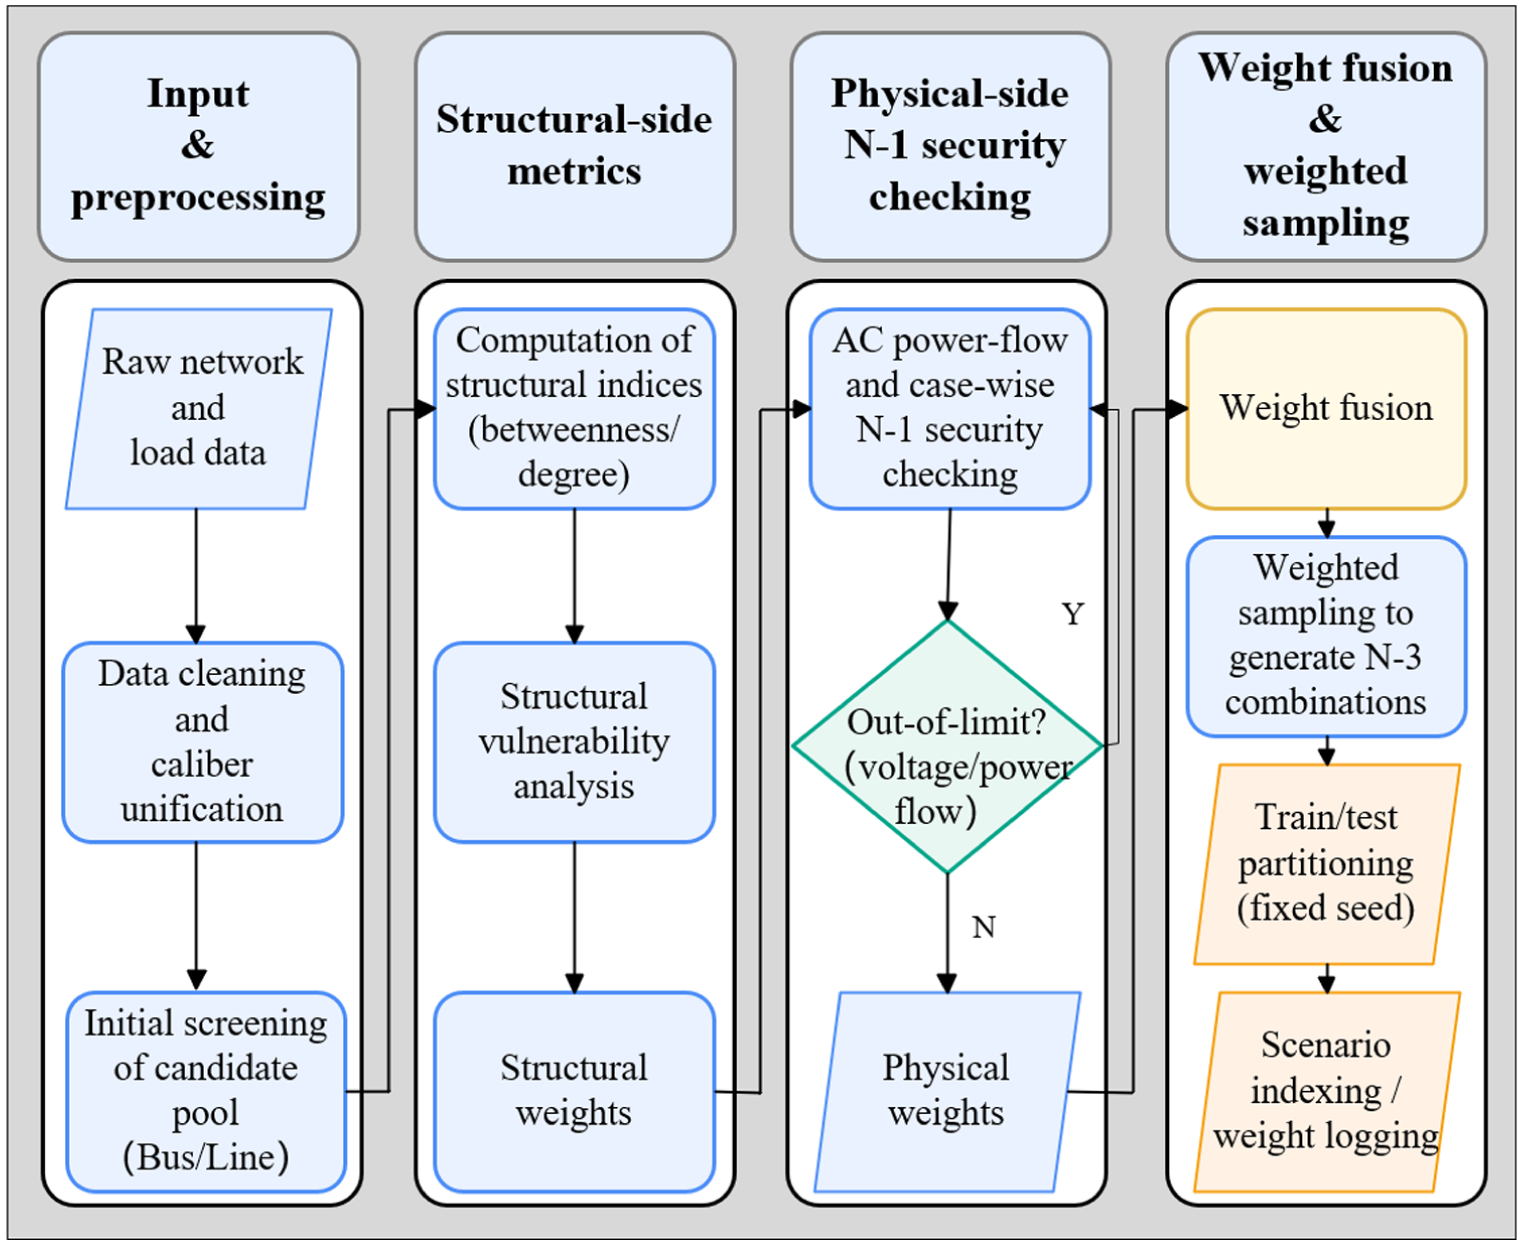
Vulnerable component identification and N-3 scenario generation process.
Scenario library, evaluation settings, and planning parameters.
Weights are first computed from betweenness centrality and N-1 security margins, and weighted sampling then constructs fixed training/test sets with reproducible seeds. The feasible domain of the environment is jointly defined by AC power-flow convergence and operational-safety limits. Each deployment action is verified through power-flow and out-of-limit checks before it is admitted to the replay buffer. Policy learning is performed using a deep Q-network with prioritized experience replay, soft target network updates, gradient clipping, and learning rate scheduling. At the execution layer, reserve-interconnection subsets are selected by a width-limited beam search with embedded AC power-flow checks. Evaluation is conducted under unified criteria that include connectivity, critical-line survival rate, load-loss ratio, and overload ratio, along with a weighted composite resilience score.
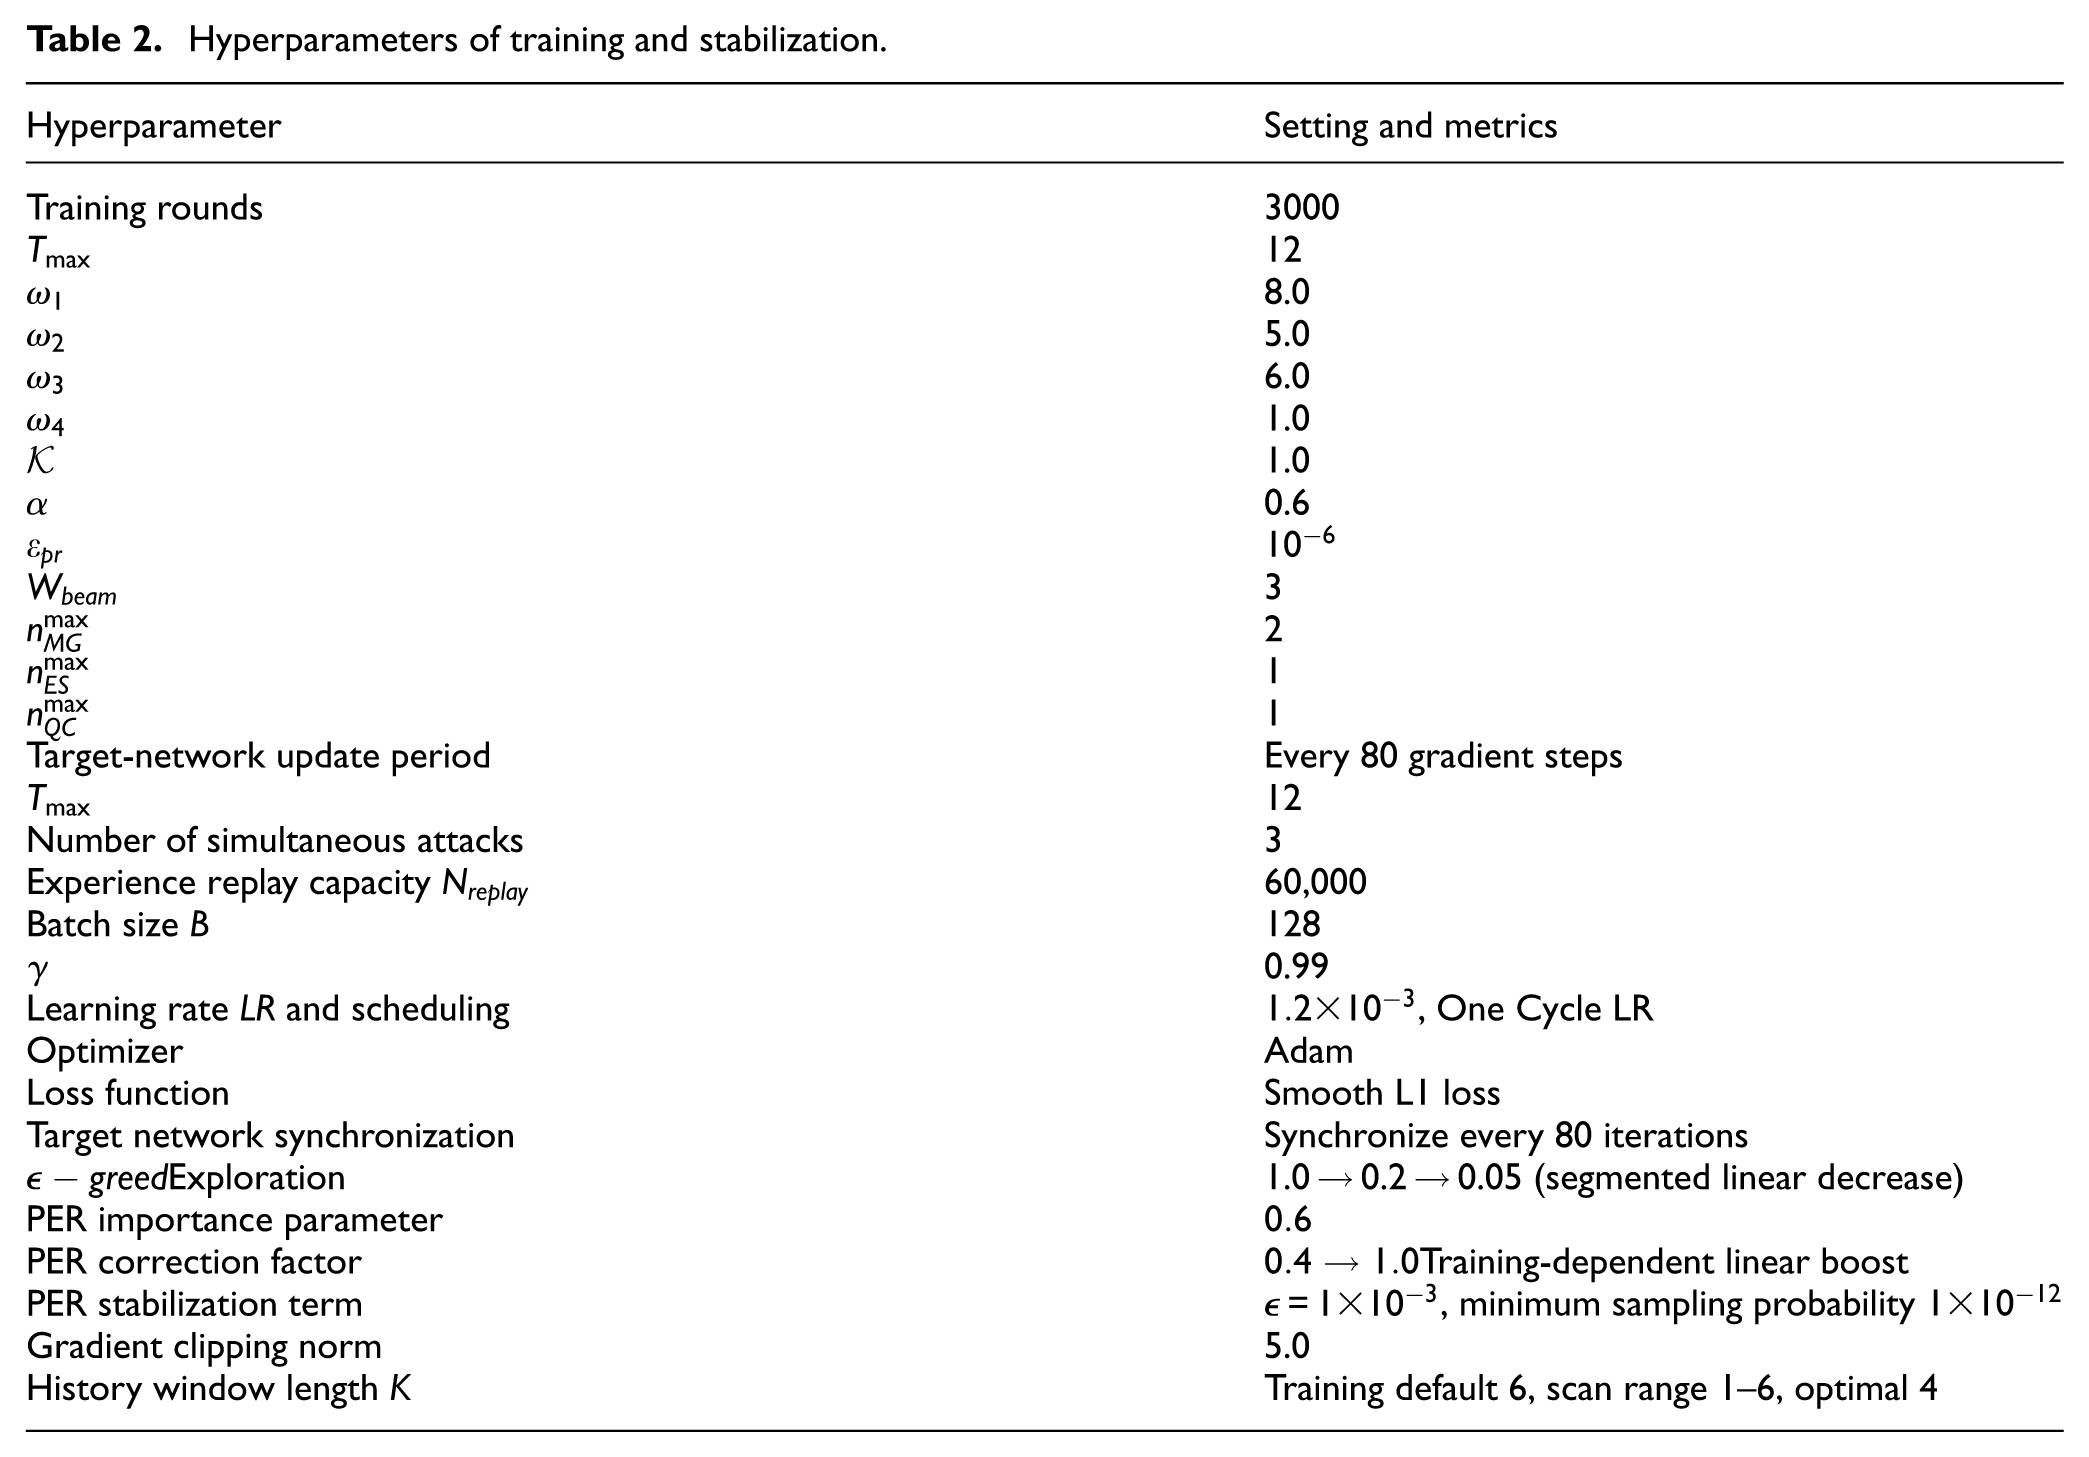
To ensure reproducibility and implementation consistency, unified settings are applied to training and evaluation, including scenario construction and statistical metrics, budget and portfolio configurations, and critical components such as experience replay, target networks, exploration policy, optimizer and learning-rate scheduling, gradient clipping, and history-window length. The specific configurations are listed in Table 2. These settings are kept identical for both test systems and for all comparison methods so that performance differences are attributable to methodological differences rather than unequal hyperparameter tuning effort.
Hyperparameters of training and stabilization.
To enhance transparency and reproducibility of the implementations used in the comparative study reported in Section 4.2, the core workflows of GA, Greedy-1, and Vanilla DQN are documented in the Appendix 1 as Algorithms A1–A3. In addition, convergence evidence for GA, Greedy-1, and Vanilla DQN is provided in Appendix 2 as Figures B1–B3. All three methods are evaluated under an identical environment model, contingency sets, budget rules, and metric computation pipeline, and they differ only in the decision rule used to select deployment actions and reserve-interconnection choices.
Operational metrics and method comparison
Post-operation stability
Learning and convergence behaviors are first examined for the proposed method alone, across training iterations, to assess stability and scalability under different network topologies.
Figure 5 shows that the episode reward increases steadily with training iterations and then enters a narrow fluctuation band in the later stage. The peak-to-trough range remains controlled and no long-term drift is observed. Preselection of the feasible domain and empirical filtering in prioritized experience replay reduce the proportion of invalid samples, leading to progressively stabilized value estimation. Exploration and exploitation remain balanced, and the curve trajectory is consistent with the operational-feasibility requirement. The convergence pattern is reproducible and numerically interpretable.
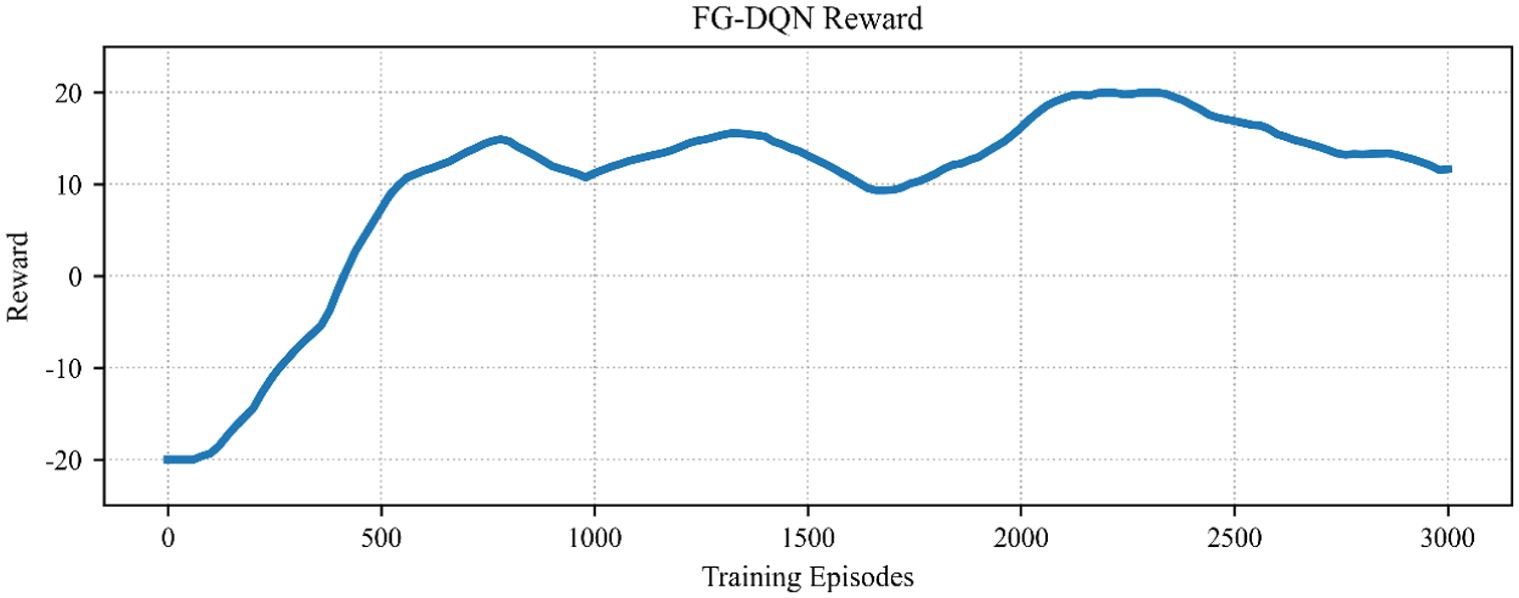
Training reward curve on the IEEE-30 system.
Figure 6 shows sustained monotonic improvement on the larger network, with a more extended convergence phase but fluctuations that remain within a controllable range. Width-limited optimization at the execution layer suppresses noise from combinatorial explosion, and soft updates of the target network maintain gradient stability in the high-dimensional action space. Relative to Figure 5, scale expansion primarily results in a moderate increase in convergence time and jitter amplitude, while the overall stable convergence trend remains intact.
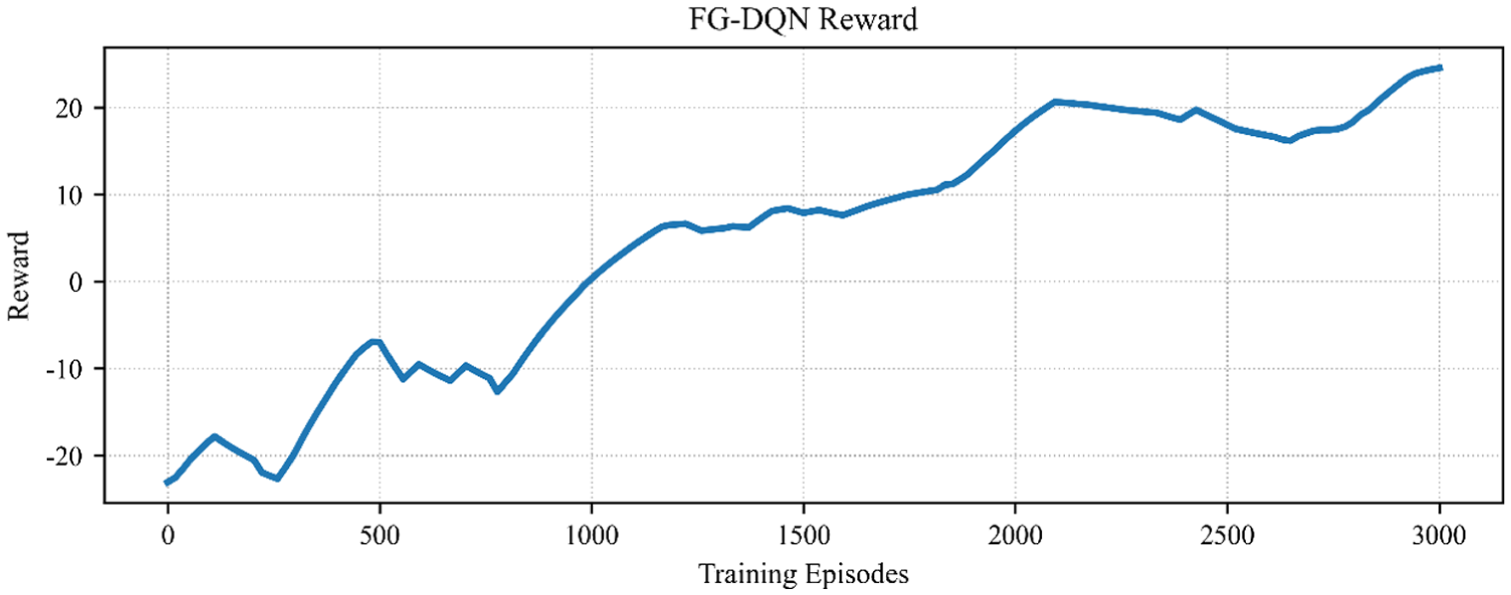
Training reward curve on the IEEE-57 system.
Comparison with other methods
After the behavior of the individual method has been characterized, comparative analysis is carried out along two dimensions: (i) system-level overall performance and (ii) the incremental performance distribution across methods.
Observation of Figure 7(a) and (b) shows that the radar charts normalize the LLR and the Over using
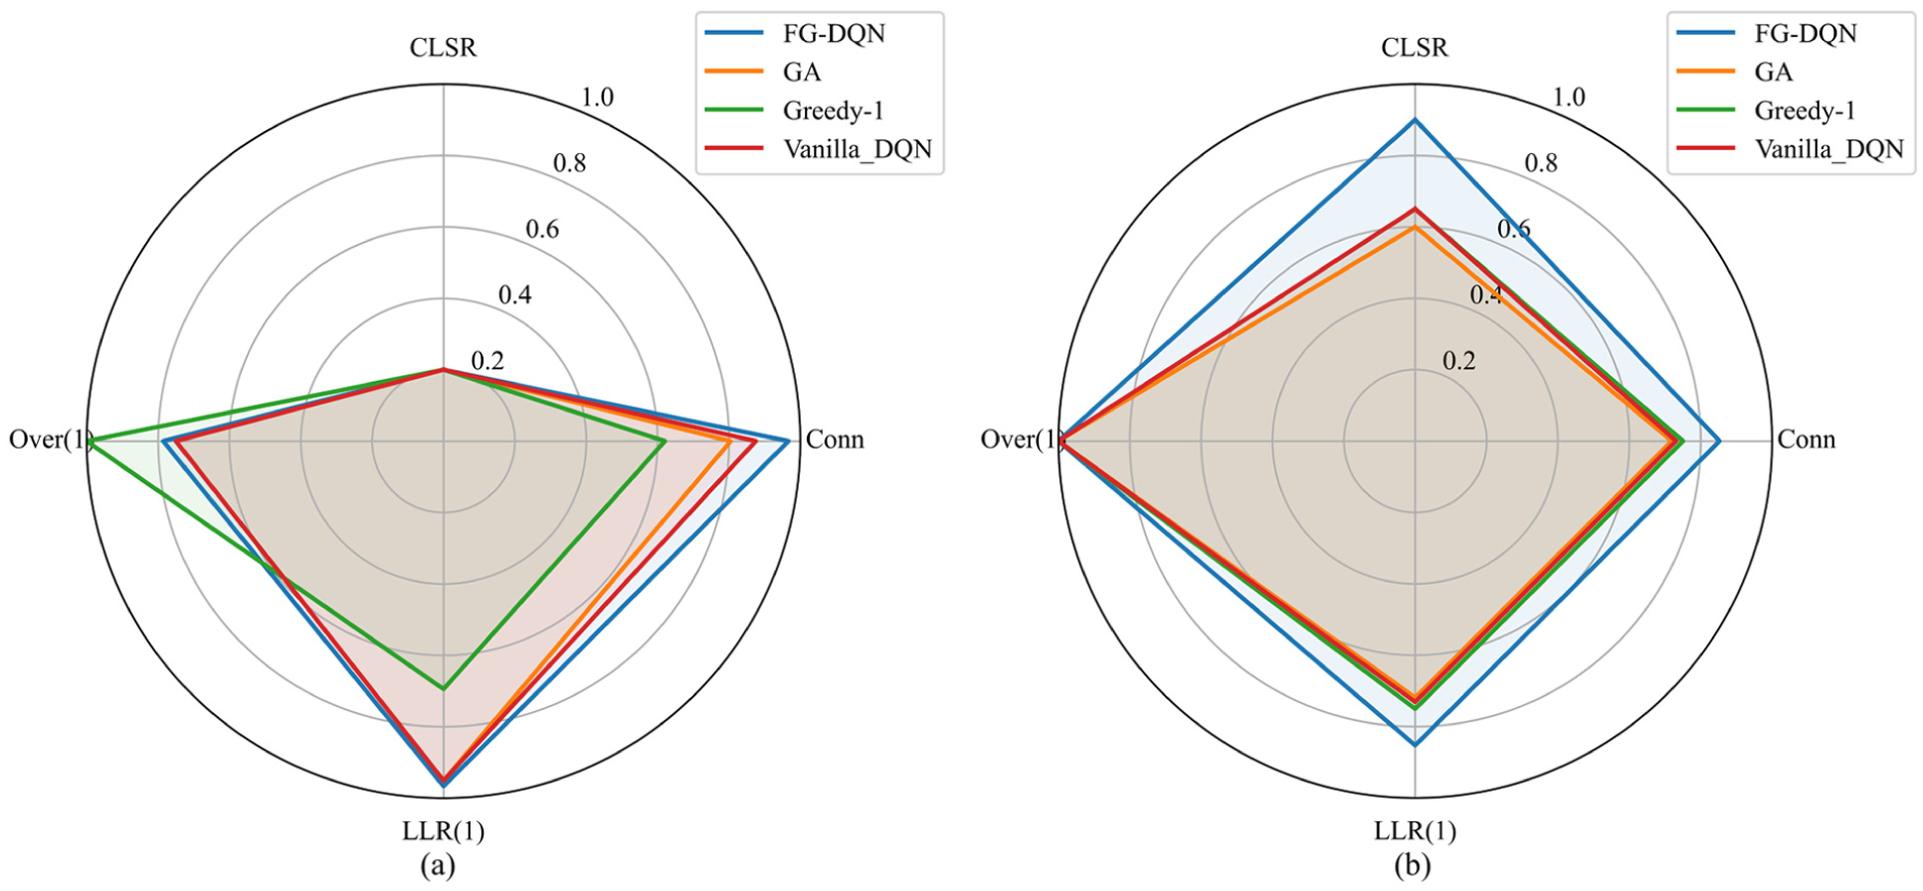
Multi-method synthesis radar charts for the four resilience metrics: (a) IEEE-30 system and (b) IEEE-57 system.
Observation of Figure 8(a) and (b) shows that both test systems exhibit a consistent improvement trend in the four resilience metrics when the methods are placed on the horizontal axis. The FG-DQN-based method produces larger positive gains in critical-path survival rate and in connectivity, and at the same time achieves stronger reductions in load-loss ratio and overload ratio. This concurrent favorable movement of all four indicators indicates that structural restoration and supply recovery can progress simultaneously. When the system scale is increased from IEEE-30 to IEEE-57, the advantage is preserved in the more complex topology. Under highly fragmented conditions, however, the decreases in load-loss ratio and overload ratio begin to converge, implying that the performance ceiling is mainly limited by connectivity boundaries, the coverage of candidate interconnections, and budget relaxation, rather than by learning instability. FG-DQN therefore delivers consistent directional improvements with superior magnitude across different system sizes and scenario sets.
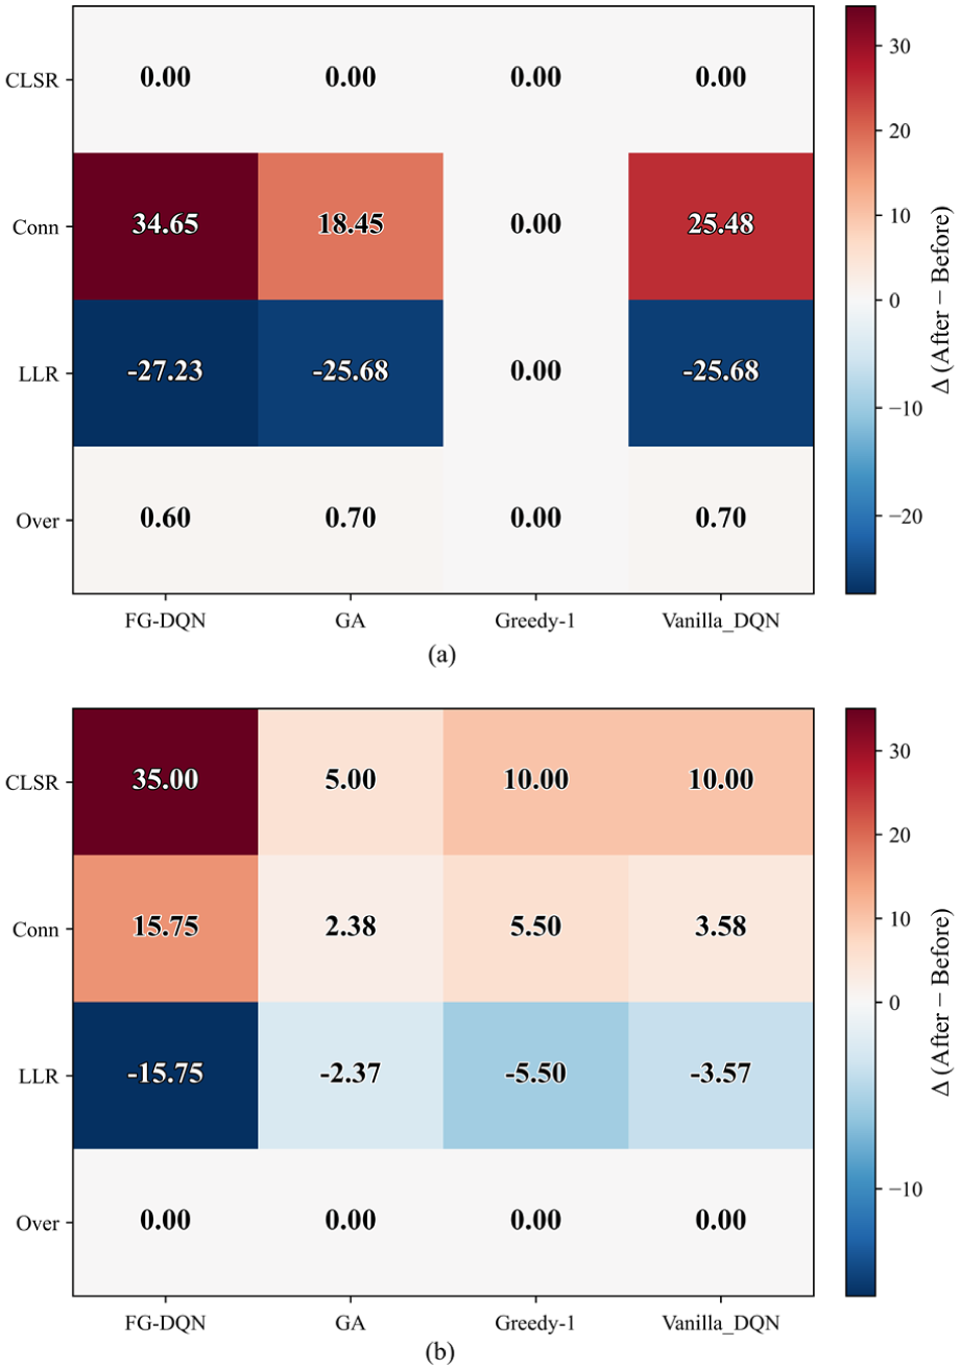
Heatmap of Δ for the four resilience metrics: (a) IEEE-30 system and (b) IEEE-57 system.
Ablation studies and hyperparameter validation
Ablation studies
To identify the causal contributions of the key mechanisms, the temporal sliding window and the prioritized experience replay module are removed separately. The resulting changes in scenario-wise increments, training trajectories, and distribution statistics are then examined in a coupled manner.
Figure 9 shows that the baseline configuration attains positive gains in most scenarios. Removing either the temporal sliding window or the prioritized experience replay (PER) module markedly weakens these gains, and several scenario-action combinations even turn negative. The regions with the most pronounced degradation coincide with the high-impact scenarios, which indicates that the temporal window captures outlier channels and short-term dynamics. At the same time, PER increases the sampling weight and estimation efficiency of critical experiences. Both components are therefore necessary to sustain stable improvements in high-impact settings.
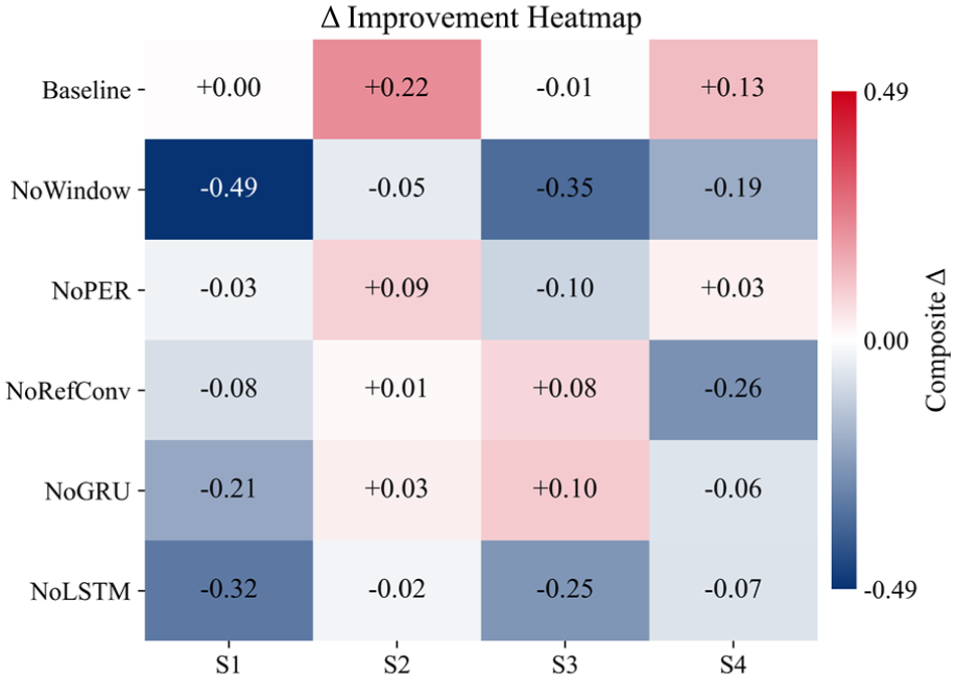
Ablation experiment: Δ-resilience heatmap.
Figures 10 and 11 show that, under the complete mechanism, the training loss decreases rapidly and then oscillates within a narrow and stable band, corresponding to a steady increase in episode return and curve convergence across different random seeds. Removing either mechanism enlarges the loss oscillations, lowers the mean return, and increases the variance. The learning trajectory becomes more sensitive to the synchronization between the experience distribution and the optimization objective, and the curve-level degradation is consistent with the degradation observed at the scenario level.
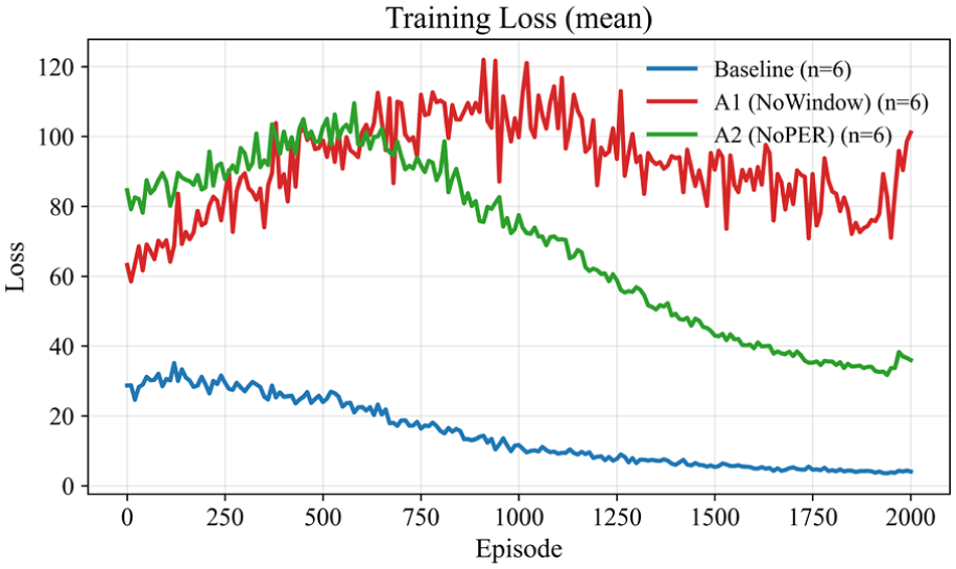
Training loss curve (average of five seeds).
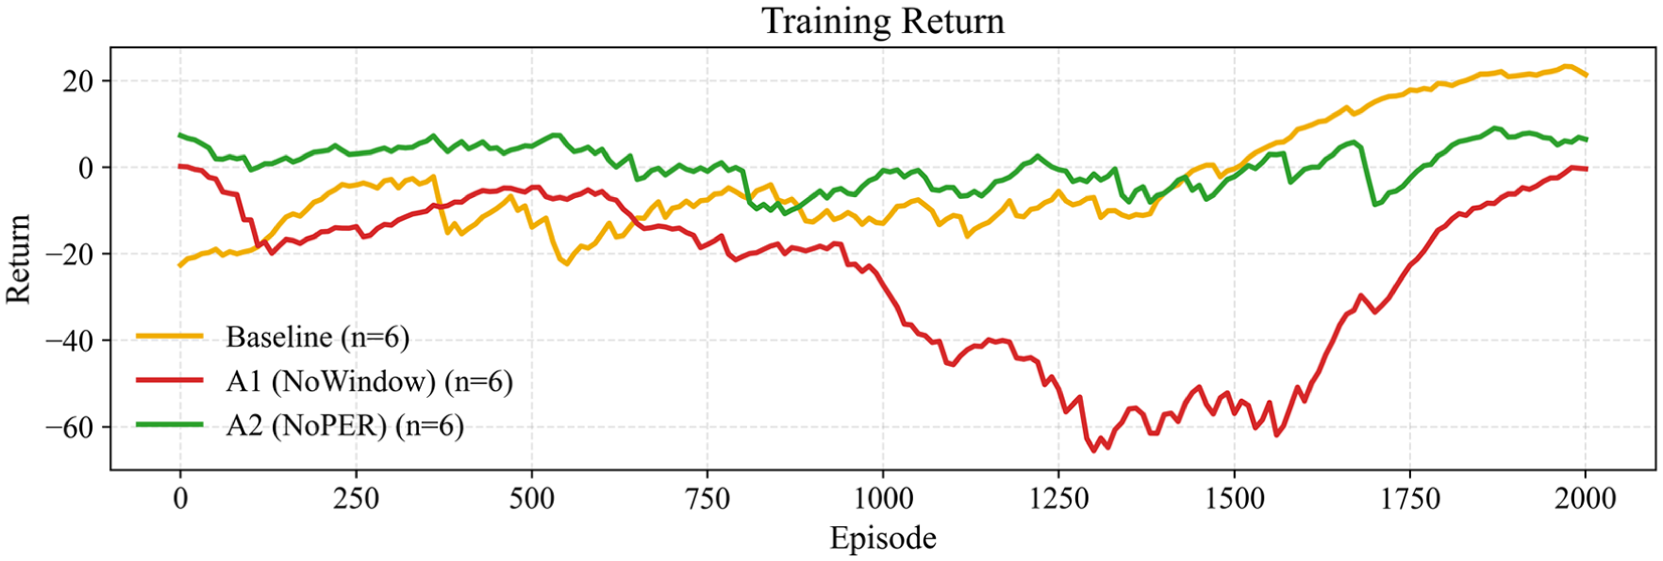
Training return curve (average of five seeds).
Figure 12(a) and (b) show that the complete mechanism produces distributions with higher medians, tighter interquartile ranges, and shorter lower tails. After the mechanism is removed, the rightward shift becomes weaker and pronounced long tails appear. The agreement between the distributional statistics and the training curves indicates that the key mechanism accelerates convergence while improving robustness across heterogeneous scenarios, the observed gains are not attributable to a small number of favorable cases.
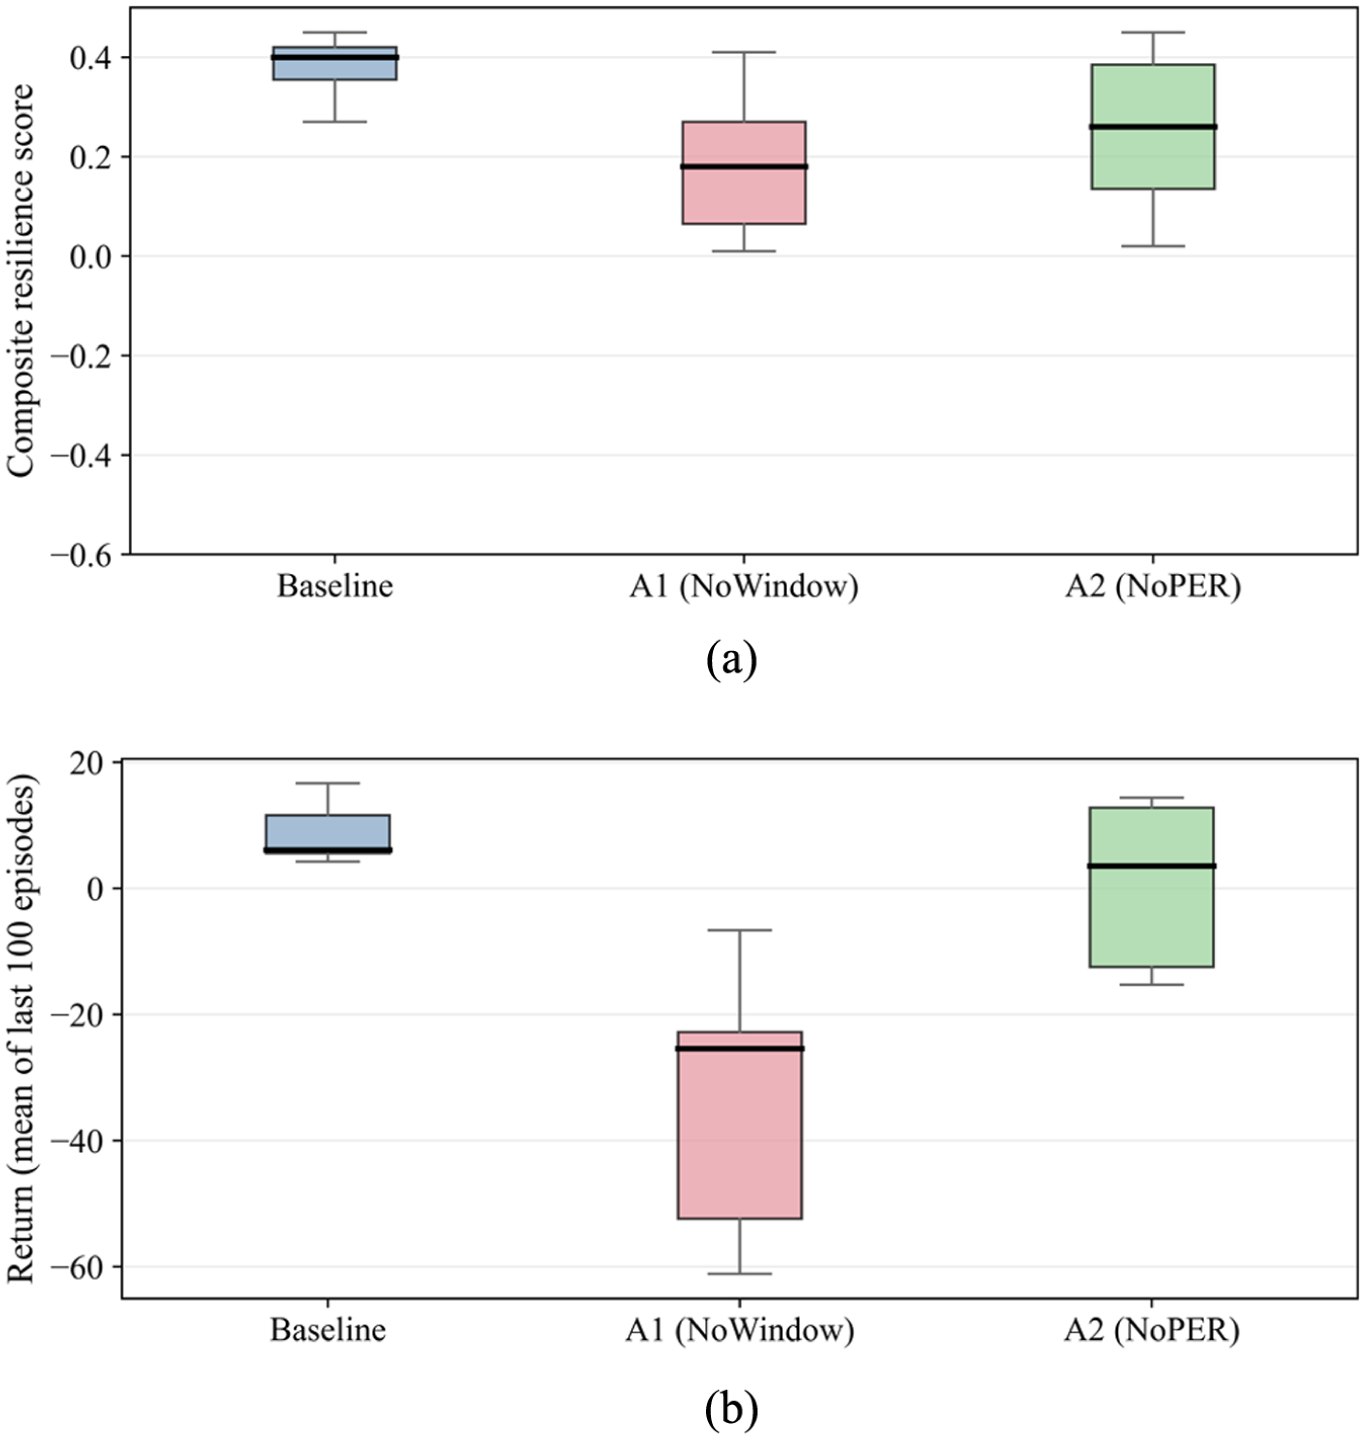
Box plots of: (a) composite resilience on the test set and (b) returns (average over the last 100 episodes).
K-value scan
The length of the historical window affects both the coverage of temporal information and the variance of value estimation, so a balance must be maintained between perceptual depth and redundant noise.
Figure 13 shows that performance first increases and then decreases as K grows, and stabilizes near K = 4. A window that is too small cannot capture the short-term memory of threshold-crossing propagation, whereas an excessively long window introduces redundancy and raises the variance of value estimation. Both test systems exhibit the same trend, and the optimal window length is positively correlated with network scale, providing actionable guidance for multi-scale deployments.
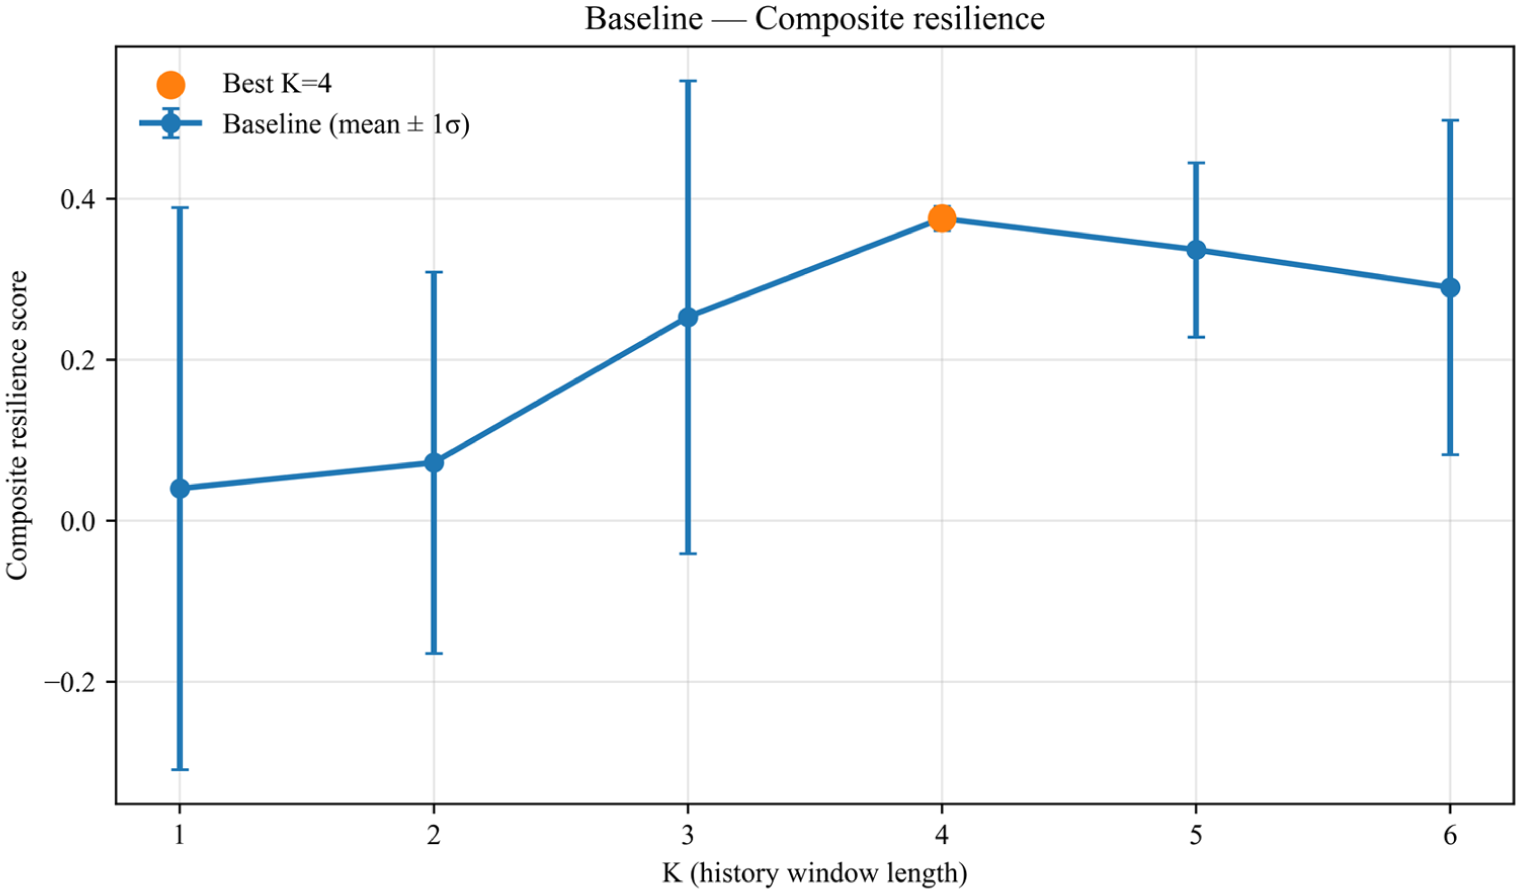
K-scan for the baseline, where K = 4 is optimal and most stable.
Conclusions
This study developed an FG-DQN-based framework for the collaborative allocation of mobile generators, energy storage, reactive compensation, and reserve interconnections to enhance power system resilience under extreme events while balancing physical feasibility and computational tractability. AC power-flow feasibility and operational-safety limits were embedded into the environment, and a normalized incremental-potential reward aligned with a composite resilience score was designed. In addition, a width-limited beam search with embedded AC power-flow checks was introduced for reserve-interconnection selection, which helped to preserve physical consistency and control the computational burden. Simulation results on the IEEE-30 and IEEE-57 test systems showed that FG-DQN increased network connectivity and the critical-line survival rate, reduced load-loss and overload ratios, and raised the composite resilience score while lowering variance.
One limitation of this study is that the simulations are based on IEEE standard test systems and do not incorporate real operating data. Future extensions may integrate time synchronized wide area measurements from existing PMU based monitoring infrastructures as a source of actual grid operating data. Such data, collected under realistic channel capacity and communication constraints, can drive a continuously updated scenario pipeline and enable the evaluation of cross condition generalization under real operating conditions. Another limitation is that feasible-region thresholds and reward weights are manually specified, which constrains transferability across systems. Future research can explore adaptive or data-driven schemes to tune these parameters under safety constraints. The tuning can be driven by state-estimation outputs from time-synchronized wide-area measurements, which is expected to improve generalization across different grids and operating conditions.
Footnotes
Appendix 1
Algorithm A1 presents the GA for portfolio deployment within a unified evaluation framework.
Algorithm A2 outlines the Greedy-1 with one-step look-ahead selection of deployment actions.
Algorithm A3 outlines the Vanilla DQN trained and evaluated under the same setting as FG-DQN but without feasibility-guided screening or beam search.
Appendix 2
Figure B1 presents the generation-wise objective evolution of the GA within the unified evaluation framework.
Figure B2 presents the step-wise indicator evolution of Greedy-1 within the unified evaluation framework.
Figure B3 presents the episode-wise reward trajectories of Vanilla DQN within the unified evaluation framework.
Ethical considerations
This article does not contain any studies with human or animal participants.
Consent to participate
Not applicable.
Consent for publication
Not applicable.
Funding
The author(s) disclosed receipt of the following financial support for the research, authorship, and/or publication of this article: This work was supported by the Science and Technology Project of China Southern Power Grid Co., Ltd. [grant number 000005KC24010023].
Declaration of conflicting interests
The authors declared no potential conflicts of interest with respect to the research, authorship, and/or publication of this article.
Data availability statement
Data sharing not applicable to this article as no datasets were generated or analyzed during the current study.